
Enhancement of Power Generation and Organic Removal in Double Anode Chamber Designed Dual-Chamber Microbial Fuel Cell (DAC-DCMFC)


1
Graduate School of Sciences and Technology for Innovation, Yamaguchi University, Yamaguchi 755-8611, Japan
2
Department of Environmental Engineering, Faculty of Engineering, Universitas Diponegoro, Semarang 50275, Indonesia
3
Department of Civil and Environmental Engineering, Cleveland State University, FH 112, 2121 Euclid Ave, Cleveland, OH 44115, USA
*
Author to whom correspondence should be addressed.
Water 2021, 13(21), 2941; https://doi.org/10.3390/w13212941
Submission received: 1 September 2021
/
Revised: 1 October 2021
/
Accepted: 16 October 2021
/
Published: 20 October 2021
(This article belongs to the Special Issue Water Quality Engineering and Wastewater Treatment Ⅱ)
Abstract
:One of the important factors in enhancing the performance of microbial fuel cells (MFCs) is reactor design and configuration. Therefore, this study was conducted to evaluate the regressors and their operating parameters affecting the double anode chamber–designed dual-chamber microbial fuel cell (DAC-DCMFC) performance. Its primary design consists of two anode chamber compartments equipped with a separator and cathode chamber. The DAC-DCMFCs were parallelly operated over 8 days (60 days after the acclimation period). They were intermittently pump-fed with the different organic loading rates (OLRs), using chemically enriched sucrose as artificial wastewater. The applied OLRs were adjusted at low, medium, and high ranges from 0.4 kg.m−3.d−1 to 2.5 kg.m−3.d−1. The reactor types were type 1 and type 2 with different cathode materials. The pH, temperature, oxidation-reduction potential (ORP), optical density 600 (OD600), chemical oxygen demand (COD), and total organic carbon (TOC) were measured, using standard analytical instruments. In general, the power production achieved a maximum of 866 ± 44 mW/m2, with a volumetric power density of 5.15 ± 0.26 W/m3 and coulombic efficiency of 84%. Two-stage COD and TOC removal at medium OLR achieved a range of 60–80%. Medium OLR is the recommended level to enhance power production and organic removal in DAC-DCMFC. The separated anode chambers into two parts in a dual anode chamber microbial fuel cell adjusted by various organic loadings expressed a preferable comprehension in the integrated MFCs for wastewater treatment.
1. Introduction
Nowadays, energy and water have grown to be the center of the world’s attention, particularly for sustainable development. Energy and water support human and living things’ activities to produce their demand [1,2,3]. Hence, energy and water cannot be separated, due to their synergism creating significant economic and ecological benefits.
A promising approach in facing future challenges is to develop technologies that help human life, stimulate a green environment, and support the world’s protocols on sustainable development. Presently, wastewater treatment technologies for organic removal have been reported, from basic to advanced levels, such as adsorption, oxidation, catalysis, photocatalysis, advanced oxidation process, electrochemical oxidation and filtration, membrane bioreactor, anaerobic digestion, etc. [4,5,6] However, the cost and technical considerations, especially in operational and maintenance, present a drawback in their application. In addition, more attention has been given to the technologies which provide green by-products, such as methane gas, fertilizer, electricity, water, etc. MFC is a breakthrough technology in electricity generation through a biochemical process that converts organic substrates, which are non-complex, complex, and wastewater, into electricity directly without generator support [7,8]. This technology could be considered for developing in the future in adopting back-to-nature concepts that use natural organic substrates [9,10], such as wastewater-based biomass, enriching carbons, and nutrients utilized by the electrogenic bacteria [11,12]. The research of MFC is still lacking in power generation affected by high internal resistance [13,14] and affected by parameters’ control (pH, and temperature) [15], anolyte [16], catholyte [17,18,19,20], inoculum [21,22], anode [23,24], cathode [25,26], electrode spacing [27,28], separator [29,30], flowrate [31,32], retention time [33], wiring system [34], design/construction [35], and configuration [36,37,38]. Design and configuration modifications are studied since the highest internal resistance mostly occurs on the anode chamber.
Most of the design of an MFC reactor is heavily influenced by the retention time, due to the relationship with the loading rate of substrates and reactor volume devoted to fed-batch and continuous processes. Fundamentally, the configurations of MFC consist of a single chamber microbial fuel cell (SCMFC) and double chamber microbial fuel cell (DCMFC) [38]. The high performance of DCMFC is shown by the engineered electrode, such as multiple electrodes [39,40], nanomaterial-assisted electrode [41,42], low-cost material substituted electrode [43,44], separator [45,46], and multiple anode chamber called the integrated system with the wastewater treatment plant types (anaerobic digester, constructed wetland, up-flow anaerobic baffled reactor (UASB), etc.) [7,11,47,48,49]. Multiple anode chamber studies are shown to exhibit greater performance both in power generation and organic removal. The closer type of multiple anode chamber MFC between the previous study with the current study is shown by Kim et al. (2011) [47] and Samsudeen et al. (2015) [48], in which the results show the power densities of 458 mW/m2 and 135.4 mW/m2, respectively. This configuration could be a pioneer of MFC stack or bioelectrochemically-assisted microbial reactor (BEAMR), which produces high power output up to 1.0 V when assisted or integrated with the wastewater treatment plant.
Notably, the multiple anode chamber MFC has not yet been studied extensively on the low-mid concentration of the sucrose-based substrate, graphene nanoplatelets (GNPs) coated anode, and graphene nanoplatelets-water-based polyurethane (GNPs: PU) coated cathode. Hence, the name of the multiple anode chamber in this study is stated as a double anode chamber (DAC) to emphasize its essential functions. The DAC-DCMFC separating the anode chamber into two compartments represents the MFC-assisted wastewater treatment design and configuration to improve its performance and reveals a preferable understanding of the mechanism. Therefore, the objective of this study was to assess the performance of a DAC-DCMFC with varied OLRs, reactor type-based cathodic differences, and two anode chamber compartments, for electrical production and organic removal.
2. Materials and Methods
2.1. Materials
Mixed bacteria containing electroactive bacteria in sludge form was taken from the Eastern Ube Sewage Treatment Plant (EU-STP), Ube City, Yamaguchi Prefecture, Japan, and placed into the DAC-DCMFC at around 30% of the total reactor volume to stimulate and acclimate to new conditions in a 500 mL anode chamber volume containing the sucrose-based substrate, representing an artificial wastewater solution. Initial sludge treated using a respirometric chamber with 2500 mgCOD/L during 30 days was subsequently analyzed by polymerase chain reaction (PCR) that discovers genetic material as ribonucleic acid (RNA) by amplifying its small amount from EAB specimens into deoxyribonucleic acid (DNA), which is replicated until they are detectable if they exist, denaturing gradient gel electrophoresis (DGGE) that reveals bacteria communities by amplifying 16S ribosomal RNA (rRNA) gene fragments of the PCR product, and sequencing. Universal 16S rRNA gene primer (27 F and 1492 R)–based PCR products from DNA extraction, while universal 16S rRNA gene primers (GC-341 F and 518 R)–based DGGE [50], were employed to identify the specific species type of mixed bacteria, which have potential as an electrochemically active bacteria (EAB).
Artificial wastewater solution represented by sucrose-based substrates was made of a carbon source and trace elements. Sucrose as a carbon source performing 20,000 mgCOD/L was prepared at 11.86 g per liter added with 8 g per liter of NaHCO3 99% p.a. and K2HPO4 99% p.a. as the nitrogenphosphate–potassium (NPP) source of trace elements, and other supporting trace elements consisted of 4 milliliters per liter of 2.65 M (NH4)2HPO4 99% p.a., 20 milliliters per liter of 1M KCl 99.5% p.a., 0.4 M MgCl2.6H2O 98% p.a., 1.6 M NH4Cl 99.5% p.a., 0.2 M MgSO4 98% p.a., 0.16 M FeCl3.6H2O 99% p.a., and 0.014 M CoCl2.6H2O 99% p.a.; and 2 milliliters per liter of 0.68 M CaCl2.2H2O 93% p.a. [51,52]. The sucrose-based substrate was varied into three concentrations, which consisted of 400, 1000, and 2500 mgCOD/L diluted from 20,000 mgCOD/L as a stock organic solution, using a dilution equation.
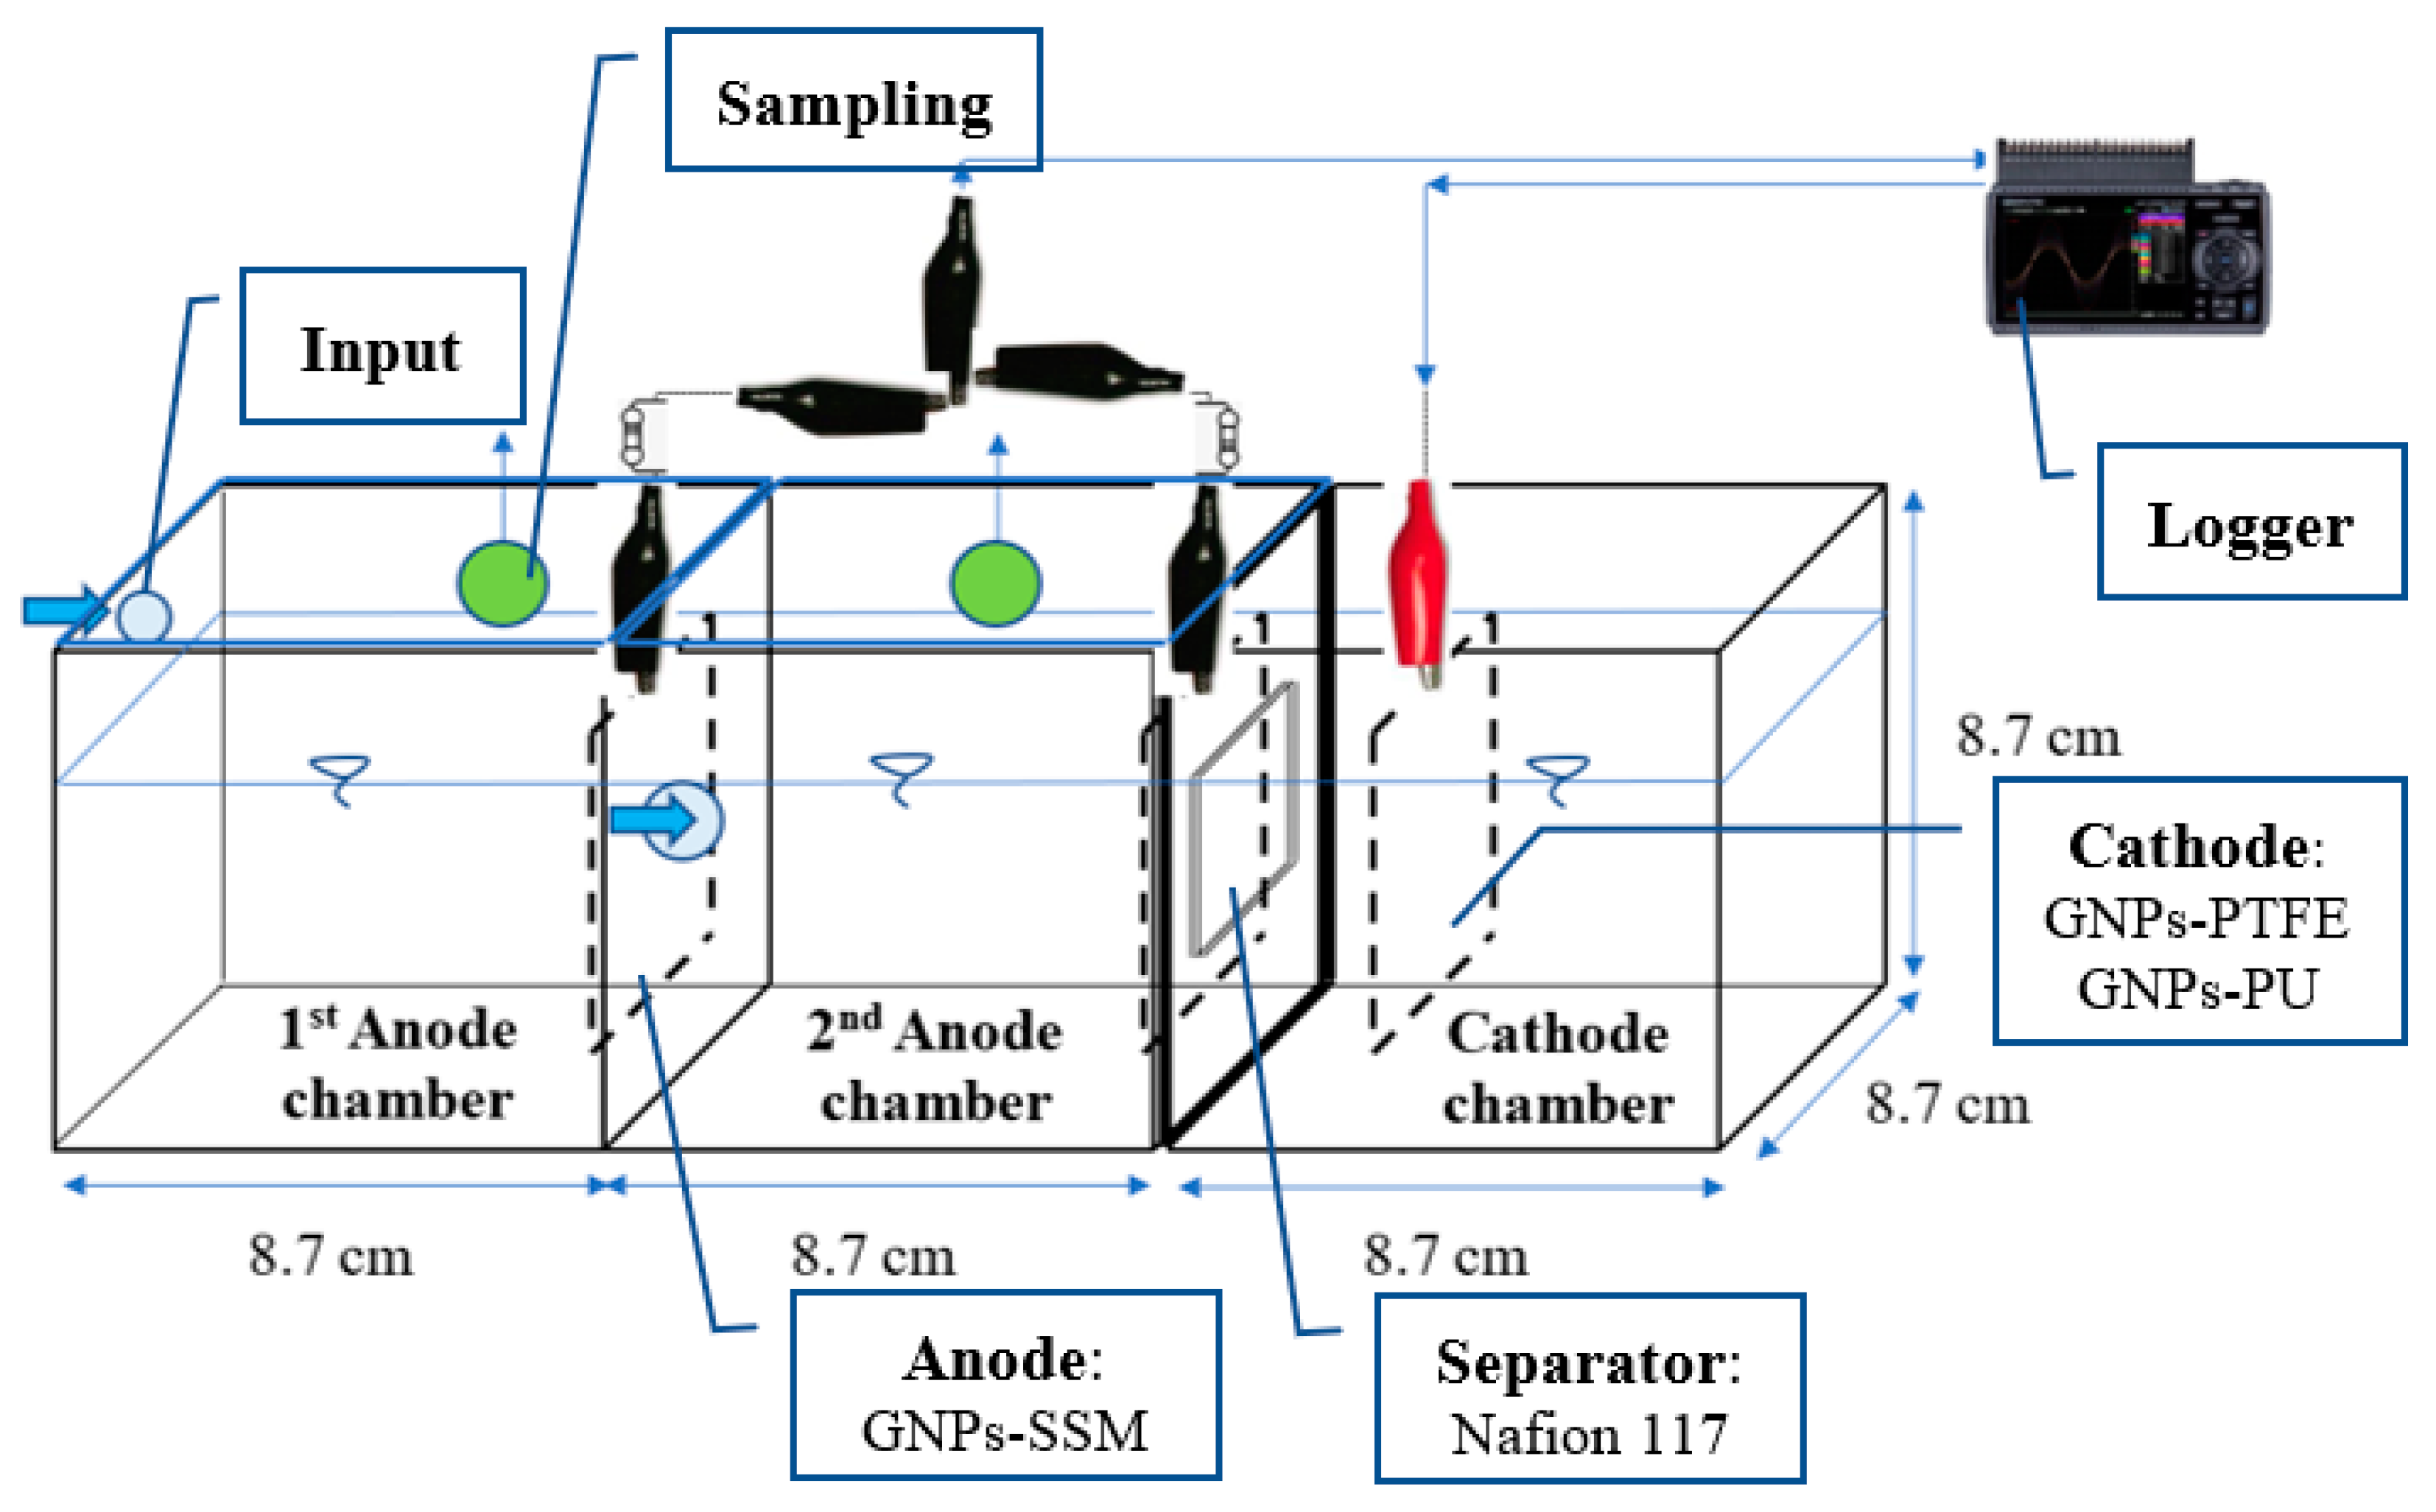
The reactor construction named DAC-DCMFC was built, using acrylic fabrication with the dimension LWH (8.7 × 8.7 × 8.7) cm and thickness 0.3 mm. There were two anode chamber compartments with similar functions. The first and second anode chambers focused on substrate conversion and electron transfer to reveal the new findings regarding the process between those chambers. The proton exchange membrane (PEM) supported by Nafion 117 with the dimension LW (4 × 4) cm was used to separate the second anode chamber and cathode chamber. The anolyte was the sucrose-based substrate with the three concentrations of COD unit, whereas the catholyte was 0.006 M Na2CO3.1.5H2O2 (CAS# 15630-89-4) in a 500 mL of cathode chamber volume. Electrodes consisted of GNPs (CAS# 9002-84-0) coated 30 mesh SSM as the anode of both anode chambers, and the big difference was cathode material that consisted of GNPs: PU 1:1 volume solution ratio-coated cathode at the code 1A, and GNPs-PTFE (CAS# 9002-84-0) 60% coated cathode at the code 2A. In addition, synthesized PU was water-based polyurethane [53] with a similar function to polytetrafluoroethylene (PTFE) [44,54,55] as a waterproofing material and increasing the oxygen reduction reaction (ORR) on the surface of the cathode material. The wiring system, called closed-circuit voltage (CCV) [56,57], connected the anode-equipped 100 Ω of resistor onto the data logger and cathode in a line. In general, the reactor is described in Figure 1.
2.2. Methods
2.2.1. Practical Techniques
The fed-batch mode was run with the support of a peristaltic pump performed by EYELA MP-1000 (Tokyo Rikakikai Co., Ltd., Tokyo, Japan) to manage the stable flow and concentration input of sucrose-based substrate to the reactor and to ensure the anaerobic condition of solution with purging by pure nitrogen gas (N2) with null oxygen interference.
An amount of sucrose-based substrate prepared in 400, 1000, and 2500 mgCOD/L on 1000 mL of the water tank was injected, using a peristaltic pump to the first anode chamber every 24 h. It can be stated as the organic loading rate (OLR) in 0.4 gCOD/d representing 400 mgCOD/L as low OLR, 1 gCOD/d representing 1000 mgCOD/L as medium OLR, and 2.5 gCOD/d representing 2500 mgCOD/L as high OLR. These level-strength wastewaters can be found at Stoll et al. (2018) [58]. The solution of the first anode chamber passed to the second anode chamber after injecting it to the first anode chamber was done within 20 min. After leaving it for 24 h; then, the sample from the first and second anode chamber was taken around 10 mL for analyzing OD600, COD, and TOC, and prepared for preservation using the refrigerator at 4 °C for less than 24 h. The physical parameters, such as pH, temperature, and ORP, were analyzed immediately after the 24 h running process, whereas the power in the voltage unit for every reactor was recorded every 30 min. The sampling time was determined at steady-state every 24 h over 192 h, which was previously acclimatized within two months for every reactor type, anode compartments, and OLRs to investigate their effect. Likewise, a brief explanation of the DAC-DCMFC setup is shown in Table 1.
2.2.2. Analytical Techniques
The physical parameters consisted of pH, temperature, ORP, and OD600. The pH and temperature in degree Celsius (°C) were performed by pH meter D-72 ( HORIBA Advanced Techno Co., Ltd., Kyoto, Japan). ORP in millivolt (mV) was carried out by pH/ORP meter D-72 (LAQUA act, HORIBA, Japan). OD600 in absorbance (Abs) was operated at wavelength 600 nm by spectrophotometer U-2900 (Hitachi High-Tech Science Corporation, Tokyo, Japan). The chemical parameters consisted of COD and TOC, both in milligram per liter (mg/L). COD and TOC were executed through 5220 C, closed reflux, titrimetric method, and 5310 B, high-temperature combustion method, respectively, by Standard Methods For The Examination Of Water And Wastewater 23rd edition [59]. Specifically, the COD instrument analysis was supported by block heater MG-2200 (Tokyo Rikakikai Co., Ltd., Tokyo, Japan), and the TOC analysis was operated by TOC-V Shimadzu (Shimadzu Corporation, Kyoto, Japan). The power parameter in the voltage unit was performed by the data logger, midiLOGGER GL-240 (Graphtec Corporation, Yokohama, Japan), with a sampling time every 30 min.
2.2.3. Data Calculation
The percentage of COD removal was counted with the following formula: %COD removal = , where COD in (mg/L): the COD of the influent; COD out (mg/L): the COD of the effluent [60]. The TOC removal was calculated by using the analogical COD removal formula as follows: TOC removal = , where TOCin (mg/L): the TOC of the influent; TOCout (mg/L): the TOC of the effluent.
Power and current were enumerated by following Ohm’s law: V = I.R; P = V.I; where V (volt) is power; P (watt) is power; I (ampere) is current; and R (ohm) is resistance. Power density (PD), volumetric PD and coulombic efficiency (CE) were computed by the following formula: PD = (V.I)/A and PD = (V.I)/WV, where V (volt): power; I (ampere): current; A (m2): anode surface area; WV (m3): working volume [61]. CE = , where M: the oxygen molar mass (32); I: the electrical current intensity utilized by the MFC (Ampere.second); n: the actual electrons transferred (4 mmol of electron per mmol of COD); F: the Faraday constant (96485 C/mol electrons); Vanodic: the volume of anodic (L), rCOD: the removal rate of COD (g/L) [61].
3. Results
3.1. Seeding and Feeding Characteristics
Seeding, which means an EAB source from the sludge of EU-STP, was initially characterized to acquire its condition and to ensure that no other nuisances were affected by the other possible parameters. The results were as follows: pH 7.1 ± 0.04, temperature 20 ± 5.0 °C, biochemical oxygen demand (BOD) 198 ± 2 mg/L, COD 396 ± 2 mg/L, TOC 57 ± 1 mg/L, total phosphorous in phosphate (P-PO4) 266 ± 5 mg/L, total nitrogen in nitrate (N-NO3) 26 ± 5 mg/L, total solids (TS) 12740 ± 140 mg/L, total suspended solids (TSS) 11973 ± 690 mg/L, volatile suspended solids (VSS) 8415 ± 420 mg/L, and fixed suspended solids (FSS) 3320 ± 175 mg/L. The sequence analysis results using the Basic Local Alignment Search Tool Nucleotide (BLASTN) National Center for Biotechnology Information (NCBI) with the similarity results up to 96% consisted of Lactococcus laudensis, Schwartzia succinivorans, Selenomonas lacticifex, Arcobacter lekhitochrous, Arcobacter butzleri, Clostridium polynesiense, and Clostridium aurantibutyricum.
Feeding, which means a sucrose-based substrate, was characterized in pH, temperature, ORP, OD600, COD, and TOC as the primary tested parameters during the operational period, based on the different OLRs. The results are listed in Table 2.
3.2. Parameters Changes
This observation during the time-frame limitation can be correlated to find the differences among them, particularly the different effects among reactor type and two anode chamber compartments with the different OLRs.
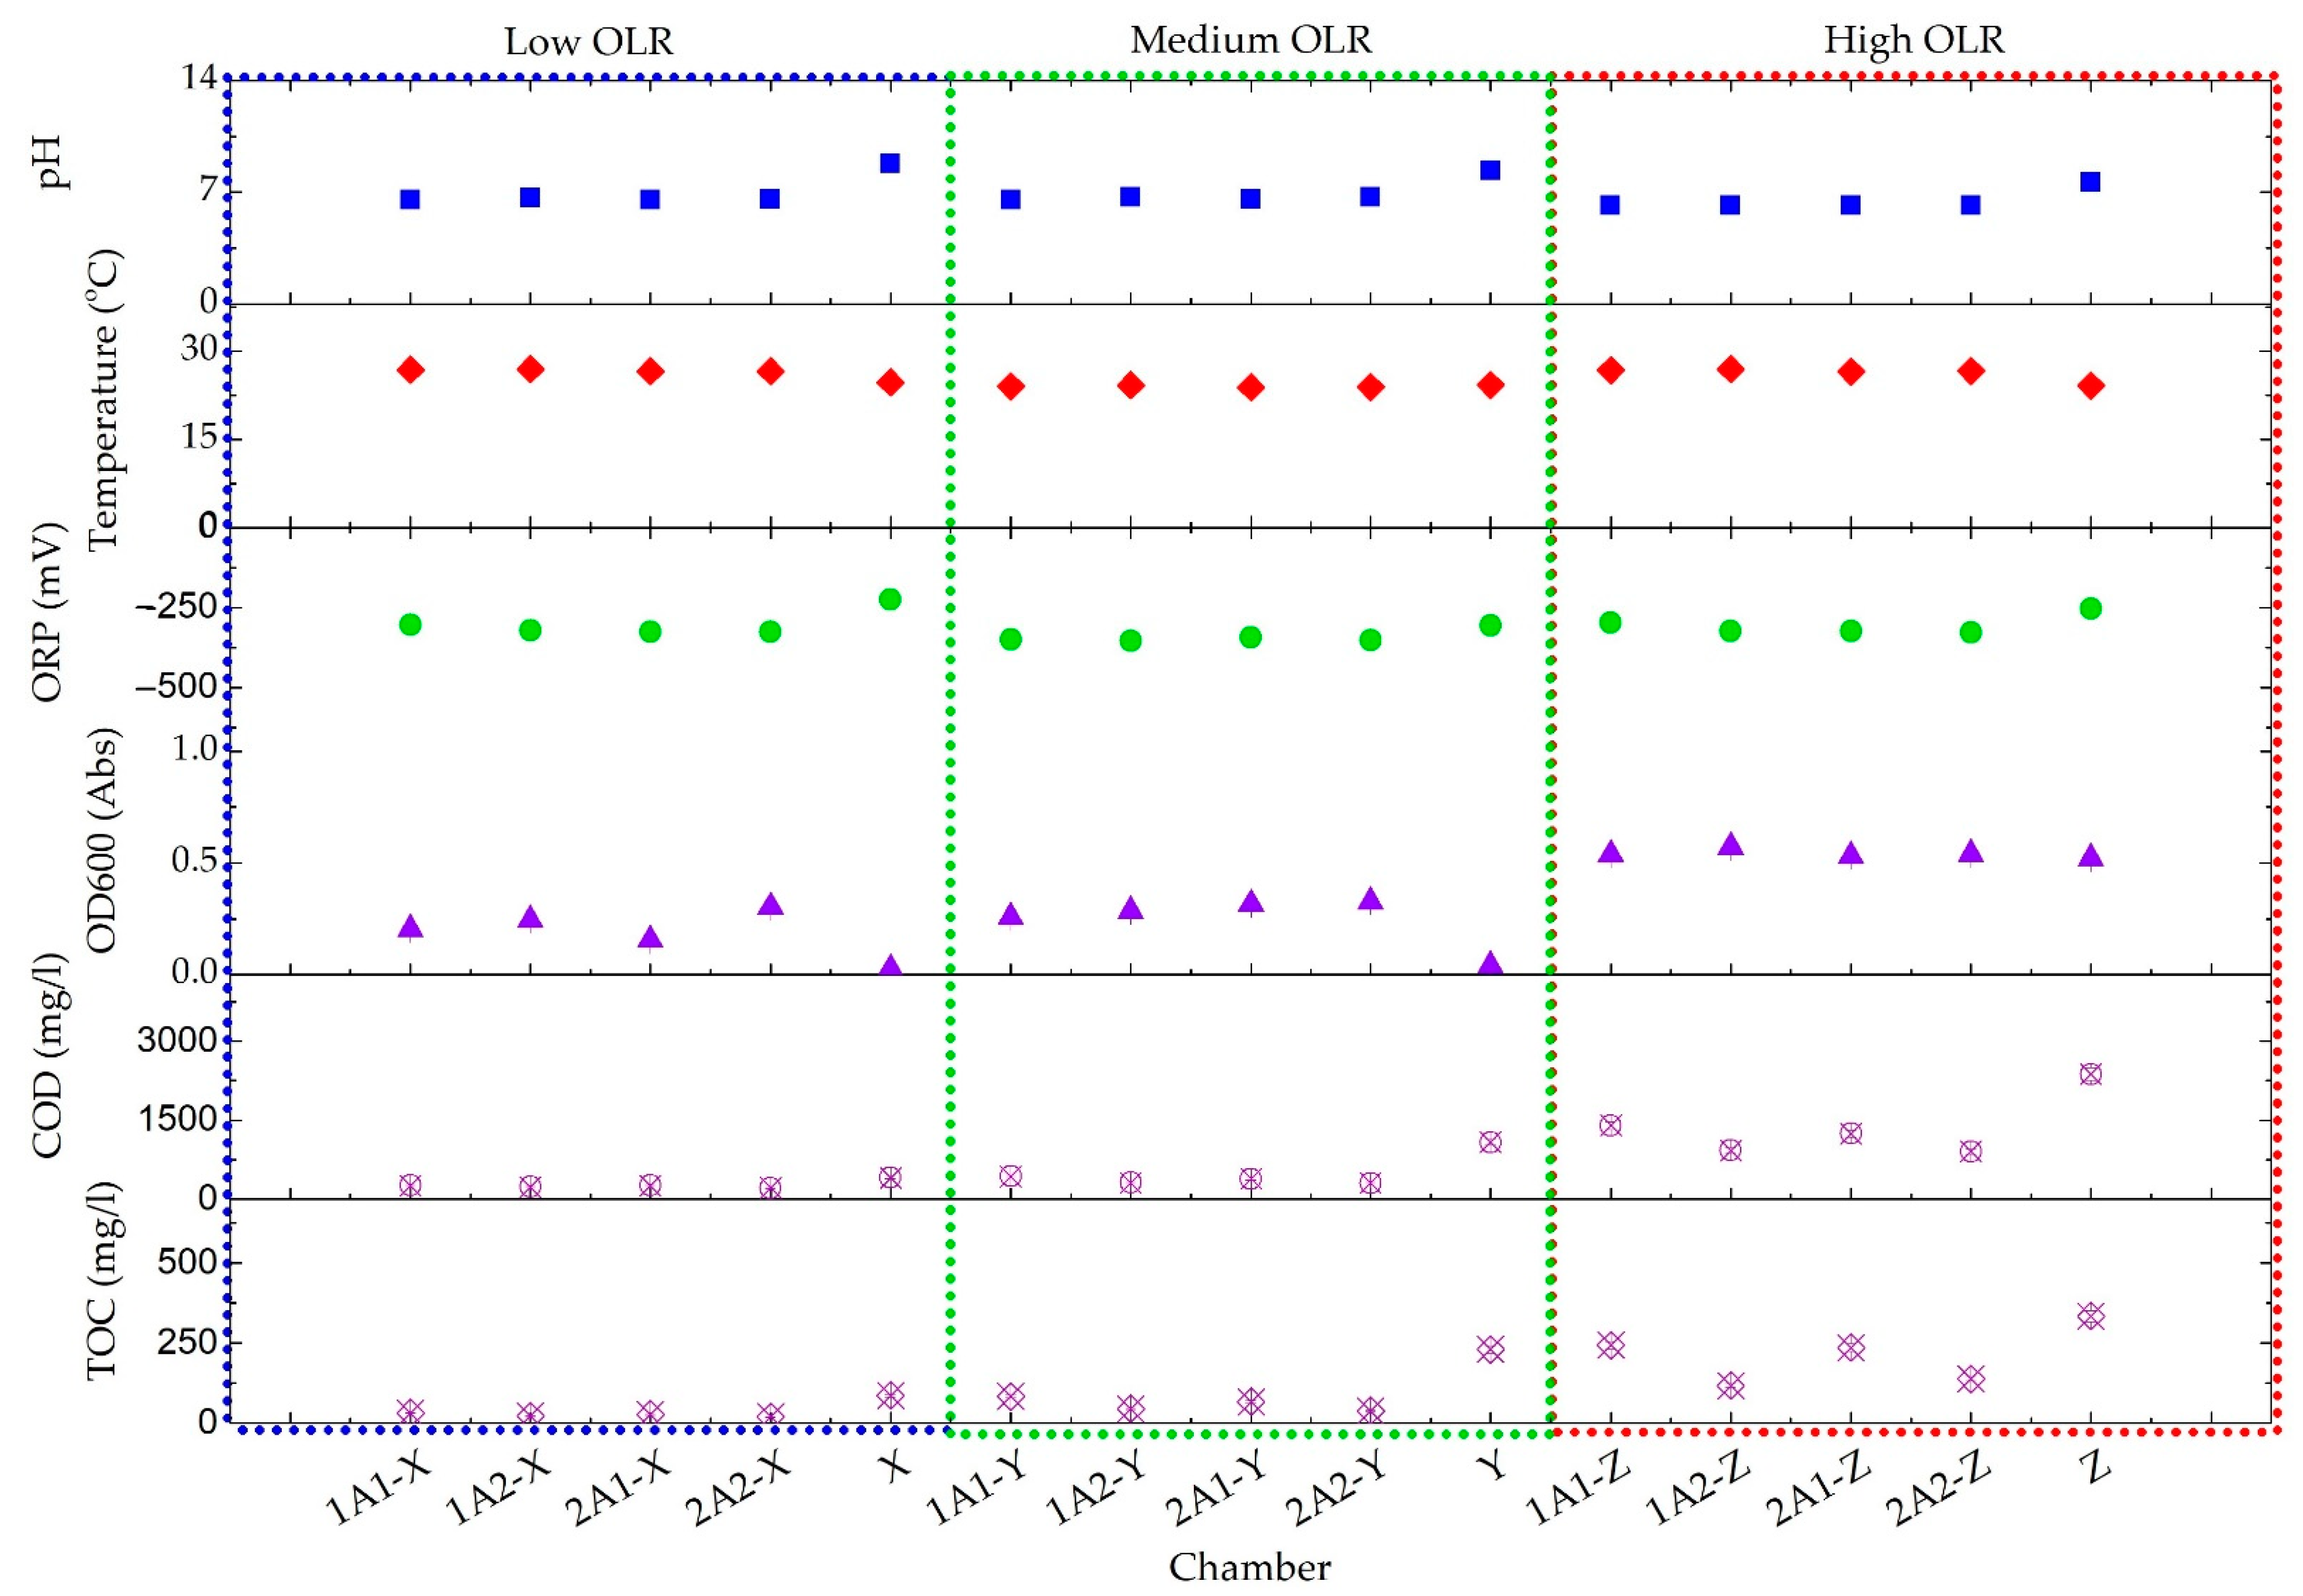
Figure 2 shows that those pHs of the low, medium, and high OLRs at the first and second anode chambers in type 1 and type 2 reactors were in the range of 6 to 8 during an operational period of 192 h. The initial pHs of each input of OLRs denoted differently in which from low OLR to high OLR presented 8.8, 8.3, and 7.6, respectively. The inside pH in both reactors pointed, on average, to 6.6 ± 0.07 of low and medium OLRs, and to 6.1 ± 0.01 of high OLR. Meanwhile, temperatures of the low, medium, and high OLRs at the first and second anode chambers in type 1 and type 2 reactors had no substantial difference during a running period of 192 h. The initial temperatures of each input of OLRs showed approximately 24.4 ± 0.3 °C. The inside temperatures in both reactors denoted, on average, 26.7 ± 0.2 °C of low and high OLRs, and 24 ± 0.1 °C of medium OLR. Whereas ORPs of the low, medium, and high OLRs at the first and second anode chambers in type 1 and type 2 reactors were in the range of −299 to −356 mV during an operational period of 192 h. The initial ORPs of each input of OLRs denoted differently in which from low OLR to high OLR presented −226 mV; −306 mV; −255 mV, respectively. The inside ORP in both reactors pointed on average −320 ± 11 mV, −351 ± 6 mV, and −319 ± 14 mV of the low, medium, and high OLRs, successively. Further, OD600s, CODs, and TOCs of the low, medium, and high OLRs at the first and second anode chambers in type 1 and type 2 reactors had significant differences over an operational period of 192 h. The initial OD600s of each input of OLRs were denoted differently for which low OLR to high OLR presented 0.025 Abs, 0.04 Abs, and 0.52 Abs, serially. In succession, the inside OD600 in both reactors pointed on average to 0.226 ± 0.06 Abs, 0.296 ± 0.03 Abs, and 0.544 ± 0.02 Abs of low, medium, and high OLRs, whereas the initial CODs of each input of OLRs were denoted differently for which low OLR to high OLR presented 407 mg/L, 1080 mg/L, and 1118 mg/L, respectively. The inside COD in both reactors pointed, on average, to 242 ± 24 mg/L, 360 ± 60 mg/L, and 1118 ± 241 mg/L of the low, medium, and high OLR, serially. Meanwhile, the initial TOCs of each input of OLRs were denoted differently for which low OLR to high OLR presented as 87 mg/L, 230 mg/L, and 334 mg/L, successively. The inside COD in both reactors pointed, on average, to 25 ± 5 mg/L, 58 ± 21 mg/L, and 184 ± 65 mg/L of the low, medium, and high OLR, respectively.
3.3. COD and TOC Removal
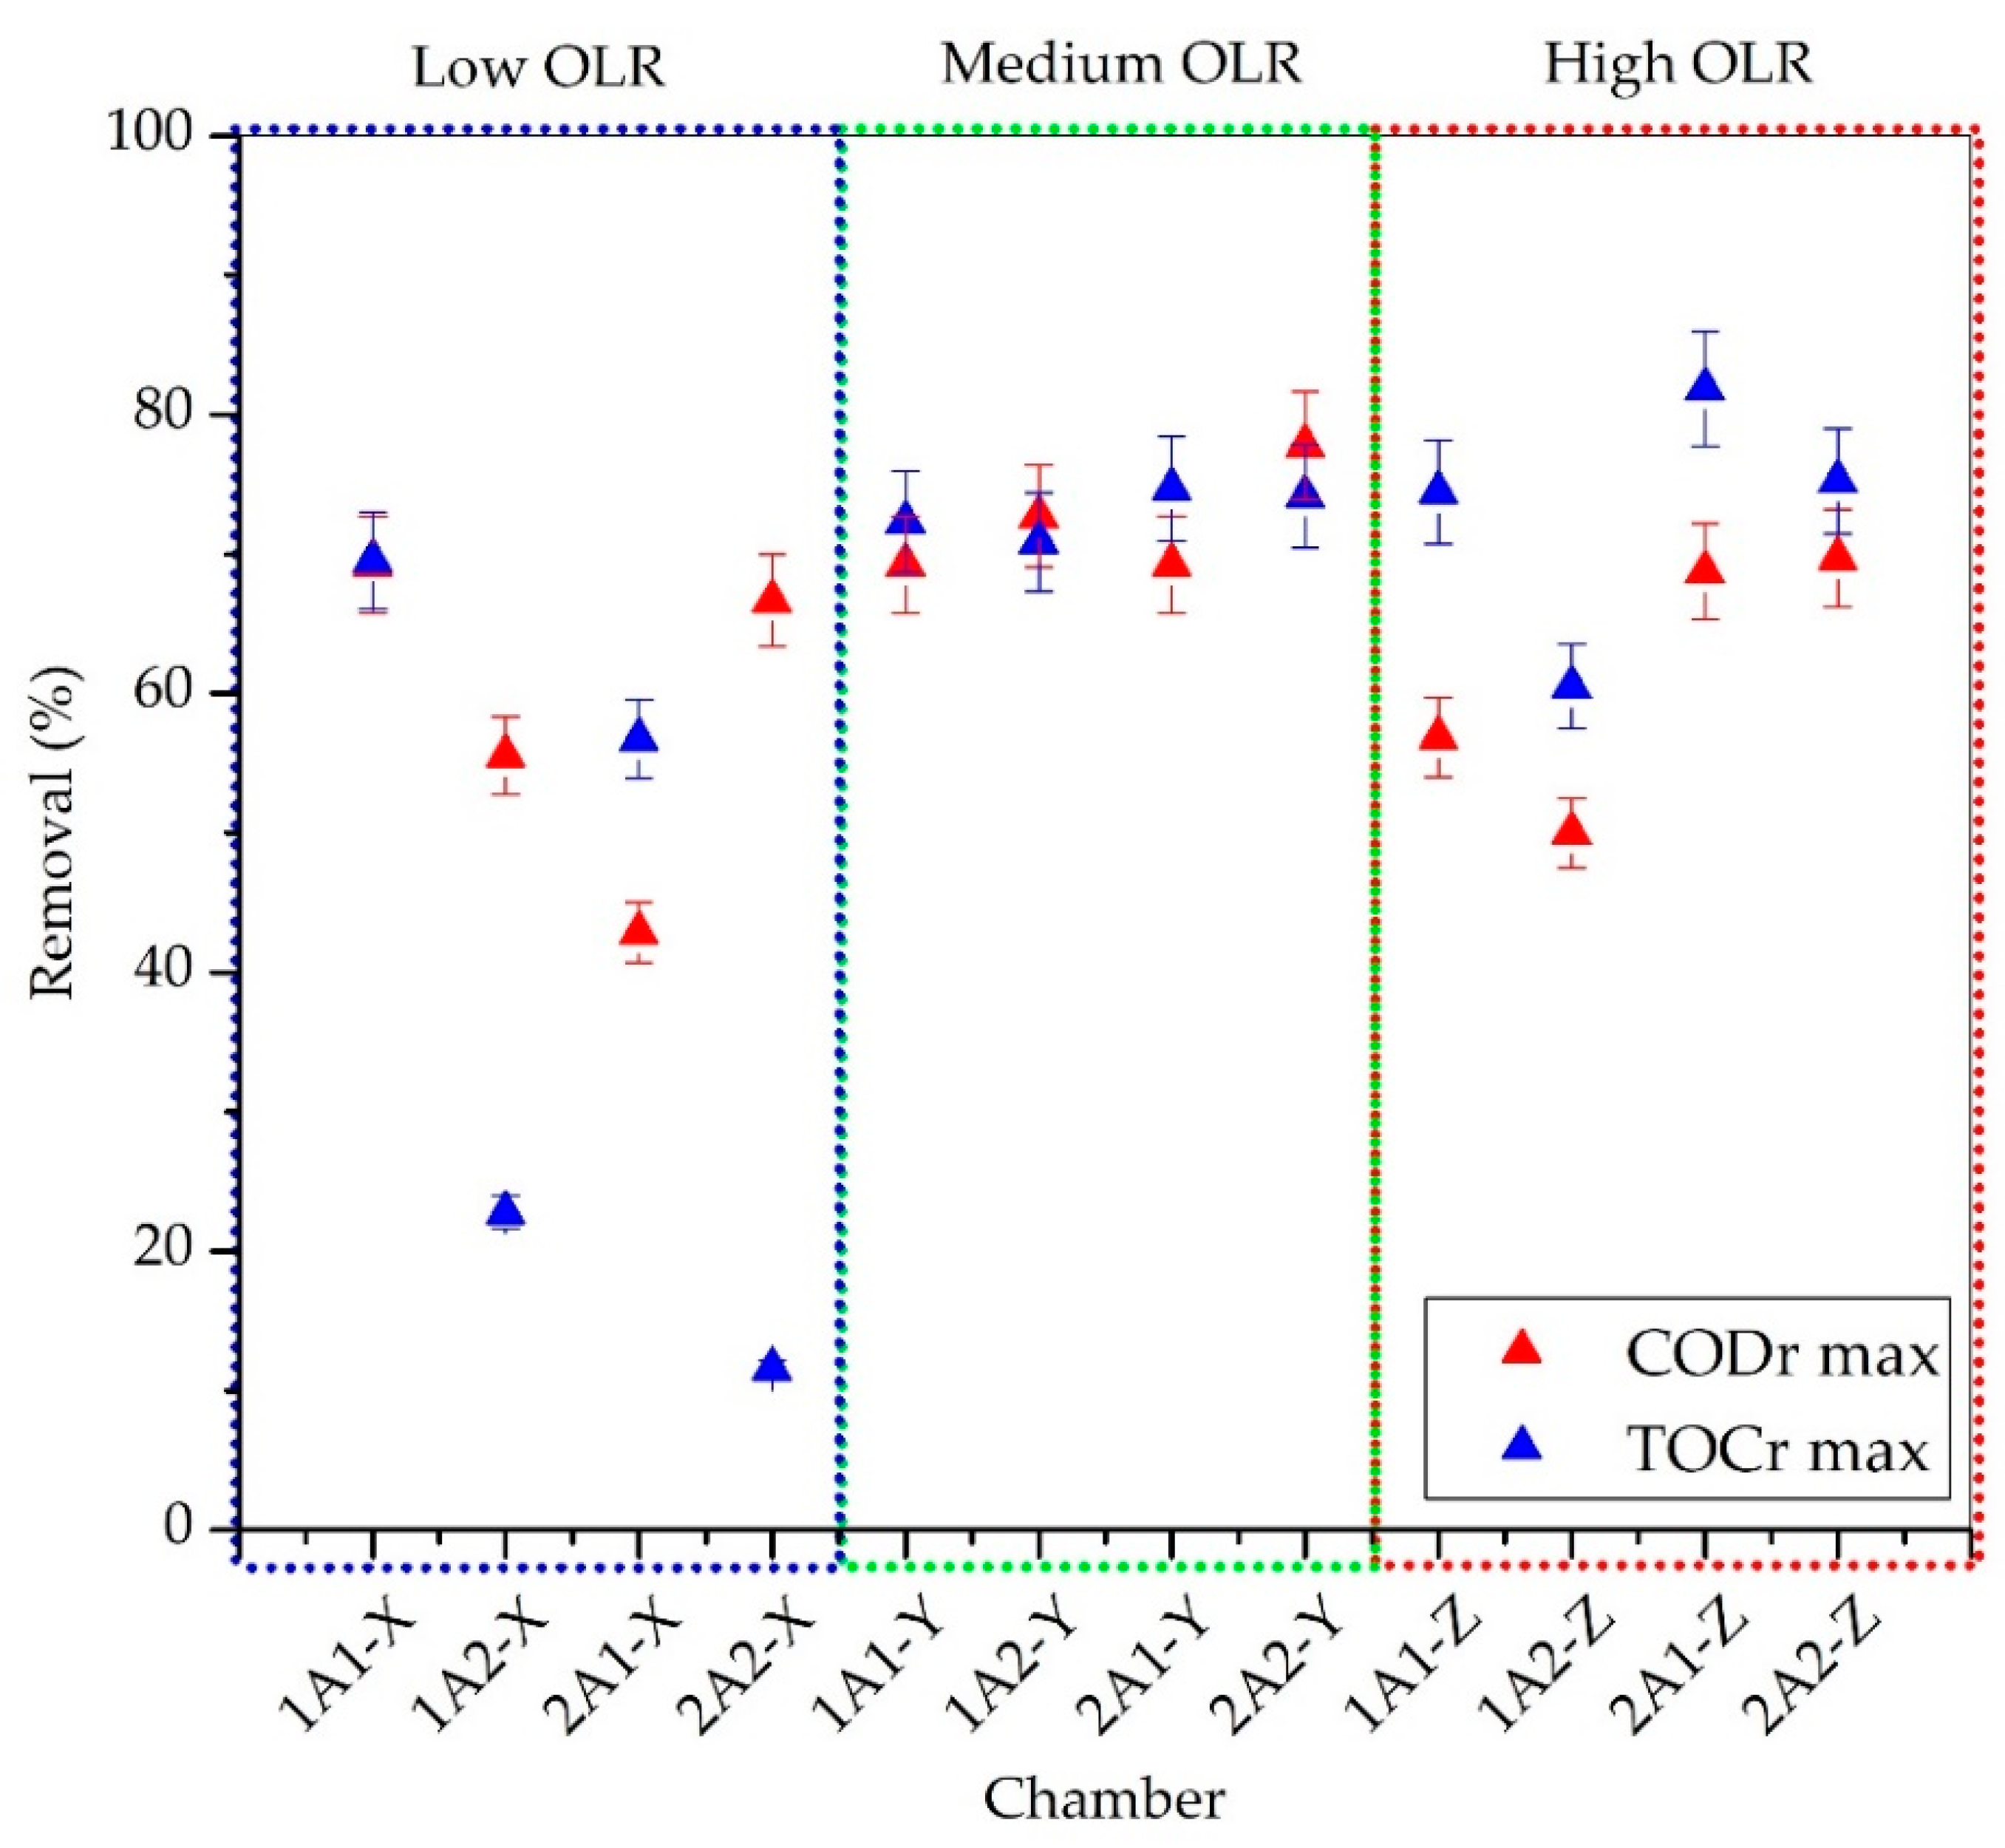
Generally, Figure 3 shows that the COD and TOC removal maximum of medium OLR at the first and second anode chamber in type 1 and type 2 reactor were more stable at around 60–80% than COD and TOC removal maximum of low and high OLRs. Low OLR presented the COD and TOC removal maximum at the first and second anode chamber in the type 1 and type 2 reactor at around 10–80%, whereas high OLR performed COD and TOC removal maximum at the first and second anode chamber in type 1 and type 2 reactor at around 40–80%.
The COD concentration of low and high OLR at the first and second anode chamber was removed at the same level in which the only difference was the TOC concentration utilization. The TOC concentration of low OLR noticed a decrease at the second anode chamber but higher usage at the first anode chamber. At the same time, the TOC concentration of high OLR appeared to increase at the type 1 and 2 reactors.
3.4. Power Production
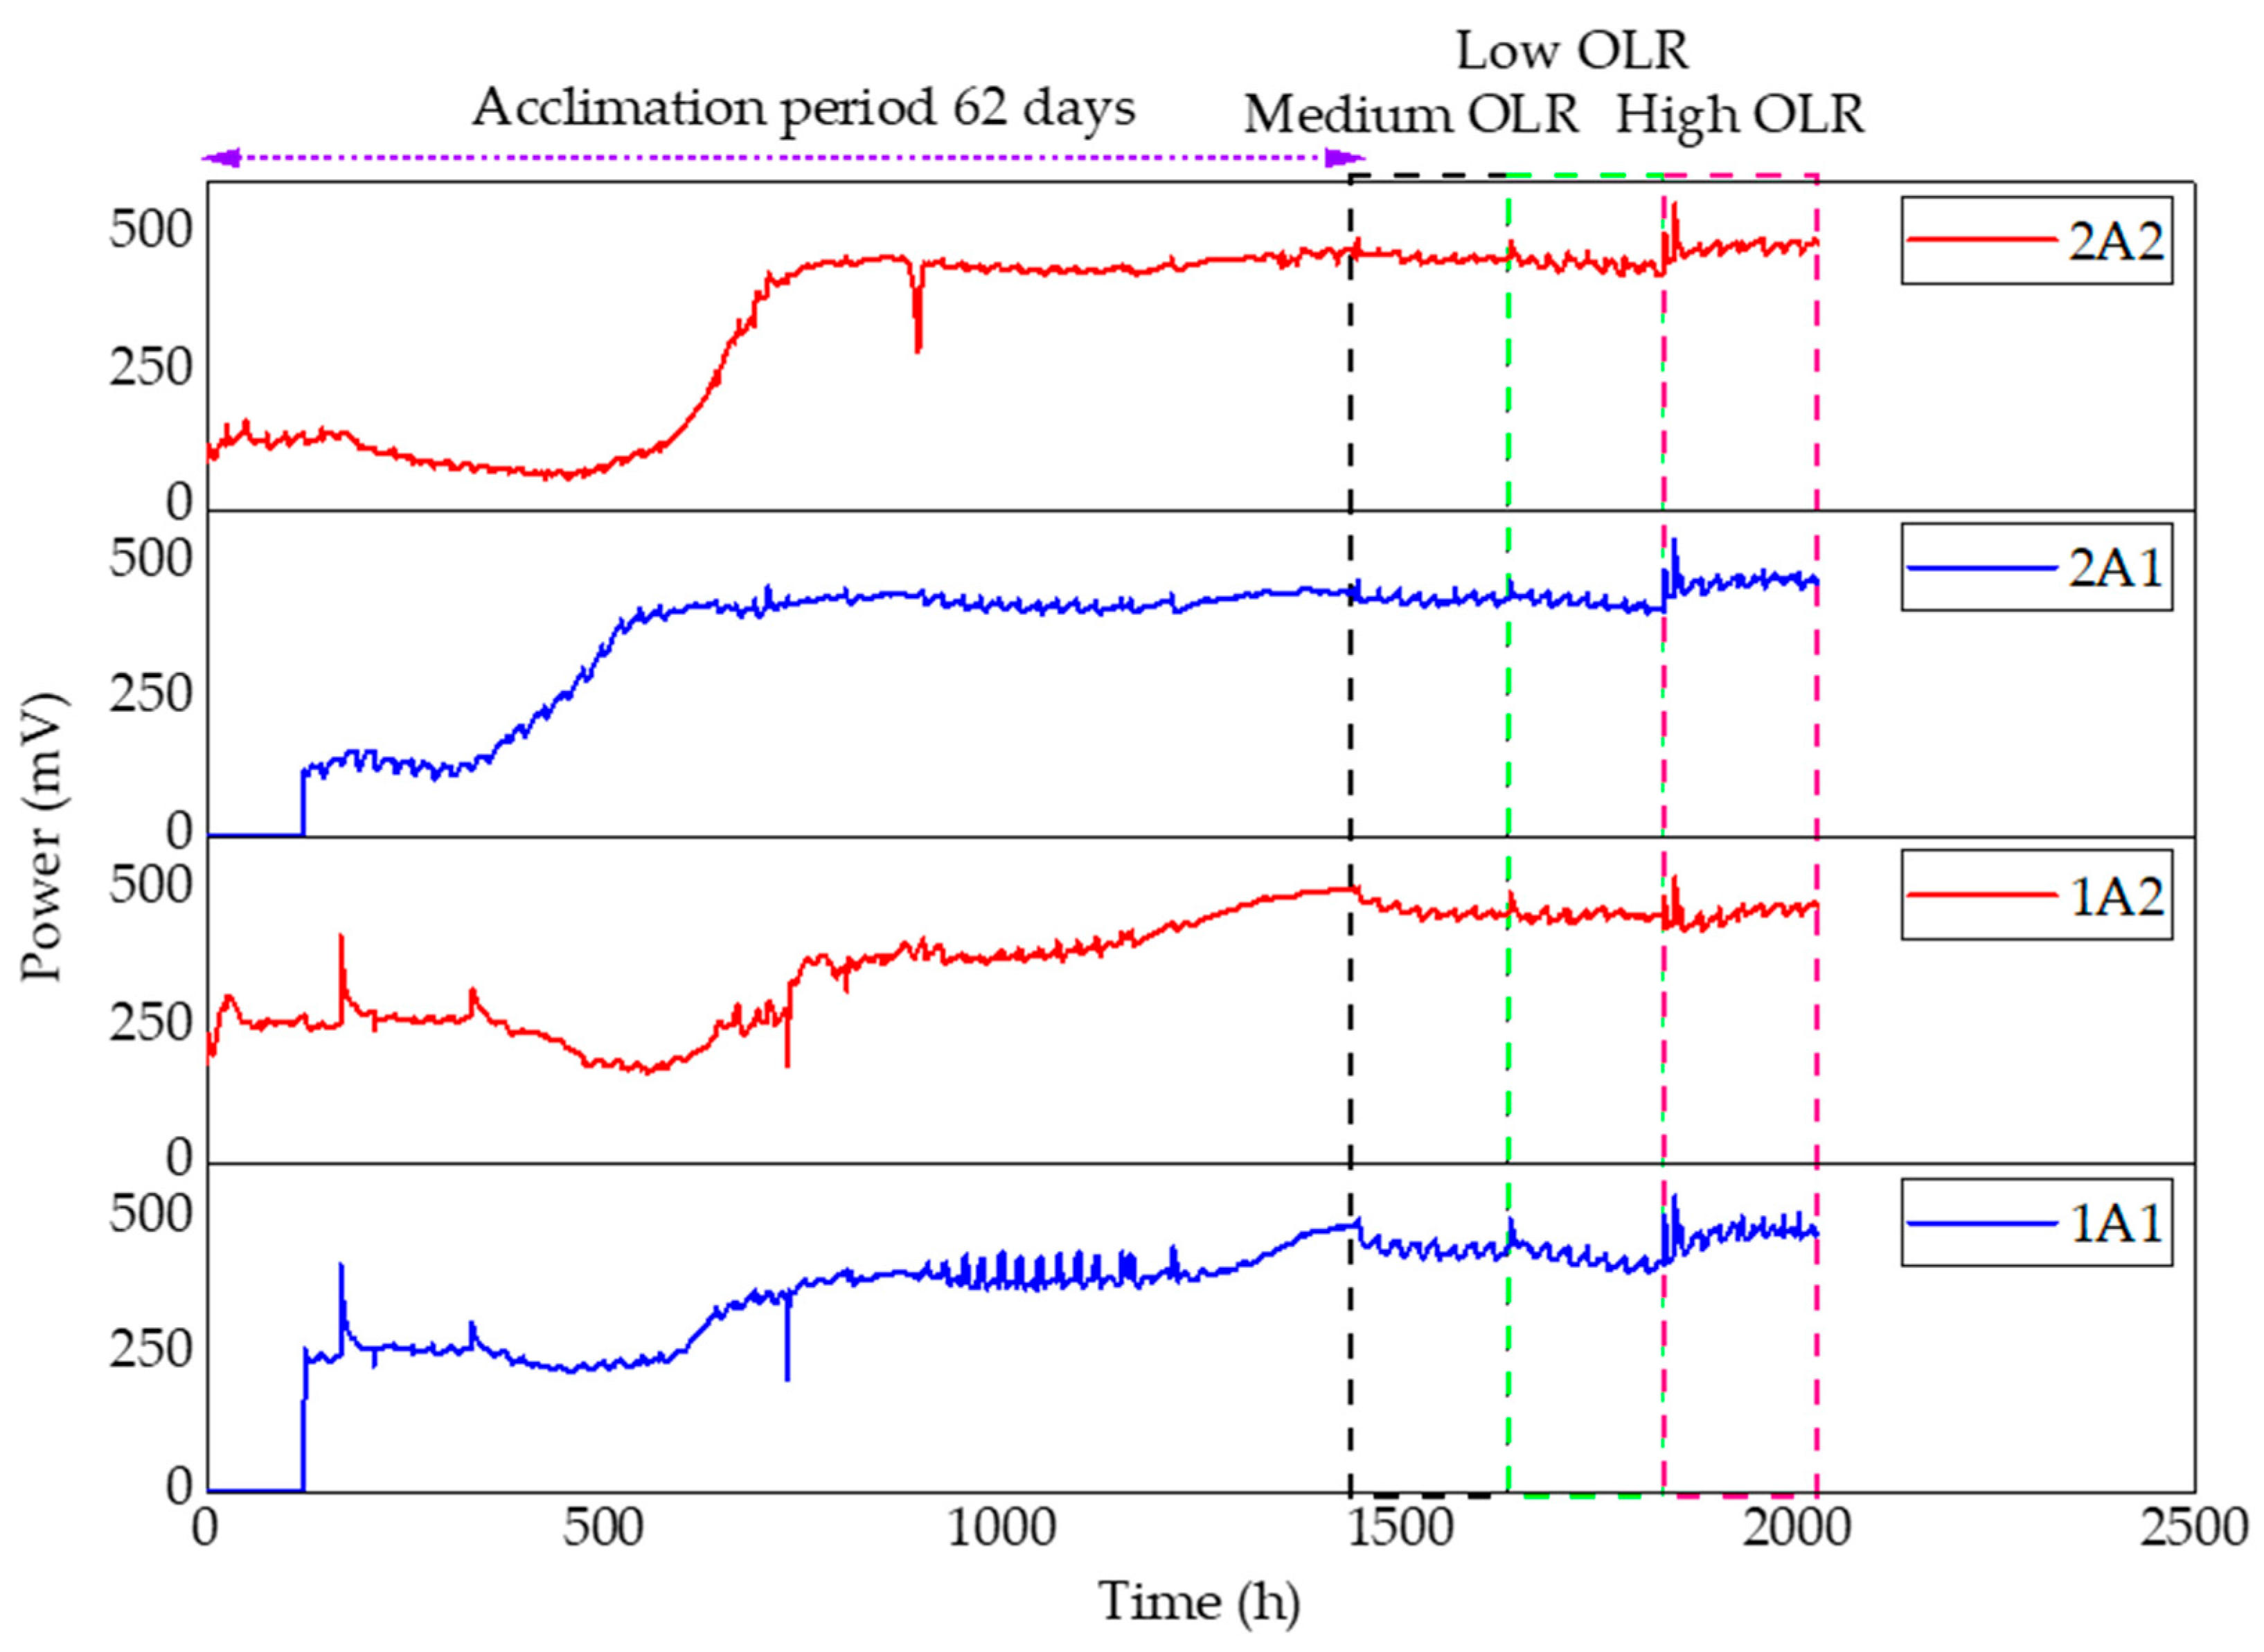
The acclimation was operated within 1483 h or 62 days to provide stable power output during the injection afterward. The acclimation process showed that both reactors at the first and second anode chambers had different patterns.
Figure 4 shows that the first anode chamber of both reactors started increasing from minus power due to adaptation with new concentrations input at time zero to around +114 mV of the type 1 reactor and at 122.5 h to about +264 mV of the type 2 reactor. Furthermore, the powers significantly increased to around +400–500 mV at 797 h for the type 1 reactor and 576.5 h for the type 2 reactor. It can be stated that the type 2 reactor provided a faster adaptation to the new concentration input than the type 1 reactor, where both were in the first anode chamber. The power of the reactor type 1 and 2 became well built around +400–500 mV until 1446.5 h right before injecting with the different OLRs variable.
Whereas the second anode chamber of both reactors started at around +200 mV and +100 mV at the beginning of acclimation, the power reached +400 mV for the type 1 reactor at +874 mV and the type 2 reactor at +705 h. It was similar to the first anode chamber aforementioned that the type 2 reactor provides a faster power increase than the type 1 reactor. After the acclimation process, the power was stable at around +400–500 mV.
At a glance, the power outputs were much the same level, but the difference between them could be identified clearly. At low and medium OLRs, the powers were around +400–500 mV; meanwhile, at high OLR, the power was around +400–550 mV. There was a difference of 50 mV higher at high OLR compared to low and medium OLRs.
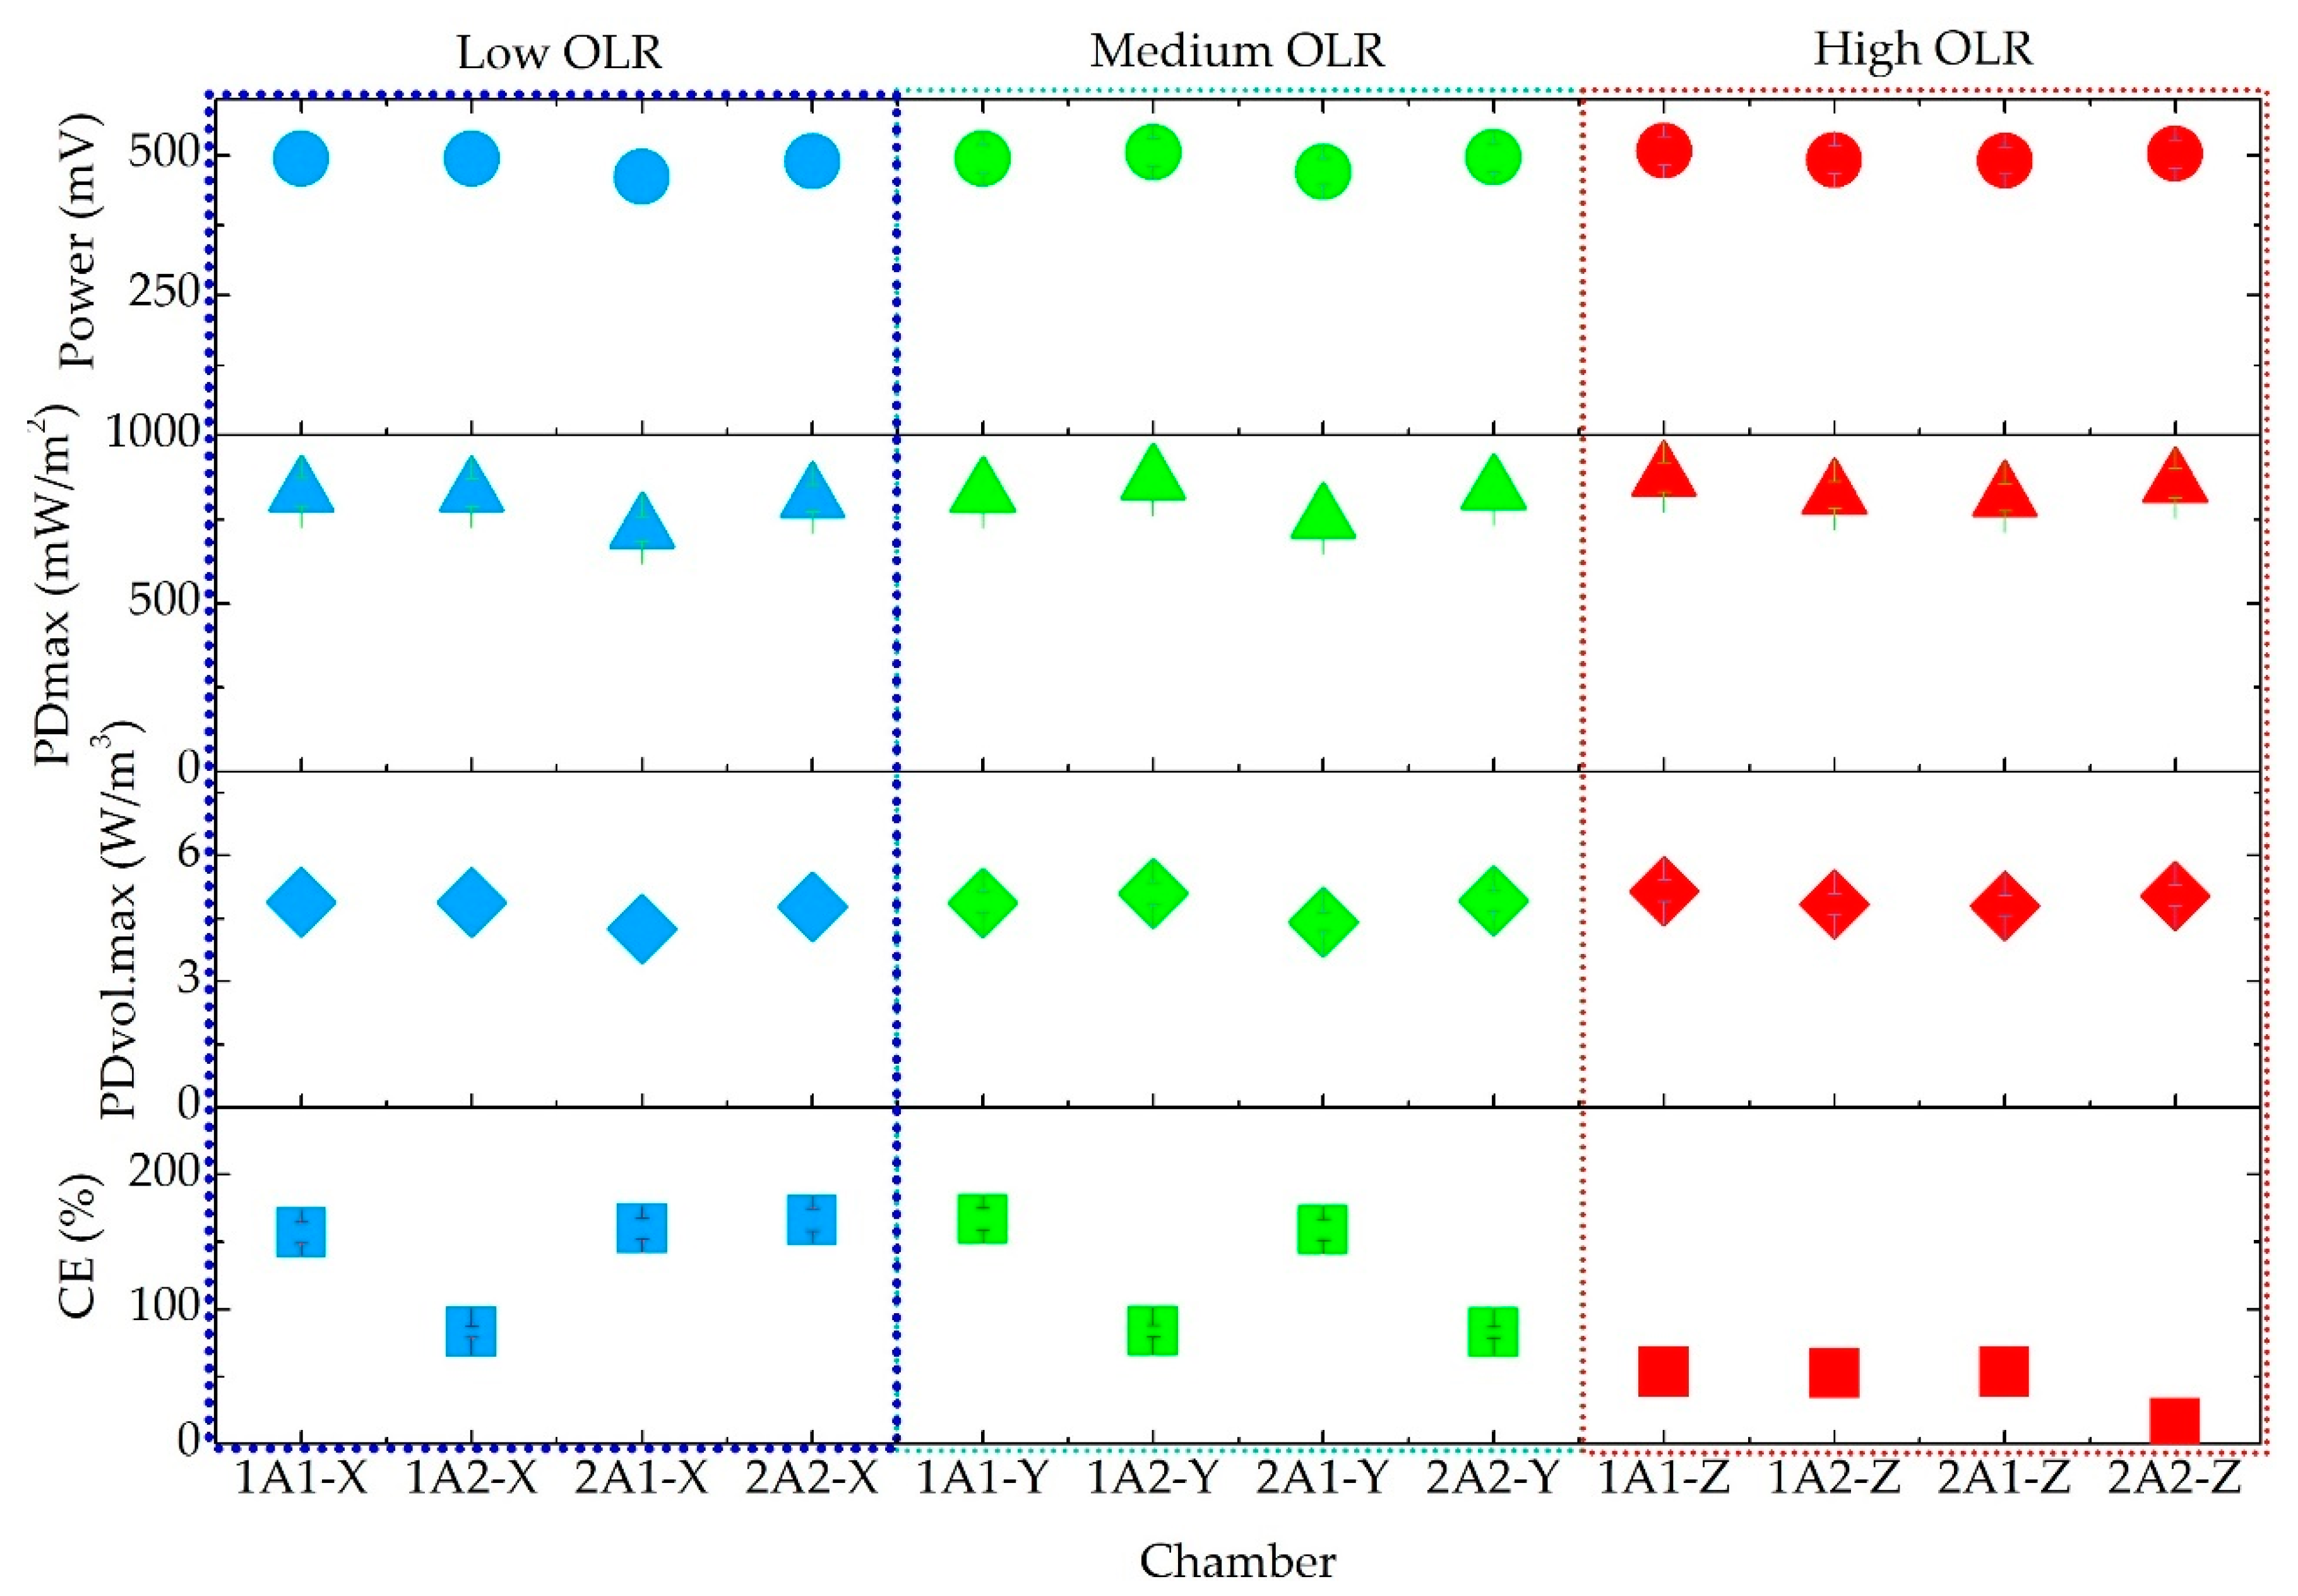
Figure 5 shows that power production performed very stably at a maximum of 483.3 ± 15 mV among OLRs, reactor types, and anode chamber compartments. The power density at the second anode chamber showed to be relatively less high than at the first anode chamber among OLRs; however, the level presented was similar at a maximum of 866 ± 44 mW/m2. Meanwhile, the volumetric power density reached a maximum of 5.15 ± 0.26 W/m3. Interestingly, CE achieved a maximum of 83% of low OLR, 84% of medium OLR, and 53% of high OLR. The level of CE showed more than 100%, which could occur when the system was started at the beginning of the process, starting from 0 h to less than 120 h of observation.
4. Discussion
4.1. Conceptualization
One of the exciting schemes is treating the wastewater containing a high organic loading in an anaerobic digester (AD). Subsequently, a low organic loading output of AD is treated by stack MFC system or BEAMR to produce a very low organic loading to meet the water effluent standard and high-power production at the end of treatment [36,37]. Hence, this study is structured more closely with the integrated microbial fuel cell-wastewater treatment (MFC-WWT) in which the first anode chamber has the same function as wastewater treatment and the second anode chamber has the function of transferring abundantly generated electrons from the first anode chamber; even the process is similar to the first anode chamber.
In addition, since the first anode chamber has a similar function with anaerobic treatment, therefore, the additional information related to the anaerobic treatment could be represented by the F/M ratio to ensure that the process follows the standard of the anaerobic process. The F/M ratio means food-to-microorganism organic loading per time divided by the number of microorganisms represented by volatile suspended solids (VSS). Since this study used three different OLRs, the F/M ratio can subsequently be obtained by dividing OLR toward the existing VSS. The F/M ratio from low OLR to high OLR is 0.1, 0.24, and 0.59 gCOD/gVSS.d, respectively. The F/M ratio should be in the range of 0.45–0.50 to efficiently solubilize cells [62]. The best value of F/M ratio is between 0.57and 0.68 for anaerobic digestion [63]. The F/M ratio was found to be optimal at 0.5 for biogas production in an anaerobic digester [64]. Since the MFC has a function to generate electricity, which can be inhibited by high gas production from methanogenic bacteria, then the optimal F/M ratio should be less than 0.5 gCOD/gVSS.d. In correlation with the recommended optimal OLRs in this study, the optimal F/M ratio can be determined at 0.24 gCOD/gVSS.d to generate more electricity with less gas production.
4.2. Seeding and Feeding
The seeding characteristics showed a good strength concentration level of several identified parameters that some EABs could grow and adapt very well. According to the mentioned sequence results, the potential EABs were determined to ensure and support the performance of DAC-DCMFC. Arcobacter lekhitochrous and Arcobacter butzleri, a part of the Arcobacter group, are defined explicitly as epsilon proteobacteria (ε-proteobacteria), which is classified as one of the proteobacteria genera, having a function of electron producing and transferring active bacteria [65,66,67,68]. Likewise, Clostridium polynesiense and Clostridium aurantibutyricum, a part of the Clostridium group, are particularly defined as firmicutes that are stated to be one of EABs, having a similar function with ε-proteobacteria. At the same time, Lactococcus laudensis, Schwartzia succinivorans, and Selenomonas lacticifex are synergistic as a catalyst to convert organic substances to the electron. Schwartzia sp. and Selemonas sp., specified as anaerobic, Gram-negative, and non-spore-forming bacteria, are the most closely related genera [69]. Lactococcus sp. is a Gram-positive bacteria that utilize the soluble redox mediators taken by Gram-negative bacteria [70,71].
Regarding the feeding characteristics in Table 2, the results indicate that the pH showed to be lower when OLR became higher, but the pH of feeding was still neutral, which was useful for the adaptation of microorganisms to the new environment which has a pH range of 5–8.5 [72]. Only at the low OLR would the optimal living of microorganisms be inhibited. The temperature also showed a good environmental factor that is adaptable for microorganism living, especially for the seeding characteristics, which can live optimally around 15–37 °C [72]. The overall ORP value was appropriately performed due to the pre-treatment using nitrogen gas injection into the solution. The ORP was reported in a range of −200 mV to −100 mV in performing the integrated MFC-CW [73], the bio-electrochemical oxidation of sulfide utilized by sulfate-reducing bacteria (SRB) has an ORP range of −150 mV to −100 Mv [74], and the phosphorus (P) utilization and energy production in the dual chamber-microbial fuel cells (DCMFCs) presented an ORP range of −600 mV to −300 mV [75]. Therefore, ORP could be an option for process monitoring in MFC related to environmental factors. Subsequently, OD600 shows that it could be higher at high OLR. It could be depicted here that high OLR in the COD unit affected the OD600 value and would influence the end value of OD600.
In addition to these feeding characteristics, the effect of the presence of organic pollutants and inorganic pollutants known as complex substrates on the performance of MFCs has been reported in many MFC studies. Specific components derived from salt (chloride) [76,77], and heavy metals (chromium, cadmium, mercury, lead, etc.) [78,79,80] are the parameters that most inhibit MFC performance. Since this study used a pure substrate containing components and concentrations suitable for EAB, this substrate did not affect its performance.
4.3. Factors Affecting the Performance
The pH, temperature, and ORP used in this research were defined as the control parameters to manage the applied variables. pH is an imperative parameter that affects the performance of DAC-DCMFC since the EAB typically comprise adaptive microorganisms at pH 6–8 [81]. The results presented that the input pH of different OLRs and observed pHs during DAC-DCMFC operation could successfully stimulate the EABs to produce and transfer electricity. The pH input of the different OLRs between 7 and 9 could help the system suit the environmental condition and prevent the shock loading in which pH 8–10 was reported to improve the electrical generation in MFC [82]. Various references reported that the observed pH between 6.8 and 7.5 is the optimal range for methanogenic activities, meaning operation in an anaerobic condition [83]. The pH would affect CE [84,85], CH4 production [83], the release of CO2 [86], the anode reaction kinetics [87,88], the electrochemical relationship between anode and biofilm [88], the population density of EAB [15], suppress or inactive the methanogenic bacteria, which is currently known to be contributing to one of the EAB [15], the electroactive moiety density and the main effect is reducing the MFC internal resistance [87].
At this point, the significant effect of pH on the other observed variables was OD600, COD, TOC, and power production. OD600 presenting the density of bacteria population would increase significantly in which the pHs were in the optimal range value, whereas COD and TOC representing the organic substances containing carbon and nutrients, would be removed substantially as well [89,90]. The power production could be stable during the process and directly improve the entire MFC performance [91]. Owing to the fact that pH, temperature, and ORP were not the independent variables, subsequently, the effect was not too considerable. Those variables were only observed during the process to ensure that the condition was in the appropriate range.
Based on the observation of both the type 1 and 2 reactors, as seen in Figure 2, pHs at the first anode chamber were no significant different than at the second anode chamber since the first anode chamber contained a high concentration of COD and TOC that affected the decreasing of pH, due to the high hydrogen ion generation [92,93]. There were no such different values between the type 1 and 2 reactors of each OLR.
Linares et al. (2019) [94] reported that COD removal in several studies achieved ranges from 36% to 84%. It could be said that the results of this study are still on the normal performance of MFC research, even though the maximum COD removal could achieve up to 78%. In comparison with the similar condition of this study, COD removal is around 58% during 48 h with a power maximum at 498 mV and current maximum at 7.9 mA in CCV mode [50].
Particularly, it could be stated for a type 1 reactor that higher OLR does not mean higher COD removal. However, it could be appointed on the type 2 reactor that the higher the OLR, the higher COD removal is linearly achieved. Santos et al. (2017) [92] reported that higher-applied COD concentration influencing the OLR could decrease the COD removal. The other study reported similar results in which treating swine wastewater at a high concentration of COD decreased the COD removal [95]. When undiluted wood industry wastewater applied on SMFC, the COD removal only achieved a maximum of 40% [60]. This result is appropriate with the applied OLR recommendation between 0.05 kg.m−3.d−1 and 2 kg.m−3.d−1 for optimizing any kind of MFC system by many types of research [96].
Likewise, it could be stated that the COD removal at the first and second anode chamber on both reactors is relatively similar, as seen in Figure 3. In comparison, medium and high OLR appeared to be the same or slightly different on COD removal, even though high OLR still provided high COD removal. It could be concluded that the microbial activities are adaptable in high COD concentrations.
Meanwhile, the TOC removal maximum contributes similarly to the COD removal maximum, as seen in Figure 3. Medium and high OLR provides up to 100% TOC removal meaning that the carbon source as the organic carbon is properly utilized by the EAB. It could be concluded to be same as the COD removal. This study of organic carbon utilization in MFCs has not been yet comprehensively studied to investigate the correlation between COD and TOC in which TOC is a component part of COD used by EAB as their primary carbon source.
Based on the calculation of the final COD concentration in daily averages of the three OLRs levels, the treated effluent from the low and medium OLRs of the DAC-DCMFC meets the 2015 Japanese National Effluent Standard (J-NES), where the COD level is set to a maximum of 120 mg/L for a daily average, whereas the high OLR does not meet J-NES 2015. This study opens up further opportunities and challenges, especially for dealing with high OLR, that a multi-anode chamber known as anode baffle chamber for multi-stage treatment can be developed to gradually enhance the organic removal and ensure an increase in power generation.
In addition, COD and TOC removal were revealed at different OLRs and each anode chamber compartment. From this information, we can calculate the further design and construction of the DCMFC. Because the design criteria for the multi-anode compartment are not concise, this study contributes to its use as a benchmarking design.
4.4. Power Production Performance
Figure 5 shows that low OLR performed lower than medium and high OLRs in power production. Likewise, the type 1 and 2 reactors demonstrated similarly in power production at the overall OLRs level. Furthermore, the second anode chamber presented higher power production at overall OLRs than the first anode chamber. In fact, the second anode chamber enhanced the power production to be 3–6% higher than the first anode chamber both in type 1 and 2 reactors. Moreover, the second anode chamber was two-fold in HRT or 24 h longer than the first anode chamber; hence, an abundant electron that passed from the first anode chamber could be transferred to the second anode chamber. Another reason is the cathode material used that contributes to increasing the ORR rate on the surface of the cathode [97,98,99,100].
As seen in Figure 4 and Figure 5, the power production showed approximately on average at 460 mV, when the highest was achieved at 483 mV. The difference in power was only less than ±5%. Consequently, the power production among OLRs level could be defined similarly. It is comprehensible in which the measurement was conducted in a stable position after the acclimation period.
Additionally, a comparison study was conducted to support the explained information above regarding the associated references in power production. This study used the components mentioned in Table 1, and the results provided power at a maximum of 483.3 ± 15 mV with power density at a maximum of 866 ± 44 mW/m2 (5.15 ± 0.26 W/m3), and CE reached a maximum of 84%. Meanwhile, other studies that used lactate as the anolyte, air as the catholyte, solid graphite rods as the anode and cathode, and PEM Nafion Alfa Aesar presented a power density at a maximum of 458 mW/m2 (23.6 W/m3) [47]. The other studies using a different anolyte from real distillery wastewater, a catholyte from potassium ferricyanide, and an electrode from graphite provided a power density at a maximum of 135.4 mW/m2 (368 mA/m2) [48]. Coupled with related references performed by DA-MFC, which used real brewery wastewater as an anolyte, air as a catholyte, graphite felt as an anode, graphite felt loaded Pt/C as a cathode, and was membraneless presented, at a maximum, a power of 0.46 mW [101]. All related studies showed high performance on a couple of sides, such as high volumetric power density, which means a high predictor of in-field application. This study is located on the high level of power density, indicating that this configuration has increased the power density at a maximum of 1.9-fold rather than the previous studies.
Meanwhile, CE achieved a maximum of 84% measured after 144 h since the previous CE showed up to 100%. These CE ranges are acceptable as the minimum requirement of at least 80% to optimize the MFC system [58]. In comparison with the other studies using acetate as their substrate, CE achievement was up to 70% [102,103].
However, the volumetric power density was still lower than the other studies associated with general DCMFCs. It could happen since the design volume of the anode chamber did not adopt the stack MFC. The other studies performed analytical MFC design using disposable polypropylene as their findings to adjust anode distance to the membrane or anodic volume without redesigning the MFC construction many times [27]. Nevertheless, we could understand and reveal that volumetric power density can be enhanced by modifying the anode chamber. Here, we can contribute to the knowledge regarding the optimum design of future multiple anode chamber MFC and strengthen the cognition in developing multiple anode chambers into stack MFC integrated with WWTPs.
4.5. Cost Consideration
This study used two types of reactors with different cathodic materials. In order to face further practical use, a cost analysis was calculated to compare the appropriate design and configuration applied in the field. The specific cost analysis is the cost-benefit ratio (C/B). The cost component consists of capital and O&M costs, while the benefit component consists of returning or recovering the use of the reactor. Disbenefit is the effect of using the reactor. For the purpose of calculating the C/B ratio, the inflation assumption is set at 6% per year with a viable economic period of 10 years.
Based on the analysis, the C/B ratio of the type 1 reactor is 0.7 less than the recommended one of 1 so that it provides advantages in its application. Compared to the C/B ratio of the type 2 reactor, which is 1.3 over 1, it presents a small advantage. It is the case where the type 2 reactor used an expensive catalyst to obtain the ORR of the cathodic material. While the type 1 reactor used an alternative catalyst that was used as waterproofing as well, the costs incurred are only 2% of the catalyst used in the type 2 reactor, providing stable and the same organic removal as the type 2 reactor.
5. Conclusions
DAC-DCMFC is a promising design and configuration of MFC technology in power production and organic pollutant removal. It contributes to increasing power density 1.9 times, compared to the closer design and configuration of other multiple anode chambers MFC reported in the literature. Power production was achieved at a maximum of 866 ± 44 mW/m2 (5.15 ± 0.26 W/m3), and coulombic efficiency (CE) reached a maximum of 84%. COD and TOC removals represented by medium OLR achieved the maximum organic removal ranging from 60% to 80%.
There were no significant differences among low, medium, and high OLRs in power production; however, the different levels of OLRs highly influenced the COD and TOC removal in which low OLR presented as being lower than medium and high OLRs. Meanwhile, the second anode chamber achieved higher performance in power production at overall OLRs than the first anode chamber. In addition, there were no substantial differences in COD and TOC removal between the two compartments.
Overall tested OLRs could be used for further study in the development of DAC-DCMFC. For recommendation, medium OLR is more preferred for the start-up process, due to fast EAB adaptation and stable power output in long-term performance. The modified anode chamber by separating the anode space into two parts in a dual anode chamber microbial fuel cell applied by different organic loadings reveals a better understanding of the actual application of a wastewater treatment integrated microbial fuel cell.
Author Contributions
G.S.: Conceptualization, methodology, formal analysis, investigation, data curation, writing—original draft, visualization. T.I.: conceptualization, methodology, resources, writing—review and editing, supervision, project administration, funding acquisition. Y.-T.H.: conceptualization, methodology, writing–review and editing. All authors have read and agreed to the published version of the manuscript.
Funding
This research received no external funding.
Institutional Review Board Statement
Not applicable.
Informed Consent Statement
Not applicable.
Acknowledgments
The first author would like to thank Diponegoro University, The Ministry of Education and Culture of the Republic of Indonesia for the full support through the Doctoral Degree Scholarship Program (Grant No. 5853/UN7.P2/KS/2019).
Conflicts of Interest
The authors declare that they have no known competing financial interests or personal relationships that could have appeared to influence the work reported in this paper.
References
- Samudro, H.; Mangkoedihardjo, S. Indoor phytoremediation using decorative plants: An overview of application principles. J. Phytol. 2021, 13, 28–32. [Google Scholar] [CrossRef]
- Samudro, G.; Mangkoedihardjo, S. Mixed plant operations for phytoremediation in polluted environments—A critical review. J. Phytol. 2020, 12, 99–103. [Google Scholar] [CrossRef]
- Syvitski, J.; Waters, C.N.; Day, J.; Milliman, J.D.; Summerhayes, C.; Steffen, W.; Zalasiewicz, J.; Cearreta, A.; Gałuszka, A.; Hajdas, I.; et al. Extraordinary human energy consumption and resultant geological impacts beginning around 1950 CE initiated the proposed Anthropocene Epoch. Commun. Earth Environ. 2020, 1, 1–13. [Google Scholar] [CrossRef]
- Ahsan, M.A.; Santiago, A.R.P.; Nair, A.N.; Weller, J.M.; Sanad, M.F.; Valles-Rosales, D.J.; Chan, C.K.; Sreenivasan, S.; Noveron, J.C. Metal-Organic frameworks-derived multifunctional carbon encapsulated metallic nanocatalysts for catalytic peroxymonosulfate activation and electrochemical hydrogen generation. Mol. Catal. 2020, 498, 111241. [Google Scholar] [CrossRef]
- Ahsan, M.A.; Imam, M.A.; Santiago, A.R.P.; Rodriguez, A.; Alvarado-Tenorio, B.; Bernal, R.; Luque, R.; Noveron, J.C. Spent tea leaves templated synthesis of highly active and durable cobalt-based trifunctional versatile electrocatalysts for hydrogen and oxygen evolution and oxygen reduction reactions. Green Chem. 2020, 22, 6967–6980. [Google Scholar] [CrossRef]
- Dominguez, N.; Torres, B.; Barrera, L.A.; Rincon, J.E.; Lin, Y.; Chianelli, R.R.; Ahsan, M.A.; Noveron, J.C. Bimetallic CoMoS Composite Anchored to Biocarbon Fibers as a High-Capacity Anode for Li-Ion Batteries. ACS Omega 2018, 3, 10243–10249. [Google Scholar] [CrossRef] [PubMed]
- Gajda, I.; Greenman, J.; Ieropoulos, I.A. Recent advancements in real-world microbial fuel cell applications. Curr. Opin. Electrochem. 2018, 11, 78–83. [Google Scholar] [CrossRef]
- Fadzli, F.S.; Bhawani, S.A.; Rania, E.A.M. Microbial Fuel Cell: Recent Developments in Organic Substrate Use and Bacterial Electrode Interaction. J. Chem. 2021, 2021, 4570388. [Google Scholar] [CrossRef]
- Chen, H.; Simoska, O.; Lim, K.; Grattieri, M.; Yuan, M.; Dong, F.; Lee, Y.S.; Beaver, K.; Weliwatte, S.; Gaffney, E.M.; et al. Fundamentals, Applications, and Future Directions of Bioelectrocatalysis. Chem. Rev. 2020, 120, 12903–12993. [Google Scholar] [CrossRef]
- Ahmed, I.; Zia, M.A.; Afzal, H.; Ahmed, S.; Ahmad, M.; Akram, Z.; Sher, F.; Iqbal, H.M.N. Socio-economic and environmental impacts of biomass valorisation: A strategic drive for sustainable bioeconomy. Sustainability 2021, 13, 4200. [Google Scholar] [CrossRef]
- Capodaglio, A.G.; Bolognesi, S.; Cecconet, D. Sustainable, decentralized sanitation and reuse with hybrid nature-based systems. Water 2021, 13, 1583. [Google Scholar] [CrossRef]
- Verma, P.; Daverey, A.; Kumar, A.; Arunachalam, K. Microbial Fuel Cell—A Sustainable Approach for Simultaneous Wastewater Treatment and Energy Recovery. J. Water Process. Eng. 2021, 40, 101768. [Google Scholar] [CrossRef]
- Flimban, S.G.A.; Ismail, I.M.I.; Kim, T.; Oh, S.-E. Overview of recent advancements in the microbial fuel cell from fundamentals to applications: Design, major elements, and scalability. Energies 2019, 12, 3390. [Google Scholar] [CrossRef] [Green Version]
- Paucar, N.E.; Sato, C. Microbial Fuel Cell for Energy Production, Nutrient Removal and Recovery from Wastewater: A Review. Processes 2021, 9, 1318. [Google Scholar] [CrossRef]
- Igboamalu, T.E.; Bezuidenhout, N.; Matsena, M.T.; Chirwa, E.M.N. Microbial fuel cell power output and growth: Effect of pH on anaerobic microbe consortium. Chem. Eng. Trans. 2019, 76, 1381–1386. [Google Scholar]
- Potrykus, S.; León-Fernández, L.F.; Nieznański, J.; Karkosiński, D.; Fernandez-Morales, F.J. The influence of external load on the performance of microbial fuel cells. Energies 2021, 14, 612. [Google Scholar] [CrossRef]
- Lawson, K.; Rossi, R.; Regan, J.M.; Logan, B.E. Impact of cathodic electron acceptor on microbial fuel cell internal resistance. Bioresour. Technol. 2020, 316, 123919. [Google Scholar] [CrossRef]
- Rossi, R.; Logan, B.E. Unraveling the contributions of internal resistance components in two-chamber microbial fuel cells using the electrode potential slope analysis. Electrochim. Acta 2020, 348, 136291. [Google Scholar] [CrossRef]
- Waheeb, H.A.; Al-Alalawy, A.F. Innovative microbial fuel cell design for investigation of cathode chamber effect and electricity generation enhancement. AIP Conf. Proc. 2020, 2213, 020212. [Google Scholar]
- Gajda, I.; Obata, O.; Greenman, J.; Ieropoulos, I.A. Electroosmotically generated disinfectant from urine as a by-product of electricity in microbial fuel cell for the inactivation of pathogenic species. Scientific Reports. 2020, 10, 5533. [Google Scholar] [CrossRef] [PubMed]
- Nath, D.; Ghangrekar, M.M. Plant secondary metabolites induced electron flux in microbial fuel cell: Investigation from laboratory-to-field scale. Scientific Reports. 2020, 10, 17185. [Google Scholar] [CrossRef]
- Ren, J.; Li, N.; Du, M.; Zhang, Y.; Hao, C.; Hu, R. Study on the effect of synergy effect between the mixed cultures on the power generation of microbial fuel cells. Bioengineered 2021, 12, 844–854. [Google Scholar] [CrossRef]
- Rajesh, P.P.; Noori, M.T.; Ghangrekar, M.M. Improving Performance of Microbial Fuel Cell by Using Polyaniline-Coated Carbon–Felt Anode. J. Hazardous Toxic Radioact. Waste 2020, 24, 04020024. [Google Scholar] [CrossRef]
- Jingyu, H.; Miwornunyuie, N.; Ewusi-Mensah, D.; Koomson, D.A. Assessing the factors influencing the performance of constructed wetland-microbial fuel cell integration. Water Sci. Technol. 2020, 81, 631–643. [Google Scholar] [CrossRef] [Green Version]
- Chakraborty, I.; Das, S.; Dubey, B.K.; Ghangrekar, M.M. Novel low cost proton exchange membrane made from sulphonated biochar for application in microbial fuel cells. Mater. Chem. Phys. 2020, 239, 122025. [Google Scholar] [CrossRef]
- Aysla Costa De Oliveira, M.; D’Epifanio, A.; Ohnuki, H.; Mecheri, B. Platinum group metal-free catalysts for oxygen reduction reaction: Applications in microbial fuel cells. Catalysts 2020, 10, 475. [Google Scholar] [CrossRef]
- You, J.; Greenman, J.; Ieropoulos, I. Novel Analytical Microbial Fuel Cell Design for Rapid in Situ Optimisation of Dilution Rate and Substrate Supply Rate, by Flow, Volume Control and Anode Placement. Energies 2018, 11, 2377. [Google Scholar] [CrossRef] [Green Version]
- Singh, A.; Kaushik, A. Sustained energy production from wastewater in microbial fuel cell: Effect of inoculum sources, electrode spacing and working volume. 3 Biotech. 2021, 11, 334. [Google Scholar] [CrossRef] [PubMed]
- Flimban, S.G.A.; Hassan, S.H.A.; Rahman, M.M.; Oh, S.E. The effect of Nafion membrane fouling on the power generation of a microbial fuel cell. Int. J. Hydrogen Energy 2020, 45, 13643–13651. [Google Scholar] [CrossRef]
- Shabani, M.; Younesi, H.; Pontié, M.; Rahimpour, A.; Rahimnejad, M.; Zinatizadeh, A.A. A critical review on recent proton exchange membranes applied in microbial fuel cells for renewable energy recovery. J. Clean. Prod. 2020, 264, 121446. [Google Scholar] [CrossRef]
- Ieropoulos, I.; Winfield, J.; Greenman, J. Effects of flow-rate, inoculum and time on the internal resistance of microbial fuel cells. Bioresour. Technol. 2010, 101, 3520–3525. [Google Scholar] [CrossRef]
- Krieg, T.; Wood, J.A.; Mangold, K.M.; Holtmann, D. Mass transport limitations in microbial fuel cells: Impact of flow configurations. Biochem. Eng. J. 2018, 138, 172–178. [Google Scholar] [CrossRef]
- Santos, J.B.C.; de Barros, V.V.S.; Linares, J.J. The Hydraulic Retention Time as a Key Parameter for the Performance of a Cyclically Fed Glycerol-Based Microbial Fuel Cell from Biodiesel. J. Electrochem. Soc. 2017, 164, H3001–H3006. [Google Scholar] [CrossRef]
- Tominaga, M.; Ototani, S.; Darmawan, R. The effect of connection type in series and parallel on electric power generation of mud microbial fuel cell. AIP Conf. Proc. 2020, 2230, 030002. [Google Scholar]
- Miller, A.; Singh, L.; Wang, L.; Liu, H. Linking internal resistance with design and operation decisions in microbial electrolysis cells. Environ. Int. 2019, 126, 611–618. [Google Scholar] [CrossRef] [PubMed]
- Aelterman, P.; Rabaey, K.; Clauwert, P.; Verstraete, W. Microbial fuel cells for wastewater treatment. Biotechnol. Biomim. Civ. Eng. 2006, 54, 9–15. [Google Scholar] [CrossRef] [PubMed] [Green Version]
- Clauwaert, P.; Aelterman, P.; Pham, T.H.; De Schamphelaire, L.; Carballa, M.; Rabaey, K.; Verstraete, W. Minimizing losses in bio-electrochemical systems: The road to applications. Appl. Microbiol. Biotechnol. 2008, 79, 901–913. [Google Scholar] [CrossRef]
- Nandy, A.; Kundu, P.P. Configurations of microbial fuel cells. In Progress and Recent Trends in Microbial Fuel Cells; Elsevier: Amsterdam, The Netherlands, 2018; pp. 25–45. [Google Scholar]
- Minutillo, M.; Nastro, R.A.; Di Micco, S.; Jannelli, E.; Cioffi, R.; Di Giuseppe, M. Performance Assessment of Multi-Electrodes Reactors for Scaling-up Microbial Fuel Cells. E3S Web Conf. 2020, 197, 08020. [Google Scholar] [CrossRef]
- Hamed, M.S.; Majdi, H.S.; Hasan, B.O. Effect of Electrode Material and Hydrodynamics on the Produced Current in Double Chamber Microbial Fuel Cells. ACS Omega 2020, 5, 10339–10348. [Google Scholar] [CrossRef]
- Liu, Y.; Zhang, X.; Zhang, Q.; Li, C. Microbial Fuel Cells: Nanomaterials Based on Anode and Their Application. Energy Technol. 2020, 8, 2000206. [Google Scholar] [CrossRef]
- Frattini, D.; Karunakaran, G.; Cho, E.-B.; Kwon, Y. Sustainable Syntheses and Sources of Nanomaterials for Microbial Fuel/Electrolysis Cell Applications: An Overview of Recent Progress. Processes 2021, 9, 1221. [Google Scholar] [CrossRef]
- Yaqoob, A.A.; Ibrahim, M.N.M.; Rafatullah, M.; Chua, Y.S.; Ahmad, A.; Umar, K. Recent advances in anodes for microbial fuel cells: An overview. Materials 2020, 13, 2078. [Google Scholar] [CrossRef]
- Fatima, M.; Kiros, Y.; Farooq, R.; Lindström, R.W. Low-Cost Single Chamber MFC Integrated With Novel Lignin-Based Carbon Fiber Felt Bioanode for Treatment of Recalcitrant Azo Dye. Front. Energy Res. 2021, 9, 672817. [Google Scholar] [CrossRef]
- Koók, L.; Dörgő, G.; Bakonyi, P.; Rózsenberszki, T.; Nemestóthy, N.; Bélafi-Bakó, K.; Abonyi, J. Directions of membrane separator development for microbial fuel cells: A retrospective analysis using frequent itemset mining and descriptive statistical approach. J. Power Sources 2020, 478, 229014. [Google Scholar] [CrossRef]
- Obileke, K.C.; Onyeaka, H.; Meyer, E.L.; Nwokolo, N. Microbial fuel cells, a renewable energy technology for bio-electricity generation: A mini-review. Electrochem. Commun. 2021, 125, 107003. [Google Scholar] [CrossRef]
- Kim, M.H.; Iwuchukwu, I.J.; Wang, Y.; Shin, D.; Sanseverino, J.; Frymier, P. An analysis of the performance of an anaerobic dual anode-chambered microbial fuel cell. J. Power Sources 2011, 196, 1909–1914. [Google Scholar] [CrossRef]
- Samsudeen, N.; Sharma, A.; Radhakrishnan, T.K.; Matheswaran, M. Performance investigation of multi-chamber microbial fuel cell: An alternative approach for scale up system. J. Renew. Sustain. Energy 2015, 7, 043101. [Google Scholar] [CrossRef]
- Abbassi, R.; Yadav, A.K.; Khan, F.; Garaniya, V. Integrated Microbial Fuel Cells for Wastewater Treatment, 1st ed.; Butterworth-Heinemann: Chennai, India, 2020. [Google Scholar]
- Hemalatha, M.; Shanthi Sravan, J.; Venkata Mohan, S. Self-Induced Bioelectro-Potential Influence on Sulfate Removal and Desalination in Microbial Fuel Cell; Elsevier: Amsterdam, The Netherlands, 2020; Volume 309. [Google Scholar]
- Zhou, W.; Imai, T.; Ukita, M.; Sekine, M.; Higuchi, T. Triggering forces for anaerobic granulation in UASB reactors. Process. Biochem. 2006, 41, 36–43. [Google Scholar] [CrossRef]
- Zhou, W.; Imai, T.; Ukita, M.; Li, F.; Yuasa, A. Effect of loading rate on the granulation process and granular activity in a bench scale UASB reactor. Bioresour. Technol. 2007, 98, 1386–1392. [Google Scholar] [CrossRef] [PubMed]
- Ahmad, M.; Qaiser, A.A.; Huda, N.U.; Saeed, A. Heterogeneous ion exchange membranes based on thermoplastic polyurethane (TPU): Effect of PSS/DVB resin on morphology and electrodialysis. RSC Adv. 2020, 10, 3029–3039. [Google Scholar] [CrossRef] [Green Version]
- Ortiz-Martínez, V.M.; Gajda, I.; Salar-García, M.J.; Greenman, J.; Hernández-Fernández, F.J.; Ieropoulos, I. Study of the effects of ionic liquid-modified cathodes and ceramic separators on MFC performance. Chem. Eng. J. 2016, 291, 317–324. [Google Scholar] [CrossRef] [Green Version]
- Touach, N.; Ortiz-Martínez, V.M.; Salar-García, M.J.; Benzaouak, A.; Hernández-Fernández, F.; de los Ríos, A.P.; Labjar, N.; Louki, S.; El Mahi, M.; Lotfi, E.M. Influence of the preparation method of MnO2-based cathodes on the performance of single-chamber MFCs using wastewater. Sep. Purif. Technol. 2016, 171, 174–181. [Google Scholar] [CrossRef]
- Liu, S.H.; Fu, S.H.; Chen, C.Y.; Lin, C.W. Enhanced processing of exhaust gas and power generation by connecting mini-tubular microbial fuel cells in series with a biotrickling filter. Renew. Energy 2020, 156, 342–348. [Google Scholar] [CrossRef]
- Marassi, R.J.; Queiroz, L.G.; Silva, D.C.V.R.; da Silva, F.T.; Silva, G.C.; de Paiva, T.C.B. Performance and toxicity assessment of an up-flow tubular microbial fuel cell during long-term operation with high-strength dairy wastewater. J. Clean. Prod. 2020, 259, 120882. [Google Scholar] [CrossRef]
- Stoll, Z.A.; Dolfing, J.; Xu, P. Minimum performance requirements for microbial fuel cells to achieve energy-neutral wastewater treatment. Water 2018, 10, 243. [Google Scholar] [CrossRef] [Green Version]
- APHA; AWWA; WEF. Standard Methods for the Examination of Water and Wastewater, 23rd ed.; American Public Health Association: Washington, DC, USA, 2017. [Google Scholar]
- Kloch, M.; Toczylowska-Maminska, R. Toward optimization of wood industry wastewater treatment in microbial fuel cells-mixed wastewaters approach. Energies 2020, 13, 263. [Google Scholar] [CrossRef] [Green Version]
- Logan, B.E. Microbial Fuel Cells; John Wiley & Sons, Inc.: Hoboken, NJ, USA, 2008. [Google Scholar]
- Tanaka, S.; Kobayashi, T.; Kamiyama, K.I.; Bildan, M.L.N. Effects of thermochemical pretreatment on the anaerobic digestion of waste activated sludge. Water Sci. Technol. 1997, 35, 209–215. [Google Scholar] [CrossRef]
- Prashanth, S.; Kumar, P.; Mehrotra, I. Anaerobic Degradability: Effect of Particulate COD. J. Environ. Eng. 2006, 132, 4. [Google Scholar] [CrossRef]
- Gözde Tuğba Köksoy. Investigation of Digester F/M Ratio as a Parameter to Affect Sludge Minimization and Gas Production of Ultrasonically Treated Sludge. Master’s Thesis, Middle East Technical University, Ankara, Turkey, 2009. [Google Scholar]
- Fedorovich, V.; Knighton, M.C.; Pagaling, E.; Ward, F.B.; Free, A.; Goryanin, I. Novel electrochemically active bacterium phylogenetically related to Arcobacter butzleri, isolated from a microbial fuel cell. Appl. Environ. Microbiol. 2009, 75, 7326–7334. [Google Scholar] [CrossRef] [Green Version]
- Toh, H.; Sharma, V.K.; Oshima, K.; Kondo, S.; Hattori, M.; Ward, F.B.; Free, A.; Taylor, T.D. Complete genome sequences of Arcobacter butzleri ED-1 and Arcobacter sp. Strain L, both isolated from a microbial fuel cell. J. Bacteriol. 2011, 193, 6411–6412. [Google Scholar] [CrossRef] [Green Version]
- Pereira-Medrano, A.G.; Knighton, M.; Fowler, G.J.S.; Ler, Z.Y.; Pham, T.K.; Ow, S.Y.; Free, A.; Ward, B.; Wright, P.C. Quantitative proteomic analysis of the exoelectrogenic bacterium Arcobacter butzleri ED-1 reveals increased abundance of a flagellin protein under anaerobic growth on an insoluble electrode. J. Proteom. 2013, 78, 197–210. [Google Scholar] [CrossRef]
- Szydlowski, L.; Lan, T.C.T.; Shibata, N.; Goryanin, I. Metabolic engineering of a novel strain of electrogenic bacterium Arcobacter butzleri to create a platform for single analyte detection using a microbial fuel cell. Enzym. Microb. Technol. 2020, 139, 109564. [Google Scholar] [CrossRef]
- Van Gylswyk, N.O.; Hippe, H.; Rainey, F.A. Schwartzia succinivorans gen. nov., sp. nov., another ruminal bacterium utilizing succinate as the sole energy source. Int. J. Syst. Bacteriol. 1997, 47, 155–159. [Google Scholar] [CrossRef]
- Pham, T.H.; Boon, N.; De Maeyer, K.; Höfte, M.; Rabaey, K.; Verstraete, W. Use of Pseudomonas species producing phenazine-based metabolites in the anodes of microbial fuel cells to improve electricity generation. Appl. Microbiol. Biotechnol. 2008, 80, 985–993. [Google Scholar] [CrossRef] [PubMed]
- Rabaey, K.; Verstraete, W. Microbial fuel cells: Novel biotechnology for energy generation. Trends Biotechnol. 2005, 23, 291–298. [Google Scholar] [CrossRef] [PubMed]
- Hilton, C.L.; Mackey, B.M.; Hargreaves, A.J.; Forsythe, S.J. The recovery of Arcobacter butzleri NCTC 12481 from various temperature treatments. J. Appl. Microbiol. 2001, 91, 929–932. [Google Scholar] [CrossRef]
- Yan, D.; Song, X.; Weng, B.; Yu, Z.; Bi, W.; Wang, J. Bioelectricity generation from air-cathode microbial fuel cell connected to constructed wetland. Water Sci. Technol. 2018, 78, 1990–1996. [Google Scholar] [CrossRef]
- Ryckelynck, N.; Stecher III, H.A.S.; Reimers, C.E. Understanding the Anodic Mechanism of a Seafloor Fuel Cell: Interactions between Geochemistry and Microbial Activity. Biogeochemistry 2005, 76, 113–139. [Google Scholar] [CrossRef]
- Almatouq, A.; Babatunde, A.O. Concurrent phosphorus recovery and energy generation in mediator-less dual chamber microbial fuel cells: Mechanisms and influencing factors. Int. J. Environ. Res. Public Health 2016, 13, 375. [Google Scholar] [CrossRef] [PubMed] [Green Version]
- Miyahara, M.; Kouzuma, A.; Watanabe, K. Effects of NaCl concentration on anode microbes in microbial fuel cells. AMB Express 2015, 5, 34. [Google Scholar] [CrossRef] [Green Version]
- Grattieri, M.; Minteer, S.D. Microbial fuel cells in saline and hypersaline environments: Advancements, challenges and future perspectives. Bioelectrochemistry 2018, 120, 127–137. [Google Scholar] [CrossRef]
- Adekunle, A.; Raghavan, V.; Tartakovsky, B. On-line monitoring of heavy metals-related toxicity with a microbial fuel cell biosensor. Biosens. Bioelectron. 2019, 132, 382–390. [Google Scholar] [CrossRef]
- Sharma, P.; Pandey, A.K.; Kim, S.-H.; Singh, S.P.; Chaturvedi, P.; Varjani, S. Critical review on microbial community during in-situ bioremediation of heavy metals from industrial wastewater. Environ. Technol. Innov. 2021, 24, 101826. [Google Scholar] [CrossRef]
- Gustave, W.; Yuan, Z.; Liu, F.; Chen, Z. Mechanisms and challenges of microbial fuel cells for soil heavy metal(loid)s remediation. Sci. Total Environ. 2021, 756, 143865. [Google Scholar] [CrossRef]
- Puig, S.; Serra, M.; Coma, M.; Cabré, M.; Balaguer, M.D.; Colprim, J. Effect of pH on nutrient dynamics and electricity production using microbial fuel cells. Bioresour. Technol. 2010, 101, 9594–9599. [Google Scholar] [CrossRef]
- Liu, M.; Yuan, Y.; Zhang, L.X.; Zhuang, L.; Zhou, S.G.; Ni, J.R. Bioelectricity generation by a Gram-positive Corynebacterium sp. strain MFC03 under alkaline condition in microbial fuel cells. Bioresour. Technol. 2010, 101, 1807–1811. [Google Scholar] [CrossRef] [PubMed]
- Li, Y.; Chen, Y.; Wu, J. Enhancement of methane production in anaerobic digestion process: A review. Appl. Energy 2019, 240, 120–137. [Google Scholar] [CrossRef]
- Kaur, A.; Boghani, H.C.; Michie, I.; Dinsdale, R.M.; Guwy, A.J.; Premier, G.C. Inhibition of methane production in microbial fuel cells: Operating strategies which select electrogens over methanogens. Bioresour. Technol. 2014, 173, 75–81. [Google Scholar] [CrossRef] [PubMed]
- Rajesh, P.P.; Jadhav, D.A.; Ghangrekar, M.M. Improving performance of microbial fuel cell while controlling methanogenesis by Chaetoceros pretreatment of anodic inoculum. Bioresour. Technol. 2015, 180, 66–71. [Google Scholar] [CrossRef] [PubMed]
- Geng, Y.K.; Yuan, L.; Liu, T.; Li, Z.H.; Zheng, X.; Sheng, G.P. Thermal/alkaline pretreatment of waste activated sludge combined with a microbial fuel cell operated at alkaline pH for efficient energy recovery. Appl. Energy 2020, 275, 115291. [Google Scholar] [CrossRef]
- Yuan, Y.; Zhao, B.; Zhou, S.; Zhong, S.; Zhuang, L. Electrocatalytic activity of anodic biofilm responses to pH changes in microbial fuel cells. Bioresour. Technol. 2011, 102, 6887–6891. [Google Scholar] [CrossRef]
- Liao, Q.; Zhang, J.; Li, J.; Ye, D.; Zhu, X.; Zheng, J.; Zhang, B. Electricity generation and COD removal of microbial fuel cells (MFCs) operated with alkaline substrates. Int. J. Hydrogen Energy 2014, 39, 19349–19354. [Google Scholar] [CrossRef]
- Gonzalez del Campo, A.; Lobato, J.; Cañizares, P.; Rodrigo, M.A.; Fernandez Morales, F.J. Short-term effects of temperature and COD in a microbial fuel cell. Appl. Energy 2013, 101, 213–217. [Google Scholar] [CrossRef]
- Mateo, S.; Gonzalez Del Campo, A.; Lobato, J.; Rodrigo, M.; Cañizares, P.; Fernandez-Morales, F.J. Long-term effects of the transient COD concentration on the performance of microbial fuel cells. Biotechnol. Prog. 2016, 32, 883–890. [Google Scholar] [CrossRef]
- Mahmood, N.A.N.; Ghazali, N.F.; Ibrahim, K.A.; Ali, M.A. Anodic pH Evaluation on performance of power generation from palm oil empty fruit bunch (EFB) in dual chambered microbial fuel cell (MFC). Chem. Eng. Trans. 2017, 56, 1795–1800. [Google Scholar]
- López Velarde Santos, M.; Rodríguez Valadéz, F.J.; Mora Solís, V.; González Nava, C.; Cornejo Martell, A.J.; Hensel, O. Performance of a microbial fuel cell operated with vinasses using different cod concentrations. Rev. Int. Contam. Ambient. 2017, 33, 521–528. [Google Scholar] [CrossRef] [Green Version]
- Algar, C.K.; Howard, A.; Ward, C.; Wanger, G. Sediment microbial fuel cells as a barrier to sulfide accumulation and their potential for sediment remediation beneath aquaculture pens. Sci. Rep. 2020, 10, 13087. [Google Scholar] [CrossRef]
- Linares, R.V.; Domínguez-Maldonado, J.; Rodríguez-Leal, E.; Patrón, G.; Castillo-Hernández, A.; Miranda, A.; Romero, D.D.; Moreno-Cervera, R.; Camara-chale, G.; Borroto, C.G.; et al. Scale up of microbial fuel cell stack system for residential wastewater treatment in continuous mode operation. Water 2019, 11, 217. [Google Scholar] [CrossRef] [Green Version]
- Goto, Y.; Yoshida, N. Scaling up Microbial Fuel Cells for Treating Swine Wastewater. Water 2019, 11, 1803. [Google Scholar] [CrossRef] [Green Version]
- Scott, K.; Yu, E.H.; Ghangrekar, M.M.; Erable, B.; Duteanu, N.M. Biological and microbial fuel cells. Compr. Renew. Energy 2012, 4, 277–300. [Google Scholar]
- Cheng, S.; Liu, H.; Logan, B.E. Increased performance of single-chamber microbial fuel cells using an improved cathode structure. Electrochem. Commun. 2006, 8, 489–494. [Google Scholar] [CrossRef]
- Zhang, X.; He, W.; Yang, W.; Liu, J.; Wang, Q.; Liang, P.; Huang, X.; Logan, B.E. Diffusion layer characteristics for increasing the performance of activated carbon air cathodes in microbial fuel cells. Environ. Sci. Water Res. Technol. 2016, 2, 266–273. [Google Scholar] [CrossRef]
- Midyurova, B.; Nenov, V. Electricity Generation in Microbial Fuel Cells as a Function of Air: Cathode Configuration. Int. J. Altern. Fuels Energy 2017, 1, 9–13. [Google Scholar]
- Walter, X.A.; Greenman, J.; Ieropoulos, I. Binder materials for the cathodes applied to self-stratifying membraneless microbial fuel cell. Bioelectrochemistry 2018, 123, 119–124. [Google Scholar] [CrossRef] [PubMed]
- Kim, J.; Kim, B.; An, J.; Lee, Y.S.; Chang, I.S. Development of anode zone using dual-anode system to reduce organic matter crossover in membraneless microbial fuel cells. Bioresour. Technol. 2016, 213, 140–145. [Google Scholar] [CrossRef] [PubMed]
- Rozendal, R.A.; Hamelers, H.V.M.; Molenkamp, R.J.; Buisman, C.J.N. Performance of single chamber biocatalyzed electrolysis with different types of ion exchange membranes. Water Res. 2007, 41, 1984–1994. [Google Scholar] [CrossRef]
- Sleutels, T.H.J.A.; Darus, L.; Hamelers, H.V.M.; Buisman, C.J.N. Effect of operational parameters on Coulombic efficiency in bioelectrochemical systems. Bioresour. Technol. 2011, 102, 11172–11176. [Google Scholar] [CrossRef] [PubMed]
Figure 1.
Reactor design and configuration.

Figure 2.
Parameters level changes comparison among OLRs; X: Low OLR; Y: Medium OLR; Z: High OLR; 1A1: type 1 reactor and first anode chamber; 1A2: type 1 reactor and second anode chamber; 2A1: type 2 reactor and first anode chamber; 2A2: type 2 reactor and second anode chamber.
Figure 2.
Parameters level changes comparison among OLRs; X: Low OLR; Y: Medium OLR; Z: High OLR; 1A1: type 1 reactor and first anode chamber; 1A2: type 1 reactor and second anode chamber; 2A1: type 2 reactor and first anode chamber; 2A2: type 2 reactor and second anode chamber.

Figure 3.
COD and TOC removal among OLRs; X: low OLR; Y: medium OLR; Z: high OLR; 1A1: type 1 reactor and first anode chamber; 1A2: type 1 reactor and second anode chamber; 2A1: type 2 reactor and first anode chamber; 2A2: type 2 reactor and second anode chamber.
Figure 3.
COD and TOC removal among OLRs; X: low OLR; Y: medium OLR; Z: high OLR; 1A1: type 1 reactor and first anode chamber; 1A2: type 1 reactor and second anode chamber; 2A1: type 2 reactor and first anode chamber; 2A2: type 2 reactor and second anode chamber.

Figure 4.
The overall power production; 1A1: type 1 reactor and first anode chamber; 1A2: type 1 reactor and second an-ode chamber; 2A1: type 2 reactor and first anode chamber; 2A2: type 2 reactor and second anode chamber.
Figure 4.
The overall power production; 1A1: type 1 reactor and first anode chamber; 1A2: type 1 reactor and second an-ode chamber; 2A1: type 2 reactor and first anode chamber; 2A2: type 2 reactor and second anode chamber.

Figure 5.
Power density (P.D.) and coulombic efficiency (CE); X: low OLR; Y: medium OLR; Z: high OLR; 1A1: type 1 reactor and first anode chamber; 1A2: type 1 reactor and second an-ode chamber; 2A1: type 2 reactor and first anode chamber; 2A2: type 2 reactor and second anode chamber.
Figure 5.
Power density (P.D.) and coulombic efficiency (CE); X: low OLR; Y: medium OLR; Z: high OLR; 1A1: type 1 reactor and first anode chamber; 1A2: type 1 reactor and second an-ode chamber; 2A1: type 2 reactor and first anode chamber; 2A2: type 2 reactor and second anode chamber.


Table 1.
Set up of the DAC-DCMFC component based on the variables used.
| Reactor Type | Anolyte | Anode | Separator | Catholyte | Cathode | |
|---|---|---|---|---|---|---|
| A1 | A2 | |||||
| 1 | Sucrose-based substrate | GNPs-SSM 30 mesh | GNPs-SSM 30 mesh | CEM (Nafion 117) | 2 g/L Na2CO3.1.5H2O2 | GNPs:PU 1:1(v/v)-SSM 30 mesh |
| 2 | Sucrose-based substrate | GNPs-SSM 30 mesh | GNPs-SSM 30 mesh | CEM (Nafion 117) | 2 g/L Na2CO3.1.5H2O2 | GNPs:PTFE 60%-SSM 30 mesh |
Here, based on Table 1 above, all the captions in the figures afterward are defined as follow: 1A1 and 1A2: 1st anode-GNPs-SSM, 2nd anode-GNPs-SSM, and cathode-GNPs: PU-SSM; 2A1 and 2A2: 1st anode-GNPs-SSM, 2nd anode-GNPs-SSM, and cathode-GNPs: PTFE-SSM; X: low OLR; Y: medium OLR; Z: high OLR.
Table 2.
Feeding characterization in average.
| Parameters | Low OLR | Medium OLR | High OLR |
|---|---|---|---|
| pH | 8.8 ± 0.09 | 8.3 ± 0.1 | 7.6 ± 0.01 |
| Temperature (°C) | 24.7 ± 1.09 | 24.2 ± 0.34 | 24.2 ± 0.12 |
| ORP (mV) | −226 ± 3.98 | −306 ± 3.98 | −255 ± 7.74 |
| OD600 (Abs) | 0.025 ± 0.007 | 0.04 ± 0.011 | 0.5 ± 0.29 |
| COD (mg/L) | 407 ± 68.89 | 1040 ± 160 | 2387 ± 205 |
| TOC (mg/L) | 87 ± 2.08 | 230 ± 4.65 | 724 ± 40 |
Publisher’s Note: MDPI stays neutral with regard to jurisdictional claims in published maps and institutional affiliations. |
© 2021 by the authors. Licensee MDPI, Basel, Switzerland. This article is an open access article distributed under the terms and conditions of the Creative Commons Attribution (CC BY) license (https://creativecommons.org/licenses/by/4.0/).
Share and Cite
MDPI and ACS Style
Samudro, G.; Imai, T.; Hung, Y.-T. Enhancement of Power Generation and Organic Removal in Double Anode Chamber Designed Dual-Chamber Microbial Fuel Cell (DAC-DCMFC). Water 2021, 13, 2941. https://doi.org/10.3390/w13212941
AMA Style
Samudro G, Imai T, Hung Y-T. Enhancement of Power Generation and Organic Removal in Double Anode Chamber Designed Dual-Chamber Microbial Fuel Cell (DAC-DCMFC). Water. 2021; 13(21):2941. https://doi.org/10.3390/w13212941
Chicago/Turabian StyleSamudro, Ganjar, Tsuyoshi Imai, and Yung-Tse Hung. 2021. "Enhancement of Power Generation and Organic Removal in Double Anode Chamber Designed Dual-Chamber Microbial Fuel Cell (DAC-DCMFC)" Water 13, no. 21: 2941. https://doi.org/10.3390/w13212941
Note that from the first issue of 2016, this journal uses article numbers instead of page numbers. See further details here.