Article

Evaluation of Karst Spring Discharge Response Using Time-Scale-Based Methods for a Mediterranean Basin of Northern Algeria

by
Bilel Zerouali
1,*,
Mohamed Chettih
2,
Mamdooh Alwetaishi
3,
Zaki Abda
2,
Ahmed Elbeltagi
4,5,
Celso Augusto Guimarães Santos
6 and
Enas E. Hussein
7
1
Vegetable Chemistry-Water-Energy Research Laboratory, Faculty of Civil Engineering and Architecture, Hassiba Benbouali, University of Chlef, B.P. 78C, Ouled Fares, Chlef 02180, Algeria
2
Research Laboratory of Water Resources, Soil and Environment, Department of Civil Engineering, Faculty of Civil Engineering and Architecture, Amar Telidji University, Laghouat 03000, Algeria
3
Department of Civil Engineering, College of Engineering, Taif University, Taif 21974, Saudi Arabia
4
Agricultural Engineering Department, Faculty of Agriculture, Mansoura University, Mansoura 35516, Egypt
5
College of Environmental and Resource Sciences, Zhejiang University, Hangzhou 310058, China
6
Department of Civil and Environmental Engineering, Federal University of Paraíba, João Pessoa 58051-900, Brazil
7
National Water Research Center, Shubra El-Kheima 13411, Egypt
*
Author to whom correspondence should be addressed.
Water 2021, 13(21), 2946; https://doi.org/10.3390/w13212946
Submission received: 24 September 2021 / Revised: 8 October 2021 / Accepted: 13 October 2021 / Published: 20 October 2021

Abstract

:
Understanding of behavior, variability, and links between hydrological series is a key element for successful long-term water resources planning and management. In this study, various time-scale-based methods such as correlation and spectral analysis (CSA), cross wavelet (XWT), and wavelet coherence transform (WCT) were applied to assess the response of daily rainfall and karst spring discharge for the Sebaou River basin, which is located on Mediterranean basin in northern Algeria. The CSA revealed that the hydrogeological systems under study are characterized by various memory effect (small, poor, reduced, and extensive) with regularization times ranging from 5 to 50 day. XWT between rainfall and discharge time series indicates few marked disruptions in the spectra between the 1980s and 1990s corresponding to the dry period. The annual process is visible, dominant, and more amplified compared to the multi-annual fluctuations that characterize the 1-3- and 3–6-year modes, which explained the multi-annual regulation. The nonlinear relationship of the short-term components seems to be linked to the periods of storage (infiltration). Compared to the WCT components of 2–5, 26, and 52 weeks, there is a strong coherence for 102 weeks, which explains the long-term component, indicating a quasi-linearity of the rainfall-runoff relationship. According to the obtained results, the construction of more water resources structures is recommended to increase the water storage and improve the water supply due to the richness of the hydrographic network. On the other hand, the impacts of human activities on streamflow due to the looting of rocks and sands in the Sebaou River valleys have reached alarmingly high levels that require urgent intervention for the protection of water and ecological resources and their better rational use.

1. Introduction

Karst is a land with unique shapes and drainage. A worn increased porous zone called epikarst is located on the surface, but in the subterranean there are networks of fractures, splits, and conduits of all sizes and shapes, which comprise an extremely and complex active hydrologoelogical system [1,2]. The reverse flow occurs in channels while uniform flows propagate in fractures and fissures [3]. It can also register rapid discharge and base discharge components for karst springs. The tubing network regulates the fast flow component, whereas the fractures and cracks network manage the base flow component of the release [4,5]. Karst lands are very susceptible to anthropogenic factors, and are vulnerable to contamination from many sources; therefore, it is frequently important to measure the amount of rapid flow [6,7,8]. The result of the karst’s internal structure is rapid oscillations of groundwater, often over large amplitudes, causing rapid changes in the velocity and groundwater direction. This implies that floods from one karst spring to another occur depending on the groundwater level, therefore, in many karst locations across the world, adjacent karst springs with overlapping catchments are common [9,10]. The word “overlapping” shows that portions of the catchment are intermittent or permanent in the presence of multiple karst springs. The groundwater exchange system is typically complicated and time-consuming in adjacent karsts [1,11,12,13].
Different runoffs in recent years have received extensive attention in hydrological and climate research for the quantification of consequences of human interactions and climate change [14,15,16,17,18,19,20]. Some human impacts are demographic pressure, traditional management, and random building of storage structures such as dams. In addition, illegal logging by sand smugglers from the main bed of Wadis River and overexploitation of aquifers by industry and agriculture with very advanced pumping are rapidly decreasing the aquifer storage, and this appears to be the reasons affecting the decline of flows and regulatory reserves [21]. The impact assessments of these factors are essential, and a good understanding of the external environment and hydrogeological structure is required. Understanding this system in depth is one of the targets of this current investigation, as based on the results, it may or may not allow the use and manage of groundwater from the aquifer. Therefore, it is very necessary to point out the abrupt moment (time) of change in these factors to assess the individual impact of these the causes on the runoff. It is worth highlighting that changes in river runoff in different rivers throughout the globe are the central focus of a huge literature that seeks to determine the temporal features of these rapid changes before assessing the effect of climate variability and interactions with humans [22].
Numerous processes with spatiotemporal variation happen across the hydrological cycle and are influenced by hydrological time series. By means of correlation functions, the impacts of these processes may be identified. The high dependence or interconnection between time series can significantly increase the correlation values, therefore misunderstandings generally arise about the effects contained in correlation functions, where some partial correlation functions can overcome those inconveniences by eliminating the linear influence. There are relatively new techniques for the arithmetical reliability test in the hydrological arithmetical has been used to analyze the impacts of hydrometeorological fluctuations on the karst streamflow, e.g., Refs. [23,24].
Correlation spectral analysis (CSA) was developed by Jenkins and Watts (1968), Box and Jenkins (1976), and Mangin (1984) [25,26,27]. It was used for the identification of basic characteristics of karst underground, including research on hydrodynamics of groundwater levels [28,29], transport properties and turbidity dynamics [30], surface and underground flow interactions, cave duct systems, karst underground network connections, storm behavior effects, and response times [31,32,33,34,35,36]. The wavelet method has a different approach because it is directly applied to intervals and can discover latent and hidden aspects in a time series [37]. According to Torrence and Compo (1998) [38], the emergence of wavelet approach represents a qualitative leap in the modern interpretation of results in the time–scale domain. Traditionally, the Short Time Fourier Transform (STFT) is the most used technique to investigate a series in the frequency domain, where it is based only on the assumption of stationarity but, unfortunately, this does not allow a good temporal resolution to the detriment of frequency resolution and vice versa due to the Heisenberg uncertainty principle [39]. One of the main reasons for the success of wavelet transform-based methods is their high spatial precision at small scale. The use of wavelet transform increases significantly year after year in engineering and earth science fields, such as hydroclimatic series analyses [40], large-scale fluctuations [41,42], and analyses of hydrochemical and isotopic characteristics [43]. For example, the relationship between groundwater storage with El Niño, NAO, and AMO variability was investigated by Resende et al. (2019) [44] across Africa. The results indicate that these teleconnection patterns can have a significant impact on groundwater storage and recharge process. In a central-eastern European agricultural region, shallow groundwater (SGW) level fluctuations were assessed according to the climate-driven periodicity. Garamhegyi et al. (2018) [45] revealed a clear relationship between the drought periodicity and the absence of annual cyclic comportment in the SGW level. Meng et al. (2021) [46] analyzed the rainfall effects on karst spring response characteristics in northern China. The results documented that the flow response time to rainfall ranged between 7–16 months and that the karst system in southern China has a low regulating effect compared to the southern part. In Algeria, human effects have also reached record levels in all natural resources, especially in the study area, which requires interventions by the competent authorities to take appropriate deterrent measures and carry out accurate studies that provide realistic solutions for sustainable development and better water and natural resource management. In the absence of studies that discuss streamflows and the nature of karst spring water in Algeria using time-frequency-based methods, this study may provide water resource managers with some pictures for understanding the hydrogeological system of Sebaou River basin. Thus, in this research, CSA, cross wavelet (XWT), and wavelet coherence transform (WCT) were applied on daily hydroclimatic time series of Sebaou River basin (northern Algeria) to:
  • Understand the internal structure of aquifers, storage capacity and obtain information about periodic characteristics.
  • Classify the karst systems of the basin based on memory effect and regularization time.
  • Study the random process of daily hydroclimatic time series using statistical fractals.
  • Assess the causal links and linearity between rainfall and runoff for each sub-basin of the study area.
  • Extract the significant coherence and covariance through isolated components developed between rainfall and runoff time series at a time-scale domain and identify dry and wet periods as well as anthropological impacts on the daily streamflow of the Sebaou River basin.

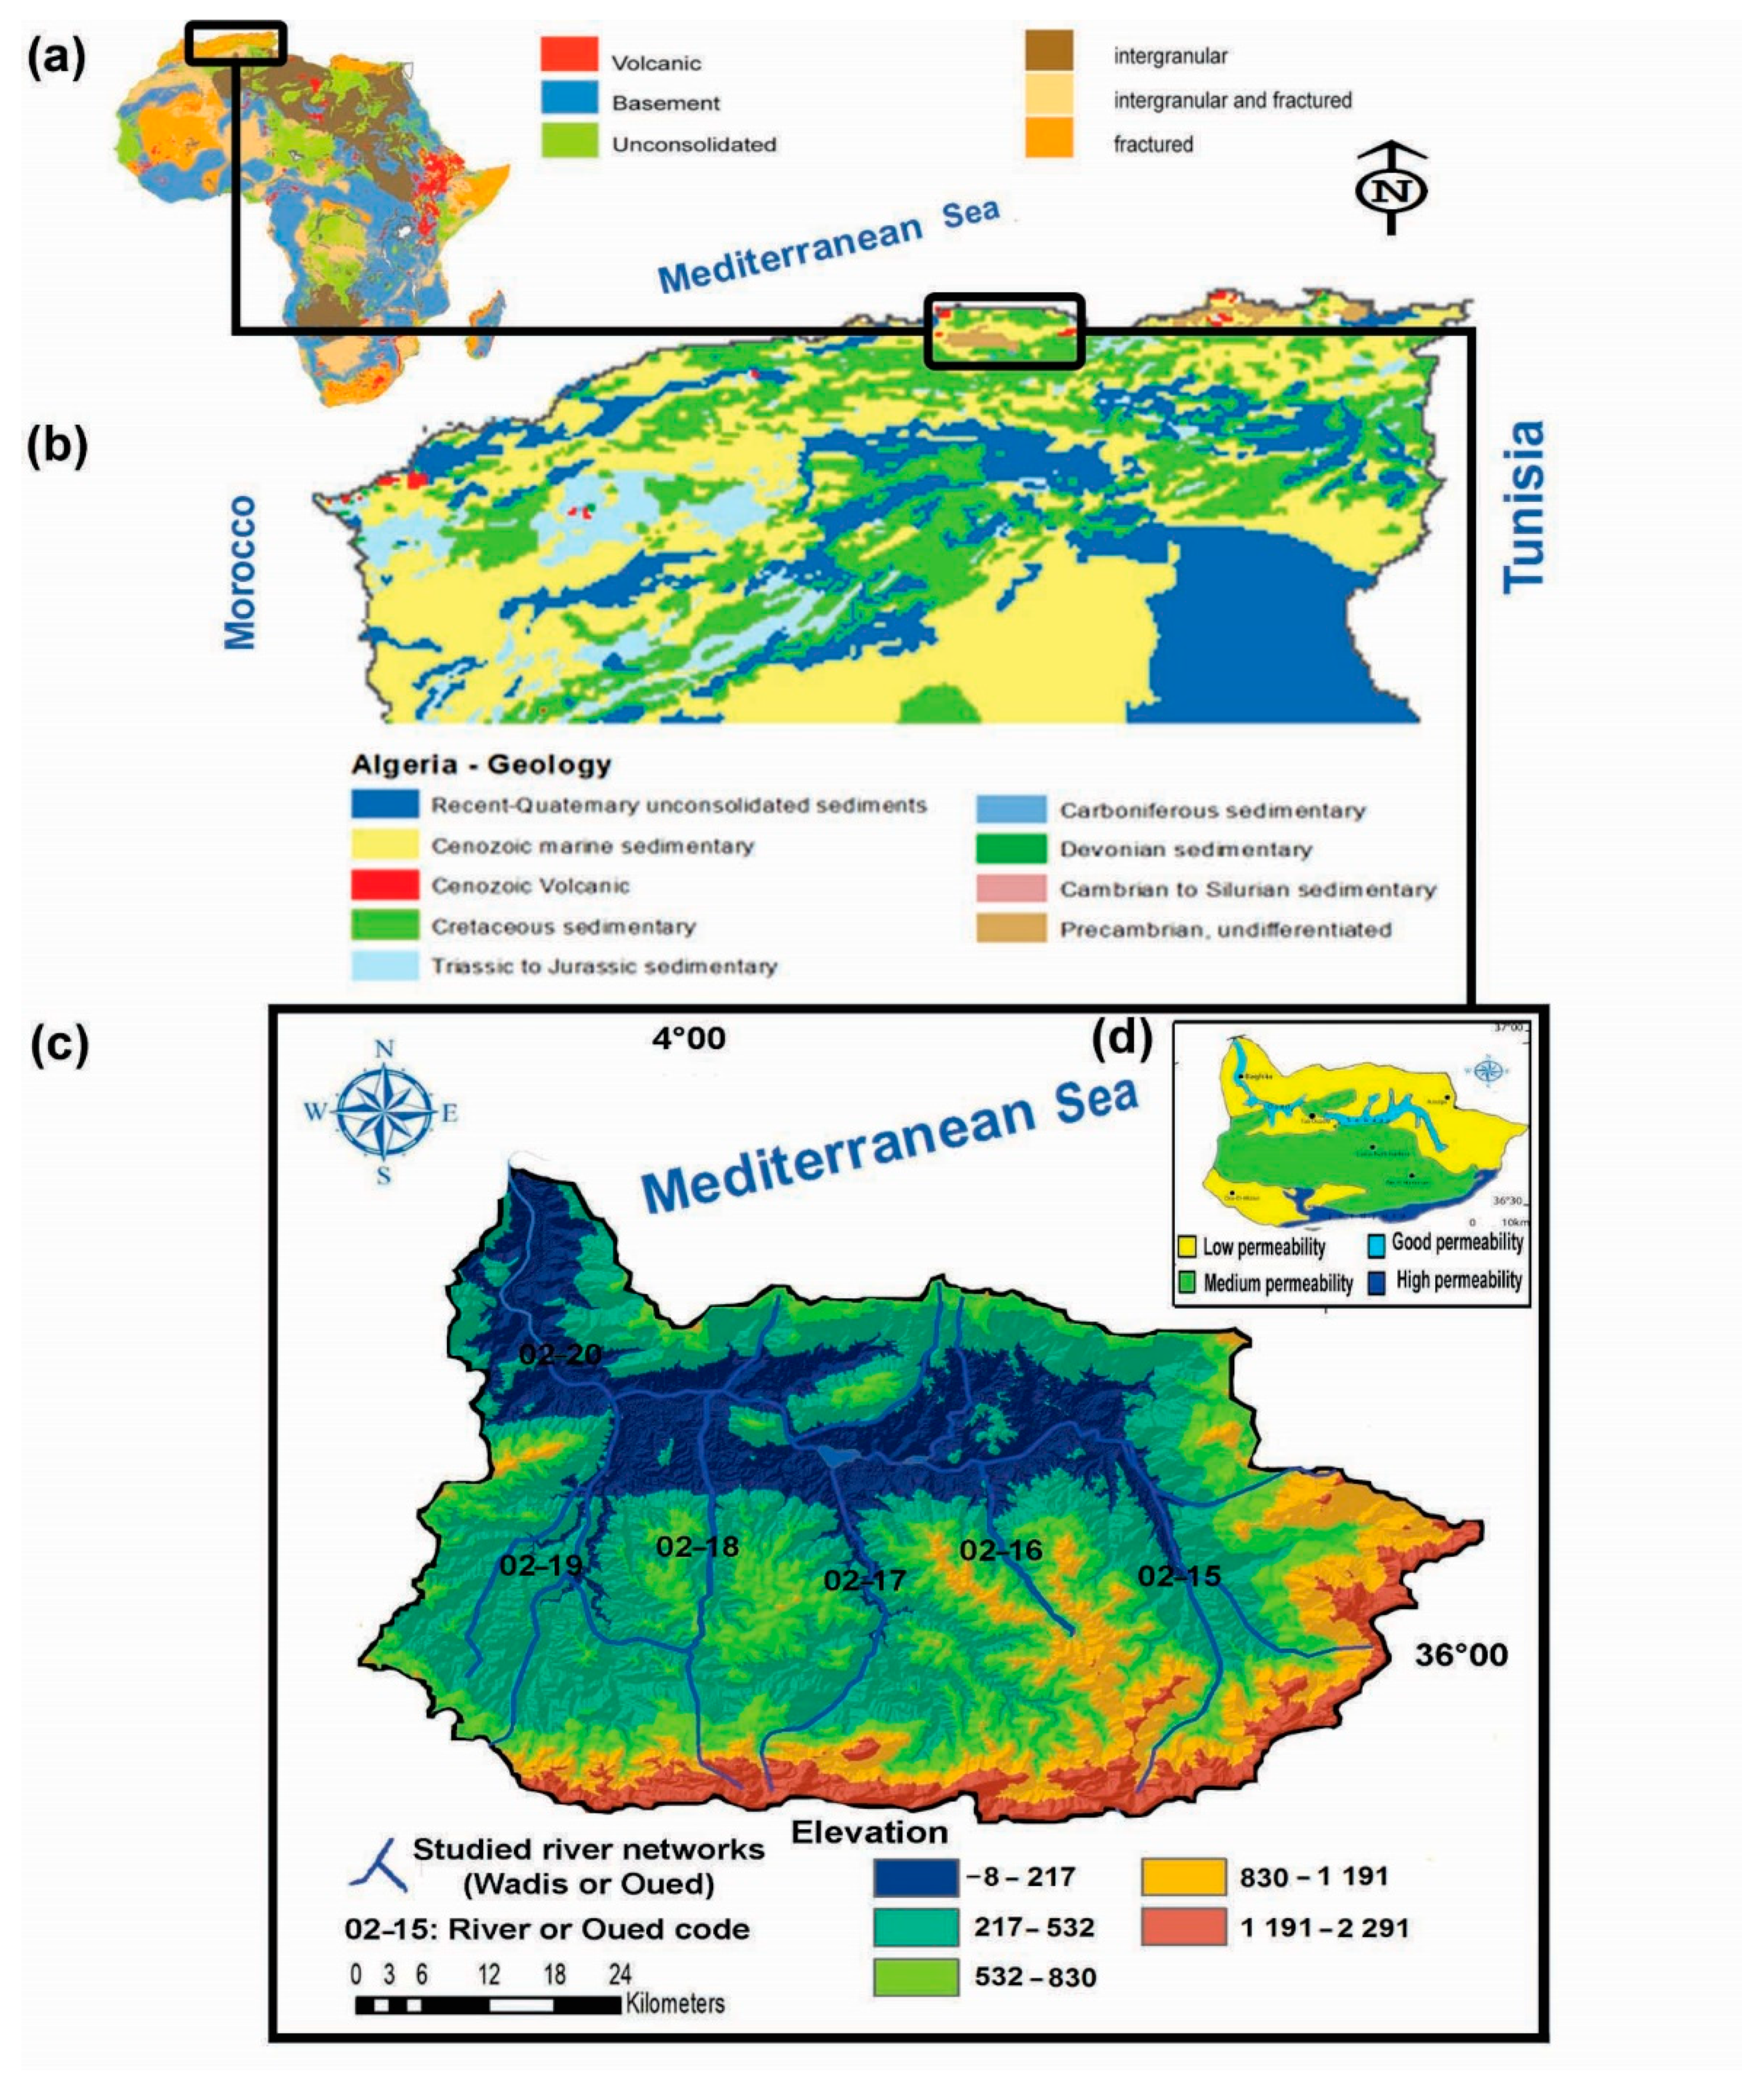
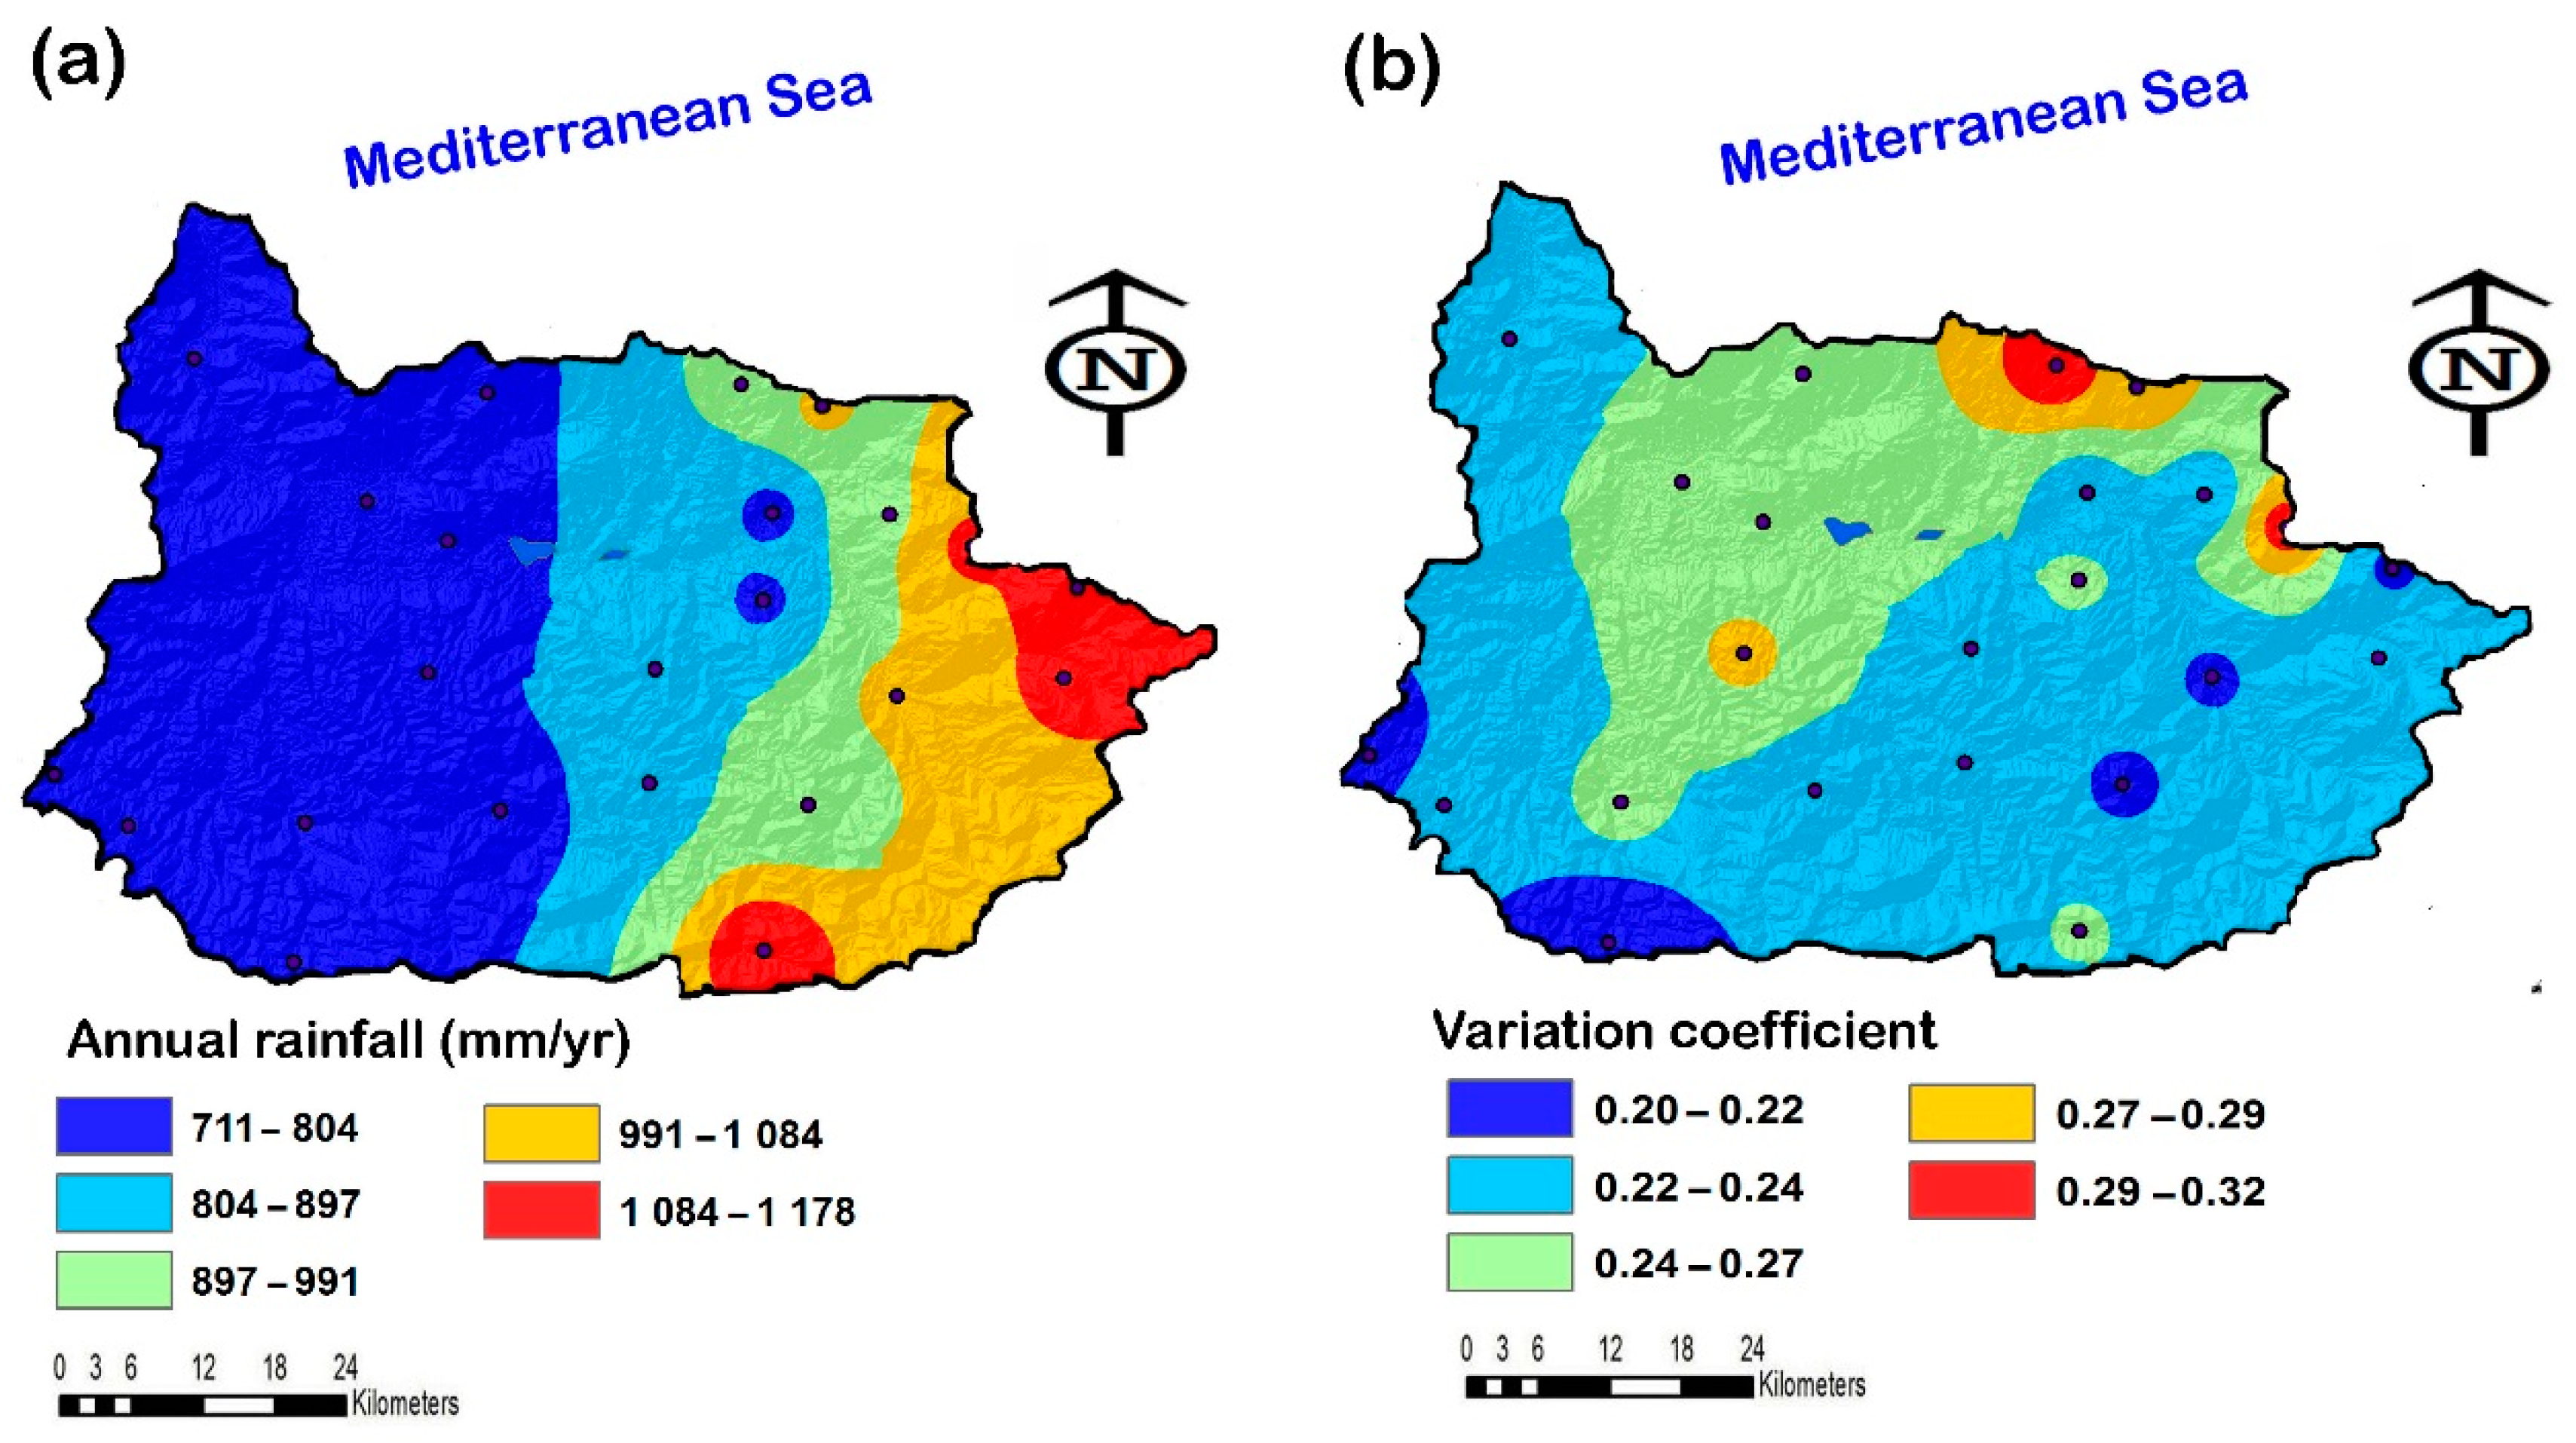
2. Study Area and Database

The Sebaou River basin is one of the Mediterranean basins located in the central north of Algeria, located between longitudes E 03°30′ and 04°30′ and latitudes N 36°30′ and 37°00′ with an area of 2500 km2. Its elevations reach more than 2030 m above sea level (Figure 1b).
The top of the Sebaou river basin consists of the limestone chain that borders the south of the Kabyle stands (Bouira, Tizi Ouzou, and Bejaia) [47], with flysch in the north and east. In the west, it is the Miocene that lines the entire valley. Argillaceous shales and gray and schistous marls with layers of sandstone occupy 70.5% of the middle Sebaou. On the other hand, the lower Sebaou consists of 43.15% of marl formations, sandstone and conglomerates (Figure 1c). These marls, which constitute 69% of the total area of the basin, crack by dehydration during the dry season and deteriorate by several centimeters, forming a carpet of gravel mixed with clay-limestone dust [48].
According to Djemai (2008) [51], the geology of the study region is marked by the peri-Mediterranean alpine orogeny. It appears in several lithological facies, ranging from the oldest Cambro-Ordovician, which forms the plinth, to the most recent, the Quaternary composite of alluvial deposits. Understanding the overall structure of the region depends on the origin of the flyschs. The soft and brittle tectonics responsible for the (N-70) and (N-140) structures and the current morphology are the products of finite Miocene tectonics. The high permeability area is linked to the limestone formations of Djurdjura and detrital of the alluvial aquifer (Figure 1d) [51].
The limestones of Djurdjura and the alluvial deposits of the Sebaou River and its tributaries are the well-known reservoirs of exploited water (Figure 1). The age of the hydrographic network is after the finished-Miocene phase that led to the formation of longitudinal folds (N-70).
The construction of the dam in the municipality of Beni Aïssi in the Aïssi River started in 1994 and was completed in 2001. It is an earth dam 94 m high and 515 m long. The rainfall distribution over the Sebaou River basin (Figure 2a) indicates that the observed interannual rainfall averages (1972–2010) ranged between 700 and 1200 mm with coefficient of variation between 0.20 and 0.33 (Figure 2b).
The databases used in the analysis were obtained from the Algerian National Agency of Water Resources (ANRH) and the details about the stations are presented in Table 1. In addition, long-term rainfall time series were used in the univariate analysis. Figure 3 represent the daily time series of rainfall and streamflow in the Aïssi River sub-basin (1985–2010), whose code is 02-17, as shown in Figure 2 and Table 1.

3. Materials and Methods

3.1. Correlation and Spectral Analysis

Correlation and spectral analysis (CSA), expressing the variation in input-output covariance for different frequencies, has been successfully applied in regional studies of large karst aquifers in the world [52,53].

3.1.1. Simple Analysis

Correlation analysis corresponds to the processing of a single time series, for example, the input or output. It assesses the dependence of successive measures for accumulative time intervals [27,54]. The values rk (k = 0, 1, 2, 3, …, m) are the autocorrelation coefficients obtained. According to Box and Jenkins (1976) [26], the choice of truncation (m) is not based on theoretical concepts, but it can be set as m = N/2, m = N/3 or m = 2N/3. The following expression gives rk:
r k = C k ( k ) C k ( 0 )
C k ( 0 ) = 1 N t = 1 N ( x t x ¯ ) 2     C k ( k ) = 1 N t = 1 N k ( x t x ¯ )   ( x t + k x ¯ )
where C x ( k ) is the autocovariance and k is the time lag or step.
According to Padilla and Pulido-Bosch (1995) [55], the power spectral density function Γ x ( f ) is an unbiased approach of the Fourier transform of the autocorrelation function, where the cyclic phenomena seem like peaks in the graph of Γ x ( f ) [27,54], which is defined as:
Γ x ( f ) = 2   [ 1 + 2 x = 1 m D k r k   cos   ( 2 π f k ) ]
where f is the frequency and D k is a weighting function chosen in such a way that the estimated value of the spectrum Γ x ( f ) is not biased [55]. The Tukey filters were used in this study.

3.1.2. Cross-Analysis

Cross-analysis simultaneously treats two time series, one considered as the input time series of the system, and the other as the output time series. Therefore, it no longer seeks to directly describe the details of the system, but rather a black box with inputs and outputs. It is, therefore, by studying its operation at the source that the structure of the system and its degree of karstification are deduced [54,56].
  • Cross correlograms
Cross-analysis gives the causal relationship between two time series Xt and Yt of N observations [23,25,57]. When r + k r k , this explains that the cross-correlation function is not symmetric:
r + k = r x y ( k ) = C x y ( k ) C x 2 ( 0 ) C y 2 ( 0 ) r k = r y x ( k ) = C y x ( k ) C x 2 ( 0 ) C y 2 ( 0 )
  • Cross spectrum
The cross spectrum corresponds to the decomposition of the covariance between inputs and outputs in the frequency domain. A complex number explains the spectral density function that represents the asymmetry of the intercorrelation function given by the following expression:
Γ x y = | α x y ( f ) |   exp [ i Φ ( f ) ]
From the point of view of its application to the study of hydroclimatic research, the cross-amplitude function α x y ( f ) expresses the variation of the hydrological input-output covariance for different frequencies.
The phase function Φ x y ( f ) expresses the output delay in relation to the input for each frequency with a variation range of 2π, between -π and + π (Equation (6)):
α x y ( f ) = ψ x y 2 ( f ) + Λ x y 2 ( f )    Φ x y ( f ) = arctan   Λ x y ( f ) ψ x y ( f )
where Γ x y ( f ) is the cross spectral density function between Γ x ( f ) and Γ y ( f ) of the input and output, respectively, i denotes 1 , α x y ( f ) is the amplitude, Φ x y ( f ) is the phase function at the frequency f, ψ x y ( f ) is the co-spectrum, and Λ x y ( f ) is the quadrature spectrum.
The coherence function k x y ( f ) exhibits the square of the correlation between the cyclical components of the input-output at the corresponding frequency. It provides information about the linearity of the system and is assimilated to an intercorrelation between the events.
The gain function G x y ( f ) expresses the variations of the regression coefficient (input variance/output variance), accordingly depending on the frequencies. Therefore, it provides an estimate for the augmentation or reduction of the input signal relative to the output signal.
k x y ( f ) = α x y ( f ) Γ x ( f )   Γ y ( f )    G x y ( f ) = α x y ( f ) Γ x ( f )

3.2. Cross Wavelet Transform

In this study, the XWT between rainfall (Xn) and runoff (Yn) is defined by the cross-wavelet power spectrum Wxy = Wx Wy*, where (*) explains the conjugate complex Wxy, and is given as follows [58,59]:
D   ( | W n X ( s ) W n X * ( s )   | δ X δ Y < p )   =   Z ν ( p ) ν P k X P k Y
where:
P k = 1 α 2 | 1 α   e 2 i π k | 2
P k is the Fourier spectrum with autocorrelation of lag-1.   P k x and P k y are calculated for X n and Y n of the variance δ x and δ y , respectively. Zv (P) is the significance level for the probability (P) density function. For XWT, the user must be aware that a coefficient of XWT can be high because the wavelet power spectrum of the two signals is high [60].

3.3. Wavelet Coherence Transform

According to Torrence and Webster (1998) and Grinsted et al. (2004) [58,59], WTC function is given by the following equation:
R n 2 ( s ) =   | S ( s 1 W n X Y ( s ) )   | 2 S ( | s 1 ( W n X ( s ) ) | 2 )   .   S ( | s 1 ( W n Y ( s ) ) | 2 )
where S is the smoothing operator and resemble the mother-wavelet. According to Torrence and Webster (1998) [58], the most compatible parameter S for Morlet wavelet is given by the following equation:
S ( W ) = S s c a l e ( S t i m e ( W n ( s ) ) )
where S t i m e and S s c a l e are smoothing operators in time and scale, respectively. Further information and details on the XWT and WTC theories can be found in Refs. [38,58,59].

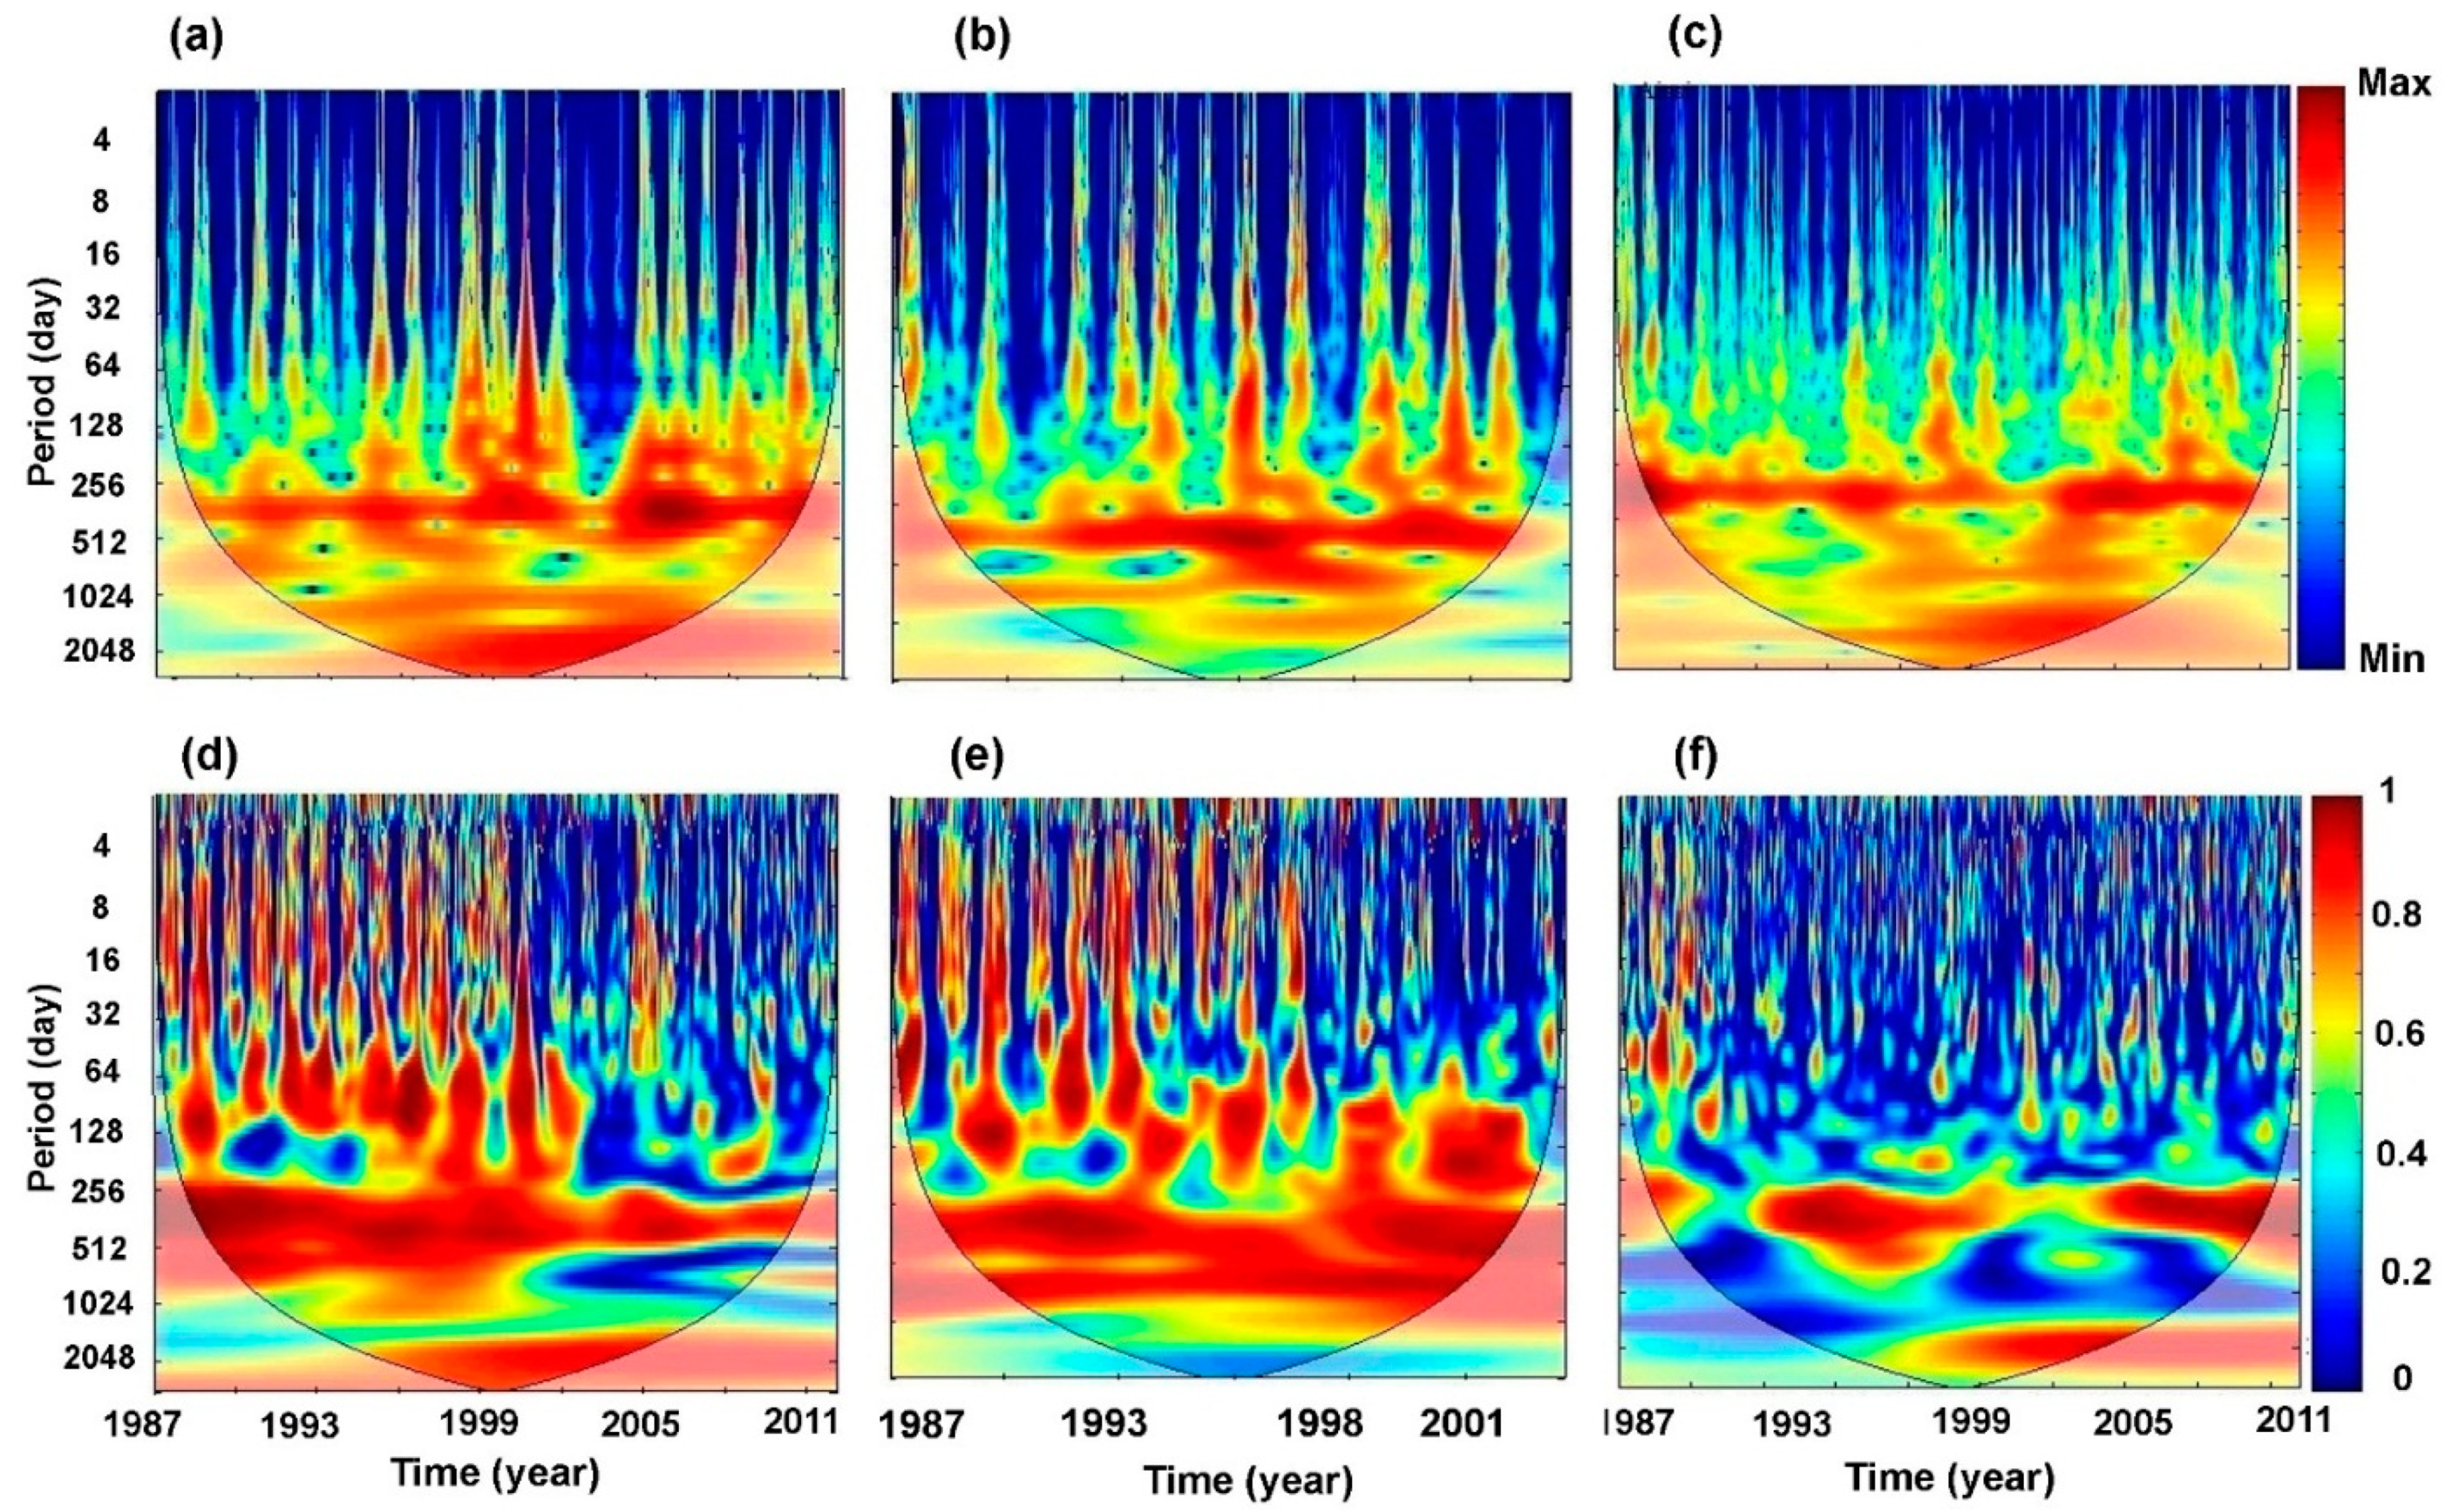
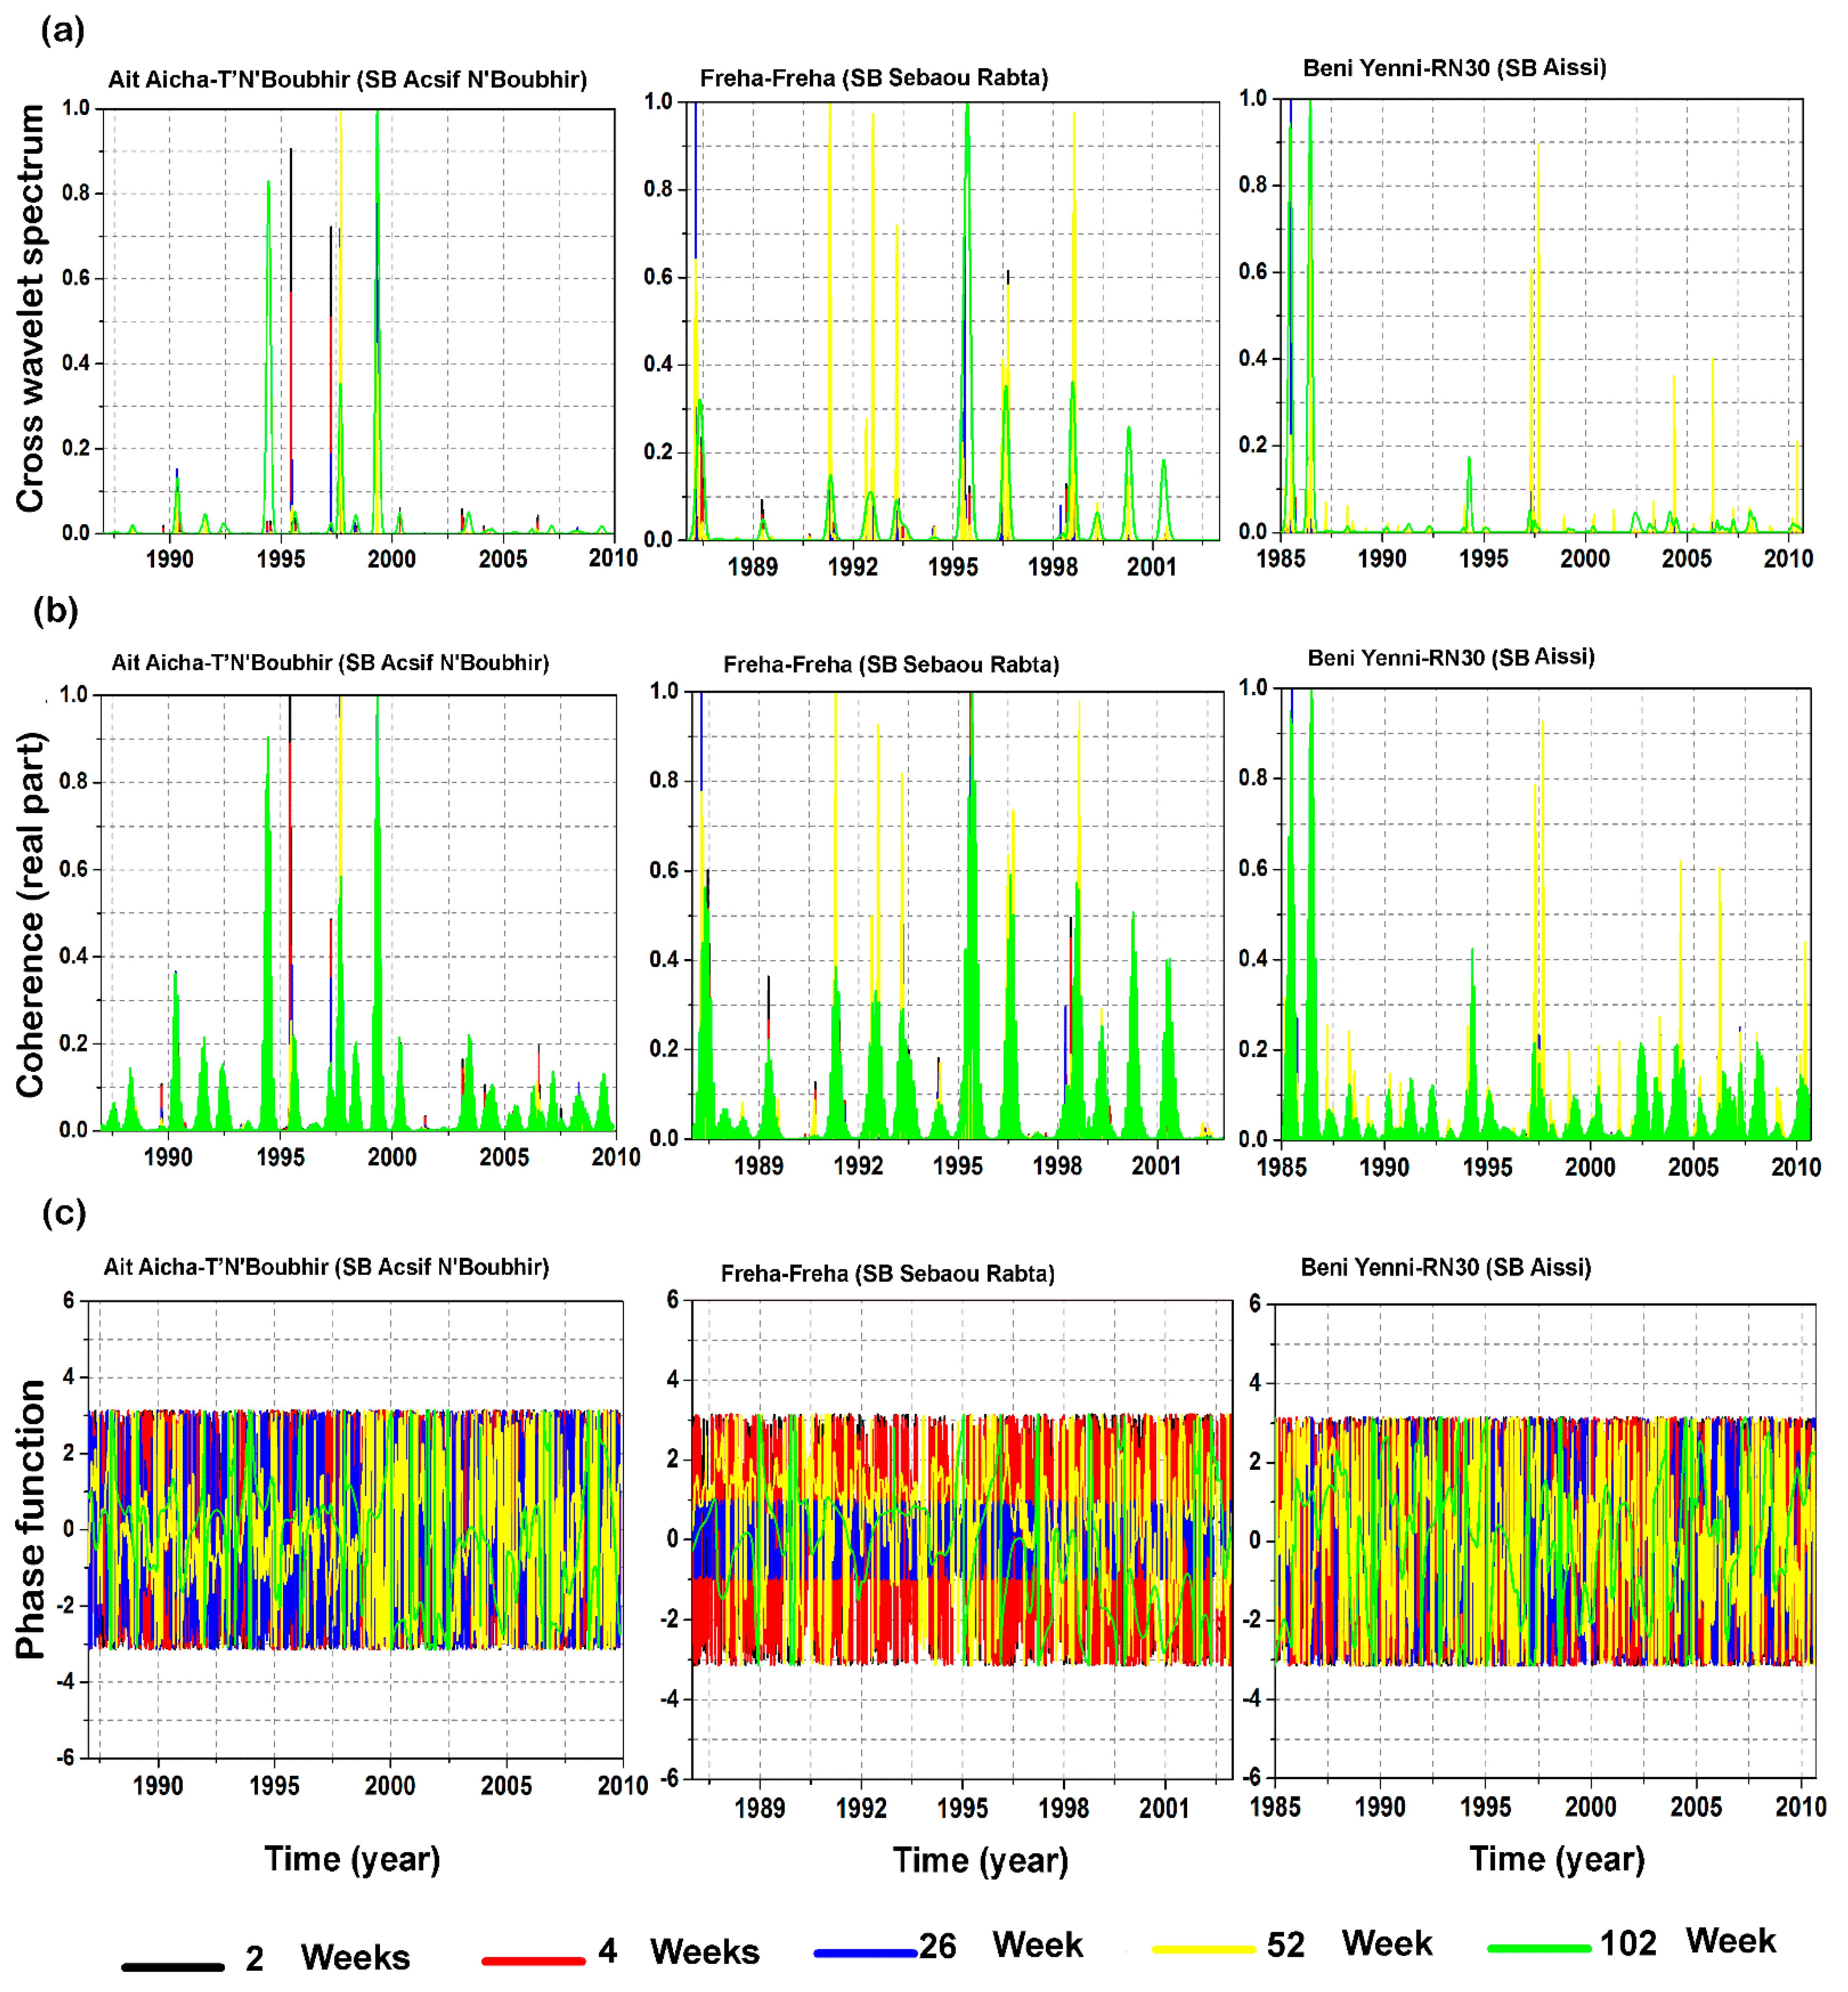
4. Results and Discussion

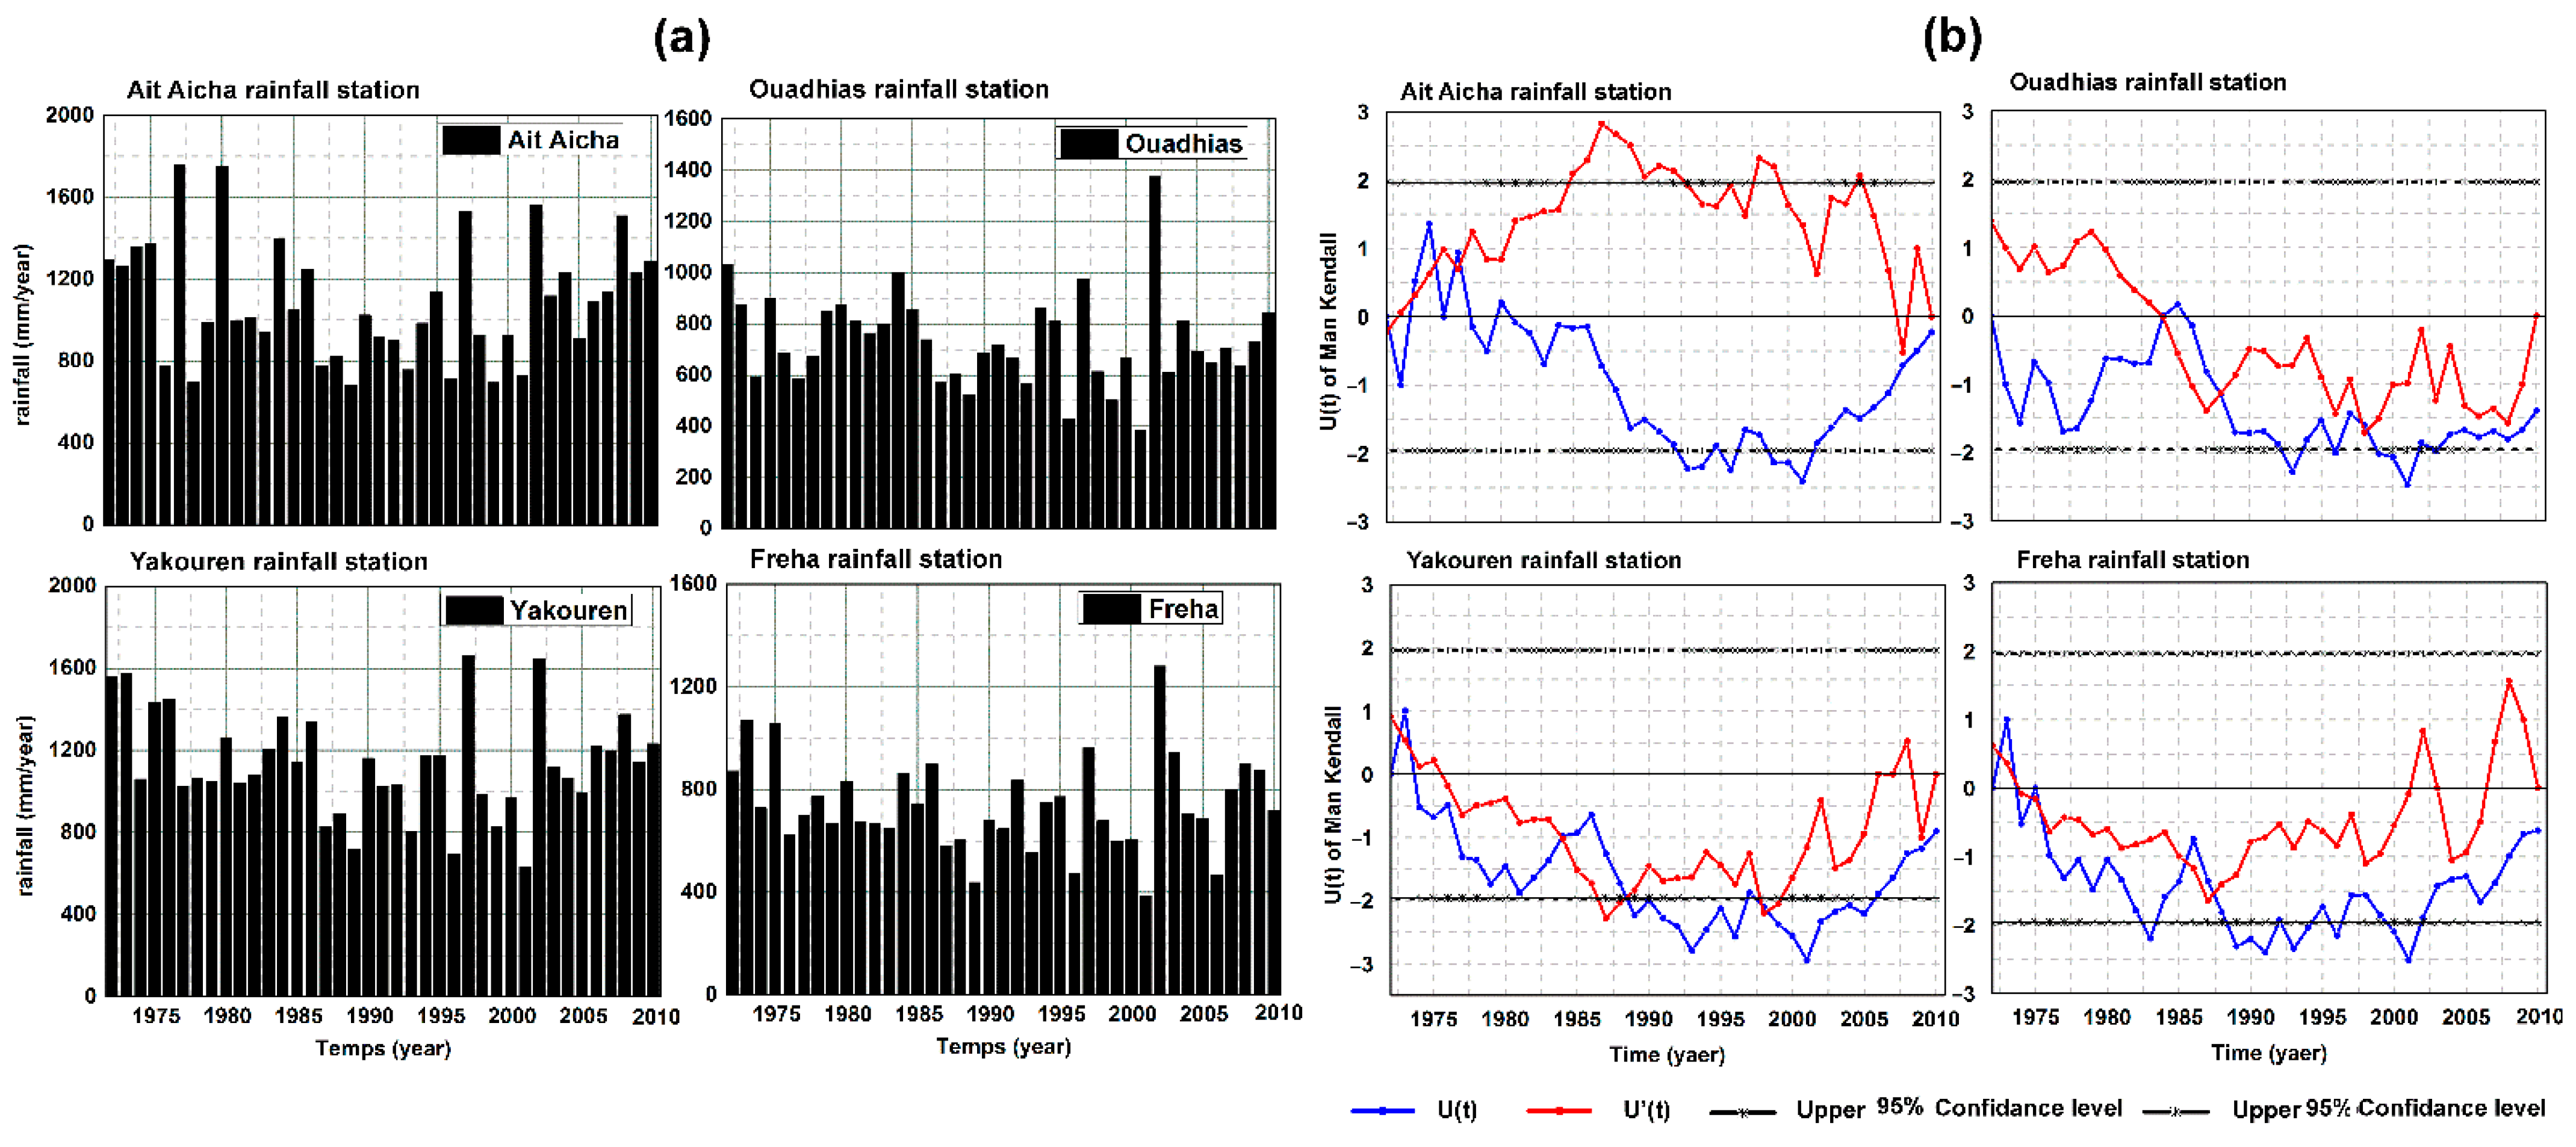
4.1. Overview of the Rainfall Trends

Figure 4a represents some annual rainfall time series of the study area that explain that the rainfall in the Sebaou River basin can reach 1800 mm/year, making it one of the most watered basins in the Mediterranean. The intersection between the progressive and retrograde curves of the sequential Mann-Kendall test (SQMK) (Figure 4b) shows that the first significant negative trend starts in the years 1974 and 1984 until the early 2000s. However, the second non-significant positive trend begins in early 2001. According to Figure 4b, the SQMK test indicates a significant value of U(t) for the 95% confidence interval, approximately equal to −2.5; this tendency was evidenced in all the stations during the year 2001. These climatic trends have been observed in the Mediterranean basin and in northern Algeria, which agree with the presence of negative rainfall trends between the 1980s and 1990s [61,62,63,64,65,66,67].

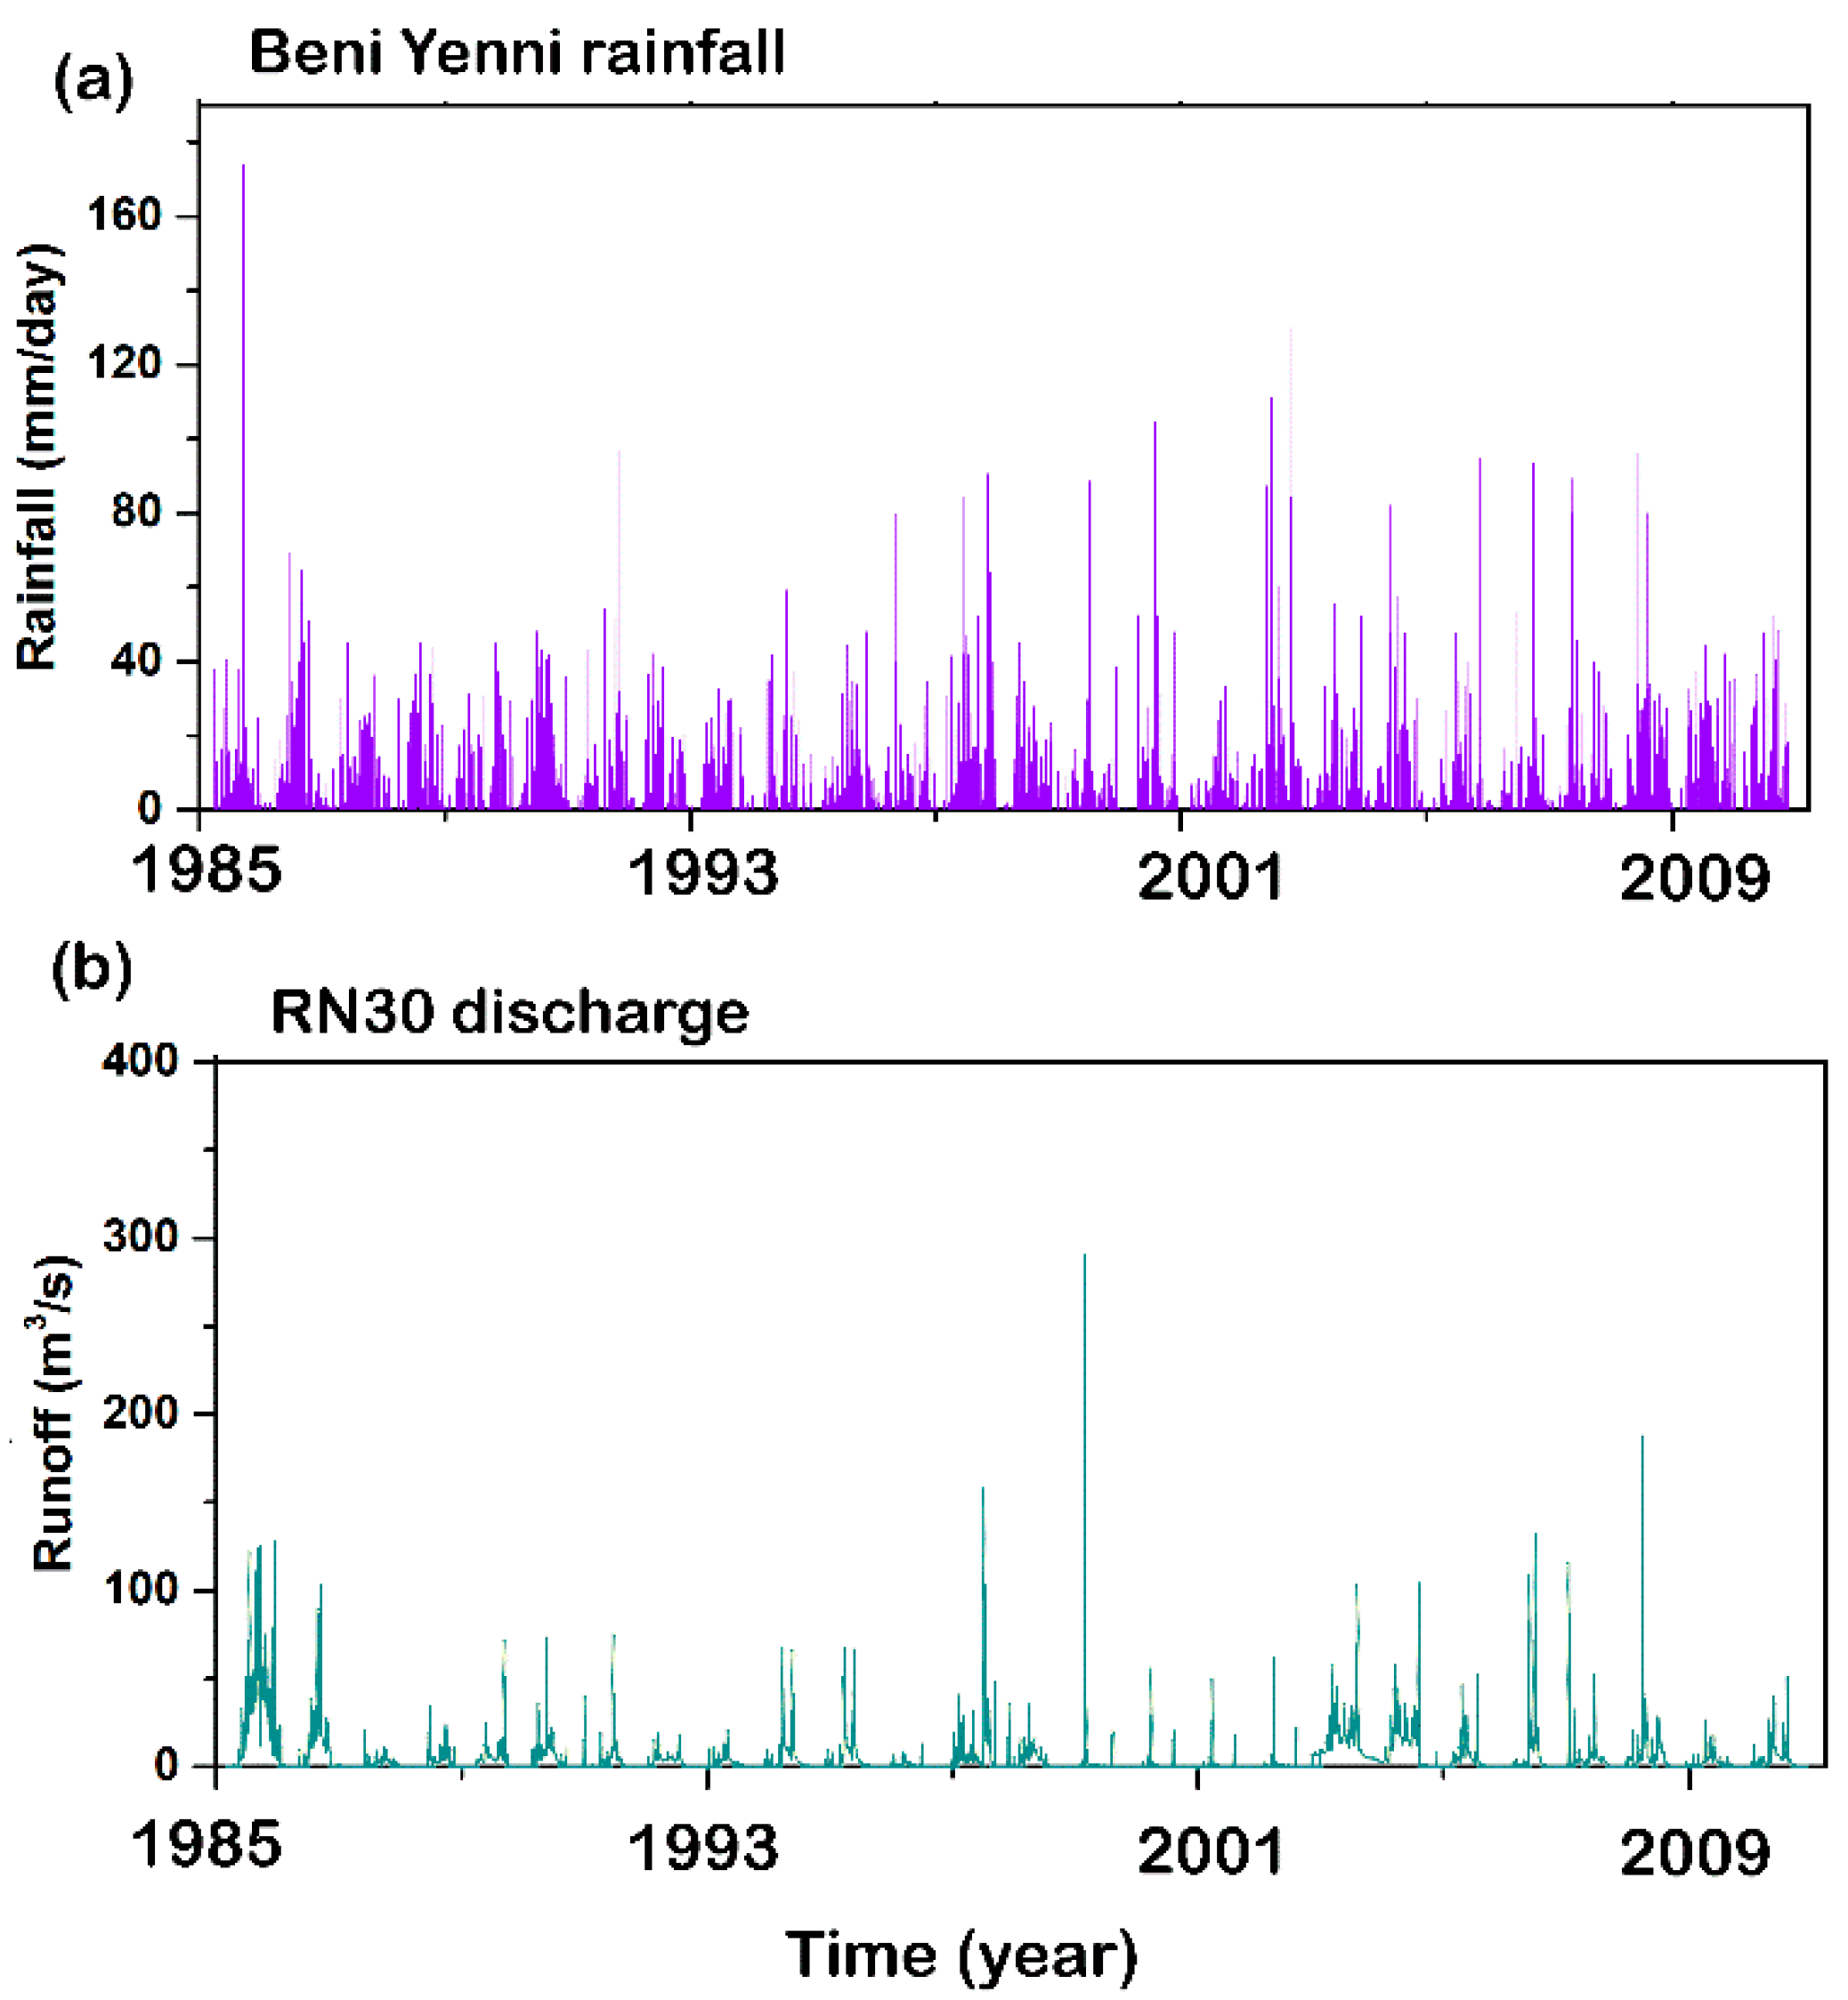
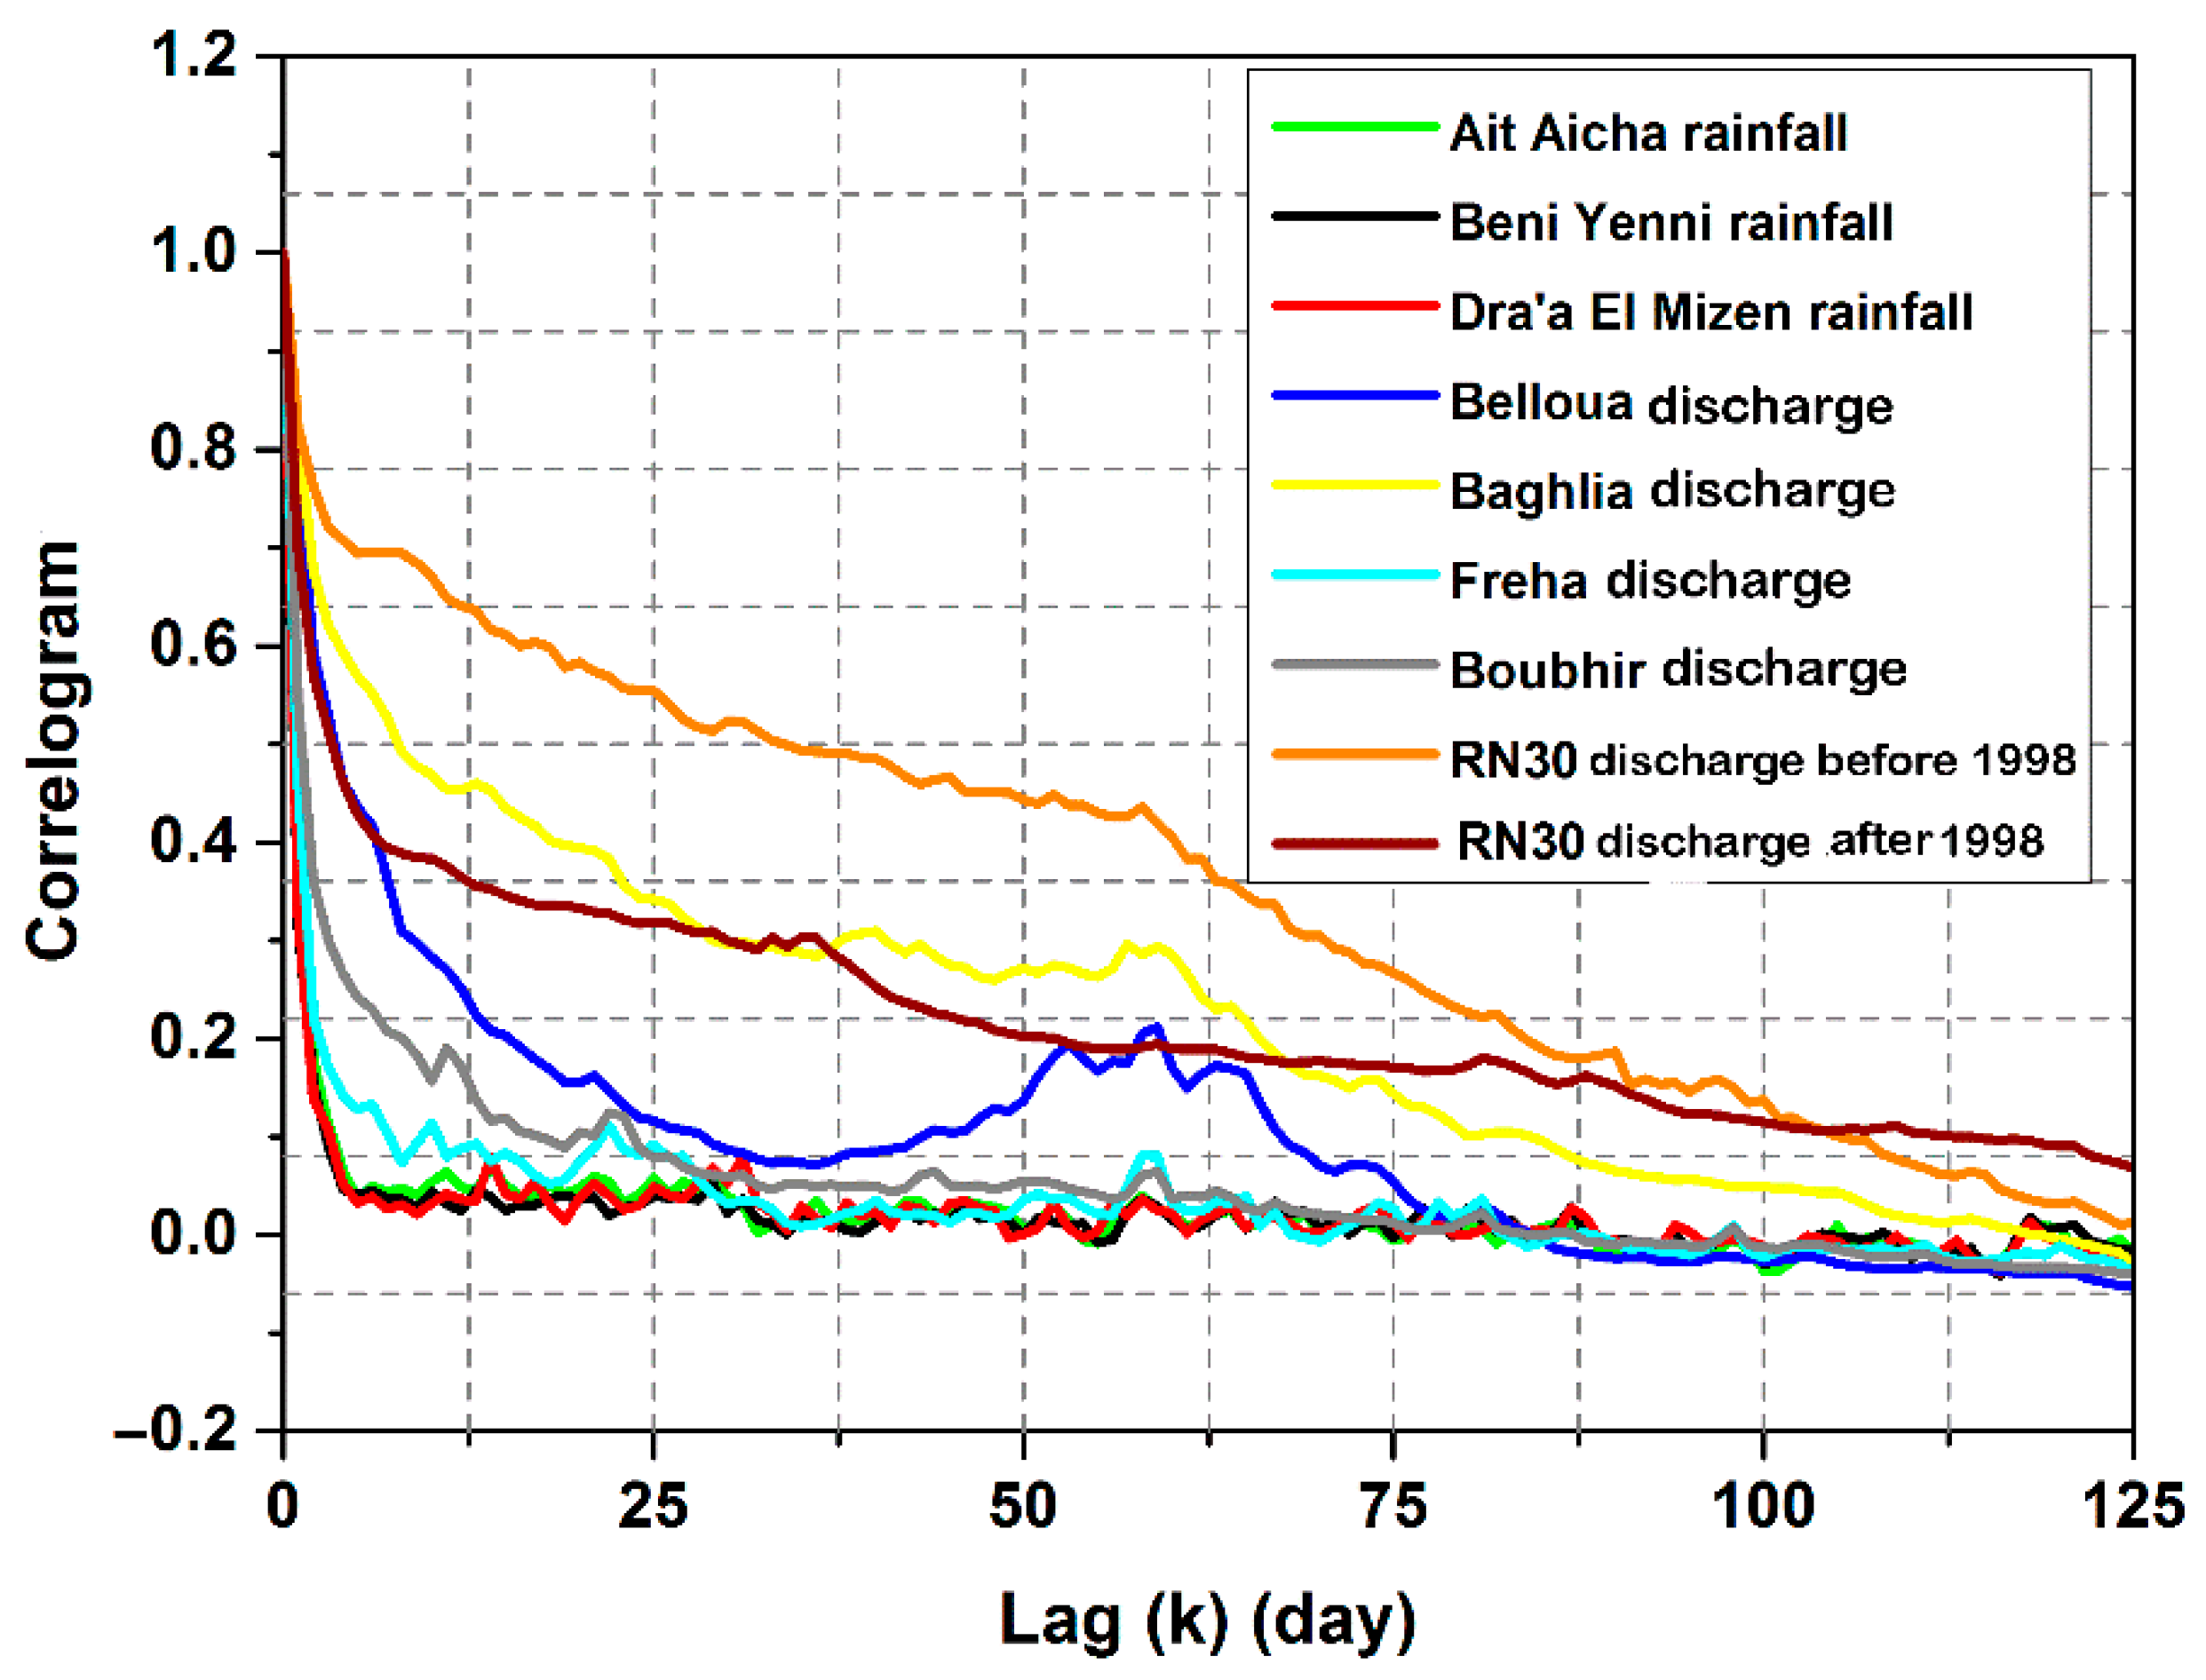
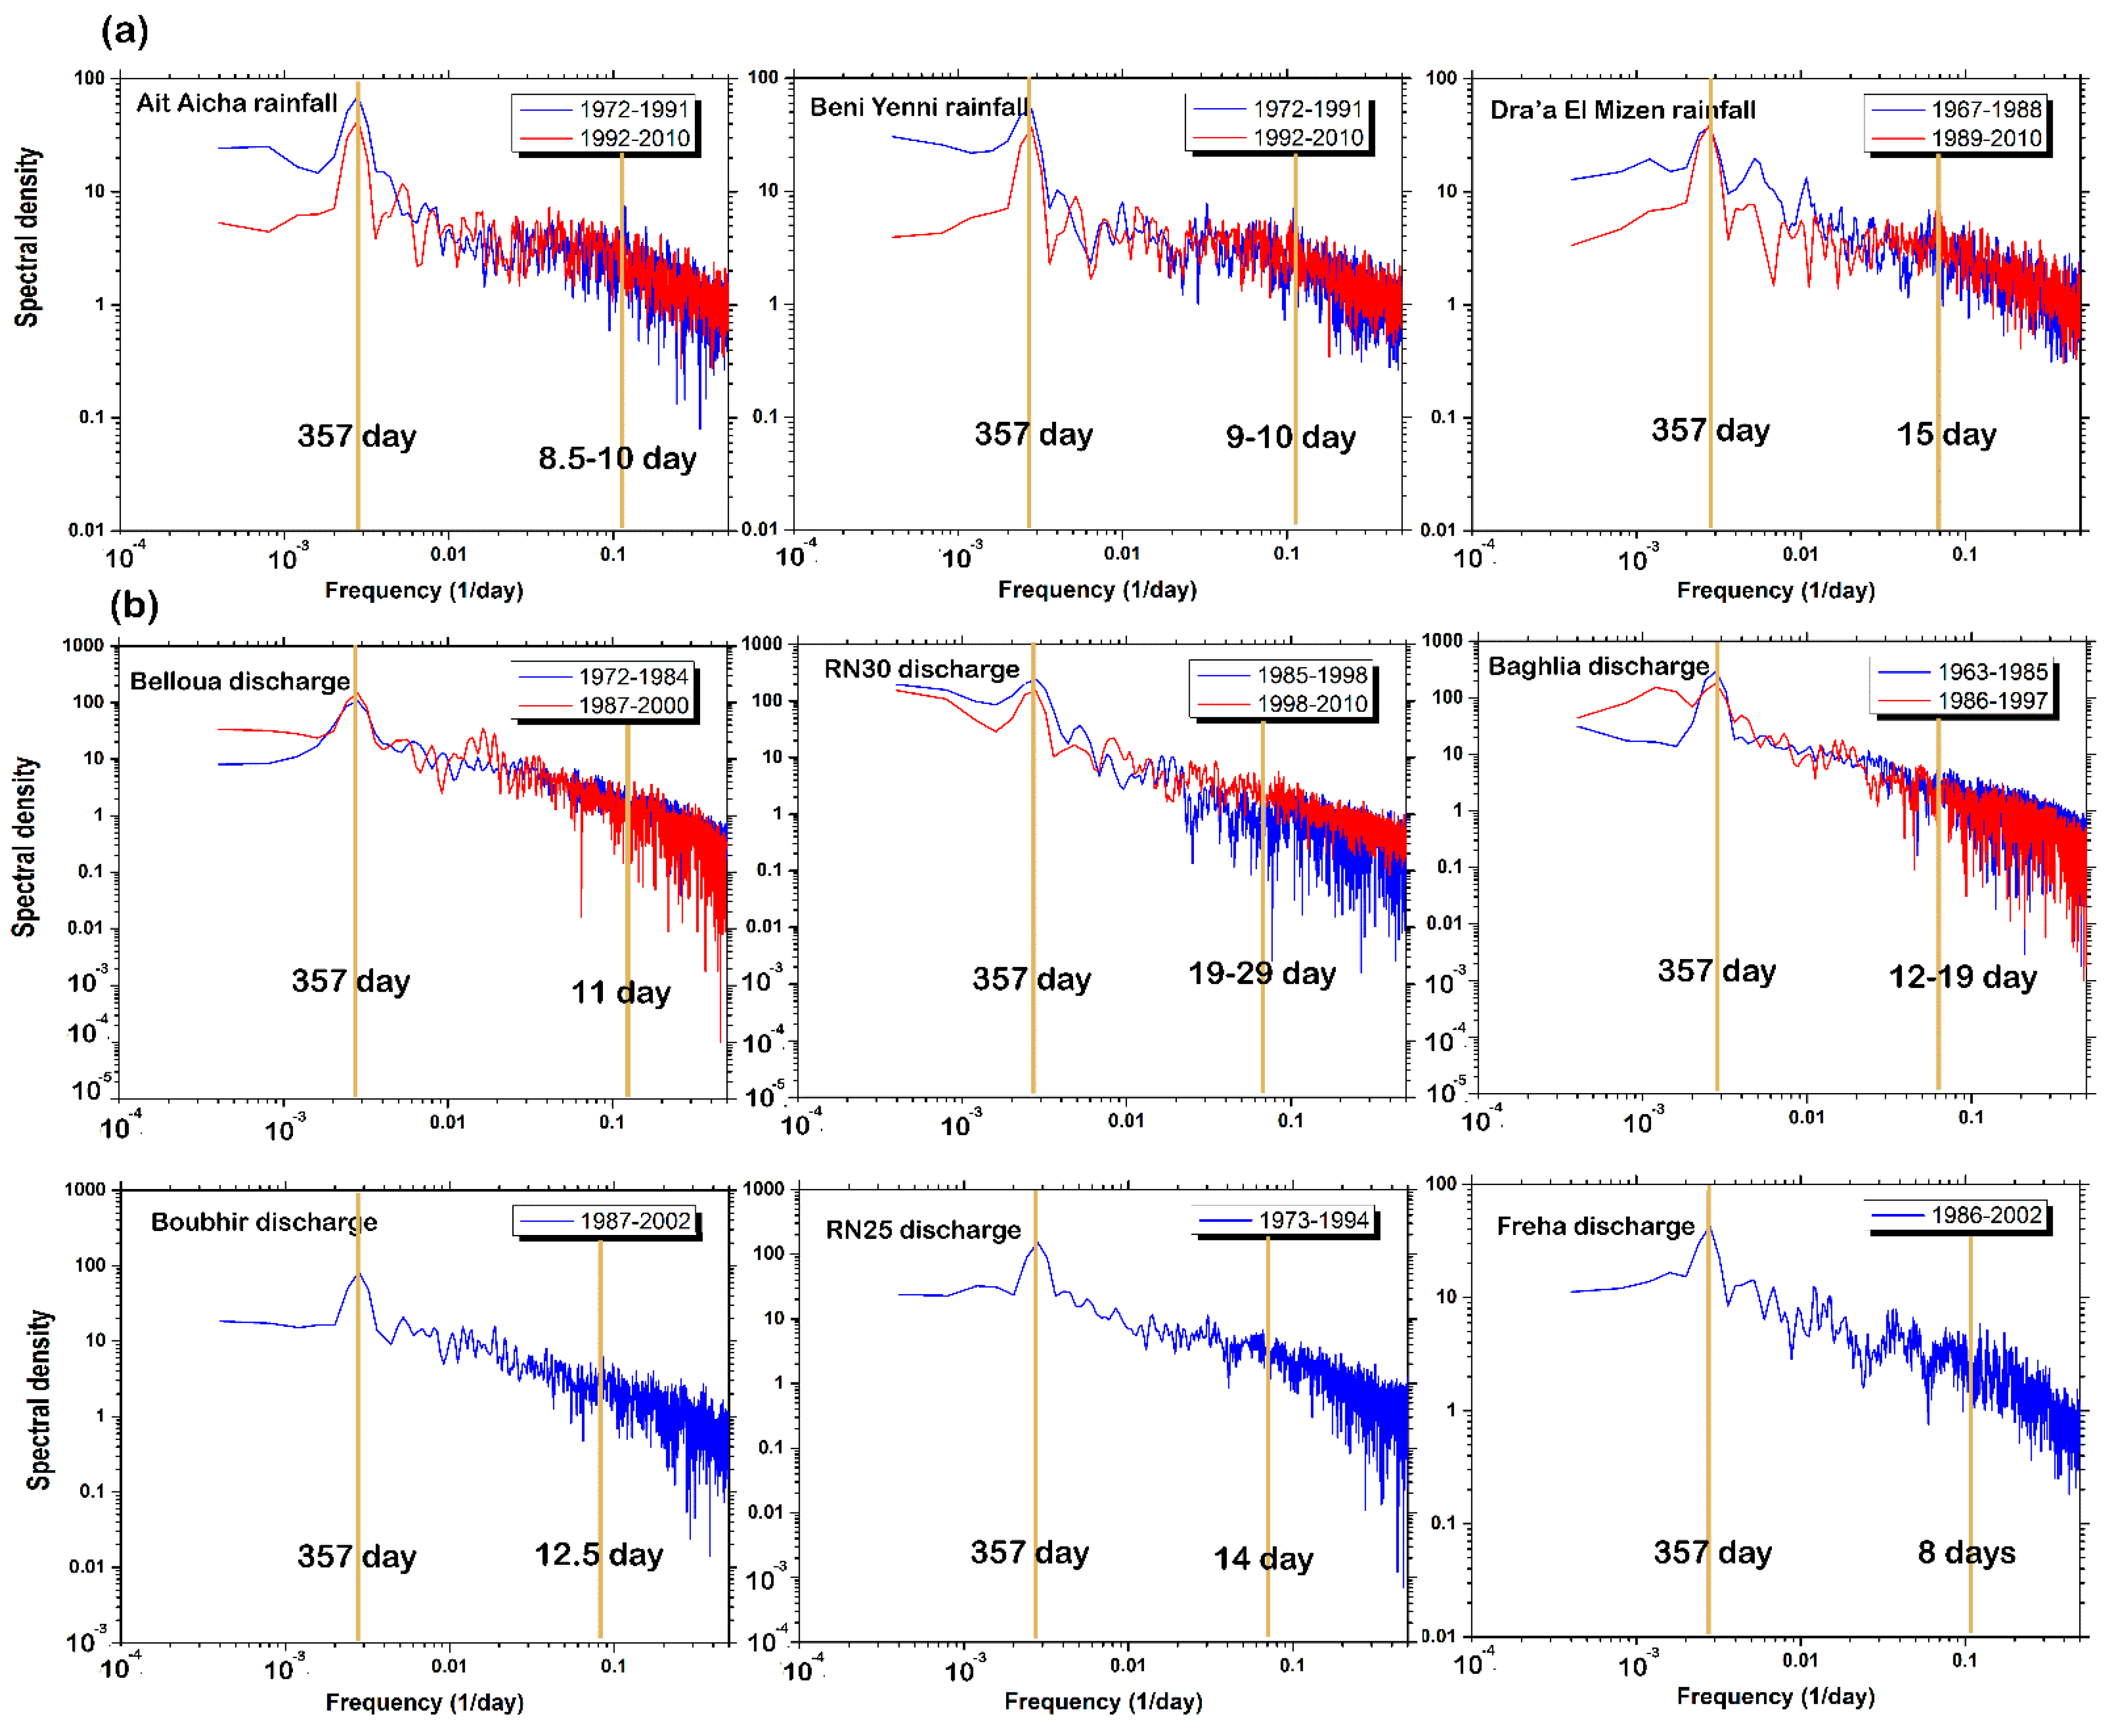
4.2. Univariate Correlation and Spectrum Analysis
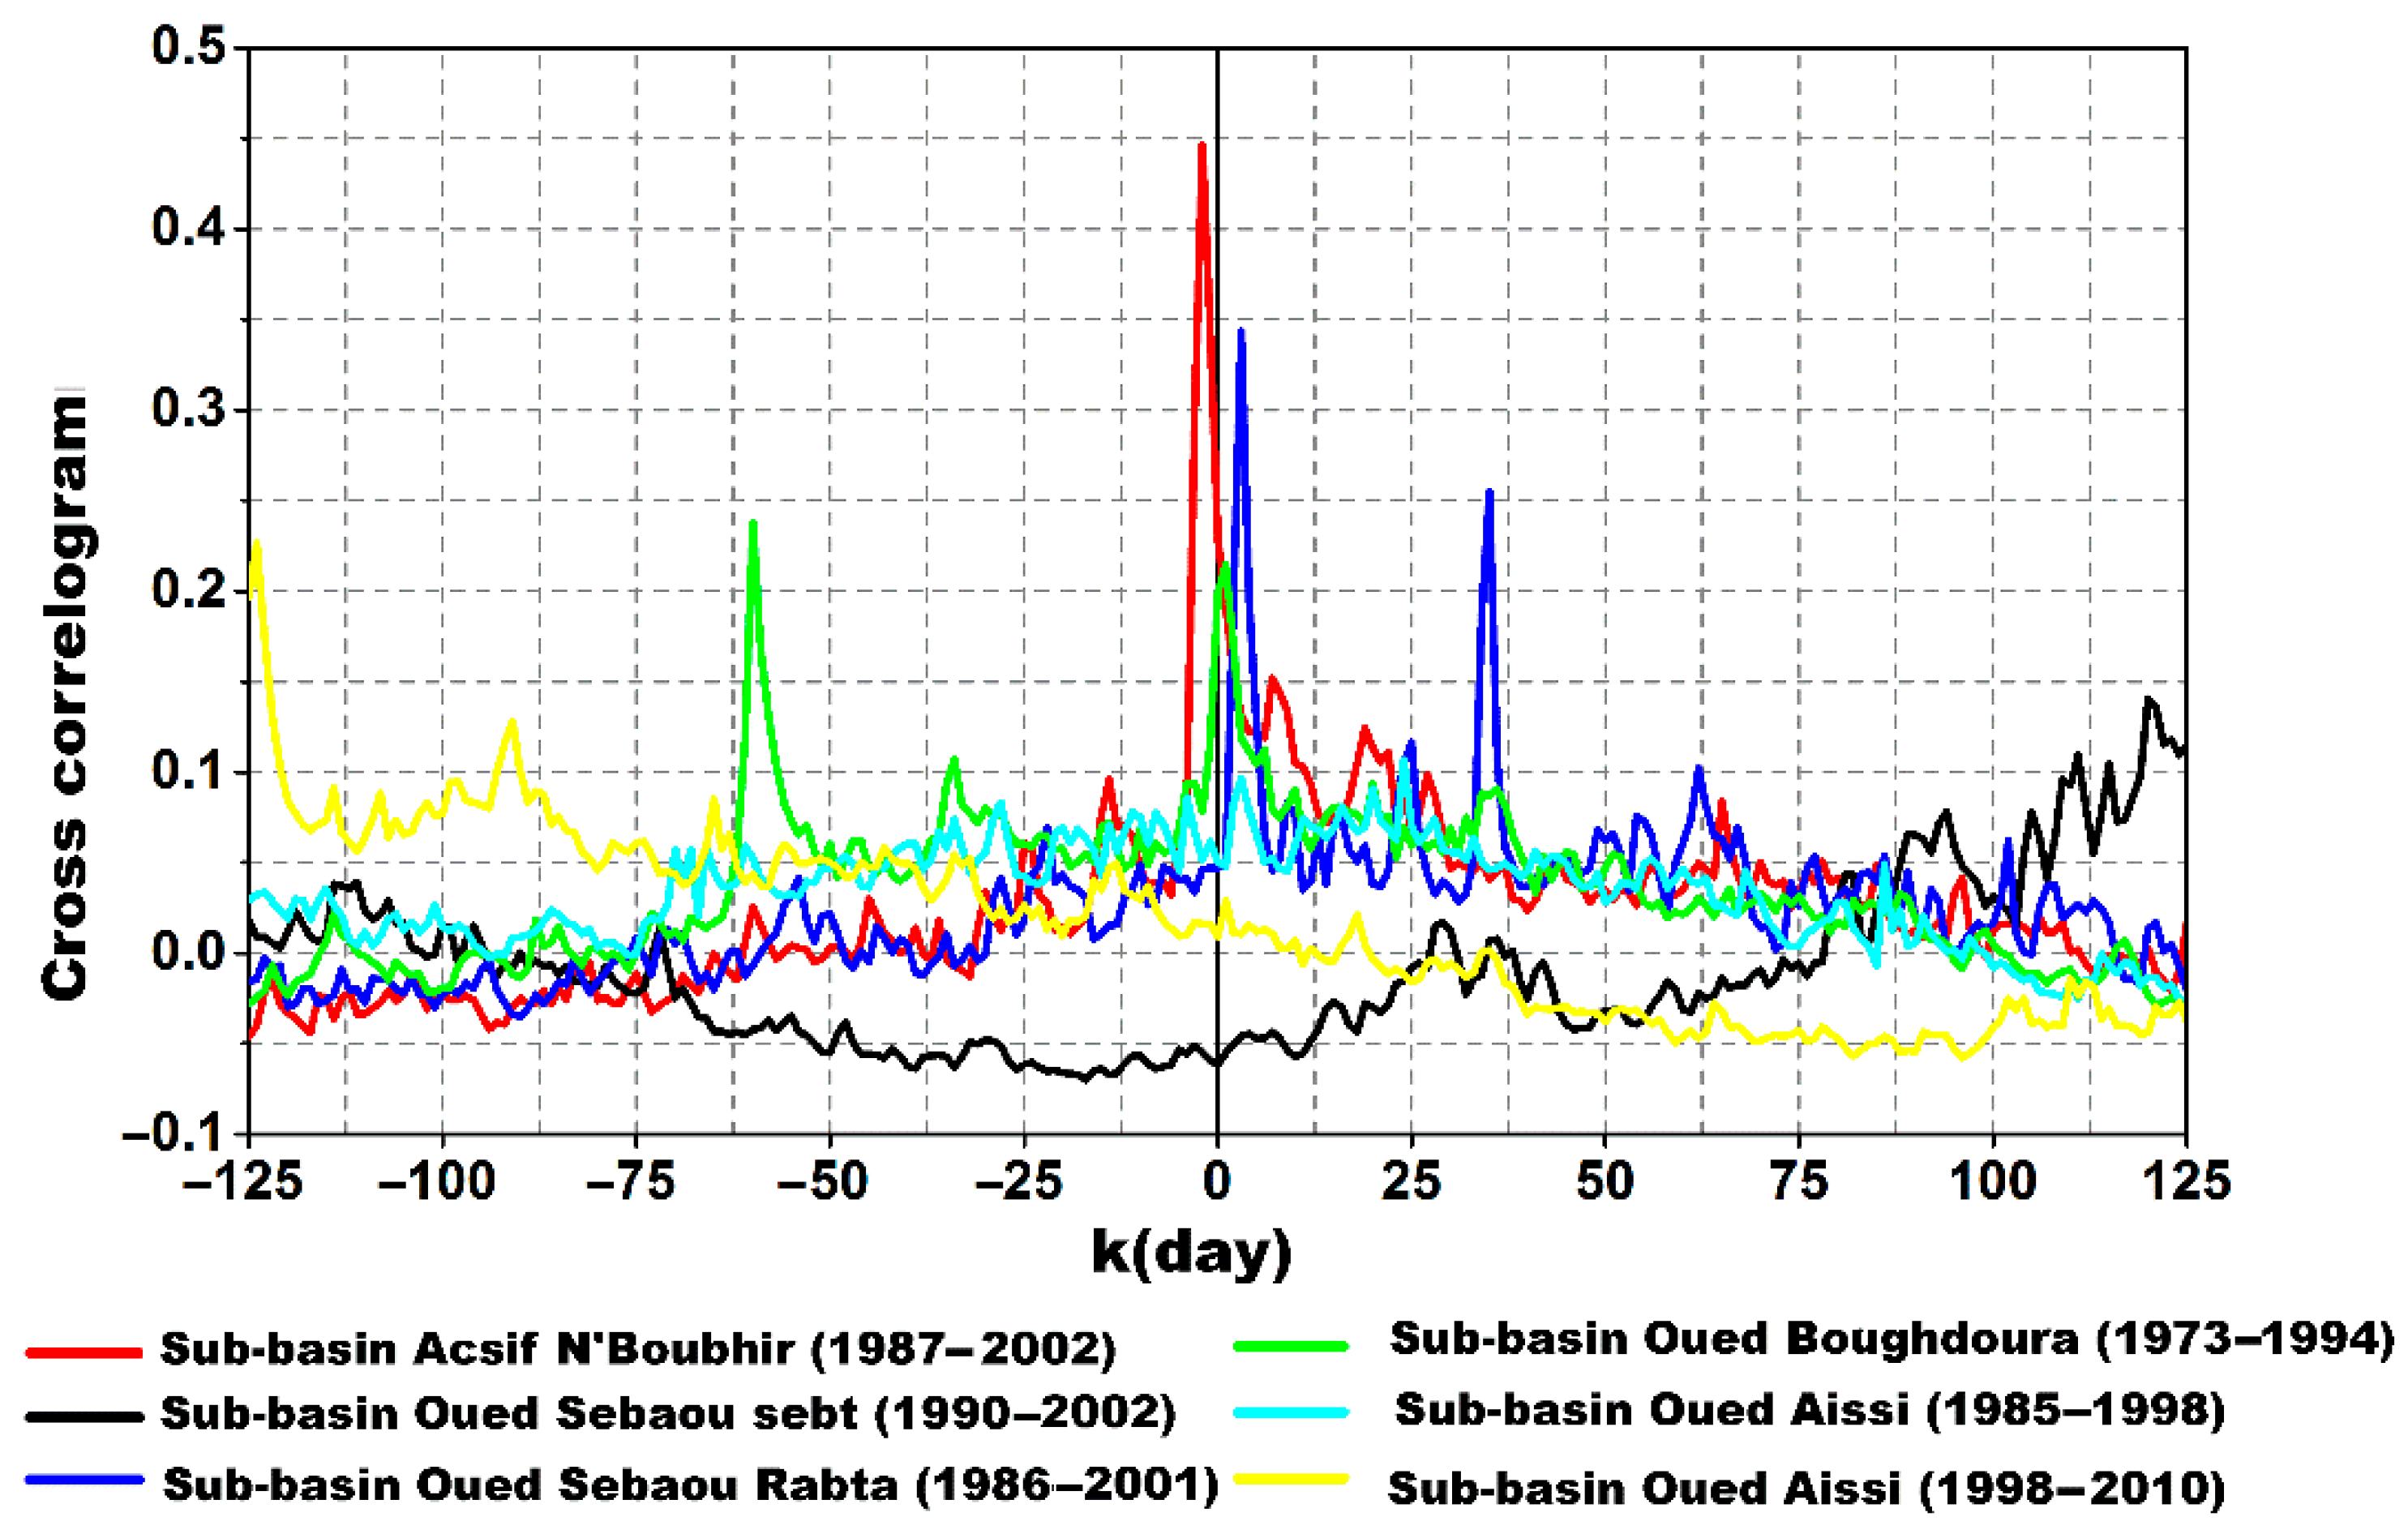
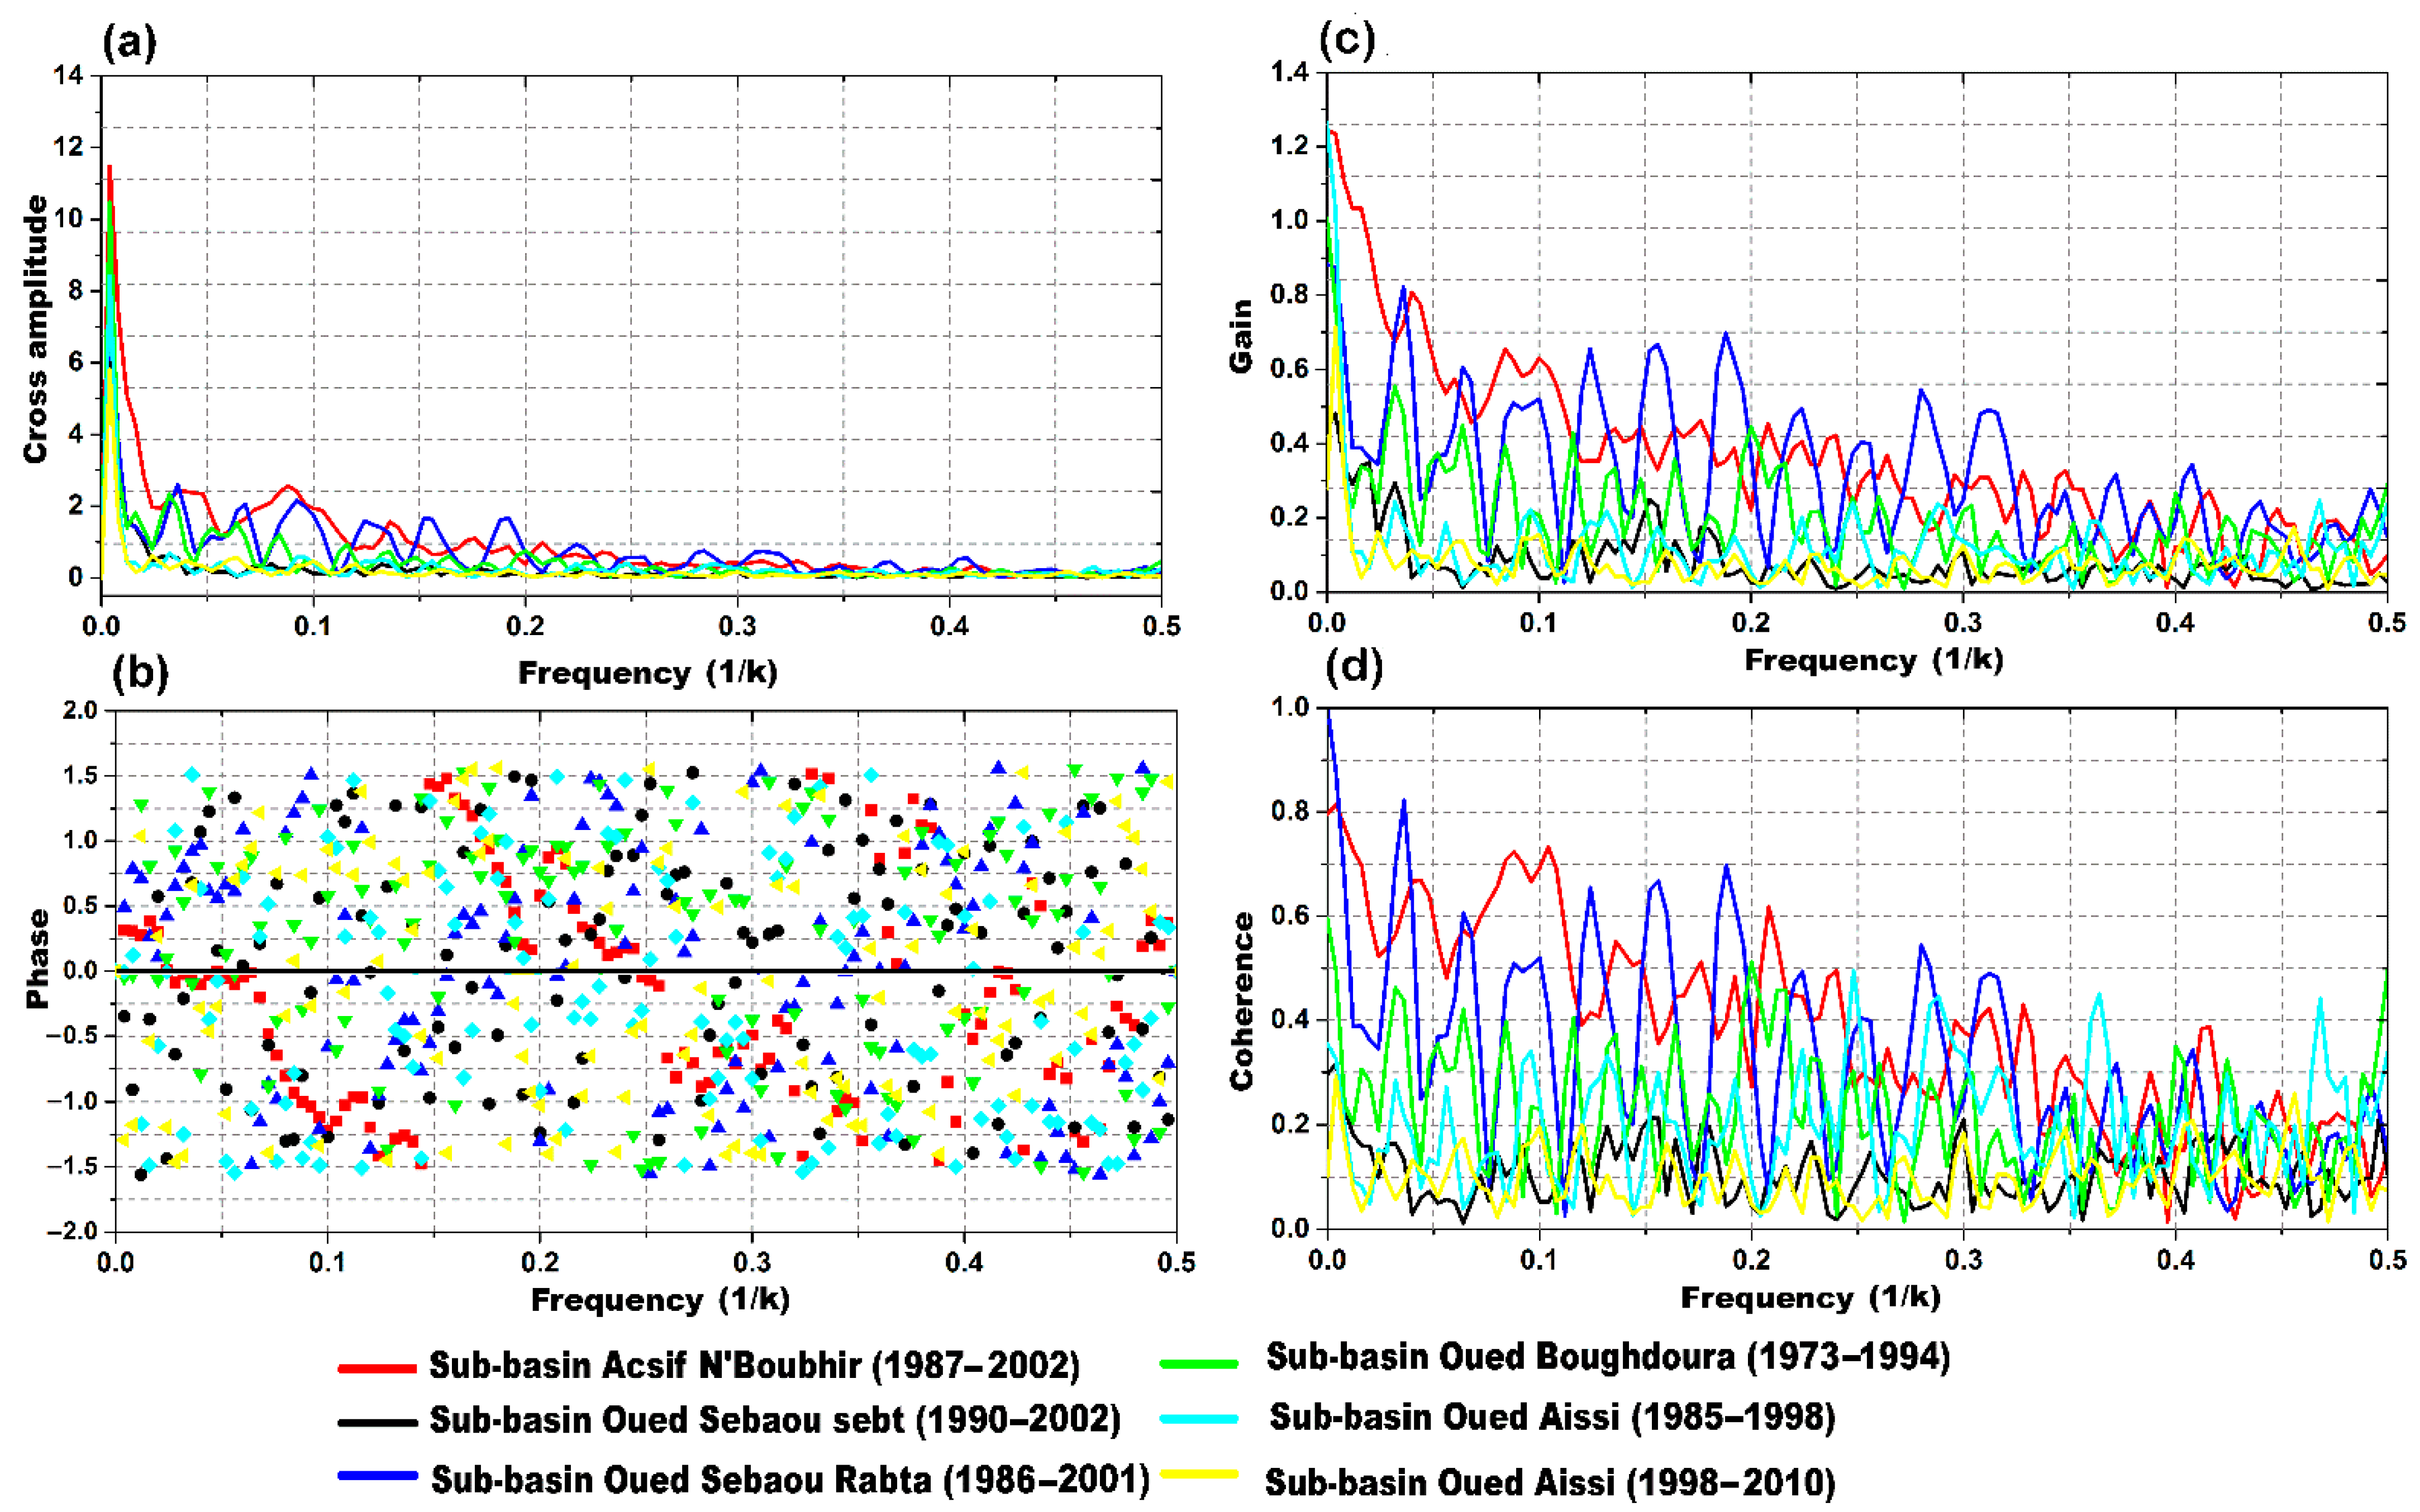
The short-term analysis of rainfall (observation window from 1 to 125 days) is presented in a correlogram, which decreases very rapidly, assuming the value 0.2 at the 3rd day and then becoming zero at 35 days (Figure 5). The rainfall does not have a clear structure and has a quasi-random character in the short-term analysis (<6 months).
The global short-term analysis of daily flow rates shows that the correlograms (Figure 5) decrease rapidly at Boubhir and Freha, a little fast for RN30 before 1999, and slow for Baghlia and RN30 after 1998. This explains why the hydrogeological system of Sebaou River is spatially heterogeneous and complex, or why each sub-basin (karstic system) is characterized by different memory effects each other, according to the time dependence and independence of the events affecting the flows. Table 2 shows a summary classification of karst systems of the Sebaou River basin and some representative Mediterranean karstic system based on the memory effect and the regularization time.
Since the rainfall signal is a random input function, the log-spectrum rises dominating periodic structures to f = 0.0028 (hydrologic cycle every 357 days). The amplitudes of the spectra are homogeneously distributed and are subjected to negative trends at all frequencies (Figure 6).
Hydrological time series are often highly random. In order to study the character of the available hydrological time series, an analysis method frequently used in the study of statistical fractals, corresponding to the log-log representation of the variance density spectra, is applied. This method makes it possible to identify the Gaussian, Brownian, or deterministic character of a data series. The slope β of the log-log density spectrum assumes values between +1 and −1 for fractional Gaussian noise and between −1 and −3 for fractional Brownian motion. A zero slope (β = 0) is characteristic for pure Gaussian noise, and a slope β = −2 is characteristic for the pure Brownian domain. Slopes in the range −2 to −3 are characteristic of the persistent Brownian domain, while slopes in the range −1 to −2 are characteristic of the antipersistent Brownian domain.
The spectral analysis of the daily precipitation time series allows us to observe a linear behavior over the scale range, which extends between one day and 15 days (Figure 6a and Table 3), often encountered in the literature, e.g., [72]. The upper limit of the domain is not very clear. It is always possible to implement, in addition, an automatic detection procedure for linear portions, if the user wishes to make the location of the rupture more objective. The invariance ranges of the analyzed scales are characterized by an exponent of the spectrum less than 1 (−0.002 < β < −1.10).
Short-term noise analysis places the streamflow at Belloua station in the fractional gaussian noise domain with the slope β equal to −0.97 for the 1972–1984 period, and the slope β is strong enough for the high frequencies, corresponding to a fractional Brownian motion, which is −1.40 for the 1987–2000 period (Figure 6b and Table 3). These time series, therefore, represent an unstructured random phenomenon for the first period and typical of a quasi-deterministic phenomenon for the second period.
In general, the log-spectral analysis of the daily streamflow time series allows the classification of the annual spectra into two different groups according to the average slope value β. The results show a composite character with a steep slope β (−1.25 < β < −2.98) for high frequencies, where the series is non-conservative, whereas for low frequencies, the slope is greater than −1 (−0.01 < β < −0.48). For this group, two scales with linear behavior are highlighted, with a clear break in the spectrum around 8.5 to 29 days approximately, which is clearly demonstrated in the rainfall spectra (Figure 6b). Two ranges of scale invariance separated by a break were retained, the first between 1 day and 3 weeks and the second between 3 weeks and 1 year, i.e., two distinct types of variability regimes. In addition, this break is identified as the synoptic maximum, defined as the maximum time scale for which synoptic events persist. According to Rossi et al. (2011) [73], the values of the β spectral exponents provide information about the variability of each signal, depending on the time scale considered: a low rate of β is linked to a high variability in the data, while a high rate of β is related to low variations. According to the results of Tessier et al. (1993) and De Lima and Grasman (1999) [74,75], all obtained values of β were less than 1 and highlighted the conservative character of the rainfall time series, which is very much in agreement with the results of this study. Therefore, the two diverse slopes ß1 and ß2 characterize two categories of variability regimes, respectively related to short- and long-term patterns. The results of the log-log spectral analysis of the available rainfall time series are presented in Table 3.

4.3. Cross Analyses

The system’s response to a rainfall impulse occurs in two modes according to Marsaud (1997) [76]:
-
A transmissive function corresponding to the peak explains a well-developed drainage.
-
A slower decrease explains the capacitive effect.
The cross-correlograms in Figure 7 consist of well-individualized responses for the Acsif N’Boubhir and Sebaou Rabta systems and, less obviously, for the Boughdoura system, which explains the well-developed drainage. At Sebaou Rabta, the 5-day peak represents a rapid flow, and the 36-day peak represents a delayed flow (Figure 7). However, the Aïssi River system does not show an increase in the correlogram, which indicates that the response to rainfall impulses is probably very low, explaining that the system performed a filtering of the rainfall signal. In addition, the human impact and the construction and ordering of the Taksebt dam since 1998 may have influenced the rainfall-runoff relationship (Figure 7).
The cross-amplitude function (Figure 8a) shows that the cause-and-effect relationship is strong for low frequencies (f equal to 0.032, which corresponds to 31 days), especially for the Boughdoura, Sebaou Rabta, and Acsif N’Boubhir systems. From this cutoff frequency of 0.032 day−1, the covariance becomes negligible, with the exception of some frequencies lower than 0.2, which have some characteristic peaks. According to El Hakim (2005) [77], the high covariance indicates that these periods correspond to a good cause-and-effect relationship. The amplitude function shows that the impulse response is valid for low and medium frequencies, especially for the A’N boubhir and Rabta sub-basins. This confirms the low inertia behavior of these systems (Figure 8a).
The lag representative of the rainfall-runoff relationship is calculated for a cutoff frequency (i.e., 0.032 = 32 days) and gives a delay value of about 10 days (Figure 8b). This value is relatively high, which means that the rise in flood duration is a little long and can only be noticed at the outlet after 7 to 10 days.
The gain function, which reflects the way in which the rainfall is put into reserve, shows poor attenuation at high frequencies (Figure 8c). There are attenuations for the three frequency modes of the different systems. This attenuation of rainfall, on the one hand, may correspond to a short-term effect associated with a reserve in flood events, except for some insignificant low frequencies peaks in the Acsif N’Boubhir and Sebaou Rabta systems. This amplification is due to the low filtering of the system.
The coherence function represents an indicator of linearity, which shows highly oscillating values varying between 0.014 and 0.810 with a negative trend of overall average coefficients equal to 0.430. The coherence function (Figure 8d) shows a probably poor linearity of the rainfall-runoff relationship, which is related to the replenishment of reserves during some days of the year.
The streamflow variation depends on the groundwater-rainfall system response and specifies the conductivity of the fractures, which expresses the porosity. This latter contributes to the propagation of rainfall in the form of infiltration in heterogeneous aquifers. This is perfectly evident in the case of flow: sources and rivers, in the case of heavily karstified areas [78].
The Morlet XWT (Figure 9b,c) of daily data of the Sebaou River basin system was calculated to highlight the temporal change of the rainfall-runoff relationship by a common power spectrum, in which the continuous wavelet coefficients of precipitation are multiplied by the other one of the discharges [53]. The results are mapped beforehand into the time-frequency domain.
The XWT spectra (Figure 9b,c) reveal common significant power at 95% confidence interval. The cross spectra do not highlight the seasonal components, except for few insignificant localized events (Figure 9a,b).
The annual scale, which is represented by the 256–512-day band, and the multi-annual scale, which is represented by spectral bands greater than 512 days, indicate a fairly continuous component during the study periods with strong coefficients for all the spectra (Figure 9a–c and Table 4), with the exception of a few marked discontinuities between the 1980s and 1990s, which are related to the dry periods. The amplifications of the annual components are visible, dominant, and more amplified compared to the multi-annual fluctuations, characterizing the 1–3- and 3–6-year modes (Figure 9a–c and Table 4). This can be explained by the multi-annual regulation shown by the CSA. The attenuations of short-term components seem to be linked to the periods of storage (infiltration).
As a first observation on the WCT spectra (Figure 9d–f), we can notice a decrease in the correlation surfaces (less important dark red color) compared to the XWT spectra. Thus, the wavelet coherence transform really indicates the degree of dependence between the input-output systems.
At small scales (32–128 day), dispersed structures are marked due to successive passages of floods particularly visible in the system of Acsif N’Boubhir and Sebaou Rabta rivers. At an annual scale (256–512 day), the most significant consistency between rainfall and streamflow is clearly evident during the study period, with a transition to the multiannual modes at 512–1024-day band (Acsif N’Boubhir and Sebaou Rabta rivers) (Figure 9d–f), but sometimes there is intermittence. The interruption in the annual component at Aïssi River between the 1999–2002 period (Figure 9d–f and Table 4) was previously explicated by the construction and ordering of the Taksebt Dam (Figure 9c,d). According to Chinarro et al. (2012) [53], high coherence values explain the linear response of the system during wet periods, whereas the response to the rainfall event is not linear when the period is dry. Therefore, it can be concluded that two main modes are the wet mode with linear behavior that corresponds to the annual process, while the dry mode with non-linear behavior corresponds to successive drought events and anthropological activities, which affect the annual flow and regulatory reserves. According to Hadjou (2008) [79] and the report of the department of Water Resources of Tizi Ouzou, the boreholes in the downstream part of the Aïssi bridge are currently only producing a quarter of their initial capacity.
This drop in water production is due to the lack of water resources after the dam was filled. The piezometric level statement for the year 2001 show that the water table of the Aïssi River is drying up, leaving only a meter of wet alluvium in place. Khelifa et al. (2021) [80] also observe this in the Seybouse River (Algeria), where further water is exploited and used for agriculture using advanced water pump technology. This decrease in water amount and uninterrupted industrial toxic discharges decrease water quality and inflict damage on the aqua-fauna system. In the Medjerda River (Algero-Tunisian basin), Kadir et al. (2020) [81] observed overexploited groundwater with intensive water extraction for agriculture during the 2000−2012 period (0.004 Mm3/year).
From the XWT and WCT spectra, the evolution of some components was isolated and analyzed using the theory of the cross wavelet and wavelet coherence [82], i.e., the isolated cross wavelet spectrum components (Figure 10a), the real squared part (Figure 10b), and the phase components (Figure 10c) of the wavelet coherence function. For high frequency processes, 2- and 4-week components were chosen. However, the 26- and 52-week components were chosen for the medium-term and the 102-week component was selected as the long-term components (Figure 10a–c). Very poor consistencies were observed for the 2–4-week components, since the real part of the consistency is very low, which agreed with the phase that is diverse from zero. This indicates that the rainfall-runoff relationship was not linear (Figure 10a–c), except for some characteristic peaks. Between the 26-week seasonal and the 52-week annual components, there are some highly consistent values just for the Sebaou Rabta and Sebaou Maritime river system, but the phase is always non-zero. This also supports the rainfall-runoff nonlinearity relationship (Figure 10a–c). There is a strong low frequency coherence of the 102-week component, as the coherence is somewhat strong in the real part, while the phase oscillates close to zero for some time interval. This approves the pseudo-linearity of the rainfall-runoff relationship for this component, in particular for the Sebaou Maritime River (outlet) and the Boughdoura River (Figure 10a–c). According to Chettih and Mesbah (2010) [82], the highest magnitudes of coherence are related to successive events of floods and rainfalls; this shows how quickly the systems respond. During wet periods, a “good” match is observed, while during dry periods no match is evidenced.
The phenomenon of looting the rocks and sands of the valleys of Sebaou River exists, as the looting of sand is a source of profit for thousands of families and sand barons, who take advantage of the nocturnal conditions and the lack of inspection on some places of the valleys to proceed with these illegal mining activities. These activities have succeeded in draining large amounts of sand, especially at the level of the Bouqandora Valley, threatening to cause a serious disaster in agricultural land adjacent to those valleys, as well as in eastern regions such as Ait Issa Maimon and Aknoun, which are still suffering from the emergence crises in shallow drinking waters [83].
The water reserves of this valley, which extend from the municipality of Tadmaet (Tizi Ouzou) and flow into the Mediterranean Sea in the region of Benchod (Boumerdes) for a length of 20 km, are threatened by pollution due to their mixing with the seawater. An unusual percentage of salinity appeared in the chemical elements in water, which are chlorine, calcium, and bicarbonate. The increase in water salinity is due to the low water level of the valley and the theft of sand, especially during the years of low rainfall, as well as the excessive exploitation of wells for agriculture and the construction of dams, which contributed significantly to the aggravation of this problem. According to the Algérie Presse Service [84], there was a 30% decrease in agricultural production in the region due to the contamination of water wells used for irrigation by seawater.
Large violations of the riverbed by some careers and excavators turned up the riverbed and extracted large amounts of sand and rock, despite pronouncements by the control authority to prevent these crimes to natural resources (Figure 11). According to Akanwa (2021) [85], the sands extracted from the river banks and riverbeds are the most desired sands for construction purposes due to their capability to bond to concrete. All over the world, many researchers have been dedicated and widely debated the problems of human effects on streamflow and rivers. It was concluded by [86] that sand mining in the Progo River (Indonesia) provides employment opportunities for the population of the area, which creates a good economic level, but the impact of sand mining on the stability of the riverbed is witnessing a deteriorating trend of −0.43 m/year. In the lower Gangetic Plain in India, the impact of human intervention on downstream channel behavior was evaluated using Landsat images and GIS, and an intensive field survey was carried out to analyze the river cross-section, indicating a modification in the morphological characteristics due to human-nature interface, which induced the upliftment of the riverbed by continuous siltation as well [87]. In the Yellow River basin, it was found that anthropological activities contributed about 80% to the decrease in runoff, while the other 20% was attributed to rainfall [88]. In the Yangtze River, significant changes have been observed since the 1950s in the runoff and sediment discharge dynamics, which has attracted great social attention. In addition, it was found that the anthropological activity impact on sediment discharge was greater than the runoff from 1953 to 2010 [89]. In southwestern China at the dammed Lancang River, impacts of the climate variability and anthropological activities on the flow regime were assessed by Han et al. (2019) [15]. The analysis showed that the construction of the reservoir was the anthropological activity that most severely affected the streamflow, reducing the streamflow during the rainy season.

5. Conclusions

The Sebaou River basin is experiencing significant demographic and socioeconomic development. Groundwater in this basin is one of the major resources for this growing population, as it supports agricultural and industrial activities and ensures the supply of drinking water. However, it is worth highlighting that the ground and surface waters are currently overexploited. In this study, several time-scale-based methods were used to assess and understand the karst spring discharge response for better planning of these water resources.
The CSA revealed that the hydrogeological systems in the study area are characterized by various memory effects, which can be classified as small, poor, reduced, and extensive, with regularization time ranging between 5 and 50 days. The results indicate that the aquifer systems of the Sebaou River basin have a very complex hydrodynamic behavior.
Amplifications of the annual components are visible, dominant, and more amplified compared to the multi-annual fluctuations and characterized by the 1–3- and 3–6-year modes. This can be explained by the multi-annual regulation shown by the CSA. Attenuations of short-term components (i.e., 2–5-, 26-, and 52-week) seem to be linked to periods of storage (infiltration) with two main modes; i.e., wet mode with linear behavior corresponding to the annual process and dry mode with non-linear behavior corresponding to successive drought events in the 1980s and 1990s and anthropological activities, which affected the annual flow and regulatory reserves.
The impacts of human activities on the streamflow due to the looting of rocks and sands from the valleys of the Sebaou River reached alarming levels, which requires urgent intervention to protect water and ecological resources and their better rational use. Therefore, in-depth field studies in the lower course of the river must be initiated and urgent interventions and practical short- and medium-term strategies must be proposed, which include high monitoring of water flows. In addition, the publication of serious statements and the imposition of heavy financial fines to curb the activities of thieves of sand, gravel, and rocks of the river, especially where invasive aquatic species have reached a catastrophic situation, requiring the intervention of specialists in the field in order to revive aquatic ecosystems. Coordinated actions between land use planning, agriculture, energy, and industry managers are essential to present a better solution and achieve the sustainable development of water and other natural resources at a basin scale.
Finally, the main strength of this study is the use of wavelet-based techniques to provide additional information in a time-scale domain, which allows us to understand and make appropriate decisions of the behavior of the hydrogeological system for better water storage and supply. However, it is worth noting that the main weakness of this study was the use of short time series, which prevented us from dividing them into sub-series to detect the change in behavior and some characteristics of the studied time series, especially because the wavelet approach gives good results on stationary and non-stationary phenomena when applied to long time series.

Author Contributions

B.Z., M.C. and M.A. conceived the framework of this research, processed data, designed the experiments, plots, and map preparation, validated the processing results, and wrote the manuscript. Z.A., A.E., C.A.G.S. and E.E.H. gave feedback on the written manuscript and helped to analyze and edit the manuscript for proper English language, grammar, punctuation, spelling, and technical improvements. All authors have read and agreed to the published version of the manuscript.

Funding

This research was funded by Taif University Researchers Supporting Project, Taif University, Taif, Saudi Arabia. Grant number TURSP-2020/196.

Institutional Review Board Statement

Not applicable.

Informed Consent Statement

Not applicable.

Data Availability Statement

The data that support the findings of this study are available from the corresponding author, [BZ], upon reasonable request.

Acknowledgments

Authors would like to acknowledge the financial support provided from Taif University Researchers Supporting Project Number (TURSP-2020/196). The authors gratefully thank the Directorate General for Scientific Research and Technological Development and the National Agency of Water Resources (ANRH) of Algeria who gave us the needed data to realize this research. This and all my works are dedicated to the memory of my beloved wonderful mom and darling sister. May they forever remain in my heart.

Conflicts of Interest

The authors declare no conflict of interest.

References

  1. Denić-Jukić, V.; Lozić, A.; Jukić, D. An application of correlation and spectral analysis in hydrological study of neighboring karst springs. Water 2020, 12, 3570. [Google Scholar] [CrossRef]
  2. Sun, S.; Li, L.; Wang, J.; Shi, S.; Song, S.; Fang, Z.; Ba, X.; Jin, H. Karst development mechanism and characteristics based on comprehensive exploration along Jinan Metro, China. Sustainability 2018, 10, 3383. [Google Scholar] [CrossRef] [Green Version]
  3. Liu, K.; Sun, W.; Wang, S.; Sun, Y. Study on the characteristics of karst development in Beijing. Carbonates Evaporites 2020, 35, 54. [Google Scholar] [CrossRef]
  4. Adji, T.N.; Haryono, E.; Fatchurohman, H.; Oktama, R. Diffuse flow characteristics and their relation to hydrochemistry conditions in the Petoyan Spring, Gunungsewu Karst, Java, Indonesia. Geosci. J. 2016, 20, 381–390. [Google Scholar] [CrossRef]
  5. Larson, E.B.; Mylroie, J.E. Diffuse versus conduit flow in coastal karst aquifers: The consequences of Island area and perimeter relationships. Geosciences 2018, 8, 268. [Google Scholar] [CrossRef] [Green Version]
  6. Medici, G.; West, L.J. Groundwater flow velocities in karst aquifers; importance of spatial observation scale and hydraulic testing for contaminant transport prediction. Environ. Sci. Pollut. Res. 2021, 28, 43050–43063. [Google Scholar] [CrossRef] [PubMed]
  7. Goeppert, N.; Goldscheider, N. Improved understanding of particle transport in karst groundwater using natural sediments as tracers. Water Res. 2019, 166, 115045. [Google Scholar] [CrossRef]
  8. Jamal, M.S.; Awotunde, A.A. Darcy’s model with optimized permeability distribution for the simulation of Stokes flow and contaminant transport in karst aquifers. Hydrogeol. J. 2020, 28, 1249–1267. [Google Scholar] [CrossRef]
  9. Marinović, V.; Stevanović, Z. Karst groundwater quantity assessment and sustainability: The approach appropriate for river basin management plans. Environ. Earth Sci. 2019, 78, 1–10. [Google Scholar] [CrossRef]
  10. Stevanović, Z. Karst waters in potable water supply: A global scale overview. Environ. Earth Sci. 2019, 78, 1–12. [Google Scholar] [CrossRef]
  11. Stevanović, Z.; Marinović, V.; Krstajić, J. CC-PESTO: A novel GIS-based method for assessing the vulnerability of karst groundwater resources to the effects of climate change. Hydrogeol. J. 2021, 29, 159–178. [Google Scholar] [CrossRef]
  12. Valle, S.L.; Castillo, J.L.E.; Alberich, M.V.E.; Albores, M.A.G.; Tavares, J.P.; Esquivel, J.M. Delineation of protection zones for springs in fractured volcanic media considering land use and climate change scenarios in central Mexico region. Environ. Earth Sci. 2021, 80, 662. [Google Scholar] [CrossRef]
  13. Lee, J.M.; Koh, D.-C.; Chae, G.-T.; Kee, W.-S.; Ko, K.-S. Integrated assessment of major element geochemistry and geological setting of traditional natural mineral water sources in South Korea at the national scale. J. Hydrol. 2021, 598, 126249. [Google Scholar] [CrossRef]
  14. Cheng, J.; Xu, L.; Fan, H.; Jiang, J. Changes in the flow regimes associated with climate change and human activities in the Yangtze River. River Res. Appl. 2019, 35, 1415–1427. [Google Scholar] [CrossRef]
  15. Han, Z.; Long, D.; Fang, Y.; Hou, A.; Hong, Y. Impacts of climate change and human activities on the flow regime of the dammed Lancang River in Southwest China. J. Hydrol. 2019, 570, 96–105. [Google Scholar] [CrossRef]
  16. Mittal, N.; Bhave, A.G.; Mishra, A.; Singh, R. Impact of human intervention and climate change on natural flow regime. Water Resour. Manag. 2016, 30, 685–699. [Google Scholar] [CrossRef] [Green Version]
  17. Yang, Y.; Yang, Z.; Yin, X.A.; Liu, Q. A framework for assessing flow regime alterations resulting from the effects of climate change and human disturbance. Hydrol. Sci. J. 2018, 63, 441–456. [Google Scholar] [CrossRef]
  18. Meng, P.; Ren, Z.; Shi, B.; Jia, T. Quantifying the impact of climate variability and human activities on the streamflow of the Qingzhang River. IOP Conf. Ser. Earth Environ. Sci. 2020, 446, 032100. [Google Scholar] [CrossRef]
  19. Saidi, H.; Dresti, C.; Manca, D.; Ciampittiello, M. Quantifying impacts of climate variability and human activities on the streamflow of an Alpine river. Environ. Earth Sci. 2018, 77, 690. [Google Scholar] [CrossRef]
  20. Zhao, G.; Tian, P.; Mu, X.; Jiao, J.; Wang, F.; Gao, P. Quantifying the impact of climate variability and human activities on streamflow in the middle reaches of the Yellow River basin, China. J. Hydrol. 2014, 519, 387–398. [Google Scholar] [CrossRef]
  21. Zerouali, B.; Mesbah, M.; Chettih, M.; Djemai, M.; Abda, Z. Hydrogeological System of Sebaou River Watershed (Northern Central Algeria): An Assessment of Rainfall-Runoff Relationship. In Advances in Sustainable and Environmental Hydrology, Hydro-628 geology, Hydrochemistry and Water Resources; Springer: Cham, Switzerland, 2019; pp. 29–31. [Google Scholar] [CrossRef]
  22. Liu, D.; Guo, S.; Chen, X.; Shao, Q. Analyse des tendances des précipitations annuelles et saisonnières de 1956 à 2000 dans la province du Guangdong, en Chine. Hydrol. Sci. J. 2012, 57, 358–369. [Google Scholar] [CrossRef] [Green Version]
  23. Fleming, S.W.; Lavenue, A.M.; Aly, A.H.; Adams, A. Practical applications of spectral analysis of hydrologic time series. Hydrol. Process. 2002, 16, 565–574. [Google Scholar] [CrossRef]
  24. Jukić, D.; Denić-Jukić, V. Investigating relationships between rainfall and karst-spring discharge by higher-order partial correlation functions. J. Hydrol. 2015, 530, 24–36. [Google Scholar] [CrossRef]
  25. Jenkins, G.M.; Watts, D.G. Spectral Analysis and its Application; Holden-Day: San Francisco, CA, USA, 1968; 525p. [Google Scholar]
  26. Box, G.E.; Jenkins, G.M. Time Series Analysis: Forecasting and Control, Revised ed.; Holden-Day: San Francisco, CA, USA, 1976. [Google Scholar]
  27. Mangin, A. Pour une meilleure connaissance des systèmes hydrologiques à partir des analyses corrélatoire et spectrale. J. Hydrol. 1984, 67, 25–43. [Google Scholar] [CrossRef]
  28. Paiva, I.; Cunha, L. Characterization of the hydrodynamic functioning of the Degracias-Sicó Karst Aquifer, Portugal. Hydrogeol. J. 2020, 28, 2613–2629. [Google Scholar] [CrossRef]
  29. Panagopoulos, G.; Lambrakis, N. The contribution of time series analysis to the study of the hydrodynamic characteristics of the karst systems: Application on two typical karst aquifers of Greece (Trifilia, Almyros Crete). J. Hydrol. 2006, 329, 368–376. [Google Scholar] [CrossRef]
  30. Massei, N.; Dupont, J.; Mahler, B.; Laignel, B.; Fournier, M.; Valdes, D.; Ogier, S. Investigating transport properties and turbidity dynamics of a karst aquifer using correlation, spectral, and wavelet analyses. J. Hydrol. 2006, 329, 244–257. [Google Scholar] [CrossRef]
  31. Bailly-Comte, V.; Martin, J.B.; Jourde, H.; Screaton, E.J.; Pistre, S.; Langston, A. Water exchange and pressure transfer between conduits and matrix and their influence on hydrodynamics of two karst aquifers with sinking streams. J. Hydrol. 2010, 386, 55–66. [Google Scholar] [CrossRef]
  32. Chiaudani, A.; Di Curzio, D.; Palmucci, W.; Pasculli, A.; Polemio, M.; Rusi, S. Statistical and fractal approaches on long time-series to surface-water/groundwater relationship assessment: A central Italy alluvial plain case study. Water 2017, 9, 850. [Google Scholar] [CrossRef] [Green Version]
  33. Delbart, C.; Valdes, D.; Barbecot, F.; Tognelli, A.; Richon, P.; Couchoux, L. Temporal variability of karst aquifer response time established by the sliding-windows cross-correlation method. J. Hydrol. 2014, 511, 580–588. [Google Scholar] [CrossRef]
  34. Gill, L.; Naughton, O.; Johnston, P.; Basu, B.; Ghosh, B. Characterisation of hydrogeological connections in a lowland karst network using time series analysis of water levels in ephemeral groundwater-fed lakes (turloughs). J. Hydrol. 2013, 499, 289–302. [Google Scholar] [CrossRef]
  35. Mayaud, C.; Wagner, T.; Benischke, R.; Birk, S. Single event time series analysis in a binary karst catchment evaluated using a groundwater model (Lurbach system, Austria). J. Hydrol. 2014, 511, 628–639. [Google Scholar] [CrossRef] [Green Version]
  36. Tam, V.T.; de Smedt, F.; Batelaan, O.; Dassargues, A. Characterization of a cavern conduit system in Vietnam by time series correlation, cross-spectrum and wavelet analyses. Hydrol. Sci. J. 2004, 49, 900. [Google Scholar] [CrossRef]
  37. Mateescu, M.; Haidu, I. La méthode des ondelettes comme outil de test d’homogénéité le cas des précipitations a Cluj, Roumanie. In Proceedings of the XXème Colloque de l’Association Internationale de Climatologie, Actes du Colloque, Cluj, Romania, 8 September 2007; pp. 369–374. [Google Scholar]
  38. Torrence, C.; Compo, G.P. A Practical Guide to Wavelet Analysis. Bull. Am. Meteor. Soc. 1998, 79, 61–78. [Google Scholar] [CrossRef] [Green Version]
  39. Mateescu, M.; Haidu, I. Comparaison entre la variabilité de la NAO et du SOI selon l’approche des ondelettes. In Proceedings of the XIXe Colloque de l’Association Internationale de Climatologie, Actes du Colloque, Cluj, Romania, 6–9 September 2006; pp. 421–426. [Google Scholar]
  40. Khedimallah, A.; Meddi, M.; Mahé, G. Characterization of the interannual variability of precipitation and runoff in the Cheliff and Medjerda basins (Algeria). J. Earth Syst. Sci. 2020, 129, 134. [Google Scholar] [CrossRef]
  41. Fiorillo, F.; Leone, G.; Pagnozzi, M.; Esposito, L. Long-term trends in karst spring discharge and relation to climate factors and changes. Hydrogeol. J. 2021, 29, 347–377. [Google Scholar] [CrossRef]
  42. Zerouali, B.; Mesbah, M.; Chettih, M.; Djemai, M. Contribution of cross time-frequency analysis in assessment of possible relationships between large-scale climatic fluctuations and rainfall of northern central Algeria. Arab. J. Geosci. 2018, 11, 392. [Google Scholar] [CrossRef]
  43. Rezaei, A.; Saatsaz, M. Large-scale climate indices teleconnections with hydrochemical and isotopic characteristics of a karst spring using wavelet analysis. Environ. Earth Sci. 2021, 80, 335. [Google Scholar] [CrossRef]
  44. Resende, T.C.; Longuevergne, L.; Gurdak, J.J.; Leblanc, M.; Favreau, G.; Ansems, N.; Van Der Gun, J.; Gaye, C.B.; Aureli, A. Assessment of the impacts of climate variability on total water storage across Africa: Implications for groundwater resources management. Hydrogeol. J. 2019, 27, 493–512. [Google Scholar] [CrossRef] [Green Version]
  45. Garamhegyi, T.; Kovács, J.; Pongrácz, R.; Tanos, P.; Hatvani, I.G. Investigation of the climate-driven periodicity of shallow groundwater level fluctuations in a Central-Eastern European agricultural region. Hydrogeol. J. 2018, 26, 677–688. [Google Scholar] [CrossRef] [Green Version]
  46. Meng, Q.; Xing, L.; Liu, L.; Xing, X.; Zhao, Z.; Zhang, F.; Li, C. Time-lag characteristics of the response of karst springs to precipitation in the northern China. Environ. Earth Sci. 2021, 80, 1–13. [Google Scholar] [CrossRef]
  47. Zerouali, B.; Chettih, M.; Abda, Z.; Mesbah, M.; Santos, C.A.G.; Neto, R.M.B.; da Silva, R.M. Spatiotemporal meteorological drought assessment in a humid Mediterranean region: Case study of the Oued Sebaou basin (northern central Algeria). Nat. Hazards 2021, 108, 689–709. [Google Scholar] [CrossRef]
  48. Persits, F.M.; Ahlbrandt, T.S.; Tuttle, M.L.; Charpentier, R.R.; Brownfield, M.E.; Takahashi, K.I. Maps Showing Geology, Oil and Gas Fields and Geological Provinces of Africa: U.S. Geological Survey Open-File Report 97-470-A. 1997. Available online: https://pubs.er.usgs.gov/publication/ofr97470A (accessed on 16 October 2021).
  49. Flandrin, J. La Chaine du Djurdjura. In Proceedings of the XIXe Congr. Géol. Intern Monogr. Région, Alger, Algeria, September 1952. 43p. [Google Scholar]
  50. Mohammed, D. Bilan Physico-Chimique des Eaux de la Vallée de l’Ouest Sébaou et son Environnement Immédiat: Impact de l’Urbanisation, l’Agriculture et l’Industrie sur la Qualité des Eaux en Grande Kabylie. Ph.D. Thesis, Université Mouloud Maameri de Tizi Ouzou, Tizi Ouzou, Algeria, 2008. [Google Scholar]
  51. Ould, S.; Abdallah, A. Application des Modèles Hydrologiques GR2M et GR4J Sur le Bassin Versant du Sebaou. Master’s Thesis, Ecole National Polytechnique d’Alger, El Harrach, Algerie, 2013. [Google Scholar]
  52. Larocque, M.; Mangin, A.; Razack, M.; Banton, O. Contribution of correlation and spectral analyses to the regional study of a large karst aquifer (Charente, France). J. Hydrol. 1998, 205, 217–231. [Google Scholar] [CrossRef]
  53. Chinarro, D.; Villarroel, J.; Cuchí, J. Wavelet analysis of fuenmayor karst spring, San Julián de Banzo, Huesca, Spain. Environ. Earth Sci. 2012, 65, 2231–2243. [Google Scholar] [CrossRef]
  54. Amraoui, F.; Razack, M.; Bouchaou, L. Comportement d’une source karstique soumise à une sécheresse prolongée: La source Bittit (Maroc). Comptes Rendus Geosci. 2004, 336, 1099–1109. [Google Scholar] [CrossRef]
  55. Padilla, A.; Pulido-Bosch, A. Study of hydrographs of karstic aquifers by means of correlation and cross-spectral analysis. J. Hydrol. 1995, 168, 73–89. [Google Scholar] [CrossRef]
  56. Li, J.; Pu, J.; Zhang, T.; Wang, S.; Huo, W.; Yuan, D. Investigation of transport properties and characteristics of a large karst aquifer system in southern China using correlation, spectral, and wavelet analyses. Environ. Earth Sci. 2021, 80, 1–17. [Google Scholar] [CrossRef]
  57. Delbart, C. Variabilité Spatio-Temporelle du Fonctionnement d’un Aquifère Karstique du Dogger: Suivis Hydrodynamiques et Géochimiques Multifréquences; Traitement du Signal des Réponses Physiques et Géochimiques. Ph.D. Thesis, Université Paris Sud-Paris XI, Paris, France, 2013. [Google Scholar]
  58. Torrence, C.; Webster, P.J. The annual cycle of persistence in the El Niño/Southern Oscillation. Q. J. R. Meteorol. Soc. 1998, 124, 1985–2004. [Google Scholar] [CrossRef]
  59. Grinsted, A.; Moore, J.; Jevrejeva, S. Application of the Cross Wavelet Transform and Wavelet Coherence to Geophysical Time Series. Nonlinear Proc. Geoph. 2004, 11, 561–566. [Google Scholar] [CrossRef]
  60. Charles, C. Introduction aux Applications des Ondelettes. Notes De Stat. Et D’informatique. Note Technique, Unité de Statistique, Informatique et Mathématiques Appliquées (SIMa). 2011. Available online: https://orbi.uliege.be/bitstream/2268/87189/1/Intro_ond2_v2.pdf (accessed on 16 October 2021).
  61. Zerouali, B.; Al-Ansari, N.; Chettih, M.; Mohamed, M.; Abda, Z.; Santos, C.; Zerouali, B.; Elbeltagi, A. An Enhanced Innovative Triangular Trend Analysis of Rainfall Based on a Spectral Approach. Water 2021, 13, 727. [Google Scholar] [CrossRef]
  62. Bouabdelli, S.; Meddi, M.; Zeroual, A.; Alkama, R. Hydrological drought risk recurrence under climate change in the karst area of Northwestern Algeria. J. Water Clim. Chang. 2020, 11, jwc2020207. [Google Scholar] [CrossRef]
  63. Mrad, D.; Dairi, S.; Boukhari, S.; Djebbar, Y. Applied multivariate analysis on annual rainfall in the northeast of Algeria. J. Water Clim. Chang. 2020, 11, 1165–1176. [Google Scholar] [CrossRef]
  64. Jemai, H.; Ellouze, M.; Abida, H.; Laignel, B. Spatial and temporal variability of rainfall: Case of Bizerte-Ichkeul Basin (Northern Tunisia). Arab. J. Geosci. 2018, 11, 177. [Google Scholar] [CrossRef]
  65. Caloiero, T.; Veltri, S.; Caloiero, P.; Frustaci, F. Drought analysis in Europe and in the Mediterranean basin using the standardized precipitation index. Water 2018, 10, 1043. [Google Scholar] [CrossRef] [Green Version]
  66. da Silva, R.M.; Santos, C.A.G.; Moreira, M.; Corte-Real, J.; Silva, V.C.L.; Medeiros, I.C. Rainfall and river flow trends using Mann-Kendall and Sen’s slope estimator statistical tests in the Cobres River basin. Nat. Hazards 2015, 77, 1205–1221. [Google Scholar] [CrossRef]
  67. Gocic, M.; Trajkovic, S. Spatiotemporal characteristics of drought in Serbia. J. Hydrol. 2014, 510, 110–123. [Google Scholar] [CrossRef]
  68. Bouchaou, L. Fonctionnement des Aquifères Atlasiques et Leur Relation avec les Aquifères de la Plaine: Cas de l’Atlas de Beni Mellal et de la Plaine de Tadla (Maroc). Ph.D. Thesis, University of Agadir, Agadir, Morocco, 1995. [Google Scholar]
  69. Larocque, M.; Mangin, A.; Razack, M.; Banton, O. Caractérisation du karst de La Rochefoucauld (Charente, France) à l’aide des Analyses Corrélatoire et Spectrale; Sciences & Techniques de l’Environnement, Université de Franche-Comté, Mémoire Horssérie: Besançon, France, 1997; pp. 283–286. [Google Scholar]
  70. Mohamed, C.; Mohamed, M. Utilisation des Analyses Corrélatoire et Spectrale Pour Inférer Sur La Structure et Le Comportement Hydrodynamique des Aquifères de l’Atlas Saharien. Bull. Serv. Géol. l’Algérie 2006, 17, 145–159. [Google Scholar]
  71. Bouanani, A. Hydrologie, Transport solide et Modélisation: Etude de Quelques sous bassins de la Tafna (NW-Algérie). Ph.D. Thesis, Université Abou Bekr Belkaid Tlemcen, Tlemcen, Algeria, 2004. [Google Scholar]
  72. de Lima, M.I.P. Multifractals and the Temporal Structure of Rainfall. Ph.D. Thesis, Agricultural University Wageningen, Wageningen, The Netherlands, 1998. [Google Scholar]
  73. Rossi, A.; Massei, N.; Laignel, B. A synthesis of the time-scale variability of commonly used climate indices using continuous wavelet transform. Glob. Planet. Chang. 2011, 78, 1–13. [Google Scholar] [CrossRef]
  74. Tessier, Y.; Lovejoy, S.; Schertzer, D. Universal multifractal: Theory and observations for rain and clouds. J. Appl. Meteorol. 1993, 32, 223–250. [Google Scholar] [CrossRef]
  75. de Lima, M.I.P.; Grasman, J. Multifractal analysis of 15-min and daily rainfall from a semi-arid region in Portugal. J. Hydrol. 1999, 220, 1–11. [Google Scholar] [CrossRef]
  76. Marsaud, B. Structure et Fonctionnement de la Zone Noyée des Karsts a Partir des Résultats Expérimentaux. Ph.D. Thesis, Université Paris XI, Orsay, France, 1997. [Google Scholar]
  77. El Hakim, M. Les Aquifères Karstiques de l’Anti-Liban et du Nord de la Plaine de la Bekaa: Caractéristiques, Fonctionnement, Evolution tt Modélisation, d’après L’exemple du Système Karstique Anjar-Chamsine (Liban). Ph.D. Thesis, Université des Sciences et Techniques de Montpellier 2, Montpellier, France, 2005. [Google Scholar]
  78. Miao, J.; Liu, G.; Cao, B.; Hao, Y.; Chen, J.; Yeh, T.J. Identification of strong karst groundwater runoff belt by cross wavelet transform. Water Resour. Manag. 2014, 28, 2903–2916. [Google Scholar] [CrossRef]
  79. Hadjou, F. Étude Hydrogéologique par Modélisation Mathématique en vue d’une Approche Rationnelle et Optimale de la Gestion des eaux Souterraines de la vallée de l’oued Sebaou. Master’s Thesis, Sciences de la Terre, Université des Sciences et de la Technologie Houari Boumediene, Bab Ezzouar, Algeria, 2008. [Google Scholar]
  80. Khelifa, R.; Mahdjoub, H.; Baaloudj, A.; Cannings, R.A.; Samways, M.J. Effects of both climate change and human water demand on a highly threatened damselfly. Sci. Rep. 2021, 11, 7725. [Google Scholar] [CrossRef]
  81. Kadir, M.; Fehri, R.; Souag, D.; Vanclooster, M. Exploring causes of streamflow alteration in the Medjerda river, Algeria. J. Hydrol. Reg. Stud. 2020, 32, 100750. [Google Scholar] [CrossRef]
  82. Chettih, M.; Mesbah, M. Hydrodynamic behavior analysis of the Saharian aquifers with continuous wavelet transform. Res. J. Environ. Sci. 2010, 4, 421–432. [Google Scholar] [CrossRef]
  83. Elhiwardz. 2015. Available online: https://www.elhiwardz.com/local/7551/ (accessed on 14 February 2021).
  84. Aps. 2017. Available online: https://www.aps.dz/ar/regions/47926-2017-09-29-18-21-16 (accessed on 14 February 2021).
  85. Akanwa, A.O. River Sand Mining and Its Ecological Footprint at Odor River, Nigeria. In Agroecological Footprints Management for Sustainable Food System; Banerjee, A., Meena, R.S., Jhariya, M.K., Yadav, D.K., Eds.; Springer: Singapore, 2021. [Google Scholar] [CrossRef]
  86. Ikhsan, J.; Rezanaldy, A.; Rozainy, M.Z.M.R. Analysis of Sand Mining Impacts on Riverbed in the Downstream of the Progo River, Indonesia. In IOP Conference Series: Materials Science and Engineering; IOP Publishing: Bristol, London, UK, 2021; p. 012065. [Google Scholar] [CrossRef]
  87. Biswas, S.; Ghosh, S.; Halder, R. Impact of human intervention on assessing downstream channel behaviour of Ichamati River on the lower Gangetic Plain of West Bengal, India. Model. Earth Syst. Environ. 2021, 7, 1651–1665. [Google Scholar] [CrossRef]
  88. Gu, C.; Mu, X.; Gao, P.; Zhao, G.; Sun, W. Changes in run-off and sediment load in the three parts of the Yellow River basin, in response to climate change and human activities. Hydrol. Process. 2019, 33, 585–601. [Google Scholar] [CrossRef]
  89. Zhang, D.; Hong, H.Y.; Zhang, Q.; Li, X.H. Attribution of the changes in annual streamflow in the Yangtze River Basin over the past 146 years. Theoret Appl. Climatol. 2015, 119, 323–332. [Google Scholar] [CrossRef]
Figure 1. An overview of (a) hydrogeology of Africa, (b) geology of northern Algeria obtained from United States Geological Survey [49], (c) digital elevation model (DEM), and (d) permeability map of the study basin according to Flandrin (1952) [50] and modify by Djemai (2008) [51].
Water 13 02946 g001
Figure 2. Spatial analysis of (a) the average intra-annual rainfall and (b) coefficient of variation between 1972–2010 for the study area.
Water 13 02946 g002
Figure 3. Representation of daily time series of rainfall (Ben Yenni station) and streamflow (RN30 station) in Aïssi River sub-basin (1985–2010).
Water 13 02946 g003
Figure 4. Time series of some (a) rainfall stations and (b) results of sequential Man Kendall test.
Water 13 02946 g004
Figure 5. Correlogram of daily rainfall and runoff time series (windows of 125 days).
Water 13 02946 g005
Figure 6. Noise analysis of (a) rainfall time series (Ait Aicha, Beni Yenni and Dra’a El Mizen) and (b) different runoff time series of Sebaou River basin based on log-log representation spectra.
Water 13 02946 g006
Figure 7. Cross correlogram of rainfall-runoff relationship of the main sub-basin of Sebaou River basin (windows of 125 days).
Water 13 02946 g007
Figure 8. (a) Cross amplitude function, (b) phase function, (c) gain function, and (d) coherence function of the rainfall-runoff relationship of the main sub-basin of the Sebaou River basin (windows of 125 days).
Water 13 02946 g008
Figure 9. Cross wavelet spectra (XWT) of daily rainfall and streamflow of (a) Acsif N’Boubhir, (b) Sebaou Rabta, and (c) Aïssi sub-basins and wavelet coherence spectra (WCT) of daily rainfall and streamflow of (d) Acsif N’Boubhir, (e) Sebaou Rabta, and (f) Aïssi sub-basins (the dark line denotes the “cone of influence”, where edge effects become important).
Water 13 02946 g009
Figure 10. Representation analyses of (a) cross wavelet spectra, (b) square real part coherence spectra, and (c) phase function spectra between daily rainfall and streamflow for three representative sub-basins of the Sebaou River for the different isolation components of short-, medium- and long-term processes.
Water 13 02946 g010
Figure 11. Some pictures regarding the impacts and modifications of anthropological activities due to the extraction of large amounts of sand and rock from the riverbed of the Sebaou River.
Water 13 02946 g011
Table 1. Rainfall and runoff stations, and sub-basins studied in the cross analysis.
Rainfall Station/ANRH IDRunoff Station/ANRH IDRiver NamesSub-Basin/ANRH CodeArea of the Sub-Basin in haStudy Periods
Ait Aicha
02-15-09
Boubhir
02-15-13
BoubhirAcif N’boubhir
02-15
53,8301987–2011
Fréha
02-16-03
Fréha
02-16-05
DisSebaou Rabta
02-16
43,3301987–2002
Benni Yenni
02-17-12
RN 30
02-17-15
AïssiAïssi
02-17
47,0201985–2010
Tizi Ouzou
02-18-10
Belloua
02-18-03
SebaouSebaou Sebt
02-18
30,6301987–1998
DEM
02-19-02
RN 25
02-19-09
BoughdouraBoughdoura
02-19
53,4501973–1993
Baghlia
02-20-02
Baghlia
02-20-01
SebaouSebaou Maritime
02-20
22,8901964–1998
Table 2. Classification of six karstic systems of Sebaou River basin and some representative Mediterranean karstic system based on CSA of daily flow.
AuthorRegionKarstic SystemMemory Effect (Day)
(rk = 0.1–0.2)
Spectral Band: Cutoff FrequencyRegularization Time (Day)
Mangin (1984)
[27]
Pyrenees (France)AliouPoor (5 days)Very large (0.3)10–15
BagetSmall (10–15 days)large (0.2)20–30
FontestorbesLarge (50–60 days)narrow (0,1)50
TorcalExtensive (70 days)Very narrow (0.05)70
Bouchaou (1995) [68]The pleated Middle Atlas
(Maroc)
AsserdouneExtensive
(70–80 days)
Very narrow
(0.04–0.05)
70–80
Larocque et al. (1997) [69]Western FranceRochfoucauld76
Amraoui et al. (2004) [54]The tabular Middle Atlas (Maroc)BittitLarge (37–45 days)Very Wide35
RibaaExtensive (70 days)large (0.14)57
Chettih and Mesbah (2010) [70]Saharan Atlas (Algeria)Seklafa2.50.41.5
Kerakda3.5
Rhouiba4
Bouanani (2004) [71]basin Tafna
(Western Algeria)
SebdouSmall 5
MouilahLarge 0.02521
IsserExtensive0.01843
This workSebaou River
(Algeria)
Boughdoura RiverReduced (18 days)large (0.21)20–30
Aïssi RiverExtensive (53–84 days)Very narrow (0.032)50
Acif N’boubhirPoor (9 days)Large (0.22)15
Sebaou Sebt RiverSmall (16 days)Large (0.19)20–30
Sebaou Rabta RiverPoor (3 days)Very large (0.44)5
Sebaou maritime RiverExtensive (66 days)Very narrow (0.067)60
Table 3. Statistical fractals of the main hydroclimatic time series of the Sebaou River basin.
Time SeriesStationsPeriodSlope
(β1)
Scale Invariance RangesSlope (β2)Scale Invariance Ranges
Daily rainfall (mm/day)Tizi Ouzou1990–2009−0.2114 days–1 year−0.661–13.5 days
Ait Aicha1972–1991−0.159 days–1 year−1.101–8.5 days
1991–2010−0.3211 days–1 year−1.0310–13 days
DEM1967–1988−0.2616 days–1 year−0.821–15 days
1988–2010−0.00216 days–1 year−0.881–15 days
Freha1972–1991−0.2710 days–1 year−0.891–9 days
1991–20100.0711 days–1 year−0.881–10 days
Beni Yenni1972–1991−0.0910 days–1 year−1.101–9 days
1991–2010−0.1011 days–1 year−0.731–10 days
Daily runoff (m3/s)Belloua1949–1958−0.2611days–1 year−1.251–10 days
1972–1983−0.2212 days–1 year−1.141–11 days
1987–2000−0.3712 days–1 year−2.981–11 days
Baghlia1963–1985−0.3212 days–1 year−2.851–13 days
1985–1997−0.0113 days–1 year−2.241–12 days
Freha1986–2001−0.2820 days–1 year−1.601–19 days
Boubhir1987–2002−0.1313 days–1 year−1.451–12.5 days
RN251973–1994−0.7514 days–1 year−2.211–15 days
RN301985–1998−0.4820 days–1 year−2.431–19 days
1998–2010−0.3930 days–1 year−1.611–29 days
Table 4. Extracted significant correlations between daily rainfall and streamflow time series using XWT and WCT.
Spectral BandsYears with Significant Correlations Based on cross Wavelet Spectra (XWT) Analysis
Acif N’boubhir RiverAïssi RiverBoughdoura RiverSebaou Rabta RiverSebaou Sebt RiverSebaou Maritime River
(Outlet)
6–8 month1998, 2000
2006, 2007
1997, 20071974, 19761993, 1995, 1998, 20001994–19951974, 1978,
1983, 1987
1989
1 year1987–20101986–2002
2002–2010
1974–19941989–20011990–19971974–1998
1–3 year1996–20041996–20041983–19911990–19991993
1994–1997
1975–1981
1986–1993
3–6 year1996–20051997–20051995–19991994–19971979–1983
6–8 year1996–20041993–200419811984–1987
8–12 year1996–20041996–2001
Spectral BandsYears with Significant Correlations Based on Wavelet Coherence Spectra
6–8 month1988–200019861977, 1979,
1981, 1984, 1987, 1990
1988–1990
1992–1994
1998–2001
1991, 19971973, 1976
1983, 1985
1 year1988–20101991–19991974–1976
1979–1994
1988–20011990–20001973–1975
1979–1993
1–3 year1988–20102003–20101988–20011987–1993
3–6 year1995–19991978–19901992–1999
6–8 year1996–20041999–20041984–1987
8–12 year
Publisher’s Note: MDPI stays neutral with regard to jurisdictional claims in published maps and institutional affiliations.

