Article

Immobilization of TiO2 Semiconductor Nanoparticles onto Posidonia Oceanica Fibers for Photocatalytic Phenol Degradation

1
Laboratory of Energy and Materials (LABEM), High School of Sciences and Technology of Hammam Sousse, Sousse University-Tunisia, Hammam, Hammam Sousse 4011, Tunisia
2
Department of Chemistry, Technische Universität Berlin, TC 8, Straße des 17. Juni 124, 10623 Berlin, Germany
*
Author to whom correspondence should be addressed.
Water 2021, 13(21), 2948; https://doi.org/10.3390/w13212948
Submission received: 29 September 2021 / Revised: 13 October 2021 / Accepted: 14 October 2021 / Published: 20 October 2021
(This article belongs to the Section Wastewater Treatment and Reuse)

Abstract

:
A new composite photocatalyst called POF/TiO2 was prepared from commercial P25 TiO2 and Posidonia oceanica fibers (POF), a biomaterial collected from Tunisia’s beach. The composite material was prepared by a classical sol-gel synthesis and was characterized by different methods. SEM images show a TiO2 layer formed on top of the fibers, which was verified by XRD and XPS. Diffuse reflectance UV-vis spectroscopy shows that the layer has the same optical properties (Eg = 3.0 eV) as bulk P25. The photodegradation of phenol as a model compound was studied under different operating conditions using POF/TiO2 and the results show degradation efficiencies between 4% (100 ppm) and 100% (<25 ppm) after 4 h of UV-C light irradiation (254 nm) using a POF/TiO2 concentration of about 1 g/L. The composite material showed good stability and could be recycled up to three times.

1. Introduction

During the last years, clean water resources have become one of the most significant worries of governments due to population growth, a considerable increase in water withdrawal, and the production of large amounts of wastewater by various industries. Phenols and phenolic compounds from wastewaters of petrochemical, pharmaceutical, and biotechnology refineries are considered priority pollutants that may cause severe damage to the environment and human health [1]. Phenol is the most common organic pollutant with a stable structure and high toxicity even at low concentrations. Phenol removal can be done in different ways including physical, chemical, or biological treatment, and an overview is given by Villegas et al. [2]. One of the standard methods to remove pollutants from wastewater is based on adsorption using activated carbon as the adsorbent [3]. Although treatment with activated carbon is expensive, it is in many cases the most efficient method. To lower the costs and increase the sustainability of adsorption processes, natural materials such as Posionia oceanica fibers [4], Phragmites australis [5], or banana peel [6] have been investigated for pollutant removal. However, currently adsorption on biomaterials is hardly applied in industry and only taken into consideration at very low pollutant concentration.
A promising alternative to pollutant adsorption is the photocatalytic removal of pollutants. Successful examples for photocatalytic phenol degradation, mainly with titanium dioxide (TiO2) as the photocatalyst, are shown in the literature [7,8,9]. Also the plastic additive bisphenol A (BPA), a representative endocrine disruptor and a compound of high concern, belongs to the group of phenolic compounds and can contaminate waters [10]. It is reported that TiO2-based photocatalysts are able to degrade BPA, too [11,12].
In lab-scale, the photocatalytic pollutant degradation is carried out with suspended TiO2 photocatalysts, but TiO2 tends to agglomerate, whereby agglomeration depends on TiO2 concentration and water quality [13]. To avoid the agglomeration of photocatalyst particles and also to improve their photocatalytic activity, they can be mixed with low cost and abundant materials forming composite photocatalysts as shown in the literature, e.g., clay for ZnO [14,15], zeolites for TiO2 [16,17], chitosan for TiO2 [18,19], perlite for TiO2 [20], and cellulose/lignocellulose for TiO2 [21,22]. In many of these composite photocatalysts, the natural and abundant material acts as support for the photocatalyst particles, thus allowing a good dispersion of the titanium oxide particles while avoiding their agglomeration. The immobilization of the photocatalyst particles is beneficial for the photocatalytic process and allows for a better utilization of the photocatalyst.
In this contribution, Posidonia oceanica fibers (POF) are used as the support material for P25 TiO2 photocatalyst particles. The fibers can be found in large quantities at Tunisia’s beach, and they are mainly considered as waste. The fibers have been previously investigated for the removal of contaminants from water by adsorption, showing a good and stable performance [4,23,24,25]. The new POF/TiO2 composite photocatalyst, in which a better utilization of the P25 particles is assumed, is prepared by the sol-gel method. The photocatalytic performance of POF/TiO2 is investigated for phenol degradation as a model reaction. Phenol was taken as a model because it can be easily detected by liquid chromatography, and further, it represents the polyphenols contained in the residues of the olive oil industry. The composite material is characterized by standard analytical methods such as X-ray diffraction (XRD), scanning electron microscopy (SEM), and diffuse reflectance UV-Vis spectroscopy (DR-UV/vis). Several operating parameters (e.g., phenol concentration, photocatalyst concentration, and light source) are varied to study their effect on the degradation efficiency.

2. Materials and Methods

2.1. Chemicals and Materials

Posidonia oceanica fibers (abbreviated as POF) were collected from Chatt Menchiya beach from Hammam Sousse of Tunisia. For the pre-treatment of POF, sodium hydroxide (NaOH, 98%, Sigma-Aldrich, Hamburg, Germany), phosphoric acid (H3PO4, 85%, Sigma-Aldrich, Hamburg, Germany), and hydrogen peroxide (H2O2, 30%, Sigma-Aldrich, Hamburg, Germany) were used. For the synthesis of a POF/TiO2 composite photocatalyt, titanium tetraisopropoxide (TTIP, 97%, Sigma-Aldrich), tetraethylorthosilicate (TEOS, 98%, Sigma-Aldrich), P25 (Evonik Degussa, Munich, Germany), hydrochloric acid (HCl, 37 wt%, VWR International, Darmstadt, Germany), perchloric acid (HClO4, 70%, Sigma-Aldrich, Hamburg, Germany), and Levasil 200/30 (30% active matter, Obermeier, Bad-Berleburg, Germany) were used. Phenol (99%, Sigma-Aldrich) was selected as a model compound for photocatalytic degradation tests. Aqueous solutions were prepared with distilled water (1–3 μS/cm).

2.2. Pre-Treatment of POF

The collected fibers were thoroughly washed with distilled water and dried at 40 °C for 48 h. Then, 5 g POF was pre-treated with 100–250 mL of 0.5 M NaOH, H3PO4, or H2O2 for 2 h at 70 °C under stirring. The treated fibers were again washed with distilled water and dried for 48 h at room temperature (approximately 20 °C), and finally dried for 2 h at 80 °C.

2.3. Synthesis of POF/TiO2

A TiO2 precursor solution (called SOL1) was prepared by dissolving 15 mL of TTIP in 15 mL of ethanol. A second solution (called SOL2) was prepared by mixing 45 mL of water and 2 mL of 0.1 M of HClO4. SOL2 was added to SOL1 dropwise under reflux and heating. After reflux for 2 days (48 h), a clear yellow solution was obtained called SOL3. A further solution called SOL4 was prepared by mixing 3.72 mL of TEOS, 2.5 mL of Levasil 300/20, 2 mL of water, and 10 mL of SOL 3 under vigorous stirring to prevent the formation of agglomerates. Hereafter, 1 mL of HCl was added to SOL4, and the solution was stirred for 45 min. This solution with a yellow color was called SOL5. In the final step, SOL5 was added dropwise to a mixture of 2 g POF and 2 g P25. The mixture was stirred for 20 min and then sonicated at room temperature for 10 min to form a homogenous suspension. This mixture was filtered, washed with distilled water, and finally dried under air for 3 days. The modified fibers were abbreviated as POFX/TiO2 (x = kind of pre-treatment). A scheme of the synthesis process is shown in Figure S1.

2.4. Characterization of POF/TiO2

All samples were characterized with X-ray powder diffraction (XRD, Malvern PANalytical X’Pert, Worcestershire, United Kingdom) in the 2θ range between 20° and 80° using CuKα (γ = 1.54060 Å) radiation to study the physicochemical character of the materials. The morphology of the fibers was examined by using scanning electron microscopy (SEM) (SEM type: SU8030 microscope operated at an acceleration voltage of 10 kV and a probe current of 15 pA, Hitachi High-Tech Horiba, Hillsboro, OR, USA). The surface characterization of the fibers was done by Brunauer-Emmett-Teller (BET) measurements using nitrogen adsorption-desorption isotherms at 77K (Micromeritics-ASAP 2020 chemisorption system, Norcross, GA, USA). The diffuse reflectance UV-vis absorption spectra were measured using a UV-vis spectrophotometer equipped with an integrating sphere (LAMBDA 650 UV-vis with 150 mm integrating sphere, Perkin Elmer, 710 Bridgeport Avenue Shelton, USA). Indirect band-gap energies were determined by plotting the Kubelka–Munk transformation of the original diffuse reflectance spectra vs. photon energy (Tauc plot):
F ( R ) = ( 1 R ) 2 2 R
where R is the measured reflectance ( R = Rsample/Rstandard).
X-ray photoelectron spectroscopy (XPS) analyses were performed using a Perkin Elmer Φ 5600 ci spectrometer with a non-monochromatized AlKα source (1486.6 eV) as an excitation source (equipped with the Omni Focus III Small area Lens, Perkin-Elmer GmbH, Rodgau, Germany), and powered at 300 W, at a working pressure lower than 10−9 mbar. The reported Binding Energy (BE) values were corrected for charging effects by assigning a BE of 284.8 eV to the adventitious C1s signal. After Shirley-type background subtraction, the atomic percentages were evaluated through sensitivity factor values provided by the Φ V5.4 A software.

2.5. Photocatalytic Degradation of Phenol

The photocatalytic degradation of phenol as a model compound was examined in batch mode. Fifty milliliters of an aqueous solution with a phenol concentration of 50 mg L−1 was placed in a beaker. The desired amount of POF/TiO2 composite was added and the suspension was stirred under UV-C light top irradiation (254 nm) at 298 K. If not mentioned otherwise, an 8 W Hg UV-C lamp (Ultra-Violet Products, Cambridge, UK) was used as the light source and the distance between lamp and beaker was about 12 cm. A scheme of the setup is shown in Figure S2. Before irradiation, the reaction medium was stirred for 30 min in darkness to obtain the adsorption-desorption equilibrium. During photocatalytic tests with a total duration of 4 h, every 30 min a sample of 1 mL was collected. The samples were centrifuged to remove the photocatalyst, and the liquid was analyzed by high-performance liquid chromatography (HPLC). The photodegradation efficiency of phenol was calculated by the following equation:
D e g r a d a t i o n   e f f i c i e n c y   ( % ) = ( c 0 c t ) c 0 100
where c0 and ct are the concentrations after 30 min in dark and irradiation time t, respectively. If not mentioned otherwise, the reactions were performed at neutral pH (pH = 6–7), which showed the best activity based on earlier publication [8].
The HPLC equipment consists of an Agilent Technologies 1200 Series chromatograph (Agilent Technologies, Waldbronn, Germany) coupled with a UV-vis detector. A Multospher 120 RP 18 column (Ziemer Chromatographic, 250 mm × 4 mm, 5 μm) was used for the separation, and a mixture of acetonitrile and distilled water (V/V = 70/30) was used as the eluent. The eluent flow rate was 1.0 mL min−1 and the injection volume was 10 μL. The elution of the compounds was monitored by a UV/Vis detector at 225 nm and the column temperature was 25 °C. The retention time of phenol is about 3.1 min and HPLC chromatograms are shown in Figure S3.

3. Results and Discussion

3.1. Physico-Chemical Characterization of POF and POF/TiO2

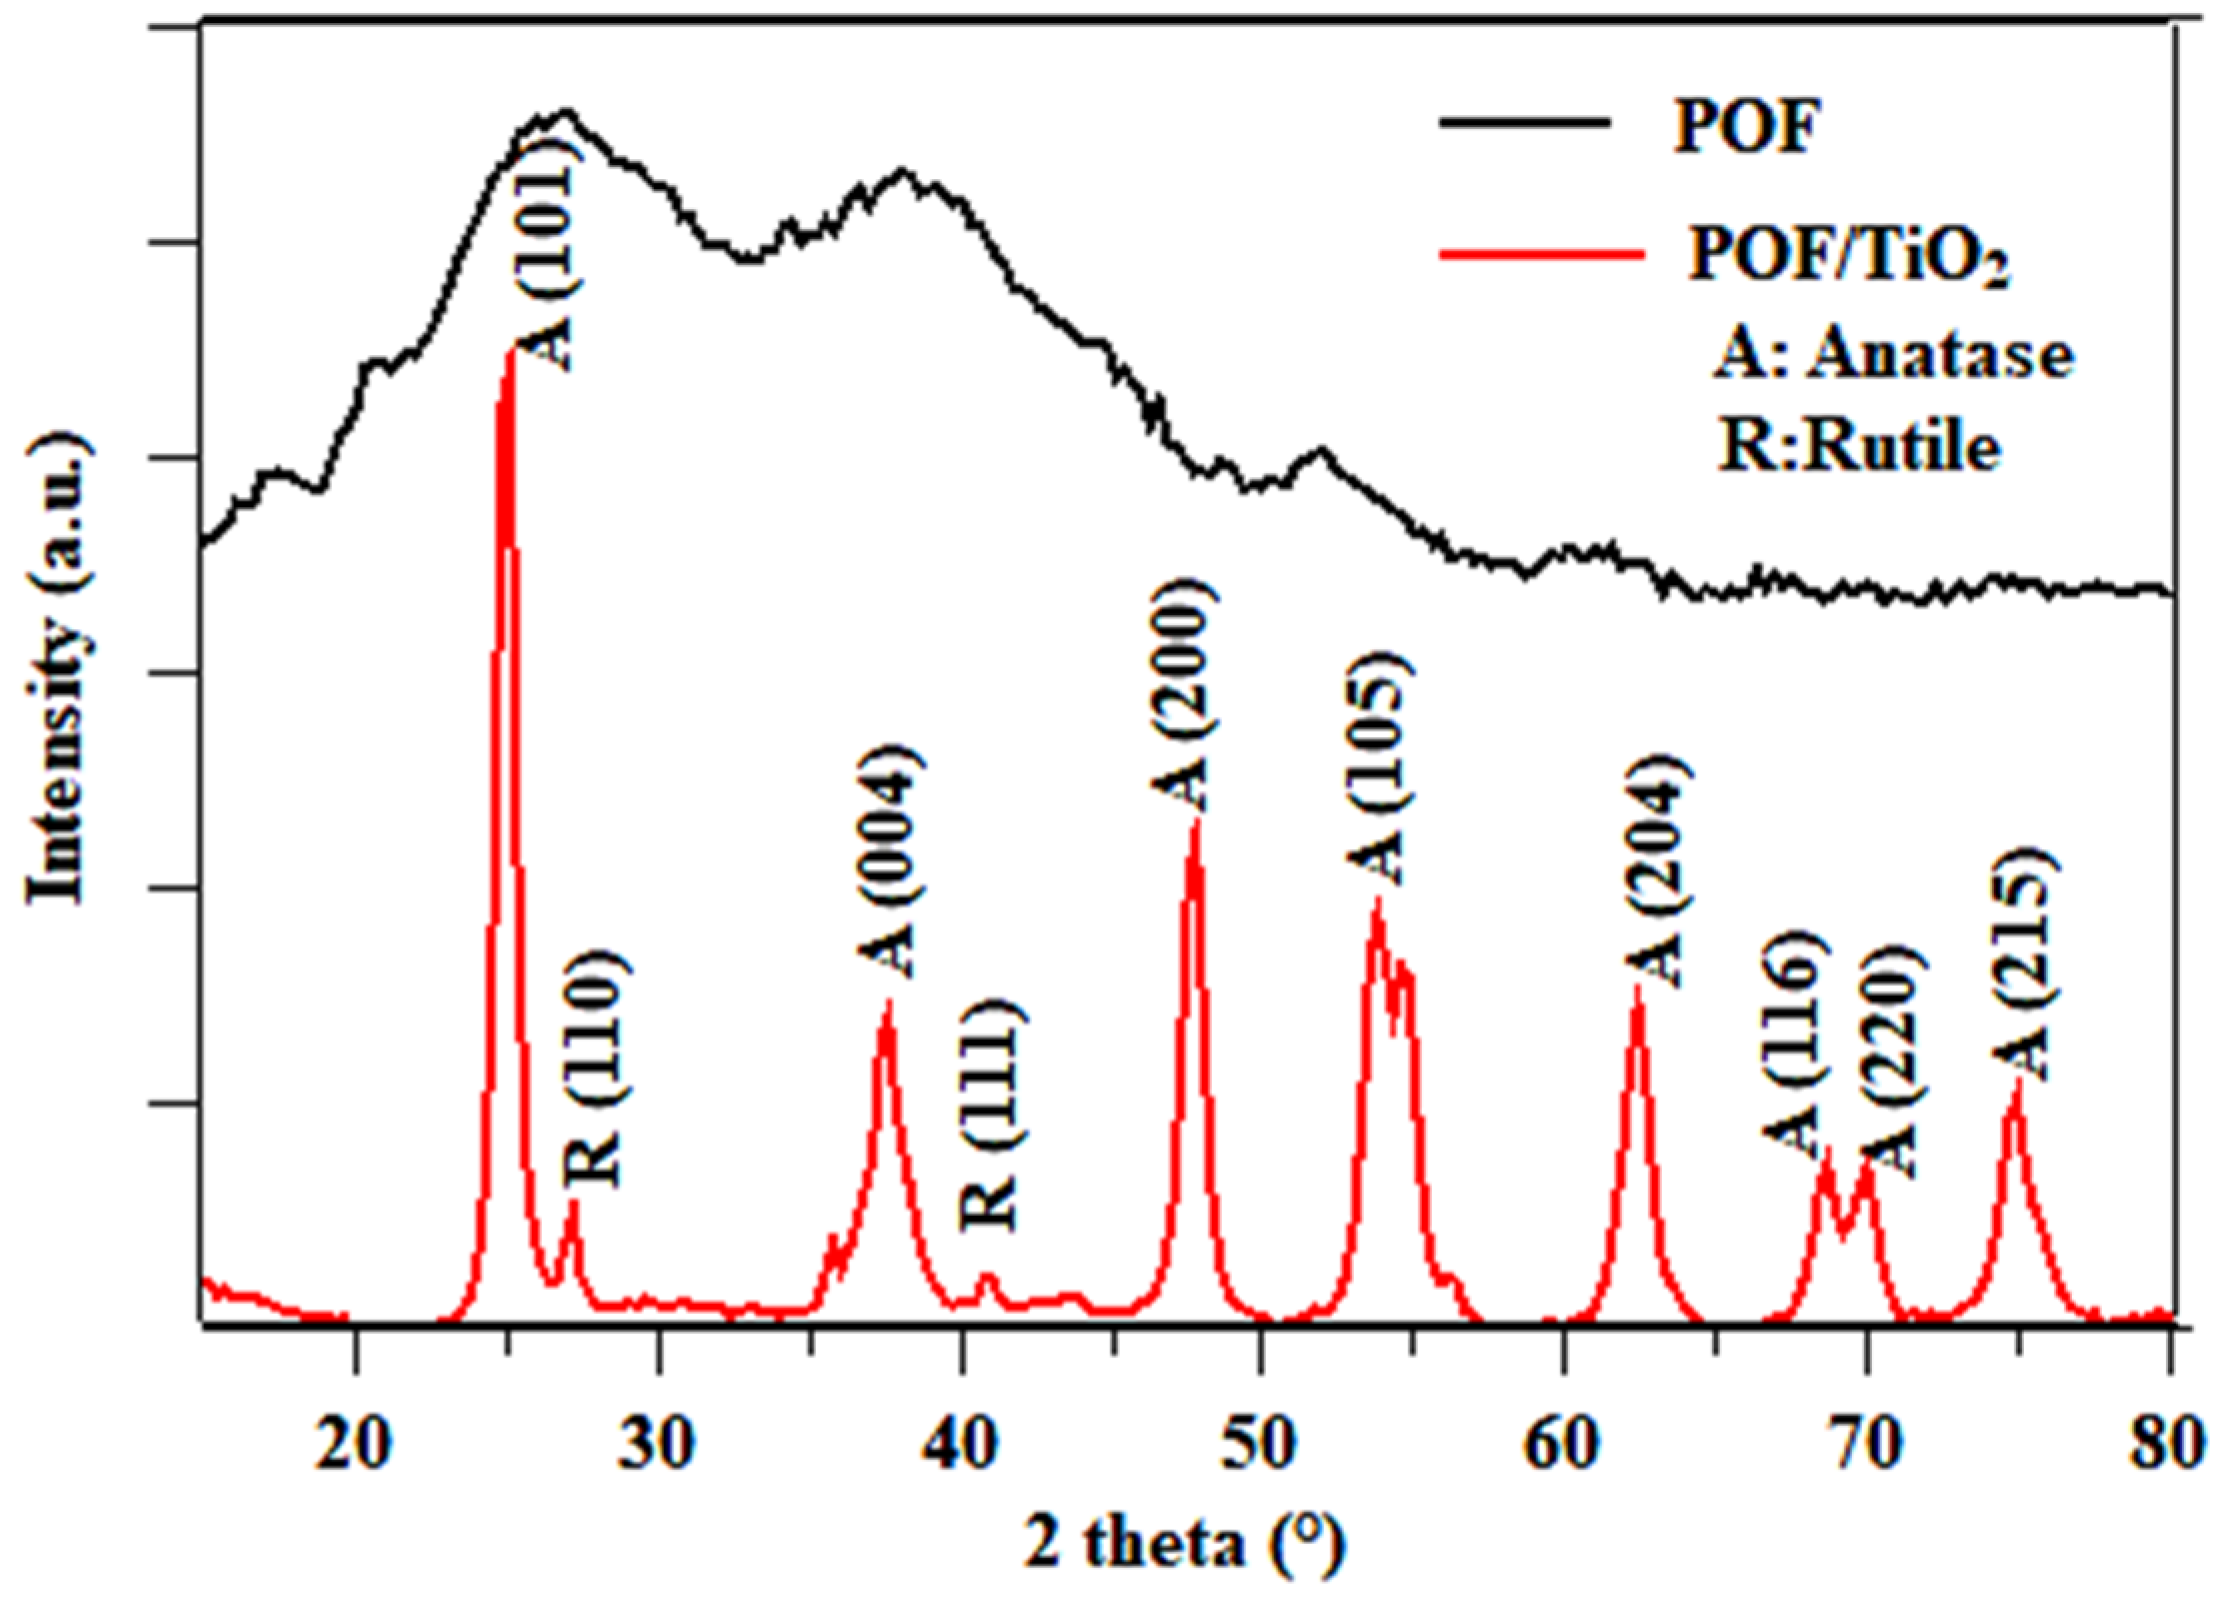
3.1.1. X-ray Diffraction

The X-ray diffraction patterns of POF and POF/TiO2 are shown in Figure 1. The fibers that were used as the support material show an amorphous structure. After sol-gel modification, several peaks are shown that correspond to a mixture of anatase and rutile phases. Anatase was the major crystalline phase as indicated by peaks emerging at 25.3°, 37.8°, 47.8, 53.8°, 62.8°, 68.6°, 70.1°, and 75.1°, associated with (1 0 1), (0 0 4), (2 0 0), (1 0 5), (2 0 4), (1 1 6), (2 2 0), and (2 1 5) anatase reflections, respectively (JCPDS powder diffraction file 00-021-1272). Besides, the rutile peaks at 27.1° and 41.6° are associated with (1 1 0) and (1 1 1) rutile reflections, respectively (JCPDS powder diffraction file 00-21-1276). The POF/TiO2 pattern agrees well with that of commercial P25 as shown in the literature [26], indicating the successful immobilization of commercial P25. It is important to mention that the TiO2 in the binder, which was synthesized from TTIP, had a much lower degree of crystallinity compared to P25. Therefore, the binder contribution in the diffractogram cannot be distinguished [27]. Furthermore, the addition of the binder did not cause any phase change in commercial P25 because the treatment of the samples took place at a lower temperature where the process is slow [28].

3.1.2. SEM/EDX

SEM characterizations were performed to gain further insight into the distribution of TiO2 particles in the POF/TiO2 composite. The SEM images of POF and POF/TiO2 are shown in Figure 2a–f, respectively. The pure fibers have a long uniform length and a fibrous structure (Figure 2a) as confirmed by other researchers [29,30,31]. After the modification of POF by the sol-gel method, a well-fixed thin film of TiO2 is formed (Figure 2d–f). The film has some protrusions, which might improve the activity of phenol degradation. It is assumed that the TiO2 particles are attached to the POF surface through condensation during the sol-gel process. Both the fibers and the TiO2 particles contain surface OH groups that can take part in the condensation process. Both TEOS and Levasil 300/20 are used as a binder that supports the linkage of the particles to the surface. In addition, the TiO2 precursor TTIP acts as a binder rather than as a film-forming agent.
The successful immobilization of P25 onto the fibers is also verified from the EXD spectrum (Figure S4). Before modification, the raw POF contains elements such as oxygen (O), carbon (C), and calcium (Ca). After transformation and immobilization, titanium (Ti) peaks appear for the POF/TiO2 sample. These results confirm the success of the modification with TiO2. Besides, the O/C ratio slightly increases due to the oxygen from TiO2.

3.1.3. BET

The surface area (SA) of the pure fibers was about 2.7 m2 g−1 with an average pore diameter and pore volume of about 15.5 Å and 0.027 cc/g, respectively. For TiO2 P25, the surface area was about 56 m2 g−1. After the modification of POF with TiO2, the BET surface area was about 45.8 m2 g−1 with average pore diameter and pore volume of 17.2 Å and 0.041 cc/g, respectively. The surface area of the composite is much larger than the surface area of POF alone and only slightly lower than the surface area of pure P25. It has to be mentioned that in the synthesis of the POF/TiO2 composite, the ratio of P25:POF was 1:1. Therefore, compared to pure P25, the total surface area (=surface area multiplied with mass of catalyst), increased, which can suggest an enhancement in the adsorption capacity. The nitrogen adsorption-desorption of POF/TiO2 (Figure S5a) shows a type IV isotherm with a hysteresis cycle, usually observed for mesoporous solids. Similar spectra for TiO2 were reported by other researchers [32].

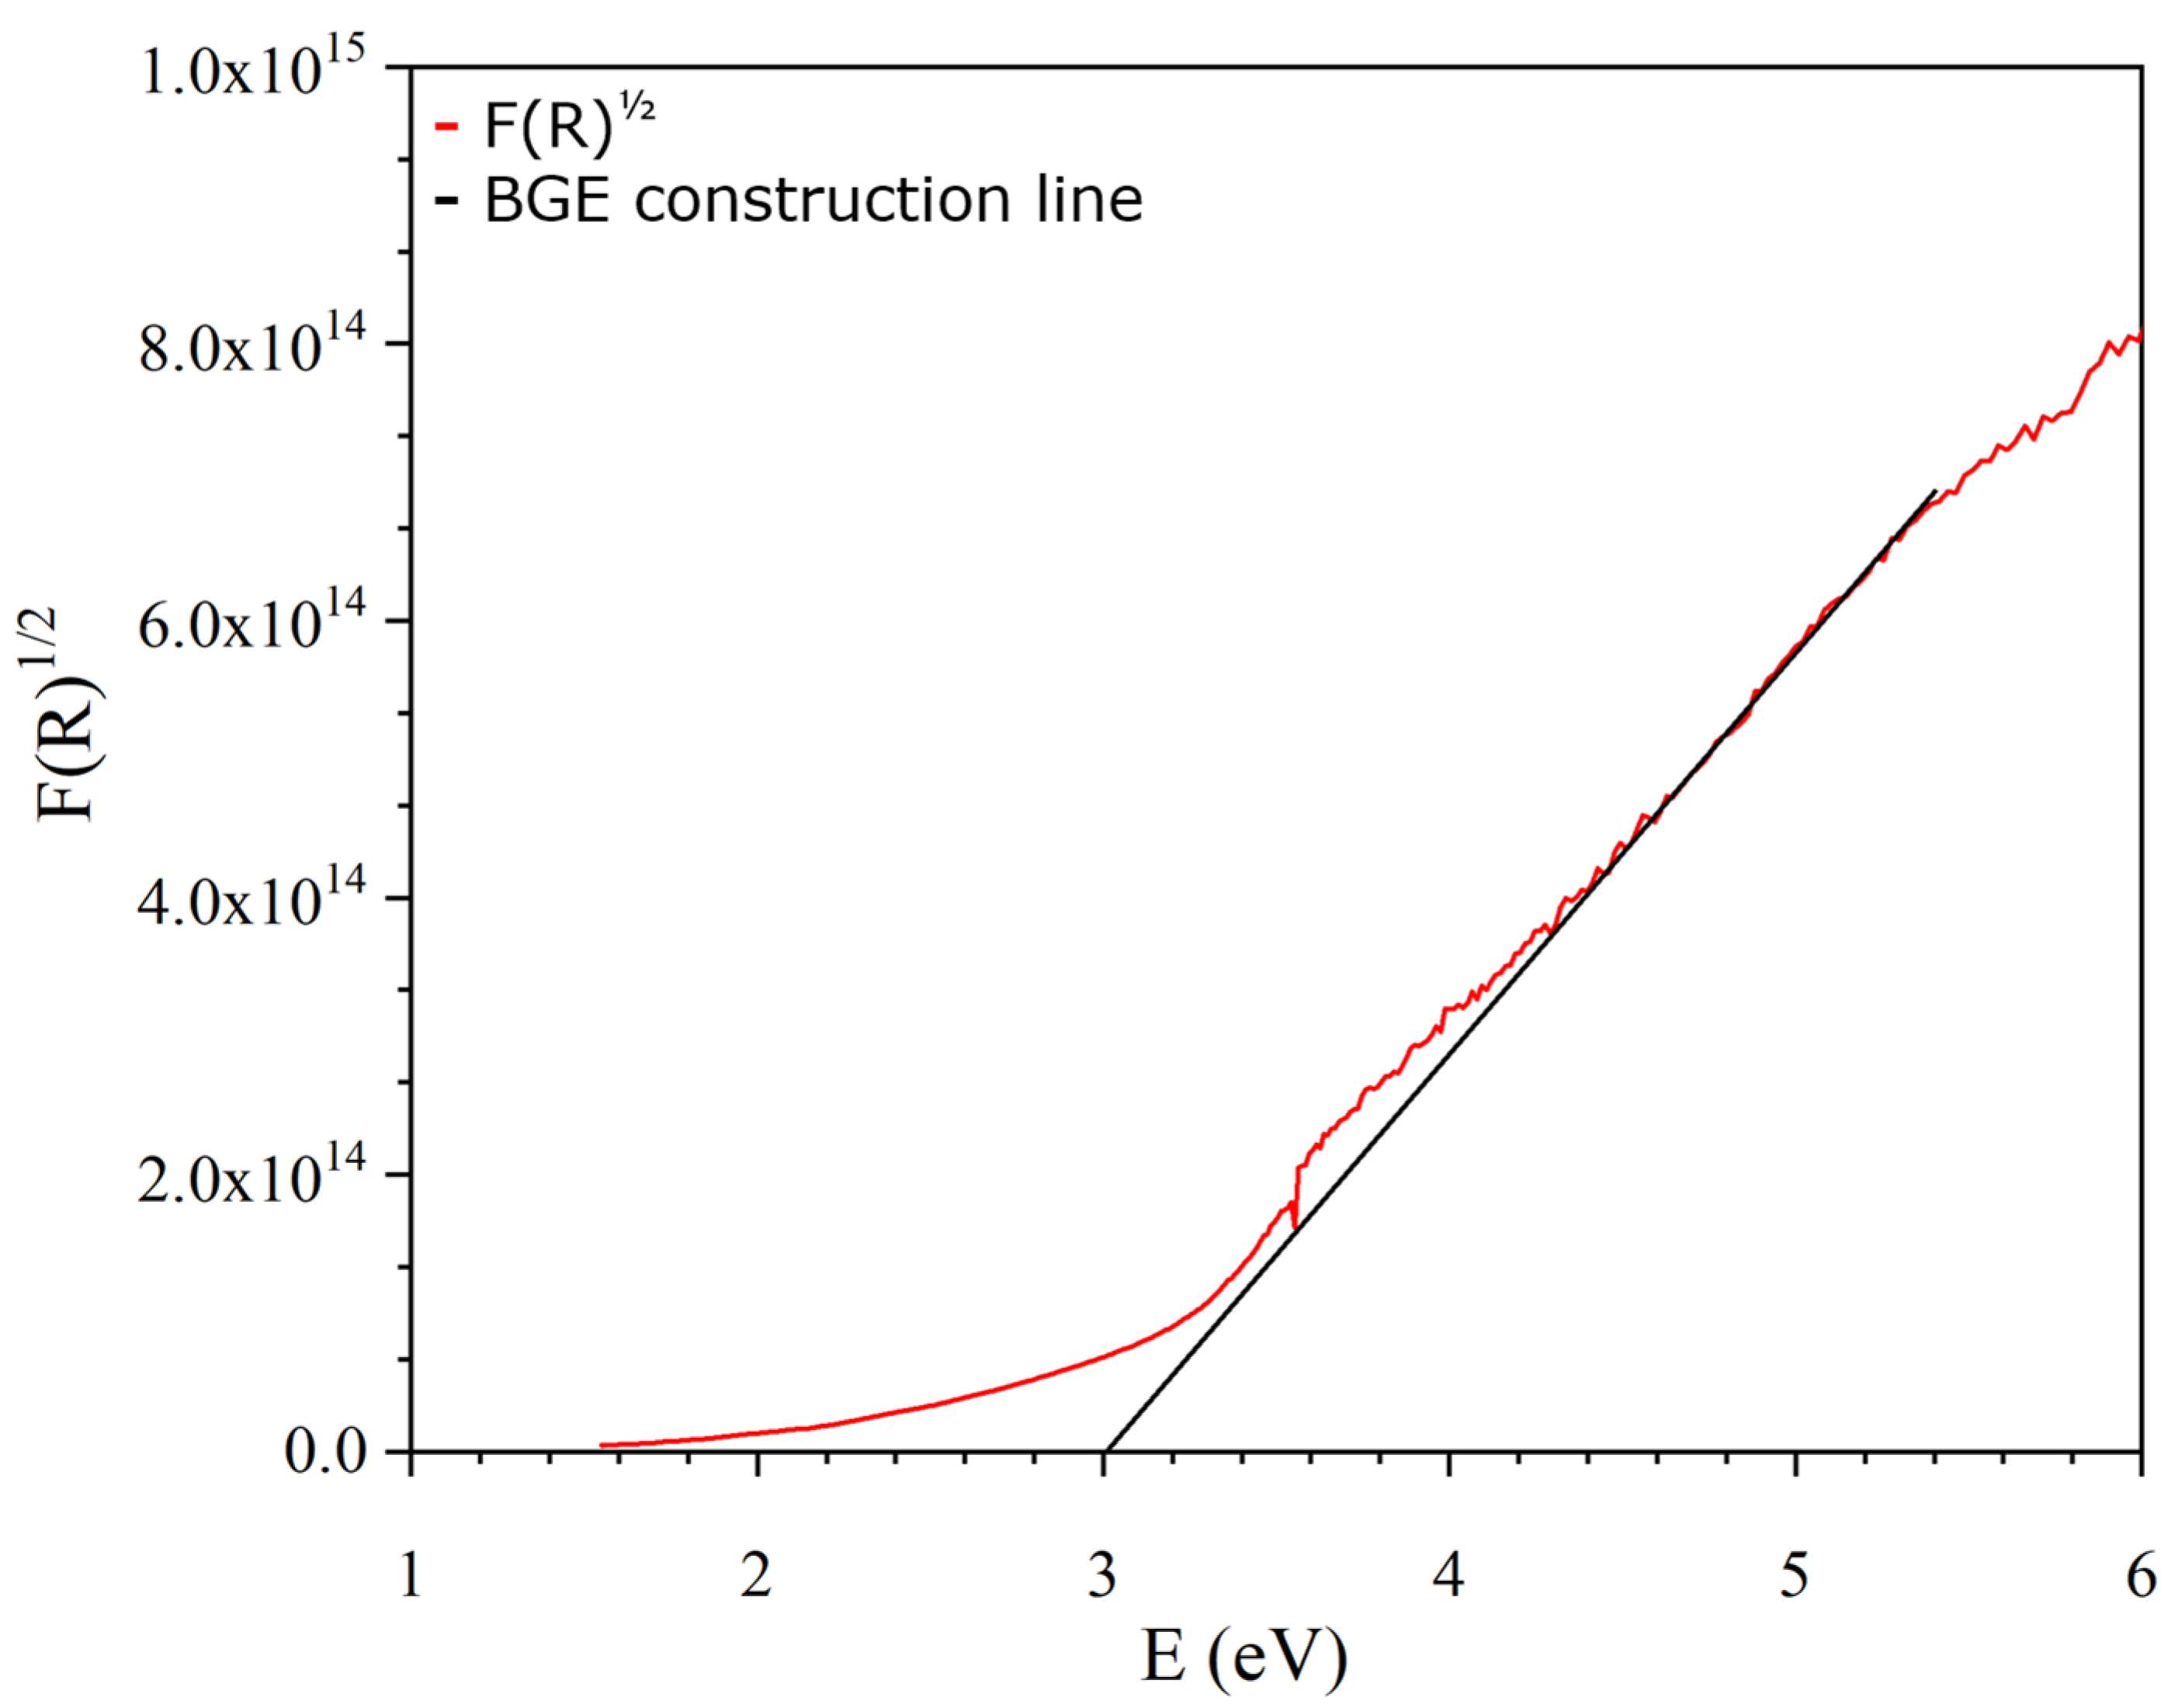
3.1.4. UV-Vis DRS Analysis
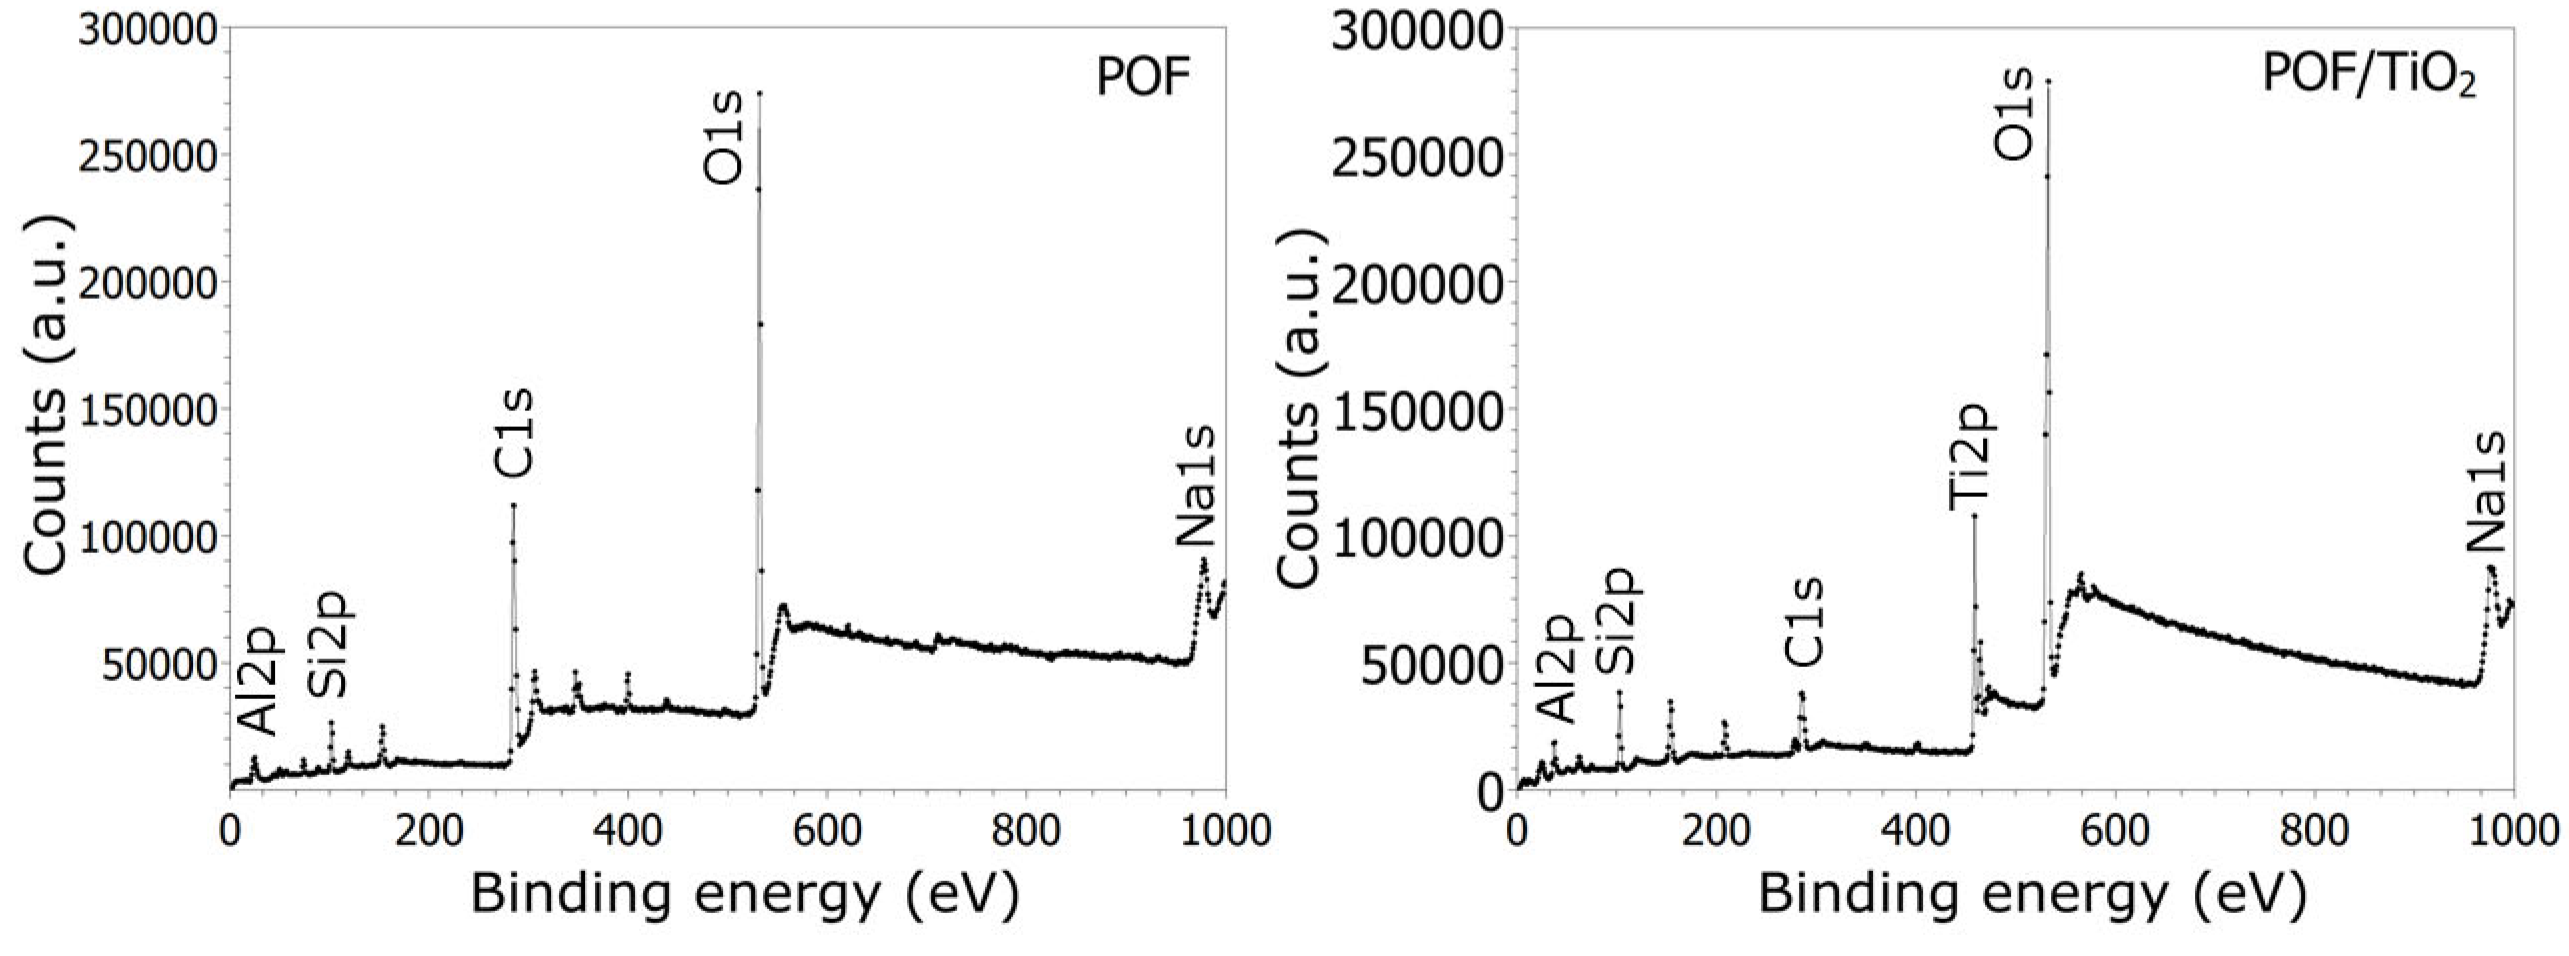
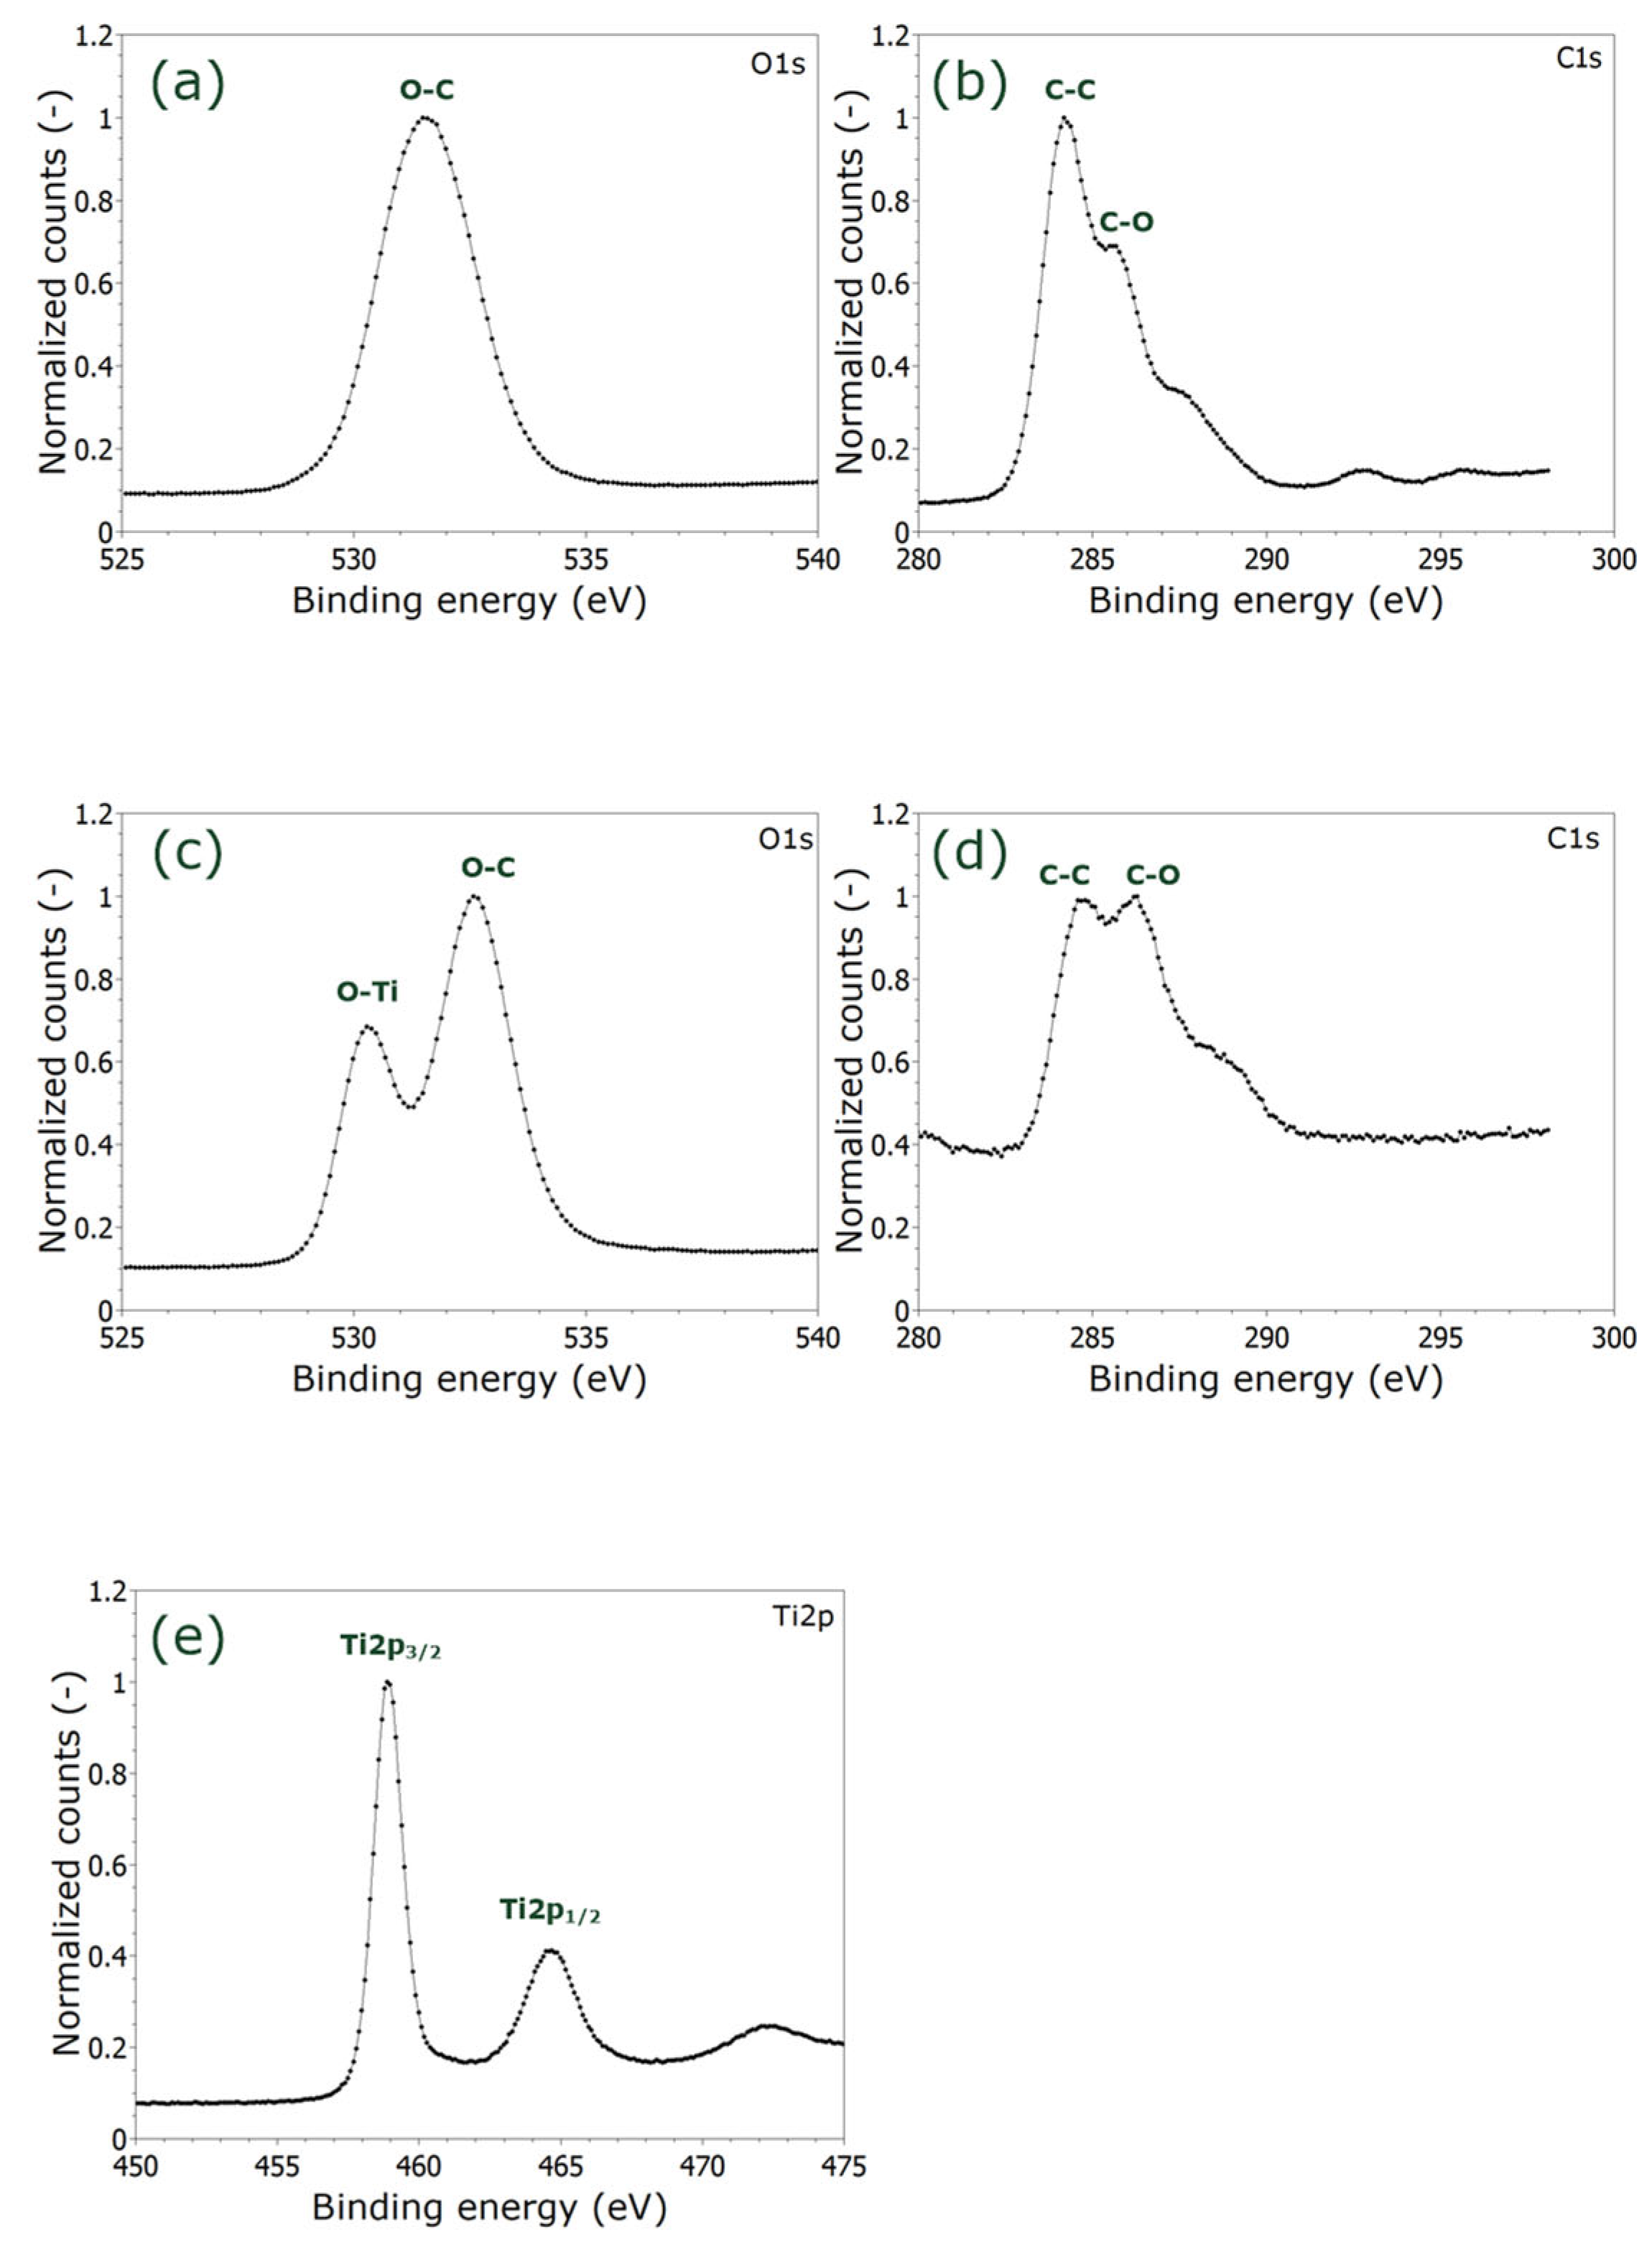
The fibers are a natural material without semi-conductive properties. Commercial P25 has been investigated several times as semiconductor photocatalyst and its indirect band-gap is 3.1 eV [33]. The optical properties of POF/TiO2 were analyzed by UV-vis DRS spectroscopy to determine the band-gap energy of the composite photocatalyst. The TAUC plot is shown in Figure 3. The indirect band-gap energy of POF/TiO2 was found to be around 3.0 eV. This value fits well with the literature for the bandgap of P25 [33]. It can be summarized that the optical properties of P25 remain in the POF/TiO2 composite, and therefore, for photocatalytic reactions, still UV light is required to generate electron-hole pairs.

3.1.5. XPS

XPS characterization gives information about the surface states and elemental composition of as-prepared samples. The method is only sensitive to the surface and cannot probe regions deeper than a few nanometer [34]. This methods allows to get more information about the structure and composition of the TiO2 film rather than of the composite material. The film thickness of immobilized TiO2 was estimated from Figure 2b,e to be larger than 100 nm. Therefore, XPS analysis is directly related to the composition of the film. Figure 4 shows the survey spectra for POF and POF/TiO2. The pure fibers (Figure 4, left) are mainly composed of carbon (Cs1, 298 eV) and oxygen (Os1, 545 eV) but show some trace elements such as N, Al, Fe, S, Si, Na, and Mg. The spectrum contains the typical elements for biomaterials and agrees with the literature [35]. After modification of the fibers surface with commercial P25 using the sol-gel method, a new peak for titanium (Ti) appeared as proof of the successful immobilization of TiO2. These results are in agreement with the results from SEM and EDX analysis. A more detailed analysis is shown in Figure 5. The O1s spectrum of POF (Figure 5a) shows a signal for the C-O bond and the C1s spectrum (Figure 5b), and two signals for C-O and C-C bonds in the biomaterial. After modification, new signals appear. The POF/TiO2 sample shows two Ti2p (Figure 5e) signals at about 459 eV (Ti2p3/2) and 464 eV (Ti2p1/2), typical for P25 as confirmed by the literature [36]. Further, the samples show a new O1s signal at about 530 eV (Figure 5c), which corresponds to the O-Ti bond in TiO2 [37]. Due to the successful immobilization of TiO2 and the fact that XPS mainly analyzes the TiO2 film, the C-O signal increased (Figure 5d).
The elemental composition of POF and POF/TiO2 as well as their energy levels are shown in Table 1. As already mentioned, POF consists of C, O, and some trace elements. After the sol-gel process to bind P25 to the POF surface, a signal for Ti is shown as proof for the successful immobilization of P25. Furthermore, Si and O increased. The increase of Si is due to the formation of SiO2 in the sol-gel process. The increase of O is due to both the presence of TiO2 and SiO2. The fact that no peaks for SiO2 are shown in XRD verifies that SiO2 is not on the surface and is only used as a binder between POF and TiO2.

3.2. Photocatalytic Phenol Degradation

The POF/TiO2 composite photocatalysts were tested for the photocatalytic degradation of phenol. In this part, the focuses are (a) to utilize the natural fibers as photocatalyst support material and (b) to investigate the impact of the operating conditions for phenol degradation. Before turning the light on, the solution was kept in the dark for 30 min to obtain the adsorption-desorption equilibrium. As P25 is the main photocatalyst in the POF/TiO2 composite, one phenol degradation experiment with pure P25 was performed for comparison. Using a phenol concentration of 50 ppm and a P25 concentration of 1 gL−1, the degradation efficiency was about 1.4 %/mgP25 after 4 h. The results of the photocatalytic tests for removing phenol by as-prepared POF/TiO2 composites are discussed in the following sections. Initial experiments showed that removing phenol was negligible in the absence of TiO2. Neither photolysis nor the fibers alone can degrade phenol under irradiation.

3.2.1. Effect of Chemical POF Pre-Treatment

Before evaluation of the photocatalytic activity of POF/TiO2 for phenol degradation, experiments were carried out to determine the best POF pre-treatment. The fibers were collected from the beach in Tunisia, and they required a cleaning step before their usage. First, the fibers were intensively washed, and second, the fibers were treated with different chemical agents, such as NaOH, H3PO4, and H2O2. Then the composite was prepared as described and tested under the following conditions: 50 mL of phenol at an initial concentration of 50 ppm and 50 mg of POF/TiO2. Figure 6 compares the degradation efficiency of phenol on pure POF/TiO2, POFNaOH/TiO2, POFH3PO4/TiO2, POFH2O2/TiO2, POF, P25, and photolysis under UV-C light. As it is shown in Figure 6, the pure fibers cannot degrade phenol because the biomaterial is not a semiconductor photocatalyst. As the POF surface area is low, phenol adsorption is negligible. The activity of the POF/TiO2 composite varies depending on the kind of pre-treatment. The highest activity was obtained after the fibers were pre-treated with NaOH or H3PO4.
Considering all composites, the degradation efficiency was in the following order: P25 > POFNaOH/TiO2 (62%) > POFH3PO4/TiO2 (56%) > POF/TiO2 (45%) > POFH2O2/TiO2 (23%) > POF/photolysis (0%). Curves for pure P25 and photolysis of phenol were included in Figure 6. There is no degradation in the absence of the photocatalyst. For P25 at a concentration of 1 g/L, the phenol degradation is the highest, because the total amount of TiO2 is much higher than in the composite. The XPS showed a Ti fraction in the composite of about 8% (Table 1). Based on the XPS value for Ti, the 50 mg POF/TiO2 sample corresponds to a TiO2 mass of approximately 7 mg. Although the amount of TiO2 in the composite was about five times lower, the composite photcatalyst showed a very good photocatalytic performance.
As shown from Figure 6, the pre-treatment of POF with NaOH results in the most active composite to degrade phenol. Alkaline pre-treatment is better to remove lignin, wax, and impurities that cover the external surface of the Posidonia oceanica fibers [38,39]. The NaOH-cleaned POF surface seems to be beneficial for the synthesis of a POF/TiO2 composite by the sol-gel method. Beside the removal of impurities, a further reason for the better performance after NaOH treatment might be the change in the surface morphology of the fibers. After treatment, the fibers are more orientated and possess a high surface roughness as shown by Garcia-Garcia et al. [40]. Both are important aspects for the interaction of the fibers and the TiO2 particles. A higher surface roughness allows for a higher particle adsorbance as shown by Sakti et al. for BSA adsorption onto smooth and rough polystyrene surface [41].

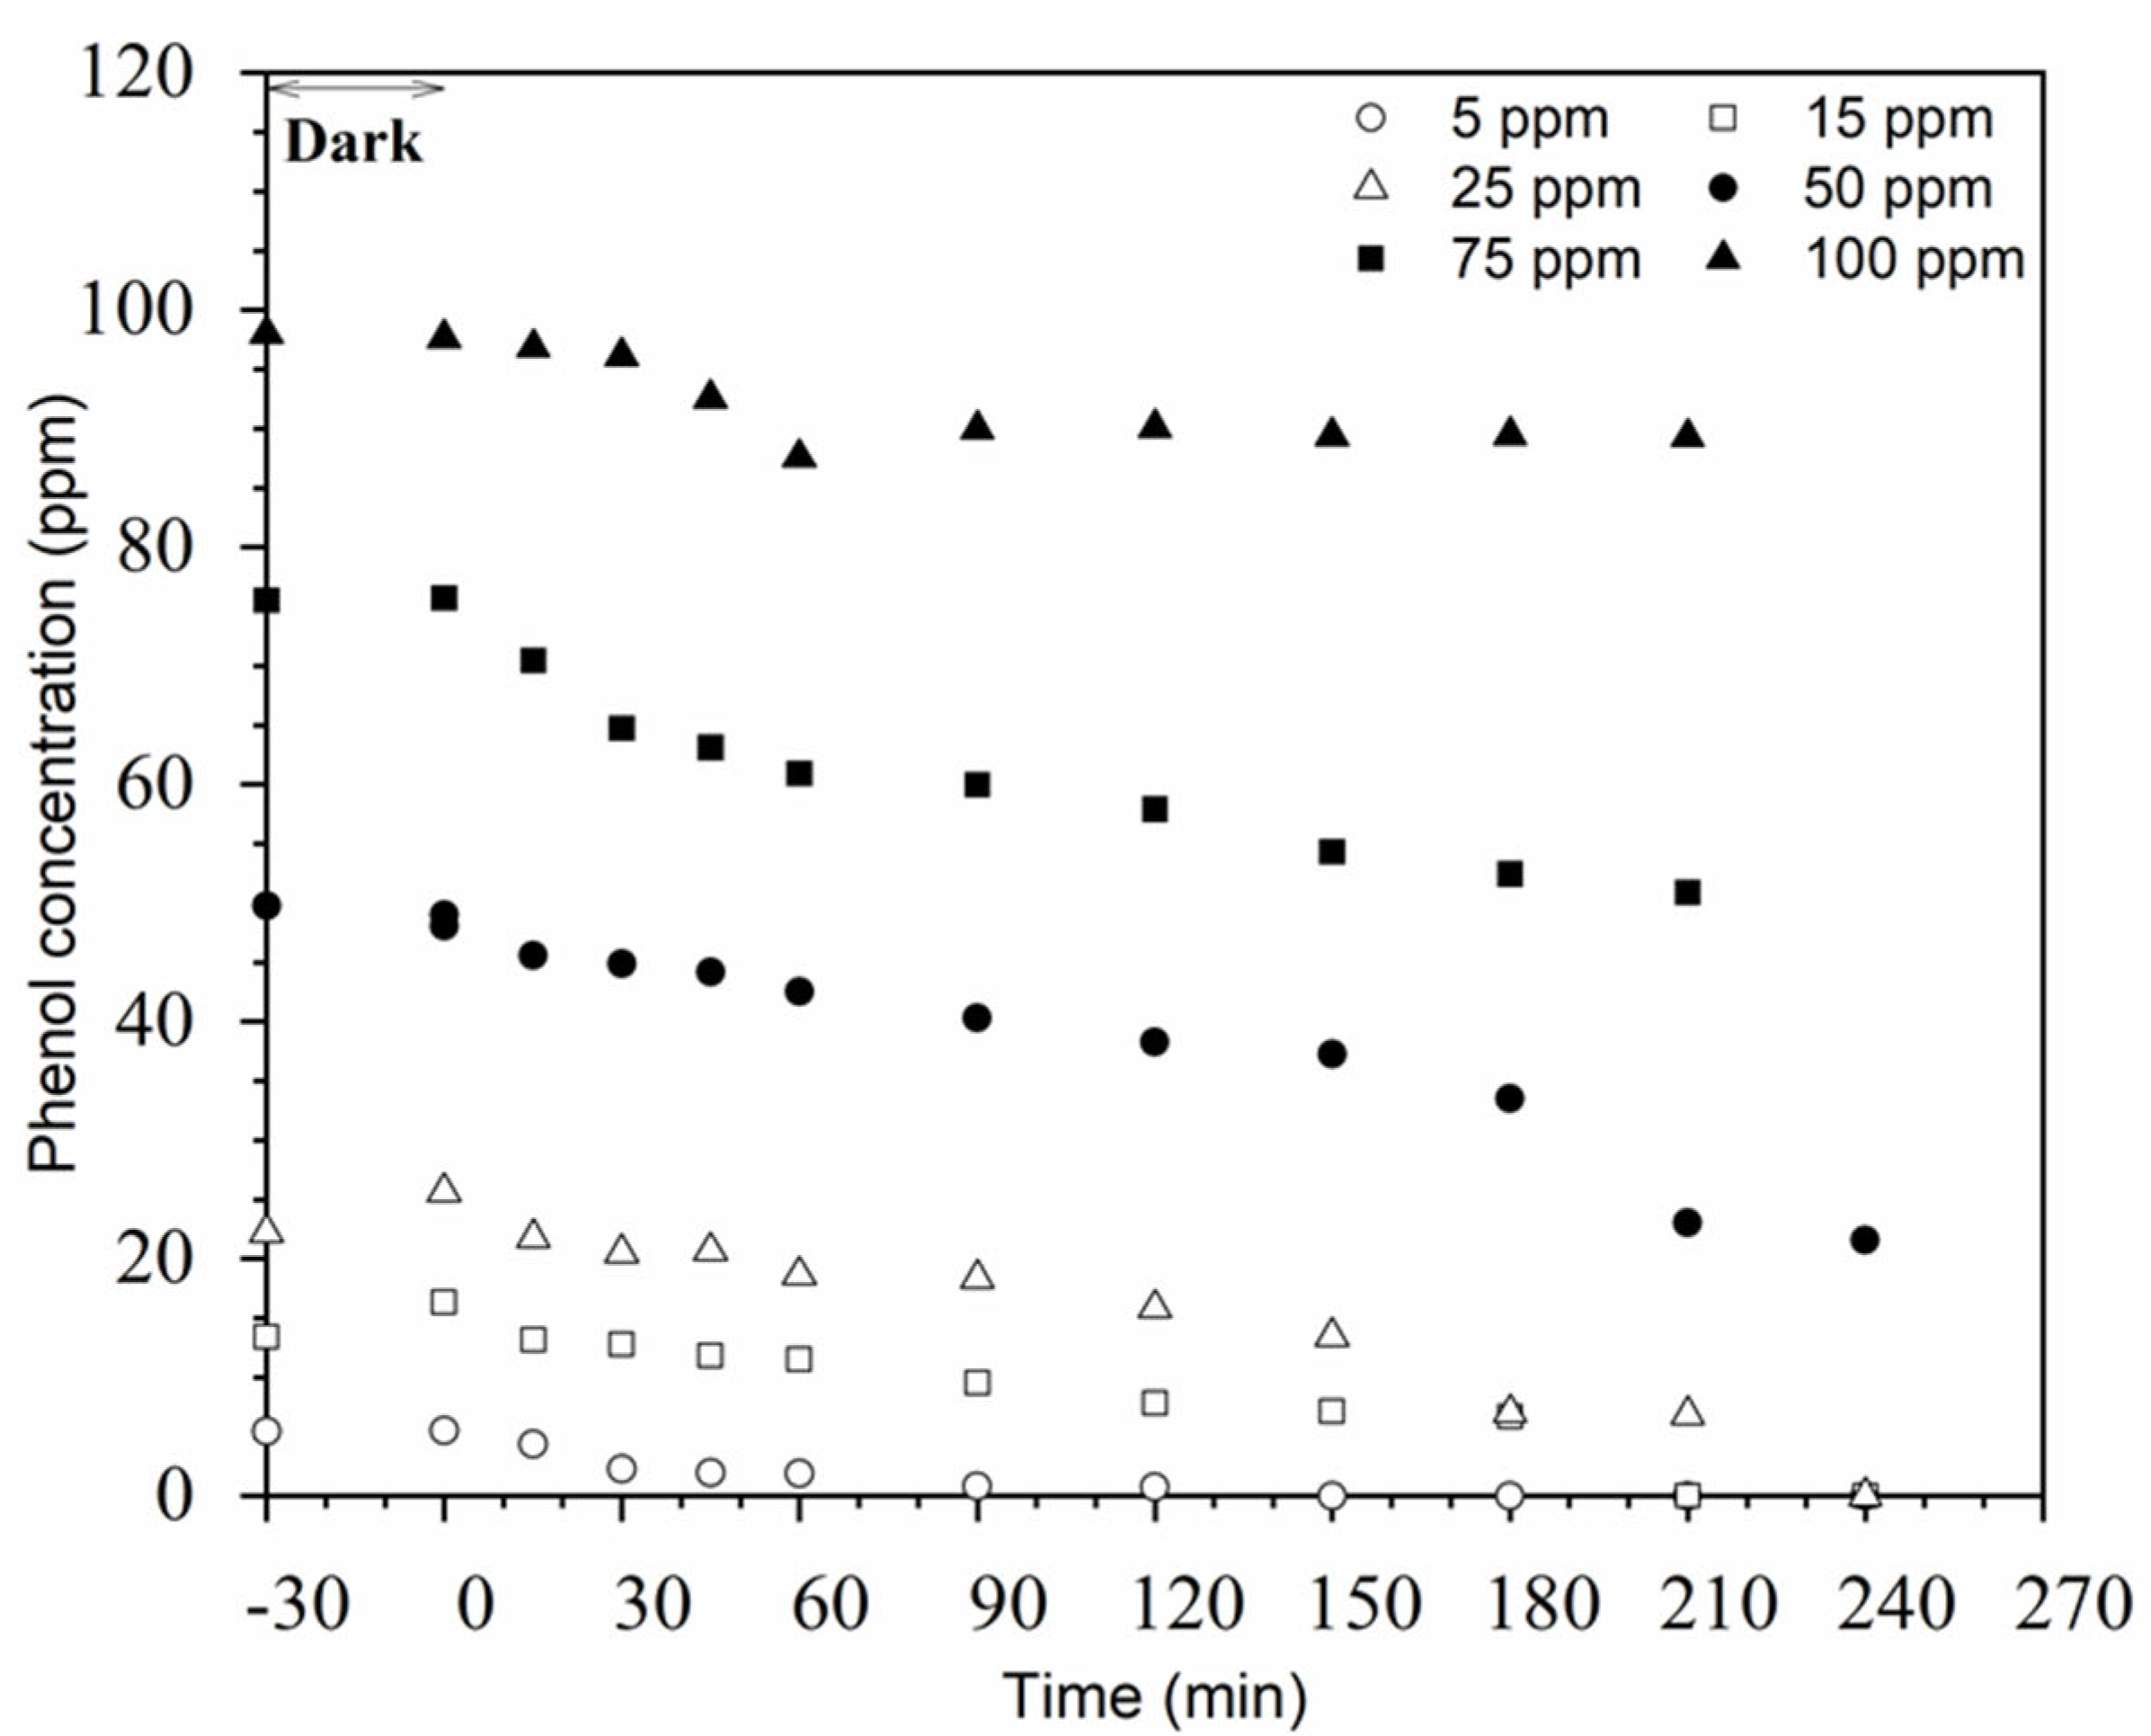
3.2.2. Effect of Initial Phenol Concentration

Pollutant concentration is one parameter in photocatalytic reaction studies that must be investigated. The effect of the initial phenol concentration (5–100 ppm) on the photocatalytic activity of POFNaOH/TiO2 under UV-C light irradiation is shown in Figure 7. The results show that by increasing the initial phenol concentration, the degradation efficiency decreases. Up to a phenol concentration of about 25 ppm, complete phenol degradation can be observed after 4 h. By further increasing the phenol concentration, the efficiency decreases, and more phenol remains in the reaction solution. For a phenol concentration of 100 ppm, the degradation efficiency is only 4%. It has to be mentioned that the removal efficiency is a relative value (in %), and even the removal is only 4% for the highest phenol concentration; the total phenol removal (in ppm) is high compared to the lowest investigated phenol concentrations. The lower degradation efficiency with increasing phenol concentration is a combination of different effects taking place simultaneously: (a) more phenol adsorbs onto the surface of POFNaOH/TiO2, (b) fewer photons are adsorbed by the photocatalyst and photons might be adsorbed by phenol, and c) the formation of hydroxyl radicals decreases since the number of adsorption sites for the hydroxyl ions decreases. These trends are also reported by other groups [15,42].

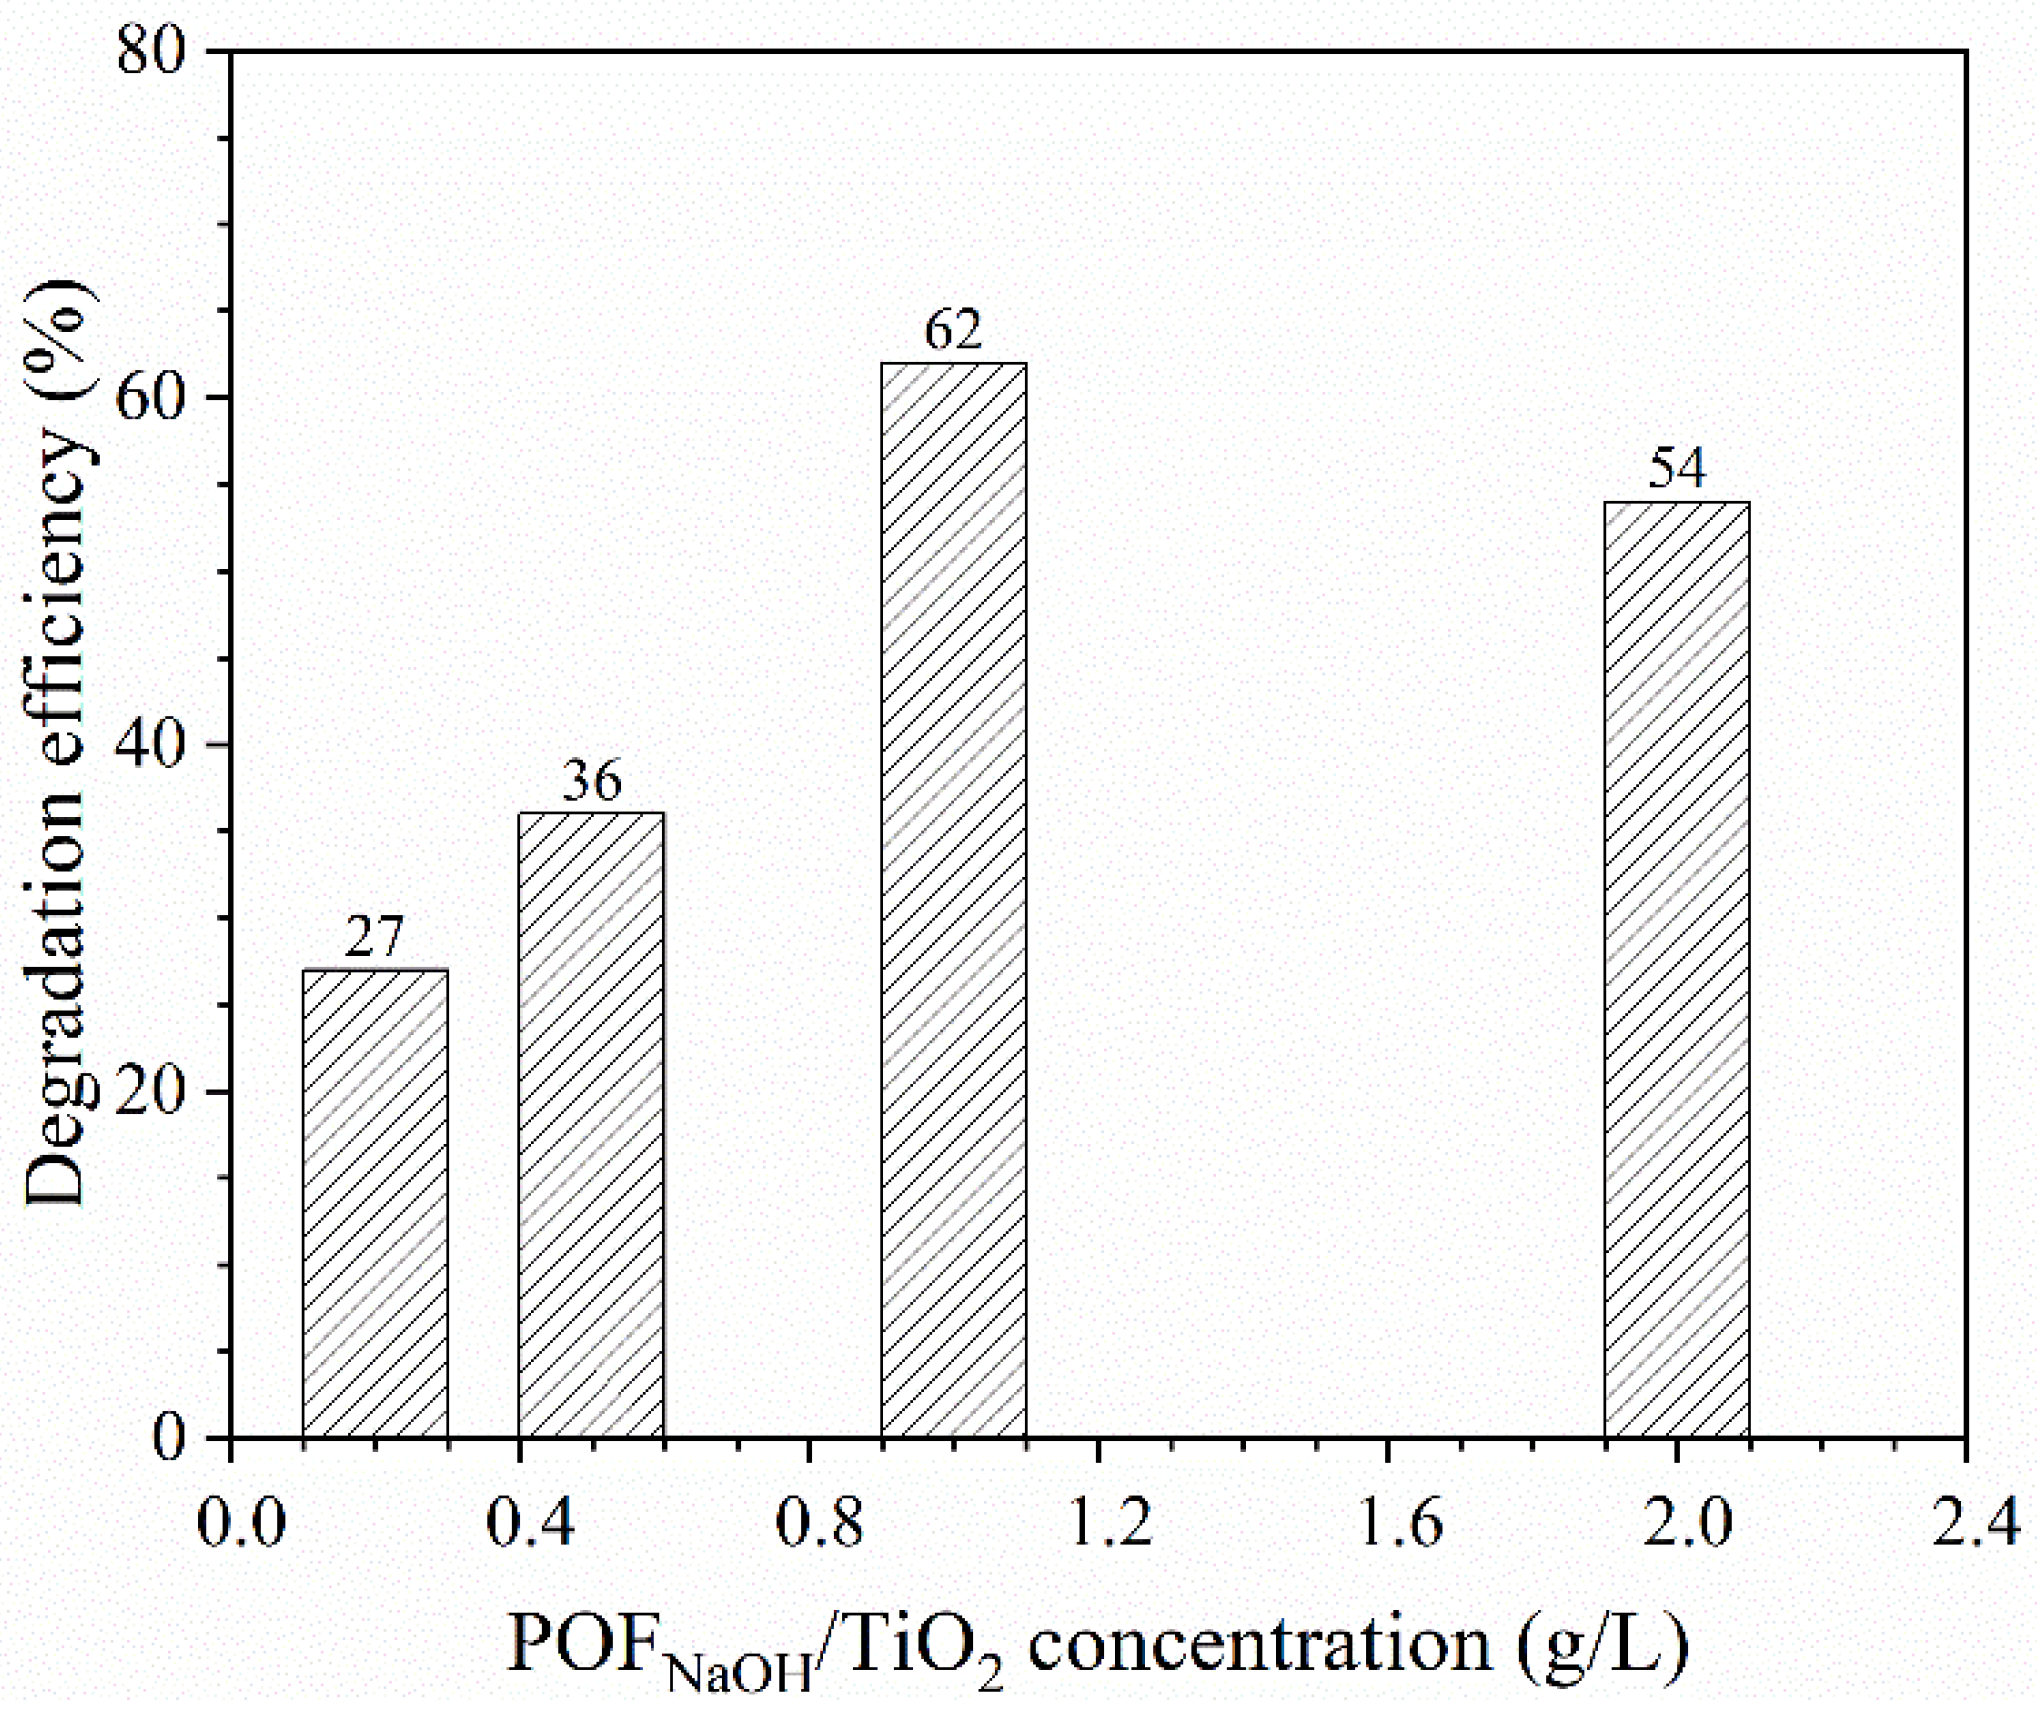
3.2.3. Effect of Catalyst Concentration

Figure 8 shows the effect of POFNaOH/TiO2 concentration on photocatalytic degradation of phenol in the range of 0.2–2 g/L. It is shown that a POFNaOH/TiO2 concentration of 1 g/L showed the best performance with a phenol degradation efficiency of 62%. It is observed that the photocatalytic efficiency decreases when the concentration of POFNaOH/TiO2 is increased further to 2 g/L. The photodegradation efficiency after 4 h irradiation time under UV-C light was increased from 27% at 0.2 g/L to 62%, which was the maximum. The decrease in efficiency was observed due to an increase in the amount of catalyst and low light penetration into the dispersion that was also reported in recent studies [22].
The effect of catalyst concentration was further evaluated by calculating the amount of degraded phenol per mass of catalyst (Table 2).
With increasing catalyst concentration, the number of adsorption/active sites increases, leading to higher degradation efficiency. An increase in the degradation efficiency was observed until 50 mg (1 g/L) of POFNaOH/TiO2. Although it is expected that a higher photocatalyst concentration should increase the phenol degradation efficiency, the opposite was observed at a higher POFNaOH/TiO2 concentration. Reasons for this behavior are: (a) with increasing POFNaOH/TiO2 concentration, the number of active sites increases, which results in an improved free hydroxyl radical formation [15], and (b) a higher POFNaOH/TiO2 concentration increases the turbidity of the solution and lowers the UV-C light penetration. Related results are shown in recent studies [15,42]. As the XPS analysis has shown a TiO2 content of about 14% in the POF/TiO2 sample, the degradation per mass of TiO2 was calculated. It has to be mentioned that XPS is related to the surface of the composite material that mainly consists of TiO2. There could be more TiO2 at deeper locations that is not detected by XPS due to the range limitation of this method and is expected not to take part in the photocatalytic reaction. Depending on the catalyst concentration, the degradation is between 7 and 20% per mg TiO2. In comparison to the photocatalytic experiment with dispersed P25 particles, with a degradation efficiency of 1.4% per mg P25, the immobilized TiO2 particles are much more active. The data can also be evaluated based on the surface area of the material. For P25, the surface area is 56 m2 g−1, and the activity is 25%/m2. For POF/TiO2 with a surface area of 45.8 m2 g−1, for the 50 mg sample, the activity is 27%/m2. Considering the XPS analysis, the amount of TiO2 in the composite material is lower and the specific activity is even higher than 27%/m2.

3.2.4. Effect of Light Source

As shown in Figure 3, the band-gap energy of POFNaOH/TiO2 is about 3.0 eV. Thus, to generate photons with the required energy, UV light is needed. However, the source of UV light can be different. Therefore, light sources having different fractions of UV light were investigated. Figure 9 shows the degradation efficiency of phenol under UV-C (maximum wavelength at 254 nm), UV-A (maximum wavelength at 365 nm), Xenon lamp (Xe-lamp) (200–2500 nm), LED light (400–800 nm with two maxima at 450 nm and 600 nm), and a sunlight simulator (300 W Xe-lamp equipped with an air mass 1.5 global filter). It is observed that only light sources with a higher fraction of UV light show a good performance for photocatalytic degradation of phenol. The highest degradation efficiency of 62% within 240 min of irradiation time was obtained for the UV-C lamp. In the case of the UV-A light, the efficiency was only 6.31%. For the Xe-lamp and the sunlight simulator, the efficiency was about 47% and 25%, respectively. The LED showed an efficiency of 2.4%. For TiO2 photocatalysts, only for UV light, enough electron-hole pairs are produced as indicated by other researchers, too [43]. The Xenon lamp and the sunlight simulator have a reasonable fraction of UV light, and that is the reason that they also show phenol degradation. However, the LED (visible light) is not able to produce enough electron-hole pairs for the photocatalytic reaction.
It should be mentioned that the light intensity of the different light sources was not equal in the experiments. The highest intensity had the Xe-lamp (about >10,000 W/m2). The intensities of the sunlight simulator and the LED were by a factor of 5–10 lower (about 1000–2000 W/m2). The intensity of the two UV lamps was much lower. However, the intensity is a result of the light spectrum and applied power. Here, the UV-C lamp showed much better performance than the Xe-lamp, even at a much lower intensity. In the case of the UV-C lamp, only one wavelength with the total intensity was used. For the Xe-lamp, the intensity was partitioned over several wavelengths, whereby a higher part belongs to the IR spectrum of the lamp.

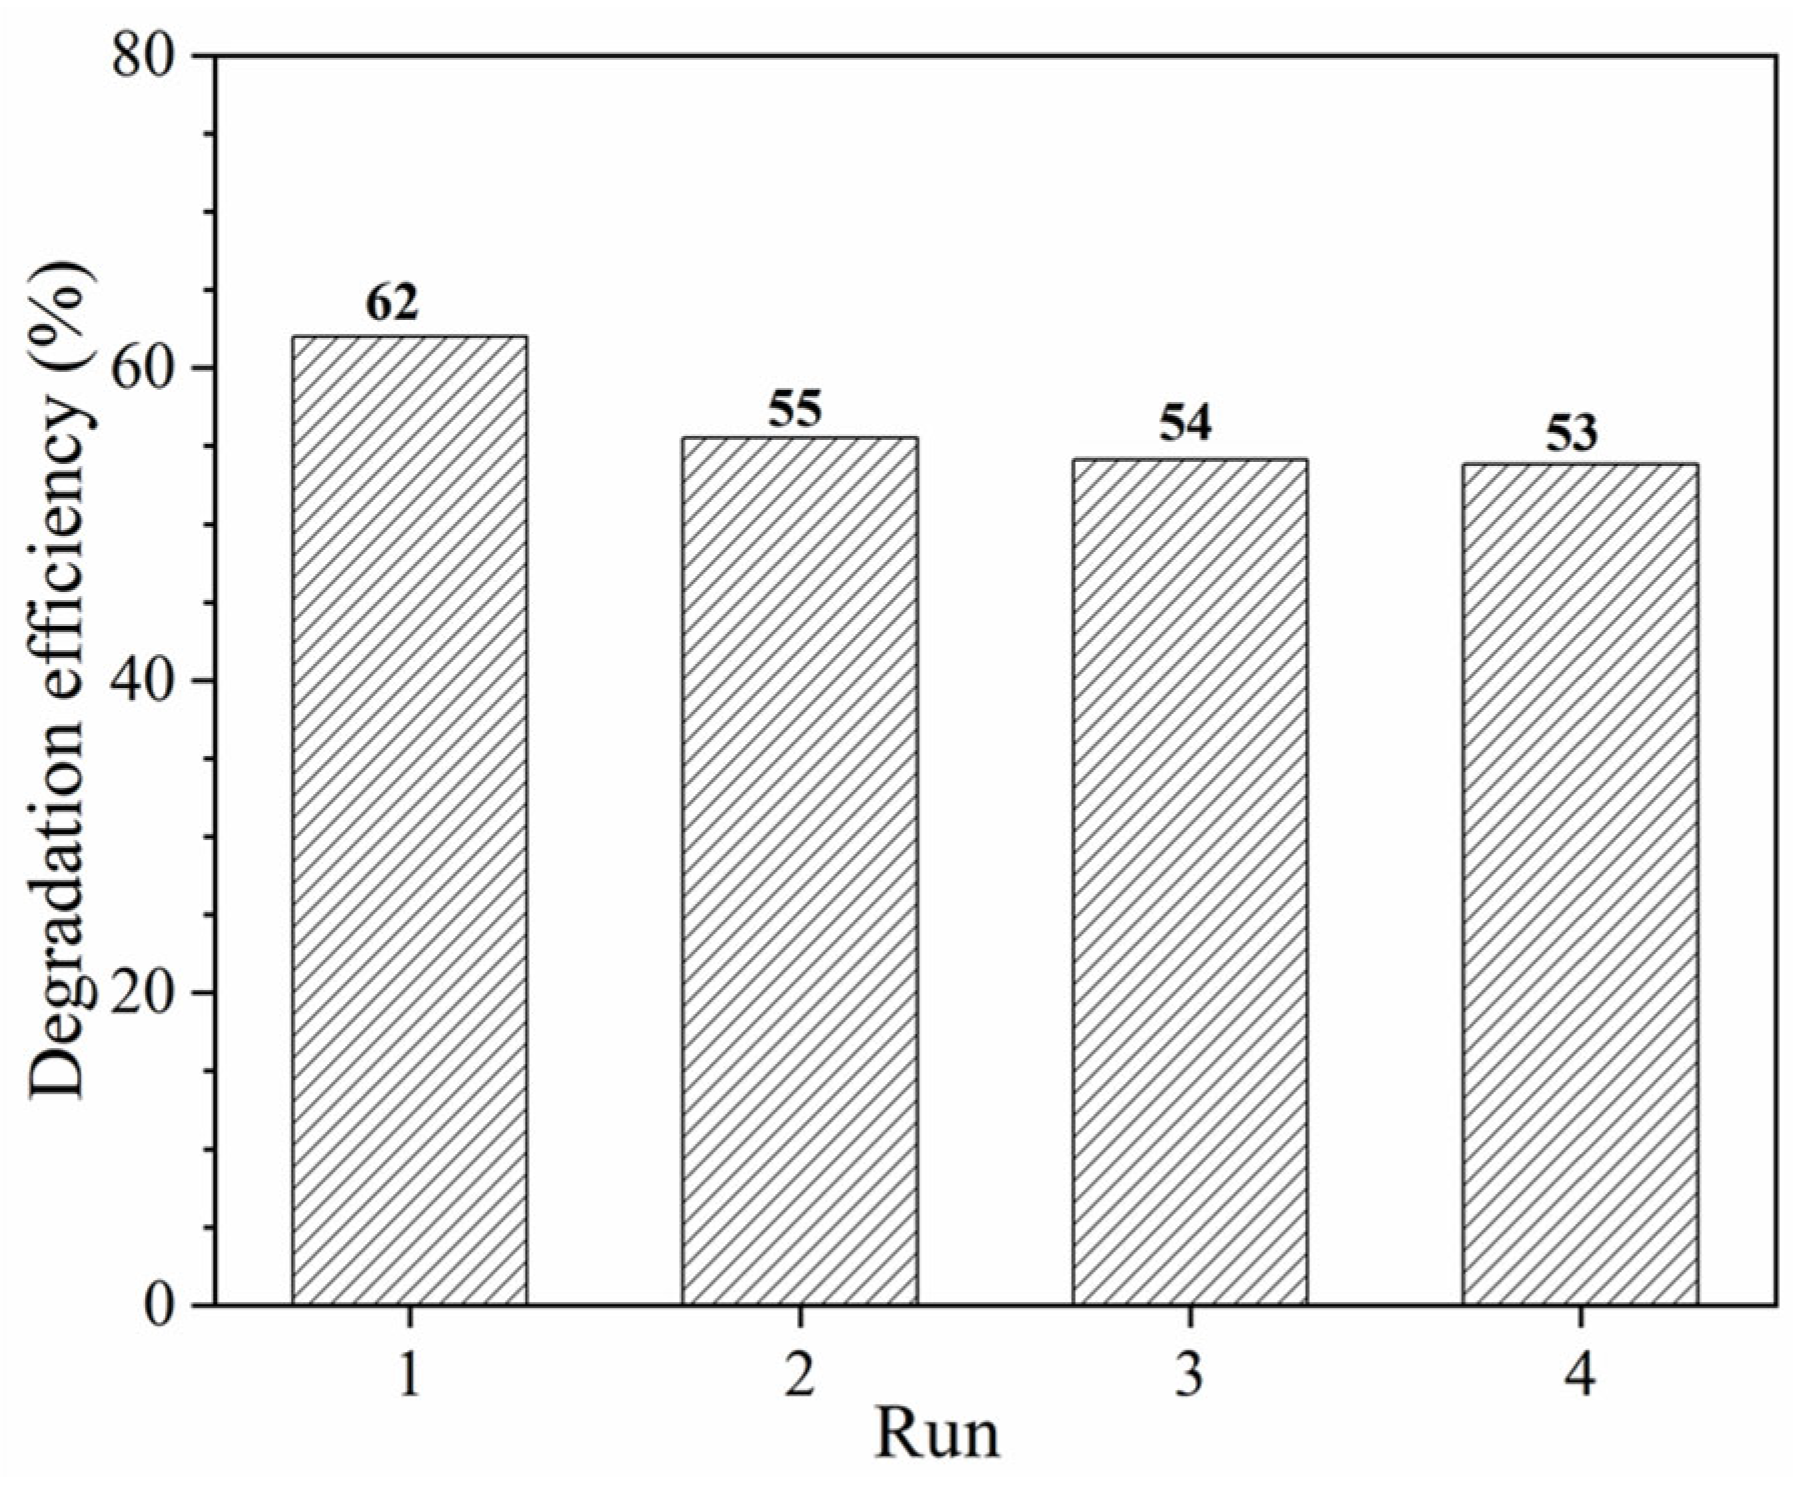
3.2.5. Recycling Test

The stability and the reusability of photocatalysts are important for practical application. To evaluate the recycling performance of the POFNaOH/TiO2 photocatalyst, four consecutive runs were performed at similar conditions: 50 ppm phenol, pH of 6.7, and 240 min UV-C irradiation. The results are shown in Figure 10.
It was observed that the phenol degradation efficiency decreased from 62% to 54% after four cycles. The recycling test confirms the ability to reuse the as-prepared photocatalyst. The decrease in efficiency might be a combination of different effects. The first effect is the handling of the POF/TiO2 catalyst between the individual runs. A small amount of the catalyst might be lost during catalyst separation and reuse. The second effect is based on the stability of the POF/TiO2 composite material. As shown in Figure 2d–f, a film of the TiO2 particles covers the surface of the fibers. During the handling and photocatalytic experiments, some TiO2 might detach from the surface and be dispersed into the phenolic solution. Usually, a stress test, e.g., handling of the supported catalyst in an ultrasonic bath, can be done to study the stability. However, the separation of the fibers and the TiO2 powder after the experiment is difficult. It is assumed that the TiO2 particles are fixed to the surface and that the loss of particles is low. The last effect is the adsorption of reaction intermediates. Even in the ideal case, where the contaminant is mineralized to water and CO2, reaction intermediates are formed. The reaction progress was studied using an HPLC system that only shows the change in the phenol concentration. How much of the phenol reacts to water and CO2 can be investigated by total organic carbon (TOC) measurement. In many cases, the TOC will show that carbon removal is less compared to the change in contaminant concentration via HPLC because of formed intermediates. The degradation of the intermediates might be more difficult, and they remain adsorbed at the POF/TiO2 surface. These intermediates will occupy adsorption places for phenol adsorption and hydroxyl radical formation. As a result, the activity will be lower. Although only four runs were performed with the catalyst, runs two to four with stable degradation efficiency indicate that further runs are possible in which the efficiency might become slightly lower.

3.2.6. Comparison with Literature Data

Table 3 gives an overview of the phenol degradation efficiency of POF/TiO2 in comparison to already published results. It should be mentioned that a direct comparison of photocatalytic results is a challenge due to the variety of experimental conditions. However, the results for POF/TiO2 are in the same order of magnitude.
In most of the cases, TiO2 was either modified with active co-catalysts or a higher TiO2 concentration was applied to obtain a higher degradation efficiency. Here, only P25 was used as the photocatalyst without any modification. Depending on the phenol concentration (Figure 7), the degradation efficiency was between 4% (100 ppm phenol) and 100% (up to 25 ppm phenol).

4. Conclusions

POF/TiO2 is a new composite material with high potential for its application in photocatalytic wastewater treatment. In this work, the POF/TiO2 photocatalyst was successfully prepared via a sol-gel route from Posidonia oceanica fibers as the support material and P25 as the TiO2 photocatalyst. Various types of biomasses, as Posidonia Oceanica, are candidates as support materials due to advantageous properties such as low density, low cost, durability, non-toxicity, abundant raw material, and recyclability. The synthesis has shown that POF can be used as a natural support to deposit TiO2. POF/TiO2 was characterized by different methods and shows a TiO2 layer on top of the fibers with the same optical properties (Eg = 3.0 eV) as bulk P25. The POF/TiO2 photocatalyst was studied for photocatalytic phenol degradation. A pre-treatment of the fibers with NaOH was beneficial concerning the photocatalytic activity. The highest photocatalytic efficiency for 50 ppm phenol after 4 hours of UV-C light irradiation with 1 g/L POF/TiO2 was about 62%. When the phenol concentration was decreased below 25 ppm, full degradation was achieved under the same reaction conditions. In contrast to suspended P25, less P25 is required in the composite material to achieve a good degradation efficiency. The immobilization of P25 onto the fibers as a thin film led to a better usage of the P25 photocatalyst particles. The POF/TiO2 photocatalyst was recycled three times, and about 15% of the catalytic activity was lost during the first recycling. Thereafter, the photocatalytic efficiency was almost constant. A combination of different effects such as catalyst loss, particle detachment from the POF surface, and adsorption of reaction intermediates might be the reason for the decrease in catalytic activity, whereby it is assumed that intermediate adsorption is the main reason. The new POF/TiO2 composite photocatalyst demonstrated an improvement of photocatalytic performance. However, some more investigations are necessary to prove the long-term chemical and mechanical stability of the composite material and the surface adsorption of reactants onto the POF surface, including intermediates.

Supplementary Materials

The following are available online at https://www.mdpi.com/article/10.3390/w13212948/s1, Figure S1: Schematic process of POF/TiO2 synthesis, Figure S2: Scheme for the photocatalytic degradation of phenol using POF/TiO2, Figure S3: EDX spectra of POF (left) and POF/TiO2 (right), Figure S4: N2 adsorption isotherms for POF/TiO2 (a), and adsorbed N2 volume for POF and POF/TiO2 (b).

Author Contributions

Conceptualization, M.S. (Mongi Seffen) and L.M.; validation, M.S. (Michael Schwarze) and M.T.; investigation, L.M.; resources, R.S.; writing—original draft preparation, L.M.; writing—review and editing, M.S (Mongi Seffen), M.S. (Michael Schwarze), M.T. and R.S.; supervision, M.S. (Mongi Seffen), M.T. and M.S. (Michael Schwarze). All authors have read and agreed to the published version of the manuscript.

Funding

The Federal Ministry of Education and Research of Germany, grant number 033RC003, Deutsche Forschungsgemeinschaft (DFG, German Research Foundation), grant number 390540038; Erasmus+, KA107; Euro-Mediterranean project, FP7 FP4BATIW.

Institutional Review Board Statement

Not applicable.

Informed Consent Statement

Not applicable.

Data Availability Statement

The data presented in this study are available on request from the corresponding author.

Acknowledgments

We acknowledge support by the German Research Foundation and the OpenAccess Publication Fund of TU Berlin.

Conflicts of Interest

The authors declare no conflict of interest.

References

  1. Anku, W.W.; Mamo, M.A.; Govender, P.P. Phenolic compounds in water: Sources, reactivity, toxicity and treatment methods. In Phenolic Compounds—Natural Sources, Importance and Applications; InTech: London, UK, 2017. [Google Scholar]
  2. Villegas, L.G.C.; Mashhadi, N.; Chen, M.; Mukherjee, D.; Taylor, K.E.; Biswas, N. A Short Review of Techniques for Phenol Removal from Wastewater. Curr. Pollut. Rep. 2016, 2, 157–167. [Google Scholar] [CrossRef] [Green Version]
  3. Yin, C.-Y.; Aroua, M.K.; Daud, W. Review of modifications of activated carbon for enhancing contaminant uptakes from aqueous solutions. Sep. Purif. Technol. 2007, 52, 403–415. [Google Scholar] [CrossRef]
  4. Ncibi, M.C.; Mahjoub, B.; Seffen, M. Biosorption of Phenol onto Posidonia oceanica (L.) Seagrass in Batch System: Equilibrium and Kinetic Modelling. Can. J. Chem. Eng. 2008, 84, 495–500. [Google Scholar] [CrossRef]
  5. Kankılıç, G.B.; Metin, A.; Tüzün, I. Phragmites australis: An alternative biosorbent for basic dye removal. Ecol. Eng. 2016, 86, 85–94. [Google Scholar] [CrossRef]
  6. Achak, M.; Hafidi, A.; Ouazzani, N.; Sayadi, S.; Mandi, L. Low cost biosorbent “banana peel” for the removal of phenolic compounds from olive mill wastewater: Kinetic and equilibrium studies. J. Hazard. Mater. 2009, 166, 117–125. [Google Scholar] [CrossRef] [PubMed]
  7. Guo, Z.; Ma, R.; Li, G. Degradation of phenol by nanomaterial TiO2 in wastewater. Chem. Eng. J. 2006, 119, 55–59. [Google Scholar] [CrossRef]
  8. Nobijari, L.A.; Schwarze, M.; Tasbihi, M. Photocatalytic Degradation of Phenol Using Photodeposited Pt Nanoparticles on Titania. J. Nanosci. Nanotechnol. 2020, 20, 1056–1065. [Google Scholar] [CrossRef]
  9. Yilleng, M.; Gimba, E.C.; Ndukwe, G.I.; Bugaje, I.M.; Rooney, D.W.; Manyar, H.G. Batch to continuous photocatalytic degradation of phenol using TiO2 and Au-Pd nanoparticles supported on TiO2. J. Environ. Chem. Eng. 2018, 6, 6382–6389. [Google Scholar] [CrossRef] [Green Version]
  10. Pop, C.-E.; Draga, S.; Măciucă, R.; Niță, R.; Crăciun, N.; Wolff, R. Bisphenol A Effects in Aqueous Environment on Lemna minor. Processes 2021, 9, 1512. [Google Scholar] [CrossRef]
  11. Garg, A.; Singhania, T.; Singh, A.; Sharma, S.; Rani, S.; Neogy, A.; Yadav, S.R.; Sangal, V.K.; Garg, N. Photocatalytic Degradation of Bisphenol-A using N, Co Codoped TiO2 Catalyst under Solar Light. Sci. Rep. 2019, 9, 765. [Google Scholar] [CrossRef]
  12. Ohko, Y.; Ando, I.; Niwa, C.; Tatsuma, T.; Yamamura, T.; Nakashima, T.; Kubota, Y.; Fujishima, A. Degradation of Bisphenol A in Water by TiO2 Photocatalyst. Environ. Sci. Technol. 2001, 35, 2365–2368. [Google Scholar] [CrossRef]
  13. Brunelli, A.; Pojana, G.; Callegaro, S.; Marcomini, A. Agglomeration and sedimentation of titanium dioxide nanoparticles (n-TiO2) in synthetic and real waters. J. Nanoparticle Res. 2013, 15, 1684. [Google Scholar] [CrossRef]
  14. Akkari, M.; Aranda, P.; Ben Rhaiem, H.; Amara, A.B.H.; Ruiz-Hitzky, E. ZnO/clay nanoarchitectures: Synthesis, characterization and evaluation as photocatalysts. Appl. Clay Sci. 2016, 131, 131–139. [Google Scholar] [CrossRef]
  15. Hadjltaief, H.B.; Ben Ameur, S.; Da Costa, P.; Ben Zina, M.; Galvez, M.E. Photocatalytic decolorization of cationic and anionic dyes over ZnO nanoparticle immobilized on natural Tunisian clay. Appl. Clay Sci. 2018, 152, 148–157. [Google Scholar] [CrossRef]
  16. Liu, Z.F.; Liu, Z.C.; Wang, Y.; Li, Y.B.; Qu, L.; E, L.; Ya, J.; Huang, P.Y. Photocatalysis of TiO 2 nanoparticles supported on natural zeolite. Mater. Technol. 2012, 27, 267–271. [Google Scholar] [CrossRef]
  17. Jansson, I.; Suárez, S.; Garcia, F.R.G.; Sanchez, B. Zeolite–TiO 2 hybrid composites for pollutant degradation in gas phase. Appl. Catal. B Environ. 2015, 178, 100–107. [Google Scholar] [CrossRef]
  18. Karthikeyan, K.; Nithya, A.; Jothivenkatachalam, K. Photocatalytic and antimicrobial activities of chitosan-TiO 2 nanocomposite. Int. J. Biol. Macromol. 2017, 104, 1762–1773. [Google Scholar] [CrossRef] [PubMed]
  19. Haldorai, Y.; Shim, J.-J. Novel chitosan-TiO2 nanohybrid: Preparation, characterization, antibacterial, and photocatalytic properties. Polym. Compos. 2014, 35, 327–333. [Google Scholar] [CrossRef]
  20. Hosseini, S.; Borghei, S.M.; Vossoughi, M.; Taghavinia, N. Immobilization of TiO2 on perlite granules for photocatalytic degradation of phenol. Appl. Catal. B Environ. 2007, 74, 53–62. [Google Scholar] [CrossRef]
  21. Garusinghe, U.M.; Raghuwanshi, V.S.; Batchelor, W.; Garnier, G. Water Resistant Cellulose—Titanium Dioxide Composites for Photocatalysis. Sci. Rep. 2018, 8, 2306. [Google Scholar] [CrossRef] [Green Version]
  22. Sintayehu, Y.D.; Gemeta, A.B.; Berehe, S.G. Optical Photocatalytic Degradation of Methylene Blue Using Lignocellulose Modified TiO2. Am. J. Opt. Photonics 2017, 5, 55. [Google Scholar] [CrossRef] [Green Version]
  23. Ncibi, M.C.; Mahjoub, B.; Seffen, M. Étude de la biosorption du chrome (VI) par une biomasse méditerranéenne: Posidonia oceanica (L.) delile. Rev. Sci. Eau 2008, 21, 441–449. [Google Scholar] [CrossRef] [Green Version]
  24. Ncibi, M.C.; Mahjoub, B.; Seffen, M. Studies on the Biosorption of Textile Dyes from Aqueous Solutions Using Posidonia Oceanica (L.) Leaf Sheath Fibres. Adsorpt. Sci. Technol. 2006, 24, 461–474. [Google Scholar] [CrossRef]
  25. Ncibi, M.C.; Mahjoub, B.; Seffen, M. Adsorption de colorant métallifère par les fibres de Posidonia oceanica. J. Environ. Eng. Sci. 2008, 7, 645–650. [Google Scholar] [CrossRef]
  26. White, L.; Koo, Y.; Yun, Y.; Sankar, J. TiO2 Deposition on AZ31 Magnesium Alloy Using Plasma Electrolytic Oxidation. J. Nanomater. 2013, 2013, 319437. [Google Scholar] [CrossRef] [Green Version]
  27. Tasbihi, M.; Kete, M.; Raichur, A.M.; Tušar, N.N.; Štangar, U.L. Photocatalytic degradation of gaseous toluene by using immobilized titania/silica on aluminum sheets. Environ. Sci. Pollut. Res. 2012, 19, 3735–3742. [Google Scholar] [CrossRef]
  28. Tasbihi, M.; Călin, I.; Šuligoj, A.; Fanetti, M.; Štangar, U.L. Photocatalytic degradation of gaseous toluene by using TiO2 nanoparticles immobilized on fiberglass cloth. J. Photochem. Photobiol. A Chem. 2017, 336, 89–97. [Google Scholar] [CrossRef]
  29. Moral, A.; Aguado, R.; Roldán, R.; Tijero, A.; Ballesteros, M. Soda-anthraquinone pulping and cationization of Posidonia oceanica. BioResources 2019, 14, 9228–9243. [Google Scholar] [CrossRef]
  30. Masri, M.A.; Younes, S.; Haack, M.; Qoura, F.; Mehlmer, N.; Brück, T. A Seagrass-Based Biorefinery for Generation of Single-Cell Oils for Biofuel and Oleochemical Production. Energy Technol. 2018, 6, 1026–1038. [Google Scholar] [CrossRef] [Green Version]
  31. Allègue, L.; Zidi, M.; Sghaier, S. Mechanical properties of Posidonia oceanica fibers reinforced cement. J. Compos. Mater. 2015, 49, 509–517. [Google Scholar] [CrossRef]
  32. Natarajan, K.; Natarajan, T.S.; Bajaj, H.; Tayade, R.J. Photocatalytic reactor based on UV-LED/TiO2 coated quartz tube for degradation of dyes. Chem. Eng. J. 2011, 178, 40–49. [Google Scholar] [CrossRef]
  33. Guayaquil-Sosa, J.; Rosales, B.S.; Valadés-Pelayo, P.; De Lasa, H. Photocatalytic hydrogen production using mesoporous TiO2 doped with Pt. Appl. Catal. B Environ. 2017, 211, 337–348. [Google Scholar] [CrossRef]
  34. Stevie, F.A.; Donley, C.L. Introduction to x-ray photoelectron spectroscopy. J. Vac. Sci. Technol. A 2020, 38, 063204. [Google Scholar] [CrossRef]
  35. Allouche, F.-N.; Mameri, N.; Guibal, E. Pb(II) biosorption on Posidonia oceanica biomass. Chem. Eng. J. 2011, 168, 1174–1184. [Google Scholar] [CrossRef]
  36. Zheng, F.; Wang, Z.; Chen, J.; Li, S. Synthesis of carbon quantum dot-surface modified P25 nanocomposites for photocatalytic degradation of p-nitrophenol and acid violet 43. RSC Adv. 2014, 4, 30605–30609. [Google Scholar] [CrossRef]
  37. Azeez, F.; Al-Hetlani, E.; Arafa, M.; Abdelmonem, Y.; Nazeer, A.A.; Amin, M.O.; Madkour, M. The effect of surface charge on photocatalytic degradation of methylene blue dye using chargeable titania nanoparticles. Sci. Rep. 2018, 8, 7104. [Google Scholar] [CrossRef] [PubMed]
  38. Onuaguluchi, O.; Banthia, N. Plant-based natural fibre reinforced cement composites: A review. Cem. Concr. Compos. 2016, 68, 96–108. [Google Scholar] [CrossRef]
  39. Reddy, K.O.; Zhang, J.; Zhang, J.; Rajulu, A.V. Effect of Alkali Treatment on the Properties of Century Fiber. J. Nat. Fibers 2013, 10, 282–296. [Google Scholar] [CrossRef]
  40. Garcia-Garcia, D.; Quiles-Carrillo, L.; Montanes, N.; Fombuena, V.; Balart, R. Manufacturing and Characterization of Composite Fibreboards with Posidonia oceanica Wastes with an Environmentally-Friendly Binder from Epoxy Resin. Materials 2017, 11, 35. [Google Scholar] [CrossRef] [Green Version]
  41. Sakti, S.P.; Santjojo, D. Improvement of Biomolecule Immobilization on Polystyrene Surface by Increasing Surface Roughness. J. Biosens. Bioelectron. 2012, 3, 3. [Google Scholar] [CrossRef]
  42. Huang, M.; Xu, C.; Wu, Z.; Huang, Y.; Lin, J.; Wu, J. Photocatalytic discolorization of methyl orange solution by Pt modified TiO2 loaded on natural zeolite. Dyes Pigments 2008, 77, 327–334. [Google Scholar] [CrossRef]
  43. Kibanova, D.; Cervini-Silva, J.; Destaillats, H. Efficiency of Clay−TiO2 Nanocomposites on the Photocatalytic Elimination of a Model Hydrophobic Air Pollutant. Environ. Sci. Technol. 2009, 43, 1500–1506. [Google Scholar] [CrossRef] [Green Version]
  44. Galedari, N.A.; Rahmani, M.; Tasbihi, M. Preparation, characterization, and application of ZnO@SiO2 core–shell structured catalyst for photocatalytic degradation of phenol. Environ. Sci. Pollut. Res. 2017, 24, 12655–12663. [Google Scholar] [CrossRef] [PubMed]
  45. Ashouri, R.; Ghasemipoor, P.; Rasekh, B.; Yazdian, F.; Mofradnia, S.R.; Fattahi, M. The effect of ZnO-based carbonaceous materials for degradation of benzoic pollutants: A review. Int. J. Environ. Sci. Technol. 2019, 16, 1729–1740. [Google Scholar] [CrossRef]
Figure 1. XRD pattern of POF and POF/TiO2.
Water 13 02948 g001
Figure 2. SEM images of POF (ac) and POF/TiO2 (df).
Water 13 02948 g002
Figure 3. Tauc plot for POF/TiO2.
Water 13 02948 g003
Figure 4. XPS survey scan for POF (left) and POF/TiO2 (right).
Water 13 02948 g004
Figure 5. XPS spectra for the main elements in POF (a,b) and POF/TiO2 (ce).
Water 13 02948 g005
Figure 6. Effect of chemical pre-treatment ([Phenol]0 = 50 mg/L; mPOF/TiO2 = 50 mg; cPOF/TiO2 = 1 g/L, mP25 = 50 mg, cP25 = 1 g/L, λ = 254 nm; Vphenol = 50 mL; pH = 6.7).
Water 13 02948 g006
Figure 7. Effect of initial phenol concentration (mPOF/TiO2 = 50 mg; cPOF/TiO2 = 1 g/L, λ = 254 nm; Vphenol = 50 mL; pH = 6.7).
Water 13 02948 g007
Figure 8. Effect of POFNaOH/TiO2 concentration ([Phenol]0 = 50 mg/L; λ = 254 nm; Vphenol = 50 mL; pH = 6.7, t = 4 h).
Water 13 02948 g008
Figure 9. Impact of light source on photocatalytic degradation efficiency (1: UV-C; 2: Xe-lamp; 3: Sunlight simulator; 4: UV-A; 5: LED; mPOF/TiO2 = 50 mg; cPOF/TiO2 = 1 g/L, [Phenol]0 = 50 mg/L; Vphenol = 50 mL; pH = 6.7, t = 4 h).
Water 13 02948 g009
Figure 10. Recycling of POFNaOH/TiO2 (mPOF/TiO2 = 50 mg; cPOF/TiO2 = 1 g/L, λ = 254 nm; [Phenol]0 = 50 mg/L; pH = 6.7, t = 4 h).
Water 13 02948 g010
Table 1. Composition of POF and POF/TiO2 from XPS analysis.
POFPOF/TiO2
ElementFraction (%)Energy (eV)Fraction (%)Energy (eV)
C1s49.1285.1616.2286.04
O1s38.3531.9258.9532.63
Al2p2.974.161.575.01
S2p2.9 -
Si2p6.3102.2213.6103.29
N1s3.0399.881.6401.63
Fe2p0.7711.36--
Na1s0.31072.03--
Mg1s0.81304.05--
Ca2p1.3347.01--
Ti2p--8.2459.15
Table 2. Effect of POF/TiO2 concentration ([Phenol]0 = 50 mg/L; λ = 254 nm; Vphenol = 50 mL; pH = 6.7, t = 4 h) on photocatalytic efficiency.
mPOFNaOH/TiO2 (mg)Catalyst (g/L)Degradation (%)Degradation/mPOF/TiO2 (%/mg)Degradation/mTiO2, XPS (%/mg) *
100.2272.719.3
250.5361.4410.3
501621.248.9
1002541.027.3
* Value is calculated based on the estimated XPS result for TiO2.
Table 3. Comparison of photocatalytic results for phenol degradation.
Catalyst
(g/L)
TiO2
(g/L)
Phenol Removal
(%)
Phenol Concentration
(mg/L)
Illumination Time
(min)
Ref.
GO/TiO2
(1)
1.0010014180[21]
C-TiO2
(0.5)
0.507050180[22]
Fe-S-TiO2
(0.8)
0.8099.420600[44]
Ag/TiO2
(2)
2.0092.95.6720[45]
POF/TiO2
(1)
0.146250240Present study
POF/TiO2
(1)
0.1410025240Present study
Publisher’s Note: MDPI stays neutral with regard to jurisdictional claims in published maps and institutional affiliations.

