
Removal of Aqueous Para-Aminobenzoic Acid Using a Compartmental Electro-Peroxone Process


1
Key Laboratory of Integrated Regulation and Resource Development on Shallow Lakes of Ministry of Education, College of Environment, Hohai University, Nanjing 210098, China
2
Hydrology and Water Resources Bureau of Henan Province, Zhengzhou 450004, China
*
Author to whom correspondence should be addressed.
Water 2021, 13(21), 2961; https://doi.org/10.3390/w13212961
Submission received: 28 September 2021
/
Revised: 14 October 2021
/
Accepted: 18 October 2021
/
Published: 20 October 2021
(This article belongs to the Special Issue Ecological Risk Assessment of Emerging Pollutants in Drinking Water)
Abstract
:The presence of emerging contaminant para-aminobenzoic acid (PABA) in the aquatic environment or drinking water has the potential to harm the aquatic ecosystem and human health. In this work, the removal of aqueous PABA by a compartmental electro-peroxone (E-peroxone) process was systematically investigated from the kinetic and mechanism viewpoints. The results suggest that single electrolysis or ozonation was inefficient in PABA elimination, and the combined E-peroxone yielded synergistic target pollutant degradation. Compared to the conventional E-peroxone oxidation, the sequential cathodic reactions, followed by anodic oxidations, improved the PABA removal efficiency from ~63.6% to ~89.5% at a 10-min treatment, and the corresponding pseudo first-order kinetic reaction rate constant increased from ~1.6 × 10⁻³ to ~3.6 × 10⁻³ s−1. Moreover, the response surface methodology (RSM) analysis indicated that the appropriate increase of inlet ozone concentration, applied current density, initial solution pH value, and solution temperature could accelerate the PABA degradation, while the excess of these operational parameters would have a negative effect on the treatment efficiency. The comparation tests revealed that the coupling of electrolysis and ozonation could synergistically produce hydroxyl radicals (HO•) and the separation of cathodic reactions and anodic oxidations further promoted the HO• generation, which was responsible for the enhancement of PABA elimination in the compartmental E-peroxone process. These observations imply that the compartmental E-peroxone process has the potential for aqueous micropollutants elimination, and the reaction conditions that favor the reactive oxygen species generation are critical for the treatment efficiency.
1. Introduction
Ultraviolet (UV) filters are emerging contaminants that have drawn extensive attention, due to their potential risks to ecosystems and human health [1,2,3]. Para-aminobenzoic acid (PABA) is one of the most widely used UV filters. The continuous discharge of PABA into the aquatic environment via personal care applications has induced particular concerns [4]. Evidence has shown that PABA could increase the photosensitivity [5]. Consequently, the removal of PABA from water and wastewater is of great importance.
In the past few years, advanced oxidation processes (AOPs) have been investigated to remove PABA from water [6,7,8,9]. AOPs can produce high reactive species to oxidize organic compounds completely. However, the single process usually has some shortcomings, such as high cost and inefficient treatment. The combination of several methods may yield a higher performance than individual processes. Recently, electro-peroxone (E-peroxone)—the combination of ozonation and electrolysis with a carbon-based cathode—has been recommended as an excellent water treatment technology with low cost and mild operating conditions [10]. An important characteristic of E-peroxone is that ozone and H2O2 can be electro-generated in situ to produce hydroxyl radicals (HO•), thus the storage of reagents can be avoided [11,12]. Moreover, E-peroxone exhibited a much better performance than single ozonation or electrolysis, and was shown to be more cost-effective [13], convenient and safe [14,15]. In the E-peroxone process, contaminants can be directly transformed by electron transfer on the electrode surface and degraded by the introduced O3 and intermediated HO• [16]. Thanks to the employment of carbon-based cathode, the two-electron reduction of oxygen can produce H2O2 in situ to react with O3, and then significantly enhance O3 decomposition to form HO•. It is possible to improve the treatment efficiency by cathode modification [17].
Although the E-peroxone process has many advantages, it still contains some deficiencies, such as the low ozone utilization and the lack of a large area cathode. Hitherto, the reported E-peroxone processes were mainly performed in semi-batch reactors, which fed O2/O3 mixed gas into an undivided electrochemical reactor [18]. As restricted to the preparation method, the gas diffusion cathodes (GDCs) used in the E-peroxone process had a small area. This means that the mass transfer of reactants to the electrodes might be restricted, and the political application of this technology in water and wastewater treatment is difficult. Moreover, due to the very short gas–liquid contact time, only a small part of the introduced ozone could be used [19]. Therefore, developing an efficient reactor and optimizing technique parameters were recommended to improve the E-peroxone treatment efficiency [20,21]. However, few systematic studies have investigated the use of this coupled process for the emerging contaminant PABA elimination, and the effects of cathodic and anodic reactions’ separation on E-peroxone treatment efficiency is largely unknown.
The aims of this study were: (1) Evaluating the effectiveness of compartmental E-peroxone treatment in aqueous PABA removal; (2) Investigating and optimizing the effects of operational parameters (i.e., inlet ozone concentration, applied current density, initial solution pH, and solution temperature) on treatment efficiency by response surface methodology (RSM); (3) Elucidating the possible oxidation mechanisms via oxidants determination and their generation pathways analysis.
2. Materials and Methods
2.1. Chemicals and Reagents
The cation-exchange membrane (CEM) was purchased from Hangzhou Lvhe Environmental Technology Co., Ltd., Hangzhou, Zhejiang, China. PABA (its characteristics and structure were listed in Table 1), potassium indigo trisulfonate and p-chlorobenzoic acid (pCBA) were supplied by Sigma Aldrich, St. Louis, MI, USA. Multi-walled CNTs (30–50 nm of outer diameter, Purity > 98%) were provided by Chengdu Organic Chemistry Co., Ltd., Chinese Academy of Sciences, Chengdu, Sichuan, China. All the chemical reagents were at least of analytical grade without further purification.
2.2. Experimental Apparatus and Conditions
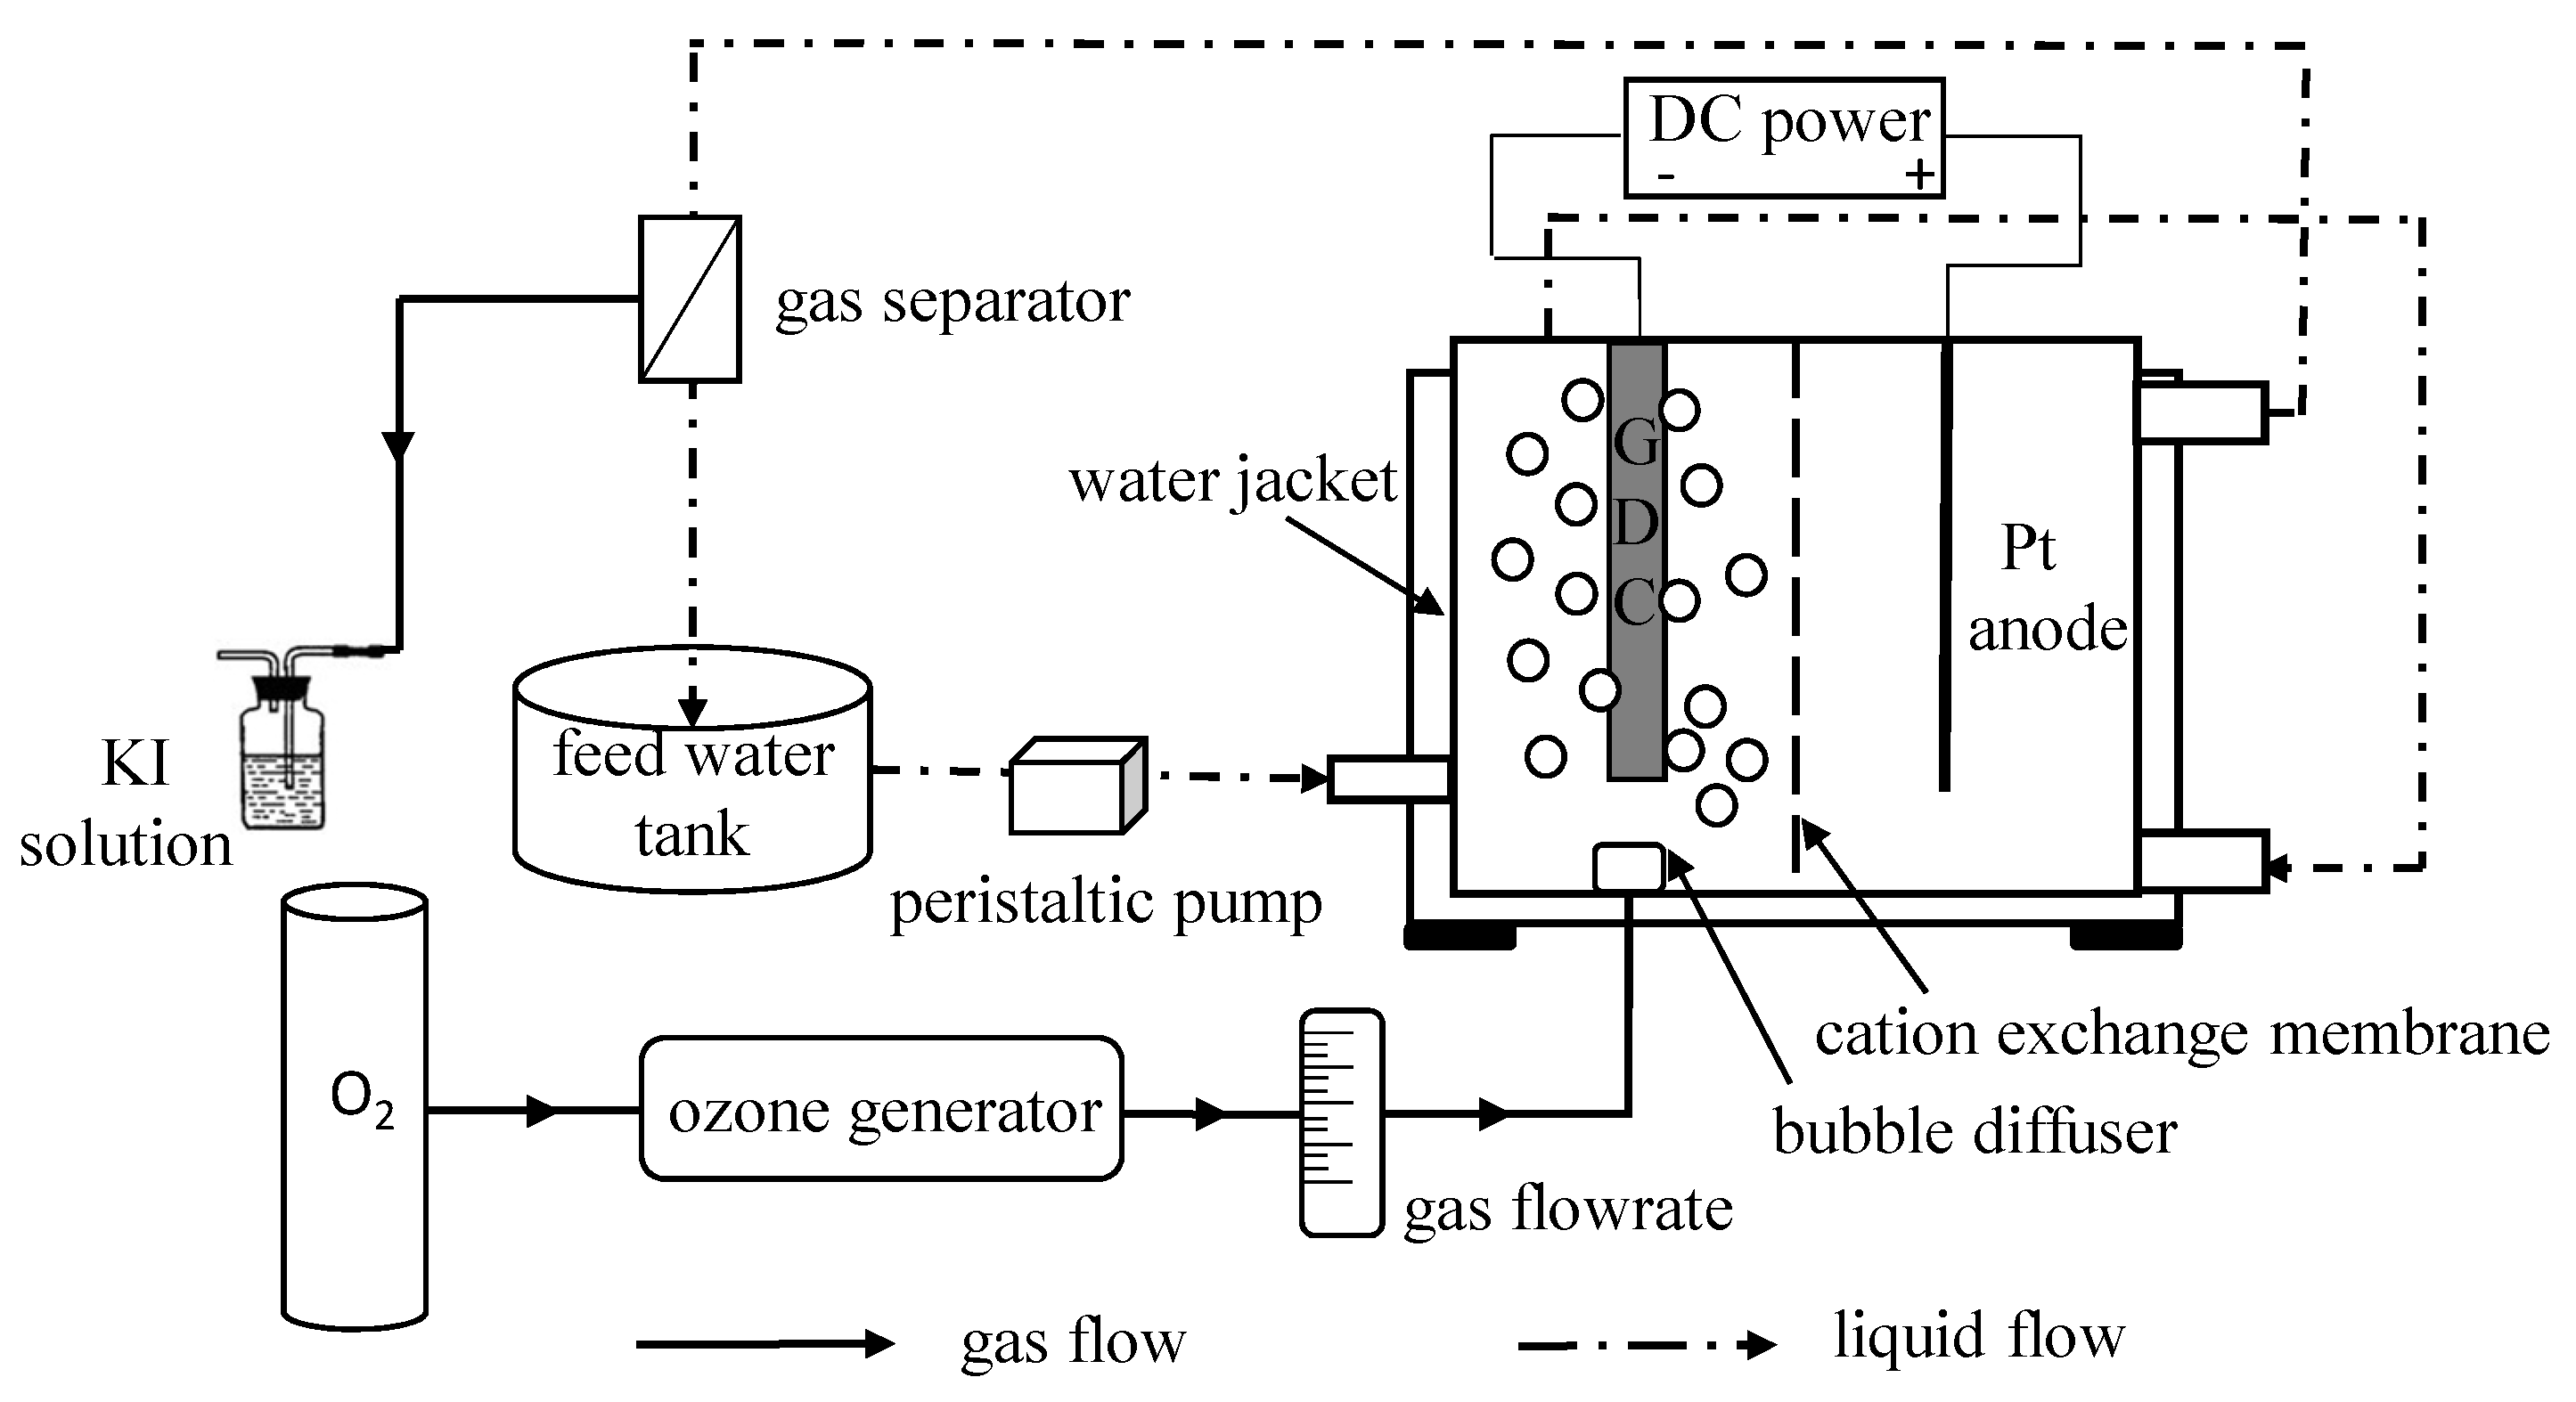
Experiments were performed in a separated E-peroxone system that contained a divided electrochemical reactor and a feed tank (Figure 1). In the center of the electrochemical reactor there was a removable CEM, which divided the reactor into two chambers. Each chamber had a width of 30 mm, a length of 30 mm, and a height of 30 mm. A 5 cm2 ferrite modified carbon nanotubes-based GDC and a Pt anode were parallelly fixed in the cathode chamber and anode chamber, respectively. The GDC was prepared according to the method described elsewhere [17]. The gap between two electrodes was 15 mm, and the constant current was provided by a DC power supply (KPS-3030DA, Atten Technology, Shenzhen, Guangdong, China). Firstly, the raw water (1.0 L) was pumped from the feed tank to the cathode chamber. After sequential passing through the cathode chamber and anode chamber, the solution flowed back into the feed tank. The whole reaction system was kept circulating by a peristaltic pump (YZ1515, Tianjin Xieda Exectron Co., Ltd., Tianjin, China). Ozone was produced from pure oxygen by a laboratory ozone generator (WH-H-Y5, Wohuan Technology Industry Co., Ltd., Nanjing, Jiangsu, China), which could adjust the produced O3 concentration by changing the power. In the ozone related process, 0.2 L/min ozonized gas was fed into the cathode chamber via a bubble diffuser that was situated under the cathode, and equal pure oxygen was used in the sole electrolysis system. For comparison, the CEM was removed from the electrochemical reactor in the termed conventional E-peroxone tests.
In all experiments, 50 mmol/L Na2SO4 was employed as the supporting electrolyte. Unless otherwise indicated, the tests were performed at ambient temperature (25 ± 2 °C). The initial solution pH was adjusted using concentrated H2SO4 or NaOH, and a water jacket outside the electrochemical cell was employed for controlling the solution’s temperature. Samples were harvested from the feed tank at a predetermined time interval, and 2 µL of 0.1 mol/L Na2S2O3 in a 1 mL sample was added to stop the oxidative reactions.
2.3. Analytical Methods
The gaseous ozone concentration was detected by the iodometric method [22]. The H2O2 was measured with the titanium salt spectrophotometry method [23]. The generation of HO• was calculated indirectly by the pCBA method [24]. The steady-state concentrations of HO• could be calculated from the known rate constant for the reaction of pCBA with HO• and the determined pseudo first-order rate constant of pCBA decay. The solution pH value and temperature were measured by a Thermo Orion 868 m. PABA concentration was determined with high-performance liquid chromatography (HPLC, Waters Alliance e2998, Milford, MA, USA) performed on a Nov-pack C18 column (4.6 mm × 150 mm, particle size 4 μm) at 30 °C. The mobile phase consisted of 40% methanol and 60% water (0.5% acetic acid, v/v) with a flow rate of 1 mL/min. The injection volume was 10 μL and the detection wavelength was 282 nm.
3. Results and Discussion
3.1. Degradation of PABA
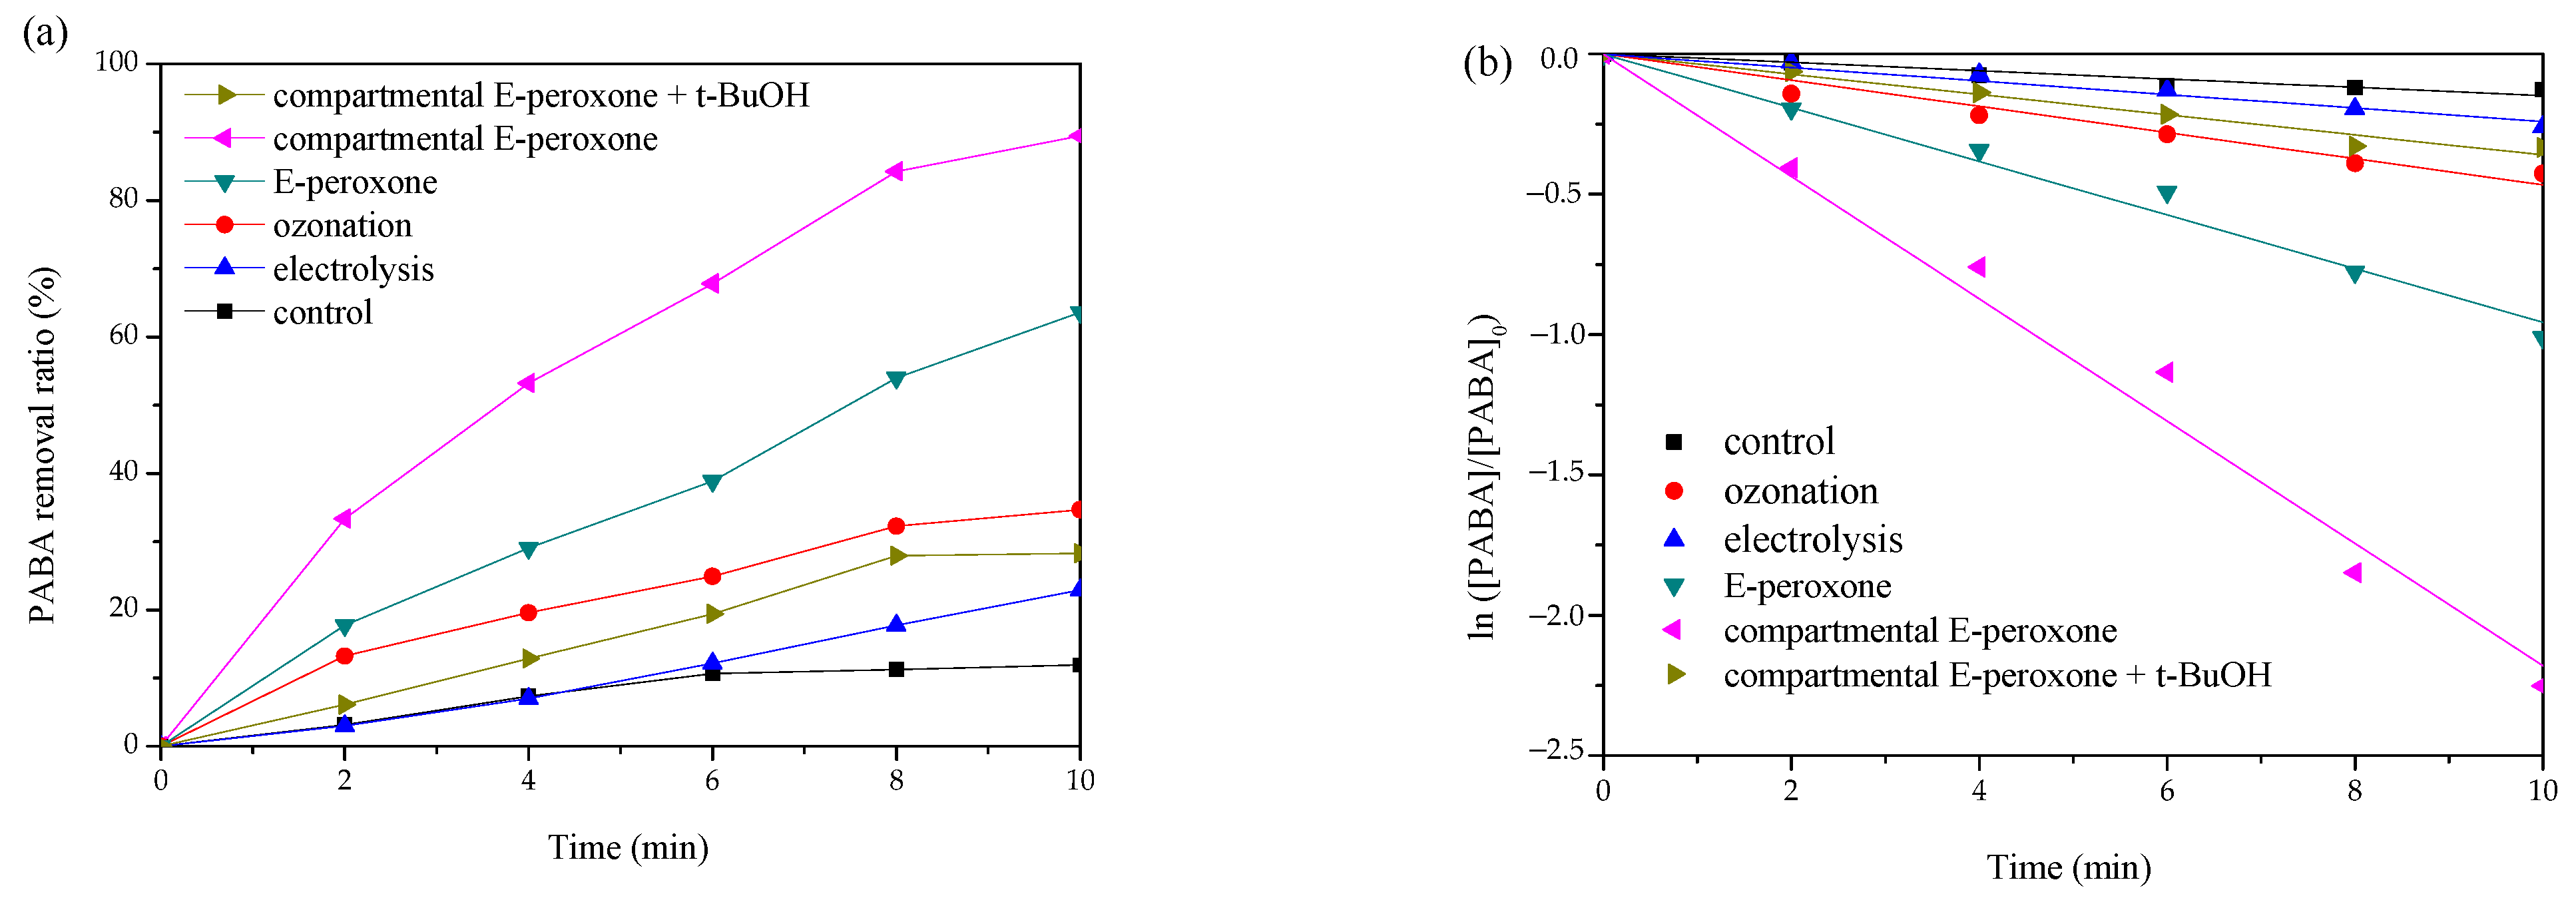
The degradation performances of PABA by various processes were shown in Figure 2a. For the control test without current and ozone application, ~12% PABA removal was detected, implying that the adsorption effects of electrodes and the reactor were marginal. Neither single electrolysis nor ozonation could degrade PABA effectively, only ~22.9% and ~34.7% eliminations were observed at 10-min treatments, respectively. Synergistic contaminant destruction was obtained in the compartmental E-peroxone system, ~89.5% PABA was degraded within 10 min. In contrast, when the CEM was removed from the electrochemical cell, the PABA removal efficiency decreased significantly, ~63.6% degradation was detected in the conventional E-peroxone process. Moreover, the kinetic analysis indicates that the PABA degradation reactions in all the above processes followed the pseudo first-order kinetics (Figure 2b). The calculated rate constants are as follows: compartmental E-peroxone (~3.6 × 10⁻³ s−1) > conventional E-peroxone (~1.6 × 10⁻³ s−1) > ozonation (~0.8 × 10⁻³ s−1) > electrolysis (~0.4 × 10⁻³ s−1). Furthermore, the synergistic effect was quantitatively analyzed by synergistic index (f) according to Equation (1), and the calculated f of compartmental E-peroxone system was ~3.
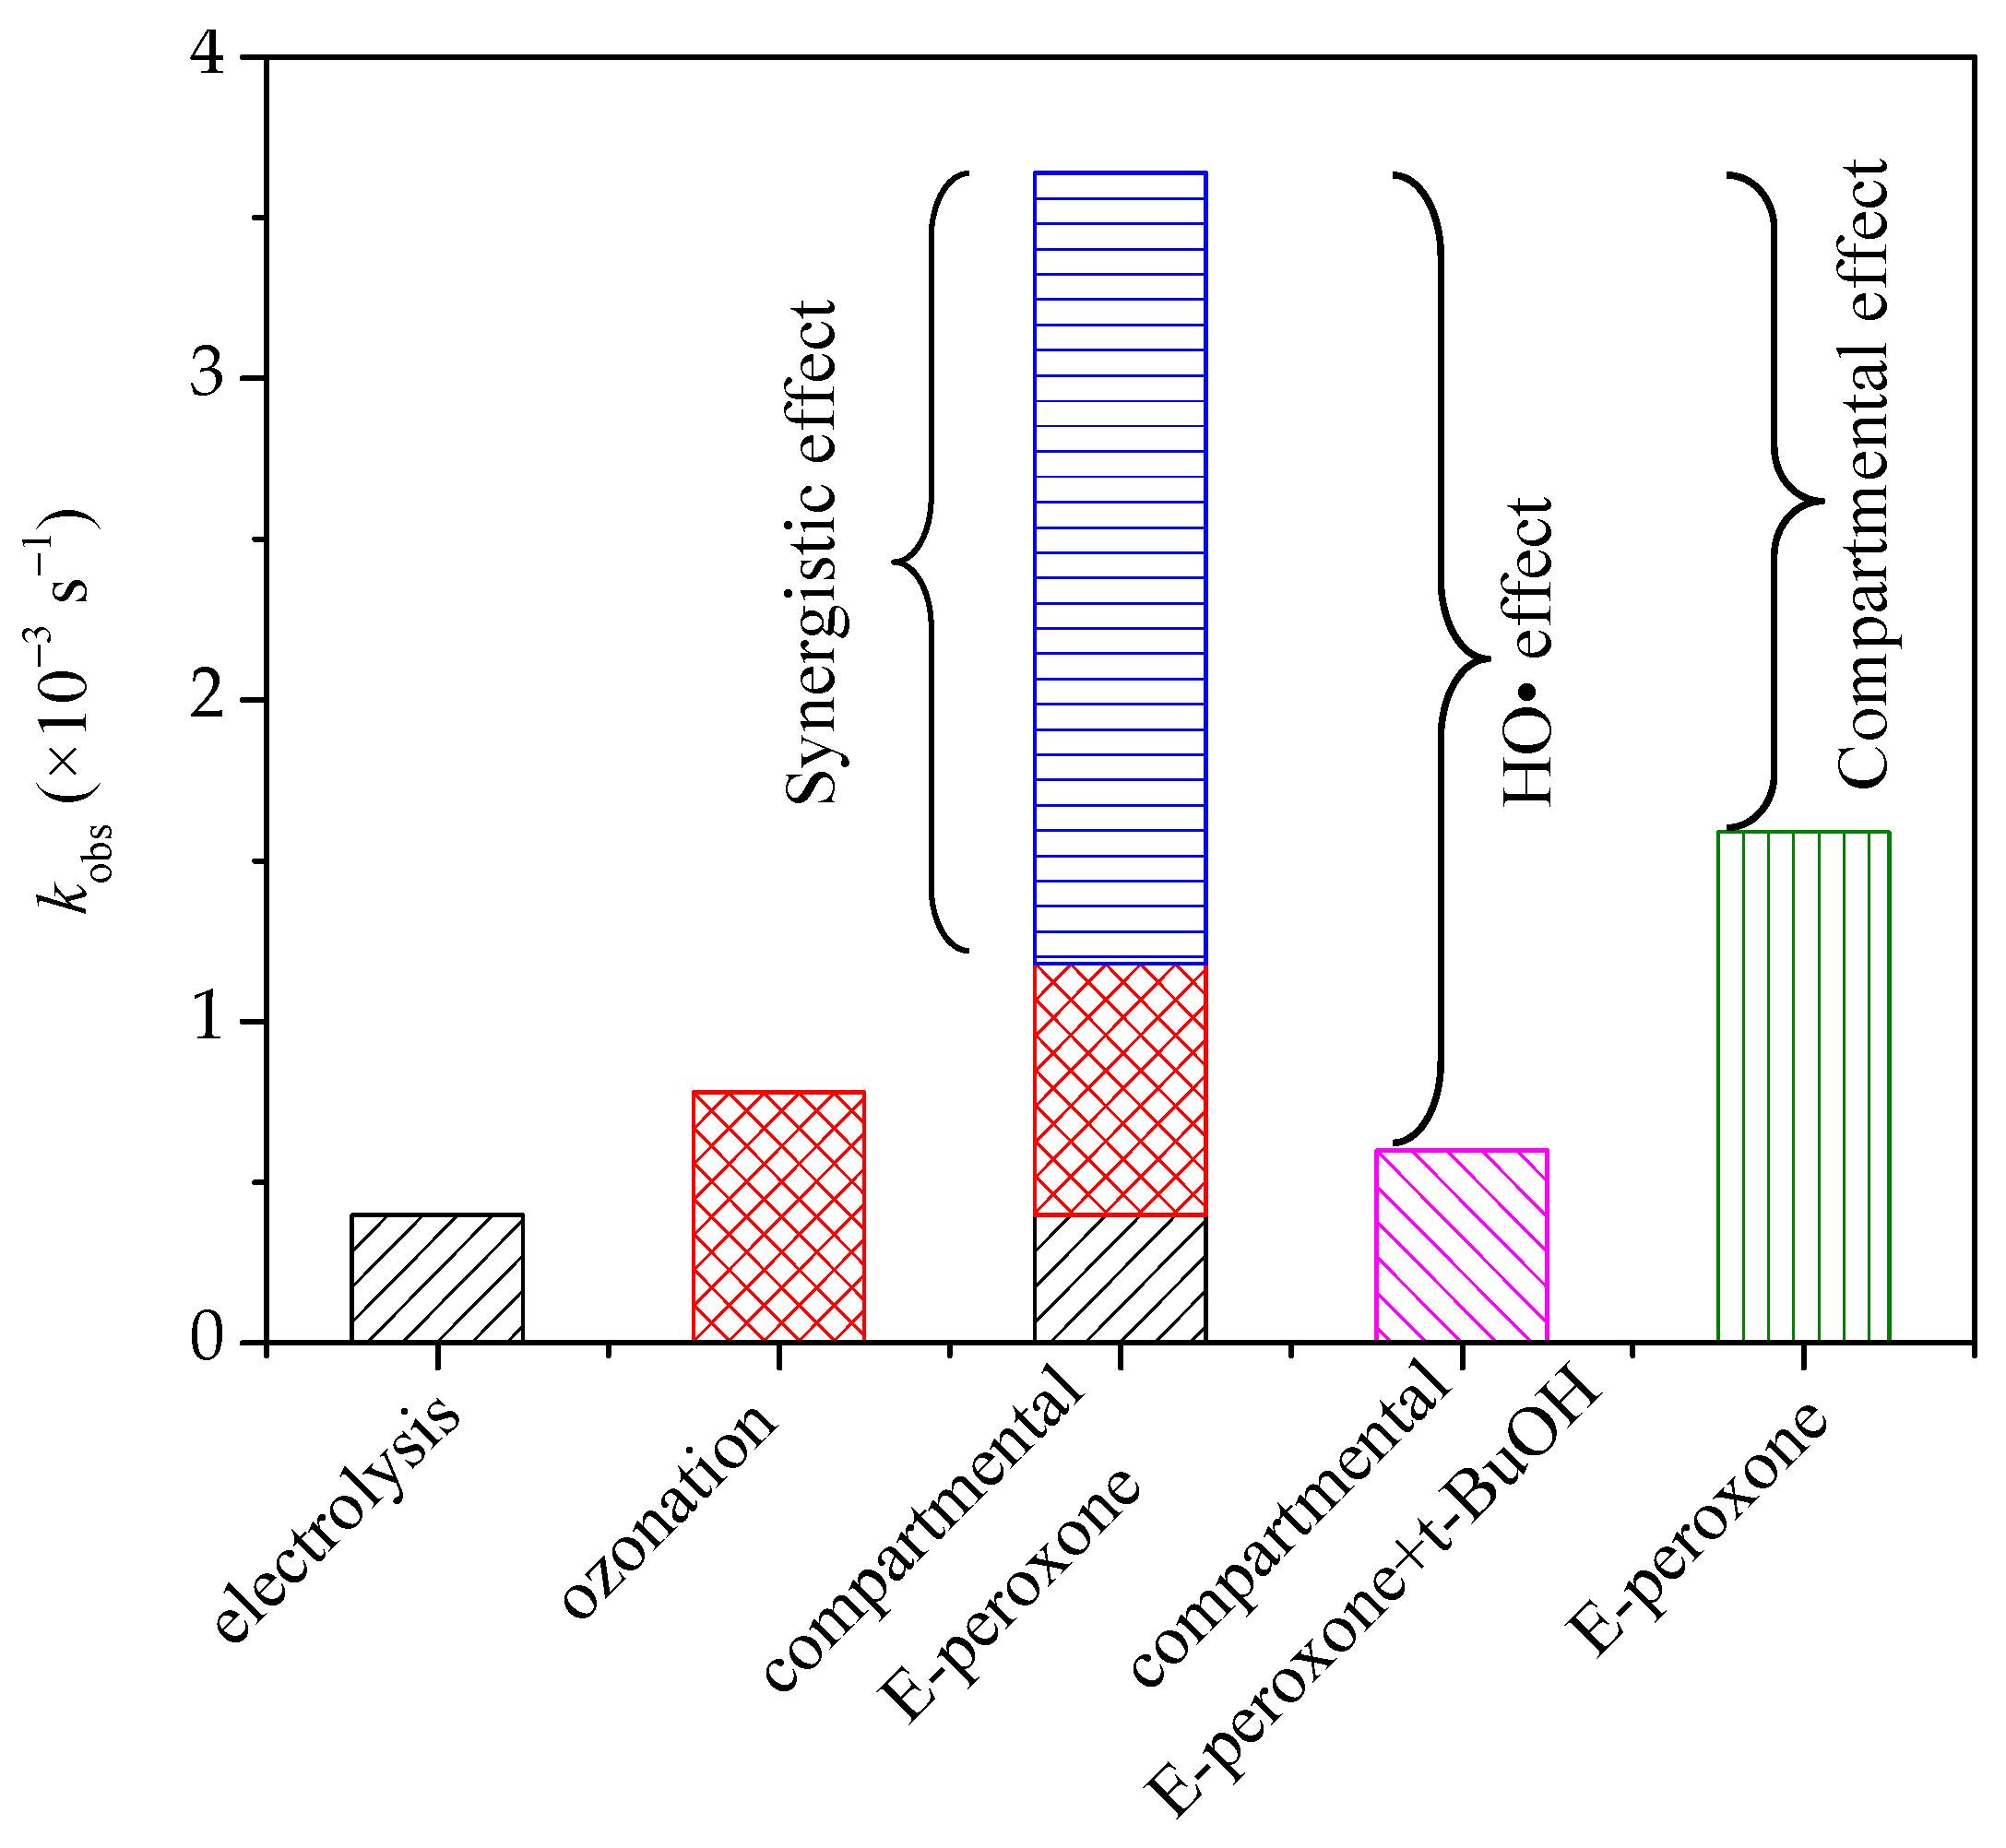
In general, because of the restricted mass transfer at electrodes, a long time is needed for sole electrolysis treatment, and unsatisfied degradation efficiency has been reported for the electrolysis of many pollutants [25,26]. Ozone is a selective oxidant that can oxidize ozone-reactive contaminants quickly but is inefficient at the ozonation of ozone-resistant compounds. PABA has a carboxyl functional group (Table 1), which is difficult oxidized by ozone [27]. Thus, sole electrolysis or ozonation exhibited a low PABA removal efficiency. In the E-peroxone system, the reduction of oxygen at cathode could, in-situ, generate H2O2, and further initiate the peroxone reactions (Equations (2) and (3)) [12]. The produced HO• is an excellent and unselective oxidant that can degrade most organic compounds completely. Therefore, tert-butyl alcohol (t-BuOH) was employed as a scavenger to verify the contribution of HO• in the compartmental E-peroxone process. As shown in Figure 2a, the presence of t-BuOH profoundly decreased the PABA removal ratio, implying that PABA degradation mainly followed the HO• oxidation mechanism. The contributions of various factors on PABA removal in the compartmental E-peroxone process were identified in Figure 3.
O2 + 2H+ + 2e− → H2O2
2H2O2 + 2O3 → H2O + 3O2 + HO2• + HO•
3.2. Effects of Operational Parameters
3.2.1. Model Building and Statistical Analyses
Central composite design (CCD), a widely used form of RSM [28,29], was applied to investigate the effects of the experimental variables and their interactions on the response functions. The initial solution pH (x1), inlet O3 concentration (x2), cathodic current density (x3) and reaction temperature (x4) were selected as the independent variables, and the dependent variable was PABA removal efficiency (y). A 4-factor and 5-level CCD consisting of 30 experimental runs was performed, and the results were shown in Table 2. A second order polynomial response equation (Equation (4)) was applied to relate the empirical relationship between the independent and dependent variables.
where y is the response factor, xi and xj are independent variables, k = 4; β0, βi, βii, βij are the regression coefficients for intercept, linearity, square, and interaction, respectively; ε represents the residual term.
Based on the experimental data analysis by the Design-Expert software, the following quadratic polynomial response equation (Equation (5)) was obtained.
y = 81.62 + 6.17 x1 + 3.04 x2 + 2.14 x3 + 11.09 x4 − 0.088 x1 x2 − 0.29 x1 x3 + 1.03 x1 x4 − 0.52 x2 x3 − 0.69 x2 x4 − 0.51 x3 x4 − 2.61 x12 − 1.49 x22 − 2.31 x32 − 2.95 x42
According to Equation (5), the influences of various parameters on PABA degradation can be calculated, and an increasing order of the four independent variables is cathodic current density (x3) < inlet O3 concentration (x2) < initial solution pH (x1) < reaction temperature (x4). It is also noted that there were positive or negative interaction effects between different parameters. Moreover, analysis of variance (ANOVA) checked the applicability of the model (Table 3). The model F-value was 38.79 and the p value < 0.0001, indicating that the model was statistically significant. Models with high determination coefficients (R2) revealed that 97.31% of the variability in the data could be in a good prediction with Equation (5). The low coefficient of variation (3.96%) ensured the experimental values had high accuracy and reliability. The normal residuals fall along a straight line (Figure S1), indicating that a response transformation was not required and there was no apparent problem with normality.
3.2.2. Response Surface and Counter Plots
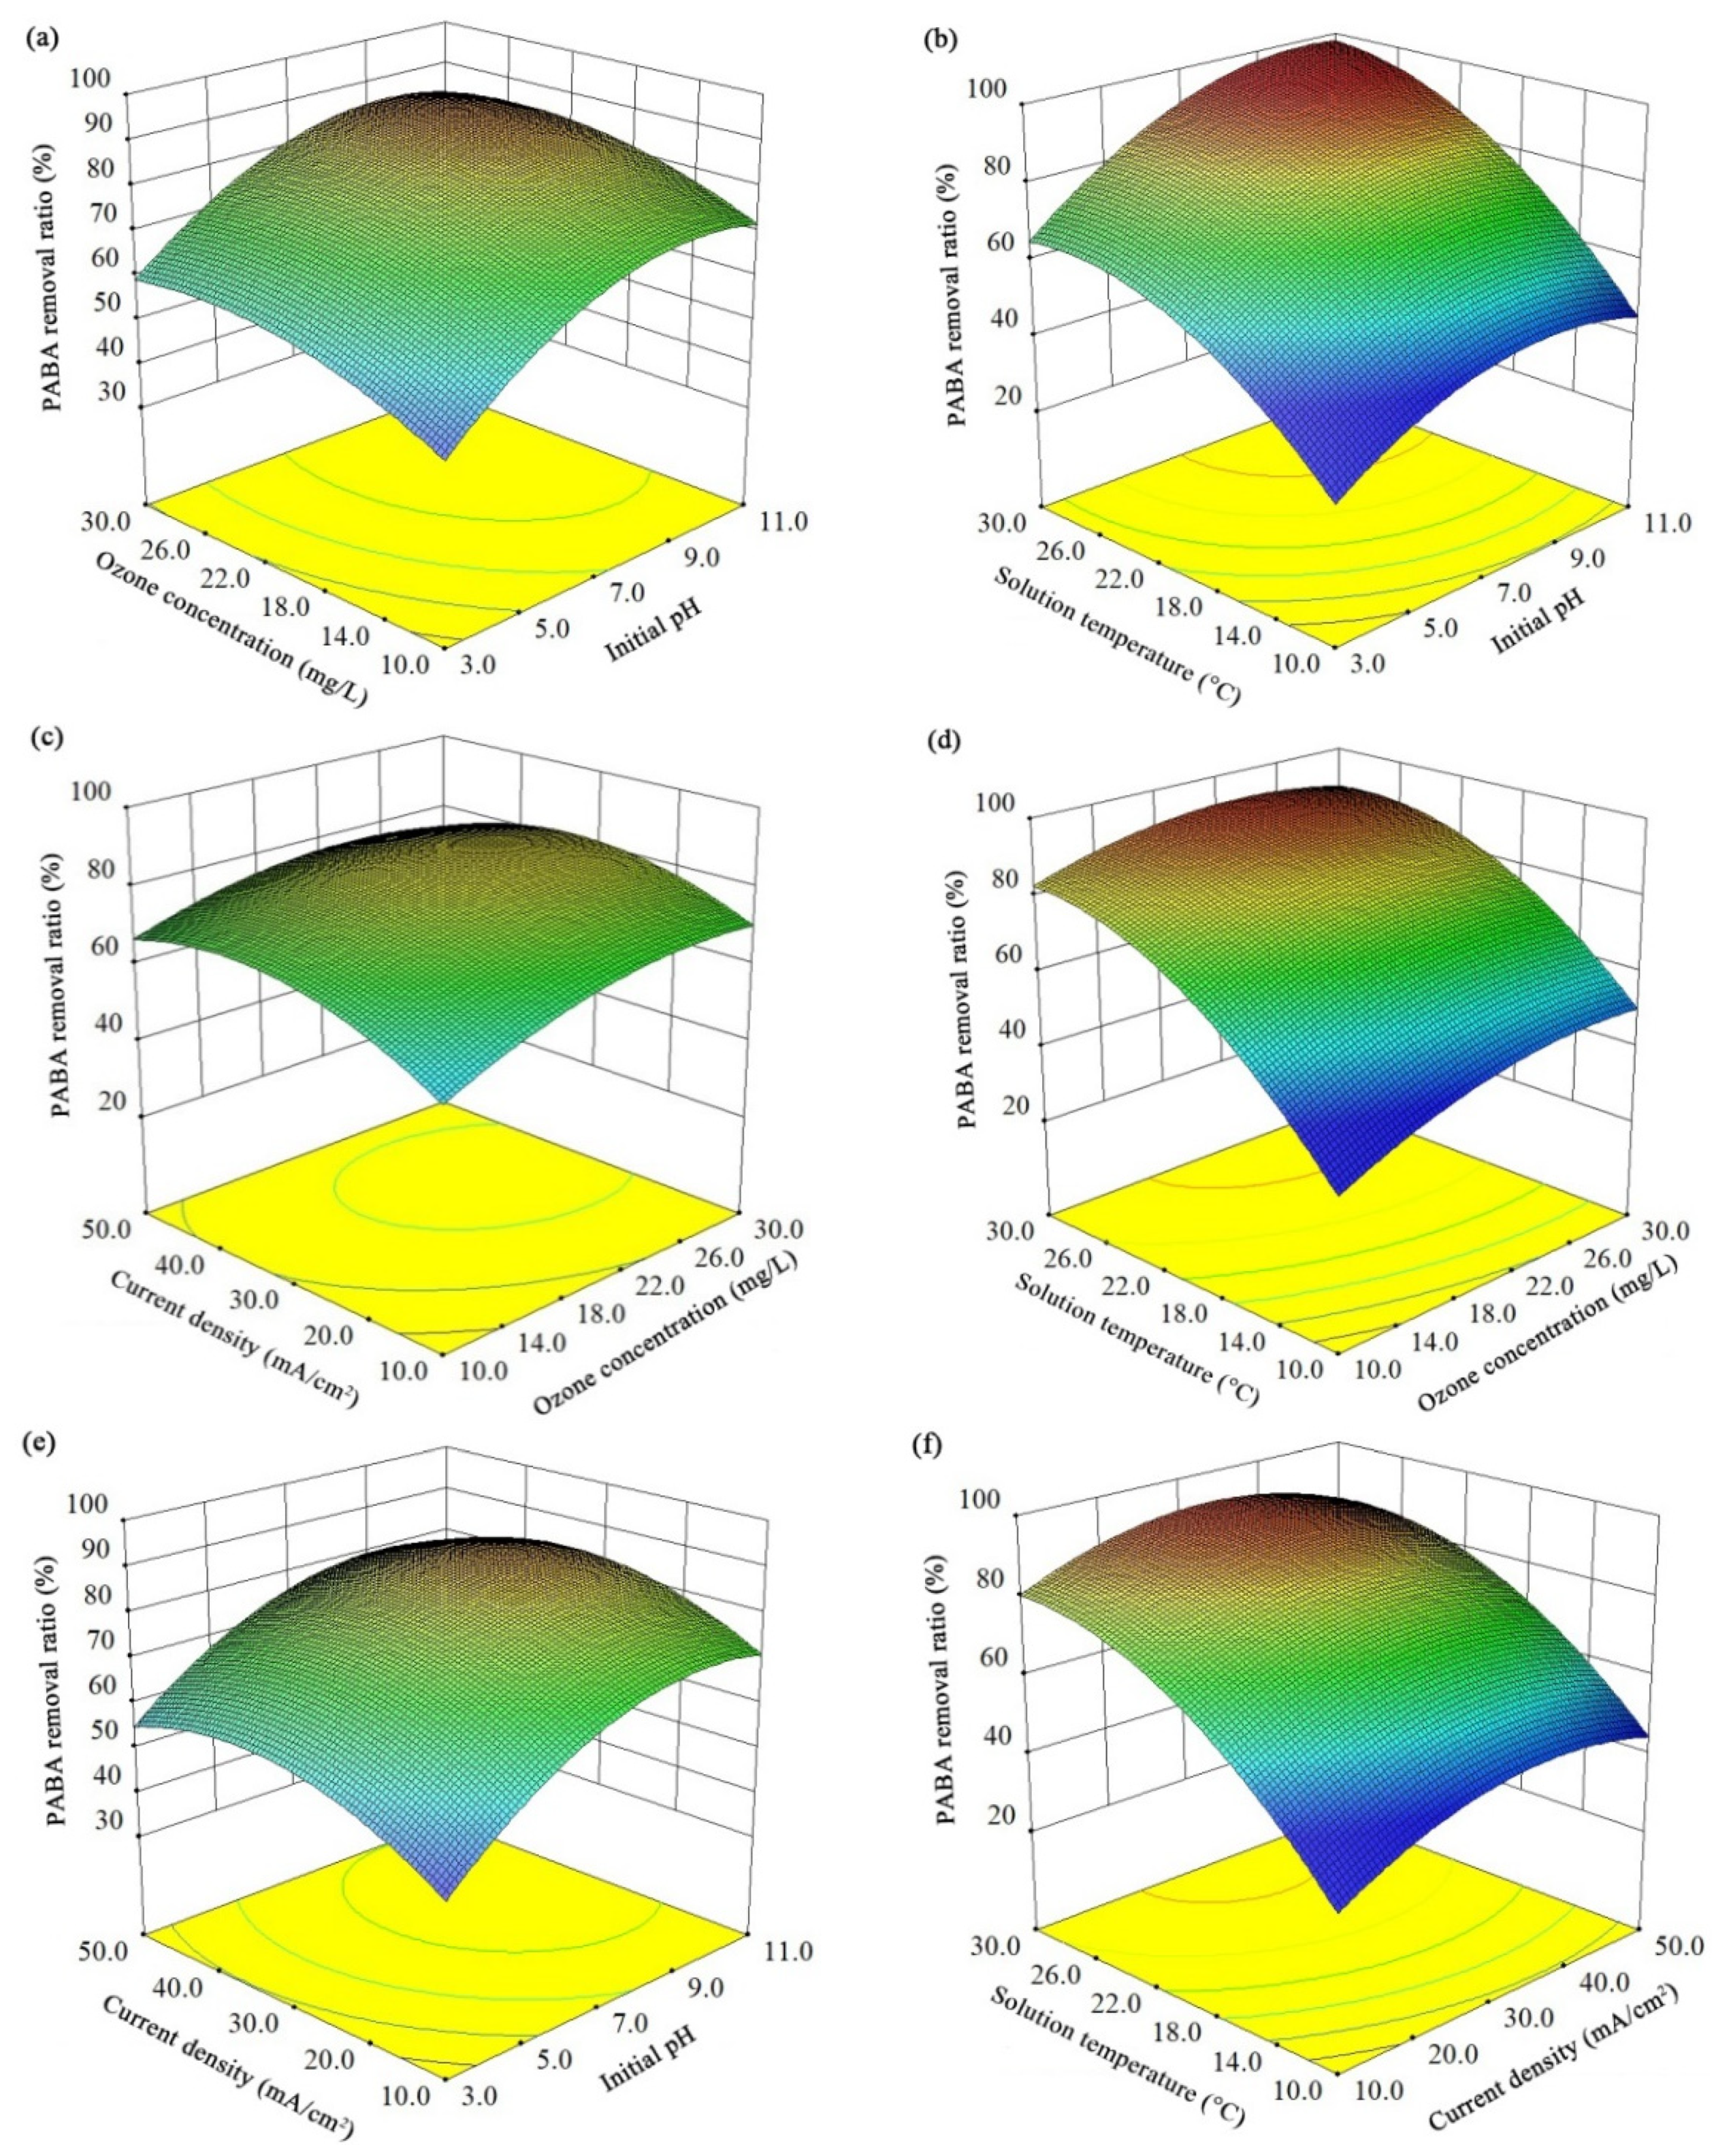
Based on the RSM analysis, the three-dimensional response surface (Figure 4) and contour plots (Figure S2) were obtained to visually display the overall interactions. Briefly, an appropriate increase of all the investigated parameters could accelerate the PABA degradation, but the extreme high values of these variables exhibited inhibitory effects. Theoretically, the increase of these four parameters has both positive and negative effects on the E-peroxone treatment efficiency. When the inlet gaseous ozone concentration increased, the gas–liquid mass transfer of ozone would be enhanced [30], which was beneficial to ozonation and peroxone oxidation. However, due to the short contacting time and the limited ozone solubility in water, the utilization of ozone was restricted, and exorbitant gaseous ozone concentration did not further facilitate contaminant degradation. In addition, the possibility of HO• consumption by ozone (Equation (6)) should also be noticed; it would lower the oxidation capacity in the system [24]. The positive effects of high current density includes enhanced anodic oxidations and cathodic reductions, but the excess H2O2 could also consume the HO• and reduce the treatment efficiency [18]. Although the increase of the solution temperature would reduce the solubility of ozone and oxygen, the reaction activation energies could also be reduced to stimulate the PABA degradation. Compared with acidic environment, an alkaline environment is more favorable for ozonation and peroxone to produce reactive radicals [31]. Nevertheless, the low proton concentration would affect the H2O2 accumulation rate (Equation (2)).
O3 + HO• → O2 + HO2•
HO2− + HO• → HO2• + OH−
Since the mechanisms of PABA degradation affected by different parameters were correlated, there were interaction effects between various variables. For instance, the negative influence of high current density was more obvious when the solution had a high initial pH. The increase of solution pH could promote ozone react with OH− to produce HO2−, which would then react with ozone to generate HO•. Similarly, with the increase of applied current density, the enhanced cathodic O2 reduction would stimulate the H2O2 formation, and the peroxone reactions would be accelerated. However, the excess production of H2O2/HO2− would cause the consumption of HO• in the E-peroxone process (Equation (7)), and the PABA elimination rate would be decreased. Likewise, the positive effect of the high solution temperature was more remarkable when the applied current density was less than 35 mA/cm2. As mentioned above, the increase of solution temperature could activate ozone and H2O2 molecules, improving the related reaction rates. With the initial pH of ~7 and inlet ozone concentration of ~20 mg/L, more than 90% PABA removal was obtained in the region between 26–30 °C solution temperature and 27–40 mA/cm2 applied current density. However, the high temperature would also reduce the solubility of O3/O2. When there was insufficient aqueous ozone to initiate the peroxone reactions, the excess H2O2 would act as an HO• scavenger to reduce the oxidation ability of the E-peroxone system.
3.2.3. Optimization of Compartmental E-Peroxone Process
The response optimizer was employed to optimize the reaction conditions. The independent variables were selected to be “in the range”, and the PABA elimination efficiency was defined as “maximize”. The calculated optimum values of the operational parameters were initial solution pH 10.1, inlet gaseous O3 concentration 22.5 mg/L, applied cathodic current density 30.9 mA/cm2, and solution temperature 30 °C. The predicted PABA degradation efficiency under the optimum conditions was 98.9%. Moreover, a test of PABA elimination at these conditions was performed, and approximate 97.2% removal was detected, confirming that the proposed models were well-reproducible in the design range as expected.
It should be noted that the optimization of the real water/wastewater treatment process is more complicated than that of laboratory simulation. Real water and wastewater usually contain a variety of organic and inorganic compounds, which can participate in the redox reactions and affect the target pollutants transformation. For example, the presence of effluent organic matter could significantly influence the traditional peroxone oxidation of micropollutants in wastewater [32]. In addition, besides the treatment efficiency, the cost of the process is also important. For practical applications, the optimization of technical parameters needs to be further investigated.
3.3. Possible Oxidation Mechanism
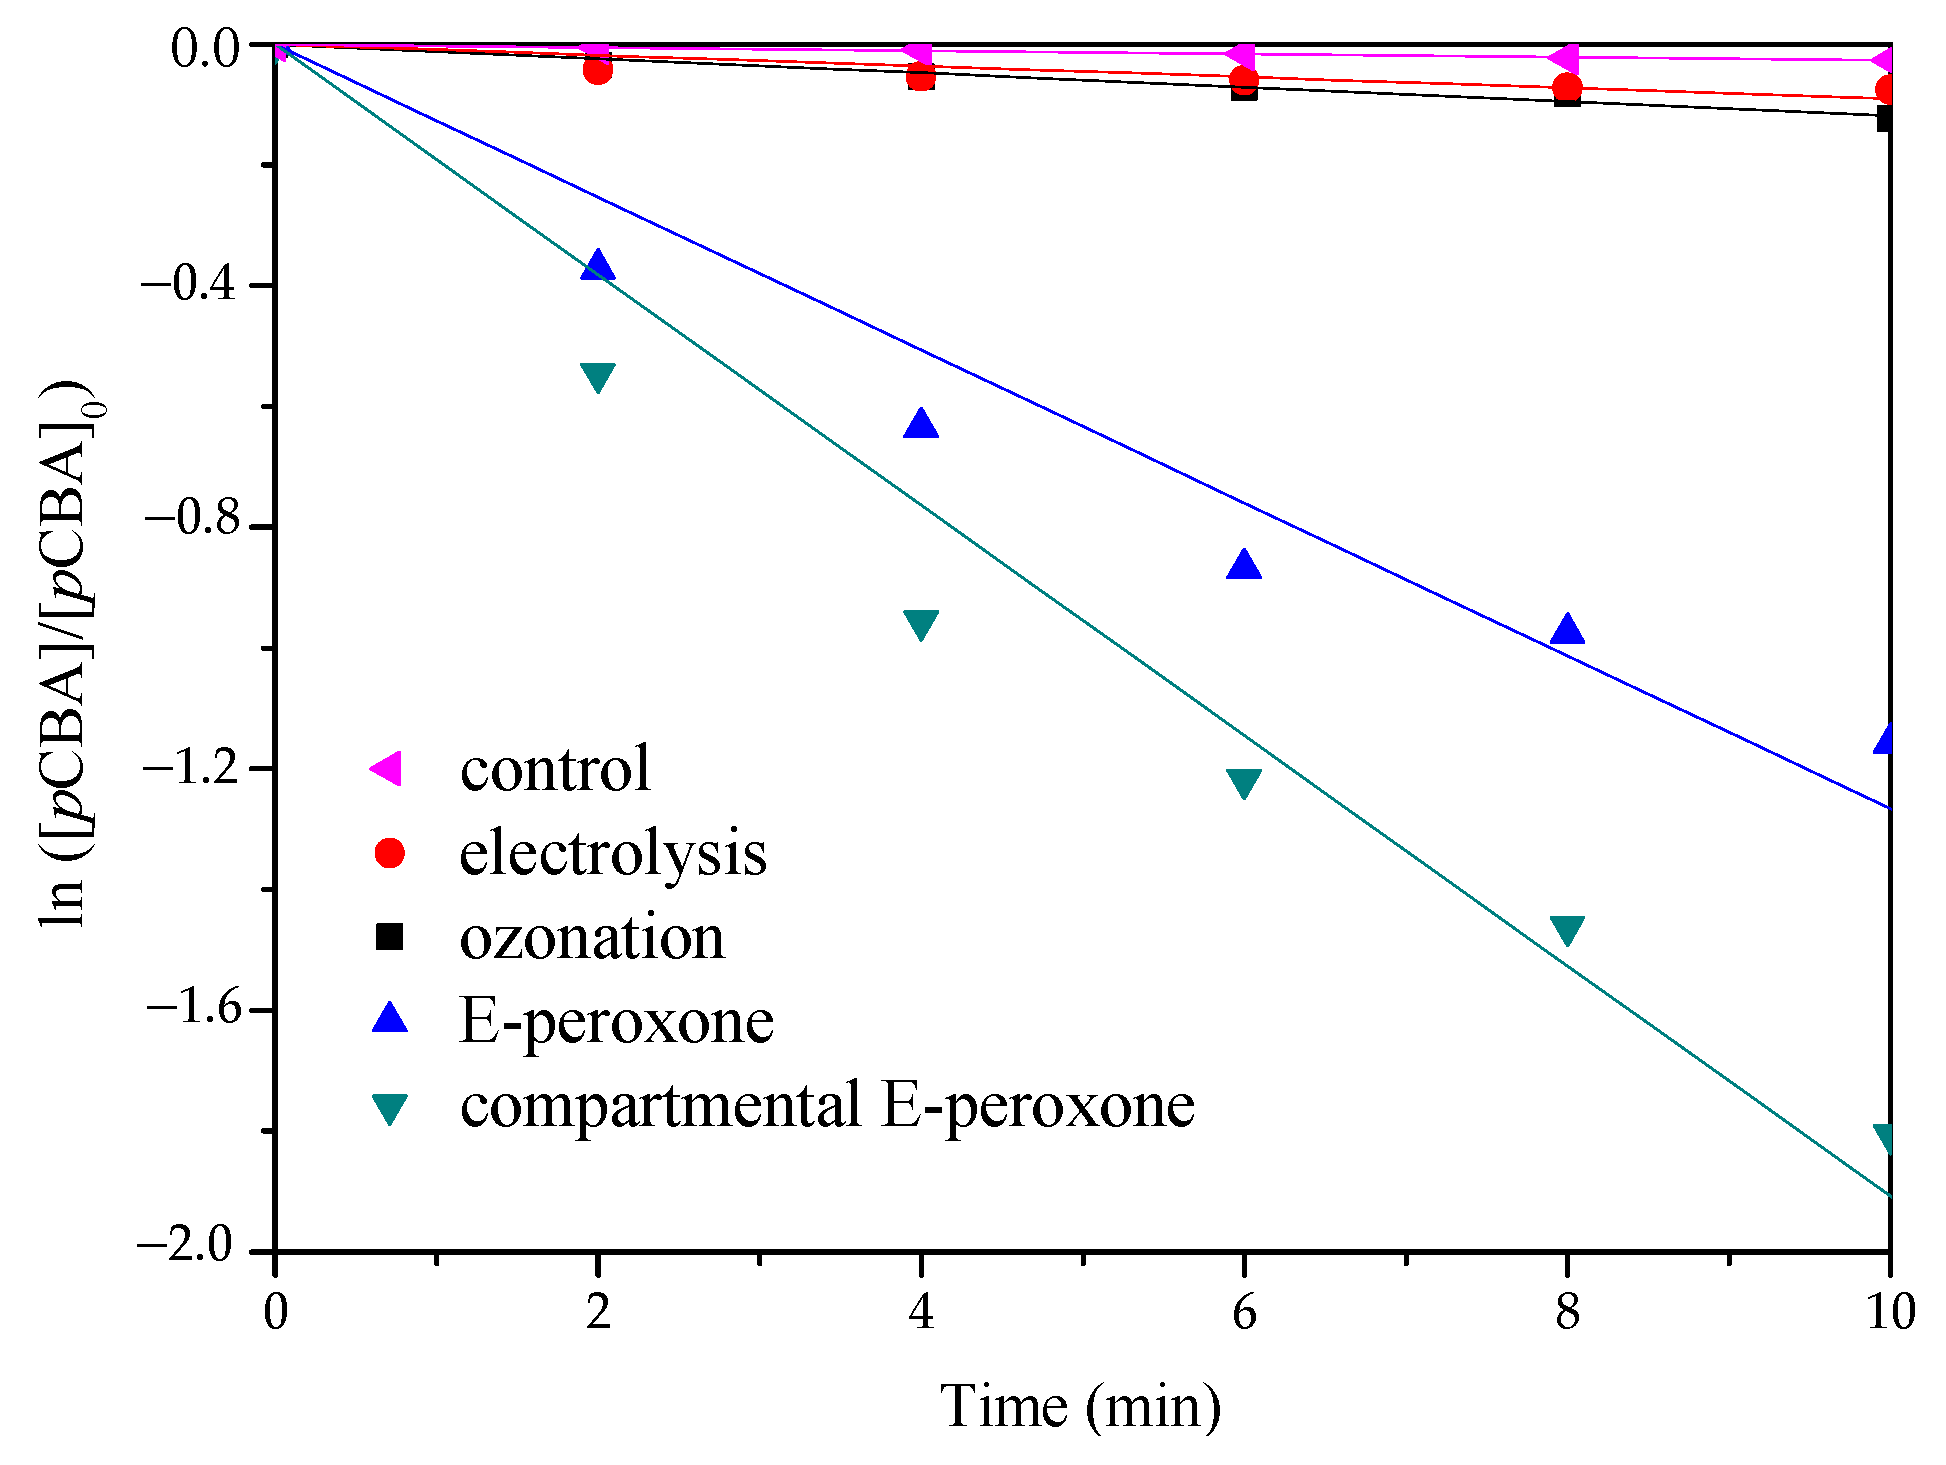
Figure 5 describes the HO• production in various processes. The degradation trends of pCBA are similar to those of PABA; the fastest reaction rate was detected in the compartmental E-peroxone process. As a famous HO• probe compound, pCBA has a high reactivity with HO• (kOH,pCBA = 5 × 10⁹ M−1 s−1) and its ozonation rate is very low (kOH,O3 < 1 M−1 s−1) [24,32]. Therefore, the steady-state concentrations of HO• could be estimated from the slopes of curves in Figure 5, and their values were as follows: electrolysis (~3.0 × 10⁻¹⁴ mol/L) < ozonation (~3.9 × 10⁻¹⁴ mol/L) < E-peroxone (~4.2 × 10⁻¹³ mol/L) < compartmental E-peroxone (~6.4 × 10⁻¹³ mol/L).
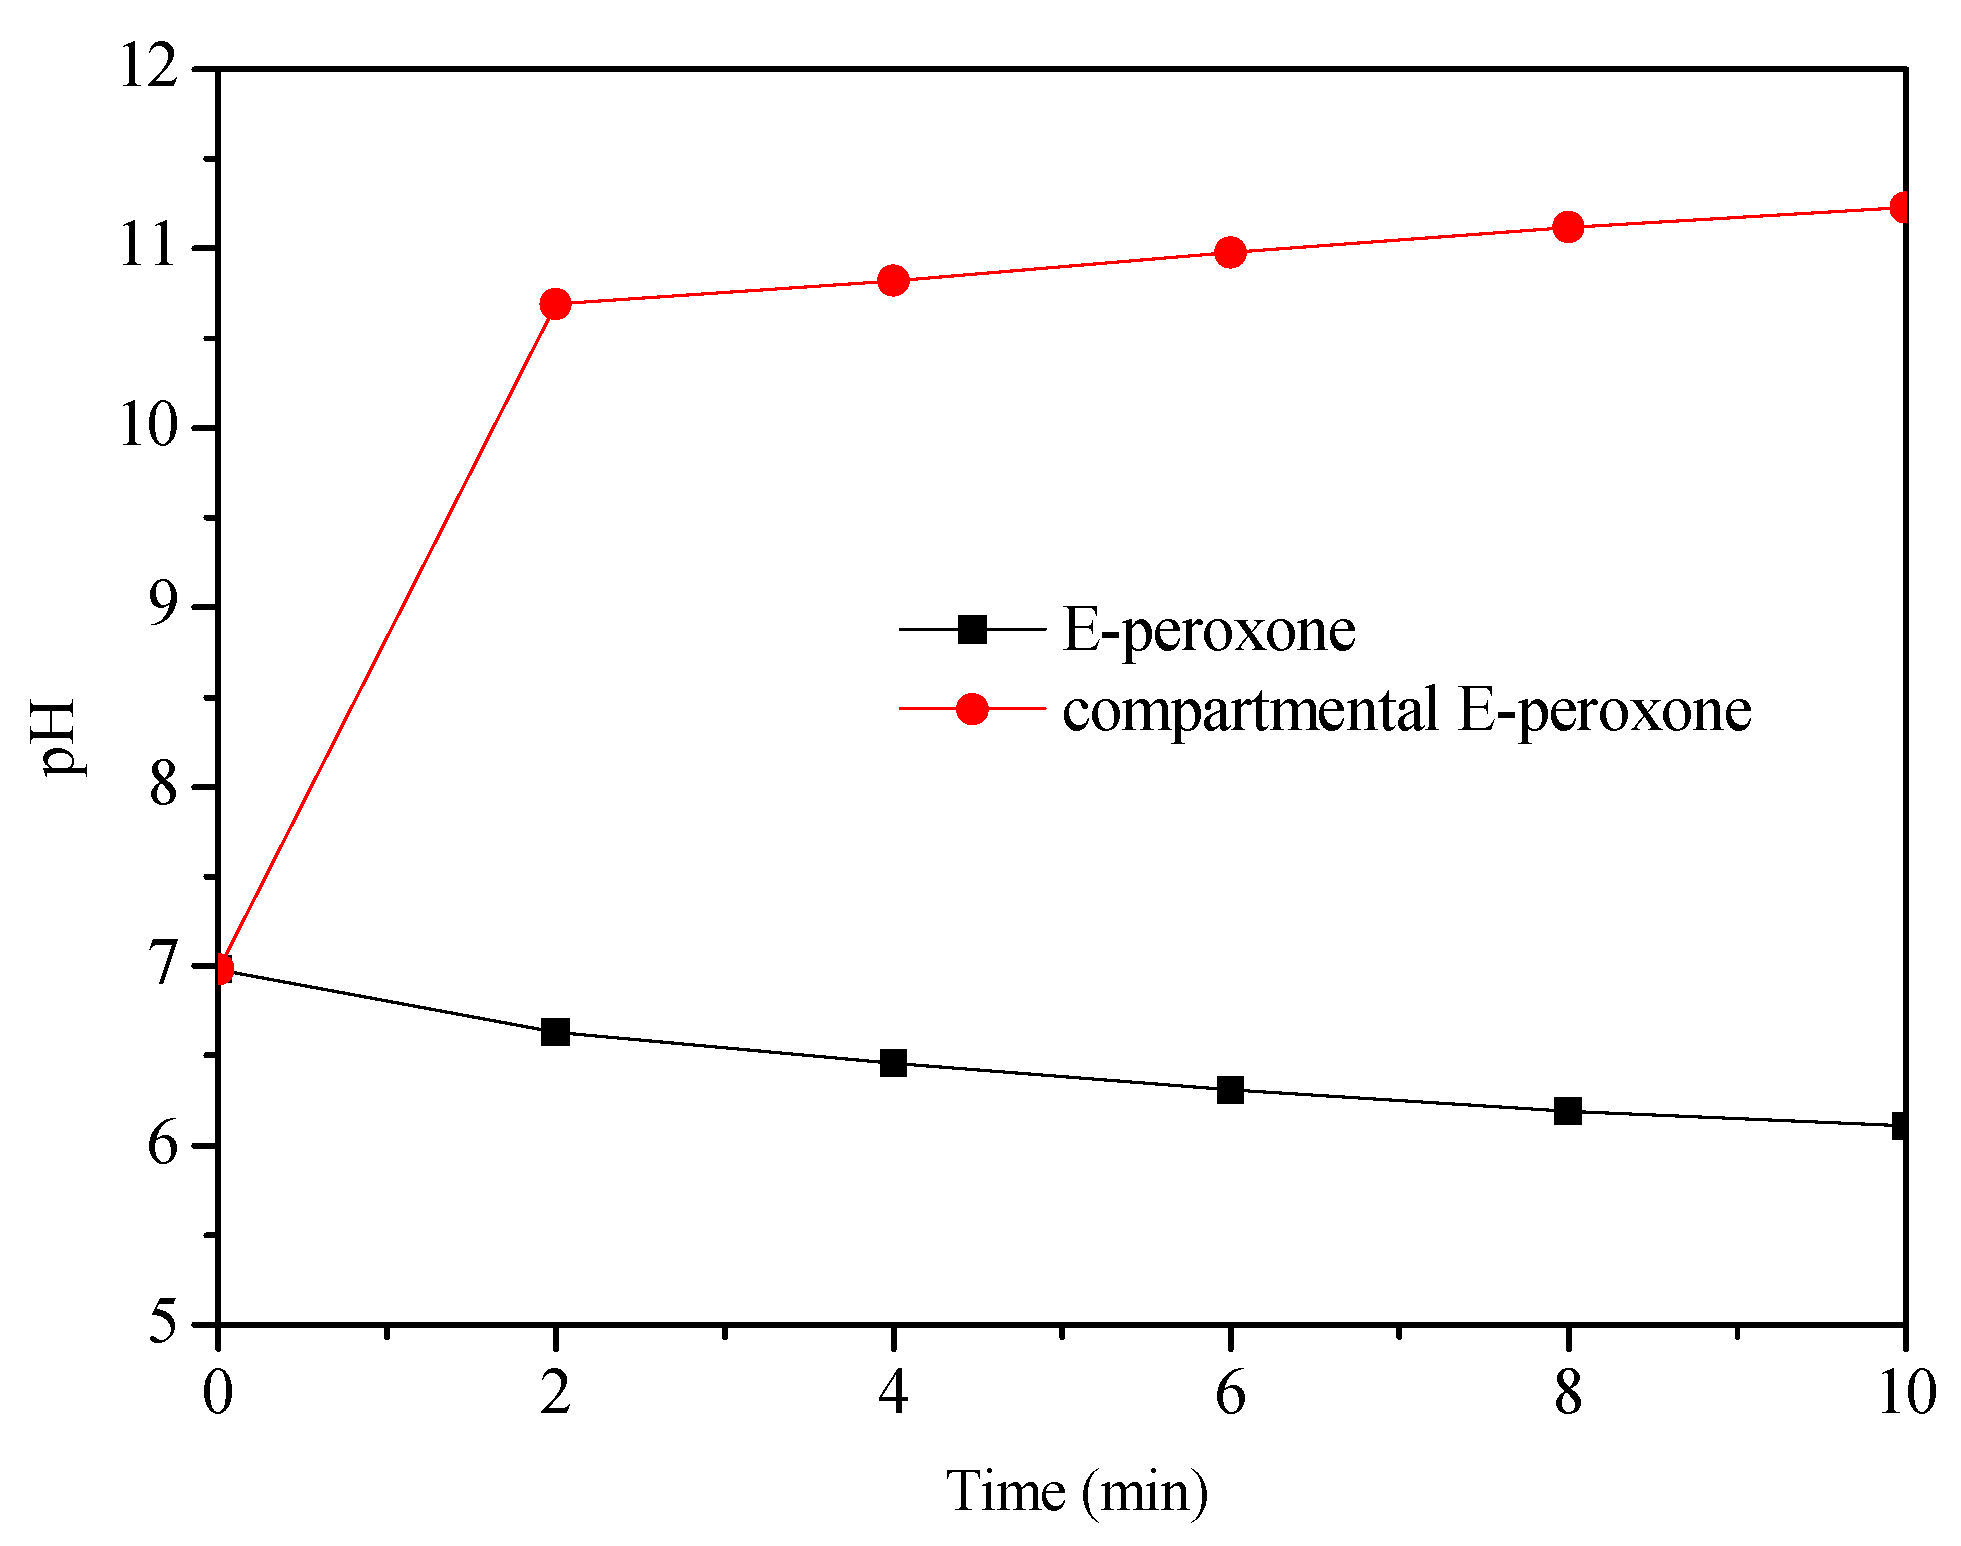
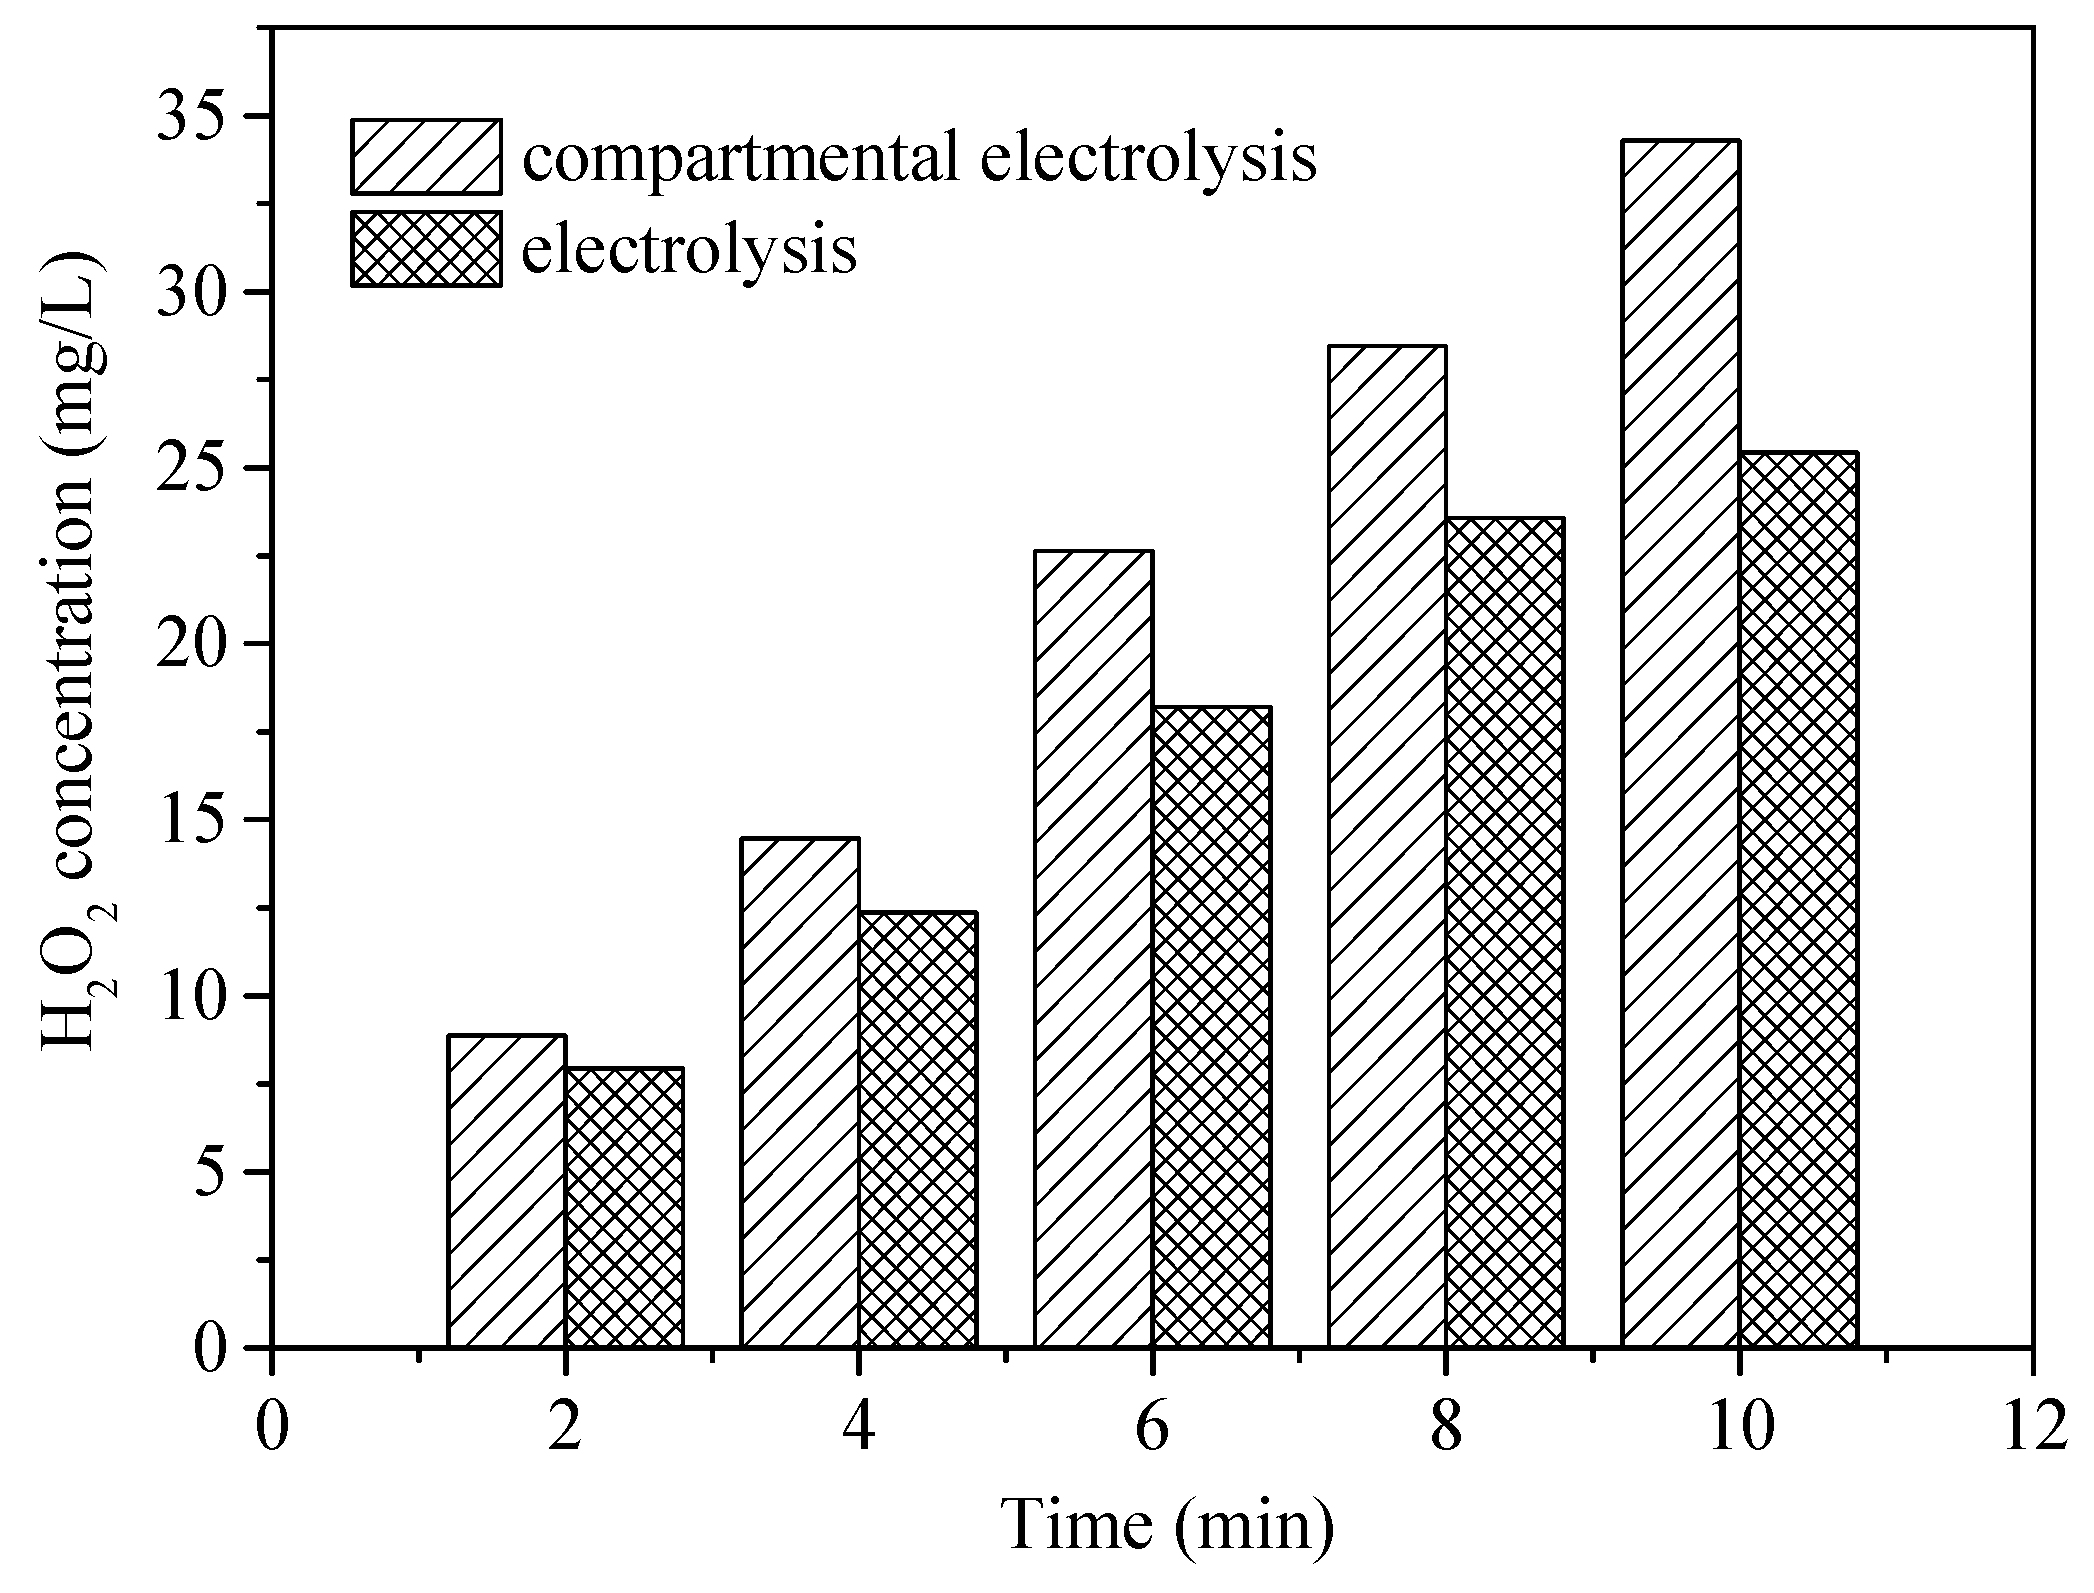
The most important difference between E-peroxone with and without CEM is the separation of cathodic and anodic reactions. The above observations suggest that this separation could promote the HO• generation. In general, in the E-peroxone system, HO• can be produced via chain reactions of peroxone and cathodic ozone reduction (Equations (8) and (9)) [11,16]. As shown in Figure 6, with the presence of CEM in the electrochemical reactor, the cathodic reactions could cause the solution pH increase in the cathode chamber. When 1 L reaction solution was circulated between the cathode chamber and the feed tank (the solution in the anode chamber was circulated separately by another peristaltic pump), the solution pH increased from 6.9 to 10.7 within 2 min, and pH 11.2 was detected at 10-min treatment. In contrast, in the undivided E-peroxone process, the solution pH decreased to 6.1 after 10 min. As reported previously, the high production of H2O2 could be produced at lower pH values (e.g., pH < 3) or higher pH values (e.g., pH > 7) [33]. Under alkaline conditions, the reduction of oxygen would be Equation (10) [33]; the produced HO2− could act as an initiator for the chain reactions of HO•. To verify the enhanced H2O2 production, its formation in the two circulating systems was measured (Figure 7). The H2O2 yield in the cathode chamber was higher than that in the E-peroxone system without CEM, confirming that the independent cathodic reaction is beneficial to the accumulation of H2O2.
O3 + e− → O3−• at cathode
O3−• + H2O → HO• + O2 + OH−
O2 + 2H+ + 2e− → HO2− + OH−
H2O2 → HO2• + H+ + e−
HO2• → O2 + H+ + e−
Besides providing favorable reaction conditions for the generation of H2O2 and HO• in the cathode chamber, the compartmental E-peroxone could also reduce the H2O2 decomposition at the anode. In fact, CEM had a selective permeability that could prevent the anions’ transfer to the anode. Thus, HO2−/OH− could react fully with ozone in the cathode chamber in the compartmental E-peroxone process. In contrast, the electro-generated H2O2 would be consumed at the anode in the E-peroxone system without CEM (Equations (11) and (12)) [33]. Figure S3 shows that changing the reaction sequence of compartmental E-peroxone (i.e., the solution flowed through the anode chamber first and then flowed into the cathode chamber) reduced the HO• production amount and PABA degradation, but still yields higher efficiency than undivided conventional E-peroxone (Figure 2). Hence, the reduction of anodic side reactions is another possible reason for the high performance of the compartmental E-peroxone process.
4. Conclusions
In summary, a novel compartmental E-peroxone process was demonstrated for its efficiency in aqueous emerging contaminant PABA elimination. While sole electrolysis or ozonation could not degrade the target pollutant effectively, the combined E-peroxone oxidation yields synergistic PABA removal, and the separation of cathodic and anodic reactions further improved the treatment efficiency. HO• was the dominant oxidant for PABA degradation and the reaction conditions that favor the HO• generation could promote the contaminant destruction rate. Based on the RSM analysis, the influences of operational parameters were optimized. To restate, the treatment efficiency was not only affected by each operating parameter, but also the interaction between different parameters should be noted. The alkaline environment in the cathode chamber, the reduction of anodic side reactions, and the enhancement of the reactant mass transfer during solution circulating were beneficial to the formation of HO• via the peroxone reactions, thereby improving the degradation rate of PABA in the compartmental E-peroxone process. Considering the high efficiency and practicality of this process, it has the potential for emerging contaminants’ removal from water and wastewater.
Supplementary Materials
The following are available online at https://www.mdpi.com/article/10.3390/w13212961/s1, Figure S1 Residuals vs. Predicted plot for PABA removal efficiency at 10 min, Figure S2 Two-dimensional contour plots of the PABA degradation efficiency of compartmental E-peroxone in terms of two independent variables: (a) inlet gaseous ozone concentration and initial solution pH, (b) solution temperature and initial solution pH, (c) current density and inlet gaseous ozone concentration, (d) solution temperature and inlet gaseous ozone concentration, (e) current density and initial solution pH, (f) solution temperature and current density, Figure S3 PABA and pCBA degradation in the compartmental E-peroxone process with anodic reactions followed by cathodic reactions: (a) removal ratio and (b) the pseudo first-order reaction kinetics (Gas flow rate = 0.2 L/min; Inlet O3 concentration = ~20 mg/L; Applied current = 20 mA/cm2; Temperature = 25 ± 2 °C).
Author Contributions
Conceptualization, D.W. and G.L.; Investigation, Y.L., Q.L., L.W. and P.Z.; Writing—Original Draft Preparation, D.W. and Y.L.; Writing—Review & Editing, all authors. All authors have read and agreed to the published version of the manuscript.
Funding
This research was funded by the National Natural Science Foundation of China (No. 51608167), the Fundamental Research Funds for the Central Universities (No. B200202112), the Scientific and Technological Project of Henan Province (No. 162102310057).
Institutional Review Board Statement
Not applicable.
Informed Consent Statement
Not applicable.
Data Availability Statement
Not applicable.
Conflicts of Interest
The authors declare no conflict of interest.
References
- Miller, I.B.; Pawlowski, S.; Kellermann, M.Y.; Petersen-Thiery, M.; Moeller, M.; Nietzer, S.; Schupp, P.J. Toxic effects of UV filters from sunscreens on coral reefs revisited: Regulatory aspects for “reef safe” products. Environ. Sci. Eur. 2021, 33, 1–13. [Google Scholar] [CrossRef]
- Astel, A.; Stec, M.; Rykowska, I. Occurrence and Distribution of UV Filters in Beach Sediments of the Southern Baltic Sea Coast. Water 2020, 12, 3024. [Google Scholar] [CrossRef]
- Cahova, J.; Blahova, J.; Plhalova, L.; Svobodova, Z.; Faggio, C. Do Single-Component and Mixtures Selected Organic UV Filters Induce Embryotoxic Effects in Zebrafish (Danio rerio)? Water 2021, 13, 2203. [Google Scholar] [CrossRef]
- Khan, J.; Sayed, M.; Shah, N.; Khan, S.; Zhang, Y.; Boczkaj, G.; Khan, H.; Dionysiou, D.D. Synthesis of eosin modified TiO2 film with co-exposed {001} and {101} facets for photocatalytic degradation of para-aminobenzoic acid and solar H2 production. Appl. Catal. B-Environ. 2020, 265, 118557. [Google Scholar] [CrossRef]
- Dromgoole, S.H.; Maibach, H.I. Sunscreening agent intolerance: Contact and photocontact sensitization and contact urticaria. J. Am. Acad. Dermatol. 1990, 22, 1068–1078. [Google Scholar] [CrossRef]
- Tsoumachidou, S.; Lambropoulou, D.; Poulios, I. Homogeneous photocatalytic oxidation of UV filter para-aminobenzoic acid in aqueous solutions. Environ. Sci. Pollut. Res. 2016, 24, 1113–1121. [Google Scholar] [CrossRef] [PubMed]
- Tsoumachidou, S.; Velegraki, T.; Poulios, I. TiO2photocatalytic degradation of UV filter para-aminobenzoic acid under artificial and solar illumination. J. Chem. Technol. Biotechnol. 2015, 91, 1773–1781. [Google Scholar] [CrossRef]
- Faka, V.; Tsoumachidou, S.; Moschogiannaki, M.; Kiriakidis, G.; Poulios, I.; Binas, V. ZnWO4 nanoparticles as efficient photocatalyst for degradation of para-aminobenzoic acid: Impact of annealing temperature on photocatalytic performance. J. Photochem. Photobiol. A Chem. 2020, 406, 113002. [Google Scholar] [CrossRef]
- Nie, M.; Zhang, W.; Yan, C.; Xu, W.; Wu, L.; Ye, Y.; Hu, Y.; Dong, W. Enhanced removal of organic contaminants in water by the combination of peroxymonosulfate and carbonate. Sci. Total Environ. 2018, 647, 734–743. [Google Scholar] [CrossRef]
- Yao, J.; Yu, B.; Li, H.; Yang, Y. Interfacial catalytic and mass transfer mechanisms of an electro-peroxone process for selective removal of multiple fluoroquinolones. Appl. Catal. B Environ. 2021, 298, 120608. [Google Scholar] [CrossRef]
- Kishimoto, N.; Nakagawa, T.; Asano, M.; Abe, M.; Yamada, M.; Ono, Y. Ozonation combined with electrolysis of 1,4-dioxane using a two-compartment electrolytic flow cell with solid electrolyte. Water Res. 2008, 42, 379–385. [Google Scholar] [CrossRef]
- Yuan, S.; Li, Z.; Wang, Y. Effective degradation of methylene blue by a novel electrochemically driven process. Electrochem. Commun. 2013, 29, 48–51. [Google Scholar] [CrossRef]
- Wu, N.; Zhang, R.; Lu, G.; Lin, Q.; Liu, F.; Li, Y. Degradation of Octocrylene Using Combined Ozonation and Electrolysis Process: Optimization by Response Surface Methodology. CLEAN—Soil Air Water 2017, 45, 1500664. [Google Scholar] [CrossRef]
- Yao, W.; Fu, J.; Yang, H.; Yu, G.; Wang, Y. The beneficial effect of cathodic hydrogen peroxide generation on mitigating chlorinated by-product formation during water treatment by an electro-peroxone process. Water Res. 2019, 157, 209–217. [Google Scholar] [CrossRef]
- Li, Y.; Shen, W.; Fu, S.; Yang, H.; Yu, G.; Wang, Y. Inhibition of bromate formation during drinking water treatment by adapting ozonation to electro-peroxone process. Chem. Eng. J. 2014, 264, 322–328. [Google Scholar] [CrossRef]
- Wu, D.; Lu, G.; Yao, J.; Zhou, C.; Liu, F.; Liu, J. Adsorption and catalytic electro-peroxone degradation of fluconazole by magnetic copper ferrite/carbon nanotubes. Chem. Eng. J. 2019, 370, 409–419. [Google Scholar] [CrossRef]
- Wu, D.; Lu, G.; Zhang, R.; Lin, Q.; Yao, J.; Shen, X.; Wang, W. Effective degradation of diatrizoate by electro-peroxone process using ferrite/carbon nanotubes based gas diffusion cathode. Electrochim. Acta 2017, 236, 297–306. [Google Scholar] [CrossRef]
- Bakheet, B.; Yuan, S.; Li, Z.; Wang, H.; Zuo, J.; Komarneni, S.; Wang, Y. Electro-peroxone treatment of Orange II dye wastewater. Water Res. 2013, 47, 6234–6243. [Google Scholar] [CrossRef] [PubMed]
- Wang, H.; Bakheet, B.; Yuan, S.; Li, X.; Yu, G.; Murayama, S.; Wang, Y. Kinetics and energy efficiency for the degradation of 1,4-dioxane by electro-peroxone process. J. Hazard. Mater. 2015, 294, 90–98. [Google Scholar] [CrossRef] [PubMed]
- Wu, D.; Zhou, C.; Lu, G.; Zhou, Y.; Shen, Y. Simultaneous membrane fouling mitigation and emerging pollutant benzophenone-3 removal by electro-peroxone process. Sep. Purif. Technol. 2019, 227, 115715. [Google Scholar] [CrossRef]
- Zhang, Y.; Zuo, S.; Zhang, Y.; Ren, G.; Pan, Y.; Zhang, Q.; Zhou, M. Simultaneous removal of tetracycline and disinfection by a flow-through electro-peroxone process for reclamation from municipal secondary effluent. J. Hazard. Mater. 2019, 368, 771–777. [Google Scholar] [CrossRef]
- Clesceri, L.S.; Greenberg, A.E.; Eaton, A.D. Standard Methods for the Examination of Water and Wastewater, 20th ed.; American Public Health Association: Washington, DC, USA, 1998. [Google Scholar]
- Sellers, R.M. Spectrophotometric determination of hydrogen peroxide using potassium titanium(IV) oxalate. Analyst 1980, 105, 950–954. [Google Scholar] [CrossRef]
- Von Gunten, U. Ozonation of drinking water: Part I. Oxidation kinetics and product formation. Water Res. 2003, 37, 1443–1467. [Google Scholar] [CrossRef]
- García-Morales, M.; Roa-Morales, G.; Barrera-Díaz, C.E.; Bilyeu, B.; Rodrigo, M.A. Synergy of electrochemical oxidation using boron-doped diamond (BDD) electrodes and ozone (O3) in industrial wastewater treatment. Electrochem. Commun. 2012, 27, 34–37. [Google Scholar] [CrossRef]
- Li, K.; Xu, L.; Zhang, Y.; Cao, A.; Wang, Y.; Huang, H.; Wang, J. A novel electro-catalytic membrane contactor for improving the efficiency of ozone on wastewater treatment. Appl. Catal. B Environ. 2019, 249, 316–321. [Google Scholar] [CrossRef]
- Nawrocki, J.; Kasprzyk-Hordern, B. The efficiency and mechanisms of catalytic ozonation. Appl. Catal. B Environ. 2010, 99, 27–42. [Google Scholar] [CrossRef]
- Niazmand, R.; Jahani, M.; Sabbagh, F.; Rezania, S. Optimization of Electrocoagulation Conditions for the Purification of Table Olive Debittering Wastewater Using Response Surface Methodology. Water 2020, 12, 1687. [Google Scholar] [CrossRef]
- Hamid, M.A.A.; Aziz, H.A.; Yusoff, M.S.; Rezan, S. Optimization and Analysis of Zeolite Augmented Electrocoagulation Process in the Reduction of High-Strength Ammonia in Saline Landfill Leachate. Water 2020, 12, 247. [Google Scholar] [CrossRef] [Green Version]
- Cussler, E.L. Diffusion: Mass Transfer in Fluid Systems, 3rd ed.; Cambridge University Press: Cambridge, UK, 2009. [Google Scholar]
- Von Sonntag, C.; von Gunten, U. Chemistry of Ozone in Water and Wastewater Treatment from Basic Principles to Applications; IWA Publishing: London, UK, 2012. [Google Scholar]
- Lee, Y.; Kovalova, L.; McArdell, C.S.; von Gunten, U. Prediction of micropollutant elimination during ozonation of a hospital wastewater effluent. Water Res. 2014, 64, 134–148. [Google Scholar] [CrossRef] [PubMed] [Green Version]
- Zhou, M.; Yu, Q.; Lei, L. The preparation and characterization of a graphite–PTFE cathode system for the decolorization of C.I. Acid Red 2. Dye. Pigment. 2008, 77, 129–136. [Google Scholar] [CrossRef]
Figure 1.
Schematic of experimental setup.

Figure 2.
Comparison of PABA degradation in various oxidation processes: (a) removal ratio and (b) the pseudo first-order reaction kinetics (Initial PABA concentration = ~10 mg/L; Gas flow rate = 0.2 L/min; Inlet O3 concentration = ~20 mg/L; Applied current = 20 mA/cm2; Initial solution pH = 6.9; Temperature = 25 ± 2 °C).

Figure 3.
The pseudo first-order reaction rate constants of various treatment processes. (Gas flow rate = 0.2 L/min; Inlet O3 concentration = ~20 mg/L; Applied current = 20 mA/cm2; Initial solution pH = 6.9; Temperature = 25 ± 2 °C).
Figure 3.
The pseudo first-order reaction rate constants of various treatment processes. (Gas flow rate = 0.2 L/min; Inlet O3 concentration = ~20 mg/L; Applied current = 20 mA/cm2; Initial solution pH = 6.9; Temperature = 25 ± 2 °C).

Figure 4.
Response surface showing the PABA elimination efficiency as a function of two independent variables at 10-min treatment: (a) inlet gaseous ozone concentration and initial solution pH, (b) solution temperature and initial solution pH, (c) current density and inlet gaseous ozone concentration, (d) solution temperature and inlet gaseous ozone concentration, (e) current density and initial solution pH, (f) solution temperature and current density.

Figure 5.
Time-dependent decay of pCBA in various treatment processes. (Gas flow rate = 0.2 L/min; Inlet O3 concentration = ~20 mg/L; Applied current = 20 mA/cm2; Temperature = 25 ± 2 °C).
Figure 5.
Time-dependent decay of pCBA in various treatment processes. (Gas flow rate = 0.2 L/min; Inlet O3 concentration = ~20 mg/L; Applied current = 20 mA/cm2; Temperature = 25 ± 2 °C).

Figure 6.
Profiles of pH in the E-peroxone and compartmental E-peroxone (cathode chamber) process. (Gas flow rate = 0.2 L/min; Inlet O3 concentration = ~20 mg/L; Applied current = 20 mA/cm2; Temperature = 25 ± 2 °C).
Figure 6.
Profiles of pH in the E-peroxone and compartmental E-peroxone (cathode chamber) process. (Gas flow rate = 0.2 L/min; Inlet O3 concentration = ~20 mg/L; Applied current = 20 mA/cm2; Temperature = 25 ± 2 °C).

Figure 7.
H2O2 generation in the electrolysis and compartmental electrolysis (cathode chamber) systems (O2 flow rate = 0.2 L/min; Applied current = 20 mA/cm2; Temperature = 25 ± 2 °C).
Figure 7.
H2O2 generation in the electrolysis and compartmental electrolysis (cathode chamber) systems (O2 flow rate = 0.2 L/min; Applied current = 20 mA/cm2; Temperature = 25 ± 2 °C).


Table 1.
Characteristics of the PABA.
| Common Name | Chemical Structure | MW (g/mol) |
|---|---|---|
| p-Aminobenzoic acid (C7H7NO2) |  | 137.14 |
Table 2.
Design matrix and the experimental responses.
| Exp. no. | Initial pH | O3 Dosage (mg/L) | Current Density (mA/cm2) | Reaction Temperature (°C) | Removal Efficiency (%) |
|---|---|---|---|---|---|
| 1 | 5 | 25 | 20 | 25 | 74.9 |
| 2 | 9 | 15 | 20 | 25 | 84.9 |
| 3 | 5 | 25 | 40 | 15 | 61.2 |
| 4 | 9 | 25 | 40 | 15 | 69.1 |
| 5 | 7 | 20 | 30 | 20 | 82.0 |
| 6 | 9 | 15 | 20 | 15 | 59.1 |
| 7 | 7 | 20 | 30 | 20 | 81.5 |
| 8 | 7 | 30 | 30 | 20 | 85.5 |
| 9 | 9 | 25 | 20 | 25 | 89.1 |
| 10 | 7 | 20 | 30 | 30 | 93.0 |
| 11 | 5 | 25 | 40 | 25 | 79.2 |
| 12 | 5 | 25 | 20 | 15 | 58.1 |
| 13 | 7 | 20 | 30 | 20 | 81.1 |
| 14 | 5 | 15 | 20 | 25 | 72.5 |
| 15 | 7 | 20 | 30 | 20 | 81.6 |
| 16 | 9 | 15 | 40 | 15 | 65.3 |
| 17 | 7 | 20 | 50 | 20 | 76.2 |
| 18 | 11 | 20 | 30 | 20 | 87.8 |
| 19 | 7 | 20 | 30 | 20 | 81.8 |
| 20 | 9 | 25 | 20 | 15 | 64.4 |
| 21 | 7 | 20 | 30 | 20 | 81.7 |
| 22 | 5 | 15 | 20 | 15 | 44.9 |
| 23 | 7 | 20 | 10 | 20 | 72.6 |
| 24 | 5 | 15 | 40 | 25 | 77.3 |
| 25 | 3 | 20 | 30 | 20 | 58.6 |
| 26 | 7 | 20 | 30 | 10 | 50.7 |
| 27 | 5 | 15 | 40 | 15 | 57.1 |
| 28 | 9 | 25 | 40 | 25 | 94.9 |
| 29 | 9 | 15 | 40 | 25 | 88.0 |
| 30 | 7 | 10 | 30 | 20 | 69.9 |
Table 3.
ANOVA and fit statistic for the quadratic model.
| Source | Sum of Squares | Degree of Freedom | Mean Square | f-Value | p-Value |
|---|---|---|---|---|---|
| Model | 4689.39 | 14 | 334.96 | 38.79 | <0.0001 |
| x1 | 912.67 | 1 | 912.67 | 105.68 | <0.0001 |
| x2 | 222.04 | 1 | 222.04 | 25.71 | 0.0001 |
| x3 | 110.08 | 1 | 110.08 | 12.75 | 0.0028 |
| x4 | 2952.60 | 1 | 2952.60 | 341.90 | <0.0001 |
| x1x2 | 0.12 | 1 | 0.12 | 0.014 | 0.9068 |
| x1 x3 | 1.32 | 1 | 1.32 | 0.15 | 0.7011 |
| x1 x4 | 16.81 | 1 | 16.81 | 1.95 | 0.1833 |
| x2 x3 | 4.41 | 1 | 4.41 | 0.51 | 0.4858 |
| x2 x4 | 7.56 | 1 | 7.56 | 0.88 | 0.3642 |
| x3 x4 | 4.20 | 1 | 4.20 | 0.49 | 0.4961 |
| x12 | 186.91 | 1 | 186.91 | 21.64 | 0.0003 |
| x22 | 60.52 | 1 | 60.52 | 7.01 | 0.0183 |
| x32 | 146.41 | 1 | 146.41 | 16.95 | 0.0009 |
| x42 | 238.36 | 1 | 238.36 | 27.60 | <0.0001 |
| Residual | 129.54 | 15 | 8.64 | ||
| Lack of fit | 129.07 | 10 | 12.91 | 137.80 | <0.0001 |
| Pure error | 0.47 | 5 | 0.094 | ||
| Corr. total | 4818.93 | 29 | |||
| R2 = 0.9731 R2Adj = 0.9480 R2pre = 0.8456 C.V.% = 3.96 | |||||
Publisher’s Note: MDPI stays neutral with regard to jurisdictional claims in published maps and institutional affiliations. |
© 2021 by the authors. Licensee MDPI, Basel, Switzerland. This article is an open access article distributed under the terms and conditions of the Creative Commons Attribution (CC BY) license (https://creativecommons.org/licenses/by/4.0/).
Share and Cite
MDPI and ACS Style
Wu, D.; Li, Y.; Lu, G.; Lin, Q.; Wei, L.; Zhang, P. Removal of Aqueous Para-Aminobenzoic Acid Using a Compartmental Electro-Peroxone Process. Water 2021, 13, 2961. https://doi.org/10.3390/w13212961
AMA Style
Wu D, Li Y, Lu G, Lin Q, Wei L, Zhang P. Removal of Aqueous Para-Aminobenzoic Acid Using a Compartmental Electro-Peroxone Process. Water. 2021; 13(21):2961. https://doi.org/10.3390/w13212961
Chicago/Turabian StyleWu, Donghai, Yuexian Li, Guanghua Lu, Qiuhong Lin, Lei Wei, and Pei Zhang. 2021. "Removal of Aqueous Para-Aminobenzoic Acid Using a Compartmental Electro-Peroxone Process" Water 13, no. 21: 2961. https://doi.org/10.3390/w13212961
Note that from the first issue of 2016, this journal uses article numbers instead of page numbers. See further details here.