
Analysis of the Economy-Wide Rebound Effect of Water Efficiency Improvement in China Based on a Multi-Sectoral Computable General Equilibrium Analysis


Abstract
:1. Introduction
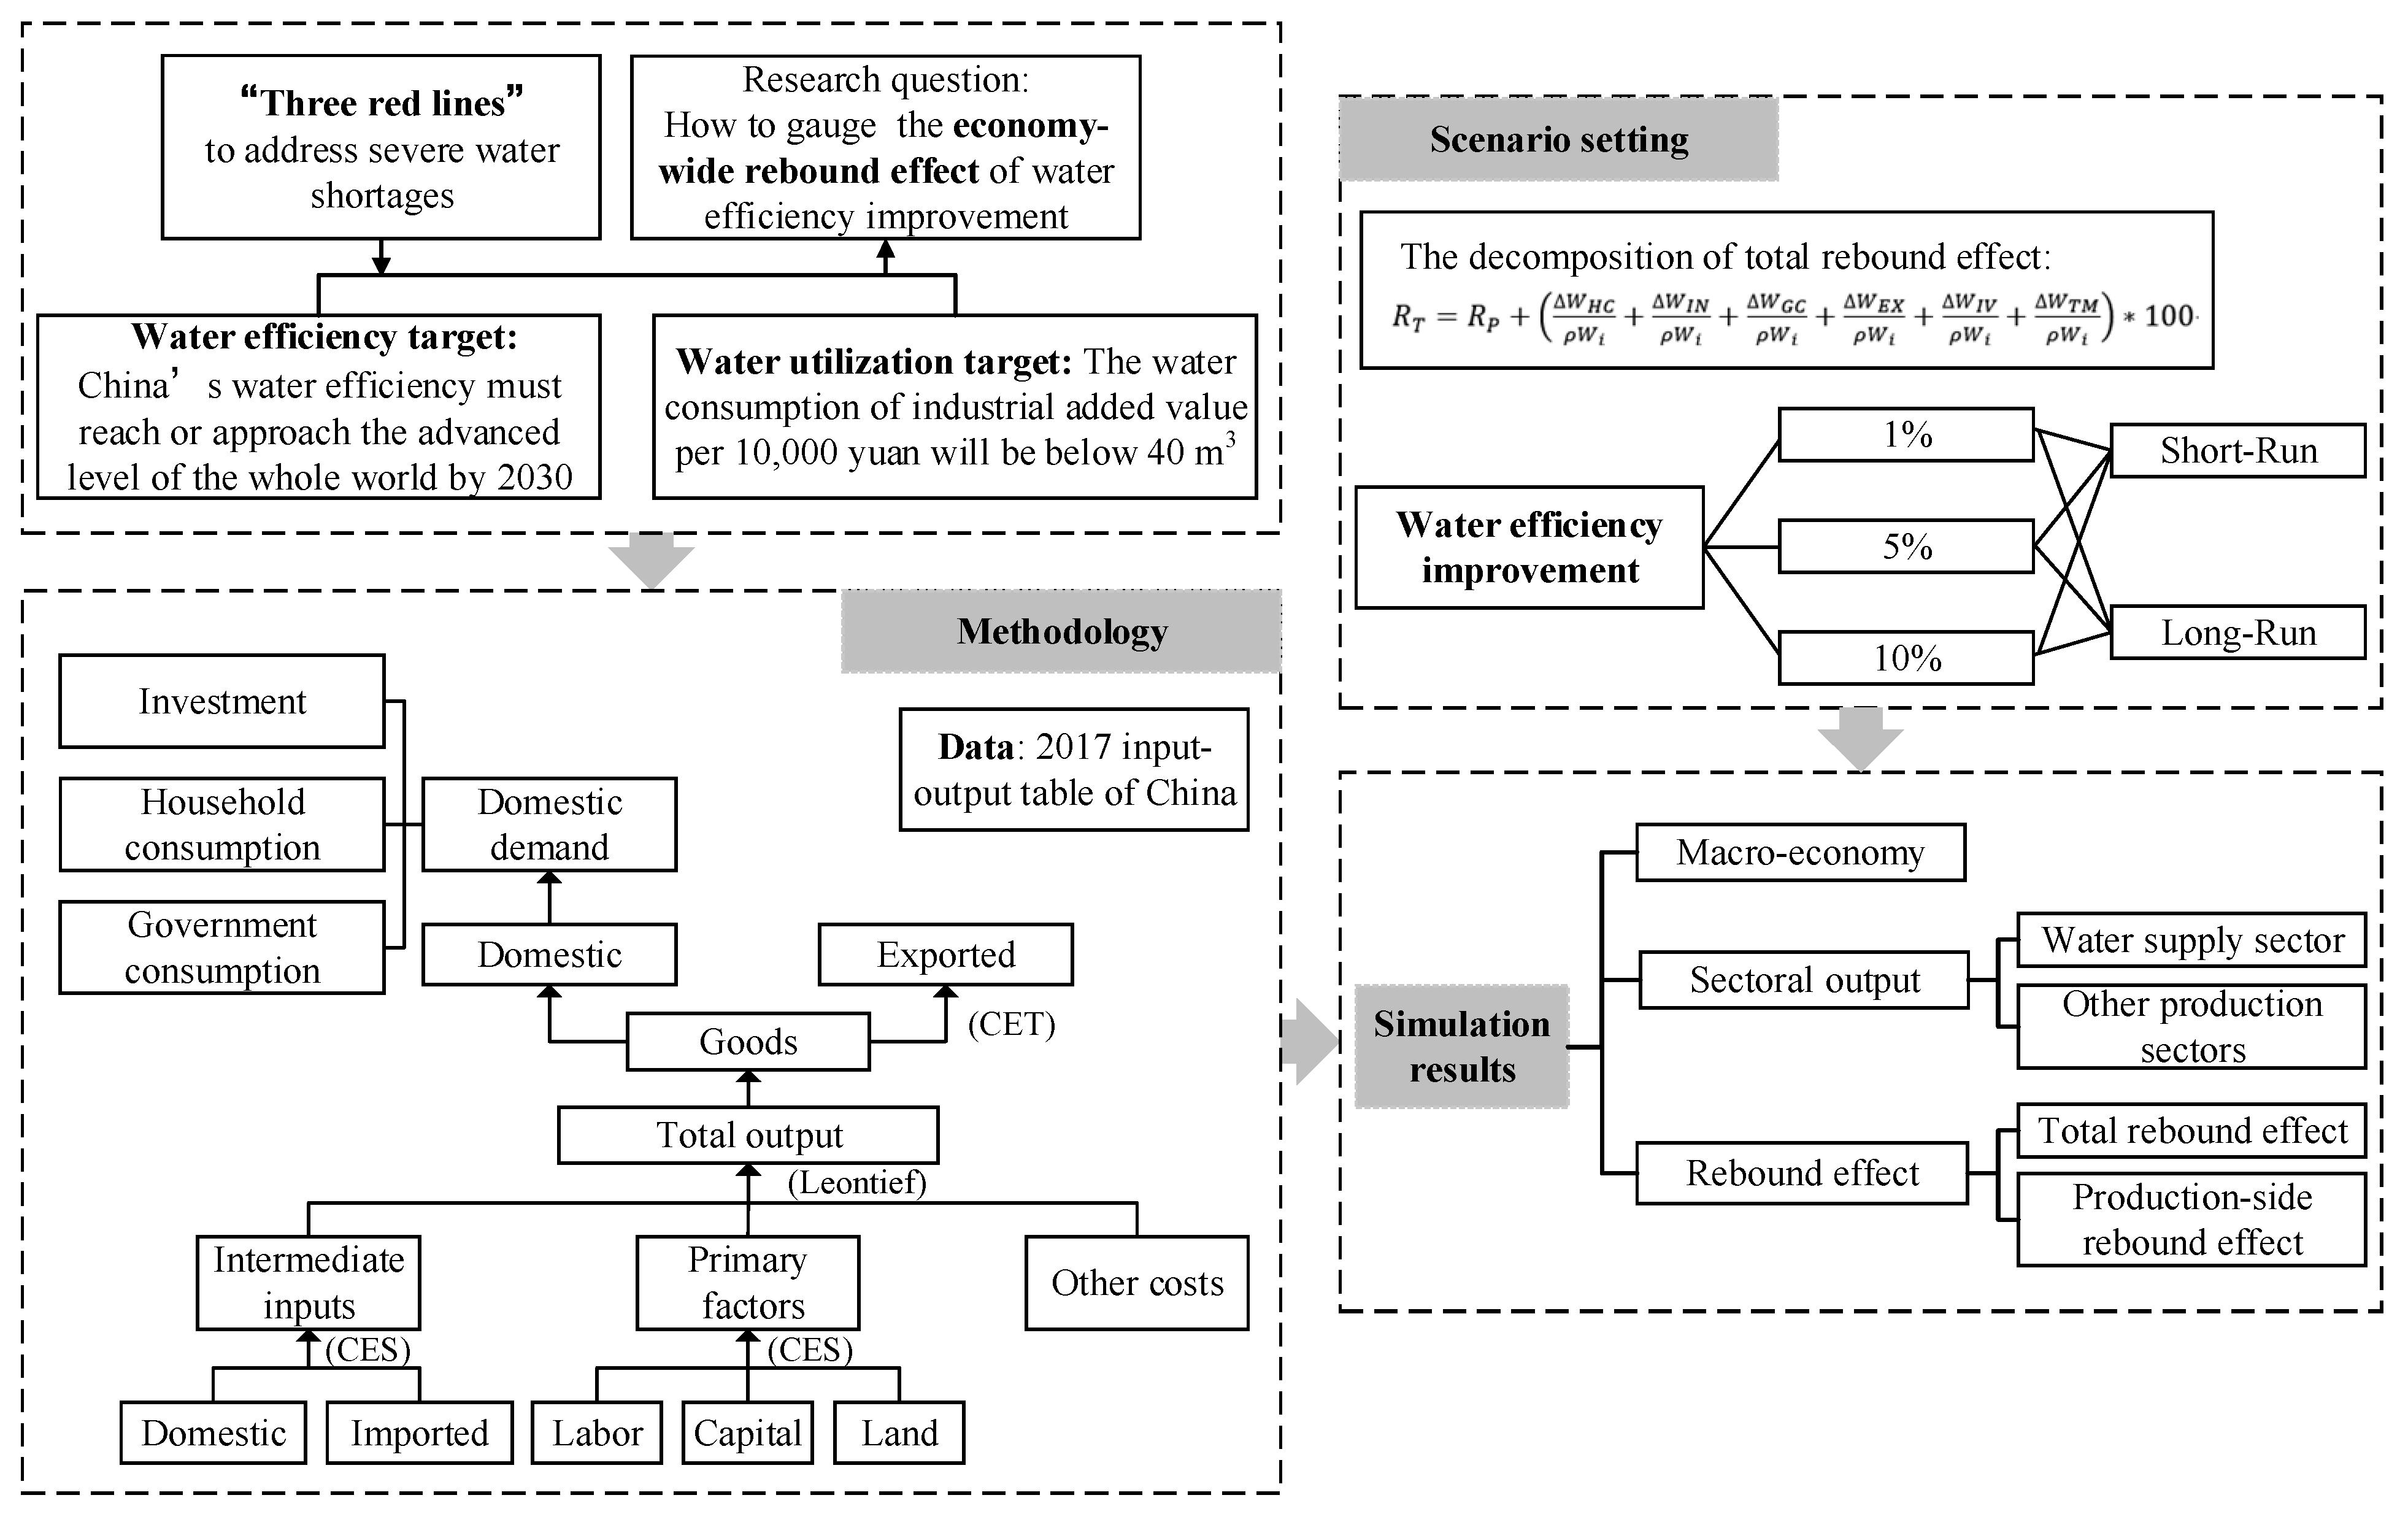
2. Methodology
2.1. The ORANIG Model
2.2. Data
3. Measurement of Rebound Effect and Scenario Design
3.1. Measurement of Rebound Effect of Water Efficiency Improvement
3.2. Scenarios
3.3. Closure
4. Simulation Results
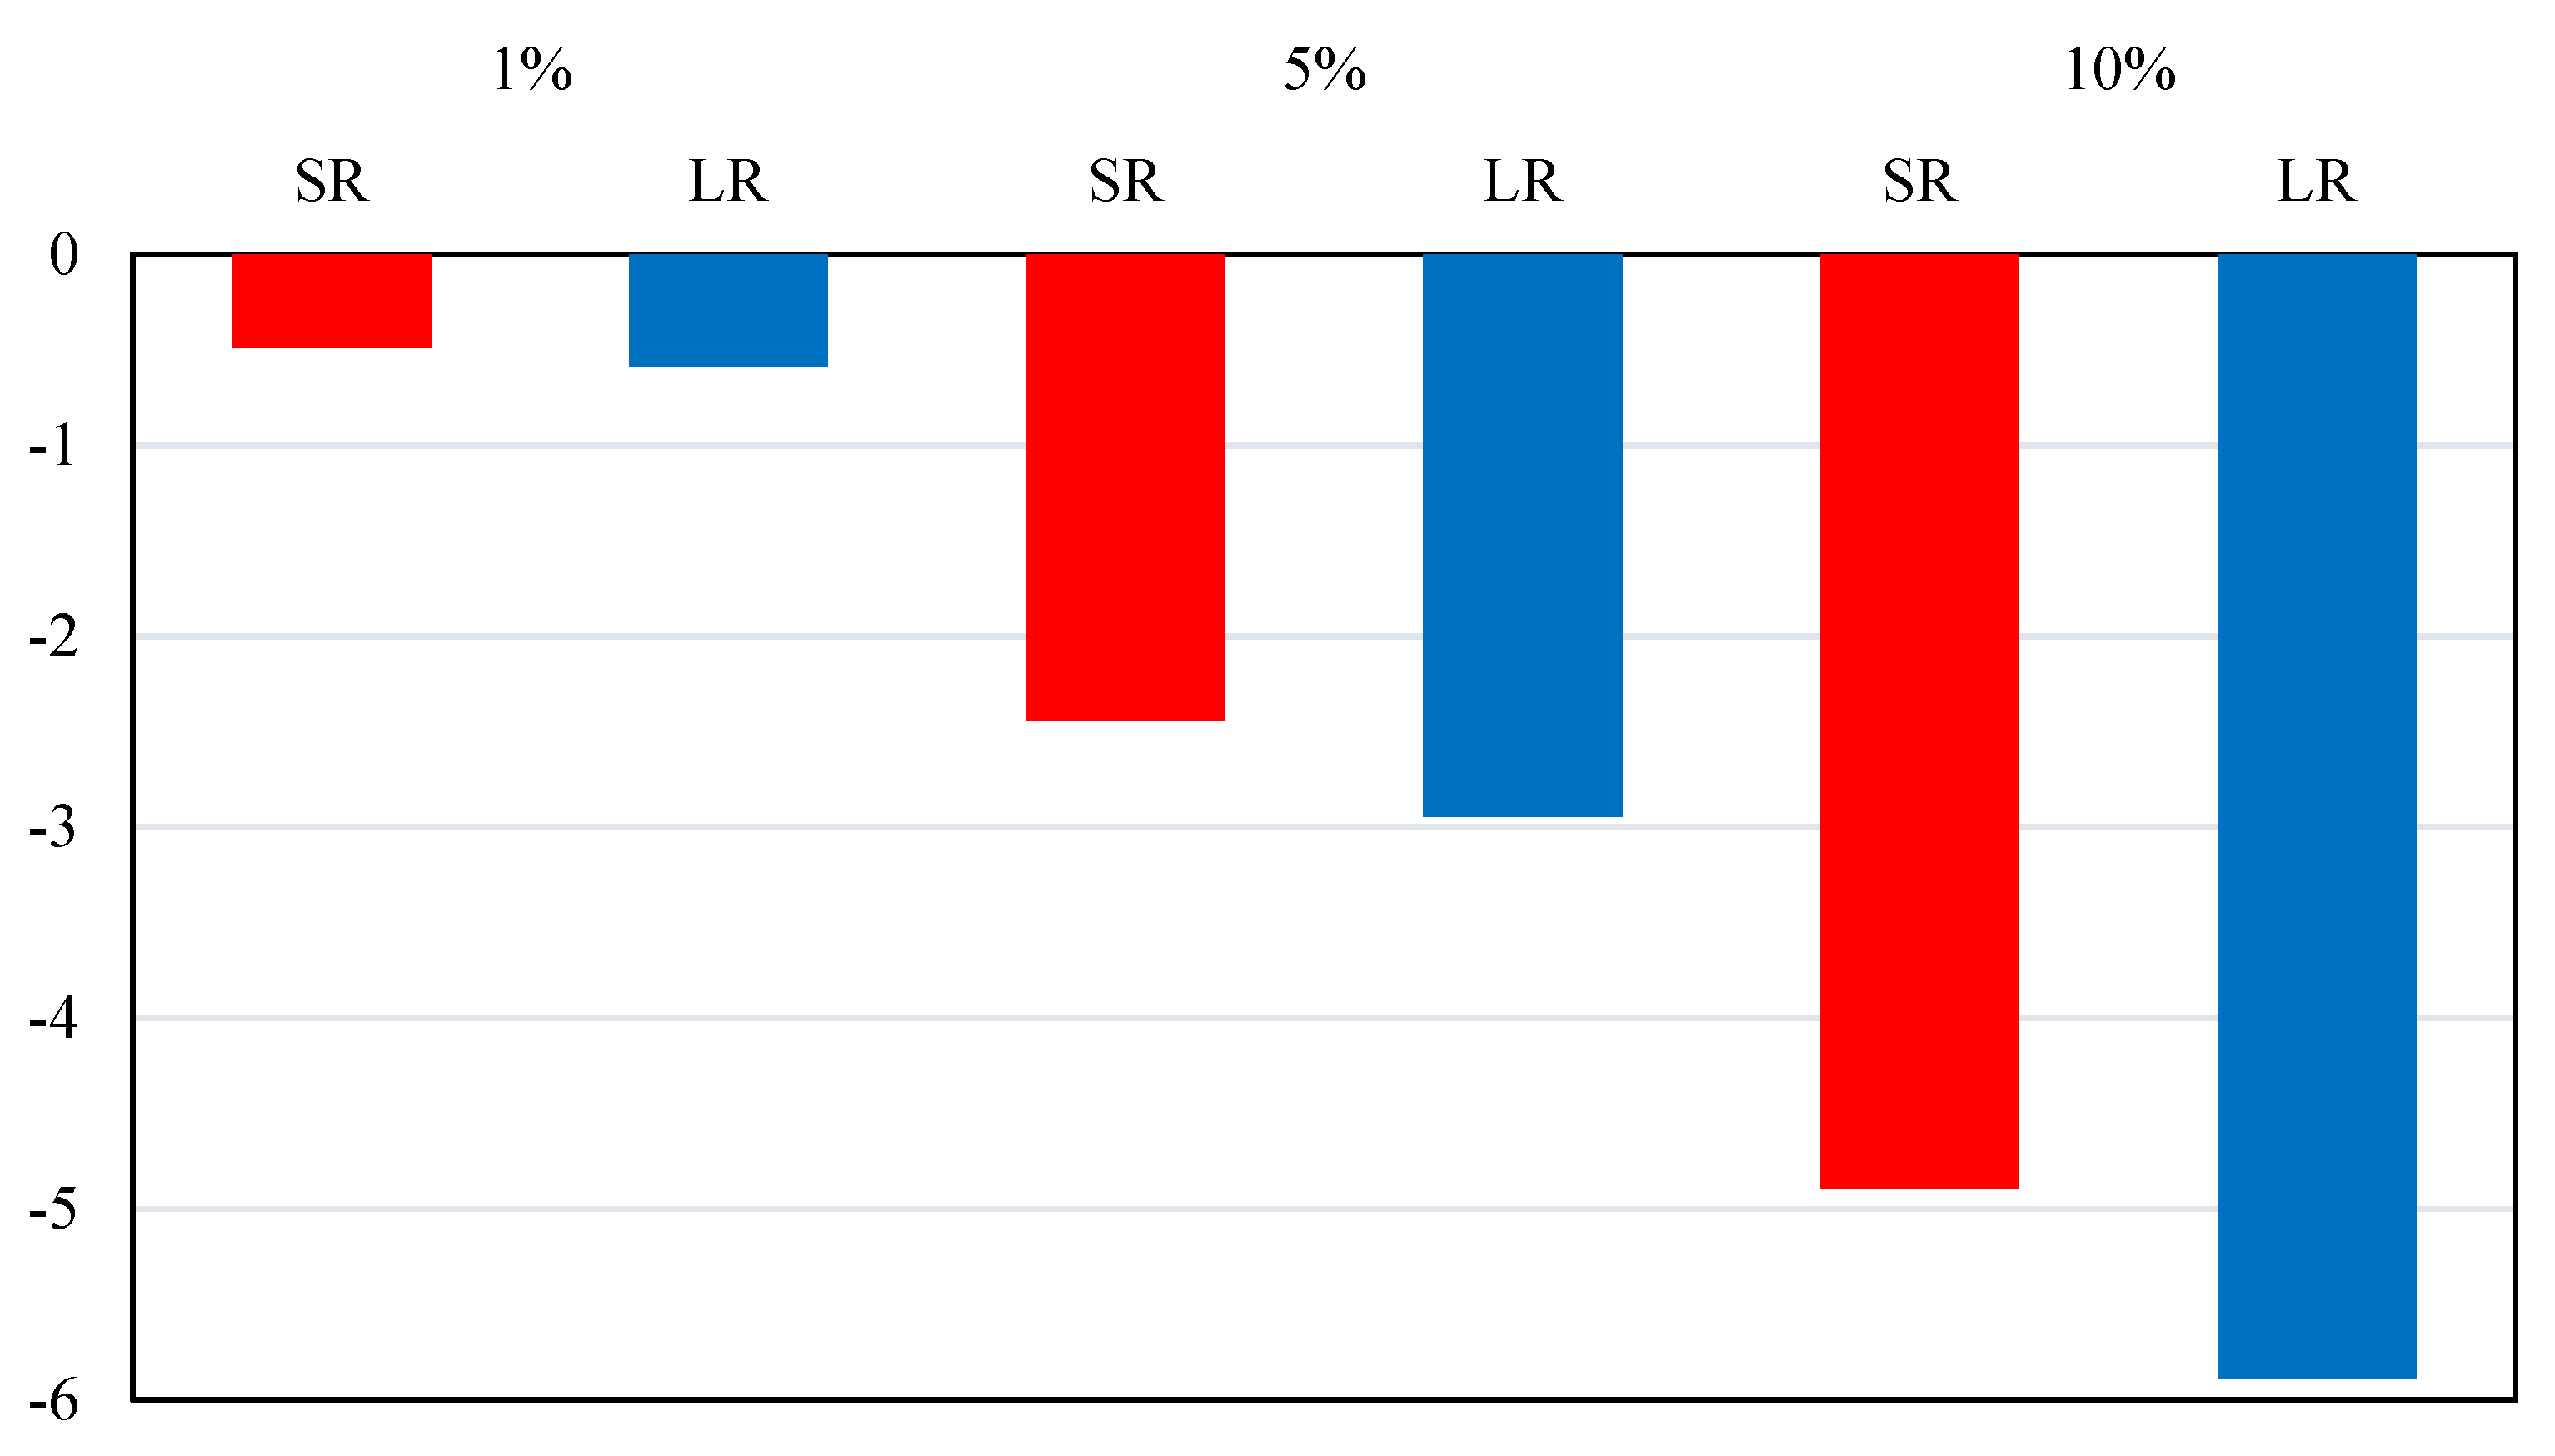
4.1. Macroeconomic Impact
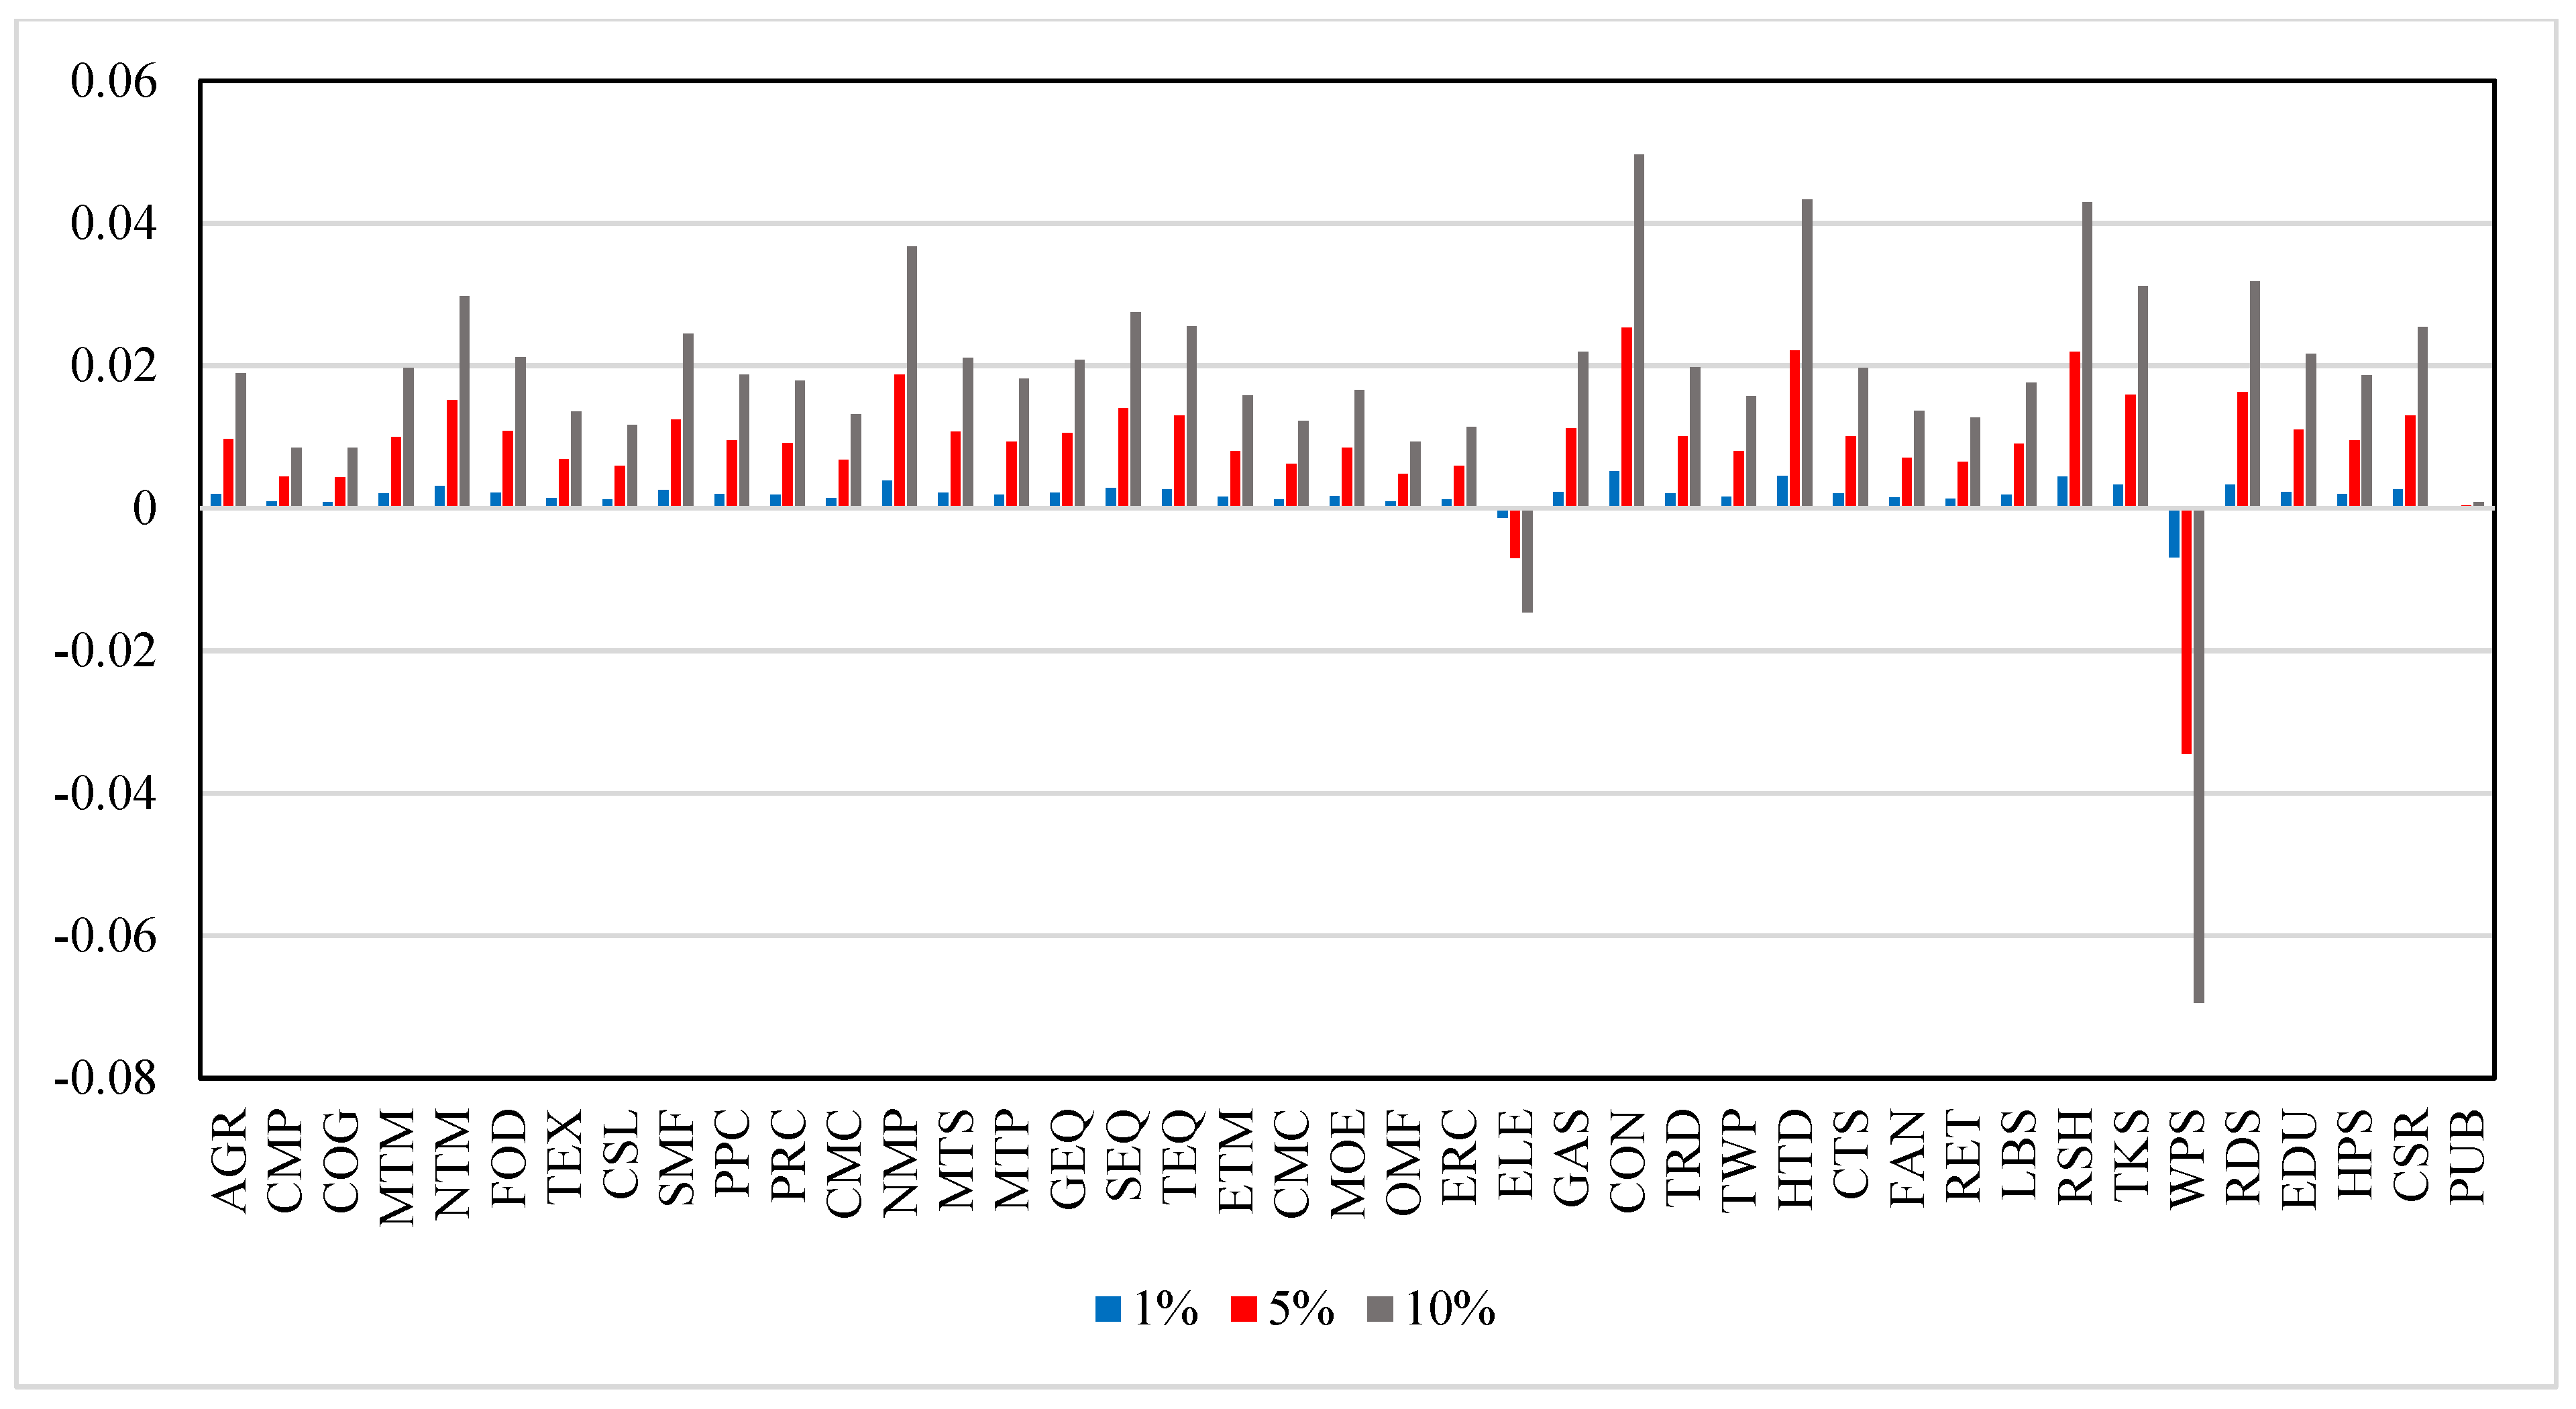
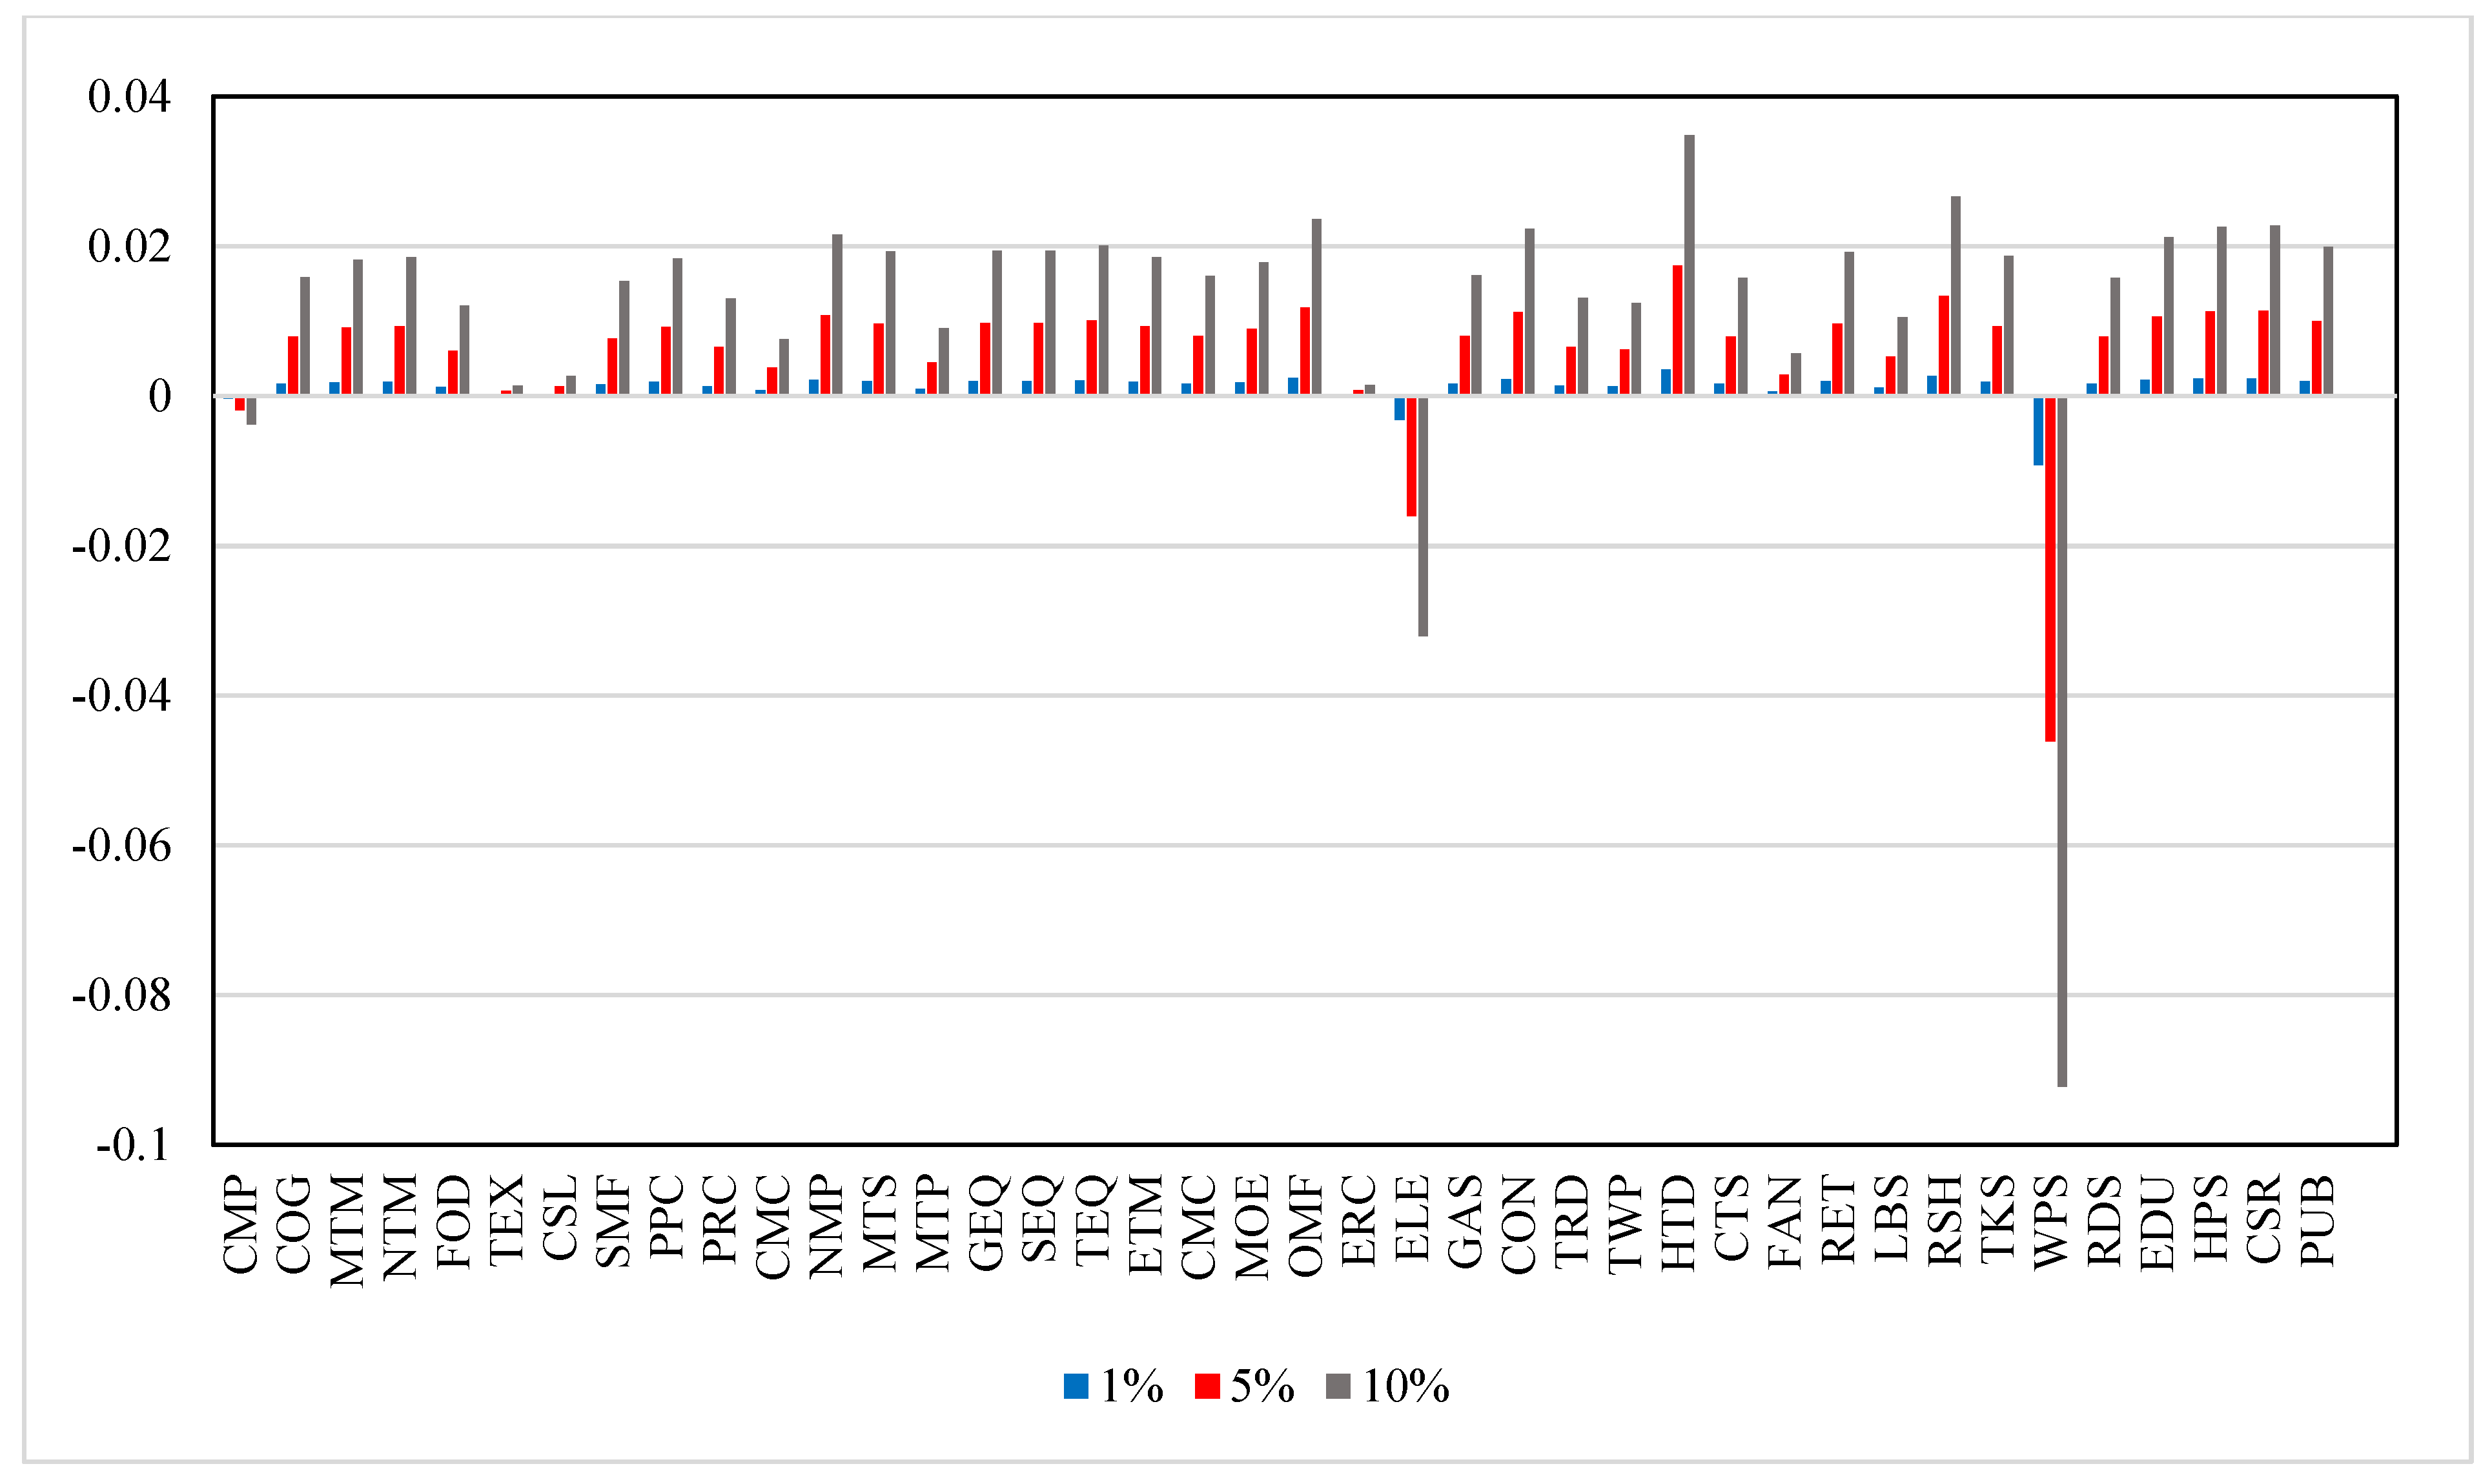
4.2. Impact on Producing Sectors’ Output
4.3. Rebound Effect of Water Efficiency Improvement
5. Discussion
6. Conclusions and Policy Implications
Author Contributions
Funding
Institutional Review Board Statement
Informed Consent Statement
Data Availability Statement
Conflicts of Interest
Appendix A

| Number | Sector | Abbreviation | Number | Sector | Abbreviation |
|---|---|---|---|---|---|
| 1 | Agriculture | AGR | 22 | Other manufacturing | OMF |
| 2 | Coal mining product | CMP | 23 | Equipment repair and recycling | ERC |
| 3 | Crude oil and gas | COG | 24 | Electricity supply | ELE |
| 4 | Metal mining | MTM | 25 | Gas supply | GAS |
| 5 | Nonmetal mining | NTM | 26 | Water supply | WTS |
| 6 | Food processing | FOD | 27 | Construction | CON |
| 7 | Textiles | TEX | 28 | Trade | TRD |
| 8 | Clothes, shoe, and leather | CSL | 29 | Transportation, warehouse, and post | TWP |
| 9 | Sawmill and furniture | SMF | 30 | Hotel and dining | HTD |
| 10 | Paper, printing, and cultural products | PPC | 31 | Computer and communication service | CTS |
| 11 | Petroleum and coke | PRC | 32 | Finance and insurance | FAN |
| 12 | Chemical product | CMC | 33 | Real estate | RET |
| 13 | Nonmetal product | NMP | 34 | Lease and business service | LBS |
| 14 | Metal smelting | MTS | 35 | Research | RSH |
| 15 | Metal products | MTP | 36 | Technology service | TKS |
| 16 | General equipment | GEQ | 37 | Water and environment service | WPS |
| 17 | Special equipment | SEQ | 38 | Residential service | RDS |
| 18 | Transportation equipment | TEQ | 39 | Education | EDU |
| 19 | Electrical machine | ETM | 40 | Health and public service | HPS |
| 20 | Communication equipment and computers | CMC | 41 | Culture, sport, and recreation | CSR |
| 21 | Meters and office equipment | MOE | 42 | Public administration | PUB |
References
- Ministry of Water Resources of the People’s Republic of China. China Water Resources Bulletin 2019. Available online: http://www.mwr.gov.cn/sj/tjgb/szygb/ (accessed on 9 July 2021).
- Chai, Q.; Gan, Y.; Turner, N.C.; Zhang, R.Z.; Yang, C.; Niu, Y.; Siddique, K.H.M. Water-saving innovations in Chinese agriculture. Adv. Agron. 2014, 126, 149–201. [Google Scholar]
- Song, J.; Guo, Y.; Wu, P.; Sun, S. The agricultural water rebound effect in China. Ecol. Econ. 2018, 146, 497–506. [Google Scholar] [CrossRef]
- Lankford, B.; Closas, A.; Dalton, J.; Gunn, E.L.; Hess, T.; Knox, J.W.; Van Der Kooij, S.; Lautze, J.; Molden, D.; Orr, S. A scale-based framework to understand the promises, pitfalls and paradoxes of irrigation efficiency to meet major water challenges. Glob. Environ. Chang. 2020, 65, 102182. [Google Scholar] [CrossRef]
- Fang, L.; Zhang, L. Does the trading of water rights encourage technology improvement and agricultural water conservation? Agric. Water Manag. 2020, 233, 106097. [Google Scholar] [CrossRef]
- Freire-González, J. Does Water Efficiency Reduce Water Consumption? The Economy-Wide Water Rebound Effect. Water Resour. Manag. 2019, 33, 2191–2202. [Google Scholar] [CrossRef]
- Berbel, J.; Gutiérrez-Martín, C.; Expósito, A. Impacts of irrigation efficiency improvement on water use, water consumption and response to water price at field level. Agric. Water Manag. 2018, 203, 423–429. [Google Scholar] [CrossRef]
- Velasco-Muñoz, J.F.; Aznar-Sánchez, J.A.; Batlles-delaFuente, A.; Fidelibus, M.D. Sustainable Irrigation in Agriculture: An Analysis of Global Research. Water 2019, 11, 1758. [Google Scholar] [CrossRef] [Green Version]
- Mateos, L.; Berengena, J.; Orgaz, F.; Diz, J.; Fereres, E. A comparison between drip and furrow irrigation in cotton at two levels of water supply. Agric. Water Manag. 1991, 19, 313–324. [Google Scholar] [CrossRef]
- Huang, Q.; Wang, J.; Li, Y. Do water saving technologies save water? Empirical evidence from North China. J. Environ. Econ. Manag. 2017, 82, 1–16. [Google Scholar] [CrossRef]
- Guo, A.; Jiang, D.; Zhong, F.; Ding, X.; Song, X.; Cheng, Q.; Zhang, Y.; Huang, C. Prediction of Technological Change under Shared Socioeconomic Pathways and Regional Differences: A Case Study of Irrigation Water Use Efficiency Changes in Chinese Provinces. Sustainability 2019, 11, 7103. [Google Scholar] [CrossRef] [Green Version]
- Birol, F.; Keppler, J.H. Prices, technology development and the rebound effect. Energy Policy 2000, 28, 457–469. [Google Scholar] [CrossRef]
- Saunders, H.D. Fuel conserving (and using) production functions. Energy Econ. 2008, 30, 2184–2235. [Google Scholar] [CrossRef]
- Turner, K. Negative rebound and disinvestment effects in response to an improvement in energy efficiency in the UK economy. Energy Econ. 2009, 31, 648–666. [Google Scholar] [CrossRef]
- Jevons, W.S. The Coal Question; Macmillan: New York, NY, USA, 2007; Volume 1865, pp. 59–89. [Google Scholar]
- Glomsrød, S.; Taoyuan, W. Coal cleaning: A viable strategy for reduced carbon emissions and improved environment in China? Energy Policy 2005, 33, 525–542. [Google Scholar] [CrossRef] [Green Version]
- Wang, Z.; Lu, M.; Wang, J.C. Direct rebound effect on urban residential electricity use: An empirical study in China. Renew. Sustain. Energy Rev. 2014, 30, 124–132. [Google Scholar] [CrossRef]
- Lin, B.; Li, J. The rebound effect for heavy industry: Empirical evidence from China. Energy Policy 2014, 74, 589–599. [Google Scholar] [CrossRef]
- Lu, Y.; Liu, Y.; Zhou, M. Rebound effect of improved energy efficiency for different energy types: A general equilibrium analysis for China. Energy Econ. 2017, 62, 248–256. [Google Scholar] [CrossRef] [Green Version]
- Zhou, M.; Liu, Y.; Feng, S.; Liu, Y.; Lu, Y. Decomposition of rebound effect: An energy-specific, general equilibrium analysis in the context of China. Appl. Energy 2018, 221, 280–298. [Google Scholar] [CrossRef]
- Sorrell, S.; Dimitropoulos, J.; Sommerville, M. Empirical estimates of the direct rebound effect: A review. Energy Policy 2009, 37, 1356–1371. [Google Scholar] [CrossRef]
- Wang, H.; Zhou, P.; Zhou, D.Q. An empirical study of direct rebound effect for passenger transport in urban China. Energy Econ. 2012, 34, 452–460. [Google Scholar] [CrossRef]
- Barker, T.; Ekins, P.; Foxon, T. The macro-economic rebound effect and the UK economy. Energy Policy 2007, 35, 4935–4946. [Google Scholar] [CrossRef]
- Broberg, T.; Berg, C.; Samakovlis, E. The economy-wide rebound effect from improved energy efficiency in Swedish industries–a general equilibrium analysis. Energy Policy 2015, 83, 26–37. [Google Scholar] [CrossRef] [Green Version]
- Wheeler, S.A.; Carmody, E.; Grafton, R.Q.; Kingsford, R.T.; Zuo, A. The rebound effect on water extraction from subsidising irrigation infrastructure in Australia. Resour. Conserv. Recycl. 2020, 159, 104755. [Google Scholar] [CrossRef]
- Gutierrez-Martin, C.; Gomez, C.M. Assessing Irrigation Efficiency Improvements by Using a Preference Revelation Model. Span. J. Agric. Res. 2011, 9, 1009–1020. [Google Scholar]
- Greening, L.A.; Greene, D.L.; Difiglio, C. Energy efficiency and consumption—the rebound effect—a survey. Energy Policy 2000, 28, 389–401. [Google Scholar] [CrossRef]
- Fei, R.; Xie, M.; Wei, X.; Ma, D. Has the water rights system reform restrained the water rebound effect? Empirical analysis from China’s agricultural sector. Agric. Water Manag. 2021, 246, 106690. [Google Scholar] [CrossRef]
- Guo, A.; Zhang, R.; Song, X.; Zhong, F.; Jiang, D.; Song, Y. Predicting the Water Rebound Effect in China under the Shared Socioeconomic Pathways. Int. J. Environ. Res. Public Health 2021, 18, 1326. [Google Scholar] [CrossRef]
- Xu, H.; Yang, R.; Song, J. Agricultural Water Use Efficiency and Rebound Effect: A Study for China. Int. J. Environ. Res. Public Health 2021, 18, 7151. [Google Scholar] [CrossRef]
- Shi, Q.; Ren, H.; Cai, W.; Gao, J. How to set the proper level of carbon tax in the context of Chinese construction sector? A CGE analysis. J. Clean. Prod. 2019, 240, 117955. [Google Scholar] [CrossRef]
- Chen, H.; He, L.; Chen, J.; Yuan, B.; Huang, T.; Cui, Q. Impacts of Clean Energy Substitution for Polluting Fossil-Fuels in Terminal Energy Consumption on the Economy and Environment in China. Sustainability 2019, 11, 6419. [Google Scholar] [CrossRef] [Green Version]
- Cui, Q.; Liu, Y.; Ali, T.; Gao, J.; Chen, H. Economic and climate impacts of reducing China’s renewable electricity curtailment: A comparison between CGE models with alternative nesting structures of electricity. Energy Econ. 2020, 91, 104892. [Google Scholar] [CrossRef]
- Cui, Q.; He, L.; Liu, Y.; Zheng, Y.; Wei, W.; Yang, B.; Zhou, M. The impacts of COVID-19 pandemic on China’s transport sectors based on the CGE model coupled with a decomposition analysis approach. Transp. Policy 2021, 103, 103–115. [Google Scholar] [CrossRef]
- Saunders, H.D. A view from the macro side: Rebound, backfire, and Khazzoom–Brookes. Energy Policy 2000, 28, 439–449. [Google Scholar] [CrossRef]
- Turner, K. “Rebound” effects from increased energy efficiency: A time to pause and reflect. Energy J. 2013, 34, 25–42. [Google Scholar] [CrossRef] [Green Version]
- Hanley, N.D.; McGregor, P.G.; Swales, J.K.; Turner, K. Do increases in energy efficiency improve environmental quality and sustainability? Ecol. Econ. 2009, 68, 692–709. [Google Scholar] [CrossRef]
- Lecca, P.; McGregor, P.G.; Swales, J.K.; Turner, K. The added value from a general equilibrium analysis of increased efficiency in household energy use. Ecol. Econ. 2014, 100, 51–62. [Google Scholar] [CrossRef] [Green Version]
- Koesler, S.; Swales, K.; Turner, K. Beyond National Economy-wide Rebound Effects. An applied general equilibrium analysis incorporating international spillover effects. In Proceedings of the 37th IAEE International Conference, New York, NY, USA, 15–18 June 2014. [Google Scholar]
- Wang, Y.; Long, A.; Xiang, L.; Deng, X.; Zhang, P.; Hai, Y.; Wang, J.; Li, Y. The verification of Jevons’ paradox of agricultural Water conservation in Tianshan District of China based on Water footprint. Agric. Water Manag. 2020, 239, 106163. [Google Scholar] [CrossRef]
- Fang, L.; Wu, F.; Yu, Y.; Zhang, L. Irrigation technology and water rebound in China’s agricultural sector. J. Ind. Ecol. 2020, 24, 1088–1100. [Google Scholar] [CrossRef]
- Zink, T.; Geyer, R. Circular Economy Rebound. J. Ind. Ecol. 2017, 21, 593–602. [Google Scholar] [CrossRef]
- Godoy-Faúndez, A.; Rivera, D.; Aitken, D.; Herrera, M.; El Youssfi, L. Circular Economy in a Water-Energy-Food Security Nexus Associate to an SDGs Framework: Understanding Complexities. In An Introduction to Circular Econom; Springer: Singapore, 2021; pp. 219–239. [Google Scholar]
- Siderius, T.; Poldner, K. Reconsidering the Circular Economy Rebound effect: Propositions from a case study of the Dutch Circular Textile Valley. J. Clean Prod. 2021, 293, 125996. [Google Scholar] [CrossRef]
- Figge, F.; Thorpe, A.S. The symbiotic rebound effect in the circular economy. Ecol. Econ. 2019, 163, 61–69. [Google Scholar] [CrossRef]
- Paul, C.; Techen, A.K.; Robinson, J.S.; Helming, K. Rebound effects in agricultural land and soil management: Review and analytical framework. J. Clean Prod. 2019, 227, 1054–1067. [Google Scholar] [CrossRef]
- Shao, S.; Guo, L.; Yu, M.; Yang, L.; Guan, D. Does the rebound effect matter in energy import-dependent mega-cities? Evidence from Shanghai (China). Appl. Energy 2019, 241, 212–228. [Google Scholar] [CrossRef] [Green Version]
- Dong, L. China’s renewed perception of global environmental governance. Chin. J. Popul. Resour. Environ. 2020, 18, 319–323. [Google Scholar] [CrossRef]
- Van Rooyen, A.F.; Moyo, M.; Bjornlund, H.; Dube, T.; Parry, K.; Stirzaker, R. Identifying leverage points to transition dysfunctional irrigation schemes towards complex adaptive systems. Int. J. Water Resour. Dev. 2020, 36, S171–S198. [Google Scholar] [CrossRef]
- Sadoff, C.W.; Borgomeo, E.; Uhlenbrook, S. Rethinking water for SDG 6. Nat. Sustain. 2020, 3, 346–347. [Google Scholar] [CrossRef]
- Matchaya, G.; Nhamo, L.; Nhlengethwa, S.; Nhemachena, C. An Overview of Water Markets in Southern Africa: An Option for Water Management in Times of Scarcity. Water 2019, 11, 1006. [Google Scholar] [CrossRef] [Green Version]
- Zhou, X.Y. Spatial explicit management for the water sustainability of coupled human and natural systems. Environ. Pollut. 2019, 251, 292–301. [Google Scholar] [CrossRef]
- He, J.; Li, Z.; Zhang, X.; Wang, H.; Dong, W.; Chang, S.; Ou, X.; Guo, S.; Tian, Z.; Gu, A. Comprehensive report on China’s Long-Term Low-Carbon Development Strategies and Pathways. Chin. J. Popul. Resour. Environ. 2020, 18, 263–295. [Google Scholar] [CrossRef]


| Short-Run Closure | Long-Run Closure | |||||
|---|---|---|---|---|---|---|
| 1% | 5% | 10% | 1% | 5% | 10% | |
| GDP | 0.0030 | 0.0149 | 0.0293 | 0.0022 | 0.0108 | 0.0215 |
| CPI | −0.0007 | −0.0033 | −0.0066 | −0.0002 | −0.0010 | −0.0020 |
| Investment | 0.0052 | 0.0258 | 0.0505 | 0.0023 | 0.0113 | 0.0226 |
| Household consumption | 0.0035 | 0.0173 | 0.0341 | 0.0020 | 0.0101 | 0.0202 |
| Exports | −0.0009 | −0.0044 | −0.0084 | 0.0012 | 0.0058 | 0.0116 |
| Imports | 0.0025 | 0.0120 | 0.0233 | 0.0006 | 0.0028 | 0.0055 |
| Employment | 0.0023 | 0.0114 | 0.0223 | 0.0000 | 0.0000 | 0.0000 |
| Labor price | −0.0007 | −0.0033 | −0.0066 | 0.0030 | 0.0149 | 0.0298 |
| Capital stock | 0.0000 | 0.0000 | 0.0000 | 0.0013 | 0.0064 | 0.0128 |
| Capital price | 0.0048 | 0.0240 | 0.0473 | −0.0006 | −0.0031 | −0.0062 |
| Short-Run Closure | Long-Run Closure | |||||
|---|---|---|---|---|---|---|
| 1% | 5% | 10% | 1% | 5% | 10% | |
| Rt | 13.1096 | 13.6153 | 14.2236 | 5.1443 | 5.1502 | 5.1576 |
| Rp | 0.4310 | 1.1811 | 2.0868 | 0.1226 | 0.1296 | 0.1352 |
Publisher’s Note: MDPI stays neutral with regard to jurisdictional claims in published maps and institutional affiliations. |
© 2021 by the authors. Licensee MDPI, Basel, Switzerland. This article is an open access article distributed under the terms and conditions of the Creative Commons Attribution (CC BY) license (https://creativecommons.org/licenses/by/4.0/).
Share and Cite
Zhou, Y.; Li, J.; Wei, W.; Cui, Q.; He, L. Analysis of the Economy-Wide Rebound Effect of Water Efficiency Improvement in China Based on a Multi-Sectoral Computable General Equilibrium Analysis. Water 2021, 13, 2963. https://doi.org/10.3390/w13212963
Zhou Y, Li J, Wei W, Cui Q, He L. Analysis of the Economy-Wide Rebound Effect of Water Efficiency Improvement in China Based on a Multi-Sectoral Computable General Equilibrium Analysis. Water. 2021; 13(21):2963. https://doi.org/10.3390/w13212963
Chicago/Turabian StyleZhou, Yexin, Jinghan Li, Wei Wei, Qi Cui, and Ling He. 2021. "Analysis of the Economy-Wide Rebound Effect of Water Efficiency Improvement in China Based on a Multi-Sectoral Computable General Equilibrium Analysis" Water 13, no. 21: 2963. https://doi.org/10.3390/w13212963