
Cyclones and Global Floods from an Observation-Simulation Evaluation: Contributions and Long-Term Changes


1
Department of Atmospheric Science, School of Environmental Studies, China University of Geosciences, Wuhan 430074, China
2
Key Laboratory of Environmental Change and Natural Disaster, Ministry of Education, Beijing Normal University, Beijing 100875, China
3
Collaborative Innovation Center for Western Ecological Safety, Lanzhou University, Lanzhou 730000, China
4
Key Laboratory of Geospatial Technology for Middle and Lower Yellow River Regions, Henan University, Ministry of Education, Kaifeng 475001, China
5
Department of Civil and Environmental Engineering, Princeton University, Princeton, NJ 08544, USA
*
Author to whom correspondence should be addressed.
Water 2021, 13(21), 2965; https://doi.org/10.3390/w13212965
Submission received: 28 September 2021
/
Revised: 15 October 2021
/
Accepted: 15 October 2021
/
Published: 20 October 2021
(This article belongs to the Section Hydrology)
Abstract
:As two of the most destructive natural disasters, tropical cyclones (TCs) and extratropical cyclones (ETCs) can bring about huge casualties and socioeconomic losses to the major continents. However, little is known about the contributions of TCs and ETCs to global flooding and the spatial-temporal variations both in the magnitude and frequency of cyclone-related floods. We collected, to our knowledge, the most complete global streamflow dataset with at least 25-year complete records between 1979 and 2012. Using this observed streamflow dataset and simulated runoff dataset from ERA5 reanalysis, for the first time at the global scale, our results show that the highest contributions of TCs to annual floods occur in coastal areas of East Asia and Australia (both > 40%), followed by North America (>25%), with a general decrease from coastline to inland, while the highest contributions of ETCs to annual floods occur in Eurasia (>70%) and North America (>60%), followed by South America and South Africa (>50%). Seasonally, TC-induced floods are clustered to occur in boreal (austral) summer and autumn, respectively, in the Northern (Southern) Hemisphere, while there is no significant difference in ETC-induced floods among the four seasons. Additionally, contributions of cyclones to floods in simulations are highly consistent with the observations. Except for East Asia, both the magnitude and frequency of TC-induced floods show increasing trends in South Asia, coastal North America, Mexico, north Australia and southeastern South Africa, which is basically and directly explained by increasing TC tracks, duration and density in these areas. For ETCs, widespread decreasing trends in magnitude and frequency of ETC-induced floods were detected across Eurasia, South America, and most of North America. Changes in large-scale environmental variables also correspond well to cyclone activities, which further confirms the reasonable trends in magnitude and frequency of cyclone floods.
1. Introduction
Heavy precipitation events triggered by tropical cyclones (TCs) and extratropical cyclones (ETCs) and their concomitants can be an evil in terms of accompanying flooding [1,2,3,4,5,6,7] and other disasters (e.g., strong winds, coastal erosion, and so on) [8], or an angel in terms of mitigating drought in agricultural and arid regions [9,10,11,12,13,14,15]. Strong and landfalling TCs are apt to produce rainstorms, which could cause huge damages to population and socioeconomic developments [15,16,17]. Under a warmer climate, TC-introduced precipitation could increase by 10–20% if global sea surface temperature increases by 2 °C [12,18]. North America witnessed an increasing trend in the intensity of ETC and associated heavy precipitation [8,19]. The possible increases in heavy precipitation driven by TCs and ETCs would lead to an increasing trend in TC- and ETC-induced floods (TC floods and ETC floods, respectively). Floods induced by TCs and/or ETCs are marked as cyclone floods.
Cyclone-derived precipitation, a crucial ingredient for floods, has been extensively investigated at global and regional scales in previous studies [13,20,21,22,23,24]. Globally, and using daily precipitation data derived from the Global Historical Climatology Network, Khouakhi et al. [25] found that the largest TC-induce precipitation total exists in eastern Asia (>400 mm/year), followed by the northeastern Australia (>200 mm/year) and the areas including the southeastern America and the Gulf of Mexico coastline (100–150 mm/year). By using satellite and radar precipitation datasets, Jiang and Zipser [20] pointed out that TCs contribute 11% and 8–9% of the seasonal precipitation in the northwest Pacific and Atlantic domains, respectively. Regionally, in Australia, most areas are fiercely impacted by TCs, and more than 50% of the highest yearly precipitation is related to the occurrence of these storms [13]. For North America, TCs from the North Atlantic contribute to ~20–30% of the annual maximum and peak-over-threshold precipitation extremes in Florida and the east coast of America [26]. There are more than 50% of precipitation extremes induced by TCs in the southeast coast of China, and TC-induced precipitation is increasing in southeast China and decreasing in southern China [15]. Previous studies on ETC-induced precipitation relative to TC-induced ones are limited. For example, Priestley et al. [27] found that more than 70% of the winter precipitation is associated with ETCs over northwest Europe. Catto et al. [28] found that the ETC-track areas witnessed 90% of precipitation associated with ETCs and fronts. In northeastern China, about 71% of the heavy precipitation days are triggered by ETCs in winter [29]. In comparison with studies on the contributions of cyclones to precipitation, research discussing the contributions of cyclones to global floods is limited and scarce.
Although the relationship between cyclones and precipitation can provide a basic perspective on understanding cyclone floods, it is still not explicit enough given that floods are affected by many land-surface processes (e.g., soil moisture storage, surface temperature, latent heating, rising sea level, land use and land cover) [30]. Besides, some large-scale atmosphere-ocean interactions (e.g., El Niño Southern Oscillation) have a significant influence on the dynamics of the TC and climate and weather in many regions across the world [31,32]. Regionally, several studies evaluated the contributions of TCs to riverine flooding by directly linking TCs and flooding [26,33,34]. There are 20–30% of floods induced by TCs over the coast of eastern United States [26]. This percentage of TC floods is even more than 50% over the coast of southeastern China [34,35]. When focusing on the top 10 floods in each station, the percentage of TC floods is even higher over the coast of the United States and China [35,36]. TCs also play a major role in inland flooding, shown by high ratios between magnitudes of TC floods and 10-year floods (i.e., on average occurring once in 10 years) in inland areas [12,23]. In southeastern Australia, Callaghan and Power [37] compared ETC floods with TC floods, and found that ETC contributed more floods than TCs (62% versus 43%) during 1860–2012. In addition to TCs, Hawcroft et al. [19] found that Europe and North America witnessed more than a threefold increase in ETC events at the end of the 21st century, which are associated with heavy precipitation and may play a primary role in floods. Although these studies have analyzed the impacts of cyclones on floods at a regional scale, different length records, methods, and spatiotemporal resolutions in these studies make it hard to compare their results. There is a gap in evaluating long-term changes in cyclone-induced floods from a global viewpoint, possibly due to lacking a uniform and long-term global streamflow dataset.
The magnitude and frequency of cyclone floods are strongly affected by variations of cyclone tracks, duration, and intensity [1,8]. There are plenty of studies that focus on cyclone changes from a regional scale. For example, west Australia has increased TC frequency, intensity, and longevity, whereas fewer TC events and no significant trends of intensity and longevity were found in the east part of Australia since 1980 [38]. McCabe et al. [39] illustrated that ETC events have increased in high-latitude areas and have decreased in mid-latitude areas, while the cyclone intensity of both high- and mid-latitude areas underwent an increasing trend at 1959–1979. Nevertheless, whether there are consensuses between changes in cyclone features and cyclone-induced floods globally remains unknown. Given predictable cyclone activities, quantifying the change rate of cyclone floods could provide the potential to examine historic variation patterns and therefore predict global cyclone flooding hazards.
In this study, we first collected the most complete and long-term global streamflow dataset, as far as we know. Based on this dataset and simulated runoff, we conducted the first global study to show a consistent evaluation of the contributions of cyclones to global floods and long-term trends of cyclone-induced floods in magnitude and frequency. Therefore, the questions we try to address are listed as follows:
- What are the fractional contributions of cyclones (including tropical and extratropical cyclones) to global floods?
- Do the magnitude and frequency of cyclone-induced floods change spatially and temporally?
- If yes, could these changes in cyclone-induced floods be explained by changes in cyclone features and large-scale environmental variables?
2. Data and Methods
2.1. Data
2.1.1. Observed Streamflow Data
The daily streamflow observations during 1900–2018 from 20,346 stations were collected as part of a previous study [40]. The dataset was compiled from 7 national and international sources: (i) Australian Bureau of Meteorology (http://www.bom.gov.au/waterdata, 7 August 2020); (ii) The HidroWeb portal of the Brazilian Agência Nacional de Águas (http://www.snirh.gov.br/hidroweb, 7 August 2020); (iii) The Canada National Water Data Archive (https://www.canada.ca/en/environment-climate-change, 7 August 2020); (iv) The Chilean Center for Climate and Resilience Research (http://www.cr2.cl/datos-de-caudales/, 15 March 2020); (v) The European Water Archive of the European Flow Regimes from International Experimental and Network Data (http://ne-friend.bafg.de, 7 August 2020); (vi) The Global Runoff Data Centre (http://grdc.bafg.de, 7 August 2020); (vii) The U.S. Geological Survey (http://waterdata.usgs.gov/nwis, 7 August 2020). The above dataset only has a few stations located in China as streamflow data are generally not freely available in China. To obtain as much streamflow data as possible, we therefore collected observed daily streamflow through all available public sources and personal request to water-related agencies in China (Table 1). Finally, daily observed streamflow data in 223 stations that were mainly located in the TC-affected region of China were obtained.
In addition to daily streamflow datasets, a global flood peak dataset (i.e., Global Streamflow Indices and Metadata Archive, GSIM, https://doi.pangaea.de/10.1594/PANGAEA.887477, 3 March 2020) including 30,959 stations and covering 1804–2016 was recently developed by Do et al. [41] and Gudmundsson et al. [42]. The flood peaks in this dataset are defined as annual/seasonal maximum discharge, and were quality-controlled and homogeneity-assessed. The date information corresponding to flood peaks is also provided. The stations with flood peaks in GSIM are very scarce in China, and therefore, flood peaks over 1951–2014 in 58 stations located in Guangdong province, southeastern China, were supplemented into GSIM (Table 1).
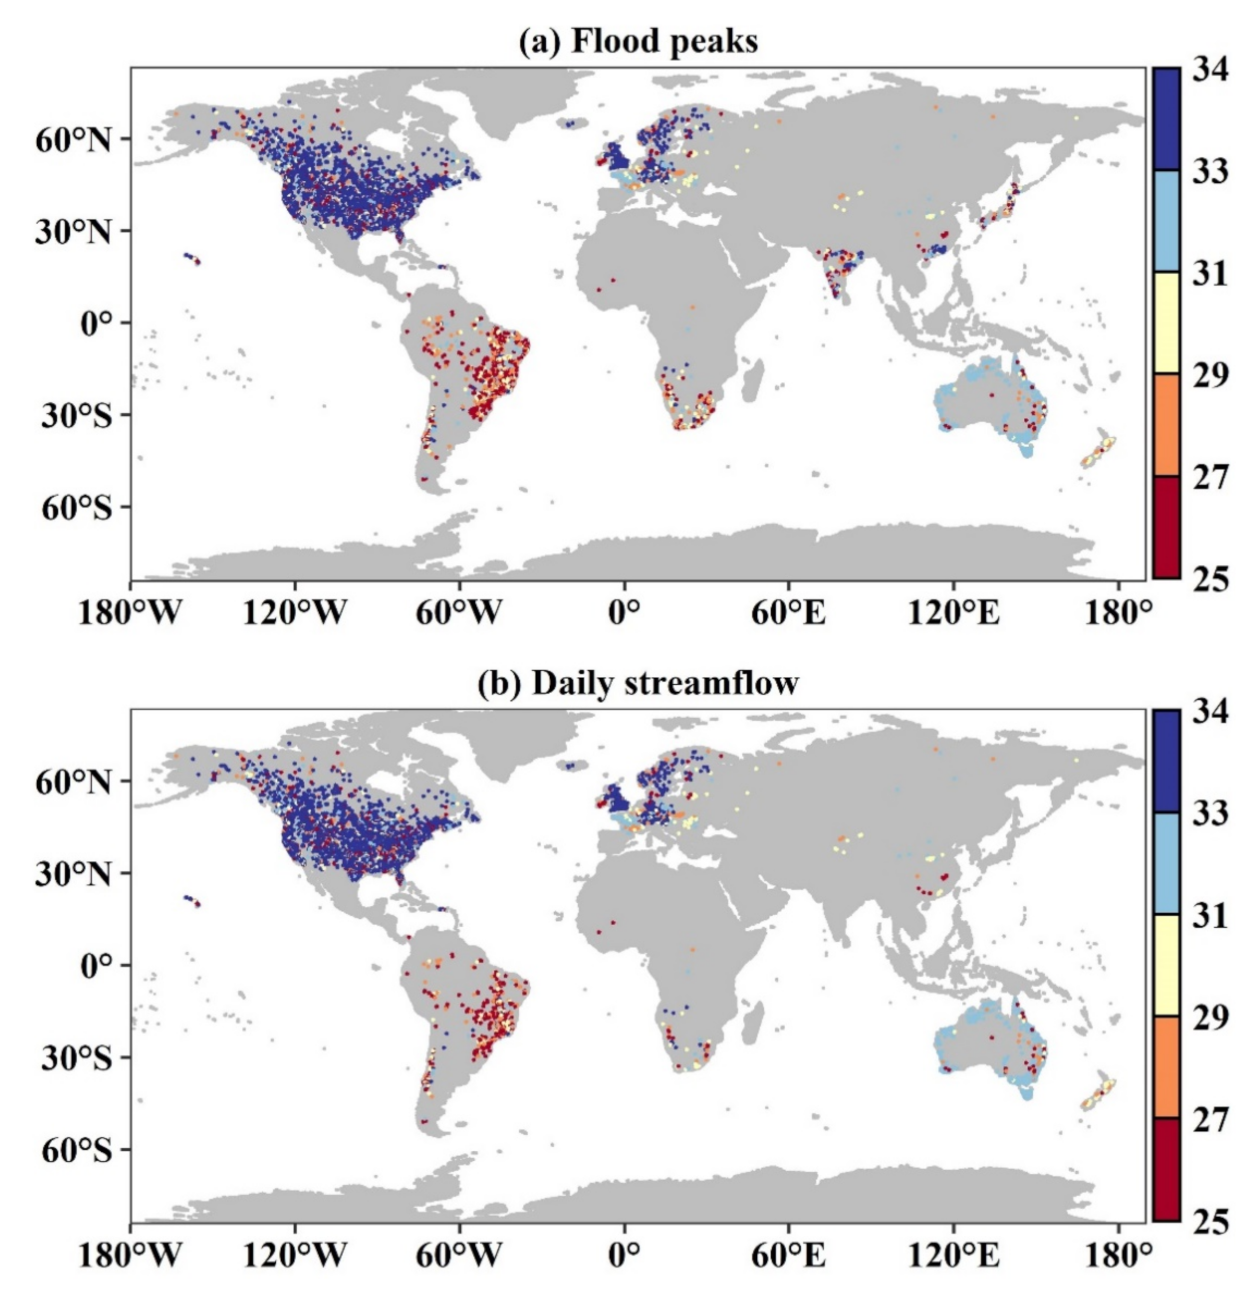
To our knowledge, the above streamflow datasets we collected are the most complete global streamflow observations. Based on these streamflow observations, stations with at least 25 complete years (>350 daily observations) during 1979–2012 were selected to conduct the following analyses. The final numbers of stations selected for each dataset are listed in Table 1. More details about the spatial distribution of stations and each record length are shown in Figure 1. The global land areas are well covered by these stations.
2.1.2. Global Cyclone Track Data
The recently released version (version 4) of the International Best Track Archive for Climate Stewardship provides global TC track information over 1842–2018 [46]. This dataset includes locations of storm inner core by every 3 hours for each TC globally and was updated by Knapp et al. in 2018 (https://www.ncdc.noaa.gov/ibtracs/, 13 January 2020). Based on the criterion of the Saffir–Simpson hurricane intensity scale [25,46], TC intensity is classified in 7 scales, namely, tropical depression, tropical storm, and hurricane wind scale 1–5.
With the comparison between fifteen sets of cyclone tracks that were detected by different methods based on European Centre for Medium-Range Weather Forecasts (ECMWF) Interim Re-Analysis (ERA-Interim) dataset, the project of Intercomparison of Mid-latitude Storm Diagnostics (IMILAST) threw light on significant differences in midlatitude cyclones (https://proclim.scnat.ch/en/activities/project_imilast, 17 April 2021) [47]. As suggested by Neu et al. [47], we chose the ETC track data based on M09 method (see Neu et al. [47] for more details on the advantages of this method) to analyze the impacts of ETCs on floods. This dataset during 1979–2012 includes locations and sea level pressure minima of cyclone inner core by 6 hours for each ETCs.
2.1.3. Reanalysis Data
Hourly data for simulated runoff is used to compare results from the observations. Surface runoff dataset is obtained from European Centre for Medium-Range Weather Forecasts (ECMWF) 5 Re-Analysis (ERA5) dataset (https://www.ecmwf.int/en/forecasts/datasets/reanalysis-datasets/era5, 11 June 2021). Monthly data for large-scale environmental variables, i.e., vertical integral of northward/eastward water vapor flux, convective available potential energy (CAPE), and surface soil moisture (SSM) data are obtained from ERA5 dataset. This dataset has a 0.25° × 0.25° spatial resolution and covers from 1950 to the present date. More details about these datasets are inserted in Table 2.
2.2. Methodologies
2.2.1. Sampling Floods and Identifying Cyclone-Induced Floods
Both block maximum (BM) and peak-over-threshold (POT) methods are used to sample floods [26]. Annual and seasonal maximum discharge is sampled by BM method and taken as BM floods. There are four seasons, i.e., March–May (MAM), June–August (JJA), September–November (SON), December–February (DJF). In POT sampling (i.e., POT floods), annual/seasonal floods are obtained from the discharge above a threshold which is set as the 99th/95th of the whole annual/seasonal daily streamflow [13,25,48]. The 99th/95th of the whole annual/seasonal daily streamflow is taken as the threshold can ensure 3–4 floods in each year/season on average. Annual/seasonal numbers of POT floods are the numbers of days in which the discharge is above the threshold. A flood is taken as a cyclone-induced flood if it occurred between the prior-2 days and posterior-7 days of a cyclone’s lifetime and its station is located within a 500-km radius from centers of this cyclone. This identification method and the selected period (i.e., prior-2 days and posterior-7 days) and distance (500-km radius) are widely employed in previous studies [36,49,50,51,52]. In the future, it is important for us as well to explore whether there is a coincidence or a lag between TC activities and flood events by using event coincidence analysis, thereby producing a reliable projection of the statistics of extreme flood events [53,54].
2.2.2. Regression Models
We employed the simple linear and Poisson regression models to quantificationally identify the trend of BM cyclone flood magnitude and cyclone intensity, and POT cyclone flood frequency, cyclone tracks, and duration, respectively. We used the simple linear regression method to explore the long-term trend of continuous variables [55,56,57]:
where is the explanatory variable (i.e., BM cyclone flood magnitude and cyclone intensity in this study), represents the independent variable (e.g., years). Where , indicate intercept and slope coefficients, respectively.
Here, we briefly introduce Poisson regression models, and more details can refer to Khouakhi et al. [48]. The long-term trend of annual numbers of events is quantified by Poisson regression [23,48]:
where is annual numbers of discrete variable (i.e., cyclone flood frequency, cyclone tracks, and duration in this study); represents the occurrence rate and is a non-negative variable modeled by the following equation [48]:
where , , and indicate the same meanings as those shown in Equation (1). If the p value of slope coefficients in simple linear (Poisson) regression is less than 0.05, the long-term trend is significant. The station with TC (ETC)-induced floods in at least five (fifteen) years is chosen to fit the simple linear and Poisson models.
2.2.3. Integrated Vapor Transport Calculation
Cyclone flood activities are tied with integrated vapor transport (IVT, units: kg m−1 s−1) [58]. Based on ERA5 reanalysis data, this variable is calculated as [59]:
where and denote vertical integral of eastward/northward water vapor flux (units: kg m−1 s−1) from the surface to the top atmosphere, respectively.
3. Results
3.1. Contributions of Cyclones to Global Flooding
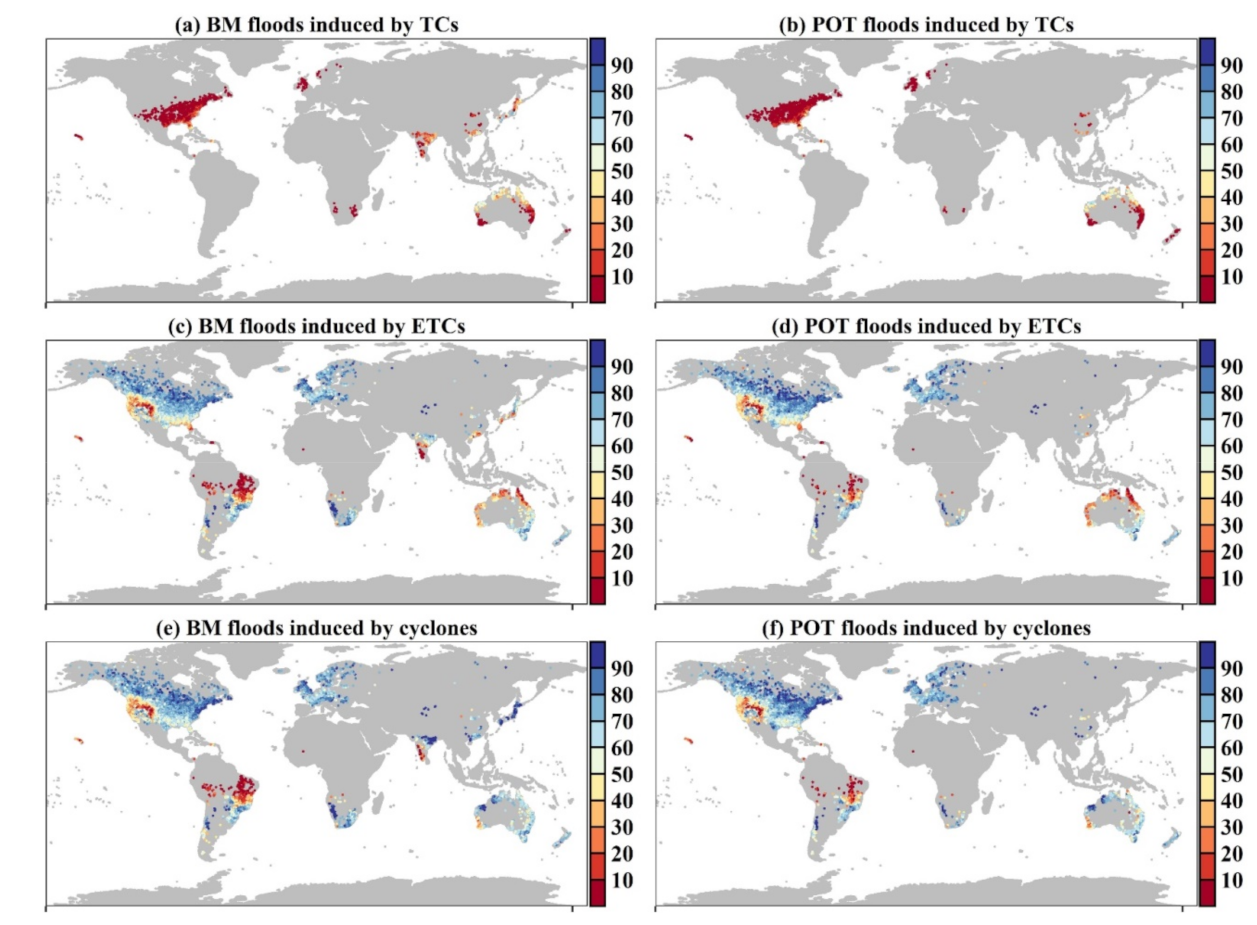
The contributions of cyclones to global floods for observations and simulations sampled by BM and POT methods for 1979–2012 are shown in Figure 2, Figure 3, Figure 4, Figure 5 and Figure 6. A flood event is a TC-induced one if this event is linked to TCs; a flood event is an ETC-induced one if this event is only linked to ETCs; and a flood event is a cyclone-induced one if this event is linked to TCs or ETCs.
(a) Eurasia
East Asia experiences the largest contributions of TCs (generated from the western North Pacific) to floods across the globe. South Japan, Southeast Asia, and south China are the regions in East Asia with more than 40% of TC floods and even more in coastal areas (Figure 2a and Figure 3a,b). As we move inland, the percentage of TC floods decreases gradually from southeast to northwest, and this is particularly the case over China due to the blocking effect of the Khigan-Taihang-Wushan-Xuefeng Mountain [5,15]. The percentage of TCs to produce floods over China is inherently consistent with that in Yang et al. [23], who indicated that TCs contribute to more than 30% of floods over southeastern China and even more than 50% over the coastal areas of southeastern China. The contributions of TCs to floods over South Asia decreased from east to west step by step, with the highest contributions (i.e., 25–35%) occurring in eastern South Asia. The mountains in western South Asia (such as Deccan Plateau) hinder the impact of TCs on floods in this region.
An almost adverse phenomena shows that ETC floods increase gradually from south to north, and that the areas with high contribution values are away from the low-latitude region (Figure 2c,d and Figure 3c,d). The percentage of ETC floods reach up to 70–90% over the mid–high latitude areas of Eurasia, with the highest contributions being in northwest China and northeast Asia (100%) and Europe (more than 80%). The contributions of ETCs to floods over parts of Europe are consistent with that found in Hawcroft et al. [19], who showed that more than 70% of precipitation could be triggered by ETCs. Overall, more than 90% of floods over Eurasia are tied to cyclones (Figure 2e,f and Figure 3e,f). Note that no cyclone-induced floods in the Qinghai–Tibet Plateau are owing to the high altitude in this region.
(b) North America
In North America, the largest contributions of TCs mainly occur in Mexico, followed by Florida in the United States, and the percentages of TC floods are more than 30% and 20%, respectively (Figure 2a,b and Figure 3a,b). The highest percentage in the two regions can be more than 85% (Michoacán state of Mexico). The flood peak distributions are mixed in the east shore of the United States due to their multiple flood-generating mechanisms, and besides TCs, the organized warm-season convective systems are mainly responsible for floods in these areas [36]. The percentage of TC floods over the eastern United States is in line with that identified in Aryal et al. [26], who also used BM and POT to sample floods and identified 10–20% of TC floods in this region.
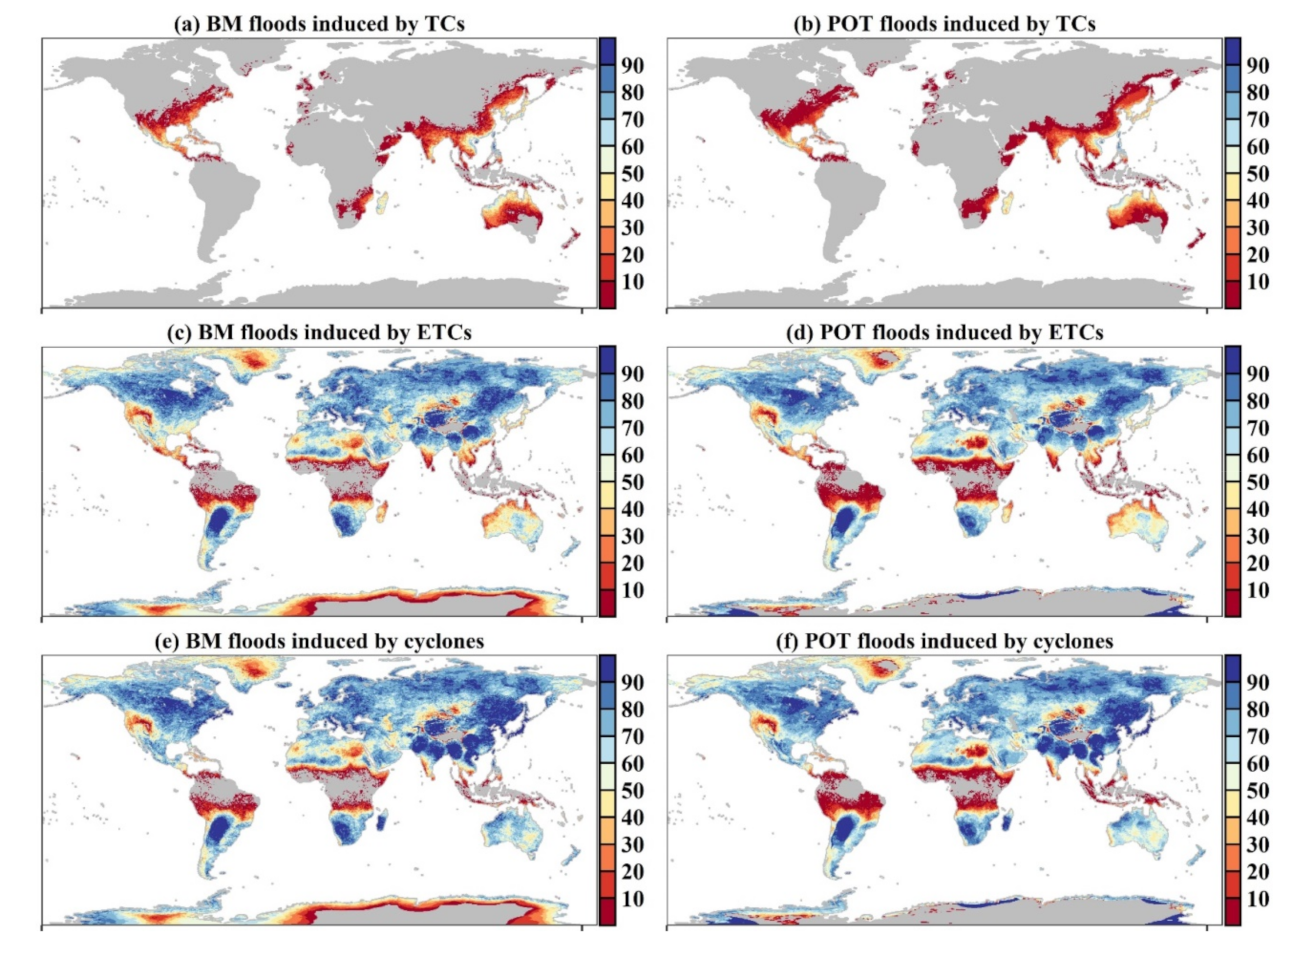
In comparison with TCs, ETCs play a dominant role in the floods in North America, especially for the mid–high latitude region, where ETCs contribute 60–90% of floods (Figure 2c,d and Figure 3c,d). A similar result can be found from Hawcroft et al. [19], with over 70% of precipitation resulting from ETCs in North America. For the eastern United States, which TCs majorly assault, the contributions of ETCs to floods in this region are much higher (from 20% to 90% as the areas from south to north). Low impacts of ETCs (less than 20% of contributions) on floods are observed in southwestern United States (Figure 2e,f and Figure 3e,f), because the floods in this region are majorly attributed to atmospheric rivers which bring abundant moisture from the tropical Pacific [58,60,61].
(c) Oceania
Floods occurring in northern Australia are mainly associated with TCs, and the percentages of TC floods in these areas are more than 40%, increasing even up to 70% (Figure 2e,f and Figure 3e,f). In central Australia, contributions of TCs to floods rapidly decrease by 20–30% and then quickly drop into zero, due to the desert and plateau in mid-west Australia. The contributions of TCs to floods are higher than that to annual precipitation maxima (i.e., ~30–50%) [23] in northern Australia. The percentage of TC-induced annual maximum daily precipitation exceeding 100 mm is much greater than that exceeding 25 mm [13], suggesting that TC floods are more likely to develop into local extreme flooding.
When it comes to ETC floods, north Australia, where TCs majorly occur, witnesses 10–30% of floods induced by ETCs, whereas 50–80% of floods could be attributed to ETCs in south Australia and the entirety of New Zealand (Figure 2c,d and Figure 3c,d). Similar results are shown by Dowdy et al. [62,63] in central-east Australia, where about 50–80% of extreme precipitation events are associated with ETCs and therefore have a high probability of producing heavy floods. In addition to precipitation, Pepler et al. [64] indicated that the east coast of Australia witnesses more than 70% of severe floods triggered by ETCs. Generally, Australia and New Zealand are severely attacked by these cyclones, with their contribution accounting for 60 to 90% (Figure 2e,f and Figure 3e,f).
(d) South America and Africa
As for South America and Africa, few floods are linked to TCs, while ETCs dominate flood occurrences with a general contribution reaching up to 50–90% (Figure 2c,d and Figure 3c,d). The contribution of ETCs to floods gradually has increased from the low-latitude to the high-latitude, peaking at 97% in Chile and 100% in Namibia, respectively.
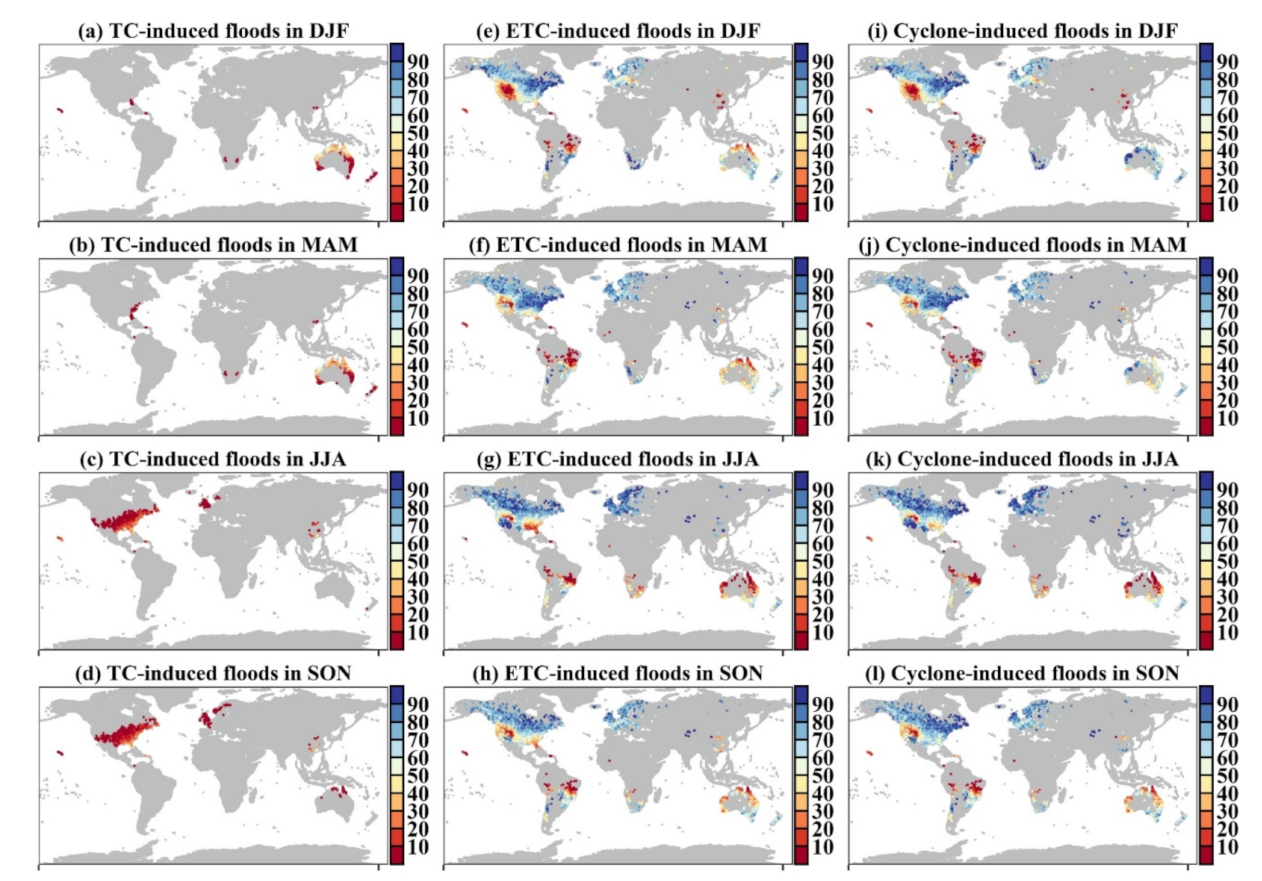
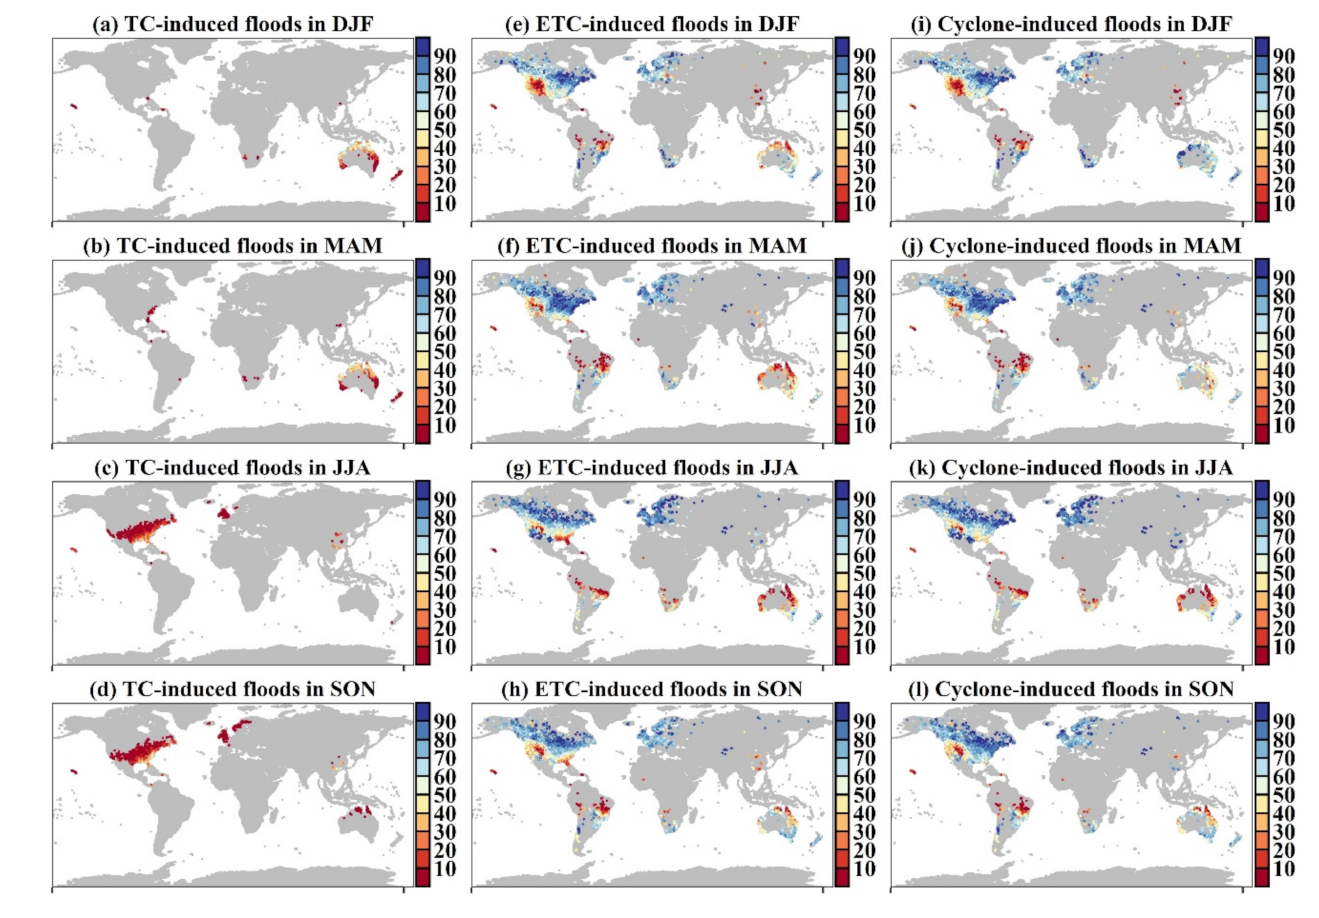
Seasonally, the feature of TC floods in the Northern Hemisphere is opposite to that in the Southern Hemisphere (Figure 4, Figure 5 and Figure 6a,d). Specifically, there are only a few floods (<=10%) that are induced by TCs in boreal winter and spring (i.e., December–February and March–May) in the coastal areas of East Asia and North America. In boreal summer and autumn (i.e., June–August and September–November), not only the contributions but also the mainly affected areas of TC floods rise to more than 50% and expand into the inland areas of East Asia and North America, which is consistent with the features apparent at an annual scale (Figure 2a,b and Figure 3a,b). Besides East Asia and North America, the coastal areas of Europe also experience a few TC floods in boreal summer and autumn (less than 10%). In the Southern Hemisphere, Australia is mainly attacked by TC floods that are generated during austral summer and autumn (i.e., December–February and March–May). Fewer than 10% of floods are induced by TCs in southern Africa during austral summer and autumn.
Compared with TC floods, there is no significant seasonal change in ETC floods (Figure 4, Figure 5 and Figure 6e,h). ETCs evidently contribute to the floods of the South Hemisphere throughout the four seasons, whereas the highest proportion of ETCs to floods is shown in North Hemisphere in boreal summer (i.e., June–August). Regionally, there are more floods (60–90%) that are induced by ETCs over Eurasia in boreal spring and summer, and a similar result can be found in North America. Hawcroft et al. [19] also found that ETCs in winter contribute >70% of the precipitation, which means that ETC-induced precipitation events are more likely to produce extreme floods, which is consistent with our results in the same areas (Figure 4, Figure 5 and Figure 6h). Apart from in Eurasia and North America, more than 50% (70%) of floods are induced by ETCs in Australia (South America and South Africa) in austral spring and summer (i.e., September–November and December–February).
Overall, the floods triggered by cyclones in observed streamflow and simulated runoff from ERA5 reanalysis are highly consistent, which means that the cyclone contribution of simulated floods over the regions without observations could be credible. Southeast East Asia, south North America, and north Australia are the areas that suffer severe TC floods in the world, whereas north Japan, the majority of the Eurasian continent, north part of North America, southeastern Australia, southern Africa, and the south part of South America are the areas that suffer severe ETC floods in the world. Previous studies have indicated that the shape parameter of the generalized extreme value distribution is higher in flood peaks inducing TC floods than in that of TC floods over the eastern United States and China [34,36]. Due to this, the shape parameter is widely used to describe the upper tail of flood peaks, and the high contributions of cyclone floods in these areas suggest that cyclones may dominate the upper tail of local flood peak distributions. We also notice that the areas suffering from a lot of cyclone floods in the world are experiencing growing or grown urbanization, such as the Pearl River Delta and the Gulf of Mexico. Zhang et al. [65] indicated that urbanization has amplified the probability of flooding induced by hurricane Harvey by 21 times in Houston, Gulf of Mexico. Given the high contributions of cyclone floods and urbanization, the flood risk jointly induced by cyclones and urbanization in these areas should be given more attention in the future.
3.2. Long-Term Changes in Magnitude and Frequency of Cyclone Floods
For annual BM (POT) floods induced by cyclones, we used the simple linear (Poisson) model to quantify the magnitude (frequency) of cyclone floods. In Equations (1)–(3), the slope coefficient is used to measure the trend of flood magnitude (frequency) induced by cyclones (Figure 7 and Figure 8).
(a) Eurasia
The trend directions of floods induced by TCs are almost opposite between South Asia and East Asia (Figure 7a,b and Figure 8a,b). Specifically, negative values of among both magnitude and frequency are found in East Asia, suggesting that TC floods in this region tend to be lighter and less frequent, although central-southeast China shows an increasing trend. Lu et al. [66] also found a significant decreasing trend in the magnitude of extreme precipitation and flood peaks induced by TCs in the southeast-coast region of China. On the contrary, the entirety of India experiences the increasing magnitude and frequency of TC-induced floods, indicating a higher disaster risk of TC-induced floods in this region. The result is consistent with Ely et al. [67], who observed an anomalous enhancement both in the frequency and magnitude of extreme TC floods in the Narmada River of India from 1951 to 1991. In terms of floods induced by ETCs, general negative values dominate the entirety of Eurasia, not only for flood magnitude, but also for flood frequency, suggesting there are weaker and less frequent floods contributed by ETCs (Figure 7c,d and Figure 8c,d). Regionally, Europe presents a compound distribution both in magnitude and frequency, i.e., increasing trends in central Europe and decreasing trends in west and north Europe.
(b) North America
In North America, there is a significant increasing trend shown in both magnitude and frequency over eastern United States and Mexico, meaning more frequent and extremer floods triggered by TCs (Figure 7a,b and Figure 8a,b). Knight and Davis [68] and Aryal et al. [26] indicated that the magnitude and frequency of TC-induced precipitation witnesses an increasing trend, suggesting a larger probability of more extreme floods. A recent study [22] also shows that the United States experiences an apparent increase in flood magnitude and frequency driven by TCs, which is consistent with our result. Unlike TC floods, and in central North America, there is a significant and positive value, suggesting that more frequent and heavier floods are induced by ETCs in this area (Figure 7c,d and Figure 8c,d). Conversely, southern and eastern North America display more stations of negative values with p < 0.05, triggering less frequent and lighter floods induced by ETCs.
(c) Oceania
For Australia, TC floods occurring in northern and parts of western Australia show a general increasing trend in magnitude and frequency (Figure 7a,b and Figure 8a,b). However, South Australia and New Zealand witness a complex distribution of magnitude in ETC floods.
(d) South America and Africa
Although there is little TC influence on floods, southeast Africa shows a significant increasing trend of floods both in magnitude and frequency, indicating a higher probability of local extreme flood risk. For ETC floods, there is an obvious spatial heterogeneity in showing the slope coefficient , that is, general decreasing trends of ETC floods are mapped by a negative value in South America (Figure 7c,d and Figure 8c,d). A mixture pattern of ETC floods both in magnitude and frequency is shown in north Africa, whereas South Africa is dominated by a simple increasing trend, suggesting the enhancement of more extreme floods triggered by ETCs.
Generally, trends of cyclone flood magnitude and frequency show a mixture pattern in different regions. For TC floods, North America, north Australia, and southeast Africa witness increasing trends both in magnitude and frequency, while East Asia shows generally negative directions. There are general decreasing trends both in magnitude and frequency of ETC floods in Eurasia, North America, and South America. It is worth noting the increasing direction of cyclone floods both in magnitude and frequency over South Africa. Additionally, compared with the flood magnitude, the frequency of ETC floods shows a significant reduction in most regions.
3.3. Possible Reasons Responsible for Changes in Cyclone-Induced Floods
(a) Eurasia
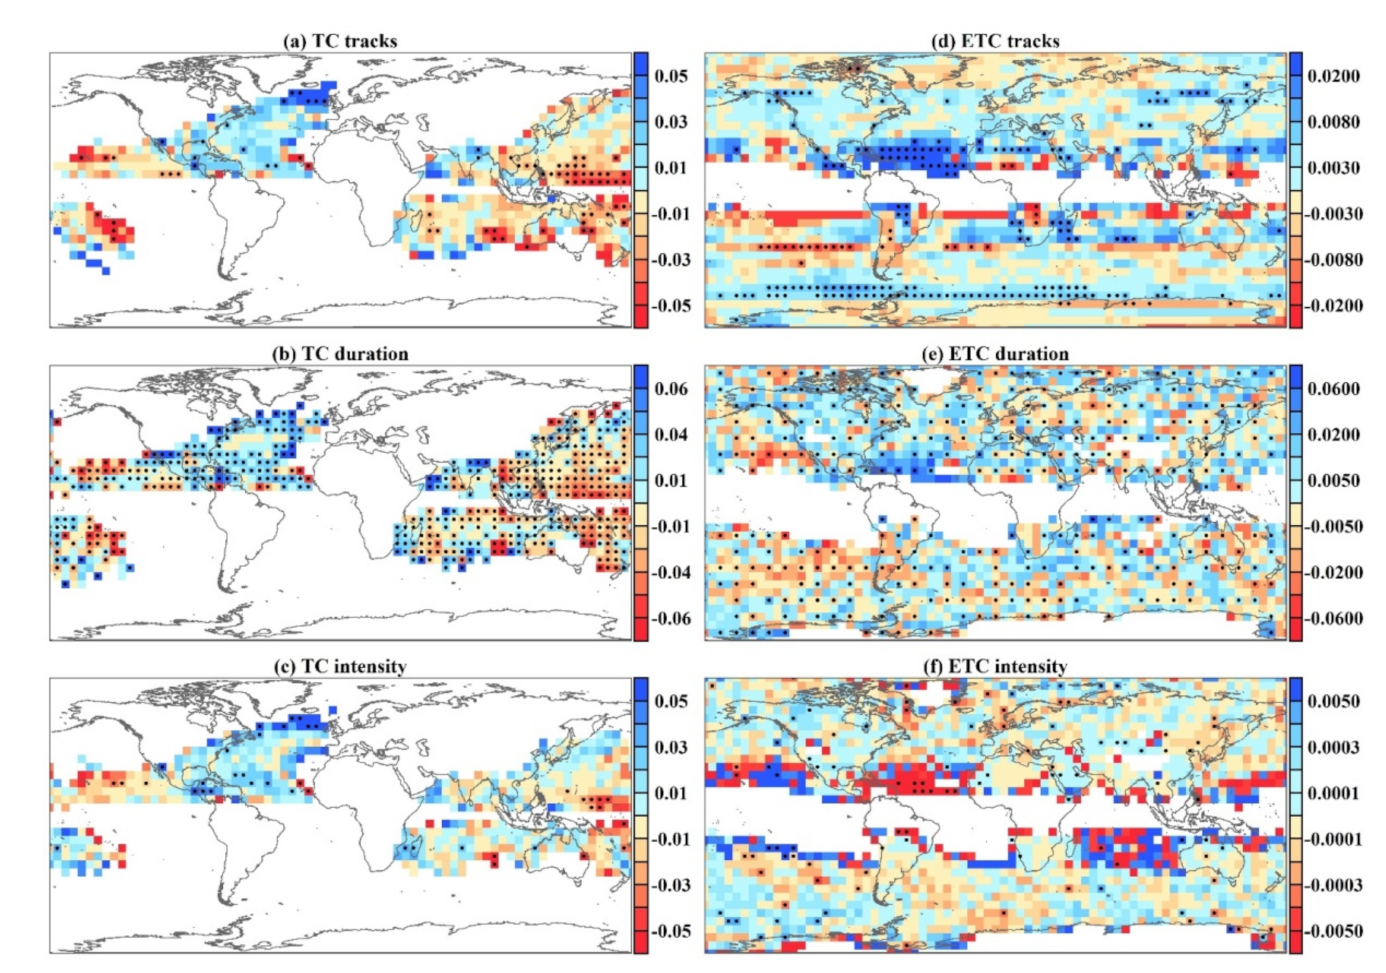
We first checked the consistency between changes in features of cyclone tracks and cyclone-induced floods. Globally, there is a highly spatial consistency in change patterns among TC tracks, duration, and intensity (Figure 9a–c). For East Asia, we observed a general decrease in the frequency, duration, and intensity of TCs, weakening the magnitude and frequency of TC floods (Figure 7a,b and Figure 8a,b). Zhang et al. [69] detected similar decreasing changes in TC intensity over south China. On the contrary, general increasing trends in TC tracks and duration are consistent with the trends of flood magnitude and frequency triggered by TCs in South Asia. A recent study by Singh et al. [70] examined the changes of landfalling TC activities during 1990–2020, indicating that India witnesses increasing trends both in maximum wind speed and duration. The trends of ETC tracks, duration, and intensity show a mixture pattern over Eurasia. In Europe, general negative values are shown in ETC tracks, duration, and intensity, which is unfavorable to convection activities (Figure 9d–f), and hence reduce ETC flood frequency and magnitude. For northeastern Asia, the negative trends of ETC intensity might play a key role in reducing the trend of flood magnitude and frequency induced by ETCs. The study of Zhang et al. [71] showed decreasing trends of ETC intensity in Eurasia, which are partly consistent with our results.
(b) North America
For North America, consistently increasing trends are found in TC tracks, duration and, intensity (Figure 9a–c), suggesting more frequent, longer-lived, and stronger TCs tend to trigger more extreme and frequent TC floods in eastern United States and Mexico (Figure 7a,b and Figure 8a,b). Murakami et al. [72] indicated that there are positive trends among TC tracks, duration, and maximum intensity in the North Atlantic, where we also found highly consistent results in the adjacent and oceans of coastal North America and Mexico. Central North America is dominated by positive values in these features of ETCs (Figure 9d–f), which is confirmed by a higher magnitude and more frequent ETC floods in this region (Figure 7c,d and Figure 8c,d).
(c) Oceania
Northern Australia experiences an increasing trend of TC tracks, lifetime, and intensity (Figure 9a–c), suggesting that TCs tend to cause more frequent and severer floods, as shown in Figure 7a,b and Figure 8a,b. In terms of ETCs (Figure 9d–f), southeastern Australia shows negative values in ETC tracks, duration, and intensity, indicating that shorter-lived and weakening ETCs pass through this region and then tend to cause fewer ETC floods.
(d) South America and Africa
In addition to Oceania, southeast Africa witnesses significant increasing trends among TC tracks, duration, and intensity (Figure 9a–c), suggesting a higher probability of TC floods. A similar trend for TC tracks is shown by Fitchett and Grab [73], who found an increasing trend of TC tracks passing Madagascar. South America is dominated by negative values in ETC tracks (Figure 9d–f), duration, and intensity, reflecting in the homogeneity between the decreasing flood magnitude and the number triggered by ETCs (Figure 7c,d and Figure 8c,d). Compared with South America, the change pattern of ETC floods is compounded in North Africa, with complex features in the changes of ETC floods. South Africa witnesses a slight change among ETC tracks, duration, and intensity, thereby presenting no significant change pattern in ETC floods.
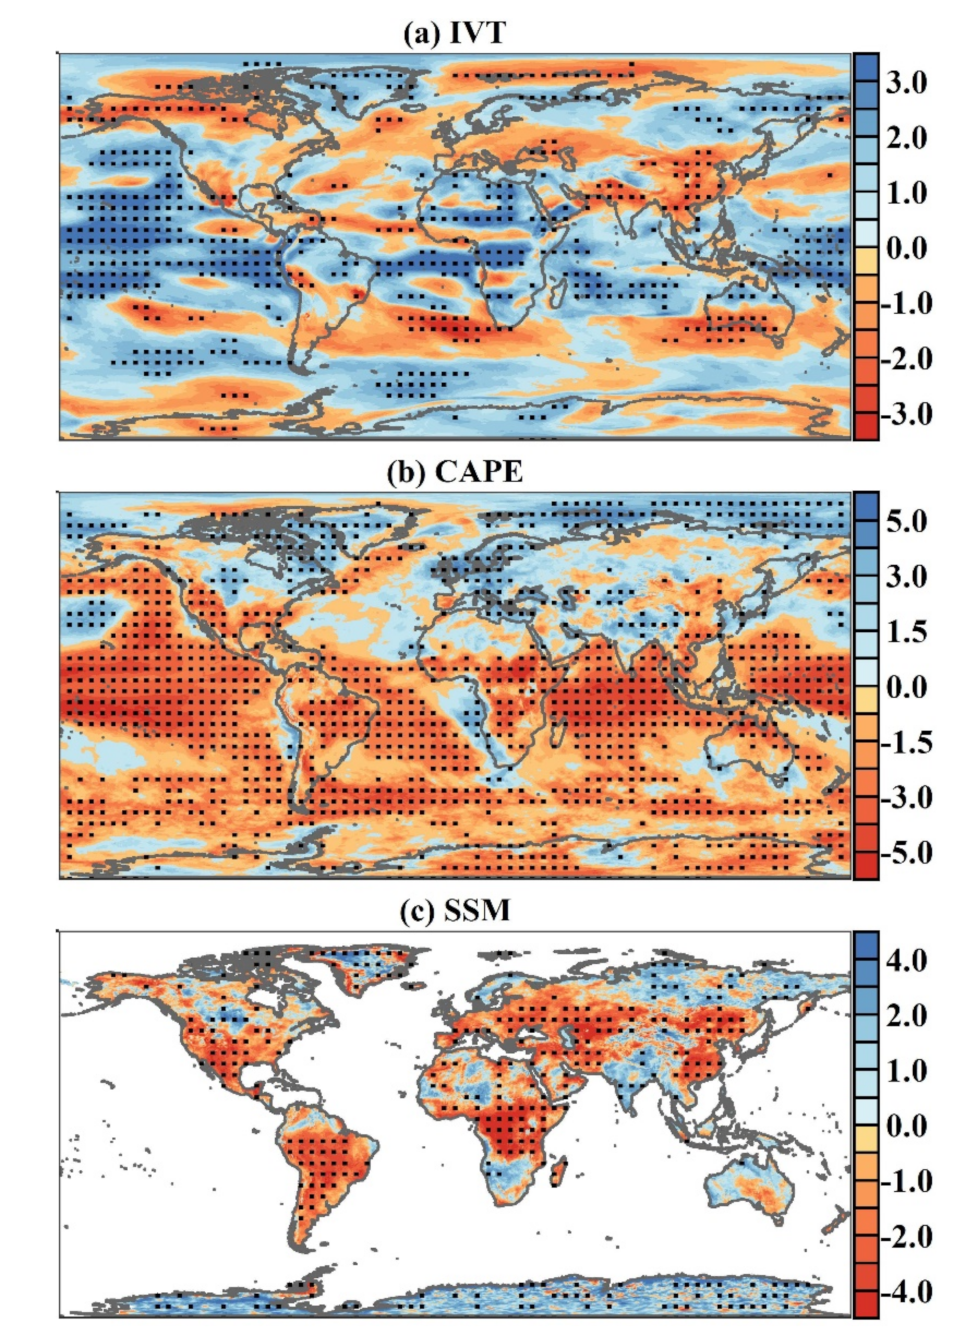
We then investigated changes in large-scale environmental variables that are related to cyclone-induced floods (Figure 10). In this study, CAPE, IVT, and SSM are chosen to indicate convective activities, vapor moisture, and the land surface state, which has been proved to have important impacts on the occurrence processes of cyclone-induced floods [74,75,76, 77,78,79].
For East Asia and Southeast Asia, the IVT shows significantly decreasing trends (Figure 10a). This weakening IVT is not conducive to cyclone developments and provides an insufficient moisture condition for precipitation and then floods [15,58,61]. The CAPE in the two regions also decreases significantly (Figure 10b), indicating that the atmospheric instability is reducing and then strong convective activities are weakening [76]. Meanwhile, the drying soil moisture (see SSM in Figure 10c) is widespread in East Asia and Southeast Asia. Zhang et al. [80] and Liu et al. [15] indicated that drying SSM is unconducive to slowing down the weakening of TCs after landfall. On the other hand, drier SSM results in decreasing latent energy release and then increasing sensible heat flux, which is unfavorable for upward moisture flux to convective processes and then is unfavorable to the enhancement of precipitation [76]. Drying soil moisture also favors more precipitation infiltration and is unconducive to flooding generation [15,81]. These explain the negative responses of cyclone-induced floods in East Asia and Southeast Asia. Similarly, we observed significantly drying soil moisture in Europe, southern North America, and South America. CAPE in southern North America and South America also decreases significantly. This drying soil moisture and weakening convective activities are consistent with the decreasing cyclone-induced flood magnitude and the less frequent cyclone-induced flood frequency in these regions.
We noticed that north-central North America, southern Africa, South Asia, and northern Australia witness an increase in cyclone-induced flood magnitude and frequency. These regions are experiencing enhancing water vapor transport (Figure 10a). Additionally, the increasing trends of CAPE in north-central North America and South Asia strengthen the intensity of convective activity, thereby creating a high probability of extreme precipitation induced by cyclones. Southern Africa and northern Australia are also featured as containing wetting soil moisture. Wetter soil moisture in South Asia and north Australia would reduce the weakening rate of TC, which have a positive influence on the track development of TCs after landfall and further increases the occurrences of TC-induced precipitation and floods. It should be noted that the change patterns of the three large-scale variables can only partly explain the reasons behind the changes in cyclone-induced flood magnitude and frequency.
4. Conclusions
In this study, we collected and compiled long-term global riverine streamflow data during 1979–2012 at more than 30,000 stations. Combining the most complete global streamflow dataset with simulated surface runoff from ERA5 dataset, we quantified the contributions of cyclones to global floods at annual and seasonal scales and investigated the long-term changes in magnitude and frequency of cyclone-induced floods.
We sampled flood events by block maxima (BM) and peak-over-threshold (POT) methods, and then computed the fractional contributions of cyclones to these flood events. Our results show that south China and central Japan are the areas in which most TCs occur, and more than 40% of floods are produced by TCs in these areas. More than 40% of floods in the coastal areas of northern Australia are associated with TCs. For Mexico and Florida in the USA, this percentage is more than 30% and 20%, respectively. In addition to TCs, the percentage of ETC floods reaches up to 70–90% over the main Eurasia. Northern North America experiences the contributions of ETCs, with floods over 60–90%. Cyclones play a minor role in flooding in the western United States, since floods in this area are controlled by atmospheric rivers [58,60,61]. South Australia and New Zealand are strongly affected by ETCs, with the contribution increasing to 50–80%. For South America and South Africa, 50–90% of floods are contributed by ETCs. The contributions of TCs to global floods vary distinctly by seasons, with the highest values occurring in boreal (astral) summer and autumn in the Northern (Southern) Hemisphere. However, there is no significant seasonal change in ETC floods, though the highest proportion of ETCs to floods was observed in the North Hemisphere in boreal summertime.
We used the simple linear (Poisson) model to quantify long-term changes in the magnitude (frequency) of cyclone floods. There are increasing trends in the magnitude and frequency of TC floods over South Asia, eastern United States, Mexico, north Australia, and southeastern South Africa, whereas East Asia is the opposite (i.e., generally decreasing trends). Compared with TCs, ETCs have a more widespread effect over the world. Eurasia, most of North America, and South America witness general downward trends in flood magnitude and frequency triggered by ETCs. Conversely, increasing trends in the ETC flood’s magnitude and frequency are found in central North America and South Africa. South Australia and North Africa indicate a mixed pattern.
To explain the long-term changes in cyclone-induced flood magnitude and frequency, we assessed changes in cyclone tracks, duration, and intensity, and large-scale environmental variables. The increasing TC tracks, duration, and intensity over South Asia and North America produce more TC-induced floods in the two regions, while it is the opposite in East Asia. Although there are complex patterns in changes in ETC tracks, duration, and intensity, the decreasing ETC intensity is still identified in southern South America, Europe, and northeastern Asia, where ETC-induced floods show a significant reduction in magnitude and frequency. The change patterns of integrated vapor transport, convective available potential energy, and soil moisture correspond well to these cyclone activities and changes in cyclone-induced floods in some regions, such as East Asia and Southeast Asia.
Author Contributions
X.G. designed this paper, L.W. conducted the computation, analysis, and figures, and H.E.B. provided the global daily streamflow dataset. L.W. wrote the first draft of the paper, and X.G. and H.E.B. edited this paper. All authors have read and agreed to the published version of the manuscript.
Funding
This research was funded by the Key Laboratory of Environmental Change and Natural Disaster, Ministry of Education, Beijing Normal University (12800-312230012), the Fundamental Research Funds for the Central Universities (lzujbky-2021-kb12), and Open Fund of Key Laboratory of Geospatial Technology for the Middle and Lower Yellow River Regions, Henan University, Ministry of Education (GTYR202003).
Institutional Review Board Statement
Not applicable.
Informed Consent Statement
Not applicable.
Data Availability Statement
The streamflow data sources are listed in Table 1, except for part of datasets in China which is not available due to license restrictions. The IBTrACS dataset is available at https://www.ncdc.noaa.gov/ibtracs/ (13 January 2020) and the ETC dataset extracted from ERA-Inerim dataset is available at https://proclim.scnat.ch/en/activities/project_imilast (17 April 2021). The reanalysis variables used in this study are available at https://www.ecmwf.int/en/forecasts/datasets/reanalysis-datasets/era5 (11 June 2021).
Acknowledgments
Conflicts of Interest
The authors declare no conflict of interest.
References
- Lionello, P.; Trigo, I.; Gil, V.; Liberato, M.L.R.; Nissen, K.M.; Pinto, J.G.; Raible, C.; Reale, M.; Tanzarella, A.; Trigo, R.; et al. Objective climatology of cyclones in the Mediterranean region: A consensus view among methods with different system identification and tracking criteria. Tellus A Dyn. Meteorol. Oceanogr. 2016, 68, 29391. [Google Scholar] [CrossRef] [Green Version]
- Booth, J.F.; Rieder, H.E.; Kushnir, Y. Comparing hurricane and extratropical storm surge for the Mid-Atlantic and Northeast Coast of the United States for 1979–2013. Environ. Res. Lett. 2016, 11, 094004. [Google Scholar] [CrossRef]
- Orton, P.; Hall, T.; Talke, S.; Blumberg, A.; Georgas, N.; Vinogradov, S. A validated tropical-extratropical flood hazard assessment for New York Harbor. J. Geophys. Res. Ocean. 2016, 121, 8904–8929. [Google Scholar] [CrossRef] [Green Version]
- Orton, P.M.; Conticello, F.R.; Cioffi, F.; Hall, T.M.; Georgas, N.; Lall, U.; Blumberg, A.F.; MacManus, K. Flood hazard assessment from storm tides, rain and sea level rise for a tidal river estuary. Nat. Hazards 2018, 102, 729–757. [Google Scholar] [CrossRef]
- Zhang, Q.; Gu, X.; Li, J.; Shi, P.; Singh, V.P. The Impact of Tropical Cyclones on Extreme Precipitation over Coastal and Inland Areas of China and Its Association to ENSO. J. Clim. 2018, 31, 1865–1880. [Google Scholar] [CrossRef]
- Gu, X.; Zhang, Q.; Li, J.; Chen, D.; Singh, V.P.; Zhang, Y.; Liu, J.; Shen, Z.; Yu, H. Impacts of anthropogenic warming and uneven regional socio-economic development on global river flood risk. J. Hydrol. 2020, 590, 125262. [Google Scholar] [CrossRef]
- Lai, Y.; Li, J.; Gu, X.; Chen, Y.D.; Kong, D.; Gan, T.Y.; Liu, M.; Li, Q.; Wu, G. Greater flood risks in response to slowdown of tropical cyclones over the coast of China. Proc. Natl. Acad. Sci. USA 2020, 117, 14751–14755. [Google Scholar] [CrossRef] [PubMed]
- Colle, B.A.; Booth, J.; Chang, E.K.M. A Review of Historical and Future Changes of Extratropical Cyclones and Associated Impacts Along the US East Coast. Curr. Clim. Chang. Rep. 2015, 1, 125–143. [Google Scholar] [CrossRef] [Green Version]
- Wang, Y.; Wang, Y.; Fudeyasu, H. The Role of Typhoon Songda (2004) in Producing Distantly Located Heavy Rainfall in Japan. Mon. Weather. Rev. 2009, 137, 3699–3716. [Google Scholar] [CrossRef]
- Dong, M.; Chen, L.; Li, Y.; Lu, C. Rainfall Reinforcement Associated with Landfalling Tropical Cyclones. J. Atmos. Sci. 2010, 67, 3541–3558. [Google Scholar] [CrossRef]
- Czajkowski, J.; Villarini, G.; Michel-Kerjan, E.; Smith, J.A. Determining tropical cyclone inland flooding loss on a large scale through a new flood peak ratio-based methodology. Environ. Res. Lett. 2013, 8, 044056. [Google Scholar] [CrossRef]
- Villarini, G.; Goska, R.; Smith, J.A.; Vecchi, G. North Atlantic Tropical Cyclones and U.S. Flooding. Bull. Am. Meteorol. Soc. 2014, 95, 1381–1388. [Google Scholar] [CrossRef]
- Villarini, G.; Denniston, R.F. Contribution of tropical cyclones to extreme rainfall in Australia. Int. J. Clim. 2016, 36, 1019–1025. [Google Scholar] [CrossRef] [Green Version]
- Gu, X.; Zhang, Q.; Li, J.; Singh, V.P.; Liu, J.; Sun, P.; Cheng, C. Attribution of Global Soil Moisture Drying to Human Activities: A Quantitative Viewpoint. Geophys. Res. Lett. 2019, 46, 2573–2582. [Google Scholar] [CrossRef]
- Liu, L.; Wang, Y. Trends in Landfalling Tropical Cyclone–Induced Precipitation over China. J. Clim. 2020, 33, 2223–2235. [Google Scholar] [CrossRef]
- Karl, T.R.; Easterling, D.R. Climate Extremes: Selected Review and Future Research Directions. Clim. Chang. 1999, 42, 309–325. [Google Scholar] [CrossRef]
- Zhang, Q.; Wu, L.; Liu, Q. Tropical Cyclone Damages in China 1983–2006. Bull. Am. Meteorol. Soc. 2009, 90, 489–496. [Google Scholar] [CrossRef] [Green Version]
- Knutson, T.R.; Tuleya, R.E. Impact of CO2-induced warming on simulated hurricane intensity and precipitation: Sen-sitivity to the choice of climate model and convective parameterization. J. Clim. 2004, 17, 3477–3495. [Google Scholar] [CrossRef] [Green Version]
- Hawcroft, M.; Walsh, E.; Hodges, K.; Zappa, G.; Hawcroft, M. Significantly increased extreme precipitation expected in Europe and North America from extratropical cyclones. Environ. Res. Lett. 2018, 13, 124006. [Google Scholar] [CrossRef]
- Jiang, H.; Zipser, E.J. Contribution of Tropical Cyclones to the Global Precipitation from Eight Seasons of TRMM Data: Regional, Seasonal, and Interannual Variations. J. Clim. 2010, 23, 1526–1543. [Google Scholar] [CrossRef]
- Woodruff, J.D.; Irish, J.; Camargo, S. Coastal flooding by tropical cyclones and sea-level rise. Nat. Cell Biol. 2013, 504, 44–52. [Google Scholar] [CrossRef] [PubMed] [Green Version]
- Paerl, H.W.; Hall, N.S.; Hounshell, A.G.; Luettich, R.A.; Rossignol, K.L.; Osburn, C.; Bales, J. Recent increase in catastrophic tropical cyclone flooding in coastal North Carolina, USA: Long-term observations suggest a regime shift. Sci. Rep. 2019, 9, 1–9. [Google Scholar] [CrossRef] [Green Version]
- Yang, L.; Villarini, G.; Zeng, Z.; Smith, J.; Liu, M.; Li, X.; Wang, L.; Hou, A. Riverine Flooding and Landfalling Tropical Cyclones Over China. Earth’s Futur. 2020, 8, e2019EF001451. [Google Scholar] [CrossRef] [Green Version]
- Ruiz-Salcines, P.; Appendini, C.M.; Salles, P.; Rey, W.; Vigh, J.L. On the use of synthetic tropical cyclones and hypothetical events for storm surge assessment under climate change. Nat. Hazards 2021, 105, 431–459. [Google Scholar] [CrossRef]
- Khouakhi, A.; Villarini, G.; Vecchi, G. Contribution of Tropical Cyclones to Rainfall at the Global Scale. J. Clim. 2017, 30, 359–372. [Google Scholar] [CrossRef]
- Aryal, Y.; Villarini, G.; Zhang, W.; Vecchi, G. Long term changes in flooding and heavy rainfall associated with North Atlantic tropical cyclones: Roles of the North Atlantic Oscillation and El Niño-Southern Oscillation. J. Hydrol. 2018, 559, 698–710. [Google Scholar] [CrossRef]
- Priestley, M.D.K.; Pinto, J.G.; Dacre, H.F.; Shaffrey, L.C. The role of cyclone clustering during the stormy winter of 2013/2014. Weather 2017, 72, 187–192. [Google Scholar] [CrossRef] [Green Version]
- Catto, J.L.; Jakob, C.; Berry, G.J.; Nicholls, N. Relating global precipitation to atmospheric fronts. Geophys. Res. Lett. 2012, 39, 1–6. [Google Scholar] [CrossRef]
- Lin, D.; Huang, W.; Yang, Z.; He, X.; Qiu, T.; Wang, B.; Wright, J.S. Impacts of Wintertime Extratropical Cyclones on Temperature and Precipitation Over Northeastern China During 1979–2016. J. Geophys. Res. Atmos. 2019, 124, 1514–1536. [Google Scholar] [CrossRef]
- Roberts, K.J.; Colle, B.A.; Korfe, N. Impact of Simulated Twenty-First-Century Changes in Extratropical Cyclones on Coastal Flooding at the Battery, New York City. J. Appl. Meteorol. Clim. 2017, 56, 415–432. [Google Scholar] [CrossRef]
- Varotsos, C.A.; Sarlis, N.; Efstathiou, M. On the association between the recent episode of the quasi-biennial oscillation and the strong El Niño event. Theor. Appl. Clim. 2017, 133, 569–577. [Google Scholar] [CrossRef]
- Varotsos, C.A.; Tzanis, C.G.; Sarlis, N.V. On the progress of the 2015–2016 El Niño event. Atmos. Chem. Phys. Discuss. 2016, 16, 2007–2011. [Google Scholar] [CrossRef] [Green Version]
- Zhang, W.; Villarini, G.; Vecchi, G.A. Impacts of the Pacific Meridional Mode on June-August precipitation in the Amazon River Basin. Q. J. R. Meteorol. Soc. 2017, 143, 1936–1945. [Google Scholar] [CrossRef]
- Yang, L.; Wang, L.; Li, X.; Gao, J. On the flood peak distributions over China. Hydrol. Earth Syst. Sci. 2019, 23, 5133–5149. [Google Scholar] [CrossRef] [Green Version]
- Zhang, Q.; Gu, X.; Shi, P.; Singh, V.P. Impact of tropical cyclones on flood risk in southeastern China: Spatial patterns, causes and implications. Glob. Planet. Chang. 2017, 150, 81–93. [Google Scholar] [CrossRef] [Green Version]
- Villarini, G.; Smith, J.A. Flood peak distributions for the eastern United States. Water Resour. Res. 2010, 46. [Google Scholar] [CrossRef] [Green Version]
- Callaghan, J.; Power, S. Major coastal flooding in southeastern Australia, associated deaths and weather systems. J. South. Hemisph. Earth Syst. Sci. 2014, 64, 183–213. [Google Scholar] [CrossRef]
- Hassim, M.; Walsh, K.J.E. Tropical cyclone trends in the Australian region. Geochem. Geophys. Geosystems 2008, 9, Q07V07. [Google Scholar] [CrossRef] [Green Version]
- McCabe, G.J.; Clark, M.P.; Serreze, M.C. Trends in Northern Hemisphere Surface Cyclone Frequency and Intensity. J. Clim. 2001, 14, 2763–2768. [Google Scholar] [CrossRef]
- Beck, H.E.; Wood, E.F.; McVicar, T.R.; Zambrano-Bigiarini, M.; Alvarez-Garreton, C.; Baez-Villanueva, O.M.; Sheffield, J.; Karger, D.N. Bias Correction of Global High-Resolution Precipitation Climatologies Using Streamflow Observations from 9372 Catchments. J. Clim. 2020, 33, 1299–1315. [Google Scholar] [CrossRef] [Green Version]
- Do, H.X.; Gudmundsson, L.; Leonard, M.; Westra, S. The Global Streamflow Indices and Metadata Archive (GSIM)–Part 1: The production of daily streamflow archive and metadata. Earth Syst. Sci. Data 2018, 10, 765–785. [Google Scholar] [CrossRef] [Green Version]
- Gudmundsson, L.; Do, H.X.; Leonard, M.; Westra, S. The Global Streamflow Indices and Metadata Archive (GSIM)–Part 2: Quality control, time-series indices and homogeneity assessment. Earth Syst. Sci. Data 2018, 10, 787–804. [Google Scholar] [CrossRef] [Green Version]
- Gu, X.; Zhang, H.; Singh, V.P.; Liu, L. Nonstationarity in the occurrence rate of floods in the Tarim River basin, China, and related impacts of climate indices. Glob. Planet. Change 2016, 142, 1–13. [Google Scholar] [CrossRef] [Green Version]
- Gu, X.H.; Zhang, Q.; Singh, V.P.; Chen, Y.D.; Shi, P. Temporal clustering of floods and impacts of climate indices in the Tarim River basin, China. Glob. Planet. Chang. 2016, 147, 12–24. [Google Scholar] [CrossRef] [Green Version]
- Zhang, Q.; Liu, V.P.; Singh, X.; Gu, H.; Chen, X. Evaluation of impacts of climate change and human activities on streamflow in the Poyang Lake basin, China. Hydrol. Process 2016, 30, 2562–2576. [Google Scholar] [CrossRef]
- Knapp, K.R.; Kruk, M.C.; Levinson, D.H.; Diamond, H.J.; Neumann, C.J. The International Best Track Archive for Climate Stewardship (IBTrACS). Bull. Am. Meteorol. Soc. 2010, 91, 363–376. [Google Scholar] [CrossRef]
- Neu, U.; Akperov, M.; Bellenbaum, N.; Benestad, R.; Blender, R.; Caballero, R.; Cocozza, A.; Dacre, H.F.; Feng, Y.; Fraedrich, K.; et al. IMILAST: A Community Effort to Intercompare Extratropical Cyclone Detection and Tracking Algorithms. Bull. Am. Meteorol. Soc. 2013, 94, 529–547. [Google Scholar] [CrossRef]
- Lavender, S.L.; Abbs, D.J. Trends in Australian rainfall: Contribution of tropical cyclones and closed lows. Clim. Dyn. 2013, 40, 317–326. [Google Scholar] [CrossRef]
- Hart, R.E.; Evans, J. A Climatology of the Extratropical Transition of Atlantic Tropical Cyclones. J. Clim. 2001, 14, 546–564. [Google Scholar] [CrossRef]
- Kunkel, K.E.; Easterling, D.R.; Kristovich, D.A.; Gleason, B.; Stoecker, L.; Smith, R. Recent increases in U.S. heavy precipitation associated with tropical cyclones. Geophys. Res. Lett. 2010, 37, L24706. [Google Scholar] [CrossRef]
- Barlow, M. Influence of hurricane-related activity on North American extreme precipitation. Geophys. Res. Lett. 2011, 38, L04705. [Google Scholar] [CrossRef]
- Smith, J.A.; Villarini, G.; Baeck, M.L. Mixture distributions and the climatology of extreme rainfall and flooding in the eastern United States. J. Hydrometeor. 2011, 12, 294–309. [Google Scholar] [CrossRef]
- Donges, J.; Schleussner, C.-F.; Siegmund, J.; Donner, R. Event coincidence analysis for quantifying statistical interrelationships between event time series. Eur. Phys. J. Spec. Top. 2016, 225, 471–487. [Google Scholar] [CrossRef] [Green Version]
- Siegmund, J.F.; Siegmund, N.; Donner, R. CoinCalc—A new R package for quantifying simultaneities of event series. Comput. Geosci. 2017, 98, 64–72. [Google Scholar] [CrossRef] [Green Version]
- Lai, C.; Tseng, M. Comparison of regression models, grey models, and supervised learning models for forecasting flood stage caused by typhoon events. J. Chin. Inst. Eng. 2010, 33, 629–634. [Google Scholar] [CrossRef]
- Motevalli, A.; Vafakhah, M. Flood hazard mapping using synthesis hydraulic and geomorphic properties at watershed scale. Stoch. Environ. Res. Risk Assess. 2016, 30, 1889–1900. [Google Scholar] [CrossRef]
- Saidi, H.; Dresti, C.; Ciampittiello, M. Fluctuations of Lake Orta water levels: Preliminary analyses. J. Limnol. 2016, 75, 86–92. [Google Scholar] [CrossRef] [Green Version]
- de Vries, A.J. A global climatological perspective on the importance of Rossby wave breaking and intense moisture transport for extreme precipitation events. Weather. Clim. Dyn. 2021, 2, 129–161. [Google Scholar] [CrossRef]
- Nayak, M.A.; Villarini, G. A long-term perspective of the hydroclimatological impacts of atmospheric rivers over the central United States. Water Resour. Res. 2017, 53, 1144–1166. [Google Scholar] [CrossRef]
- Ralph, F.M.; Neiman, P.J.; Wick, G.A.; Gutman, S.I.; Dettinger, M.D.; Cayan, D.R.; White, A.B. Flooding on California’s Russian River: Role of atmospheric rivers. Geophys. Res. Lett. 2006, 33, L13801. [Google Scholar] [CrossRef] [Green Version]
- Waliser, D.; Guan, B. Extreme winds and precipitation during landfall of atmospheric rivers. Nat. Geosci. 2017, 10, 179–183. [Google Scholar] [CrossRef]
- Dowdy, A.; Mills, G.; Timbal, B.; Griffiths, M.; Wang, Y. Understanding rainfall projections in relation to extratropical cyclones in eastern Australia. J. South. Hemisphere Earth Syst. Sci. 2013, 63, 355–364. [Google Scholar] [CrossRef]
- Dowdy, A.; Grose, M.; Timbal, B.; Moise, A.; Ekstrom, M.; Bhend, J.; Wilson, L. Rainfall in Australia’s eastern seaboard: A review of confidence in projections based on observations and physical processes. Aust. Meteorol. Oceanogr. J. 2015, 65, 107–126. [Google Scholar] [CrossRef]
- Pepler, A.S.; Fong, J.; Alexander, L.V. Australian east coast mid-latitude cyclones in the 20th Century Reanalysis ensemble. Int. J. Clim. 2017, 37, 2187–2192. [Google Scholar] [CrossRef]
- Zhang, W.; Villarini, G.; Vecchi, G.A.; Smith, J.A. Urbanization exacerbated the rainfall and flooding caused by hurricane Harvey in Houston. Nature 2018, 563, 384–388. [Google Scholar] [CrossRef] [PubMed]
- Lu, W.; Lei, H.; Yang, W.; Yang, J.; Yang, D. Comparison of Floods Driven by Tropical Cyclones and Monsoons in the Southeastern Coastal Region of China. J. Hydrometeorol. 2020, 21, 1589–1603. [Google Scholar] [CrossRef]
- Ely, L.L.; Enzel, Y.; Baker, V.R.; Kale, V.S.; Mishra, S. Changes in the magnitude and frequency of late Holocene monsoon floods on the Narmada River, central India. GSA Bull. 1996, 108, 1134–1148. [Google Scholar] [CrossRef]
- Knight, D.; Davis, R.E. Contribution of tropical cyclones to extreme rainfall events in the southeastern United States. J. Geophys. Res. Space Phys. 2009, 114, D23102. [Google Scholar] [CrossRef] [Green Version]
- Zhang, J.; Wu, L.G.; Zhang, Q. Tropical cyclone damages in China under global warming. J. Trop. Meteorol. 2013, 19, 120–129. [Google Scholar]
- Singh, K.S.; Albert, J.; Bhaskaran, P.K.; Alam, P. Assessment of extremely severe cyclonic storms over Bay of Bengal and performance evaluation of ARW model in the prediction of track and intensity. Theor. Appl. Clim. 2021, 143, 1181–1194. [Google Scholar] [CrossRef]
- Zhang, X.; Walsh, J.E.; Zhang, J.; Bhatt, U.; Ikeda, M. Climatology and Interannual Variability of Arctic Cyclone Activity: 1948–2002. J. Clim. 2004, 17, 2300–2317. [Google Scholar] [CrossRef]
- Murakami, H.; Li, T.; Hsu, P.-C. Contributing Factors to the Recent High Level of Accumulated Cyclone Energy (ACE) and Power Dissipation Index (PDI) in the North Atlantic. J. Clim. 2014, 27, 3023–3034. [Google Scholar] [CrossRef] [Green Version]
- Fitchett, J.M.; Grab, S.W. A 66-year tropical cyclone record for south-east Africa: Temporal trends in a global context. Int. J. Clim. 2014, 34, 3604–3615. [Google Scholar] [CrossRef]
- Gray, W.M. Hurricanes: Their Formation, Structure and Likely Role in the Tropical Circulation-Meteorology Over the Tropical Oceans; Shaw, D.B., Ed.; Royal Meteorological Society, James Glaisher House, Grenville Place: Bracknell, UK, 1979; pp. 155–218. [Google Scholar]
- Chia, H.H.; Ropelewski, C.F. The Interannual Variability in the Genesis Location of Tropical Cyclones in the Northwest Pacific. J. Clim. 2002, 15, 2934–2944. [Google Scholar] [CrossRef]
- Deb, S.K.; Kishtawal, C.M.; Pal, P.K.; Joshi, P.C. Impact of TMI SST on the Simulation of a Heavy Rainfall Episode over Mumbai on 26 July 2005. Mon. Weather. Rev. 2008, 136, 3714–3741. [Google Scholar] [CrossRef]
- Kim, H.-M.; Webster, P.J.; Curry, J.A. Modulation of North Pacific Tropical Cyclone Activity by Three Phases of ENSO. J. Clim. 2011, 24, 1839–1849. [Google Scholar] [CrossRef] [Green Version]
- Varlas, G.; Papadopoulos, A.; Katsafados, P. An analysis of the synoptic and dynamical characteristics of hurricane Sandy (2012). Theor. Appl. Clim. 2018, 131, 443–453. [Google Scholar] [CrossRef]
- Messmer, M.; Gómez-Navarro, J.J.; Raible, C.C. Sensitivity experiments on the response of Vb cyclones to sea surface temperature and soil moisture changes. Earth Syst. Dyn. 2017, 8, 477–493. [Google Scholar] [CrossRef] [Green Version]
- Zhang, Y.; Cassardo, C.; Ye, C.; Galli, M.; Vela, N. The role of the land surface processes in the rainfall generated by a landfall typhoon: A simulation of the typhoon Sepat (2007). Asia-Pac. J. Atmos. Sci. 2011, 47, 63–77. [Google Scholar] [CrossRef]
- Tuleya, R.E. Tropical Storm Development and Decay: Sensitivity to Surface Boundary Conditions. Mon. Weather. Rev. 1994, 122, 291–304. [Google Scholar] [CrossRef] [Green Version]
Figure 1.
Spatial distributions of global streamflow data with record lengths in years during 1979–2012: In (a), flood peaks are available in these stations. In (b), daily streamflow observations are available, and the streamflow stations in South Asia are not shown due to lacking daily streamflow in this region.

Figure 2.
Contributions (%) of tropical cyclones (TCs), extratropical cyclones (ETCs), and all cyclones to annual floods in observations sampled by block maximum (BM) (a,c,e) and peak-over-threshold (POT) (b,d,f) methods.
Figure 2.
Contributions (%) of tropical cyclones (TCs), extratropical cyclones (ETCs), and all cyclones to annual floods in observations sampled by block maximum (BM) (a,c,e) and peak-over-threshold (POT) (b,d,f) methods.

Figure 3.
Contributions (%) of tropical cyclones (TCs), extratropical cyclones (ETCs), and all cyclones to annual floods in simulations sampled by block maximum (BM) (a,c,e) and peak-over-threshold (POT) (b,d,f) methods.
Figure 3.
Contributions (%) of tropical cyclones (TCs), extratropical cyclones (ETCs), and all cyclones to annual floods in simulations sampled by block maximum (BM) (a,c,e) and peak-over-threshold (POT) (b,d,f) methods.

Figure 4.
Contributions (%) of tropical cyclones (TCs, a–d), extratropical cyclones (ETCs, e–h), and all cyclones (i–l) to seasonal floods in observations sampled by block maximum (BM) method. The four seasons are DJF (December–February), MAM (March–May), JJA (June–August), and SON (September–November).

Figure 5.
Contributions (%) of tropical cyclones (TCs, a–d), extratropical cyclones (ETCs, e–h), and all cyclones (i–l) to seasonal floods in observations sampled by peak-over-threshold (POT) method. The four seasons are DJF (December–February), MAM (March–May), JJA (June–August), and SON (September–November).

Figure 6.
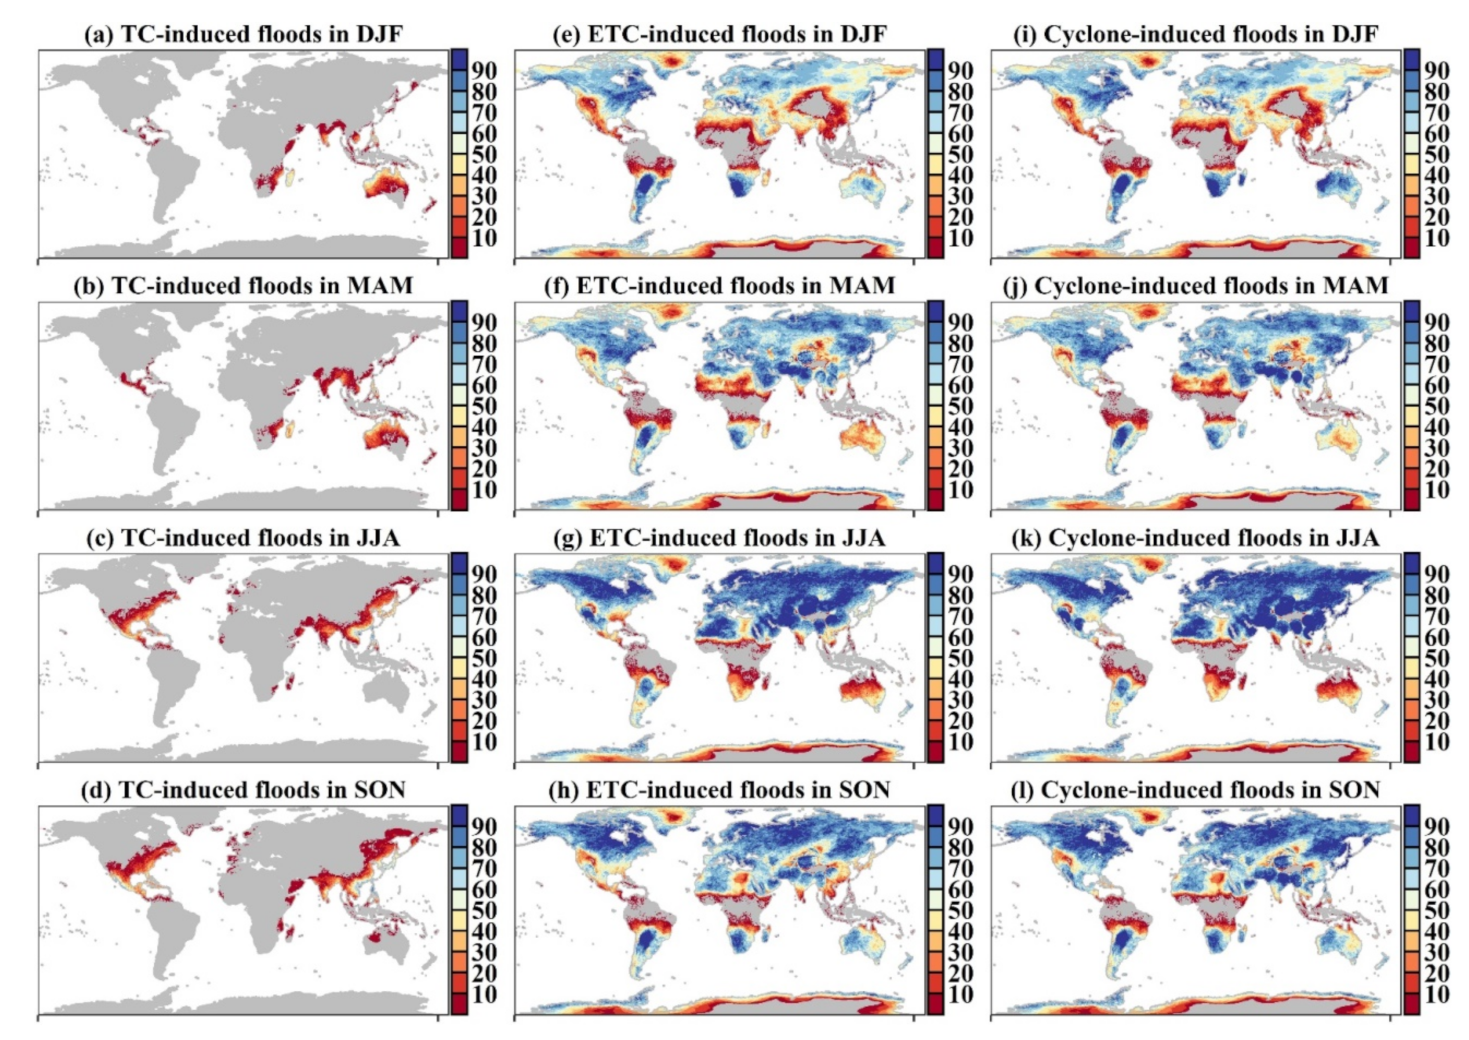
Contributions (%) of tropical cyclones (TCs, a–d), extratropical cyclones (ETCs, e–h), and all cyclones (i–l) to seasonal floods in simulations sampled by block maximum (BM) method. The four seasons are DJF (December–February), MAM (March–May), JJA (June–August), and SON (September–November).
Figure 6.
Contributions (%) of tropical cyclones (TCs, a–d), extratropical cyclones (ETCs, e–h), and all cyclones (i–l) to seasonal floods in simulations sampled by block maximum (BM) method. The four seasons are DJF (December–February), MAM (March–May), JJA (June–August), and SON (September–November).

Figure 7.
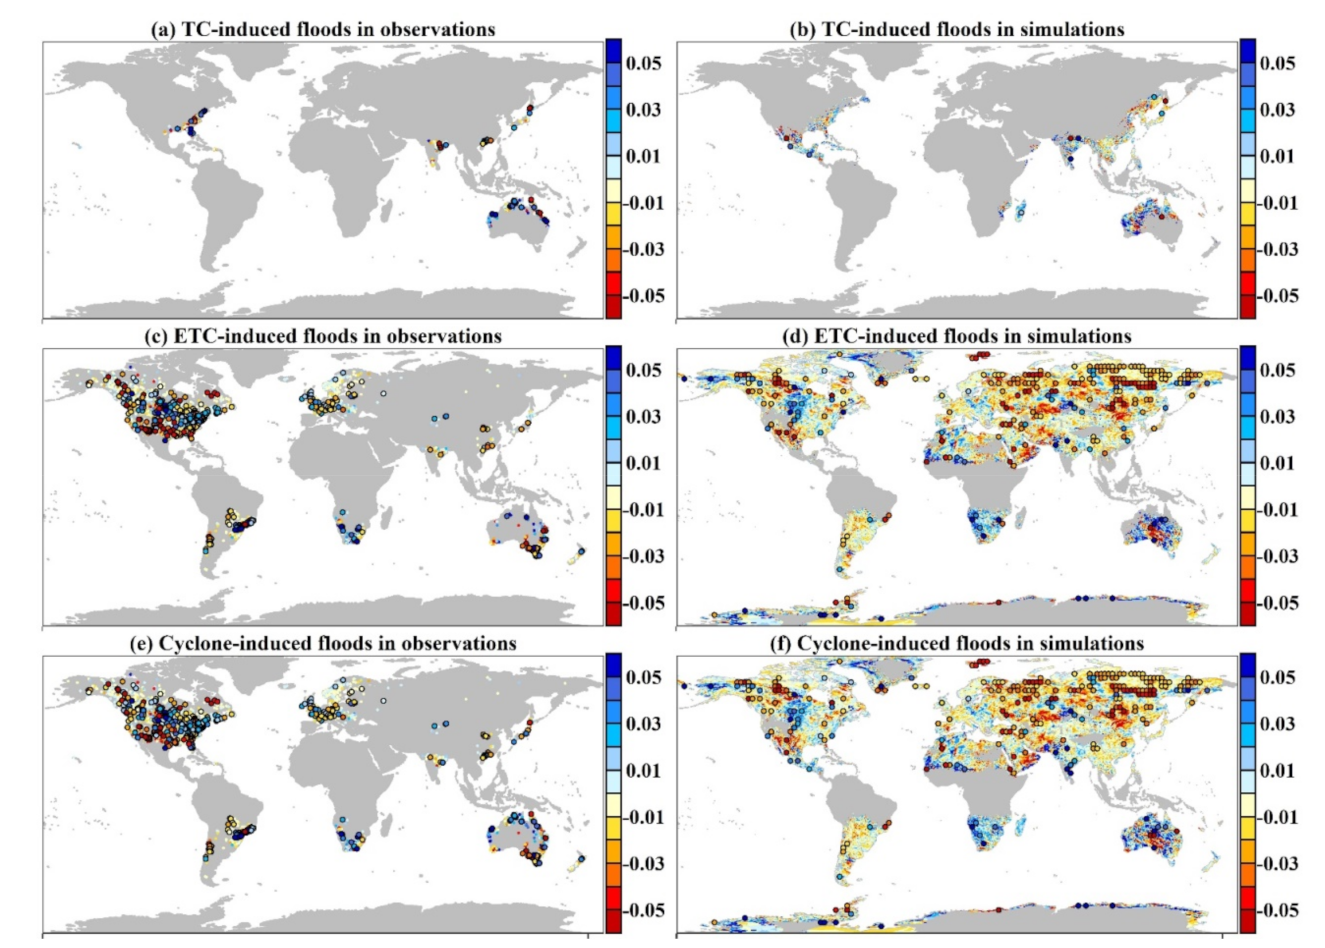
Long-term changes in the magnitude of TC, ETC, and cyclone-induced floods in observations (a,c,e) and simulations (b,d,f) during 1979–2012. The trend is quantified by the simple linear regression, and the colored points (grids) based on observations (simulations) represent slope coefficient in Equation (1). A higher probability of BM floods induced by cyclones with increasing (decreasing) magnitude are detected when is more (less) than zero. Moreover, the larger ring-shaped dots indicate the stations with significant change rate.
Figure 7.
Long-term changes in the magnitude of TC, ETC, and cyclone-induced floods in observations (a,c,e) and simulations (b,d,f) during 1979–2012. The trend is quantified by the simple linear regression, and the colored points (grids) based on observations (simulations) represent slope coefficient in Equation (1). A higher probability of BM floods induced by cyclones with increasing (decreasing) magnitude are detected when is more (less) than zero. Moreover, the larger ring-shaped dots indicate the stations with significant change rate.

Figure 8.
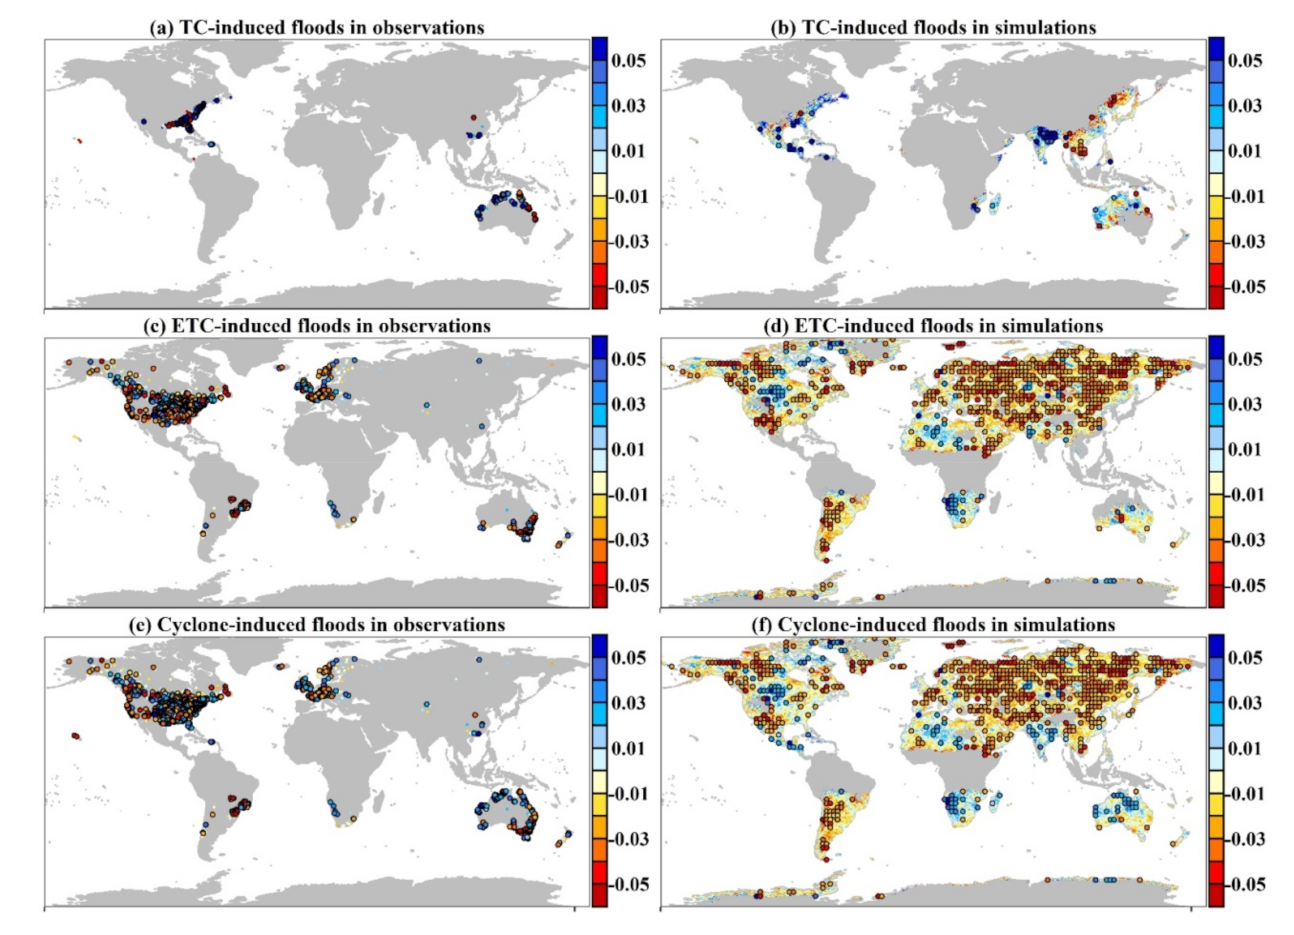
Long-term changes in the frequency of TC, ETC, and cyclone-induced floods in observations (a,c,e) and simulations (b,d,f) during 1979–2012. The trend is quantified by the Poisson regression, and the colored points (grids) based on observations (simulations) represent slope coefficient in Equation (3). A higher probability of BM floods induced by cyclones with increasing (decreasing) frequency are detected when is more (less) than zero. Moreover, the larger ring-shaped dots indicate the stations with significant change rate.
Figure 8.
Long-term changes in the frequency of TC, ETC, and cyclone-induced floods in observations (a,c,e) and simulations (b,d,f) during 1979–2012. The trend is quantified by the Poisson regression, and the colored points (grids) based on observations (simulations) represent slope coefficient in Equation (3). A higher probability of BM floods induced by cyclones with increasing (decreasing) frequency are detected when is more (less) than zero. Moreover, the larger ring-shaped dots indicate the stations with significant change rate.

Figure 9.
Spatial distributions of long-term changes of annual TC and ETC tracks (a,d), duration (b,e), and intensity (c,f) in 5° × 5° grids during 1979–2012: The trend is quantified by the Poisson (simple linear) regression, and the colored areas represent slope in Equations (1) and (3). A higher probability of increasing (decreasing) cyclone tracks and duration (intensity) is detected when is more (less) than zero. Moreover, the black dots indicate the grid with significant change rates (i.e., p ≤ 0.05).

Figure 10.
Spatial distributions of long-term changes of integrated vapor transport (IVT; units: kg m−1 s−1; (a), annual convective available potential energy (CAPE; units: J g−1; (b), and surface soil moisture (SSM; m3 m−3; (c) in 0.25° × 0.25° grids during 1979–2012. The black dots indicate the grid with significant changes (i.e., p ≤ 0.05).


Table 1.
Details of streamflow datasets collected in this study.
| Dataset/Region | Full Name | Temporal Resolution | Numbers | Length (Year) | Source |
|---|---|---|---|---|---|
| GSCD | Global Streamflow Characteristics Dataset | Daily | 20346 | 1900–2018 | http://www.gloh2o.org/gscd/ (7 August 2020) [40] |
| GSIM | Global Streamflow Indices and Metadata Archive | Annual flood peaks | 30959 | 1804–2016 | https://doi.pangaea.de/10.1594/PANGAEA.887477 (3 March 2020) [41,42] |
| Yangtze river basin | China Streamflow Dataset | Daily | 68 | 1955–2018 | http://61.163.88.227:8006/hwsq.aspx (16 March 2020) |
| Yellow River basin | 53 | 1934–2018 | http://113.57.190.228:8001/web/Report/RiverReport?WxUg5ztDmi=1596375699841 # (16 March 2020) | ||
| Pearl River Basin | 85 | 1915–2009 | http://slt.gd.gov.cn/ (16 March 2020) | ||
| Tarim River basin | 8 | 1956–2009 | Hydrological Bureau of the Tarim River basin [43,44] | ||
| Poyang Lake basin | 9 | 1949–2005 | http://www.jxssw.gov.cn/ (16 March 2020) [45] | ||
| Guangdong province, southeastern China | China Streamflow Dataset | Annual flood peaks | 58 | 1951–2014 | Hydrological bureau of Guangdong province [45] |
Table 2.
Details of datasets for reanalysis variables used in this study.
| Dataset | Full Name | Variables | Temporal Resolution | Spatial Resolution | Level | Units | Source |
|---|---|---|---|---|---|---|---|
| ERA5 dataset | European Centre for Medium-Range Weather Forecasts (ECMWF) 5 Re-Analysis dataset | Surface runoff | Hourly | 0.25°0.25° | Single level | m | https://www.ecmwf.int/en/forecasts/datasets/reanalysis-datasets/era5 (27 September 2021) |
| Vertical integral of northward water va- por flux | Monthly | Kg m−1 s−1 | |||||
| Vertical integral of eastward water va- por flux | Kg m−1 s−1 | ||||||
| Convective available potential energy | J g−1 | ||||||
| Volumetric soil water layer 1 | m3 m−3 |
Publisher’s Note: MDPI stays neutral with regard to jurisdictional claims in published maps and institutional affiliations. |
© 2021 by the authors. Licensee MDPI, Basel, Switzerland. This article is an open access article distributed under the terms and conditions of the Creative Commons Attribution (CC BY) license (https://creativecommons.org/licenses/by/4.0/).
Share and Cite
MDPI and ACS Style
Wang, L.; Gu, X.; Beck, H.E. Cyclones and Global Floods from an Observation-Simulation Evaluation: Contributions and Long-Term Changes. Water 2021, 13, 2965. https://doi.org/10.3390/w13212965
AMA Style
Wang L, Gu X, Beck HE. Cyclones and Global Floods from an Observation-Simulation Evaluation: Contributions and Long-Term Changes. Water. 2021; 13(21):2965. https://doi.org/10.3390/w13212965
Chicago/Turabian StyleWang, Liangyi, Xihui Gu, and Hylke E. Beck. 2021. "Cyclones and Global Floods from an Observation-Simulation Evaluation: Contributions and Long-Term Changes" Water 13, no. 21: 2965. https://doi.org/10.3390/w13212965
Note that from the first issue of 2016, this journal uses article numbers instead of page numbers. See further details here.