
Performance Evaluation of Different Combined Drainage Forms on Flooding and Waterlogging Removal


1
College of Water Resources and Civil Engineering, China Agricultural University, Beijing 100083, China
2
Department of Irrigation and Drainage, China Institute of Water Resources and Hydropower Research, Beijing 100048, China
*
Author to whom correspondence should be addressed.
Water 2021, 13(21), 2968; https://doi.org/10.3390/w13212968
Submission received: 9 August 2021
/
Revised: 15 October 2021
/
Accepted: 18 October 2021
/
Published: 21 October 2021
(This article belongs to the Special Issue Excessive Water and Drainage Management in Agriculture: Disaster, Facilities Operation and Pollution Control)
Abstract
:Farmland in southern China is prone to flooding and waterlogging alternation after short-term heavy rainfall. Single drainage form cannot meet the requirements of the farmland flooding and waterlogging removal. Drainage measures and layout forms should be explored to alleviate flooding and waterlogging threat and improve crop yield. So, based on an indoor sand tank experiment, this paper presents a combined drainage form: conventional subsurface drainage as an auxiliary drainage measure and is alternatively combined with open ditch (OD), filter drainage (FD), conventional (CD) and improved subsurface drainage (ID), respectively, under equal and unequal drain depth. The performance of different combined drainage forms and the effect of auxiliary drainage measures are discussed for stable ponding and receding water. During the experiment, two factors—drainage measure and drain depth—are considered. The results indicate that compared with the conventional subsurface drainage alone, the flow rates of the open-ditch, thin-improved, and thick-improved subsurface drainage combined with conventional subsurface drainage can be increased by 22.4–32.3%, 10.6–16.2%, and 29.8–32%, respectively, under equal drain depth in stable ponding water. Among the four combined drainage forms, the flow rate of shallow–deep combination is 8.1–17.1% higher than that of the shallow–shallow combination. Compared with a single drainage form, the flow rates of the combined drainage have the same change characteristics over time. Additionally, the use of auxiliary, conventional, subsurface drainage can improve the flooding and waterlogging removal efficiency in farmland. For the combined drainage forms, the contribution degree of the open-ditch and thin-improved subsurface drainage is 51.3–56.7%, while the thick-improved subsurface drainage is approximately 61.0%, under equal drain depth conditions in the flooding removal process. Moreover, open-ditch and thick-improved subsurface drainage combined with conventional subsurface drainage have significant advantages in flooding and waterlogging removal, which were 11.5–38.1% and 37.1–48.6% faster than conventional subsurface drainage in flooding removal time, 14.3–157.1% and 14.3–44.4% faster than conventional subsurface drainage in the waterlogging removal time. The synergistic application of shallow–deep and medium–medium combinations can be carried out by exploiting the advantages of each drainage measure. The experimental flow rate observation is in good agreement with the theoretically calculated value, with a relative error of less than 5%. These research findings could provide technical support for the increased application of combined drainage forms in areas prone to flooding and waterlogging.
1. Introduction
Human activities have increased greenhouse gas emissions [1], which has affected the frequency, duration, and spatial distribution of extreme rainfall events [2,3]. The number of extreme events caused by climate change has doubled since the 1990s, with flood-related disasters showing the largest increase (65%) [4]. In 2016, more than 9.3 million hectares of farmland were affected in China, and more than 1.5 million hectares were destroyed [5]. Climate change is likely to become a major obstacle for the development of sustainable agriculture and mitigation of global food security [6]. New requirements and challenges have been put forward for flooding and waterlogging removal in farmland, in order to reduce the loss from frequent floods in the case of increasing short-duration heavy rainfall events [7,8].
Farmland drainage is an effective method for removing flooding and waterlogging. Different types of drainage measures have different characteristics and applicability. Conventional subsurface drainage has the characteristics of occupying less cultivated land, high land utilization rate, and convenient construction, and its drainage effectiveness has been proven in China, Pakistan [9] and India [10]. However, it has a low flow rate [11,12]. Conventional subsurface drainage is limited in controlling groundwater level in a traditional sense. Recent studies have shown that conventional subsurface drainage can reduce surface runoff and affect surface erosion and pollutant discharge processes [13,14]. The flow rate of open-ditch drainage is higher than that of other drainage measures; nonetheless, it has disadvantages such as excessive occupation of cultivated land, easy slope collapse, unfavorable mechanization operation [15,16], and an insufficient waterlogging removal effect. The influence range of open-ditch drainage that can only reduce the groundwater level near the ditch is limited because of its large spacing. Open-ditch spacing needs to be reduced to lower the groundwater level below the required crop submergence tolerance depth, so the open ditch will occupy more cultivated land in heavy soil areas [17,18]. Filter drainage can increase the flow rate; however, solid particles easily clog the filter body [19]. Mole drainage has a significant effect on improving the physical and chemical properties of soil, but it is too dependent on soil conditions [20]. Some improvements have been made according to traditional drainage measures. Based on filter drainage, Tao et al. [12] proposed an improved subsurface drainage combining filter drainage (gravel, straw, layered gravel, and mixed gravel) with conventional subsurface drainage. To reduce the risk of drain clogging and improve drainage performance, Kaboosi et al. [21] proposed a method of combining rice husk with gravel as an envelope. Tuohy et al. [22] proposed a method that combines mole drainage with gravel to improve the flow rate.
Drain depth is an important factor that affects the flow rate of drainage measures. A deep drain depth has certain advantages in controlling the groundwater level [23] and ensuring a high flow rate. However, an exceedingly deep drain depth will cause construction difficulties and high cost. Inversely, one that is too shallow will reduce the flow rate and may not meet the drainage requirements [24]. Nevertheless, shallow drain depths are more effective in improving soil hydraulic properties than deep ones [25]. In addition, the water flow paths of shallow subsurface pipes have been shortened [26]. Therefore, while pursuing an increased flow rate and improving drainage efficiency, economic costs and comprehensive effects should be considered.
In practice, a single drainage form is often unable to meet flooding and waterlogging removal requirements in farmlands. Open-ditch drainage will be deeper and will occupy more tillage land when it is used alone to improve drainage efficiency. Problems such as delayed drainage of flooding and waterlogging may occur when a conventional subsurface drainage is used alone [27]. Some combined drainage forms that are based on single drainage forms have been proposed because of their respective advantages and to meet flooding and waterlogging removal requirements. Some examples are the double-layer combination of conventional subsurface and mole drainage [28] and the combination of an open ditch and conventional subsurface drainage [27]. Filipović et al. [14] proposed a drainage system that combines a high-permeability gravel backfill above a clay tile pipe, and implements mole drainage through indoor drainage experiments to improve drainage efficiency and reduce surface runoff. Moreover, scholars have carried out some combinations of conventional subsurface drainage at different drain depths. Wang et al. [29] proposed the use of double-layer conventional subsurface drainage with wheat straw and zeolite as the outside filter material to increase drainage efficiency and control the loss of nitrogen and phosphorus in the soil. Verma et al. [30] and Du et al. [31] pointed out that the double-layer drainage system laid alternatively with shallow and deep depths has the prominent advantage of low cost; additionally, this layout can avoid excessive drainage by adjusting the drain spacing. On this basis, a variety of combined drainage forms were investigated in this study, such as a combination of open-ditch, filter, conventional and improved subsurface drainage with conventional subsurface drainage. The flow rate and flooding and waterlogging removal effect of different combined drainage forms are discussed to further quantify their drainage performance.
The combined forms of open-ditch with subsurface drainage systems have been applied in China and Japan [32,33]. The traditional combined drainage forms of open-ditch and conventional subsurface drainage are mainly laid out in the form of orthogonal angles; a parallel arrangement is adopted in this study. The discharge of surface water directly into an open ditch is easy to be estimated. Mostly, the open ditch is widely used for removing the surface water. However, the effect of surface ponding water infiltrating into soil and seepage through the open ditch is often overlooked. Additionally, there are no mature results on the effect of conventional subsurface drainage in assisting other drainage measures to remove surface water. Thus, this field should be further studied. The current research focuses on south China, where the flooding and waterlogging often occur alternately, the groundwater level is high, and the single drainage forms cannot meet the requirement of farmland drainage, therefore combined drainage should be further studied and applied. In this study, a simulated indoor drainage test was conducted to explore the effect and feasibility of various combined drainage forms in accelerating the infiltration of ponding water and drainage through subsurface drainage systems, and we provide technical support for the application of combined drainage forms in farmland flooding and waterlogging removal.
2. Materials and Methods
2.1. Experimental Structure
An indoor sand tank was used in the experiment to simulate all of the combined drainage forms, and field engineering was used as a reference for the model, which was scaled down by 1:20. The sand tank was made of acrylic glass with a thickness of 1 cm and a size of 50 × 20 × 30 cm (length × width × height). The soil was filled layer-by-layer according to a certain bulk density. The soil is divided into two types, i.e., the bottom is filled with 4 cm of strong permeable material (2–4 mm-diameter quartz sand), and the upper soil is filled with 22.5 cm of 80–120 mesh quartz sand to shorten the test period, facilitate the water charging and gas removal, and effectively explore the drainage law, which has been adopted by researchers carrying out theoretical physical simulations of the same type of seepage flow [34,35]. A gauze was laid between the two soil layers to prevent loss of the upper soil. Along the length of the sand tank, a charging pipe with a diameter of 1 cm was laid at the bottom for water charge and gas removal. The bottom and top charging pipes were alternately connected with the fixed height of the water tank, to fill with water, remove gas, and control the initial water head. Three rows of holes were arranged on the back wall of the sand tank, which were 21.0 cm, 22.5 cm, and 24.0 cm away from the bottom of the tank, respectively. Each row had 7 holes, 0.5 cm, 5.0 cm, 15.0 cm, 25.0 cm, 35.0 cm, 45.0 cm, 49.5 cm away from one sidewall, respectively. These holes were connected to the piezometers through a latex tube with an internal diameter of 6 mm, to measure the water head in different parts. The drainage pipe was made of an open hole with a diameter of 6.35 mm, and the pipe was densely covered with Φ 2 holes with a hole distance of 2 cm. The open ditch and the filter were made of a 0.5-mm-thick stainless porous plate; both of them were made into half model components with a bottom width of 2 cm. The open-ditch trapezoidal trough was made shallow, medium, and deep, with drain depth of 2.5, 4.0, and 5.5 cm, respectively, according to a 1:1 slope. The filter was designed with two types of thin and thick filter bodies with a height of 1 and 2 cm, respectively. The improved subsurface drainage adopts the structure of adding a drainage pipe into the filter body. For testing, the outside of the subsurface pipe, the open ditch, and the filter body were wrapped with gauze for water permeability and to prevent clogging. A schematic diagram of the test device is shown in Figure 1.
2.2. Experimental Design
Drainage measures were set for conventional subsurface drainage (CD), open-ditch drainage (OD), filter drainage (FD), and improved subsurface drainage (ID) with shallow, medium, and deep depths of 2.5, 4.0, and 5.5 cm, respectively (corresponding to actual drain depths of 50, 80, and 110 cm, abbreviated as s, m, d, respectively). The drainage measures were arranged on both sidewalls of the sand tank. A baffle is set on the edge of the open ditch to prevent ponding water entering the drainage ditch directly and was used to simulate the subsurface drainage ability of ponding water infiltrating into the soil and seepage through the open ditch. Because the open-ditch drain depths are different, the baffle locations are different. Considering whether a subsurface pipe is arranged in the filter body, two conditions of 1 cm filter height of thin-improved (ID-1) and thin-filter FD-1) drainage, and a 2 cm filter height of thick-improved (ID-2) and thick-filter (FD-2) drainage were set. Figure 2 shows the structures of conventional, thin-improved, thick-improved, thin-filter, and thick-filter subsurface drainage. The single drainage forms are arranged on the left side of the sand tank, namely, conventional subsurface, open-ditch, filter, and improved subsurface drainage. Based on the single drainage forms, different drainage measures on the left side of the sand tank and the auxiliary conventional subsurface drainage on the right side are alternatively combined according to equal or unequal depth conditions, in order to fully benefit from the advantages of various drainage measures. Six drainage conditions were tested for each combination. When the height of the filter body was 2 cm, only the medium and deep depths were considered. Taking the open-ditch and conventional subsurface drainage combination as an example, it is represented by OD + CD; similarly, the thin-improved and conventional subsurface drainage combination is represented by ID-1 + CD. The design scheme of the different combined drainage forms is shown in Table 1, and the structural planar graph is shown in Figure 3.
2.3. Observation Method
This experiment was divided into two free outflow cases: steady drainage with stable ponding water, and unsteady drainage with water receded. In steady drainage, the height of the ponding water was set to 2.0 cm and was kept stable by supplying water through the fixed height of the water tank. A volumetric cylinder was used to measure the flow rate at the outlet of the drainage measures, and each group of tests was repeated five times. In the case of unsteady drainage, the initial ponding water was 2.0 cm height and the water supply was stopped at the beginning of drainage. Then, the piezometer was recorded in real time by taking pictures, and the flow rate was measured with a volumetric cylinder at regular intervals. For the single drainage form, the drainage measure for a drain depth on one sidewall of the sand tank was operated and the outlets of the drainage measures for other drain depth were closed. For the combined drainage form, the drainage measures for equal or unequal drain depth on both sides were operated and other outlets were closed.
3. Results
3.1. Flow Rate of Different Combinations under Stable Ponding Water
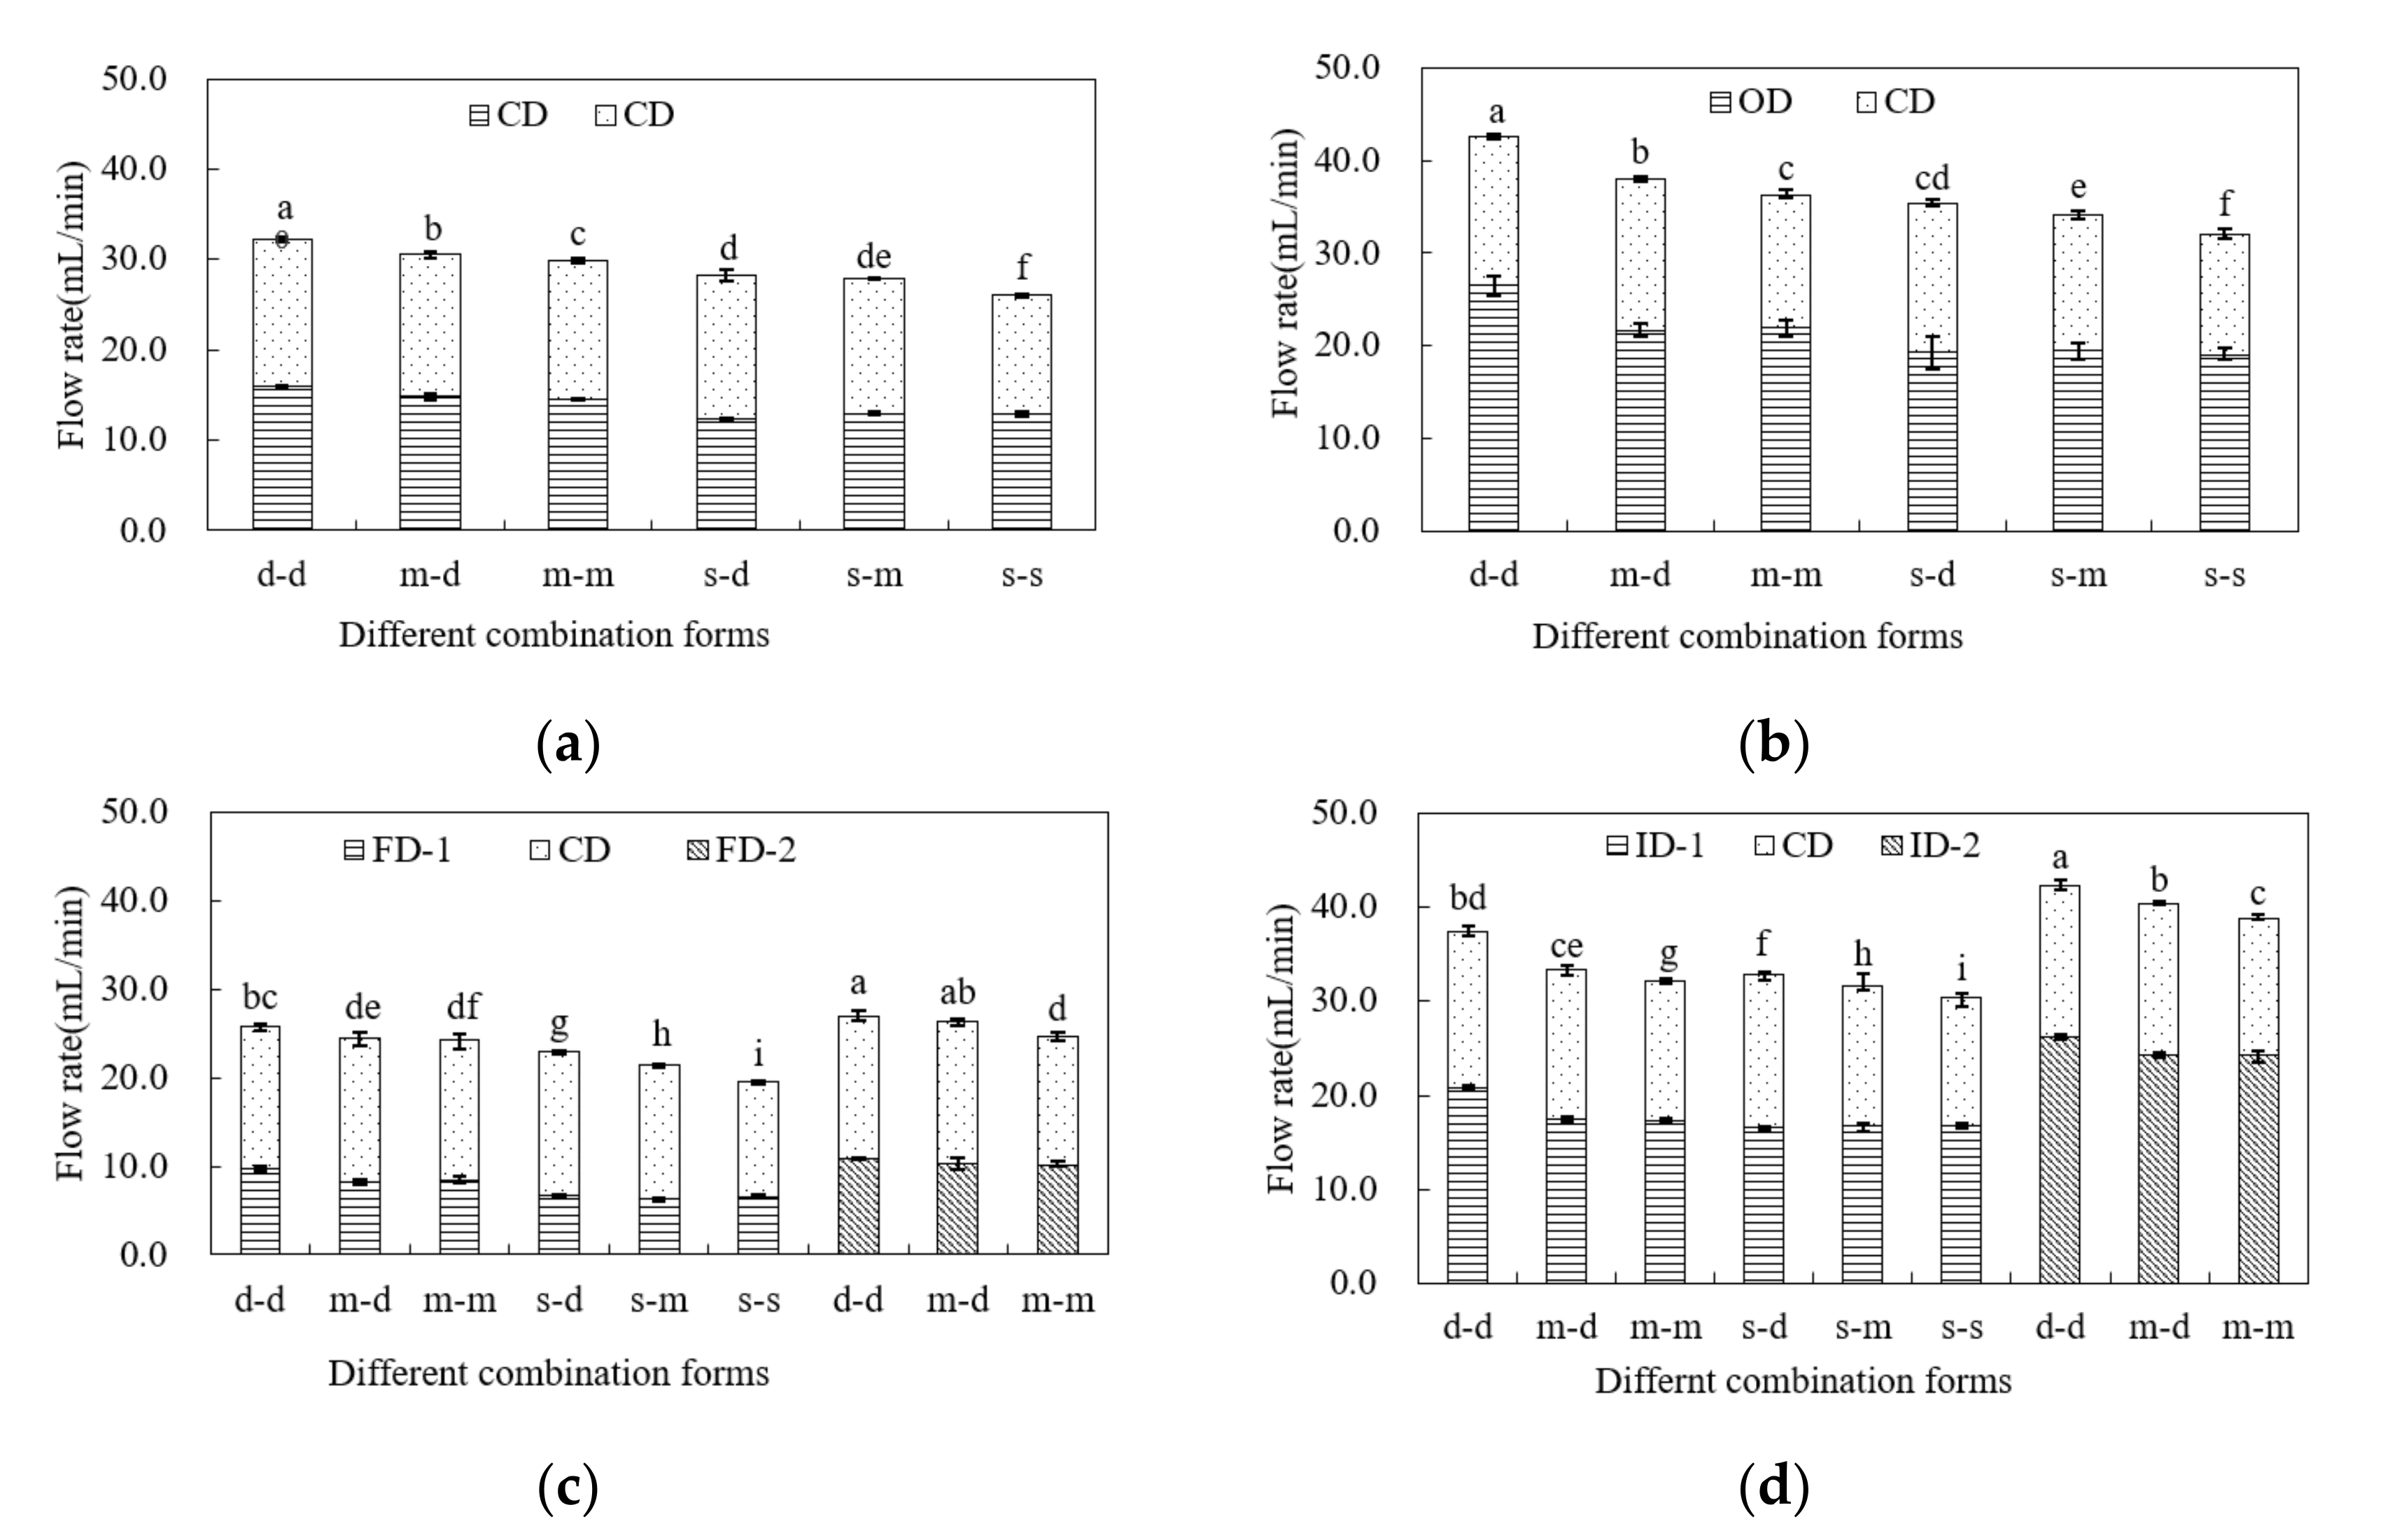
The flow rate comparison of the combined drainage forms when the ponding water is stable is shown in Figure 4. Compared with the single drainage form, it can be found that there is little difference between the flow rate of the same drainage measure in the combined drainage forms under the same drain depth. Under the condition of the same drain depth on both sides, the combined drainage form flow rate of the CD + CD was 26.1–32.2 mL/min. The flow rate of OD + CD was larger, i.e., up to 32.1–42.6 mL/min. Due to the small flow rate of the filter drainage, the flow rate of FD-2 + CD was 24.6–26.9 mL/min, while that of FD-1 + CD was 19.5–25.8 mL/min. The flow rates of ID-2 + CD and ID-1 + CD were 38.6–42.3 and 30.3–37.3 mL/min, respectively. Compared with the CD + CD, the flow rate of the OD + CD can be increased by 22.4–25.5%, 24.0%, and 32.3% in the shallow, medium, and deep depths, respectively. The drainage effect is mainly improved with an increase in the drain depth of the open ditch on the left side. For the ID-1 + CD, the flow rate can be increased by 13.4–16.2%, 10.6–12.5%, and 16.2% for the shallow, medium, and deep depths, respectively. At medium and deep depths, the flow rate of the ID-2 + CD can be increased by 29.8–31.2% and 32.0%, respectively. When the two sides have the same drain depth, the flow rates of the medium–medium combination were 14.7%, 13.3%, 7.5%, and 18.7% higher than that of the shallow–shallow combination for CD + CD, OD + CD, ID-1 + CD, and ID-2 + CD, and 7.1%, 14.8%, 14.3%, and 10.1% lower than that of the deep–deep combination, respectively.
When the two sides are arranged with different drain depths and compared with the shallow–shallow combination, the flow rates of CD + CD, OD + CD, ID-1 + CD, and ID-2 + CD increased by 8.2%, 10.5%, 8.1%, and 17.1%, respectively, under the shallow–deep combination. Compared with the deep–deep combination form, it decreases by 12.4%, 16.9%, 12.4%, and 11.3%, respectively. Except for the OD + CD, the flow rates of the shallow–deep and medium–medium combinations have a small difference. Compared with the shallow–shallow combination, it can ensure a larger flow rate. Additionally, compared with the deep–deep combination it also can reduce the construction difficulty.
3.2. Flow Rate of Different Combinations under the Receded Water Condition
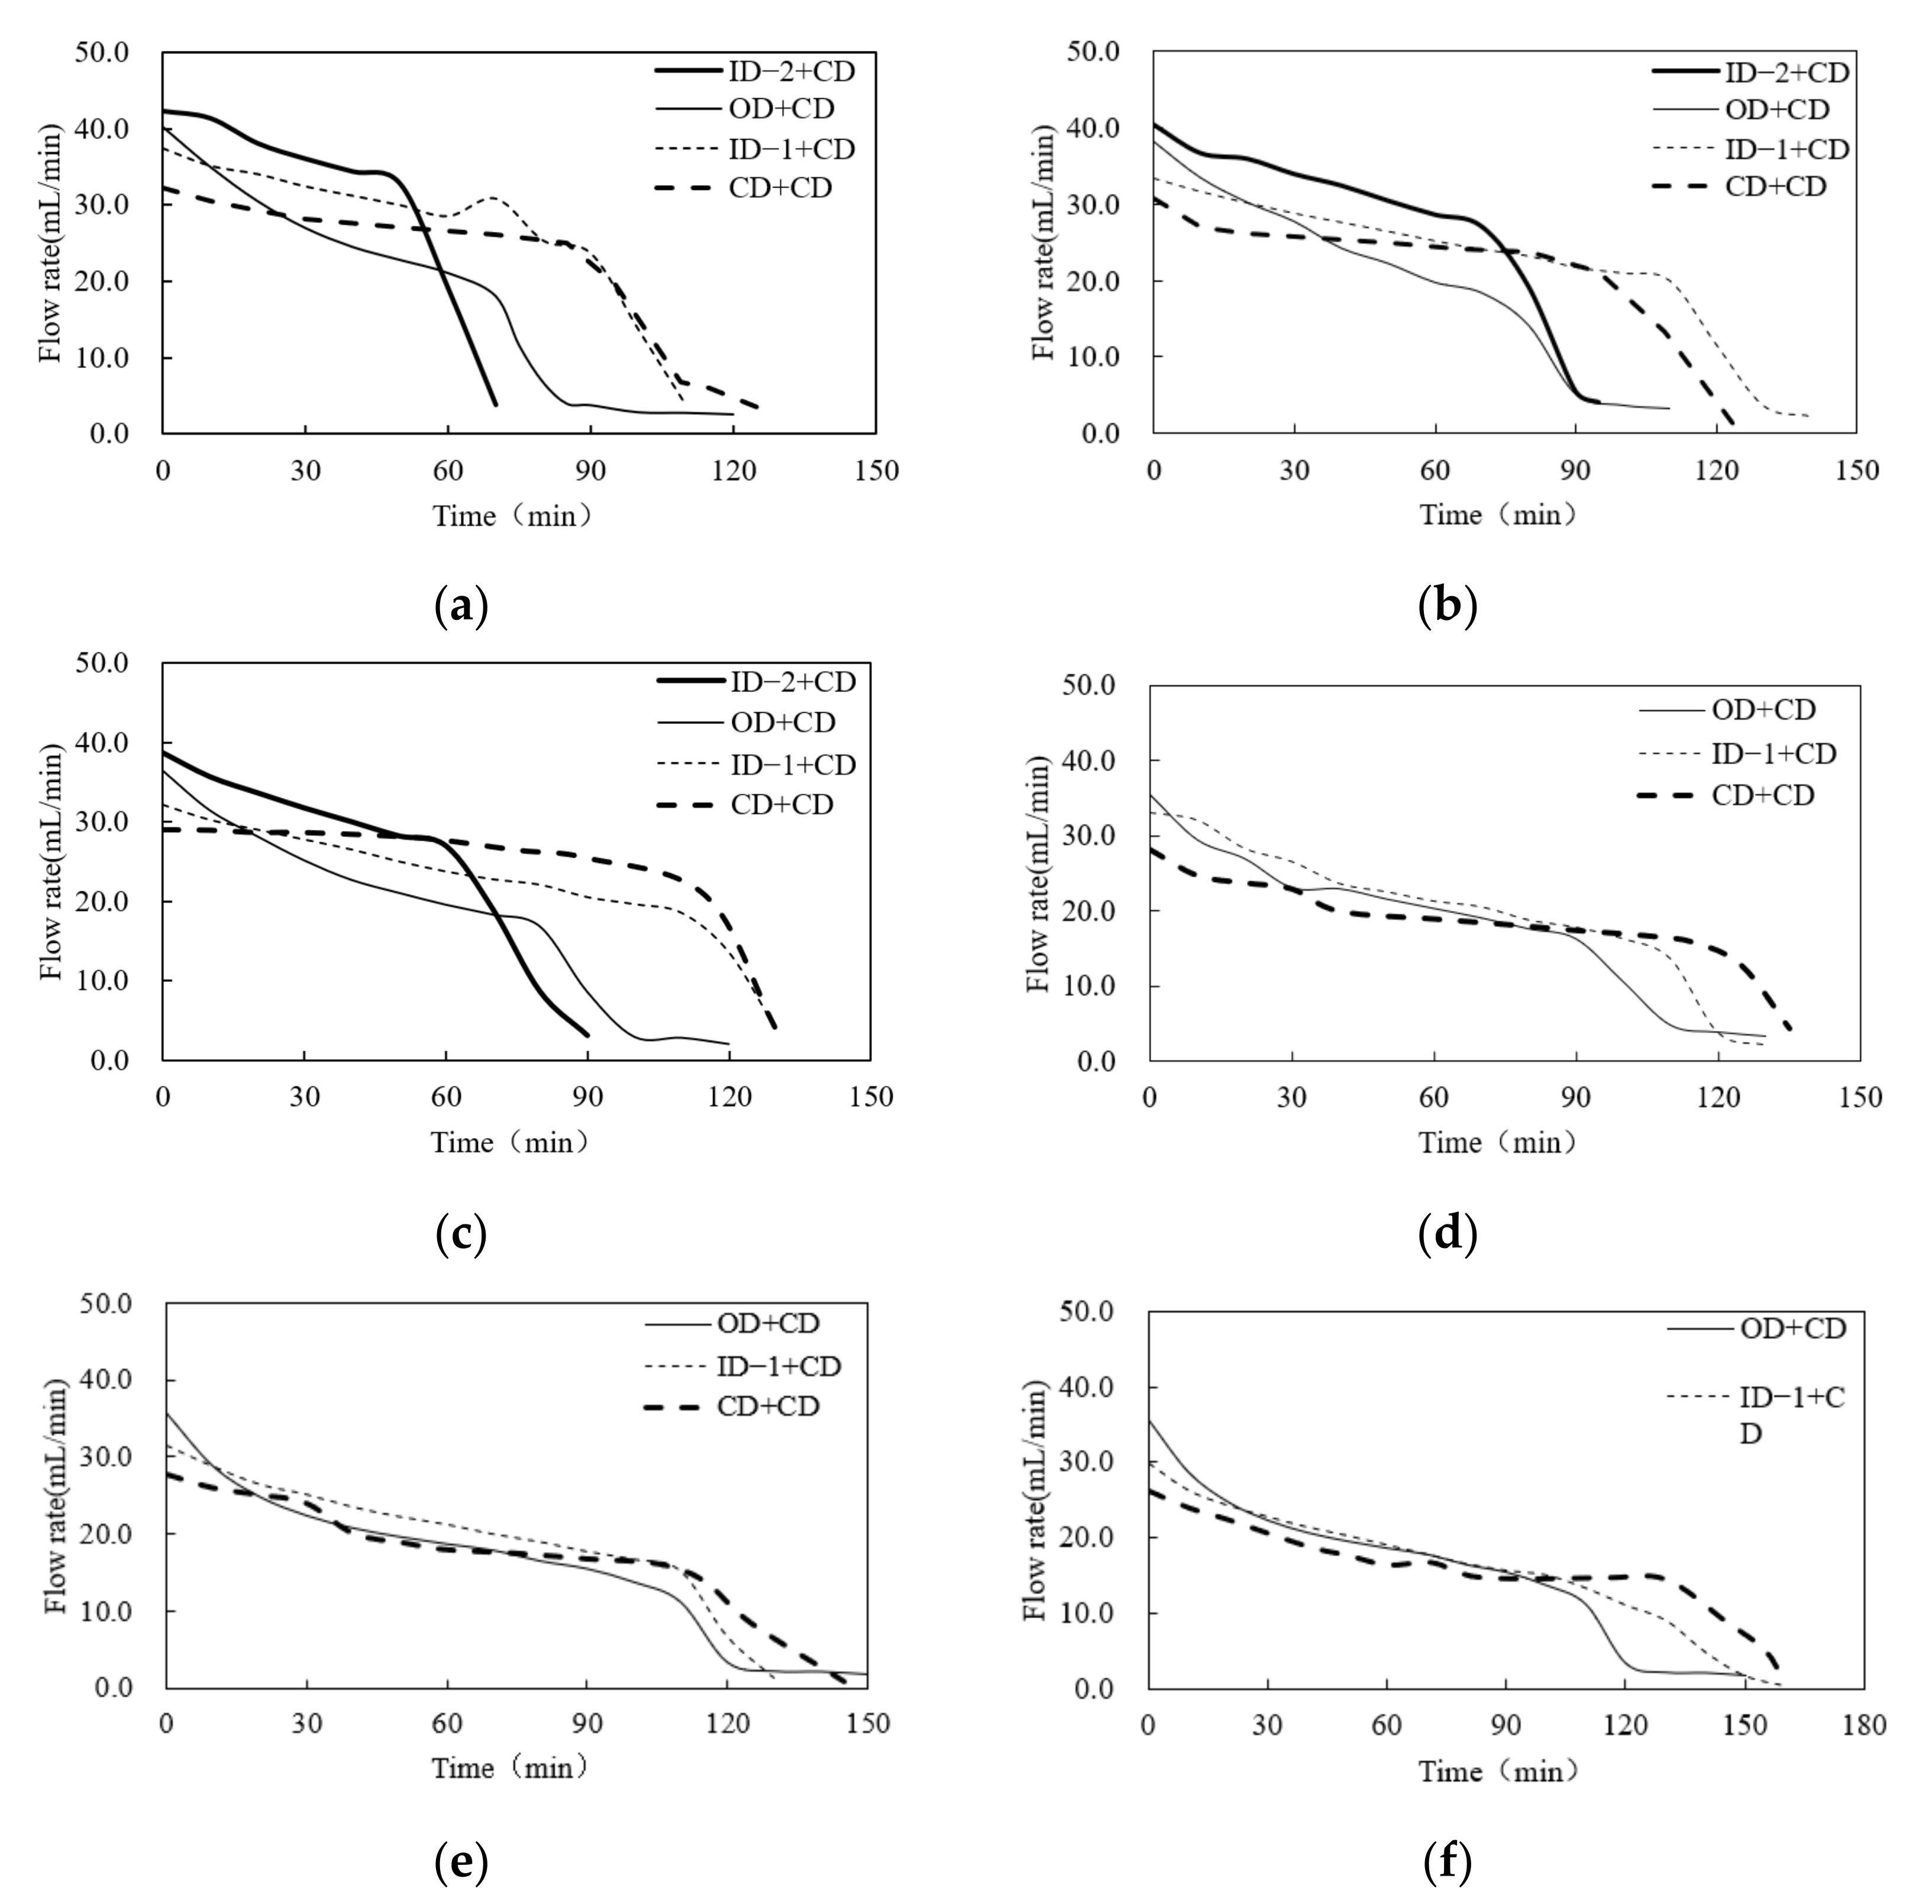
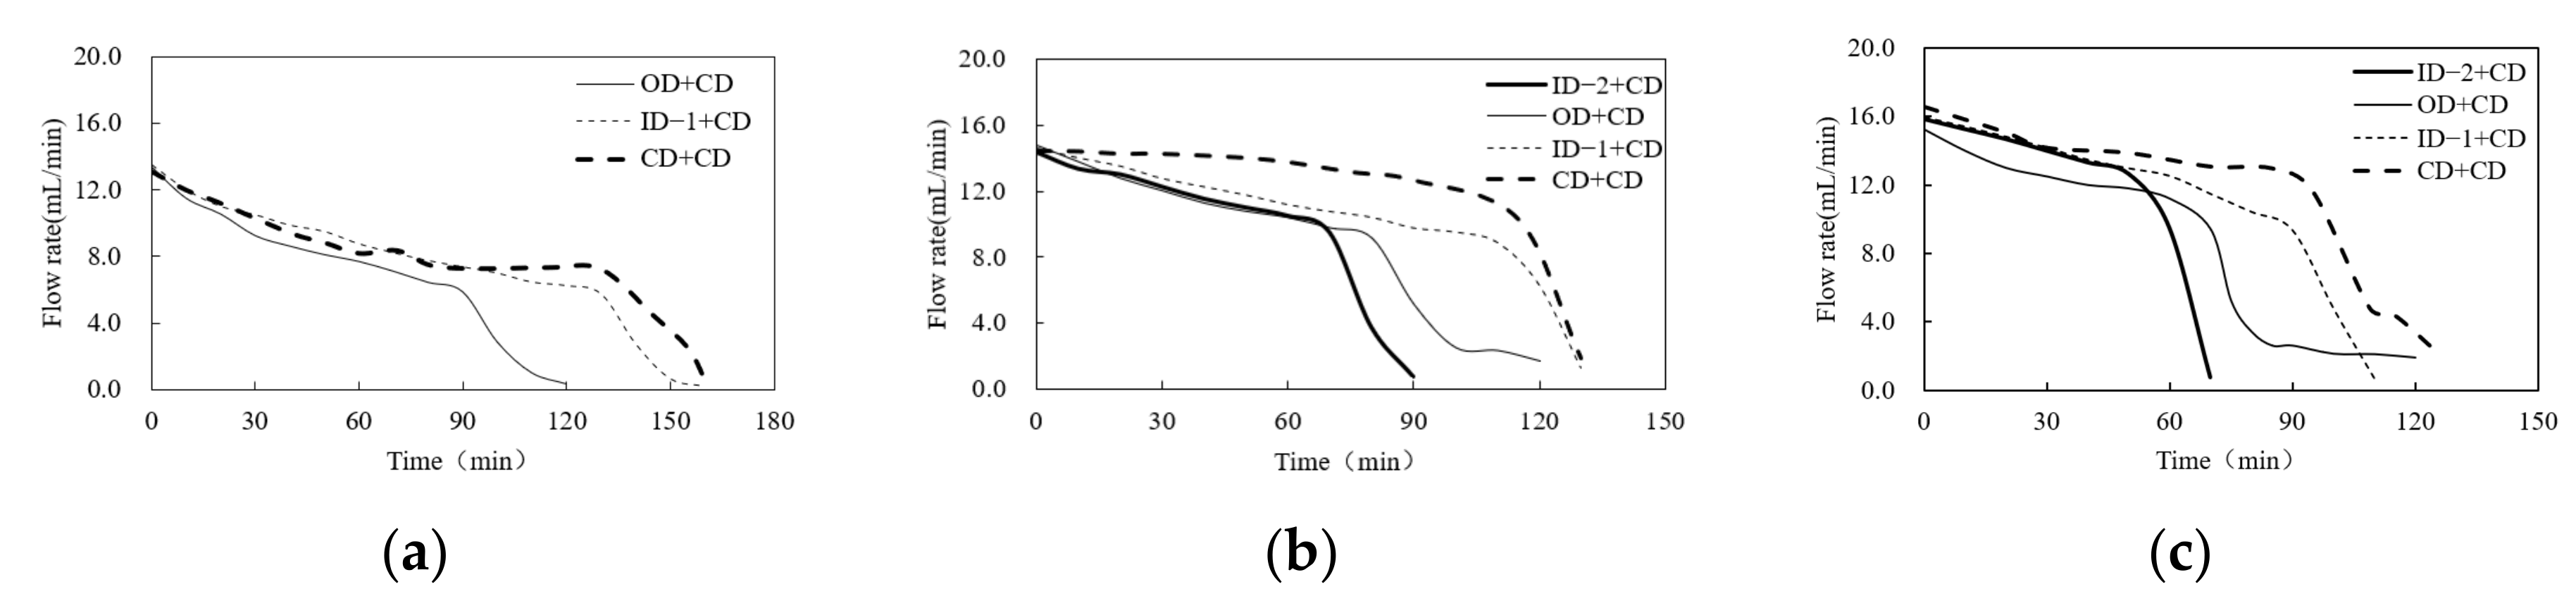
Figure 5 shows the variation in flow rate over time for different combined drainage forms under the receded water condition. Figure 6 shows the flow rate of the auxiliary, conventional subsurface drainage with various combined drainage forms under the same drain depth. The flow rate variation of the combined drainage forms have the same change characteristics as single drainage: the OD + CD has two periods of flow rate rapid change, and the flow rate of CD + CD, and ID + CD clearly decline when the ponding water will soon disappear. For the OD + CD, the total discharge into the open ditch decreased, owing to the influence of the position of the baffle. Under the condition of large flow rate, the flow rate rapidly decreased, owing to the disappearance of ponding water. Compared with the other combined drainage forms under the same drain depths (except the OD + CD combination), the ID-2 + CD combined drainage forms have the largest flow rate; this obviously brings forward the occurrence time of rapid flow attenuation. In the OD + CD and ID + CD, the flow rates of the auxiliary conventional subsurface drainage are close to the initial conditions, which is similar to the steady drainage case. Over time, both differences were not obvious at shallow depths. Under the combination of medium and deep depths, the CD + CD flow rate was larger than that of the OD + CD and ID + CD combination. This is mainly because the ponding water disappears earlier, and the flow rate decreases earlier in OD + CD and ID + CD. When the ponding water disappears, the flow rate of the open-ditch, conventional and improved subsurface drainage decreased rapidly in a short time.
Before the ponding water disappears, the OD + CD, ID-2 + CD, and ID-1 + CD flow rates are 1.20, 1.55, and 1.30 times that of the CD + CD, respectively, under the deep–deep combination. When the disappearance of the ponding water to the groundwater level is lowered to the plow layer, the advantage of open-ditch drainage is relatively less evident, while the advantages of the conventional and improved subsurface drainage are obviously enhanced. Given the flow rate attenuation characteristics of the improved subsurface drainage, i.e., the flow rate still maintains a large value before the ponding water disappears, the ID-2 + CD can maintain a large flow rate to discharge the ponding water; this is higher than other treatments at the same time. With the rapid decay of the flow rate at the initial drainage stage, the flow-rate rapid attenuation time of the OD + CD will be smaller than that of the ID-1 + CD before 30 min. However, compared with other treatments, the flow rate still has certain advantages.
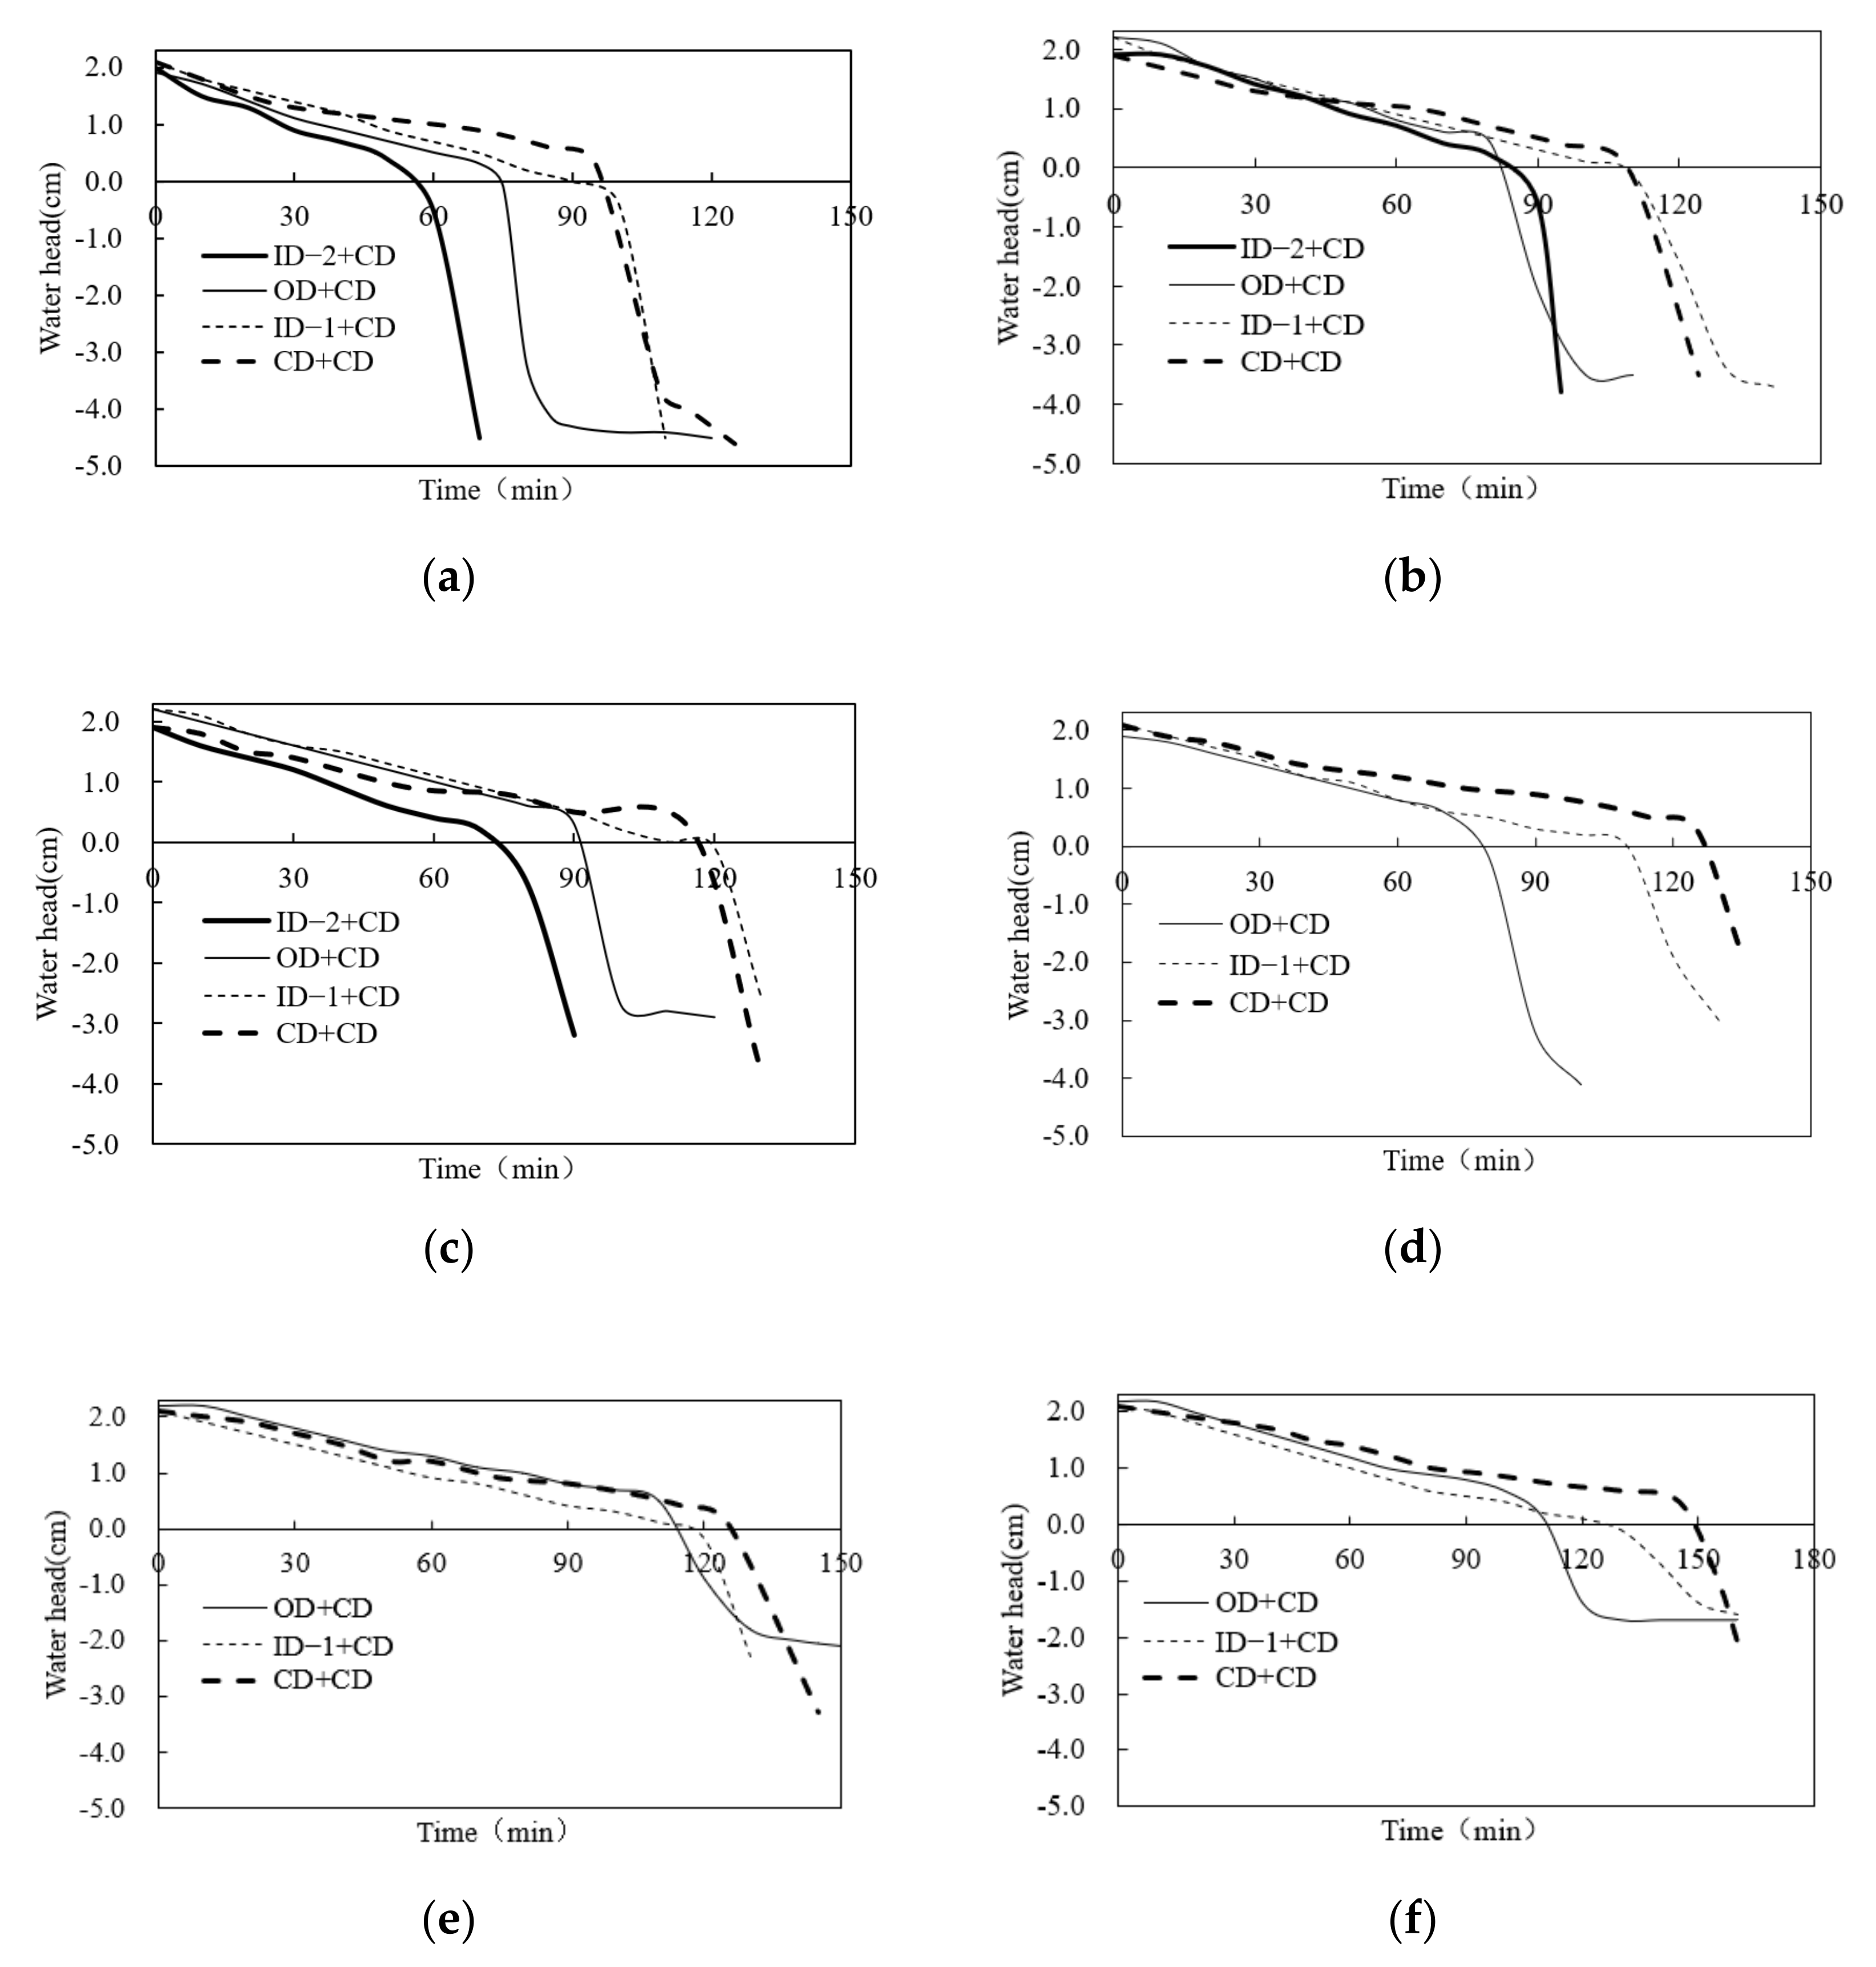
3.3. Effect of Flooding and Waterlogging Removal
To study the effect of flooding and waterlogging removal of different combined drainage forms, the water head can directly reflect the dynamic change of ponding water and groundwater level, and can visually represent the time of flooding and waterlogging removal for various combined drainage forms. Figure 7 shows the change in the water head with time under the drainage action of different combinations. The soil surface was taken as the zero baseline of the water head. A water head greater than zero means there is ponding water, the duration from the initial 2.0 cm height ponding water to disappearance is the flooding removal time. A value of less than zero indicates that the ponding water has disappeared and the groundwater level is in the descending stage; this is the drainage process of waterlogging removal. The time required for the groundwater level to be reduced near the root zone of crops (1–2 cm below the surface in the model) is the time for waterlogging removal. Under shallow depths on both sides, compared with CD + CD, the OD + CD and ID-1 + CD can reduce the flooding removal time by 11.5–38.1% and 8.5–16.7%, respectively, and reduce the waterlogging removal time by 14.3–157.1% and 0.0–25.0%, respectively. Under medium depth, the flooding removal time of OD + CD, ID-1 + CD, and ID-2 + CD decreased by 20.7–23.9%, 1.0–5.2%, and 37.1–48.6%, respectively, and the waterlogging removal time decreased by 28.6–42.9%, 0.0%, and 14.3–28.6%, respectively. Under deep depth, the flooding removal times of OD + CD, ID-1 + CD, and ID-2 + CD were reduced by 21.9%, 6.3%, and 41.7%, respectively, and the waterlogging removal time was reduced by 66.7%, 0.0%, and 44.4%, respectively. For the shallow–medium, shallow–deep, medium–medium, medium–deep, and deep–deep combinations, the flooding removal process was 13.3%, 16.0%, 22.7%, 27.3%, and 36.0% ahead of time, respectively, in the CD + CD case when compared with the shallow–shallow combination. The waterlogging removal process was 25.0%, 0.0%, 0.0%, 0.0% and 25.0% ahead of time, respectively, after the water disappeared. In the OD + CD case, the flooding removal rates were 4.3%, 16.4%, 29.1%, 24.5%, and 31.8% faster, respectively, and the waterlogging removal time decreased by 5.9%, 55.6%, 72.2%, 77.8%, and 83.3%, respectively. The flooding removal times of ID-1 + CD were 0.95, 0.88, 0.88, 0.86, and 0.72 times that of the shallow-shallow combination, respectively. The waterlogging removal rates were 28.6%, 14.3%, 14.3%, 14.3%, and 28.6% faster, respectively. In the ID-2 + CD case, the flooding removal times of the medium–deep and deep–deep combinations were 12.3% and 23.3% earlier than the medium–medium, respectively. The waterlogging removal time was reduced by 16.7% and 16.7%, respectively. In general, the deep–deep combined form requires the least time to remove flooding. The medium–medium, medium–deep, and deep–deep combined drainage forms had little difference in their corresponding waterlogging removal time. In combined drainage, with an increase in the drain depth of the auxiliary conventional pipe, the effect of flooding and waterlogging removal treatment becomes more obvious.
In general, the characteristics are as follows: with the increase in unit time of discharge, the time taken for the 2.0 cm of ponding water to disappear decreases, and the water head decreases with a fixed slope over time from the beginning of ponding water recession. When there is no ponding water, the water head decreases rapidly to a low level within a short time. Subsequently, the water head remained relatively stable and was maintained at a height equivalent to the drain depth of the deeper ditch (pipe, improved subsurface drainage). The flow rate of the drainage pipe was relatively slow, and the drainage time was long. At the same time, it can be found that the combined drainage can greatly reduce the time needed to remove the ponding water by taking advantage of the benefits of the open-ditch and improved conventional drainage. The auxiliary conventional subsurface drainage has the advantage of waterlogging removal in farmland, which can reduce the time required for groundwater levels to fall below the plow layer. Overall, OD + CD and ID-2 + CD have great advantages for the entire flooding and waterlogging removal processes.
3.4. Contribution Degree of Different Drainage Measures in Combined Drainage Forms
The drainage effect of each drainage measure in the combined drainage form is quantified by their contribution degree, owing to the different effects of different drainage measures on flooding removal. The contribution degree is defined by the amount of different drainage measures during the drainage process in the total drainage volume of the combined drainage. Table 2 lists the contribution degree of each drainage measure for flooding removal under combined drainage. As can be seen from Table 2, under an equal drain-depth condition on both sides, the contribution of the open-ditch and thin-improved drainage can reach 51.3–56.7%, and the contribution of the open-ditch, thin-improved subsurface drainage are 2.6–8.7%, and 6.0–13.4% higher than that of conventional subsurface drainage, respectively. Under an unequal drain depth condition on both sides, when the open-ditch or improved subsurface drainage drain depth is shallow, the contribution rate is less than that of the conventional subsurface drainage; while the contribution degree of the medium–deep combination is not different from that of conventional subsurface drainage, which is maintained at approximately 50.0%. In the ID-2 + CD case under equal drain depth, its contribution can exceed 61.0% in the water recession process, and the contribution of the thick-improved subsurface drainage is 22–22.6% higher than conventional subsurface drainage. Under the unequal drain depth, it can also reach 57.5% for the medium–deep combination.
4. Discussion
The formulae for conventional subsurface [36], improved subsurface [37], and open-ditch [38] drainage under stable ponding water conditions are shown in Equations (1)–(6).
The conventional subsurface drainage is as follows:
where q is the flow rate (cm/s), K is the average hydraulic conductivity of the drainage area (according to Darcy’s law: K = 0.00228 cm/s), s is the ponding water height (cm), h is the drain depth (cm), r0 is the drainage pipe radius (cm), and L is the drain spacing (cm).
The improved subsurface drainage is as follows:
where him is the equivalent drain depth (cm), r is the equivalent pipe radius (cm), b0 is the width of the filter body (cm), and z0 is the height of the filter body (cm).
The open-ditch drainage is as follows:
where αn is the correction factor (under saturated conditions, the calculated values of shallow-, medium-, and deep-depth open ditches ranged from 0.93–0.95), Qc is the single-length seepage flow (cm2/s), D is the water depth of the open ditch (cm), and ∆H refers to the acting water head at the drainage open ditch (cm).
The accuracy and reliability of the test results under the CD + CD, OD + CD, and ID + CD conditions under equal and unequal drain depth conditions are verified; the comparison of the flow-rate results between the laboratory test and the theoretical calculation are shown in Table 3. These results show that the measured and calculated values are in good agreement, and the relative errors are maintained within ±5%. Similarly, the accuracy of the test results proved the rationality of the sand tank model test.
In addition to open-ditch drainage having the advantage of quick flooding removal, its drainage effect through soil infiltration is also very obvious. The amount of ponding water seeping down and discharged through the drainage ditch is greater than that of the conventional subsurface drainage. At present, the influence of the overflow zone of the open ditch is not sufficiently considered in the theoretical calculation, and the amount of ponding water seeping out through the drainage ditch is underestimated.
As a new type of subsurface drainage measure, the improved subsurface drainage occupies less cultivated land and is environmentally friendly in practical applications, it can improve the effect of conventional subsurface drainage. The application of a filter cover around the conventional subsurface not only can reduce the risk of clogging [39] and the loss of nutrients such as nitrogen and phosphorus in the soil [40], but also it can effectively increase the equivalent cross-sectional area of the drainage pipe and the flow rate. Furthermore, its advantages are highlighted in various subsurface drainage measures [37,41]. The width of the filter will affect the drainage effect of the improved subsurface drainage. When the width of the filter is 2–6 cm, the flow rate of the improved subsurface drainage is 2–3 times that of conventional drainage in completely saturated fine-sand medium [11]. This measure has not only been theoretically researched in the laboratory but also has been applied in practice. Tao et al. [12] conducted field tests to study the improved subsurface drainage with different filter materials (gravel, layered sand-gravel, mixed sand-gravel, and straw), and it was significantly greater than that of conventional subsurface drainage by approximately 1.9 times. Compared with the previous studies, the same conclusion is drawn in this paper, that is, the improved subsurface drainage can significantly increase the flow rate compared with conventional subsurface drainage. However, the effect of combined drainage forms on the improvement of drainage performance has not been quantified in the existing studies. The results of this study reveal the improved effect of different structures on the filtering and drainage performance in combined drainage forms.
During the process of waterlogging removal, conventional and improved subsurface drainage have the effect of assisting open-ditch drainage to remove surface water, and have the effect of reducing the surface runoff. The result was similar to previous research [13,14]. The auxiliary drainage effect of conventional subsurface drainage is different in different combined drainage forms. The current design of combined drainage engineering does not consider the flooding removal effect of conventional subsurface drainage. Our research results can provide support for combined drainage engineering design.
With an increase in drain depth, the drainage effect of the open-ditch and the improved subsurface drainage increased, but the excavation cost also increased. Therefore, a reasonable arrangement of combined drainage should not only improve the drainage efficiency of farmland, but also consider its economic and environmental benefits. Accordingly, it is feasible to adopt the shallow–deep and medium–medium combinations of OD + CD or ID + CD. Additionally, it is necessary to further explore economic factors and reasonable combination layouts using mathematical models.
This study only considers the drainage condition when the soil is saturated and the initial condition is the presence of ponding water. However, the groundwater level is deep, and the initial condition of the soil being unsaturated is not considered. In addition, under rainfall conditions, groundwater level variations were not taken into account. Thus, these aspects need to be further studied in future work.
5. Conclusions
Given that ponding water and soil water are difficult to quickly discharge after short-duration heavy rainfall, an indoor sand tank test was used to study the subsurface drainage effect and application feasibility of various drainage measures under ponding and receded water conditions under different combined drainage forms.
First of all, the flow rate of different combined drainage forms has the same change characteristics compared with a single drainage form. The variation characteristics of flow rate are mainly related to drainage measures on the left side, namely open-ditch or improved subsurface drainage. Second, the combined drainage with OD + CD, ID-2 + CD, and ID-1 + CD can increase the flow rate compared with the CD + CD. Third, open-ditch and improved subsurface drainage combined with conventional subsurface drainage forms can effectively improve the efficiency of flooding and waterlogging removal. The OD + CD can greatly reduce the flooding and waterlogging removal time. During the drainage process, ponding water can infiltrate into the soil, and can discharge from the slope overflow zone through open-ditch drainage near the ditch, while conventional subsurface drainage can assist the open ditch in removing ponding water at the same time. When the ponding water disappears, the advantage of the subsurface pipe is fully revealed. The improved subsurface drainage has a prominent advantage in farmland flooding and waterlogging removal. It not only accelerates the removal of ponding water but also reduces the time required for the groundwater level to fall below the plow layer. Finally, the reasonable combination of drain depths can not only reduce construction cost, but also ensure drainage efficiency. The alternative arrangement of the shallow–deep combination form can ensure the flow rate and reduce the construction cost compared with the deep–deep combination. In the shallow–deep combination form, the shallow-depth side can shorten the infiltration path of ponding water and accelerate its infiltrate, and the deep-depth side can ensure the drainage effect during the flooding and waterlogging removal processes. The alternative arrangement of the medium–medium combination has a similar drainage effect to the shallow–deep combination; but it has an advantage in terms of waterlogging removal time. Besides, the measured and calculated values are in good agreement.
In conclusion, open-ditch drainage, conventional subsurface drainage, and improved subsurface drainage can be combined to fully benefit from their respective advantages, and can be applied to shallow–deep or medium–medium combinations. The combined drainage forms could work well in southern China to mitigate the flooding and waterlogging threat. Furthermore, future works should study the drainage of different combination forms in the field according to the rainfall conditions.
Author Contributions
Conceptualization, S.W.; methodology, S.W., Y.T., H.C.; validation, S.W., Y.T.; formal analysis, S.W., Y.T.; writing—original draft preparation, X.R., S.W.; writing—review and editing, S.W., P.Y., Y.T., H.C.; project administration, S.W.; funding acquisition, S.W. All authors have read and agreed to the published version of the manuscript.
Funding
This research was funded by National Key R&D Program of China, grant Nos. 2018YFC1508301; National Natural Science Foundation of China (No. 51779274, No. 51909277).
Institutional Review Board Statement
Not applicable.
Informed Consent Statement
Not applicable.
Data Availability Statement
The data presented in this study are available on request from the corresponding author.
Acknowledgments
Thank you to peer reviewers who improved this manuscript.
Conflicts of Interest
The authors declare no conflict of interest.
References
- Yue, X.-L.; Gao, Q.-X. Contributions of natural systems and human activity to greenhouse gas emissions. Adv. Clim. Chang. Res. 2018, 9, 243–252. [Google Scholar] [CrossRef]
- Wang, G.; Zhang, Q.; Yu, H.; Shen, Z.; Sun, P. Double increase in precipitation extremes across China in a 1.5 °C/2.0 °C warmer climate. Sci. Total Environ. 2020, 746, 140807. [Google Scholar] [CrossRef]
- Trenberth, K.E.; Dai, A.; Rasmussen, R.M.; Parsons, D.B. The Changing Character of Precipitation. Bull. Am. Meteorol. Soc. 2003, 84, 1205–1218. [Google Scholar] [CrossRef]
- Food and Agriculture Organization of the United Nations (FAO). The State of Food and Agriculture: Climate Change, Agriculture and Food Security. 2018. Available online: www.fao.org/publications (accessed on 4 November 2020).
- China Meteorological Administration. Yearbook of Meteorological Disasters in China. 2017. Available online: http://www.cma.gov.cn/2011xwzx/2011xmtjj/201701/t20170112_386200.html (accessed on 4 November 2020).
- Corwin, D.L. Climate change impacts on soil salinity in agricultural areas. Eur. J. Soil Sci. 2021, 72, 842–862. [Google Scholar] [CrossRef]
- Pierce, D.W.; Das, T.; Cayan, D.R.; Maurer, E.P.; Miller, N.L.; Bao, Y.; Kanamitsu, M.; Yoshimura, K.; Snyder, M.A.; Sloan, L.C.; et al. Probabilistic estimates of future changes in California temperature and precipitation using statistical and dynamical downscaling. Clim. Dyn. 2013, 40, 839–856. [Google Scholar] [CrossRef] [Green Version]
- Trenberth, K. Changes in precipitation with climate change. Clim. Res. 2011, 47, 123–138. [Google Scholar] [CrossRef] [Green Version]
- Kahlown, M.A.; Marri, M.K.; Azam, M. Design, construction and performance evaluation of small tile drainage systems in the Indus Basin. Irrig. Drain. 2007, 56, S217–S225. [Google Scholar] [CrossRef]
- Gopalakrishnan, M.; Kulkarni, S.A. Agricultural land drainage in India. Irrig. Drain. 2007, 56, S59–S67. [Google Scholar] [CrossRef]
- Tao, Y.; Wang, S.; Xu, D.; Qu, X. Experiment and analysis on flow rate of improved subsurface drainage with ponded water. Agric. Water Manag. 2016, 177, 1–9. [Google Scholar] [CrossRef]
- Tao, Y.; Wang, S.; Xu, D.; Yuan, H.; Chen, H. Field and numerical experiment of an improved subsurface drainage system in Huaibei plain. Agric. Water Manag. 2017, 194, 24–32. [Google Scholar] [CrossRef]
- Maalim, F.K.; Melesse, A.M. Modelling the impacts of subsurface drainage on surface runoff and sediment yield in the Le Sueur Watershed, Minnesota, USA. Hydrol. Sci. J. 2013, 58, 570–586. [Google Scholar] [CrossRef] [Green Version]
- Filipović, V.; Mallmann, F.J.K.; Coquet, Y.; Šimůnek, J. Numerical simulation of water flow in tile and mole drainage systems. Agric. Water Manag. 2014, 146, 105–114. [Google Scholar] [CrossRef] [Green Version]
- Wang, S.; Xu, D.; Chen, H.; Han, S.; Jiao, P. Review on research of farmland drainage technology. J. Drain. Irrig. Ma-Chinery Eng. 2014, 32, 343–349. [Google Scholar] [CrossRef]
- Tao, Y.; Wang, S.; Xu, D.; Qu, X. Effect of Structure-type on Improved Subsurface Drainage Performance. Trans. Chin. Soc. Agric. Mach. 2016, 47, 113–118, 179. [Google Scholar] [CrossRef]
- Madramootoo, C.A.; Johnston, W.R.; Ayars, J.E.; Evans, R.O.; Fausey, N.R. Agricultural drainage management, quality and disposal issues in North America. Irrig. Drain. 2007, 56, S35–S45. [Google Scholar] [CrossRef]
- Herzon, I.; Helenius, J. Agricultural drainage ditches, their biological importance and functioning. Biol. Conserv. 2008, 141, 1171–1183. [Google Scholar] [CrossRef]
- Tao, Y. The Performance Experiment and Theory Analysis of an Improved Subsurface Drainage. Ph.D. Thesis, College of Water Conservancy and Hydropower Engineering, Hohai University, Nanjing, China, 2017. [Google Scholar]
- Jha, M.K.; Koga, K. Mole drainage: Prospective drainage solution to Bangkok clay soils. Agric. Water Manag. 1995, 28, 253–270. [Google Scholar] [CrossRef]
- Kaboosi, K.; Liaghat, A.; Hosseini, S.H. The Feasibility of Rice Husk Application as Envelope Material in Subsurface Drainage Systems. Irrig. Drain. 2012, 61, 490–496. [Google Scholar] [CrossRef]
- Tuohy, P.; Humphreys, J.; Holden, N.; Fenton, O. Runoff and subsurface drain response from mole and gravel mole drainage across episodic rainfall events. Agric. Water Manag. 2016, 169, 129–139. [Google Scholar] [CrossRef]
- Jafari-Talukolaee, M.; Ritzema, H.; Darzi-Naftchali, A.; Shahnazari, A. Subsurface Drainage to Enable the Cultivation of Winter Crops in Consolidated Paddy Fields in Northern Iran. Sustainability 2016, 8, 249. [Google Scholar] [CrossRef] [Green Version]
- Christen, E.; Skehan, D. Design and Management of Subsurface Horizontal Drainage to Reduce Salt Loads. J. Irrig. Drain. Eng. 2001, 127, 148–155. [Google Scholar] [CrossRef]
- Talukolaee, M.J.; Naftchali, A.D.; Parvariji, L.Z.; Ahmadi, M.Z. Investigating long-term effects of subsurface drainage on soil structure in paddy fields. Soil Tillage Res. 2018, 177, 155–160. [Google Scholar] [CrossRef]
- Hornbuckle, J.; Christen, E.; Faulkner, R. Evaluating a multi-level subsurface drainage system for improved drainage water quality. Agric. Water Manag. 2007, 89, 208–216. [Google Scholar] [CrossRef]
- Wang, S.; Zhang, Y.; Li, F. Calculation method of combining open channel and pipe drainage for controlling concurrent wa-terlogging and water table rising. J. Hydraul. Eng. 2001, 12, 56–61. [Google Scholar] [CrossRef]
- Yan, G.; Xu, H. Experiment on Reconstruction of Waterlogged Paddy Field by combined drainage of dark pipe and rat ca-nal. J. Irrig. Drain. 1992, 3, 14–18. [Google Scholar] [CrossRef]
- Wang, S.; Liu, Q.; Zhou, M. Effect and Simulation of Double-layer Subsurface Pipe Drainage Lay out on Water and Nitrogen Transport of Farmland. J. Water Resour. Archit. Eng. 2014, 12, 39–44, 141. [Google Scholar] [CrossRef]
- Verma, A.; Gupta, S.; Singh, K.; Chauhan, H. An analytical solution for design of bi-level drainage systems. Agric. Water Manag. 1998, 37, 75–92. [Google Scholar] [CrossRef]
- Du, L.; Zhou, H. Experiment on reforming saline-alkali wasteland by drainage technology of double layer concealed pipe. China Rural Water Hydropower 1997, 10, 33–34. [Google Scholar]
- Wen, J.; Wang, Q.; Guo, S. Combined Drainage Engineering Formations and Design for Comprehensive Treatment of Water Logging and Waterlogged in the Northern Huai River Plain. J. Xi’an Univ. Technol. 2009, 25, 110–114. [Google Scholar] [CrossRef]
- Ogino, Y.; Ota, S. The evolution of Japan’s rice field drainage and development of technology. Special Issue: Drainage—An essential element of integrated water management. Irrig. Drain. 2007, 56, S69–S80. [Google Scholar] [CrossRef]
- Yang, X.; Ji, Z.; Zhang, P.; Qi, J. Model test and numerical simulation on the development of artificially freezing wall in sandy layers considering water seepage. Transp. Geotech. 2019, 21, 100293. [Google Scholar] [CrossRef]
- Sato, M.; Kuwano, R. Suffusion and clogging by one-dimensional seepage tests on cohesive soil. Soils Found. 2015, 55, 1427–1440. [Google Scholar] [CrossRef] [Green Version]
- Kirkham, D. Flow of ponded water into drain tubes in soil overlying an impervious layer. Trans. Am. Geophys. Union 1949, 30, 369–385. [Google Scholar] [CrossRef]
- Tao, Y.; Wang, S.; Xu, D.; Guan, X.; Ji, M.; Liu, J. Theoretical analysis and experimental verification of the improved subsurface drainage discharge with ponded water. Agric. Water Manag. 2019, 213, 546–553. [Google Scholar] [CrossRef]
- Qu, X. Calculation of Discharge and Correcting Factor on the Partial Penetration of Open Drains and Pipe Drains. J. Hydraul. Eng. 1982, 4, 11–21. [Google Scholar] [CrossRef]
- Tao, Y.; Wang, S.; Xu, D. Experimental Study of Clogging Defense Measures for Improved Subsurface Drainage. Trans. Chin. Soc. Agric. Mach. 2016, 47, 187–192. [Google Scholar] [CrossRef]
- Tao, Y.; Wang, S.; Guan, X.; Xu, D.; Chen, H.; Ji, M. Study on Characteristics of Nitrogen and Phosphorus Loss under an Improved Subsurface Drainage. Water 2019, 11, 1467. [Google Scholar] [CrossRef] [Green Version]
- Qin, W.B.; Li, M.S.; Li, Y.F.; Liu, H.G. Proposed Gravel Filters for Pipe-drain to Improve the Efficacy of the Drainage System under Drip Irrigation. J. Irrig. Drain. 2017, 36, 80–85. [Google Scholar] [CrossRef]
Figure 1.
Schematic diagram of the test device, (a) Three-dimensional view of sand tank; (b) The physical model of drainage.
Figure 1.
Schematic diagram of the test device, (a) Three-dimensional view of sand tank; (b) The physical model of drainage.

Figure 2.
Schematic diagram of conventional, improved and filter subsurface drainage, (a) CD, (b) ID-1, (c) ID-2, (d) FD-1, (e) FD-2; Unit: mm. 1. Soil medium (80–120 mesh quartz sand); 2. Highly permeable materials (2–4 mm-diameter quartz sand); 3. Subsurface drainage pipe.
Figure 2.
Schematic diagram of conventional, improved and filter subsurface drainage, (a) CD, (b) ID-1, (c) ID-2, (d) FD-1, (e) FD-2; Unit: mm. 1. Soil medium (80–120 mesh quartz sand); 2. Highly permeable materials (2–4 mm-diameter quartz sand); 3. Subsurface drainage pipe.

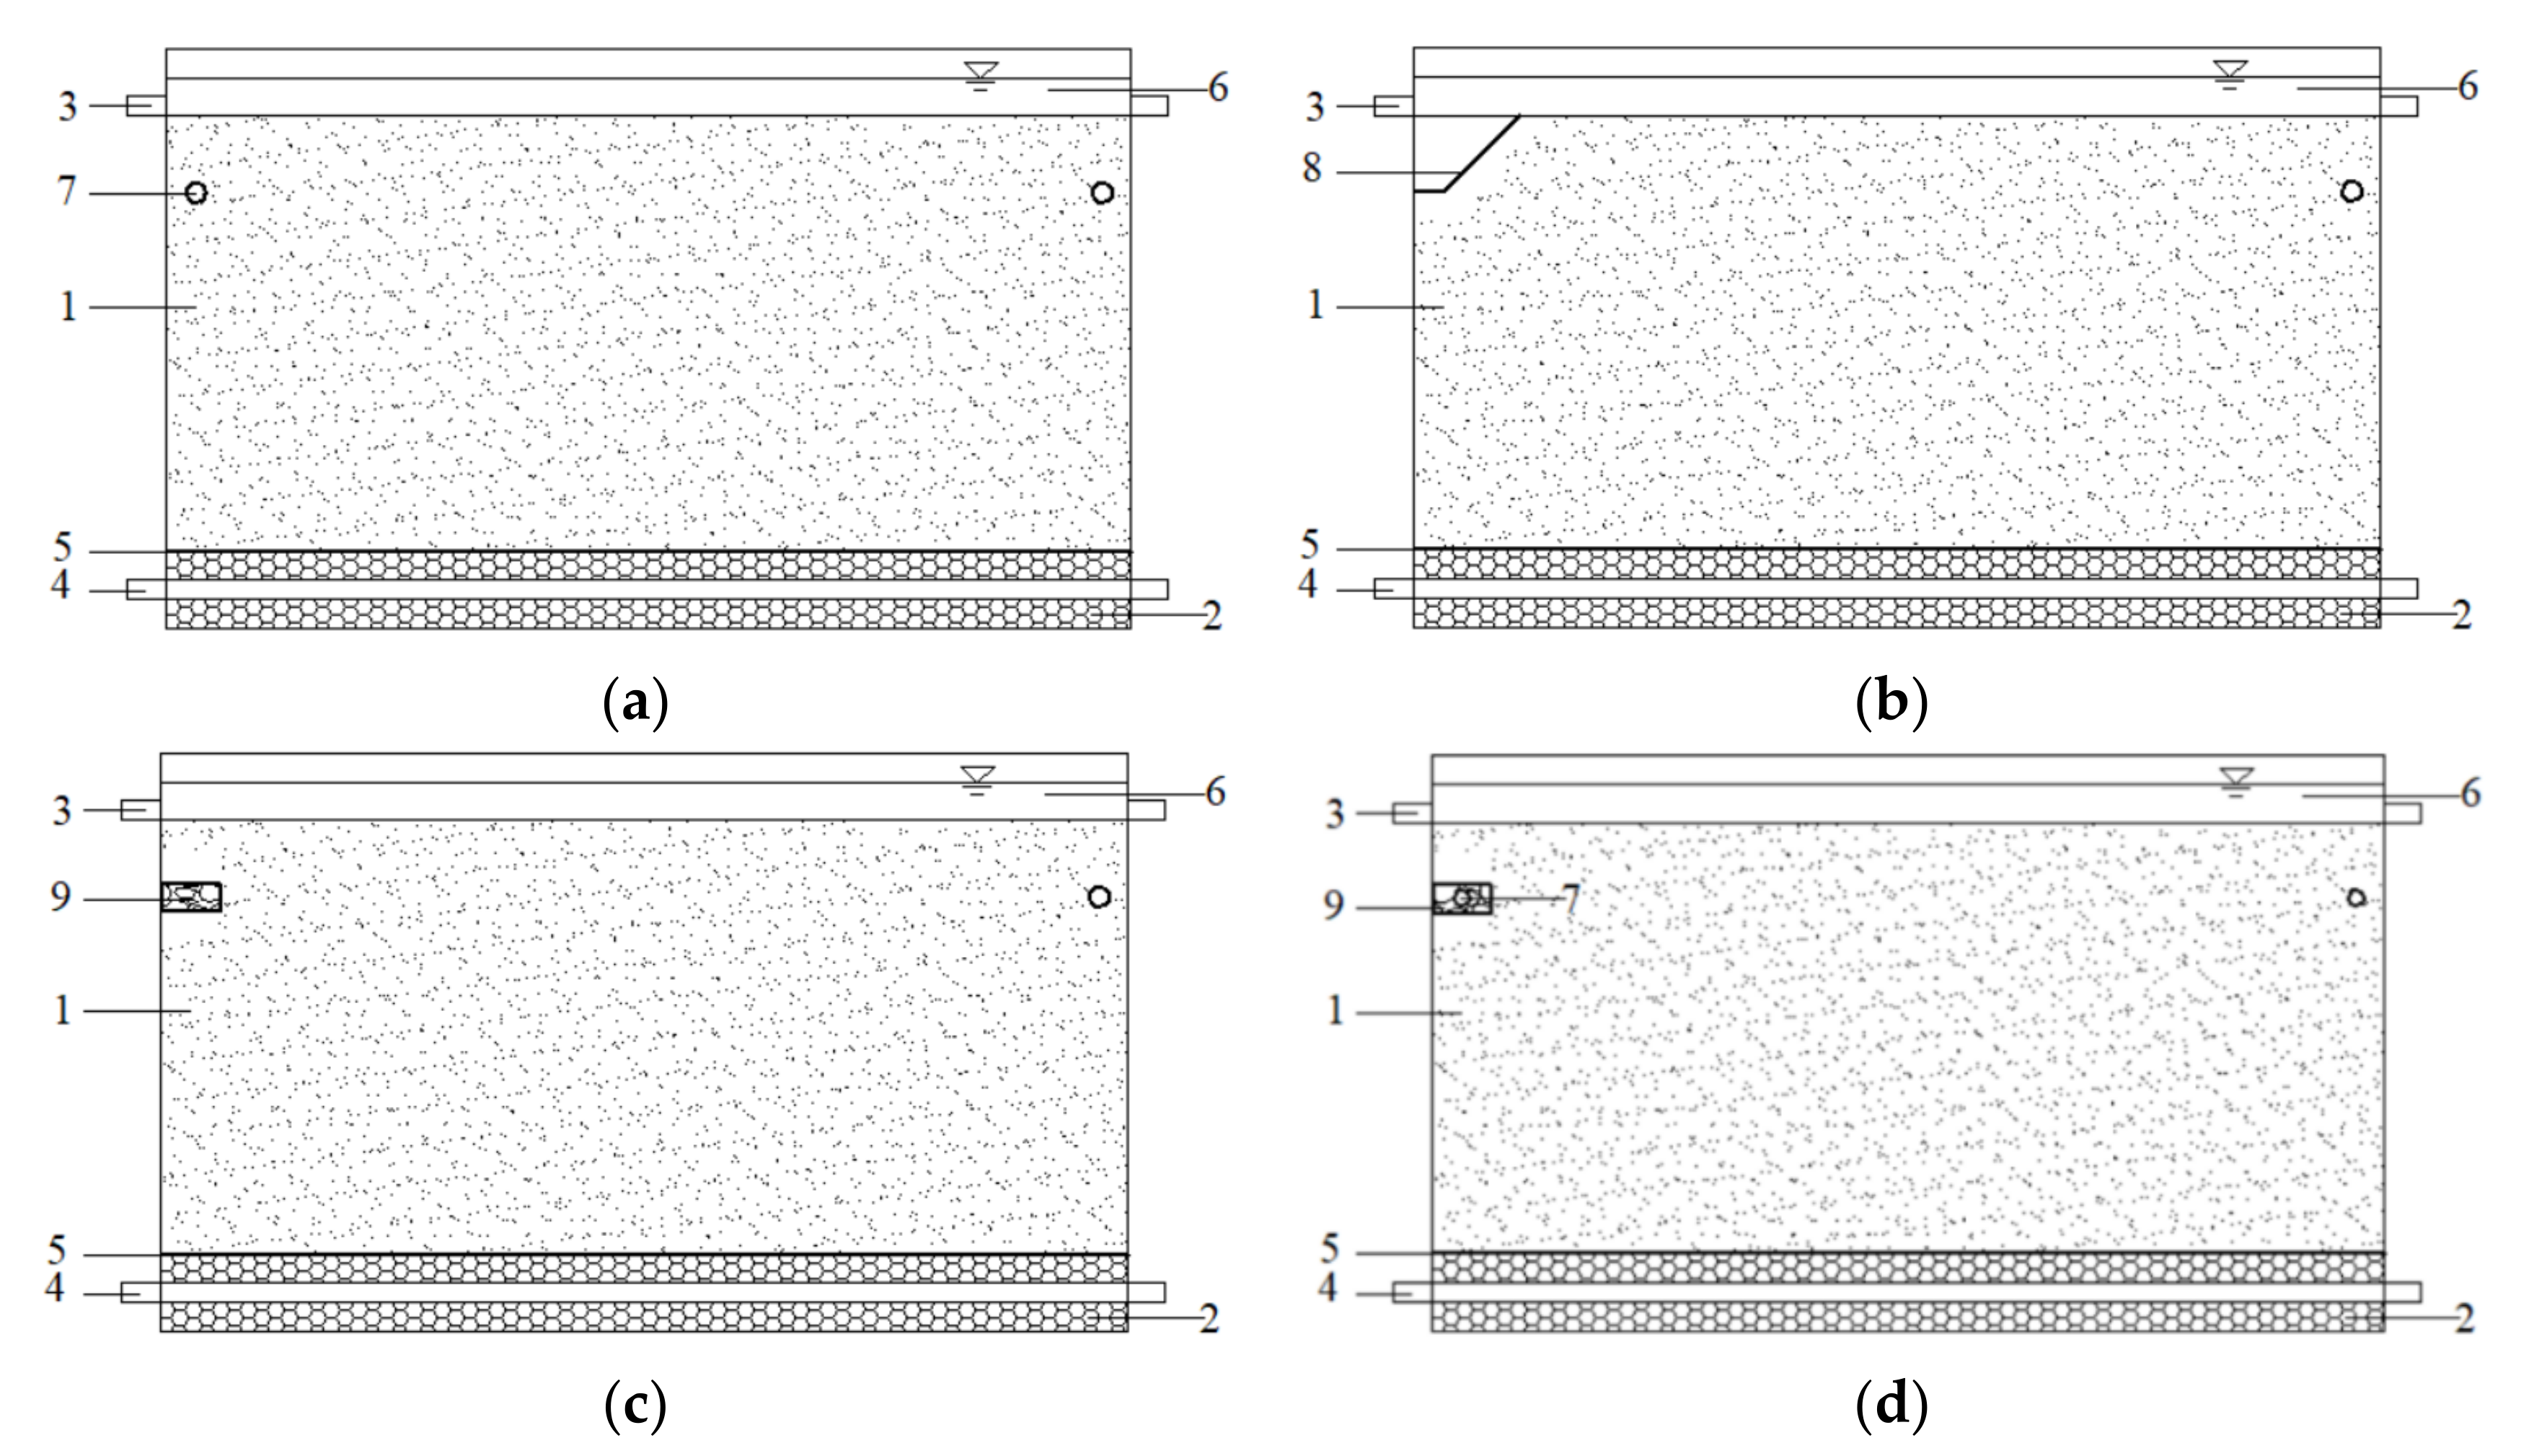
Figure 3.
Structural planar graph of different combined drainage forms, (a) Conventional subsurface drainage, (b) Open-ditch and conventional subsurface drainage, (c) Filter and conventional subsurface drainage, (d) Improved and conventional subsurface drainage; Unit: mm. 1. Soil medium (80–120 mesh quartz sand); 2. Highly permeable materials (2–4 mm-diameter quartz sand); 3–4 Charging pipe; 5. Gauze; 6. Ponding water; 7. Conventional subsurface pipe; 8. Open ditch; 9. Filter body.

Figure 4.
Flow rate of different combined drainage forms under a stable ponding water condition; (a) Conventional subsurface drainage; (b) Open-ditch and conventional subsurface drainage; (c) Filter and conventional subsurface drainage (d) Improved and conventional subsurface drainage. Note: Means followed by the same letter within a figure are not significantly different according to T-test (p < 0.05).

Figure 5.
Flow-rate variation process over time; (a) Deep–deep combination; (b) Medium–deep combination; (c) Medium–medium combination; (d) Shallow–deep combination; (e) Shallow–medium combination; (f) Shallow–shallow combination.
Figure 5.
Flow-rate variation process over time; (a) Deep–deep combination; (b) Medium–deep combination; (c) Medium–medium combination; (d) Shallow–deep combination; (e) Shallow–medium combination; (f) Shallow–shallow combination.

Figure 6.
Conventional subsurface-drainage flow-rate variation under different combined drainage forms; (a) Shallow–shallow combination; (b) Medium–medium combination; (c) Deep–deep combination.
Figure 6.
Conventional subsurface-drainage flow-rate variation under different combined drainage forms; (a) Shallow–shallow combination; (b) Medium–medium combination; (c) Deep–deep combination.

Figure 7.
Flooding and waterlogging removal effect under different combined drainage forms; (a) Deep–deep combination; (b) Medium–deep combination; (c) Medium–medium combination; (d) Shallow–deep combination; (e) Shallow–medium combination; (f) Shallow–shallow combination.
Figure 7.
Flooding and waterlogging removal effect under different combined drainage forms; (a) Deep–deep combination; (b) Medium–deep combination; (c) Medium–medium combination; (d) Shallow–deep combination; (e) Shallow–medium combination; (f) Shallow–shallow combination.


Table 1.
Design scheme of the different combined drainage forms.
| Drain Depth on the Left Sidewall of the Sand Tank (CD, OD, FD, and ID) | Drain Depth on the Right Sidewall of Sand Tank (CD) | ||
|---|---|---|---|
| Shallow | Medium | Deep | |
| Shallow | s-s | s-m | s-d |
| Medium | — | m-m | m-d |
| Deep | — | — | d-d |
Table 2.
Contribution degree of different drainage measures under different combined drainage forms.
Table 2.
Contribution degree of different drainage measures under different combined drainage forms.
| Combination | Drainage | Drain Depth | |||||
|---|---|---|---|---|---|---|---|
| s-s | s-m | s-d | m-m | m-d | d-d | ||
| OD + CD | OD | 51.3% | 48.2% | 49.0% | 51.3% | 49.8% | 54.4% |
| CD | 48.7% | 51.8% | 51.0% | 48.7% | 50.2% | 45.6% | |
| ID-1 + CD | ID-1 | 53.7% | 49.5% | 45.7% | 53.0% | 50.1% | 56.7% |
| CD | 46.3% | 50.5% | 54.3% | 47.0% | 49.9% | 43.3% | |
| ID-2 + CD | ID-2 | — | — | — | 61.0% | 57.5% | 61.3% |
| CD | — | — | — | 39.0% | 42.5% | 38.7% | |
Table 3.
Comparison of flow-rate results between the laboratory test and the theoretical calculation.
Table 3.
Comparison of flow-rate results between the laboratory test and the theoretical calculation.
| Combination | Flow Rate (mL/min) | Drain Depth | |||||
|---|---|---|---|---|---|---|---|
| s-s | s-m | s-d | m-m | m-d | d-d | ||
| CD + CD | Measured value | 26.1 | 27.9 | 28.2 | 29.2 | 30.6 | 32.2 |
| Theoretical value | 25.2 | 27.1 | 29.1 | 27.9 | 29.9 | 32.9 | |
| Relative error (%) | 3.4 | 3.0 | −2.9 | 4.6 | 2.2 | −2.0 | |
| OD + CD | Measured value | 32.1 | 34.1 | 35.4 | 36.3 | 38.0 | 42.6 |
| Theoretical value | 30.8 | 32.7 | 34.5 | 36.4 | 38.5 | 42.4 | |
| Relative error (%) | 4.1 | 4.3 | 2.7 | −0.4 | −1.2 | 0.4 | |
| ID-1 + CD | Measured value | 30.3 | 31.6 | 32.8 | 32.1 | 33.4 | 37.4 |
| Theoretical value | 29.6 | 31.5 | 33.0 | 32.4 | 34.3 | 36.8 | |
| Relative error (%) | 2.2 | 0.4 | −0.5 | −0.8 | −2.7 | 1.7 | |
| ID-2 + CD | Measured value | — | — | — | 38.8 | 40.4 | 42.3 |
| Theoretical value | — | — | — | 37.6 | 39.3 | 41.6 | |
| Relative error (%) | — | — | — | 3.1 | 2.7 | 1.7 | |
Publisher’s Note: MDPI stays neutral with regard to jurisdictional claims in published maps and institutional affiliations. |
© 2021 by the authors. Licensee MDPI, Basel, Switzerland. This article is an open access article distributed under the terms and conditions of the Creative Commons Attribution (CC BY) license (https://creativecommons.org/licenses/by/4.0/).
Share and Cite
MDPI and ACS Style
Ren, X.; Wang, S.; Yang, P.; Tao, Y.; Chen, H. Performance Evaluation of Different Combined Drainage Forms on Flooding and Waterlogging Removal. Water 2021, 13, 2968. https://doi.org/10.3390/w13212968
AMA Style
Ren X, Wang S, Yang P, Tao Y, Chen H. Performance Evaluation of Different Combined Drainage Forms on Flooding and Waterlogging Removal. Water. 2021; 13(21):2968. https://doi.org/10.3390/w13212968
Chicago/Turabian StyleRen, Xiaolei, Shaoli Wang, Peiling Yang, Yuan Tao, and Haorui Chen. 2021. "Performance Evaluation of Different Combined Drainage Forms on Flooding and Waterlogging Removal" Water 13, no. 21: 2968. https://doi.org/10.3390/w13212968
Note that from the first issue of 2016, this journal uses article numbers instead of page numbers. See further details here.