Article

Constructed Wetlands as a Landscape Management Practice for Nutrient Removal from Agricultural Runoff—A Local Practice Case on the East Coast of Taiwan

1
Department of Natural Resources and Environmental Studies, National Dong Hwa University, Hualien City 974301, Taiwan
2
Recreation Section, Hualien Forest District Office, Forest Bureau, Council of Agriculture, Executive Yuan, Hualien City 973044, Taiwan
3
Crop Environment Section, Hualien District Agricultural Research and Extension Station, Council of Agriculture, Executive Yuan, Hualien City 973044, Taiwan
*
Author to whom correspondence should be addressed.
Water 2021, 13(21), 2973; https://doi.org/10.3390/w13212973
Submission received: 20 September 2021 / Revised: 10 October 2021 / Accepted: 14 October 2021 / Published: 21 October 2021

Abstract

:
Runoff with excessive nutrients from rice paddy fields that releases into the Pacific Ocean has been a possible cause of water body pollution and harm to marine life. Constructed wetlands had developed for decades but were rarely implemented in treating agricultural pollution in Taiwan. Moreover, the environmental policies haven’t provided enough instructions, support, or compensation for the establishment of this practice. The rice paddy field that was chosen in this study is located in Xinshe, Taiwan. It is close to the Pacific Ocean where coral reefs are nearby and fishery resource is abundant. In this study, the northern half of the whole organic field was chosen, and the contributing area is approximately 1 × 10⁵ m2. Four plots of constructed wetlands (approximately 17.5 m wide, 16.7 m long, and 0.2 m deep each, covering 1164.74 m2 of the total area) and employing surface flow were established as CW treatment. Water spinach (Ipomoea aquatica) was used for treating the nutrient runoff from organic rice paddy fields. Water samples of input and output of constructed wetlands were collected during 51 days of the experimental period (from the first day of rice transplantation to 10-days before harvest). Ammonia, nitrate, nitrite, phosphate, and total phosphorus concentrations were analyzed to calculate the nutrient load. The runoff of rice paddy fields without constructed wetlands was also sampled as a reference (RPF treatment). In average, about 54.3% ammonia and 42.7% nitrate was removed from the runoff that went through the CW treatment, while 4.2% ammonia and 51.3% nitrate increase were found at the output of the RPF treatment. Meanwhile, 35.6% of total phosphorus and 29.5% of phosphate were removed from the runoff of constructed wetlands. Only 16.4% total phosphorus and 6.4% phosphate were removed from the RPF treatment. Results indicate that constructed wetlands are promising treatment for agricultural runoff and the result can be used as a reference for the future environmental policies enactment in Taiwan.

1. Introduction

Rice is the most important everyday food in Taiwan and most Asia countries. The harvested area of rice in Taiwan in 2020 was about 2.6 × 10⁵ hectares (2.6 × 10⁴ km2). Most rice plantation areas in Taiwan have two crop seasons, but there is only one crop season in few areas such as Yilan County in the northeast and Hualien County on the east coast. Rice is usually planted in paddy fields with plenty of water flow through. Most of the water, however, overflows through the irrigation draining system or other nearby plots.
The average amount of the nitrogen fertilizer applies to rice ranges from 120 to 180 kg ha−1, and some areas with high insolation duration can be up to 300 kg ha−1 or even higher; moreover, the application amount of phosphorus and potassium fertilizers for rice are about 80 and 90 kg ha−1, respectively.
Council of Agriculture (COA, the government authority of agriculture in Taiwan) had promoted the policy “Rational Use of Fertilizers” for over 15 years. However, compound fertilizers are still heavily applied to the fields. Due to the fertilizer supplier and farmers’ habit of fertilizer application, over-fertilization is rather commonly happening, and organic cultivation is even more unachievable. In Taiwan, farmers apply more organic fertilizers than chemical fertilizers due to their low-release rate. The excess nutrients that are not absorbed by the plants or crops, might pollute the soil, the water bodies nearby and even the air, but farmers tend to ignore or pay very little attention to the problem that is caused by over-fertilization. Crop yield and quality is mostly the first priority for farmers. Under the fact of over-fertilization or inappropriate fertilization, soil acidification, soil alkalinity, soil degradation, or imbalance among the elements could take place [1,2,3]. Unfortunately, it will also lower the crop yield and quality because the health of plants can be harmed by over-fertilization [4,5]. Over-fertilization also results in worsen air quality, and acid precipitation, especially the greenhouse gases emission of CH 4 and N 2 O , which cause global warming and extreme climate events [6,7,8,9,10,11]. Meanwhile, over-fertilization also increases nitrogen and phosphorus levels in water bodies and causes the most well-known phenomenon, eutrophication [12,13,14]. The increasing amount of N and P promotes the growth of algae, which consume more oxygen in the water, and eventually affects the survival of aquatic organisms. Nitrogen exists in different forms in compounds, such as ammonia, nitrate, and nitrite. Nitrate ( NO 3 ) converts to nitrite ( NO 2 ) in the water, which can affect the oxygen transport and be harmful and fatal to aquatic animals, and eventually destroys the food chain and ecosystem in reefs. The tolerance to nitrogen derivatives is varied by the body size, water salinity, nitrate concentration, and exposure time [15,16,17,18]. As a result, establishing a system that can reduce the impact of nitrogen derivatives in fertilizers on the environment is urgent and crucial.
Constructed wetlands or artificial wetlands have been widely used for dealing with many types of wastewater, such as domestic wastewater, industrial wastewater, and many types of pollutants in several countries for decades [19,20,21,22,23,24,25]. It has also been applied to agricultural wastewater treatment, especially removing nitrogen, phosphorus, and soil particles [19]. They are set up by governmental agencies or supported by governments in Germany, England, Denmark, United States, and some other countries, to treat wastewater with large-area pollution resources. In Putrajaya, Malaysia, for instance, a constructed wetland with 650 ha was set to filter pollutants in the rivers [26].
The efficiency of constructed wetlands is pretty promising in laboratory trials where the pollutant and simulated constructed wetlands are fully controlled by researchers. However, the situation in the field is usually more complicated. There might be numerous pollutants in wastewater. For example, high concentration of organics, salts, and chromium particles and solutions from the leather tanning industry [27,28]. In terms of the water quality criteria in Taiwan, only irrigation water is regulated; however, it is still unclear for the agricultural effluent. Most farmers do not evaluate or calculate the amounts of fertilizers before application and have no awareness about the impacts of agricultural effluent and runoff on the environment. It led to nutrient pollution on reservoirs and lakes in some alpine agricultural areas decades ago in Taiwan. Constructed wetlands or vegetated buffer strips were implemented to reduce the pollutants in the effluent, especially nitrogen, phosphorus, and suspended solids, at that time [29,30,31,32]. Cheng et al. (2011) examine the functional capabilities of 14 constructed wetlands near the Danshui River and its tributaries. According to the results, the water quality in Taipei metropolitan rivers kept improving with the increase of constructed wetlands and it also suggested that the water quality is more stable due to the constructed wetlands [33]. Nonetheless, few attention and solutions were made for the impacts on marine ecology caused by agricultural effluent to this stage.
There are also many additional benefits and ecosystem services from constructed wetlands [34,35,36,37,38], e.g.,:
  • increasing dissolved oxygen in water
  • regulating the microclimate of wetlands
  • avoiding frozen of water bodies
  • harvesting plants from the wetlands
  • biodiversity conservation
  • habitats of many aquatic and semi-aquatic species
  • sightseeing
  • cultural conservation
  • education
The nitrate directive of cross-compliance in the EUR Common Agricultural Policy (CAP) is to reduce water pollution caused or induced by nitrates from agricultural sources. Farmers can get direct payments to secure their incomes by following directives to improve the agricultural environment [39,40,41]. Compared to Japan, European Union, China, and other countries [42,43,44,45], ecological compensation or payments for ecosystem services is just starting to develop in Taiwan, and it mainly focuses on the conservation of biodiversity and protecting habitats of wildlife. Another important policy in the Green Environmental Payment Program is to promote organic and eco-friendly farming practices. Farmers would have financial support from authorities for practicing organic cultivation, which is certified by certification bodies. However, it lacks support or subsidy to agricultural landscape management practices, such as having hedgerows to attract beneficial insects, or establishing buffer strips or constructed wetlands to reduce nutrients in agricultural runoff. Therefore, the aims of this research are (1) providing simple and clear directives to farmers for establishing constructed wetlands around or at the end of their fields, eliminating the pollution from nutrient runoff and (2) promoting this type of landscape management practices.

2. Materials and Methods

2.1. Introduction of the Study Site

The study site in this research is located in Xinshe village, Fengbin Township, Hualien County, Taiwan (23.654, 121.539), which is called “Xinshe peninsula” by local people. There are about 2 × 10⁵ m2 rice paddy fields in the area, and half of it is organic rice plantation and another half of it is for conventional rice. There is only one crop season due to the northeast monsoon from October to March next year. Besides, there is no irrigation drainage system here, the irrigation water overflows from upper fields to the lower ones. At the end of the “Xinshe peninsula”, the irrigation water discharges to the Pacific Ocean. There are abundant fishery resources and coral reefs under the sea level close to the terrestrial area.
In order to establish and study the system that can prevent the agricultural runoff pollution from being discharged to the sea, establishing constructed wetlands was chosen as a landscape management practice in this study. The main farmer of the organic cultivation area, who is also a fisherman, was willing to “sacrifice” some plots for the study of pollutant removal to protect the marine area.
In this study, four plots at the lowest fields of organic cultivation area, contributing area is approximately 1 × 10⁵ m2, were planted with water spinach (Ipomoea aquatica) in 2019–2020 and introduced surface flow to establish constructed wetlands for treating the nutrient runoff from organic rice paddy fields. Water spinach was planted a crop season prior to our study in March 2020, in order to observe its adaptability during the winter monsoon season. Water spinach was planted in 20 cm × 20 cm row spacing in the constructed wetlands and was chosen due to its high fertilizer and water demands and easy-management. The irrigation water flow direction of each field plot was investigated as well. Most of the irrigation water from organic rice fields floods into the constructed wetlands (Figure 1 and Figure 2).
Water spinach was used as a cultivated plant in constructed wetlands in this study for its high fertilizer demand and great removal efficiency to nutrients (especially nitrogen and phosphorus), heavy metals (such as mercury, cadmium, and lead), domestic wastewater, and many types of effluents [46,47,48]. In Taiwan, the fertilizer that is usually applied to water spinach is 110–216 kg ha−1 nitrogen, 55–96 kg ha−1 phosphorus pentoxide ( P 2 O 5 ), and 60–126 kg ha−1 potassium oxide ( K 2 O ) for each period (about 14–27 days), much higher than paddy rice. Most importantly, it would not become an invasive species to the local environment. Water hyacinth (Eichhornia crassipes) was once considered for the experiment but repealed for its high invasiveness [49,50].
The whole area of constructed wetlands treatment (abbreviated as CW treatment) was 1166.74 m2. On the northern side of the CW treatment, 3 plots of organic rice paddy fields that total area was 1477.06 m2 were monitored as a reference of non-water spinach plantation paddy. It is referred to as “the rice paddy field treatment” (abbreviated as RPF treatment). The plot details are shown in Table 1. The general characteristics of CW and RPF treatments are shown in Table 2. The water depth of both treatments was 0.2 m. After one year observation of the growth of water spinach in 2019, it was found that water spinach can grow well in the strong northeast monsoon, and last for the whole winter. The investigation started on 13 March 2020. To enhance the nutrient removal efficiency, shoots of water spinach were cut to about 5 cm above the ground before rice seedling transplanting. Due to the rapid growth rate, the water spinach grew back to about its original height in 10 days and was well-growing during the whole crop season in 2020.
The rice breed planted in the study site, Xinshe, was Tainan 13, an early maturing breed. The rice was in nursery for 4 weeks and then transplanted to the fields. Organic fertilizers were applied to rice paddy fields five times during the crop season, and the total amount of fertilizer of paddy rice was 196 kg ha−1 of N, 84 kg ha−1 of P2O5, and 76 kg ha−1 of K2O. The base fertilization was right after seedling transplanting on 15 March. Top dressing was applied about every 10-days three times in total, which were on 24 March, 6 April, and 19 April. The last fertilization was earing-fertilization on 13 May.

2.2. Sample Collecting, Analyzing and Data Analysis

Fifty-one days of water samples of inlet and outlet from both treatments were collected during the crop season of 120 days (from rice transplanting to 10-days before harvesting). Samples were collected once per week usually, but after each fertilization, samples were collected once a day continuously for a week.
Sample collecting and analyzing were performed by following Environmental Protection Administration of Taiwan (Taiwan EPA) methods (ammonia-NIEA W437.52C, nitrate and nitrite-NIEA W436.52C, total phosphorus and phosphate-NIEA W427.53B). Concentrated sulfuric acid was added to preserve water samples for ammonia and total phosphorus analysis. Sodium thiosulfate was added to dechlorinate water samples for ammonia, nitrate, and nitrite analysis. All samples were kept refrigerated at 4 °C during the 1-h towing before taking them back to the laboratory. Before analyzing, water samples were filtered to remove soil particles. The flux of runoff water was also measured to calculate the nutrient flux (mass transport per unit time) of each plot.
The nutrient flux was calculated by the formula below:
Flux   g   day 1 = Conc .   g   L 1 × Flow   L   day 1
  • Flux = Nutrient flux (g day−1)
  • Conc. = Concentration of nutrient (g L−1)
  • Flow = Runoff water flow (L day−1)
The daily removal efficiency was calculated by the formula below:
R . E .   % = Flux IN Flux OUT Flux IN × 100 %
  • R.E. = Removal efficiency (%)
  • Flux IN = Nutrient flux of the inlet of the treatment (g day−1)
  • Flux OUT = Nutrient flux of the outlet of the treatment (g day−1)
The average removal efficiency of the whole crop season was calculated with the daily removal efficiency, which was calculated by the formula below:
k = 1 n R . E . k n
k = sampling day
Instead of calculating the average removal efficiency of the whole crop season by the average nutrient fluxes of inlet and outlet, Equation (3) was adopted to avoid over-evaluate or under-evaluate the removal efficiency due to the outliers. However, the average removal efficiency between each fertilization was calculated by the average nutrient flux of the inlet and outlet. The influences of the outliers would be presented in this data. The value of the average removal efficiency of the whole crop season and each fertilization period could not be compared directly due to the different calculation formulas for different purposes.

3. Results

Chemical characteristics of inlet and outlet effluents in both treatments in the study period (March–June, 2020) are shown in Table 3. In the CW treatment, the average pH of the inlet was 7.5 ± 0.3, ranging from 6.56 to 8.02, and was 7.4 ± 0.3 for the outlet, ranging from 6.69 to 8.05. In the RPF treatment, the average pH of the inlet was 7.5 ± 0.3, ranging from 7.09 to 8.37, and was 7.7 ± 0.5 for the outlet, ranging from 6.84 to 8.89. In terms of the average electricity conductivity (E.C.), for those with the CW treatment, the inlet E.C. was 3.71 ± 1.08 S m−1, ranging from 1.23 to 5.99 S m−1, and the outlet one was 3.36 ± 0.80 S m−1, ranging from 1.97 to 5.07 S m−1. Meanwhile, for those with the RPF treatment, the average E.C. of the inlet was 4.37 ± 1.62 S m−1, ranging from 0.77 to 8.61 S m−1, and was 4.03 ± 1.43 S m−1 for the outlet, ranging from 1.20 to 7.24 S m−1. It showed whether the treatment is, a wide range of the E.C. were found in both inlet and outlet. The E.C. of inlet and outlet increased after fertilization in both treatments, while the E.C. of the outlet decreased slightly less than the inlet after the CW treatment, and the RPF treatment showed a similar trend as the CW treatment (Figure 3). Although the nitrite concentrations were also measured during the study period, there were all under the detection limit. It is not discussed and shown in this study.

3.1. Ammonia Removal Efficiency

During the study period, the average concentrations, maximum and minimum concentrations of ammonia were measured from the inlet and outlet in both treatments. The average concentration of ammonia of the inlet in CW treatment was 0.27 ± 0.40 mg L−1, ranging from 0 to 1.70 mg L−1, and was 0.19 ± 0.20 mg L−1 for the outlet, ranging from 0 to 1.27 mg L−1. In the RPF treatment, the average concentration of ammonia of the inlet was 1.36 ± 1.32 mg L−1, ranging from 0 to 5.44 mg L−1, and was 0.67 ± 0.88 mg L−1 for the outlet, ranging from 0 to 4.53 mg L−1. The results are shown in Table 3.
The ammonia flux of the inlet and outlet during the study period is shown in Figure 4. After each fertilization, the ammonia flux increased and then decreased in both treatments. In the CW treatment, as shown in Table 4, it showed positive removal efficiency in most fertilization periods. However, the average removal efficiency decreased to −14.9% during 1st top dressing period. The water spinach just started to shoot again at this point, and it could be the cause of the unideal performance. The average ammonia fluxes of the inlet during 2nd, 3rd top dressing and earing fertilization periods were up to 14.37 ± 12.59 g day−1 and more, but decreased to 3.25 ± 1.21 and even less at the outlet, showing a great performance of removal efficiency. There were also significant differences between the inlet and outlet during 2nd top dressing period (p = 0.027), as well as earing-fertilization period (p = 0.013). The average ammonia removal efficiency of the whole crop season was 54.3%.
In the RPF treatment, poor average ammonia removal efficiency of the whole crop season was observed, with the value of −4.2%. Also, the average ammonia removal efficiencies of 1st top dressing period and earing fertilization were negative, which were −33.8 and −114.5%. Only during 2nd top dressing period, it showed significant differences between the inlet and the outlet fluxes (p ≪ 0.05), and the average ammonia removal efficiency was 73.6%.

3.2. Nitrate Removal Efficiency

The average concentrations, maximum and minimum concentrations of nitrate were measured from the inlet and outlet in both treatments. The average concentration of nitrate of the inlet in CW treatment was 0.19 ± 0.21 mg L−1, ranging from 0 to 0.91 mg L−1, and was 0.22 ± 0.34 mg L−1 for the outlet, ranging from 0 to 2.13 mg L−1. In the RPF treatment, the average concentration of nitrate of the inlet was 0.30 ± 0.51 mg L−1, ranging from 0 to 3.07 mg L−1, and was 0.33 ± 0.86 mg L−1 for the outlet, ranging from 0 to 5.90 mg L−1. The results are shown in Table 3. The nitrate fluxes of the inlet and outlet during the study period are shown in Figure 5. The average nitrate removal efficiency of the whole crop season was 42.7% in the CW treatment and was −51.3% in the RPF treatment. After each fertilization, the nitrate fluxes increased and then decreased in both treatments.
As shown in Table 5, in the CW treatment, it showed great performances of nitrate removal efficiency during the last three fertilization periods particularly, ranging from 47.7–65.0%, and also showed significant differences between the inlet and the outlet fluxes (p = 0.020, 0.031 and ≪0.05, respectively). The average nitrate removal efficiency of the whole crop season was 42.7%. In the RPF treatment, the average nitrate removal efficiency of the whole crop season was −51.3%. There were relatively high nitrate fluxes at the outlet in some days (showed in Figure 5). The average removal efficiency was negative during the first fertilization period, and then increased to 2.3–21.3% from 1st top dressing period to earing fertilization. It showed significant differences between the inlet and the outlet fluxes (p = 0.042) during earing fertilization.

3.3. Total Phosphorus Removal Efficiency

The average concentrations, maximum and minimum concentrations of total phosphorus were measured from the inlet and outlet in both treatments of the whole crop season. In the CW treatment, the average concentration of total phosphorus of the inlet was 0.15 ± 0.08 mg L−1, ranging from 0 to 0.36 mg L−1, and was 0.17 ± 0.50 mg L−1 for the outlet, ranging from 0 to 0.30 mg L−1. In the RPF treatment, the average concentration of total phosphorus of the inlet was 0.29 ± 0.20 mg L−1, ranging from 0 to 0.97 mg L−1, and was 0.24 ± 0.19 mg L−1 for the outlet, ranging from 0 to 0.85 mg L−1. The results are shown in Table 3.
The total phosphorus fluxes of the inlet and outlet during the study period are shown in Figure 6. The average total phosphorus removal efficiency of the whole crop season was 35.6% in the CW treatment and was 16.4% in the RPF treatment. After each fertilization, the total phosphorus fluxes rise and decline in both treatments, and it suggests there is total phosphorus accumulation at the inlet in both treatments; therefore, it demonstrates a fluctuated, but rising trend on the figure.
As shown in Table 6, in the CW treatment, the average total phosphorus removal efficiency was −18.6% at first, and then gradually increased to 22.0–67.1% during the following periods. It showed significant differences between the inlet and the outlet fluxes during the 2nd, 3rd top dressing and earing fertilization period (p ≪ 0.05). In the RPF treatment, it showed similar potential as CW treatment, with a poor average total phosphorus removal efficiency at first and then increased to 11.3–50.6%. It showed significant differences between the inlet and the outlet fluxes (p ≪ 0.05) especially during 2nd top dressing period.

3.4. Phosphate Removal Efficiency

The average concentrations, maximum and minimum concentrations of phosphate were measured from the inlet and outlet in both treatments. In the CW treatment, the average concentration of phosphate of the inlet was 0.10 ± 0.04 mg L−1, ranging from 0 to 0.22 mg L−1, and was 0.11 ± 0.05 mg L−1 for the outlet, ranging from 0 to 0.23 mg L−1. In the RPF treatment, the average concentration of phosphate of the inlet was 0.15 ± 0.11 mg L−1, ranging from 0 to 0.54 mg L−1, and was 0.15 ± 0.15 mg L−1 for the outlet, ranging from 0 to 0.79 mg L−1. The results are shown in Table 3. The phosphate fluxes of the inlet and outlet during the study period are shown in Figure 7. The average phosphate removal efficiency of the whole crop season was 29.5% in the CW treatment and was 6.4% in the RPF treatment (as shown in Table 7). After each fertilization, the phosphate fluxes rise and decline in both treatments, and it suggested there is phosphate accumulation at the inlet in both treatments; therefore, it demonstrates a fluctuated, but rising trend on the figure.
In the CW treatment, the average phosphate removal efficiency was −50.4% during the base fertilization period and then increased to 43.4–66.8% during the following periods. It showed significant differences between the inlet and the outlet fluxes during all periods (p < 0.05). In the RPF treatment, the average phosphate removal efficiencies were positive except for 3rd top dressing period. It only showed significant differences between the inlet and the outlet fluxes during 2nd top dressing period (p = 0.002).

4. Discussions

4.1. Removal Efficiencies in Both Treatments

Water spinach (Ipomoea aquatica) was chosen as the main vegetation in the constructed wetlands in this study as it is known for great efficiency for removing excessive nutrients from fluxes. In the CW treatment in this research, average removal efficiency was 54.3% for ammonia and 42.7% for nitrate during the whole crop season. The study of Luyen and Preston [51] showed that over 50% of nitrogen derivatives in urea or effluent can be converted to nitrogen by water spinach as its biomass. Sophea and Preston (2001) compared the effects of biodigester effluent that charged with pig manure and urea on the yield of water spinach, and the best yield, 18.6 tons, was produced by the water spinach in the biodigester that had the highest ammonia-nitrogen concentration [52]. A similar concept is also applied to fish farming. Catfish pond wastewater was reused to irrigate the water spinach and it presented a great nutrient removal efficiency from the wastewater, with 27.07% phosphorous and 28.64% potassium were removed. Total organic carbon decreased by 38.78%. After the pollutants were removed, the water was discharged into a river [53].
In Malaysia, water spinach was applied to establish an aquaponic system to treat the aquaculture wastewater. It removed 64–78% total ammonia nitrogen, correlating to flow rate. 42–65% nitrate nitrogen and 43–53% total phosphorus were also removed and it has a negative correlation to the flow rate [54]. In a fifteen days experiment, phytoremediation of palm oil mill effluent (POME) was conducted to the water spinach plots. Although the high concentration of POME might damage the roots of water spinach, the water spinach still showed its great potential to reduce chemical oxygen demand (COD) (86.3%), nitrate (21.5%), phosphate (90.9%), and color (95.3%) [55]. The result of all those studies also indicated that both the ability of converting nitrogen fertilizer to biomass and the removal efficiency of phosphorus of water spinach are notable. The result of this study also corresponds to the literature, showing that water spinach worked very well in removing the nitrate in the runoff. In the CW treatment in this research, the removal rate of nitrate was 42.7%.
Water spinach, furthermore, is also a cash crop and continuous harvesting crop. It is not only consumed by people but can also be the feed for poultry. The water spinach which is grown for reducing the impact of fluxes to water bodies and marine life, could potentially financially benefit farmers as well. Moreover, taking the maintenance and management into account, water spinach is a suitable crop for the promotion of the constructed wetlands, and it does not expose any threat as an invasive species to the local environment. Nevertheless, water spinach accumulates more heavy metals in its leaves than the roots and shoots [46,47]. In this research, the heavy metal concentrations of the inlet and outlet were also monitored and analyzed. The concentrations of heavy metals were very low. It was 0–0.005 mg L−1 for copper, 0–0.018 mg L−1 for lead, and zinc, chromium, nickel, and cadmium were not detected. As a result, the removal efficiency of those heavy metals could not be determined. However, plants must not be consumed if heavy metals are present.
Lotus (Nelumbo nucifera), water bamboo (Zizania latifolia), and taro (Colocasia esculenta) are also popular cash crops in Taiwan. An aquatic pond that plants lotus and hydrilla (Hydrilla verticillata) was built to treat wastewater in Thailand. The ammonia-nitrogen removal efficiency was 68% in lotus treatment and 77% in hydrilla treatment. The total phosphorus removal efficiency was 66% in lotus treatment and 65% in hydrilla treatment. However, it should be noticed that higher pH and suspended solid of the effluent were found in hydrilla treatment. Lotus generally was more suitable for being the constructed wetland plant than hydrilla in this study. [56]. In another experiment of batch type lab-scale containers cultivated with lotus, the biochemical oxygen demand (BOD) decreased by 64.5% and COD increased by 50.5% after lotus treatment, showing its removal efficiency of organic contaminants [57]. The nutrient removal efficiency was investigated in a rural wastewater treatment system that consisted of an anaerobic digestion tank, an aerobic five-cell submerged biofilm reactor, a constructed wetland and two types of vegetation, water spinach and water bamboo. The water-bamboo planted CW showed a better nutrient removal efficiency, with 15.6–58.3% total nitrogen and 11.7–85.5% total phosphorus removed. Water bamboo has a better root system than water spinach, and it promotes ammonia oxidation and better phosphorus adsorption from the bed media [58]. For its stronger root system, the potential of removal efficiency of water bamboo in highly polluted wastewaters as POME, might be a topic to consider for future studies. A 20 days-study that compared the nutrient removal efficiency of plots with taro plantation and without taro plantation in the subsurface flow constructed wetland system showed that the nitrate and phosphate in the wastewater decreased. However, the plant analysis revealed that the nitrate removal during the initial 5-day was due to the anoxic denitrification, not the plant uptake. In addition, the microorganisms played a greater part in the removal of phosphorus than plant uptake in this system. Therefore, the nutrient removal efficiency of taro can’t be confirmed [59]. All these plants that have been studied have potential to be the main vegetation of constructed wetlands. However, taking the fertilizer demand, growth rate, and wind resistance into account, and also the ease of operation to farmers, a pure water spinach plantation constructed wetland might still be a more feasible option to start with, and it is also optional to farmers having more vegetation diversity later.
RPF treatment had little nutrient removal efficiency, with 16.4% total phosphorus and 6.4% phosphate were removed. However, the nitrate increased by 51.3% at the outlet, compared with the level at the inlet. The removal efficiency of the nitrate of the paddy rice, particularly, needs to be discussed further. A similar concept was implemented to investigate the nitrogen and phosphorus removal efficiency from rural non-point agricultural sources in China. The effluent flowed through the constructed wetlands first and then went to the rice paddy fields to treat excessive nutrients. The system combined 0.56 ha constructed wetlands and 5.5 ha paddy fields, and it removed 1790 kg of nitrogen and 151 kg phosphorus per year. However, it was a lab-scale simulated condition conducted indoors, future onsite studies would be practical for assessing its efficiency in nutrient removal [60]. In Thailand, paddy rice was also tested for its ability of wastewater treatment. With a shorter hydraulic loading rate of 2, 4, 6, and 8 cm day−1, and intermittently fed of wastewater (7 hr day−1), COD and BOD decreased by 49.1 and 58.7%, and the maximum removal efficiency of total Kjeldahl nitrogen and suspended solids was 64.0% and 59.4%, respectively. With a longer hydraulic loading rate, the removal efficiency of all the pollutants increased. It showed wastewater could be an alternative to irrigation water for irrigating the paddy rice. The rice grain production was only 6% lower than the conventional fields [61]. Indian shot (Canna indica) and paddy rice (Oryza sativa L.) were studied for the removal efficiency of the heavy metal and nutrients from piggery effluent. The results showed that paddy rice removed more nutrients and heavy metals than Indian shot. The bioconcentration factor of paddy rice was higher than the Indian shot. However, paddy rice is a food crop and will be consumed by people, the potential risk should be considered [62]. As a result, even if non-fertilized paddy rice has a potential as a heavy metal removal crop in constructed wetlands, the rice can’t be consumed. If paddy rice is used for treating the wastewater that might contain heavy metals, the product of this treatment should be carefully handled.
The release of fertilizer also indirectly affects the nutrients removal efficiency. The release time of organic fertilizer is usually longer than chemical fertilizer. Organic fertilizer was applied to the rice paddy fields in this study. Its slow release gives plants more time to absorb and digest it, and it could be part of the reason for the high nutrient removal efficiency.
Nonetheless, USEPA indicated that the size of the vegetated buffer strips (constructed wetland) should be about the same as the size of the crop plantation area for proper nutrient removal. Thus, even with the chemical fertilizer applied, the size of the constructed wetlands in this study should be capable of taking the high nutrient concentration at the beginning of fertilization, and reach similar nutrient removal efficiency.

4.2. Improvement of Removal Efficiency in Constructed Wetlands

Many factors play their roles in pollutant removal in constructed wetlands, such as vegetation, the concentration of pollutants, the flow rate and direction of the effluents, and microorganisms. Some of the factors are related to the design of constructed wetlands [63,64,65], and others could be about the removal mechanism [66,67,68]. Except for plant uptake, phytoaccumulation [69,70,71], phytovolatilization [72,73], and phytodegradation [
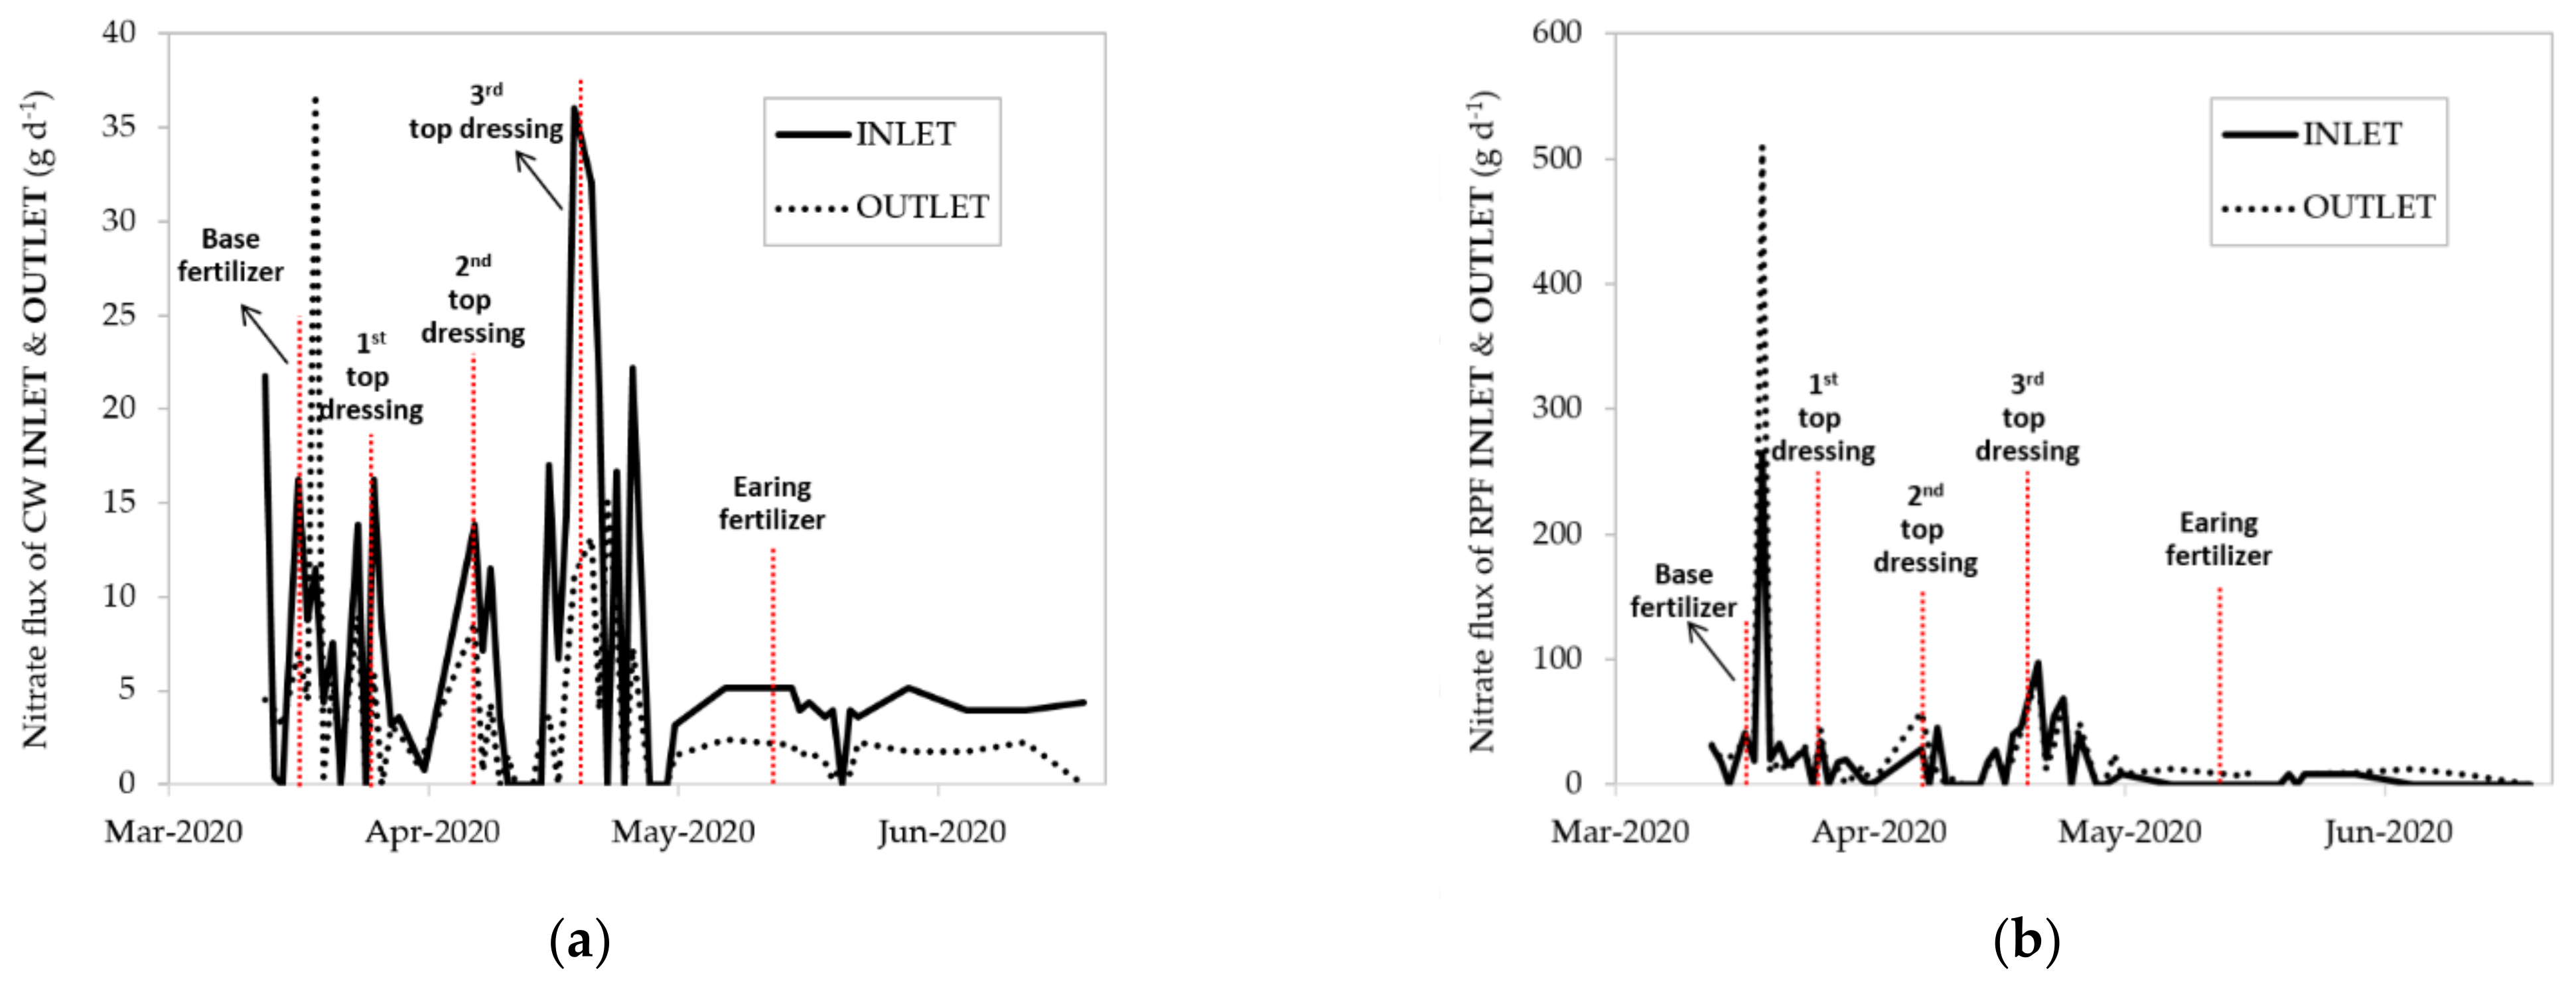
74] are also important processes of phytoremediation. In this research, the average total phosphorus and phosphate removal efficiencies of the whole crop season in the CW and RPF treatment were 35.6% and 29.5%, respectively. It is notable that the concentration of phosphorus tends to accumulate over time, from the base fertilization on 15 March to the 1st top dressing on 24 March (Figure 6 and Figure 7). It is possible because the time length is not enough for constructed wetlands to digest huge amounts of phosphorus due to intensive fertilizations.
Increase of the aeration, utilization of substrate and filter materials or combination of few types of constructed wetlands could effectively raise the pollutants removal efficiencies in constructed wetlands. However, considering the operation by farmers, easy management and the low-cost to construct, would be much more important than the removal efficiency. There are some low-cost and easy ways to enhance nutrient removal efficiency for farmers. Increasing the vegetation diversity in constructed wetlands improves the growth of the microbial communities, and enhances the treatment efficiency of constructed wetlands [75]. Hansson et al. (2005) analyzed physical, chemical, and biological features of several constructed wetlands. It was found that constructed wetlands with shallow, large areas and the complex shoreline had high nitrogen retention, and also high biodiversity of birds, benthic invertebrates, and macrophytes. Meanwhile, a small and deep wetland is more efficient in phosphorus retention, which results in worse phosphorus removal [38]. In the study of Geng et al., four vegetation species (Rumex japonicus, Oenanthe hookeri, Phalaris arundinacea, and Reineckia carnea) were planted in microcosm constructed wetlands. The results indicated lower total phosphorus concentrations detected with the increase of vegetation richness, due to a larger phosphorus pool. The results also showed that species composition is much more important than the species richness to the phosphorus removal [76]. Another similar experiment with 90 simulated constructed wetlands microcosms was conducted to investigate the effect of plant diversity on nitrogen removal. The results showed the plant species richness has a positive effect on the ammonia/nitrate ratio of the influent, and proper plant communities could improve the water quality of effluent [77].
The substrate of the constructed wetlands can be something more than soil. Some special cultivation mediums are good for pollutants adsorption, such as vermiculite, activated carbon, or biochar. It is achievable to combine those substrates to the field to enhance the nutrient removal efficiency. The average removal rates of biochar-modified horizontal constructed wetland beds from synthetic wastewater are more efficient than non-modified one. There were 58.3% ammonia, 92% nitrate-nitrogen, 79.5% total phosphorus, and 67.7% phosphate removed by biochar-modified horizontal constructed wetland bed, compared with 50.0% ammonia, 82.8% nitrate-nitrogen, 71.8% total phosphorus and 56.5% phosphate removed by non-modified one [78]. Aeration with biochar vertical flow constructed wetlands (VFCW), also showed great removal efficiency, with 99.1% ammonia-nitrogen, and 52.7% total nitrogen removed, and 94.9% COD decreased. Besides, it has lower N2O emission than other treatments, which were non-aeration with non-biochar VFCW, non-aeration with biochar VFCW, and aerated with non-biochar VFCW [79]. Sand was also considered for increasing the nutrient removal efficiency, especially phosphorus, due to its high porosity of 30–50% and P-adsorption ability of 3.5 g-P kg−1 [80]. In some farming areas, where lands are limited, biochar or other adsorbents could be considered for enhancing nutrient removal efficiency.
In general, with a higher hydraulic retention time, the nutrient removal efficiency is higher. The reduction rate of COD, tannin, and lignin of woodwaste leachate increased with the hydraulic retention time, with 0.4 kg m−3 d−1 COD and 0.13 kg m−3 d−1 tannin and lignin reduced [81,82]. Arranging several ditches that are vertical to the flow direction on constructed wetlands could increase the hydraulic retention time and the nutrient removal efficiency as well. There was significantly higher phosphorus retained in an agricultural ditch, in constructed wetlands before the agricultural runoff reaching the Florida Everglades in the study of Duersch et al. Total phosphorus concentration decreased 28–35% from upstream to downstream of the ditch [83]. A new concept of ditch, natural vegetated drainage, was introduced by Vymazal and Březinová recently, and it demonstrated a great performance as constructed wetlands. The length of the ditch was 200 m, planting Phragmites australis, Typha latifolia, and Glyceria maxima. The removal of total nitrogen and phosphorus was up to 1070 kg ha−1 yr−1 and 142 kg ha−1 yr−1 in average [84].

4.3. Promoting Constructed Wetlands in Taiwan

In Europe, farmers are instructed to take action in preventing agricultural runoff, but it is not compulsory in Taiwan. Reducing the cultivation area for the establishment of the constructed wetland relies on farmers’ awareness of environmental protection. Due to insufficient information and knowledge about the impact of agricultural runoff on the environment, and also pressure and worries about the yield and growth of crops, farmers in Taiwan mostly tend to stick to their old methods in terms of fertilization and land management, and it is one of the causes of over-fertilization and runoff with excessive nutrients. The result of this study clearly showed that constructed wetlands with water spinach plantations significantly reduce the excess nutrients that are likely to be harmful to marine life and even air quality. In spite of that, some extra benefits to encourage more farmers to cooperate with different farming ways might be essential, along with promoting or, further, making this finding for enacting laws and policies in the future. It has been suggested by several studies that ecological compensation or payments for ecosystem services [85,86,87,88,89], and moreover, all the benefits that constructed wetlands will provide, for instance, provisioning services (the vegetation in constructed wetlands), cultural services (education, recreational experiences/ecotourism), and supporting services (provisioning of habitat) [34,35,36,37,38,90,91,92,93,94], should be considered and count into part of payment scheme.
Except for the regulation services provided by constructed wetlands, more ecosystem services should be considered at the beginning of enacting the support policies. Lannas and Turpie (2009) compared the provisioning services of Letseng-la-Letsie wetlands and Mfuleni Wetlands. The main use of these two wetlands is grazing. The valuation method of this study was informal interviews and structured household surveys. It estimated that the provisioning services values derived from Letseng-la-Letsie wetlands and Mfuleni Wetlands were USD 200 ha−1yr−1 and USD 1765 ha−1yr−1 [92]. Sharma et al. (2015) evaluated the economic value of Koshi Tappu Wildlife Reserve (KTWR) in eastern Nepal, a wetland covering 175 km2, by market price and benefit transfer. The results showed KTWR created 16 million USD economic benefit per year. It provides provisioning services (85.3% of the total ecosystem services assessed), including floodplain agriculture, livestock fodder, fishery products, fuelwood, other wetland products, and domestic water supply benefits, and regulation services (7.2%), such as flood protection, carbon sequestration. Cultural services provided by KTWR also boost ecotourism, about 7.5% of the aggregated value of the ecosystem services. Although the main purpose and scale of constructed wetlands is quite different from KTWR, it is still worthy to take it as a reference [93]. Mitsch and Gosselink (2000) mentioned the importance of scale and landscape setting on the assessment of the value of wetlands. The wetland location in the landscape affects its value as well. For example, a riparian wetland could provide the extra value of detrital production, sediment retention, wildlife corridor, flood control, nitrogen and phosphorus retention, or migratory song-birds. In contrast, a coastal wetland has the benefits of fisheries, offshore productivity, waterfowl, or storm buffer [94]. An investigation was conducted to evaluate the biodiversity of two constructed wetlands in Taiwan. Fifty-eight bird species, seven fish species, and thirty-four aquatic macro-invertebrate taxa were recorded in these two types of wetlands, demonstrating the supporting services (provisioning of habitat) of constructed wetlands can offer. Proper design and management of constructed wetlands prompt biodiversity [95]. Ghermandi et al. (2010) improves the previous studies of meta-analyses and found water quality improvement, nonconsumptive recreation, and provision of natural habitat and biodiversity are valuable services providing from human-made wetlands. Also, the wetland value is positively related to anthropogenic pressure [96].
In addition, in this study, it is also suggested that the investigation of the runoff flow direction and flux, slope and soil characteristics for constructed wetlands are required, and the nutrients fluxes of the inlet and the outlet should be monitored for at least one or two crop seasons to confirm the nutrients removal efficiencies. The management and maintenance of the constructed wetlands are also crucial for keeping the constructed wetlands function.
Meanwhile, the effluent criteria for the agricultural runoff also urgently needs to be completed. Eutrophication has been a problem in over-fertilized areas, and it strongly relates to the concentration of phosphorus [97,98]. In Taiwan, however, to date, the level of total nitrogen, 3.0 mg L−1, is the only criteria that is related to it.

5. Conclusions

This research is the first one that conducted constructed wetlands for nutrient removal in runoff from rice paddy fields on the east coast of Taiwan. The results showed that CW treatment could be a promising method for removing nutrients in the agricultural runoff, with its average nutrient removal efficiencies were 54.3% for ammonia, 42.7% for nitrate, 35.6% for total phosphorus, and 29.5% for phosphate. The RPF treatment also has the potential of treating the agricultural runoff after essential improvements, but the further investigation about how to maximize its efficiency by constructed wetland arrangement or matching with certain crops, is to be discussed. This study reflected the truest field situation with the least interference. It can be a feasible landscape management practice for farmers. For areas that grow crops that have similar fertilization routines and amount, the result of this study can be a reference for establishing constructed wetland that is easily maintained and low cost.
In this study, water spinach was chosen for its fast-growing and low maintenance. It was also observed that water spinach trimming prior to the rice transplantation also slightly reduced the nutrient removal efficiency. For plants that would be trimmed, the timing should be noticed; for plants that are perennial, the removal efficiency in different stages of plants’ life, might also be an interesting topic to discuss. More studies are needed for discovering the nutrient removal efficiency of other plants, not only cash crops, but also other plants such as ornamental plants. Taking ecosystem services into account, there is great potential in the plantation on constructed wetland. In terms of how biodiversity of vegetation affects the constructed wetland, it is suggested that more plants can be examined in the constructed wetland environment in the future research. More design details might also potentially make it easier for farmers to improve the nutrient removal efficiency.
However, all measures and landscape management would also rely on the support from the government for taking it to practice. This study also aims to call agriculture authorities for enacting corresponding regulations about fertilizer usage, level of phosphorus and nitrogen derivatives, and set a proper system to assist farmers to establish constructed wetlands for marine area protection.

Author Contributions

Conceptualization, C.-Y.H.; investigation, G.-E.Y. and K.-C.P.; data curation, G.-E.Y.; writing—original draft preparation, C.-Y.H.; supervision, K.-C.L. All authors have read and agreed to the published version of the manuscript.

Funding

This research was funded by Council of Agriculture, grant number 109AS-4.2.2-HS-V1.

Institutional Review Board Statement

Not applicable.

Informed Consent Statement

Not applicable.

Data Availability Statement

Raw data file was uploaded to my google drive: https://drive.google.com/drive/folders/1b5iwjXPAWxi8qmdNN8I0MRhTIJkWa7hH?usp=sharing accessed on 20 September 2021.

Acknowledgments

We would like to thank Joi Liu, for her advice to help us submit this article. Also, we’d like to thank the farmer, Yin-Hua Pan, for his coorporation of this research. We appreciate Melinda Fan, the Chief Secretary of COA, also the ex-director of Hualien District Agricultural Research and Extension Station, who encourages Chung-Yu to study and solve farmers’ problems.

Conflicts of Interest

The authors declare no conflict of interest.

References

  1. Raza, S.; Miao, N.; Wang, P.; Ju, X.; Chen, Z.; Zhou, J.; Kuzyakov, Y. Dramatic loss of inorganic carbon by nitrogen-induced soil acidification in Chinese croplands. Glob. Chang. Biol. 2020, 26, 3738–3751. [Google Scholar] [CrossRef]
  2. Lv, H.; Zhao, Y.; Wang, Y.; Wan, L.; Wang, J.; Butterbach-Bahl, K.; Lin, S. Conventional flooding irrigation and over fertilization drives soil pH decrease not only in the top- but also in subsoil layers in solar greenhouse vegetable production systems. Geoderma 2020, 363, 114156. [Google Scholar] [CrossRef]
  3. Ge, S.; Zhu, Z.; Jiang, Y. Long-term impact of fertilization on soil pH and fertility in an apple production system. J. Soil Sci. Plant Nutr. 2018, 18, 282–293. [Google Scholar] [CrossRef] [Green Version]
  4. Nowaki, R.H.D.; Parent, S.E.; Cecílio Filho, A.B.C.; Rozane, D.E.; Meneses, N.B.; dos Santos da Silva, J.A.; Natale, W.; Parent, L.E. Phosphorus over-fertilization and nutrient misbalance of irrigated tomato crops in Brazil. Front. Plant Sci. 2017, 8, 1–11. [Google Scholar] [CrossRef] [PubMed]
  5. Albornoz, F. Crop responses to nitrogen overfertilization: A review. Sci. Hortic. 2016, 205, 79–83. [Google Scholar] [CrossRef]
  6. Synder, C.S.; Bruulsema, T.W.; Jensen, T.L.; Fixen, P.E. Review of greenhouse gas emissions from crop production systems and fertilizer management effects. Agric. Ecosyst. Environ. 2009, 133, 247–266. [Google Scholar] [CrossRef]
  7. Kahrl, F.; Li, Y.; Su, Y.; Tennigkeit, T.; Wilkes, A.; Xu, J. Greenhouse gas emissions from nitrogen fertilizer use in China. Environ. Sci. Policy 2010, 13, 688–694. [Google Scholar] [CrossRef]
  8. Linquist, B.A.; Adviento-Borbe, M.A.; Pittelkow, C.M.; van Kessel, C.; van Groenigen, K.J. Fertilizer management practices and greenhouse gas emissions from rice systems: A quantitative review and analysis. Field Crop Res. 2012, 135, 10–21. [Google Scholar] [CrossRef]
  9. Duxbury, J.M. The significance of agricultural sources of greenhouse gases. Fertil. Res. 1994, 38, 151–163. [Google Scholar] [CrossRef]
  10. Raposo, E.; Brito, L.F.; Janusckiewicz, E.R.; Oliveira, L.F.; Versuti, J.; Assumpção, F.M.; Cardoso, A.S.; Siniscalchi, D.; Delevatti, L.M.; Malheiros, E.B.; et al. Greenhouse gases emissions from tropical grasslands affected by nitrogen fertilizer management. Agron. J. 2020, 112, 4666–4680. [Google Scholar] [CrossRef]
  11. Smith, K.A.; Mctaggart, I.P.; Tsuruta, H. Emissions of N2O and NO associated with nitrogen fertilization in intensive agriculture, and the potential for mitigation. Soil Use Manag. 1997, 13, 296–304. [Google Scholar] [CrossRef]
  12. Ryther, J.H.; Dunstan, W.M. Nitrogen, phosphorus, and eutrophication in the coastal marine environment. Science 1971, 171, 1008–1013. [Google Scholar] [CrossRef] [Green Version]
  13. Howarth, R.; Paerl, H.W. Coastal marine eutrophication: Control of both nitrogen and phosphorus is necessary. Proc. Natl. Acad. Sci. USA 2008, 105, E103. [Google Scholar] [CrossRef] [Green Version]
  14. Simpson, I.C.; Roger, P.A.; Oficial, R.; Grant, I.F. Effects of nitrogen fertilizer and pesticide management on floodwater ecology in a wetland ricefield. Biol. Fert. Soils 1994, 17, 129–137. [Google Scholar] [CrossRef]
  15. Camargo, J.A.; Alonso, A.; Salamanca, A. Nitrate toxicity to aquatic animals: A review with new data for freshwater invertebrates. Chemosphere 2005, 58, 1255–1267. [Google Scholar] [CrossRef] [PubMed]
  16. Camargo, J.A.; Alonso, A. Ecological and toxicological effects of inorganic nitrogen pollution in aquatic ecosystems: A global assessment. Environ. Int. 2006, 32, 831–849. [Google Scholar] [CrossRef]
  17. Alonso, A.; Camargo, J.A. Toxicity of nitrite to three species of freshwater invertebrates. Environ. Toxicol. 2006, 21, 90–94. [Google Scholar] [CrossRef]
  18. Hentati, O.; Abrantes, N.; Caetano, A.L.; Bouguerra, S.; Gonçalves, F.; Römbke, J.; Pereira, J. Phosphogypsum as a soil fertilizer: Ecotoxicity of amended soil and elutriates to bacteria, invertebrates, algae and plants. J. Hazard. Mater. 2015, 294, 80–89. [Google Scholar] [CrossRef]
  19. Díaz, F.J.; Anthony, T.O.; Dahlgrena, R.A. Agricultural pollutant removal by constructed wetlands: Implications for water management and design. Agric. Water Manag. 2012, 104, 171–183. [Google Scholar] [CrossRef]
  20. Kadlec, R.H. Large constructed wetlands for phosphorus control: A review. Water 2016, 8, 243. [Google Scholar] [CrossRef] [Green Version]
  21. Knight, R.L.; Payne, V.W.E., Jr.; Borer, R.E.; Clarke, R.A., Jr.; Pries, J.H. Constructed wetlands for livestock wastewater management. Ecol. Eng. 2000, 15, 41–55. [Google Scholar] [CrossRef]
  22. Vymazal, J. The use constructed wetlands with horizontal sub-surface flow for various types of waste water. Ecol. Eng. 2009, 35, 1–17. [Google Scholar] [CrossRef]
  23. Abou-Elela, S.I.; Golinielli, G.; Abou-Tale, E.M.; Hellal, M.S. Municipal wastewater treatment in horizontal and vertical flows constructed wetlands. Ecol. Eng. 2013, 61, 460–468. [Google Scholar] [CrossRef]
  24. Lee, C.; Fletcher, T.D.; Sun, G. Nitrogen removal in constructed wetland systems. Eng. Life Sci. 2009, 9, 11–22. [Google Scholar] [CrossRef]
  25. Tanner, C.C.; D’Eugenio, J.; McBride, G.B.; Sukias, J.P.S. Effect of water level fluctuation on nitrogen removal from constructed wetland mesocosms. Ecol. Eng. 1999, 12, 67–92. [Google Scholar] [CrossRef]
  26. Shutes, R.B.E. Artificial wetlands and water quality improvement. Environ. Int. 2001, 26, 441–447. [Google Scholar] [CrossRef]
  27. Lofrano, G.; Meriç, S.; Zengin, G.E.; Orhon, D. Chemical and biological treatment technologies for leather tannery chemicals and wastewaters: A review. Sci. Total Environ. 2013, 461–462, 265–281. [Google Scholar] [CrossRef] [PubMed]
  28. Kabdaşli, I.; Tünay, O.; Orhon, D. Wastewater control and management in a leather tanning district. Water Sci. Technol. 1999, 40, 261–267. [Google Scholar] [CrossRef]
  29. Lin, Y.F.; Lin, C.Y.; Chou, W.C.; Lin, W.T.; Tsai, J.S.; Wu, C.F. Modeling of riparian vegetated buffer strip width and placement: A case study in Shei Pa National Park, Taiwan. Ecol. Eng. 2004, 23, 327–339. [Google Scholar] [CrossRef]
  30. Lee, C.L.; Wang, T.C.; Hsu, C.H.; Chiou, A.A. Heavy metal sorption by aquatic plants in Taiwan. Bull. Environ. Contam. Toxicol. 1998, 61, 497–504. [Google Scholar] [CrossRef] [PubMed]
  31. Lee, C.L.; Wang, T.C.; Lin, C.K.; Mok, H.K. Heavy metals removal by a promising locally available aquatic plant, Najas graminea Del., in Taiwan. Water Sci. Technol. 1999, 39, 177–181. [Google Scholar] [CrossRef]
  32. Chen, K.L. Measuring values of wetlands in Taiwan. Environ. Econ. Policy Stud. 1999, 2, 65–89. [Google Scholar] [CrossRef]
  33. Cheng, B.Y.; Liu, T.C.; Shyu, G.S.; Chang, T.K.; Fang, W.T. Analysis of trends in water quality: Constructed wetlands in metropolitan Taipei. Water Sci. Technol. 2011, 2143–2150. [Google Scholar] [CrossRef] [PubMed]
  34. Masi, F.; Rizzo, A.; Regelsberger, M. The role of constructed wetlands in a new circular economy, resource oriented, and ecosystem services paradigm. J. Environ. Manag. 2018, 216, 275–284. [Google Scholar] [CrossRef] [PubMed]
  35. Yang, W.; Chang, J.; Xu, B.; Peng, C.; Ge, Y. Ecosystem service value assessment for constructed wetlands: A case study in Hangzhou, China. Ecol. Econ. 2008, 68, 116–125. [Google Scholar] [CrossRef]
  36. Masi, F.; Rizzo, A.; Bresciani, R.; Conte, G. Constructed wetlands for combined sewer overflow treatment: Ecosystem services at Gorla Maggiore, Italy. Ecol. Eng. 2017, 98, 427–438. [Google Scholar] [CrossRef]
  37. Kennedy, G.; Mayer, T. Natural and constructed wetlands in Canada: An overview. Water Qual. Res. J. Can. 2002, 37, 295–325. [Google Scholar] [CrossRef]
  38. Hansson, L.; Bronmark, C.; Nilsson, P.A.; Abjornsson, K. Conflicting demands on wetland ecosystem services: Nutrient and retention, biodiversity or both? Freshw. Biol. 2005, 50, 705–714. [Google Scholar] [CrossRef]
  39. Herzog, F.; Prasuhn, V.; Spiess, E.; Richner, W. Environmental cross-compliance mitigates nitrogen and phosphorus pollution from Swiss agriculture. Environ. Sci. Policy 2008, 11, 655–668. [Google Scholar] [CrossRef]
  40. Hrustel-Majcen, M.; Kos, B. Cross compliance and nitrates directive in farming in Slovenia. Acta Agric. Slov. 2006, 87, 17–26. [Google Scholar]
  41. Globevnik, L.; Pintar, M.; Bremec, U. Cross compliance of the water framework and nitrate directives in Slovenia. Acta Agric. Slov. 2006, 87, 69–78. [Google Scholar]
  42. Chiba, T.; Matsushita, K. Payments for ecosystem services in Japan: The private sector’s approach in the rural areas. Int. J. Sustain. Future Hum. Secur. 2013, 1, 68–76. [Google Scholar] [CrossRef]
  43. Natuhara, Y. Ecosystem services by paddy fields as substitutes of natural wetlands in Japan. Ecol. Eng. 2013, 56, 97–106. [Google Scholar] [CrossRef]
  44. Salzman, J.; Bennett, G.; Carroll, N.; Goldstein, A.; Jenkins, M. The global status and trends of payments for ecosystem services. Nat. Sustain. 2018, 1, 136–144. [Google Scholar] [CrossRef]
  45. Kolinjivadi, V.; Adamowski, J.; Kosoy, N. Recasting payments for ecosystem services (PES) in water resource management: A novel institutional approach. Ecosyst. Serv. 2014, 10, 144–154. [Google Scholar] [CrossRef]
  46. Göthberg, A.; Greger, M.; Holm, K.; Bengtsson, B.E. Influence of nutrient levels on uptake and effects of mercury, cadmium, and lead in water spinach. J. Environ. Qual. 2004, 33, 1247–1255. [Google Scholar] [CrossRef]
  47. Göthberg, A.; Greger, M.; Bengtsson, B.E. Accumulation of heavy metals in water spinach (Ipomoea aquatica) cultivated in the Bangkok region, Thailand. Environ. Toxicol. Chem. 2002, 21, 1934–1939. [Google Scholar] [CrossRef] [PubMed]
  48. Marcussen, H.; Joergensen, K.; Holm, P.E.; Brocca, D.; Simmons, R.W.; Dalsgaard, A. Element contents and food safety of water spinach (Ipomoea aquatica Forssk.) cultivated with wastewater in Hanoi, Vietnam. Environ. Monit. Assess. 2008, 139, 77–91. [Google Scholar] [CrossRef] [PubMed]
  49. Sidek, N.M.; Abdullah, S.R.S.; Ahmad, N.U.; Draman, S.F.S.; Rosli, M.M.M.; Sanusi, M.F. Phytoremediation of abandoned mining lake by water hyacinth and water lettuces in constructed wetlands. J. Teknol. 2018, 80, 87–93. [Google Scholar] [CrossRef] [Green Version]
  50. Diaz, P.M. Constructed wetlands and water hyacinth macrophyte as a tool for wastewater treatment: A review. J. Adv. Civ. Eng. 2016, 2, 1–8. [Google Scholar] [CrossRef]
  51. Luyen, L.T.; Preston, T.R. Effect of level of urea fertilizer on biomass production of water spinach (Ipomoea aquatica) grown in soil and in water. Livest. Res. Rural Dev. 2004, 16, 81. [Google Scholar]
  52. Sophea, K.; Preston, T.R. Comparison of biodigester effluent and urea as fertilizer for water spinach vegetable. Livest. Res. Rural Dev. 2001, 13, 125–127. [Google Scholar]
  53. Tung, T.V.; Tran, Q.B.; Thao, N.T.P.; Vi, L.Q.; Hieu, T.T.; Tuan, N.Q.; Sonne, C.; Lam, S.S.; Hai, L.T.; Le, Q.V. Recycling of aquaculture wastewater and sediment for sustainable corn and water spinach production. Chemosphere 2021, 268, 1293629. [Google Scholar] [CrossRef]
  54. Endut, A.; Jusoh, A.; Ali, N.; Wan Nik, W.N.S.; Hassan, A. Effect of flow rate on water quality parameters and plant growth of water spinach (Ipomoea aquatica) in an aquaponic recirculating system. Desalin. Water Treat. 2009, 5, 19–28. [Google Scholar] [CrossRef]
  55. Zulfahmi, I.; Kandi, R.N.; Huslina, F.; Rahmawati, L.; Muliari, M.; Sumon, K.A.; Rahman, M.M. Phytoremediation of palm oil mill effluent (POME) using water spinach (Ipomoea aquatica Forsk). Environ. Technol. Innov. 2020, 21, 101260. [Google Scholar] [CrossRef]
  56. Kanabkaew, T.; Puetpaiboon, U. Aquatic plants for domestic wastewater treatment: Lotus (Nelumbo nucifera) and hydrilla (Hydrilla verticillata) systems. J. Sci. Technol. 2004, 26, 749–756. [Google Scholar]
  57. Abd Rasid, N.S.; Naim, M.N.; Che Man, H.; Abu Bakar, N.F.; Mokhtar, M.N. Evaluation of surface water treated with lotus plant; Nelumbo nucifera. J. Environ. Chem. Eng. 2019, 7, 103048. [Google Scholar] [CrossRef]
  58. Yu, R.; Wu, Q.; Lu, X. Constructed wetland in a compact rural domestic wastewater treatment system for nutrient removal. Environ. Eng. Sci. 2012, 29, 751–757. [Google Scholar] [CrossRef]
  59. Bindu, T.; Sylas, V.P.; Mahesh, M.; Rakesh, P.S.; Ramasamy, E.V. Pollutant removal from domestic wastewater with taro (Colocasia esculenta) planted in a subsurface flow system. Ecol. Eng. 2008, 33, 68–82. [Google Scholar] [CrossRef]
  60. Sun, H.; Zhang, H.; Yu, Z.; Wu, J.; Jiang, P.; Yuan, X.; Shi, W. Combination system of full-scale constructed wetlands and wetland paddy fields to remove nitrogen and phosphorus from rural unregulated non-point sources. Environ. Geochem. Health 2013, 35, 801–809. [Google Scholar] [CrossRef]
  61. Kantawanichkul, S.; Duangjaisak, W. Domestic wastewater treatment by a constructed wetland system planted with rice. Water Sci. Technol. 2011, 64, 2376–2380. [Google Scholar] [CrossRef] [PubMed]
  62. Olawale, O.; Raphael, D.O.; Christopher, O.; Akinbile, C.O.; Ishuwa, K. Comparison of heavy metal and nutrients removal in Canna indica and Oryza sativa L. based constructed wetlands for piggery effluent treatment in north-central Nigeria. Int. J. Phytoremediat. 2021, 23, 1–9. [Google Scholar] [CrossRef] [PubMed]
  63. Stone, K.C.; Hunt, P.G.; Szögi, A.A.; Humenik, F.J.; Rice, J.M. Constructed wetland design and performance for swine lagoon wastewater treatment. Trans. Am. Soc. Agric. Eng. 2002, 45, 723–730. [Google Scholar] [CrossRef]
  64. Zhang, L.; Lv, T.; Zhang, Y.; Stein, O.R.; Arias, C.A.; Brix, H.; Carvalho, P.N. Effects of constructed wetland design on ibuprofen removal—A mesocosm scale study. Sci. Total Enivron. 2017, 609, 38–45. [Google Scholar] [CrossRef]
  65. Rahman, M.E.; Halmi, M.I.E.B.; Samad, M.Y.B.A.; Uddin, M.K.; Mahmud, K.; Shukor, M.Y.A.; Abdullah, S.R.S.; Shamsuzzaman, S.M. Design, operation and optimization of constructed wetland for removal of pollutant. Int. J. Environ. Res. Public Health 2020, 17, 8339. [Google Scholar] [CrossRef]
  66. Sakadevan, K.; Bavor, H.J. Nutrient removal mechanisms in constructed wetlands and sustainable water management. Water Sci. Technol. 1999, 40, 121–128. [Google Scholar] [CrossRef]
  67. Choudhary, A.K.; Kumar, S.; Sharma, C. Constructed wetlands: An approach for wastewater treatment. Elixir Pollut. 2011, 37, 3666–3672. [Google Scholar]
  68. Budd, R.; O’geen, A.; Goh, K.S.; Bondarenko, S.; Gan, J. Removal mechanisms and fate of insecticides in constructed wetlands. Chemosphere 2011, 83, 1581–1587. [Google Scholar] [CrossRef]
  69. Ismail, N.’I.; Abdullah, S.R.S.; Idris, M.; Kurniawan, S.B.; Halmi, M.I.E.; Sbani, N.H.A.L.; Jehawi, O.H.; Hasan, H.A. Applying rhizobacteria consortium for the enhancement of Scirpus grossus growth and phytoaccumulation of Fe and Al in pilot constructed wetlands. J. Environ. Manag. 2020, 267, 110643. [Google Scholar] [CrossRef]
  70. Zhu, Y.L.; Zayed, A.M.; Qian, J.-H.; de Souza, M.; Terry, N. Phytoaccumulation of trace elements by wetland plants: II. Water hyacinth. J. Environ. Qual. 1999, 28, 339–341. [Google Scholar] [CrossRef]
  71. Qian, J.-H.; Zayed, A.; Zhu, Y.-L.; Yu, M.; Terry, N. Phytoaccumulation of trace elements by wetland plants: III. Uptake and accumulation of ten trace elements by twelve plant species. J. Environ. Qual. 1999, 28, 1448–1455. [Google Scholar] [CrossRef]
  72. Limmer, M.; Burken, J. Phytovolatilization of organic contaminants. Environ. Sci. Technol. 2016, 50, 6632–6643. [Google Scholar] [CrossRef]
  73. Imfeld, G.; Braeckevelt, M.; Kuschk, P.; Richnow, H.H. Monitoring and assessing processes of organic chemicals removal in constructed wetlands. Chemosphere 2009, 74, 349–362. [Google Scholar] [CrossRef]
  74. Al-Baldawi, I.A.; Abdullah, S.R.S.; Anuar, N.; Suja, F.; Mushrifah, I. Phytodegradation of total petroleum hydrocarbon (TPH) in diesel-contaminated water using Scirpus grossus. Environ. Eng. 2015, 74, 463–473. [Google Scholar] [CrossRef]
  75. Zhang, C.-B.; Wang, J.; Liu, W.-L.; Zhu, S.-X.; Ge, H.-L.; Chang, S.X.; Chang, J.; Ge, Y. Effects of plant diversity on microbial biomass and community metabolic profiles in a full-scale constructed wetland. Ecol. Eng. 2010, 36, 62–68. [Google Scholar] [CrossRef]
  76. Geng, Y.; Han, W.; Yu, C.; Jiang, Q.; Wu, J.; Chang, J.; Ge, Y. Effect of plant diversity on phosphorus removal in hydroponic microcosms simulating floating constructed wetlands. Ecol. Eng. 2017, 107, 110–119. [Google Scholar] [CrossRef]
  77. Wang, X.; Luo, B.; Wang, L.; Zhao, Y.; Wang, Q.; Li, D.; Gu, B.; Min, Y.; Chang, S.X.; Ge, Y.; et al. Plant diversity improves the effluent quality and stability of floating constructed wetlands under increased ammonium/nitrate ratio in influent. Ecol. Eng. 2020, 266, 110607. [Google Scholar] [CrossRef]
  78. Gupta, P.; Ann, T.-w.; Lee, S.-M. Use of biochar to enhance constructed wetland performance in wastewater reclamation. Environ. Eng. Res. 2016, 21, 36–44. [Google Scholar] [CrossRef] [Green Version]
  79. Zhou, X.; Wang, X.; Zhang, H.; Wu, H. Enhanced nitrogen removal of low C/N domestic wastewater using a biochar-amended aerated vertical flow constructed wetland. Bioresour. Technol. 2017, 241, 269–275. [Google Scholar] [CrossRef]
  80. Roseth, R. Shell sand: A new filter medium for constructed wetlands and wastewater treatment. J. Environ. Sci. Health A 2000, 35, 1335–1355. [Google Scholar] [CrossRef]
  81. Tao, W.; Hall, K.J.; Duff, S.J.B. Performance evaluation and effects of hydraulic retention time and mass loading rate on treatment of woodwaste leachate in surface-flow constructed wetlands. Ecol. Eng. 2006, 26, 252–265. [Google Scholar] [CrossRef]
  82. Laber, J. Constructed wetland system for storm water treatment. J. Environ. Sci. Health A 2000, 35, 1279–1288. [Google Scholar] [CrossRef]
  83. Duersch, B.G.; Powers, M.O.; Newman, S.; Ricca, J.G.; Bhadha, J.H.; Louda, J.W. Phosphorus retention within a relic agricultural ditch in a constructed wetland. J. Environ. Qual. 2021, 50, 1171–1183. [Google Scholar] [CrossRef]
  84. Vymazal, J.; Březinová, T.D. Removal of nutrients, organics and suspended solids in vegetated agricultural drainage ditch. Ecol. Eng. 2018, 118, 97–103. [Google Scholar] [CrossRef]
  85. Moreno-Mateos, D.; Comin, F.A. Integrating objectives and scales for planning and implementing wetland restoration and creation in agricultural landscapes. J. Environ. Manag. 2010, 91, 2087–2095. [Google Scholar] [CrossRef]
  86. Yu, J.; Belcher, K. An economic analysis of landowners’ willingness to adopt wetland and riparian conservation management. Can. J. Agric. Econ. 2011, 59, 207–222. [Google Scholar] [CrossRef]
  87. Birol, E.; Karousakis, K.; Koundouri, P. Using a choice experiment to account for preference heterogeneity in wetland attributes: The case of Cheimaditida wetland in Greece. Ecol. Econ. 2006, 60, 145–156. [Google Scholar] [CrossRef]
  88. Peng, W.; Kong, D.; Chengzhao Wu, C.; Møller, A.P.; Longcore, T. Predicted effects of Chinese national park policy on wildlife habitat provisioning: Experience from a plateau wetland ecosystem. Ecol. Indic. 2020, 115, 106346. [Google Scholar] [CrossRef]
  89. Vuuren, W.V.; Roy, P. Private and social returns from wetland preservation versus those from wetland conversion to agriculture. Ecol. Econ. 1993, 8, 289–305. [Google Scholar] [CrossRef]
  90. McInnes, R.J. Recognizing ecosystem services from wetlands of international importance: An example from Sussex, UK. Wetlands 2013, 33, 1001–1017. [Google Scholar] [CrossRef]
  91. Trepel, M. Assessing the cost-effectiveness of the water purification function of wetlands for environmental planning. Ecol. Complex. 2010, 7, 320–326. [Google Scholar] [CrossRef]
  92. Lannas, K.S.M.; Turpie, J.K. Valuing the provisioning services of wetlands: Contrasting a rural wetland in Lesotho with a Peri-Urban Wetland in South Africa. Ecol. Soc. 2009, 14, 18. [Google Scholar] [CrossRef] [Green Version]
  93. Sharma, B.; Rasul, G.; Chettri, N. The economic value of wetland ecosystem services: Evidence from the Koshi Tappu Wildlife Reserve, Nepal. Ecosyst. Serv. 2015, 12, 84–93. [Google Scholar] [CrossRef]
  94. Mitsch, W.J.; Gosselink, J.G. The value of wetlands: Importance of scale and landscape setting. Ecol. Econ. 2000, 35, 25–33. [Google Scholar] [CrossRef]
  95. Hsu, C.-B.; Hsieh, H.-L.; Yang, L.; Wu, S.-H.; Chang, J.-S.; Hsiao, S.-C.; Su, H.-C.; Yeh, C.-H.; Ho, Y.-S.; Lin, H.-J. Biodiversity of constructed wetlands for wastewater treatment. Ecol. Eng. 2011, 37, 1533–1545. [Google Scholar] [CrossRef]
  96. Ghermandi, A.; van den Bergh, J.C.J.M.; Brander, L.M.; de Groot, H.L.F.; Nunes, P.A.L.D. Values of natural and human-made wetlands: A meta-analysis. Water Resour. Res. 2010, 46, W12516. [Google Scholar] [CrossRef] [Green Version]
  97. Correll, D.L. The role of phosphorus in the eutrophication of receiving waters: A review. J. Environ. Qual. 1998, 27, 261–266. [Google Scholar] [CrossRef] [Green Version]
  98. Carpenter, S.R. Phosphorus control is critical to mitigating eutrophication. Proc. Natl. Acad. Sci. USA 2008, 105, 11039–11040. [Google Scholar] [CrossRef] [PubMed] [Green Version]
Figure 1. Fields situation of the study site in Xinshe village, Fengbin Township, Hualien County, Taiwan. The yellow arrows show the runoff direction, the blue line shows an irrigation pipe, and the red line shows the boundary of organic fields and conventional fields. Treatments applied are also shown in the figure.
Water 13 02973 g001
Figure 2. The aerial photo of the study site, the plots of CW treatment are framed in red lines, and the plots of RPF treatment are framed in yellow lines.
Water 13 02973 g002
Figure 3. E.C. of INLET and OUTLET in (a) CW treatment and (b) RPF treatment of first crop season, 2020 (March–June); each fertilization timing is marked.
Water 13 02973 g003
Figure 4. Ammonia fluxes of INLET and OUTLET in (a) CW treatment and (b) RPF treatment of the first crop season, 2020 (March–June); each fertilization timing is marked.
Water 13 02973 g004
Figure 5. Nitrate fluxes of INLET and OUTLET in (a) CW treatment and (b) RPF treatment of the first crop season, 2020 (March–June); each fertilization timing is marked.
Water 13 02973 g005
Figure 6. Total phosphorous fluxes of INLET and OUTLET in (a) CW treatment and (b) RPF treatment of the first crop season, 2020 (March–June); each fertilization timing is marked.
Water 13 02973 g006
Figure 7. Phosphate fluxes of INLET and OUTLET in (a) CW treatment and (b) RPF treatment of the first crop season, 2020 (March–June); each fertilization timing is marked.
Water 13 02973 g007
Table 1. Length, width and area of each plot of CW and RPF treatments.
PlotLengthWidthAreaPlotLengthWidthArea
mmm2mmm2
CW-116.8716.82280.77RPF-125.8413.79332.12
CW-214.1116.76234.46RPF-225.0914.40354.36
CW-316.1616.72266.91RPF-322.0436.73790.60
CW-422.9016.91384.60
Total Area of CW1166.74Total Area of RPF1477.06
Table 2. General characteristics of CW and RPF treatments.
TreatmentCWRPF
Wetland typeSurface flowSurface flow
Hydraulic flowContinuousContinuous
Vegetation TypeWater spinach (Ipomoea aquatica)Paddy rice (Oryza sativa)
Vegetation coverage (%)~90~90
Average inflow (m3 day−1)~39.6~86.4
Average outflow (m3 day−1)~17.3~86.4
Hydraulic retention time (day)5.893.42
Soil textureClayClay
Table 3. Chemical characteristics of INLET and OUTLET of the first crop season, 2020 (March–June); mean ± standard deviation; each location was sampled 42–51 times.
CharacteristicsCW TreatmentRPF Treatment
INLETOUTLETINLETOUTLET
Ave.MAX.min.Ave.MAX.min.Ave.MAX.min.Ave.MAX.min.
pH 7.5 ± 0.38.026.567.4 ± 0.38.056.697.5 ± 0.38.377.097.7 ± 0.58.896.84
E.C. * S m−13.71 ± 1.085.991.233.36 ± 0.805.071.974.37 ± 1.620.778.614.03 ± 1.431.207.24
Ammonia mg L−10.27 ± 0.401.7000.19 ± 0.201.2701.36 ± 1.325.4400.67 ± 0.884.530
Nitrate mg L−10.19 ± 0.210.9100.22 ± 0.342.1300.30 ± 0.513.0700.33 ± 0.865.900
TP mg L−10.15 ± 0.080.3600.17 ± 0.500.3000.29 ± 0.200.970.050.24 ± 0.190.850
Phosphate mg L−10.10 ± 0.040.2200.11 ± 0.050.2300.15 ± 0.110.540.020.15 ± 0.150.790
* E.C.: electricity conductivity.
Table 4. The average ammonia fluxes and removal efficiency of each fertilization period.
Fertilization TimingCW TreatmentRPF Treatment
INLETOUTLETRemovalp-ValueINLETOUTLETRemovalp-Value
g day−1g day−1%--g day−1g day−1%--
Base fertilizer4.62 ± 1.872.81 ± 1.83 39.20.63117.28 ± 21.9911.23 ± 12.1835.00.070
1st top dressing4.62 ± 3.605.31 ± 7.49−14.90.36652.21 ± 39.6869.84 ± 61.18−33.80.740
2nd top dressing26.42 ± 1.712.74 ± 2.45 * 89.60.027123.00 ± 63.5832.44 ± 19.51 * 73.6≪0.05
3rd top dressing20.38 ± 21.083.25 ± 1.21 84.10.052206.21 ± 150.34113.41 ± 114.84 45.00.914
Earing-fertilizer14.37 ± 12.592.30 ± 1.12 * 84.00.01316.42 ± 1.5035.21 ± 41.08−114.50.099
Whole crop season---- 54.3------ −4.2--
* Significant differences are shown between INLET and OUTLET fluxes of each fertilization period (p < 0.05).
Table 5. The average nitrate fluxes and removal efficiency of each fertilization period.
Fertilization TimingCW TreatmentRPF Treatment
INLETOUTLETRemovalp-ValueINLETOUTLETRemovalp-Value
g day−1g day−1%--g day−1g day−1%--
Base fertilizer10.54 ± 6.817.63 ± 10.5627.70.82252.13 ± 80.3771.63 ± 154.22−37.40.342
1st top dressing5.61 ± 5.832.94 ± 1.8147.60.17018.79 ± 13.0818.36 ± 17.40 2.30.952
2nd top dressing13.76 ± 10.074.82 ± 3.56 *65.00.02029.52 ± 16.3023.23 ± 17.4721.30.956
3rd top dressing14.31 ± 11.837.47 ± 5.23 *47.70.03141.96 ± 34.0436.72 ± 29.5812.51.000
Earing-fertilizer4.18 ± 0.551.50 ± 0.68 *64.3≪0.058.64 ± 0.007.99 ± 2.52 *7.50.042
Whole crop season----42.7------ −51.3--
* Significant differences are shown between INLET and OUTLET fluxes of each fertilization period (p < 0.05).
Table 6. The average total phosphorus fluxes and removal efficiency of each fertilization period.
Fertilization TimingCW TreatmentRPF Treatment
INLETOUTLETRemovalp-ValueINLETOUTLETRemovalp-Value
g day−1g day−1%--g day−1g day−1%--
Base fertilizer2.89 ± 1.203.43 ± 0.95−18.60.24006.98 ± 2.847.27 ± 1.97−4.20.746
1st top dressing3.70 ± 1.372.88 ± 0.73 22.00.17716.07 ± 7.4413.68 ± 4.26 14.90.368
2nd top dressing5.50 ± 1.432.43 ± 0.60 * 55.7≪0.0526.63 ± 8.1413.15 ± 2.81 * 50.6≪0.05
3rd top dressing6.98 ± 3.122.85 ± 0.75 * 59.2≪0.0541.05 ± 18.7936.40 ± 21.99 11.30.857
Earing-fertilizer8.76 ± 2.912.88 ± 1.02 * 67.1≪0.0544.84 ± 10.6332.13 ± 14.85 28.40.170
Whole crop season---- 35.6------ 16.4--
* Significant differences are shown between INLET and OUTLET fluxes of each fertilization period (p < 0.05).
Table 7. The average phosphate fluxes and removal efficiency of each fertilization period.
Fertilization TimingCW TreatmentRPF Treatment
INLETOUTLETRemovalp-ValueINLETOUTLETRemovalp-Value
g day−1g day−1%--g day−1g day−1%--
Base fertilizer1.67 ± 0.912.51 ± 1.04 *−50.40.0074.59 ± 2.894.18 ± 1.58 9.00.616
1st top dressing3.20 ± 0.881.80 ± 0.89 * 43.40.0347.19 ± 2.586.35 ± 2.65 11.50.229
2nd top dressing3.76 ± 1.471.74 ± 0.59 * 53.7≪0.0513.19 ± 5.307.42 ± 2.51 * 43.80.002
3rd top dressing4.31 ± 2.162.09 ± 0.62 * 51.4≪0.0521.02 ± 6.7025.27 ± 20.58−19.90.305
Earing-fertilizer5.10 ± 1.071.70 ± 0.69 * 66.8≪0.0530.76 ± 13.8219.05 ± 8.08 38.10.242
Whole crop season---- 29.5------ 6.4--
* Significant differences are shown between INLET and OUTLET fluxes of each fertilization period (p < 0.05).
Publisher’s Note: MDPI stays neutral with regard to jurisdictional claims in published maps and institutional affiliations.

