
Investigating a Water Resource Allocation Model by Using Interval Fuzzy Two-Stage Robust Planning for the Yinma River Basin, Jilin Province, China

Abstract
:1. Introduction
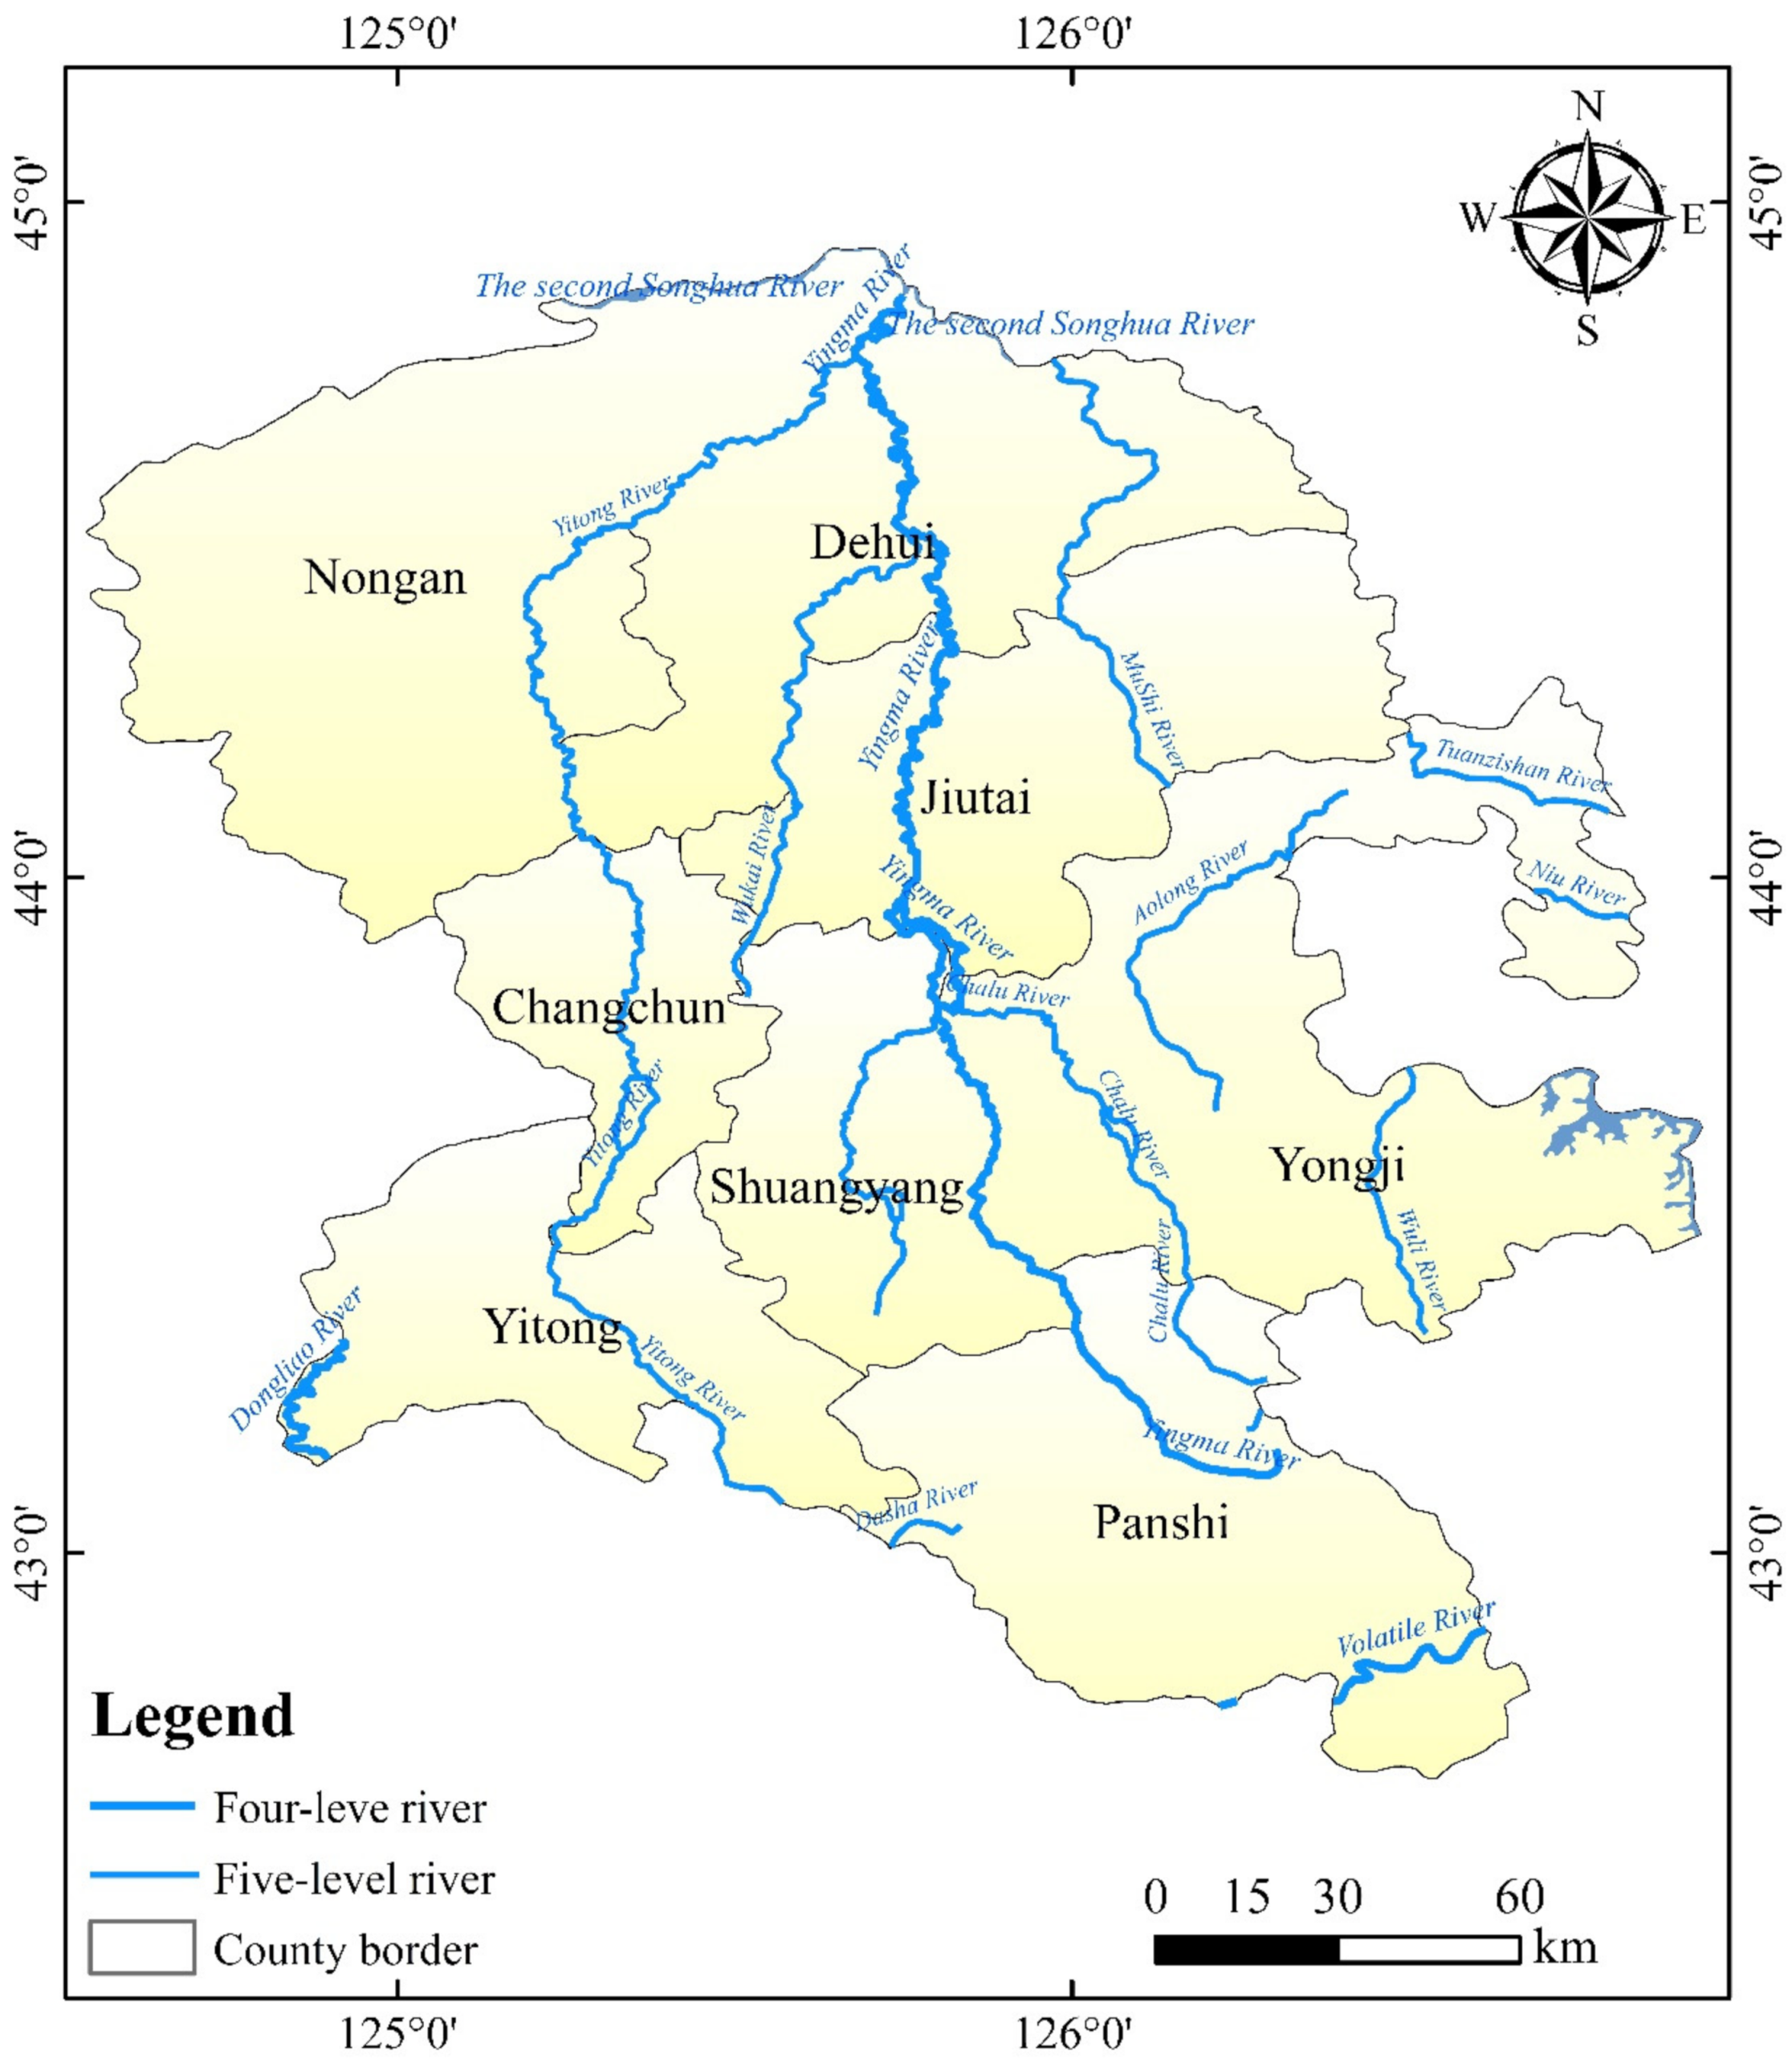
2. Case Study
3. Model Formulation
3.1. Constructing a Water Resource Allocation Model in the Yinma River Basin Based on the ITSFR Optimization Method
- Economic benefit optimization constraint:
3.2. Model Solving
4. Results and Discussion
4.1. Change Analysis of System Economic Benefit in the Yinma River Basin Based on the ITSFR Optimization Method
4.2. Total Pollution Target Control in the Yinma River Basin Based on the ITSFR Optimization Method
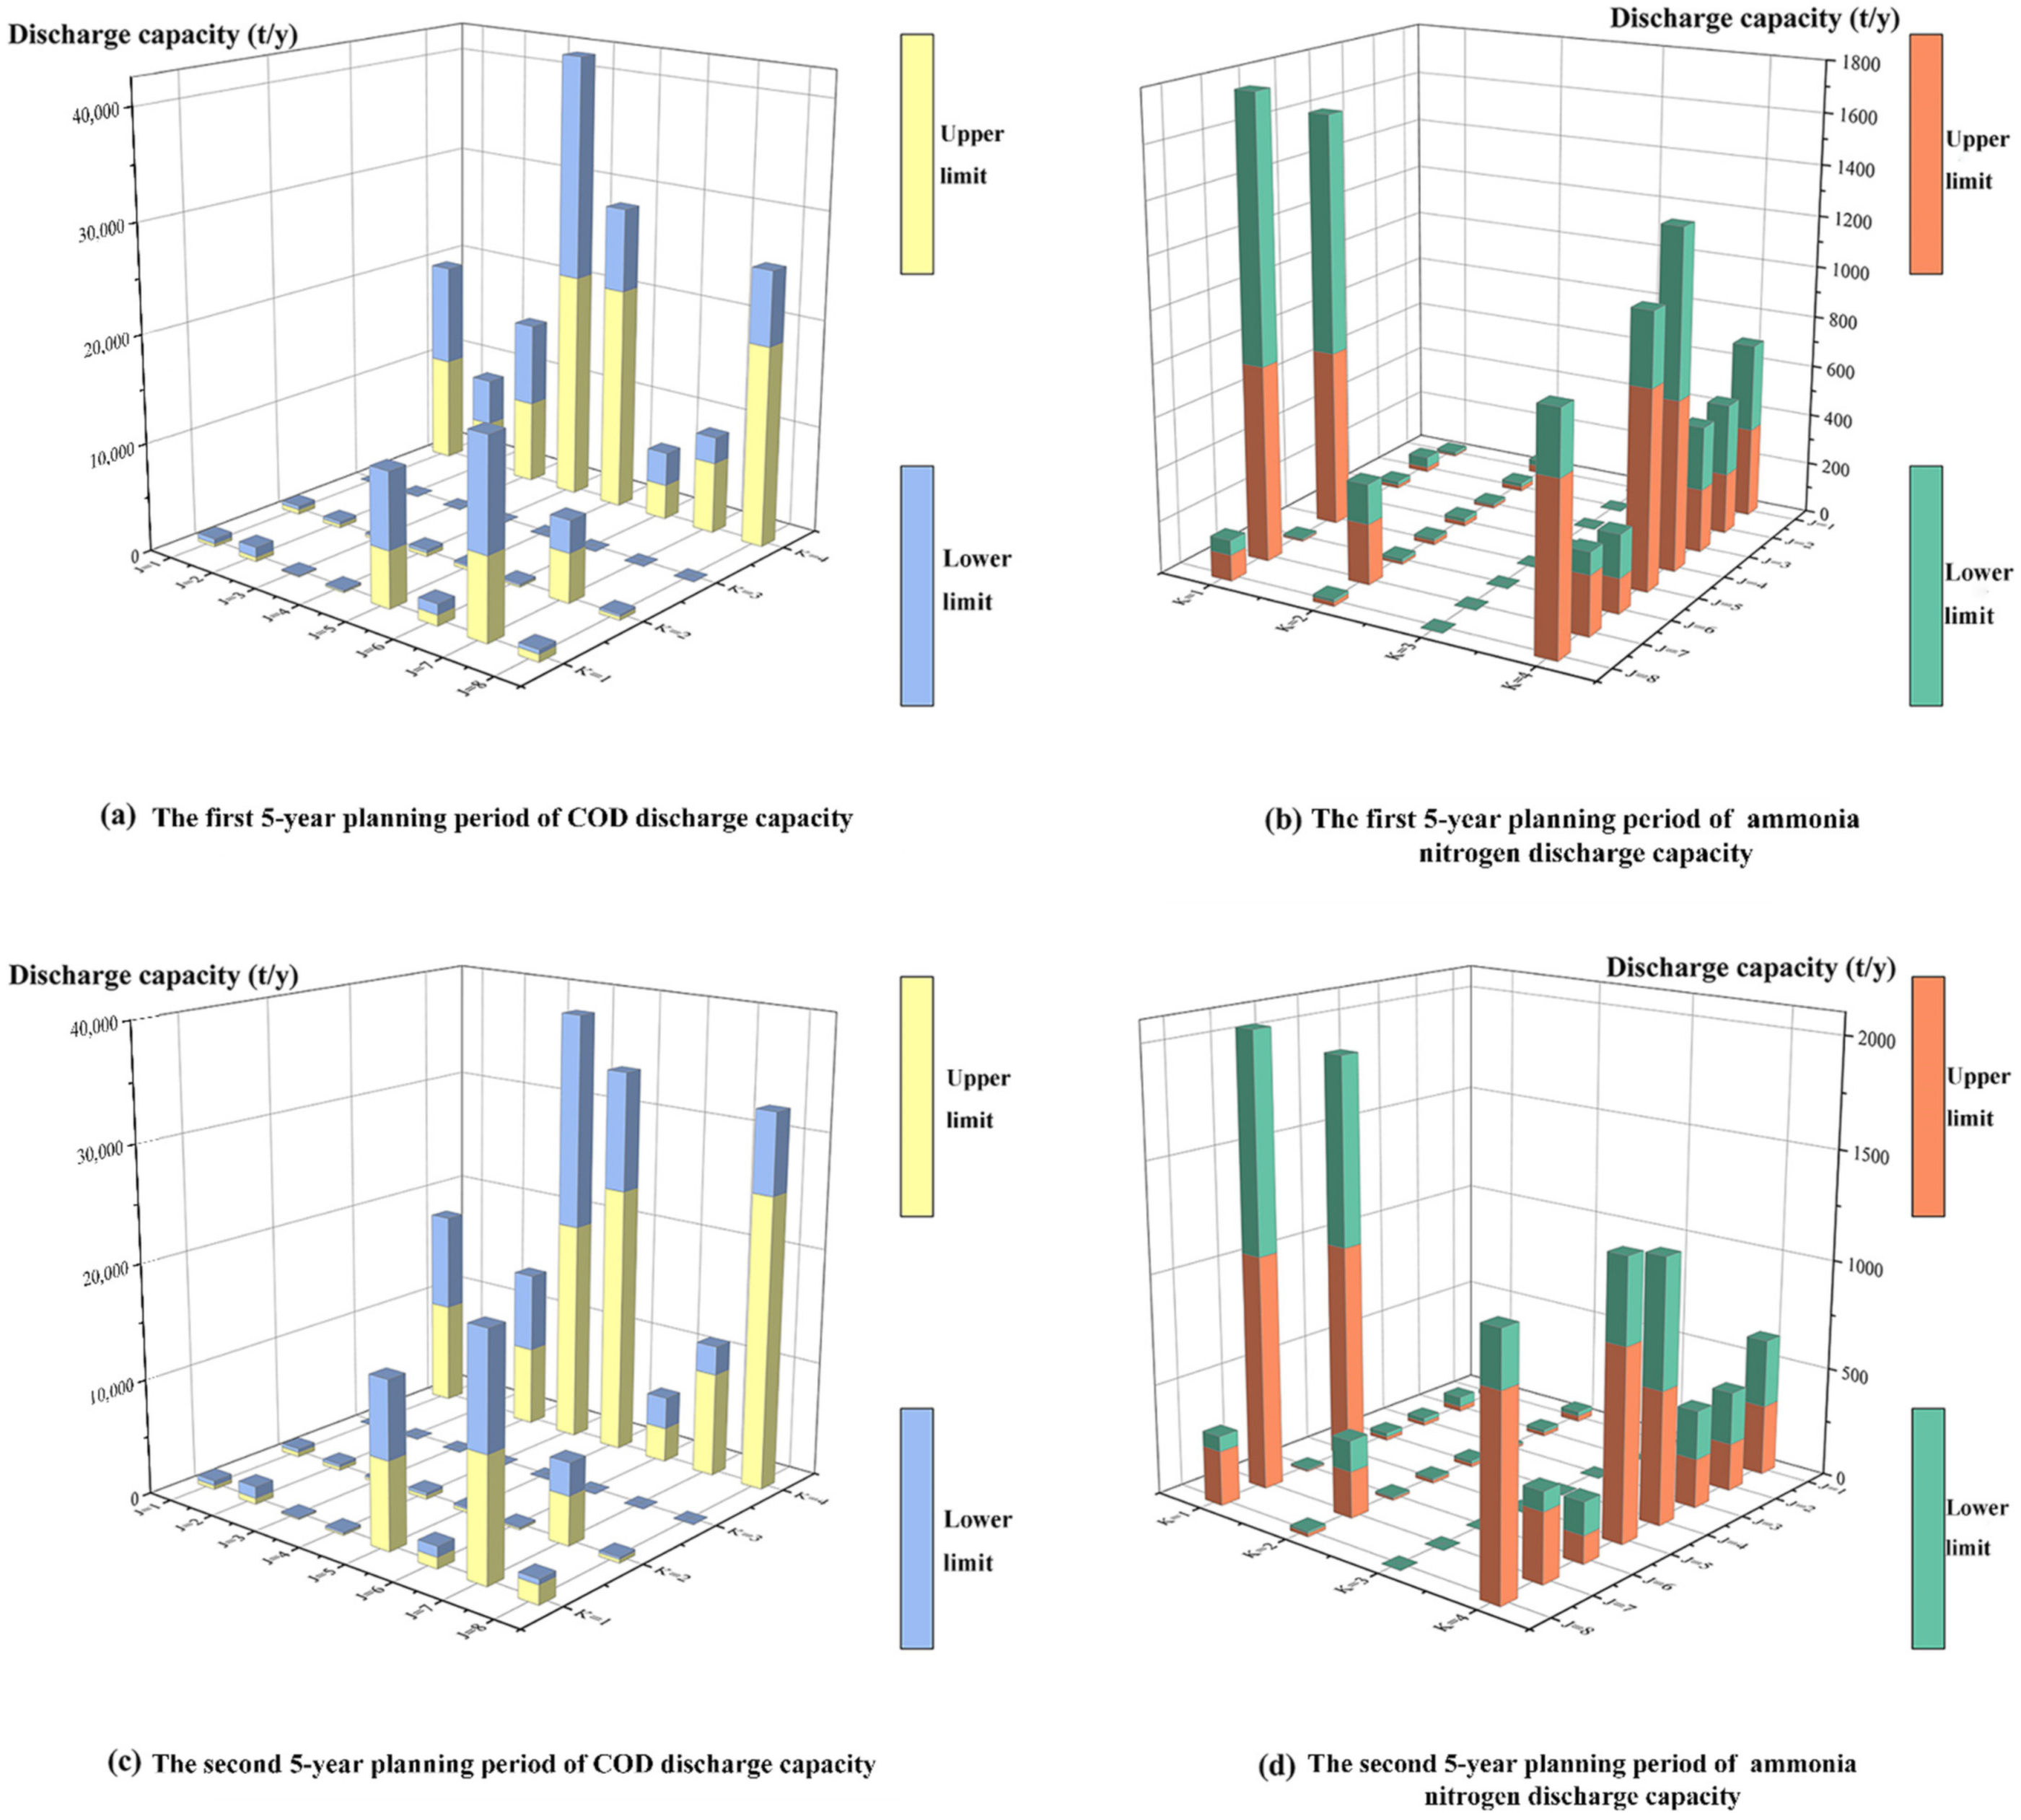
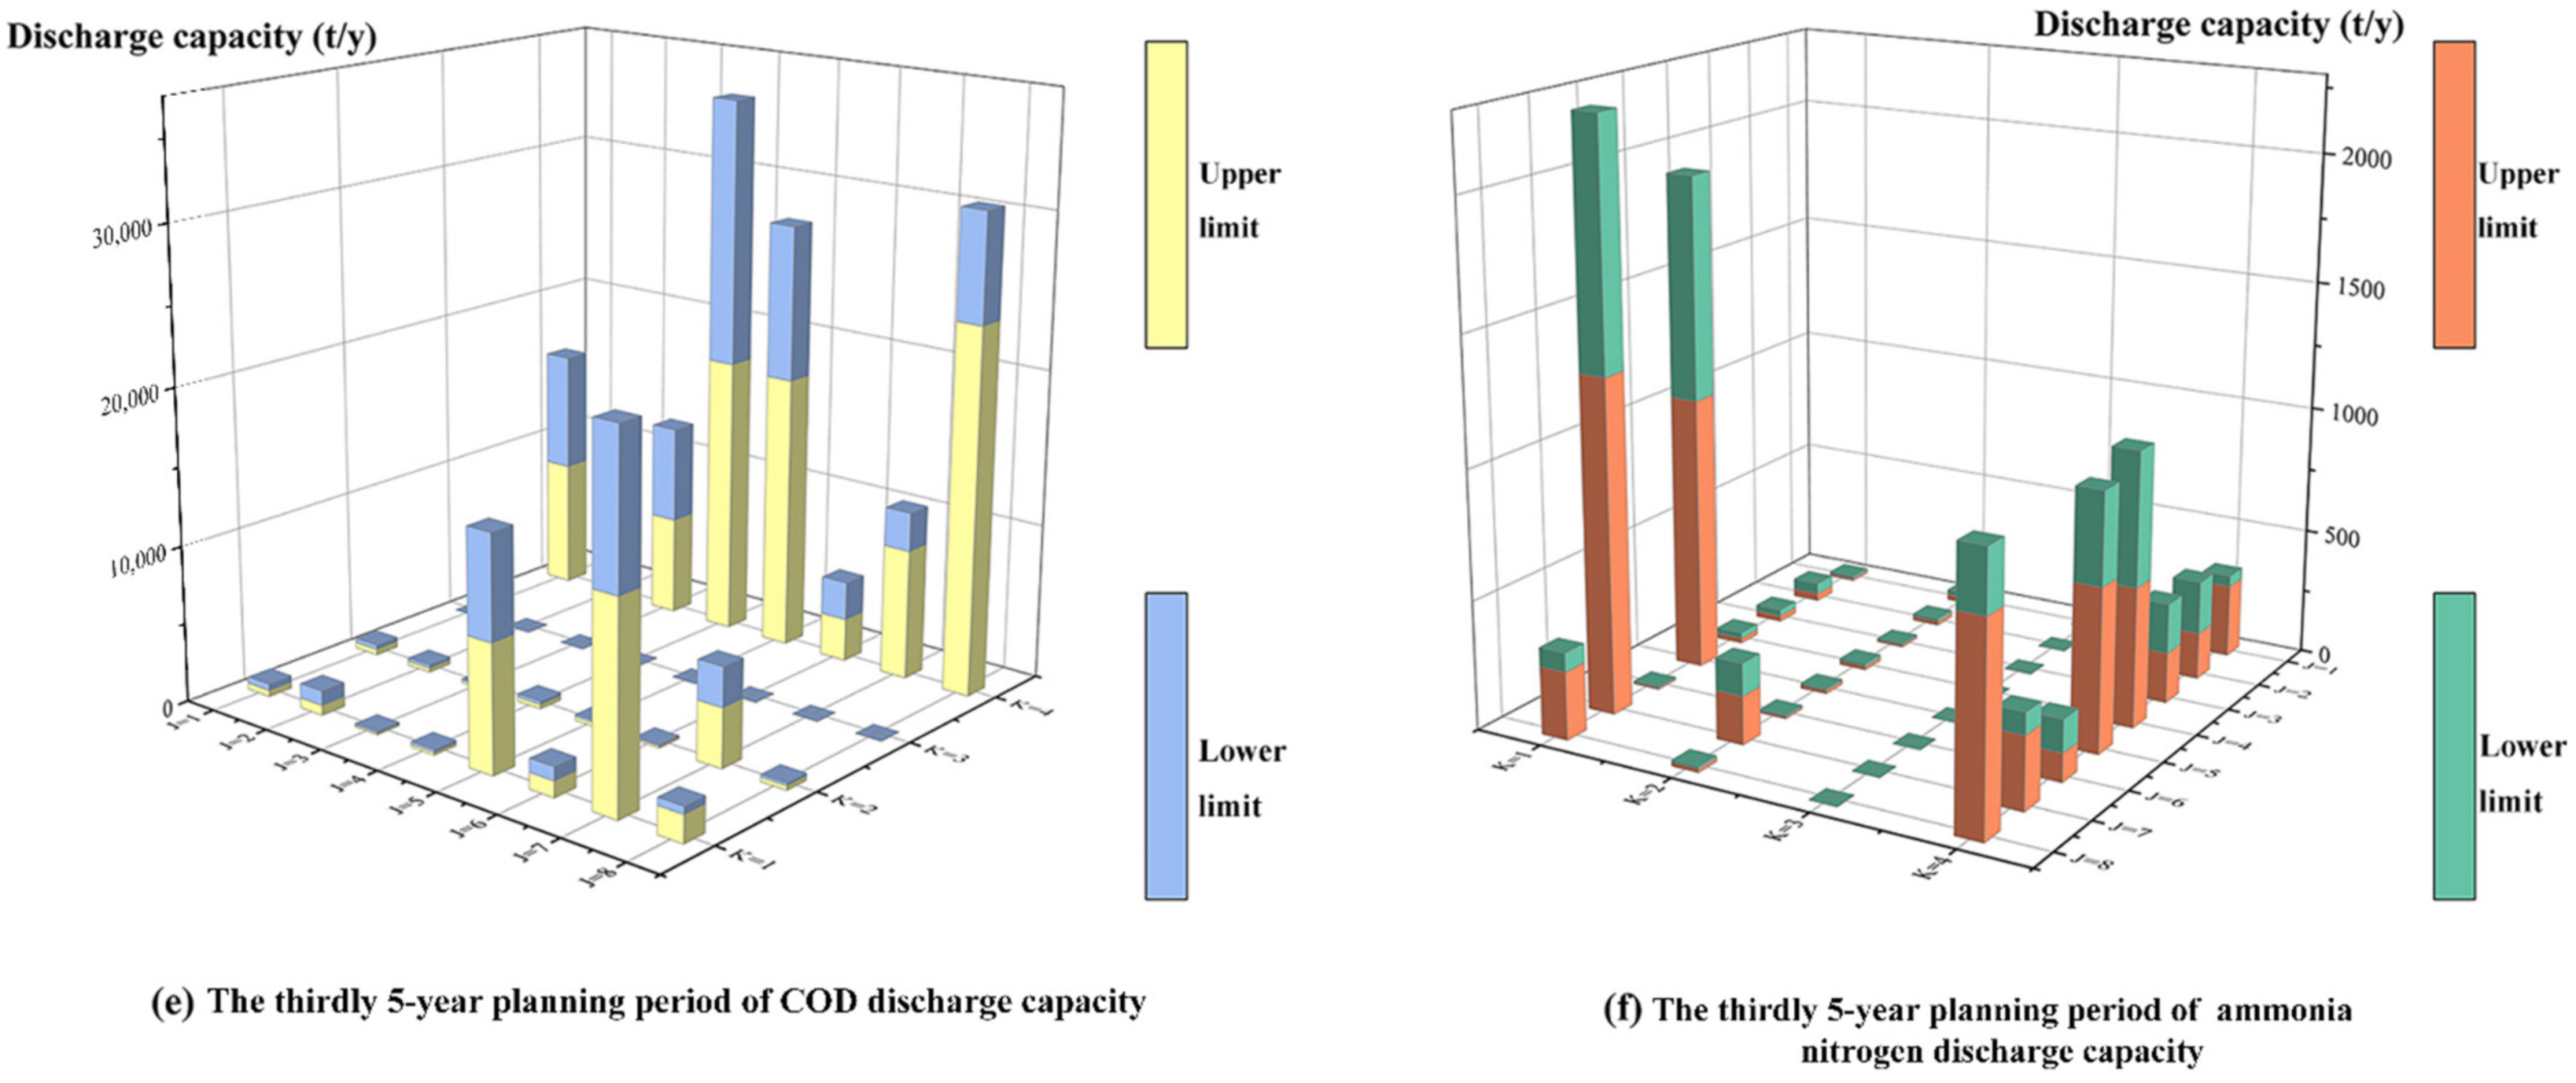
4.2.1. Analysis of Pollutant Discharge Variation in the Yinma River Basin Based on the ITSFR Optimization Method
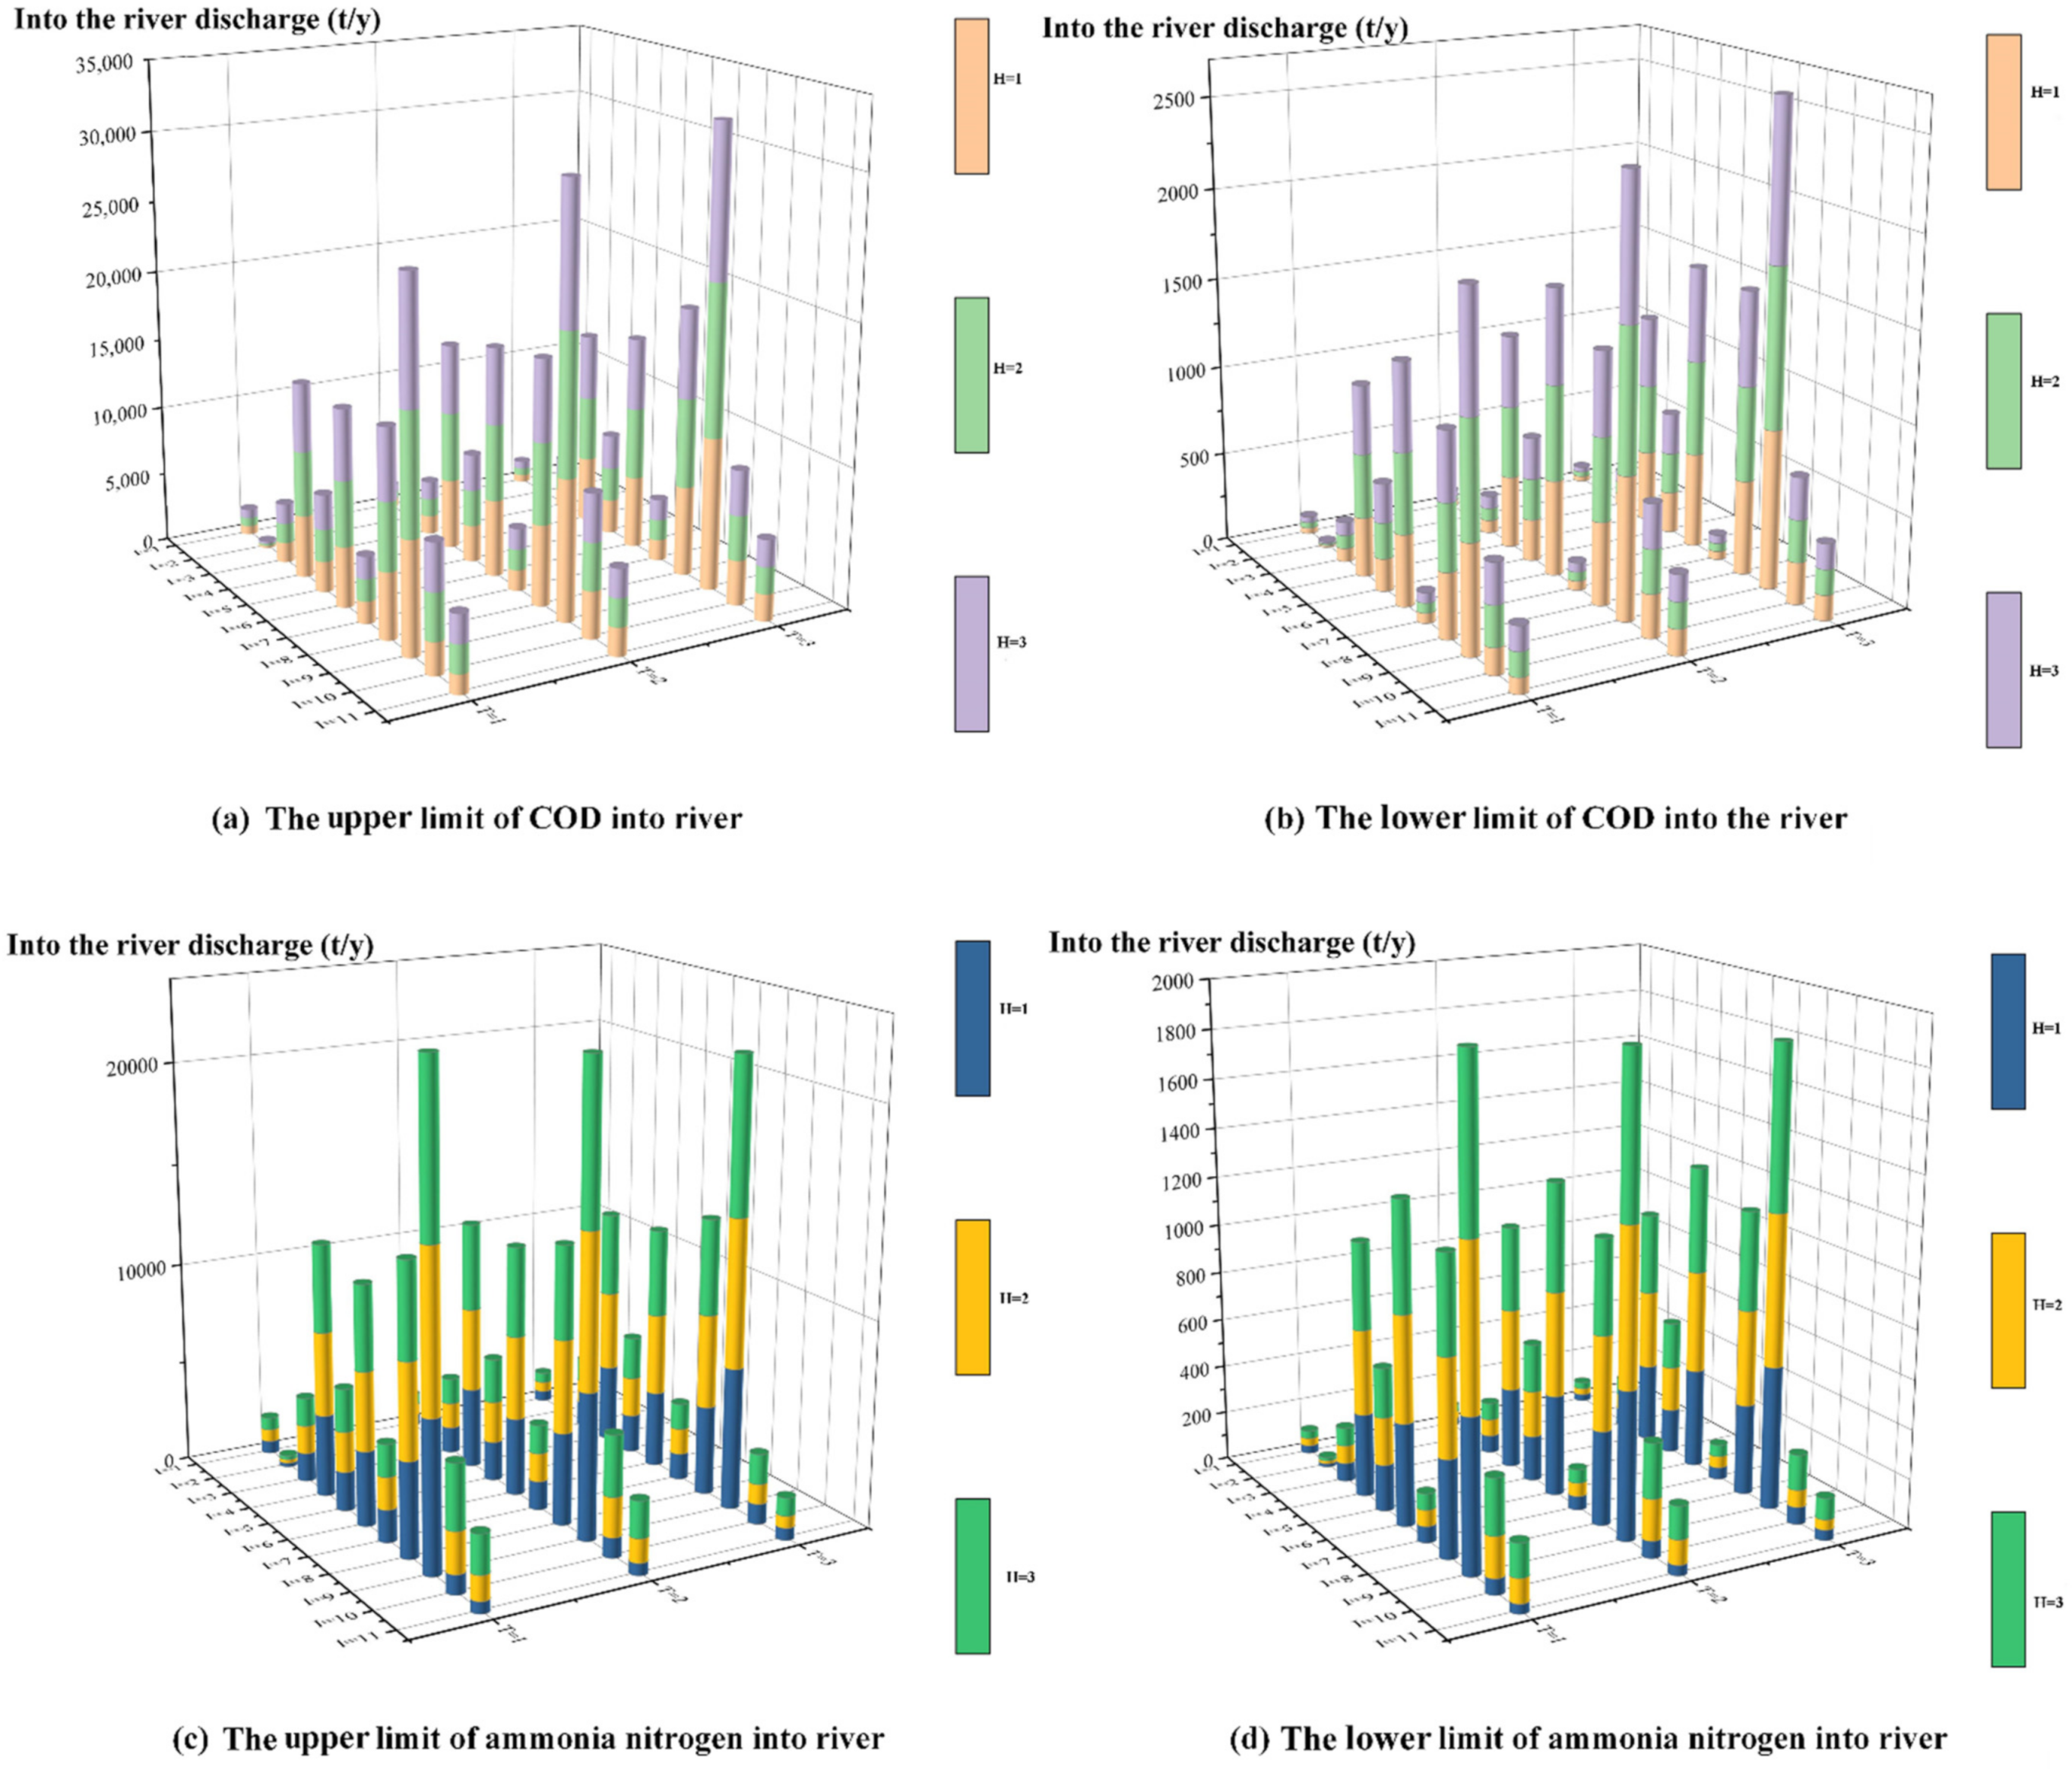
4.2.2. Analysis of the Variation of Pollution Indicators into the Yinma River Basin Based on the ITSFR Optimization Method
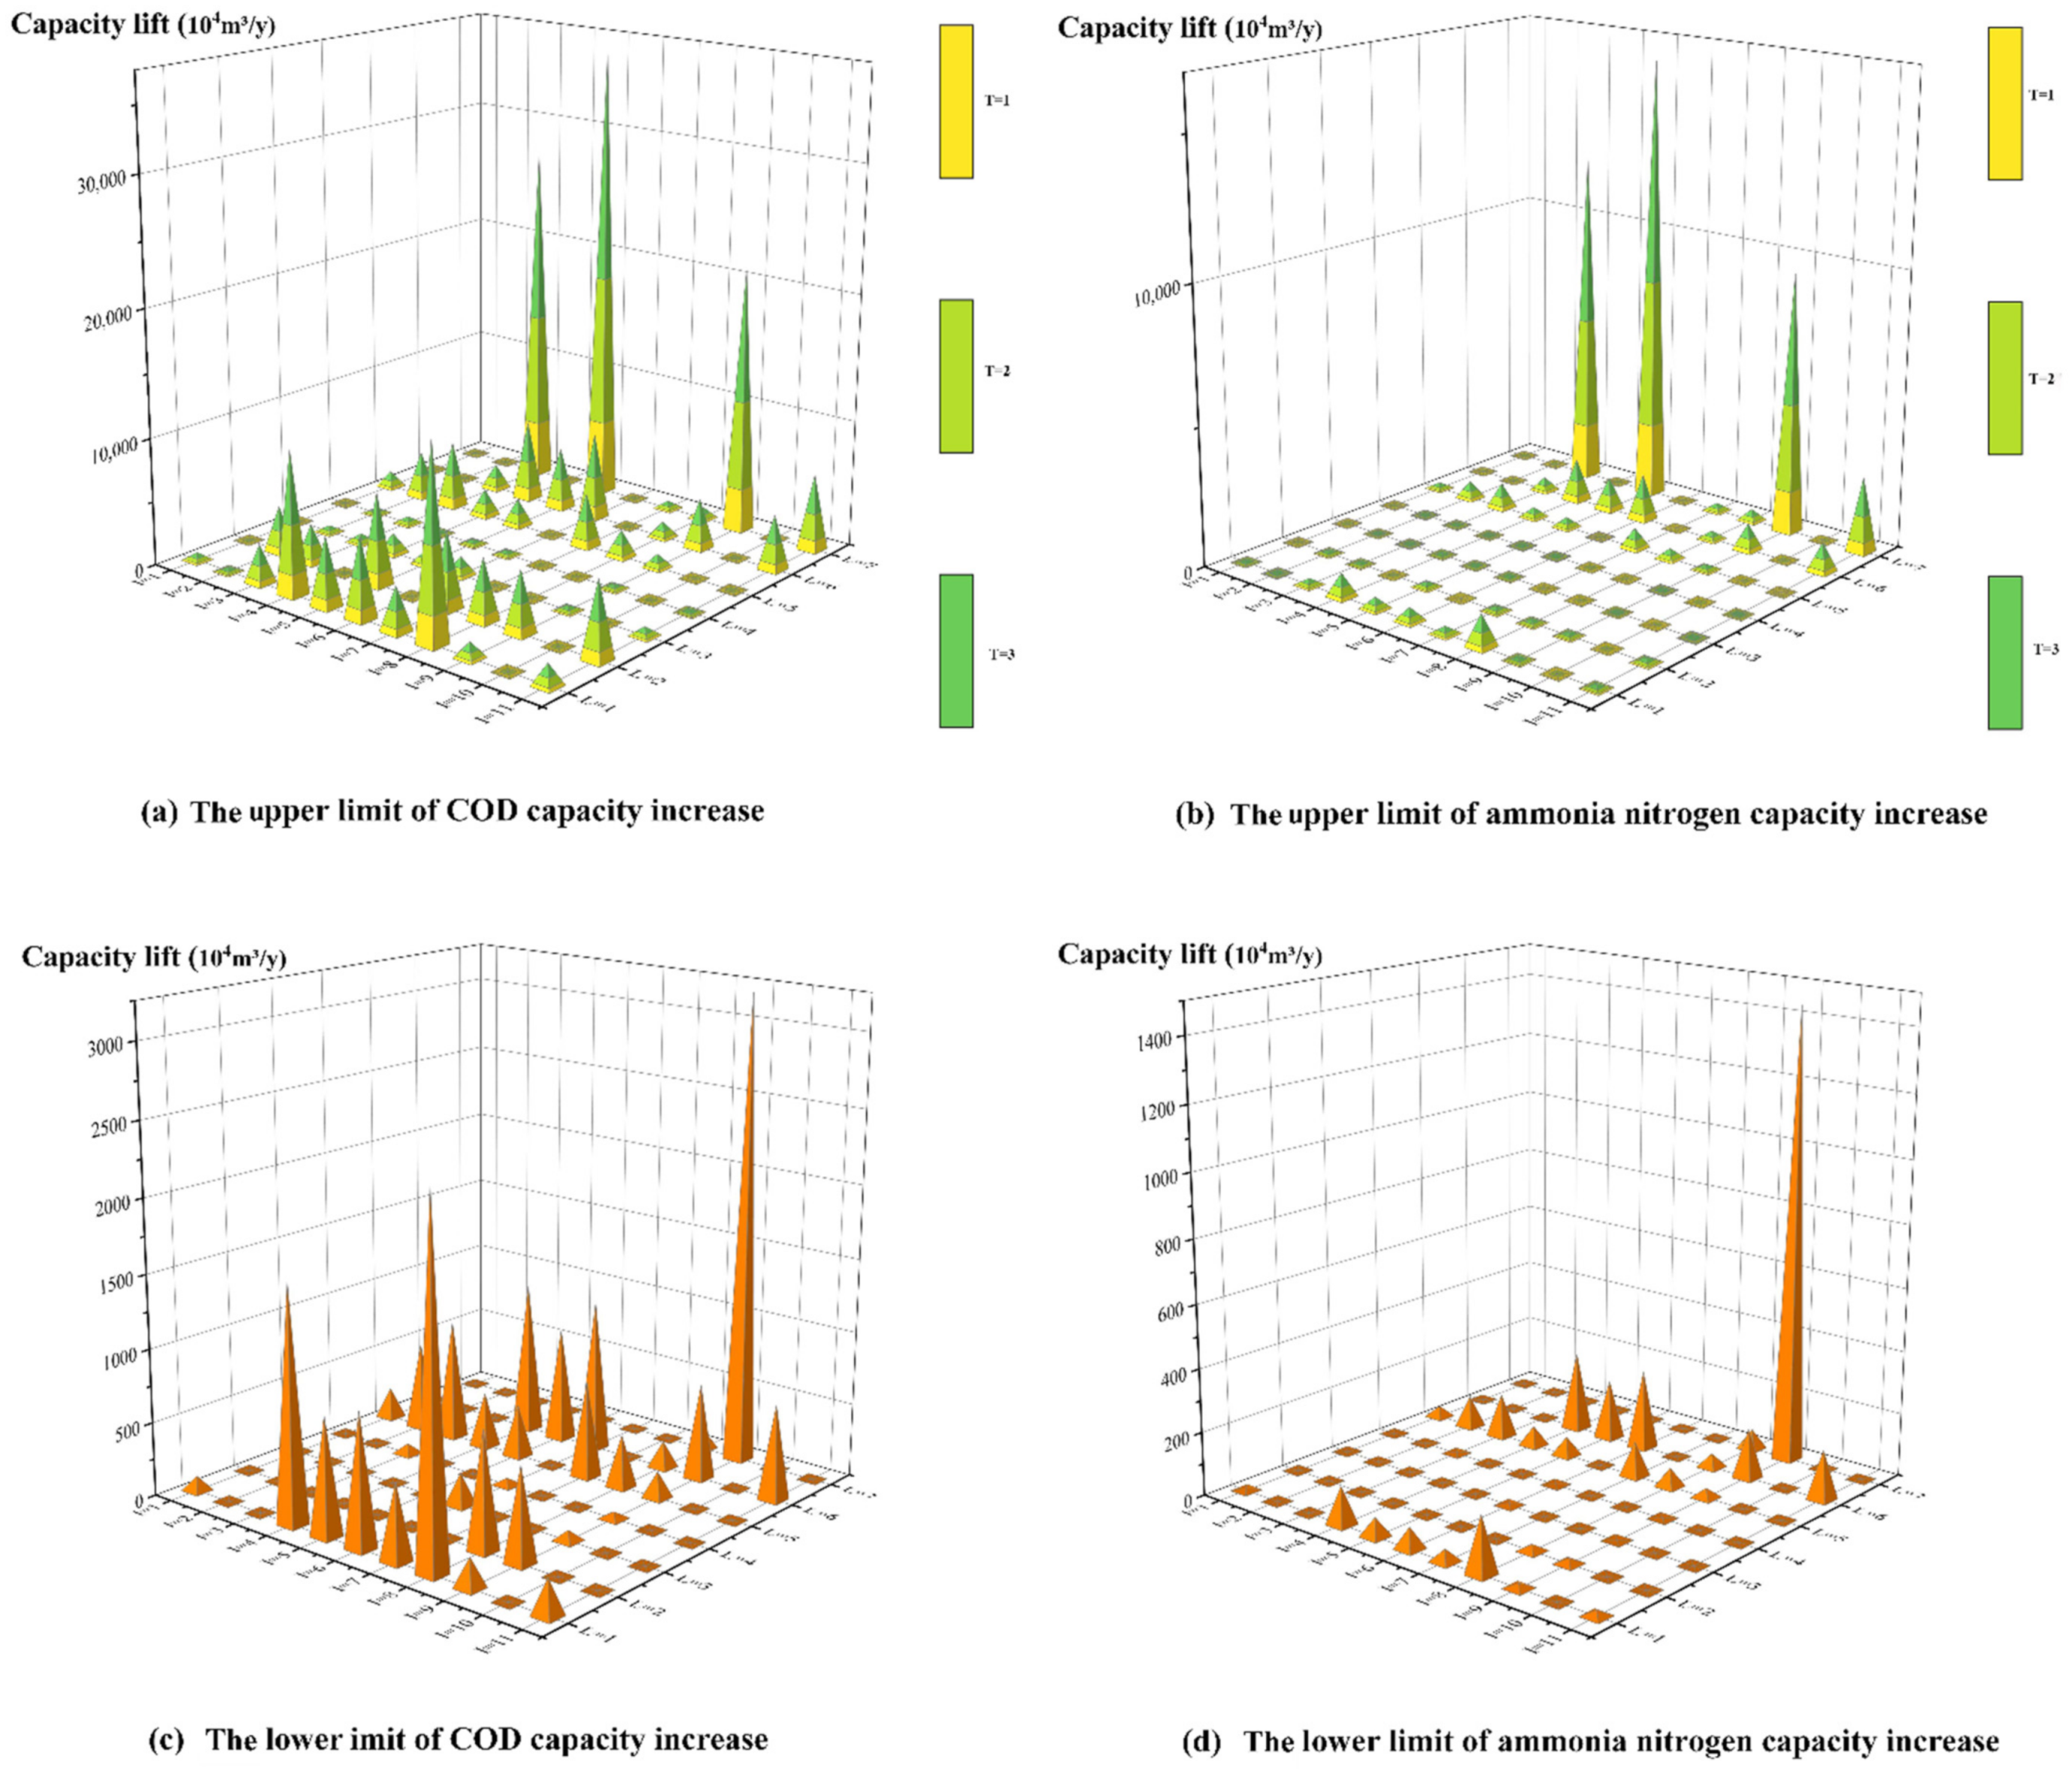
4.2.3. Analysis of Changes in the Yinma River Basin Capacity Enhancement Project Based on the ITSFR Optimization Method
4.2.4. Analysis of Capacity Improvement of Pollution Indicators in the Yinma River Basin Based on the ITSFR Optimization Method
4.3. Analysis of Changes in the Water Allocation Scheme Based on the ITSFR Optimization Method
4.3.1. Analysis of Changes in Water Allocation Based on the ITSFR Optimization Method
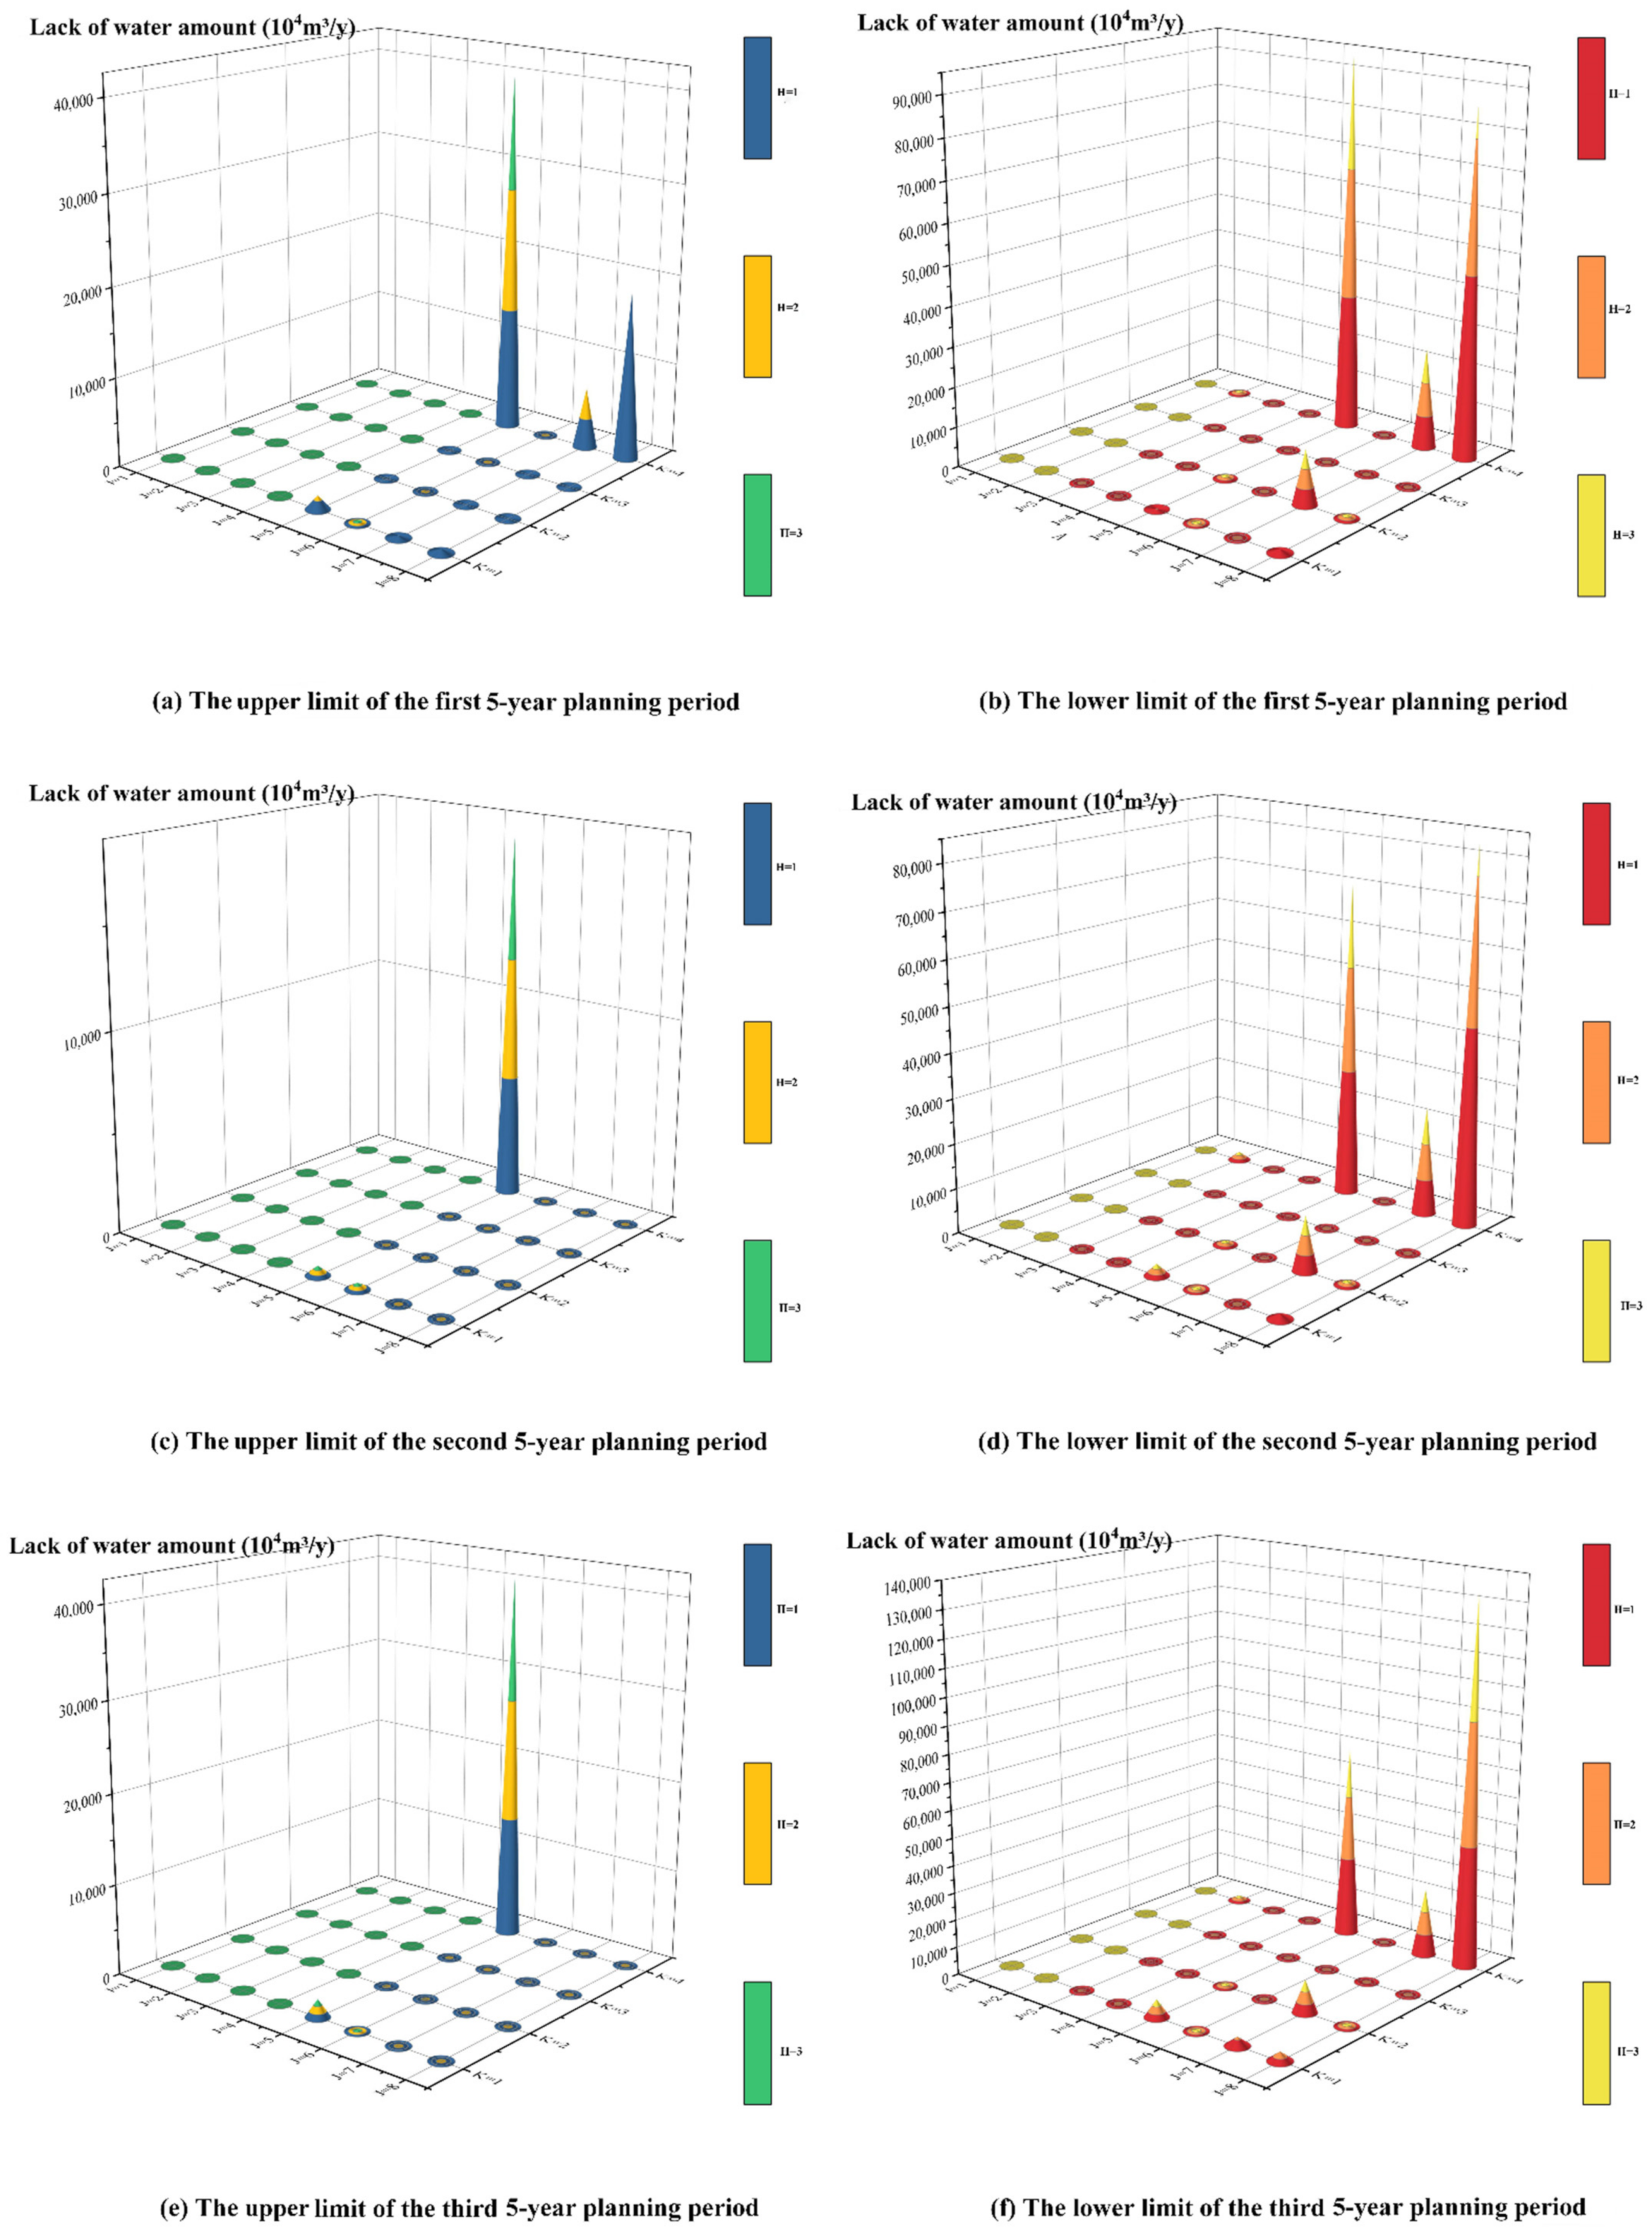
4.3.2. Analysis of Water Deficit Variation by Water-Use Sector in Each Planning Area Based on the ITSFR Optimization Method
4.3.3. Reused Water Allocation of Different Water Sectors in Each Planning Area Based on the ITSFR Optimization Method
5. Conclusions
Author Contributions
Funding
Institutional Review Board Statement
Informed Consent Statement
Data Availability Statement
Conflicts of Interest
Abbreviations
| The membership degree interval of the model. | |
| The economic benefit of ITSR model | |
| Income from water use | |
| Cost of water use | |
| Sewage treatment cost | |
| Pollutant-carrying capacity increases project cost | |
| ,, | Control the cost of punishment |
| Planning area | |
| Departments that use water | |
| Planning periods | |
| The available discharge level of the Yinma River Basin | |
| Length of a period, with each period being five-year long | |
| The unit water resource income of each water-use department | |
| The water shortage loss of each water-use department k in area j in period t (104 yuan/104 m3) | |
| The occurrence probability of scenario | |
| The amount of water resources supplied in advance by the Yinma River Basin to department in area in period (104 m3/year) | |
| The amount of reused water used by department in area in period | |
| The lack of water in the Yinma River Basin at level in period because it does not meet the water resource distribution plan of department in area (104 m3/year) | |
| The water resources use cost of each water-use department in area in period (104 yuan/104 m3) | |
| The cost of water reusing for all water-use departments k in area in period t (104 yuan/104 m3) | |
| The cost of sewage treatment for all water-use departments k in area in period (104 yuan/104 m3) | |
| The cost of water reuse for all water-use departments k in area in period (104 yuan/104 m3) | |
| The 11 water environment control units divided for the Yinma River Basin | |
| The controlled water pollutant | |
| Pollutant-carrying capacity improvement project | |
| The maximum quantity restriction for project in units in period | |
| 0–1 planning parameters, with 0 signifying that project is not implemented and 1 signifying that project is implemented | |
| The engineering cost of pollution capacity improvement project of each control unit in period | |
| The wastewater emission coefficient for department in period in area | |
| The robust coefficient, the values are 0, 0.8, and 1 | |
| Relaxation variable | |
| The amount of available water resources under level of period (104 m3/year) | |
| The lowest water consumption quota of various water-use departments k in area j in period t (104 yuan/104 m3) | |
| The highest water consumption quota of various water-use departments k in area in period (104 yuan/104 m3) | |
| The capacity of sewage treatment of department in period in area (104 tonnes/year) | |
| The reuse rate of a water department | |
| The sewage discharge coefficient of water-use department in area in period | |
| The pollutant discharge concentration of the wastewater produced by each water-use department after centralized treatment in period (tonnes/104 m3) | |
| The maximum total amount of pollutants in area in period (tonnes/year) | |
| The inflow coefficient of pollutants discharged by each water-use department k in period | |
| The discharge coefficient of area to water environment control unit | |
| The pollutant-carrying capacity of at level in period (tonnes/year) | |
| The capacity to enhance the pollutant discharge of the control unit through the pollutant-carrying capacity improvement project in period (tonnes/year) |
References
- Barber, L.B.; Hladik, M.L.; Vajda, A.M.; Fitzgerald, K.C.; Douville, C. Impact of wastewater infrastructure upgrades on the urban water cycle: Reduction in halogenated reaction byproducts following conversion from chlorine gas to ultraviolet light disinfection. Sci. Total Environ. 2015, 529, 264–274. [Google Scholar] [CrossRef]
- Lofrano, G.; Libralato, G.; Acanfora, F.G.; Pucci, L.; Carotenuto, M. Which lesson can be learnt from a historical contamination analysis of the most polluted river in Europe? Sci. Total Environ. 2015, 524–525, 246–259. [Google Scholar] [CrossRef]
- Qin, H.P.; Su, Q.; Khu, S.T. Assessment of environmental improvement measures using a novel integrated model: A case study of the Shenzhen River catchment, China. J. Environ. Manag. 2013, 114, 486–495. [Google Scholar] [CrossRef]
- Huang, Y.; Zhou, B.; Han, R.; Lu, X.; Li, S.; Li, N. China’s industrial gray water footprint assessment and implications for investment in industrial wastewater treatment. Environ. Sci. Pollut. Res. Int. 2020, 27, 7188–7198. [Google Scholar] [CrossRef] [PubMed]
- Neal, C.; Jarvie, H.P.; Neal, M.; Love, A.J.; Hill, L.; Wickham, H. Water quality of treated sewage effluent in a rural area of the upper Thames Basin, southern England, and the impacts of such effluents on riverine phosphorus concentrations. J. Hydrol. 2005, 304, 103–117. [Google Scholar] [CrossRef]
- Wu, H.; Yang, W.; Yao, R.; Zhao, Y.; Zhao, Y.; Zhang, Y.; Yuan, Q.; Lin, A. Evaluating surface water quality using water quality index in Beiyun River, China. Environ. Sci. Pollut. Res. Int. 2020, 27, 35449–35458. [Google Scholar] [CrossRef]
- Zou, L.; Li, H.; Wang, S.; Zheng, K.; Wang, Y.; Du, G.; Li, J. Characteristic and correlation analysis of influent and energy consumption of wastewater treatment plants in Taihu Basin. Front. Environ. Sci. Eng. 2019, 13, 83. [Google Scholar] [CrossRef]
- Najafzadeh, M.; Ghaemi, A. Prediction of the five-day biochemical oxygen demand and chemical oxygen demand in natural streams using machine learning methods. Environ. Monit. Assess. 2019, 191, 380. [Google Scholar] [CrossRef] [PubMed]
- Najafzadeh, M.; Ghaemi, A.; Emamgholizadeh, S. Prediction of water quality parameters using evolutionary computing-based formulations. Int. J. Environ. Sci. Technol. 2018, 16, 6377–6396. [Google Scholar] [CrossRef]
- Aiqing, K.; Li, J.; Lei, X.; Ye, M. Optimal Allocation of Water Resources Considering Water Quality and the Absorbing Pollution Capacity of Water. Water Resour. 2020, 47, 336–347. [Google Scholar] [CrossRef]
- Muga, H.E.; Mihelcic, J.R. Sustainability of wastewater treatment technologies. J. Environ. Manag. 2008, 88, 437–447. [Google Scholar] [CrossRef] [PubMed]
- Sun, Y.; Liu, N.; Shang, J.; Zhang, J. Sustainable utilization of water resources in China: A system dynamics model. J. Clean. Prod. 2017, 142, 613–625. [Google Scholar] [CrossRef]
- Di, H.; Liu, X.; Zhang, J.; Tong, Z.; Ji, M. The Spatial Distributions and Variations of Water Environmental Risk in Yinma River Basin, China. Int. J. Environ. Res. Public Health 2018, 15, 521. [Google Scholar] [CrossRef] [Green Version]
- Ju, H.; Li, S.; Xu, Y.; Zhang, G.; Zhang, J. Intensive Livestock Production Causing Antibiotic Pollution in the Yinma River of Northeast China. Water 2019, 11, 2006. [Google Scholar] [CrossRef] [Green Version]
- Ju, H.; Zhang, J.; Sun, C. Occurrence, spatial distribution and risk and hazard assessments of antibiotics in drinking water sources of a polluted large river basin in China. Aquat. Ecosyst. Health Manag. 2018, 21, 107–117. [Google Scholar] [CrossRef]
- Gao, Y.Y.; Xu, X.Y.; Yin, X.L. Summary on River Basin Water Resources Allocation Practice and Institutional Arrangements of China. Appl. Mech. Mater. 2012, 212–213, 489–492. [Google Scholar] [CrossRef]
- Meng, C.; Wang, X.; Li, Y. An Optimization Model for Water Management Based on Water Resources and Environmental Carrying Capacities: A Case Study of the Yinma River Basin, Northeast China. Water 2018, 10, 565. [Google Scholar] [CrossRef] [Green Version]
- Qi, Z.; Xiao, C.; Zhang, B.; Liang, X. Generalized Index of Regional Socio-economic Consumption Level of Water Resource. J. Water Supply Res. Technol. Aqua 2020, 69, 113–121. [Google Scholar] [CrossRef]
- Souza da Silva, G.N.; de Moraes, M.M.G.A. Economic water management decisions: Trade-offs between conflicting objectives in the sub-middle region of the São Francisco watershed. Reg. Environ. Chang. 2018, 18, 1957–1967. [Google Scholar] [CrossRef]
- Guo, S.; Zhang, F.; Zhang, C.; Wang, Y.; Guo, P. An improved intuitionistic fuzzy interval two-stage stochastic programming for resources planning management integrating recourse penalty from resources scarcity and surplus. J. Clean. Prod. 2019, 234, 185–199. [Google Scholar] [CrossRef]
- Yang, L.; Cong, W.; Meng, C.; Cai, B.; Liu, M. An Interval Fuzzy, Double-Sided, Chance-Constrained Stochastic Programming Model for Planning the Ecological Service Value of Interconnected River Systems. Water 2020, 12, 2649. [Google Scholar] [CrossRef]
- He, W.; Yang, L.; Li, M.; Meng, C.; Li, Y. Application of an Interval Two-Stage Robust (ITSR) Optimization Model for Optimization of Water Resource Distribution in the Yinma River Basin, Jilin Province, China. Water 2020, 12, 2910. [Google Scholar] [CrossRef]
- Liu, B.D.; Iwamura, K. Fuzzy programming with fuzzy decisions and fuzzy simulation-based genetic algorithm. Fuzzy Sets Syst. 2001, 122, 253–262. [Google Scholar] [CrossRef]
- Li, Y.P.; Huang, G.H.; Nie, X.H.; Nie, S.L. An Inexact Fuzzy-robust Two-stage Programming Model for Managing Sulfur Dioxide Abatement Under Uncertainty. Environ. Model. Assess. 2007, 13, 77–91. [Google Scholar] [CrossRef]
- Zhen, J.L.; Huang, G.H.; Li, W.; Wu, C.B.; Wang, S. Electric power system planning with renewable energy accommodation for supporting the sustainable development of Tangshan City, China. J. Clean. Prod. 2016, 139, 1308–1325. [Google Scholar] [CrossRef]
- Li, W.; Liu, M.; Wu, S.Z.; Xu, Y. An inexact optimization model associated with two robust programming approaches for water resources management. Int. J. Environ. Sci. Technol. 2014, 12, 2401–2414. [Google Scholar] [CrossRef] [Green Version]
- Sun, Y.; Li, Y.P.; Huang, G.H. A queuing-theory-based interval-fuzzy robust two-stage programming model for environmental management under uncertainty. Eng. Optim. 2012, 44, 707–724. [Google Scholar] [CrossRef]
- Chen, Y.; Zhang, J.; Zhang, F.; Liu, X.; Zhou, M. Contamination and health risk assessment of PAHs in farmland soils of the Yinma River Basin, China. Ecotoxicol. Environ. Saf. 2018, 156, 383–390. [Google Scholar] [CrossRef] [PubMed]
- Guan, J.; Wang, J.; Pan, H.; Yang, C.; Qu, J.; Lu, N.; Yuan, X. Heavy metals in Yinma River sediment in a major Phaeozems zone, Northeast China: Distribution, chemical fraction, contamination assessment and source apportionment. Sci. Rep. 2018, 8, 12231. [Google Scholar] [CrossRef] [Green Version]
- Li, S.; Zhang, J.; Guo, E.; Zhang, F.; Ma, Q.; Mu, G. Dynamics and ecological risk assessment of chromophoric dissolved organic matter in the Yinma River Watershed: Rivers, reservoirs, and urban waters. Environ. Res. 2017, 158, 245–254. [Google Scholar] [CrossRef]
- Zhang, F.; Liu, X.; Zhang, J.; Wu, R.; Ma, Q.; Chen, Y. Ecological vulnerability assessment based on multi-sources data and SD model in Yinma River Basin, China. Ecol. Model. 2017, 349, 41–50. [Google Scholar] [CrossRef]
- Ma, B.; Zheng, J.; Lei, G.; Zhu, J.; Guo, Y.; Wu, J. A Robust Design Optimization Method for Electromagnetic Devices with Interval Uncertainties. IEEE Trans. Magn. 2018, 54, 1–4. [Google Scholar] [CrossRef]
- Chen, J.; Köbis, E.; Yao, J.-C. Optimality Conditions and Duality for Robust Nonsmooth Multiobjective Optimization Problems with Constraints. J. Optim. Theory Appl. 2018, 181, 411–436. [Google Scholar] [CrossRef]


| Scenario | ITSR | ITSFR |
|---|---|---|
| h = 1 | [84,696.3778, 112,359.3469] | [100,397.5555, 112,272.6977] |
| h = 2 | [93,401.4222, 113,072.7597] | [104,170.1354, 112,985.4470] |
| h = 3 | [99,662.9147, 113,332.1733] | [106,187.6088, 113,244.8058] |
| Sectors | h = 1 | h = 2 | h = 3 |
|---|---|---|---|
| Industrial | [573.60, 758.00] | [768.80, 1089.00] | [1047.37, 1047.37] |
| Municipal | [1380.00, 1736.00] | [1387.20, 1754.00] | [1393.60, 1771.00] |
| Ecological | [396.00, 498.00] | [435.00, 572.40] | [479.00, 657.60] |
| Agricultural | [20,727.00, 21,945.00] | [20,748.00, 22,250.00] | [21,301.00, 23,461.00] |
| Industrial | [222.00, 222.00] | [311.00, 311.00] | [287.20, 427.00] |
| Municipal | [1110.97, 1341.00] | [1062.40, 1362.00] | [1066.40, 1332.59] |
| Ecological | [304.00, 382.80] | [334.00, 439.20] | [368.00, 505.20] |
| Agricultural | [8939.00, 9465.00] | [8949.00, 9597.00] | [9187.00, 9609.49] |
| Industrial | [772.00, 772.00] | [1244.00, 1244.00] | [1961.00, 1961.00] |
| Municipal | [641.60, 815.00] | [649.60, 836.00] | [658.40, 857.00] |
| Ecological | [182.00, 229.20] | [200.00, 264.00] | [221.00, 303.60] |
| Agricultural | [9116.00, 9487.00] | [9074.00, 9481.00] | [9430.00, 9980.00] |
| Industrial | [1738.09, 1806.00] | [2551.82, 2654.00] | [3651.80, 3800.00] |
| Municipal | [1121.60, 1416.00] | [1130.40, 1437.00] | [1138.40, 1459.00] |
| Ecological | [326.00, 410.40] | [366.00, 480.00] | [410.00, 561.60] |
| Agricultural | [26,298.00, 27,523.00] | [26,431.00, 27,905.00] | [27,734.00, 29,801.00] |
| Industrial | [4475.00, 4732.00] | [6144.00, 6144.00] | [8432.00, 8432.00] |
| Municipal | [1026.40, 1282.61] | [1032.00, 1289.61] | [1036.80, 1295.60] |
| Ecological | [300.00, 376.80] | [336.00, 440.40] | [376.00, 516.00] |
| Agricultural | [45,819.00, 45,819.00] | [46,051.00, 46,051.00] | [48,321.00, 48,321.00] |
| Industrial | [538.00, 538.00] | [610.00, 610.00] | [689.00, 689.00] |
| Municipal | [553.00, 641.45] | [440.80, 559.00] | [442.40, 564.00] |
| Ecological | [126.00, 157.20] | [138.00, 180.00] | [152.00, 204.00] |
| Agricultural | [12,696.00, 13,536.00] | [12,566.00, 13,921.00] | [12,792.00, 14,725.00] |
| Industrial | [11,165.68, 12,033.00] | [17,995.92, 18,062.16] | [24,922.75, 28,075.39] |
| Municipal | [16,685.10, 18,533.34] | [16,894.80, 19,295.00] | [17,107.20, 19,782.00] |
| Ecological | [5081.05, 5523.60] | [5072.00, 6628.80] | [5833.00, 7953.60] |
| Agricultural | [11,272.00, 11,272.00] | [11,329.00, 11,961.00] | [11,887.00, 12,774.00] |
| Industrial | [1035.90, 1291.00] | [1680.37, 1727.00] | [2200.93, 2269.00] |
| Municipal | [1109.60, 1386.58] | [1128.80, 1451.00] | [1148.80, 1495.00] |
| Ecological | [319.00, 400.80] | [357.00, 469.20] | [400.00, 548.40] |
| Agricultural | [61,958.00, 61,958.00] | [62,271.00, 65,744.00] | [65,342.00, 70,211.00] |
| Areas | Sectors | h = 1 | h = 2 | h = 3 |
|---|---|---|---|---|
| Panshi | Industrial | [184.40, 486.19] | [298.04, 320.20] | [481.64, 525.54] |
| Municipal | [0.00, 0.00] | [0.00, 0.00] | [0.00, 0.00] | |
| Ecological | [244.41, 407.58] | [474.42, 526.57] | [384.66, 527.05] | |
| Agricultural | [0.00, 0.00] | [0.00, 0.00] | [0.00, 0.00] | |
| Yongji | Industrial | [0.00, 278.03] | [0.00, 306.58] | [0.00, 339.29] |
| Municipal | [0.00, 0.00] | [0.00, 0.00] | [0.00, 0.00] | |
| Ecological | [0.00, 335.60] | [0.00, 393.04] | [0.00, 423.98] | |
| Agricultural | [0.00, 0.00] | [0.00, 0.00] | [0.00, 0.00] | |
| Shuangyang | Industrial | [0.00, 163.88] | [0.00, 189.07] | [0.00, 210.69] |
| Municipal | [0.00, 0.00] | [0.00, 0.00] | [0.00, 0.00] | |
| Ecological | [0.00, 208.17] | [0.00, 243.33] | [0.00, 274.24] | |
| Agricultural | [0.00, 0.00] | [0.00, 0.00] | [0.00, 0.00] | |
| Jiutai | Industrial | [67.91, 368.23] | [102.18, 448.46] | [148.20, 533.29] |
| Municipal | [0.00, 0.00] | [0.00, 0.00] | [0.00, 0.00] | |
| Ecological | [0.00, 361.67] | [0.00, 418.25] | [0.00, 466.88] | |
| Agricultural | [0.00, 0.00] | [0.00, 0.00] | [0.00, 0.00] | |
| Dehui | Industrial | [0.00, 0.00] | [0.00, 0.00] | [0.00, 0.00] |
| Municipal | [0.00, 0.00] | [0.00, 0.00] | [0.00, 0.00] | |
| Ecological | [327.60, 177.96] | [206.62, 375.35] | [242.27, 414.59] | |
| Agricultural | [0.00, 0.00] | [0.00, 0.00] | [0.00, 0.00] | |
| Yitong | Industrial | [0.00, 0.00] | [0.00, 0.00] | [0.00, 0.00] |
| Municipal | [0.00, 0.00] | [0.00, 0.00] | [0.00, 0.00] | |
| Ecological | [124.09, 143.94] | [115.25, 146.15] | [130.24, 166.04] | |
| Agricultural | [0.00, 0.00] | [0.00, 0.00] | [0.00, 0.00] | |
| Changchun | Industrial | [0.00, 2615.72] | [39.06, 1317.84] | [0.00, 2243.61] |
| Municipal | [0.00, 0.00] | [0.00, 0.00] | [0.00, 0.00] | |
| Ecological | [1548.07, 4733.79] | [4972.06, 5672.73] | [5877.43, 6330.24] | |
| Agricultural | [0.00, 0.00] | [0.00, 0.00] | [0.00, 0.00] | |
| Nongan | Industrial | [0.00, 0.00] | [0.00, 46.63] | [0.00, 68.07] |
| Municipal | [0.00, 0.00] | [0.00, 0.00] | [0.00, 0.00] | |
| Ecological | [208.40, 354.16] | [253.08, 426.59] | [305.35, 478.40] | |
| Agricultural | [0.00, 0.00] | [0.00, 0.00] | [0.00, 0.00] |
Publisher’s Note: MDPI stays neutral with regard to jurisdictional claims in published maps and institutional affiliations. |
© 2021 by the authors. Licensee MDPI, Basel, Switzerland. This article is an open access article distributed under the terms and conditions of the Creative Commons Attribution (CC BY) license (https://creativecommons.org/licenses/by/4.0/).
Share and Cite
Zhang, H.; He, W.; Xu, H.; Yang, H.; Ren, Z.; Yang, L.; Sun, P.; Deng, Z.; Li, M.; Wang, S.; et al. Investigating a Water Resource Allocation Model by Using Interval Fuzzy Two-Stage Robust Planning for the Yinma River Basin, Jilin Province, China. Water 2021, 13, 2974. https://doi.org/10.3390/w13212974
Zhang H, He W, Xu H, Yang H, Ren Z, Yang L, Sun P, Deng Z, Li M, Wang S, et al. Investigating a Water Resource Allocation Model by Using Interval Fuzzy Two-Stage Robust Planning for the Yinma River Basin, Jilin Province, China. Water. 2021; 13(21):2974. https://doi.org/10.3390/w13212974
Chicago/Turabian StyleZhang, Hao, Wei He, Haihong Xu, Hao Yang, Zhixing Ren, Luze Yang, Peixuan Sun, Zhengyang Deng, Minghao Li, Shengping Wang, and et al. 2021. "Investigating a Water Resource Allocation Model by Using Interval Fuzzy Two-Stage Robust Planning for the Yinma River Basin, Jilin Province, China" Water 13, no. 21: 2974. https://doi.org/10.3390/w13212974