
Comprehensive Regulation Benefits of Hydropower Generation System in Reducing Wind Power Fluctuation

1
Powerchina Northwest Engineering Corporation Limited, Xi’an 710065, China
2
Institute of Water Resources and Hydropower Research, Northwest A&F University, Yangling District, Xianyang 712100, China
3
School of Electric Power, North China University of Water Resources and Electric Power, No. 36, Beihuan Road, Zhengzhou 450000, China
*
Author to whom correspondence should be addressed.
†
Mailing Address: School of Electric Power, North China University of Water Resources and Electric Power, No. 36, Beihuan Road, Zhengzhou 450000, China.
Water 2021, 13(21), 2987; https://doi.org/10.3390/w13212987
Submission received: 27 July 2021
/
Revised: 1 October 2021
/
Accepted: 5 October 2021
/
Published: 22 October 2021
(This article belongs to the Special Issue Hydraulic Transient of Hydropower Station and Pump Station)
Abstract
:The use of renewable energy has become a necessity to generate electricity, and is taking the place of conventional coal-fired power, as it has clear economic and environmental benefits. The purpose of this paper is to quantify the comprehensive benefits of hydropower in reducing wind power fluctuation in a hybrid coal-fired/hydro/wind power system. To achieve this, a wind–hydropower generation system must be established, and its complementary characteristic is also illustrated based on the resultant wind speed. Then, based on Institute of Electrical and Electronics Engineers (IEEE) 14 Bus Power System, coal-fired generation is introduced to model a final hybrid integrated power system. The comprehensive benefit evaluation method, including the power consumption profit, the peak load profit, the energy conservation profit, the guide vane fatigue cost, the maintenance cost, and the start-stop cost, is presented to assess the join operation benefits of the wind/hydropower/coal-fired integrated system. The complementary investigation shows that the hydropower system has an excellent effect on suppressing wind power fluctuation, although the fatigue damage of hydraulic guide vanes is a little severe for the time scale of hours, compared with that of seconds. The quantified benefit shows that the increased power consumption profit, the increased guide vane fatigue loss cost, the decreased peak-load profit, and the increased energy conservation profit are RMB 1262.43 million/year, RMB 0.37 million/year, RMB 333.97 million/year and RMB 0.54 million/year, with the wind and hydropower ratio increasing from 16% to 25%, which directly leads to the annual total revenue increasing to RMB 143.2673 million. The implementation of this paper can contribute to making more efficient use of wind-hydro power in conventional electricity production.
1. Introduction
Global demand for electricity is expected to double by 2050, and thus, providing the electricity needs of the cumulatively increasing population has become a critical challenge for the regional energy power systems in the world [1]. To date, 70% of the world’s electricity is produced by burning fossil fuels [2]. There exists a larger amount of greenhouse gases (GHG) in power generation, which is inconsistent with the energy development goal of low-carbon emission reduction. To cope with this severe challenge, renewable energy (e.g., wind, solar and water energy) plays a vital role in electricity production, transmission and consumption [3,4]. Indeed, these sources are the fastest-growing ones in the electricity sector, with expectations of a 2.9% per year increase between 2012 and 2040 [5,6]. However, wind or solar power is an intermittent energy, with strong randomness and instability, which creates challenges for the stable operation of the power system [7,8]. Water resource is a kind of clean and renewable energy, which has the ability to meet the basic needs of irrigation, electrical generation, etc. [9]. As the largest producer of renewable energy, hydropower is an important mean to adjust the fluctuation of intermittent energy due to its flexibility operation, so as to maximize the comprehensive benefit. Therefore, it is urgent and necessary to focus on the complementary operation of the multiple renewable energy mix to improve the energy utilization efficiency.
Both wind and solar energy have large reserves, whereas its electric power is difficult to predict accurately due to the influence of environmental and meteorological uncertainty [10,11]. The uncertainty characteristic of the wind and solar power pose an enormous challenge for injecting into the power grid [12,13]. To tackle this problem, the energy storage equipment (ESE) attracts all attentions of the stakeholder in the field of energy power systems, including scholars, energy planners, electricity investors, energy companies, and governments [14,15]. Currently, the ESE mainly involves three patterns, including the electromagnetic energy storage (e.g., superconducting energy storage technology [16], capacitor energy storage technology [17], and super-capacitor energy storage technology [18]), the electrochemical energy storage (e.g., energy storage battery [19]), and the mechanical energy storage (e.g., hydropower generation system [20,21], compressed air regulation system [22], and flywheel energy regulation system [23]). Among them, the hydropower generation system (HGS) is considered the most flexible, economic and reliable technology, which is able to be applied in the large-scale power grid, owing to its good voltage regulation ability [24,25].
The HGS mainly comprises the upstream reservoir, the downstream reservoir, the pipeline, the PID control system, and the hydraulic generating unit [26], which control the water level of the reservoir to achieve the regulation goal of balancing the intermittent energy injection [27]. The existing of the HGS not only increases the reliability of the grid-connected power system, but also enhances the environmental and economic benefits [28]. The benefits of the HGS are [29,30]:
- The increasing penetration of the HGS compresses the coal-fired power scale, and this promotes the reduction of GHG emissions. This benefits environmental development.
- Based on the excellent regulation of peak modulation, frequency modulation and voltage modulation, the HGS increases the grid-connected success probability of multiple energy integration and greatly cuts the operation cost. This benefits the economic operation.
- Owing to the stability and controllability properties of the hydropower, the participation of the HGS complements the power fluctuation of the intermittent energy and reduces the energy curtailments, which improves the reliability of the power supply. This benefits the end use.
Despite these benefits, there still exists a challenge of how to quantify the total benefits of the HGS on the integrated power system. Based on this, there is some research used to share valuable ideas. Xiao et al. [31] presented the benefit evaluation model for a wind–hydropower hybrid system, whereas it ignored the suppressing cost caused by the hydropower regulation. Castronuovo et al. [32] investigated the optimization of the daily operation of a wind-hydro power plant by considering the time-of-use electricity price, however, this work lacked the quantification of wind-hydropower complementary benefit. Moreover, the different complementary scenarios were not included. Yao et al. [33] focused on the benefit quantification of the wind power and seawater hydropower hybrid system, but the effect of the seawater hydropower quota on the economic benefit of the power station was not involved. Zhang et al. [34] and Katsaprakakis et al. [35] reviewed design and operation challenges of the multi-energy complementary system on islanded micro-grids, but the environmental and economic benefits were not considered. Arce et al. [36] aimed to establish a new wind-hydro power-integrated model, and it lacked the analysis of the complementary characteristics and the benefit quantification.
In light of the above considerations, this work is concerned more with the complementary effect of the HGS in balancing wind power fluctuations, as well as the quantification of comprehensive regulation benefits in different industrial processes, including the construction process, the complementary operation process, the power consumption process, and the maintenance process. The innovations of this work include:
- Aiming to describe the property of the wind speed, a resultant wind speed model is presented to achieve the joint operation of the wind-hydro hybrid power system. Then, the final model is established by considering the practice of coal-fired generation in IEEE 14 Bus Power System.
- Based on the presented coal-fired/wind/hydropower-integrated system, the comprehensive benefit evaluation method is presented. This method focuses on quantifying the complementary effect of the hybrid power system from the perspective of the fatigue damage of hydraulic guide vanes.
- To reveal the suppressing effect of hydropower on grid power fluctuations due to wind power injection, this work investigates the complementary performance from second and hour time-scales. The obtained frequency and power responses also reflect the reliability of the proposed hybrid model.
The remainder of this paper is organized as follows. Section 2 presents the benefit evaluation method, aiming to quantify the complementary effect of the multi-energy power generation system. The promising wind-hydro integrated power system is described in Section 3. In Section 4, the complementary characteristic analysis is conducted. Section 5 quantifies the comprehensive regulation benefits of the presented hybrid system based on IEEE 14 Bus Power System. Finally, conclusions are drawn in Section 6.
2. Benefit Evaluation Method
The wind/hydropower/coal-fired integrated system has a significant advantage in improving energy structure and grid reliability, but there is a serious challenge that the quantified economic benefit evaluation method still lacks from the perspective of self-regulation damage of the integrated system. Based on this, a new comprehensive evaluation method, quantifying the fatigue damage of the guide vane in the time-scale of a year, is presented. This method extensively considers three consumption profits (i.e., the power consumption profit, the peak-load profit and the energy conservation profit) and three production costs (i.e., the start-stop cost, the guide vane fatigue cost and the maintenance cost) to assess the economic benefits of the integrated renewable power system. During the evaluation process, the wind/hydropower/coal-fired quota and the benefit objective function are described as follows:
- Wind-hydropower quota criterion
Considering the dual benefits of economy and environment, this paper encourages one to cut down the coal-fired quota from 84% of the minimum power output to 75%. Simultaneously, this stimulates the increase of wind-hydropower quota in the hybrid power system to meet the end use demand of power supply. The power fluctuation of the grid increases because of the injection of the intermittent wind power, therefore, the corresponding suppressing power of hydropower generation will be enhanced to balance the voltage and power variation. The participation of hydropower regulation inevitably results in the excessive abrasion of the guide vane, which can lead to the massive loss of power stations.
- Benefit objective function
The benefit objective function describing the comprehensive economic profile of the wind/hydropower/coal-fired-integrated system is expressed as:
where Fmax is the comprehensive benefit, Fd is the power consumption profit, Ft is the peak load profit, Fj is the energy conservation profit, Fs is the guide vane fatigue cost, Fw is the maintenance cost, and Fq is the start-stop cost. The detailed expression of the consumption profits and production costs are described in Equations (2)–(6).
- (i)
- Power consumption profit
The power consumption profit Fd is the economic benefit from the electricity production, i.e.,
where Ff, Fh and Fs are the wind, coal-fired and hydropower power consumption profits, respectively. Pf, Ph and Ps are the wind, coal-fired and hydropower electricity generation capacities, respectively. Sf, Sh and Ss are the wind, coal-fired and hydropower of grid purchase prices, respectively. tf, th and ts are the online time of the wind, coal-fired and hydropower generations, respectively.
- (ii)
- Peak-load profit
The peak-load profit in Equation (3) refers to the economic benefit of the reliable operation of the hybrid power system generated by the peak-load regulation of the coal-fired power system
where Ps and St are the coal-fired output power and the peak-load compensation, respectively. t2 and t1 are the start time and the stop time of the valley load, respectively.
- (iii)
- Energy conservation profit
The energy conservation profit is created by the carbon saving of the coal-fired generation due to the injection of wind power and hydropower into the power grid, which is expressed as:
where Pf is the wind power, tf is the wind generation time, Q is the coal combustion heat, a is the loss coefficient of coal combustion, and Sm is the coal price of unit mass.
- (iv)
- Start-stop cost
The start-stop cost Fq in Equation (5) is caused by the frequency start-up and shut-down of the hydropower generating units.
where Spq and Spt are the start-up cost and shut-down cost of a hydropower generation unit, respectively. nqk and ntk are the start-up and shut-down unit numbers, respectively. k is the hour series, k = 1, 2, 3, … 24.
- (v)
- Guide vane fatigue loss cost
The purpose of the wind–hydropower quota increase is to reduce the dependence of coal-fired generation and CO2 emissions. However, this will increase the regulation burden of the hydropower system. Frequent working condition conversion causes the rapid change of guide vane opening amplitude, which is different from the characteristics under stable operating conditions, and has a fatigue impact on guide vane, further leading to the fatigue damage of the guide vane. If the ratio of guide vane opening amplitude to rated guide vane opening is less than the given critical value, fatigue damage will not occur; otherwise, fatigue damage will occur. Then, the guide vane fatigue damage can be obtained by accumulating each fatigue damage result. Based on the above consideration, the guide vane fatigue cost Fs is used to quantify the cost caused by the fatigue damage of guide vane, which is closely related to the switch numbers and amplitude of the guide vane.
- (vi)
- Maintenance cost
The maintenance cost Fw is equal to 2% of the total investment, where the cost caused by the guide vane fatigue is not included. It is expressed as:
where n is the operation life of the hydropower system. Ffw, Fsw and Fhw are the wind, hydropower and coal-fired maintenance costs, respectively. Fsj, Fhj and Ffj are the wind, hydropower and coal-fired construction costs, respectively.
3. Integrated Model
In this section, the wind–hydropower integrated power system is presented by MATLAB/Simulink. The established model is used to extensively investigate how the hydropower generation system benefits the grid power stability under the fluctuation of wind power. Herein, the hydropower model employs the typical IEEE model presented in 1992, and the wind power model is based on the double-fed induction generator (DFIG).
3.1. Hydropower System
The hydropower generation system is based on the runoff hydropower station, where the hydropower output is mainly restricted by the natural flow of the river, and does not change much in one day. Based on the above consideration, the water balance, hydrograms, duration curves, and precipitation data are omitted. The hydropower system is mainly composed of hydro-turbine, synchronous generator, proportional-integral-differential (PID) governor and penstock. The detailed modeling process is illustrated as follows.
3.1.1. Hydraulic Speed Control System
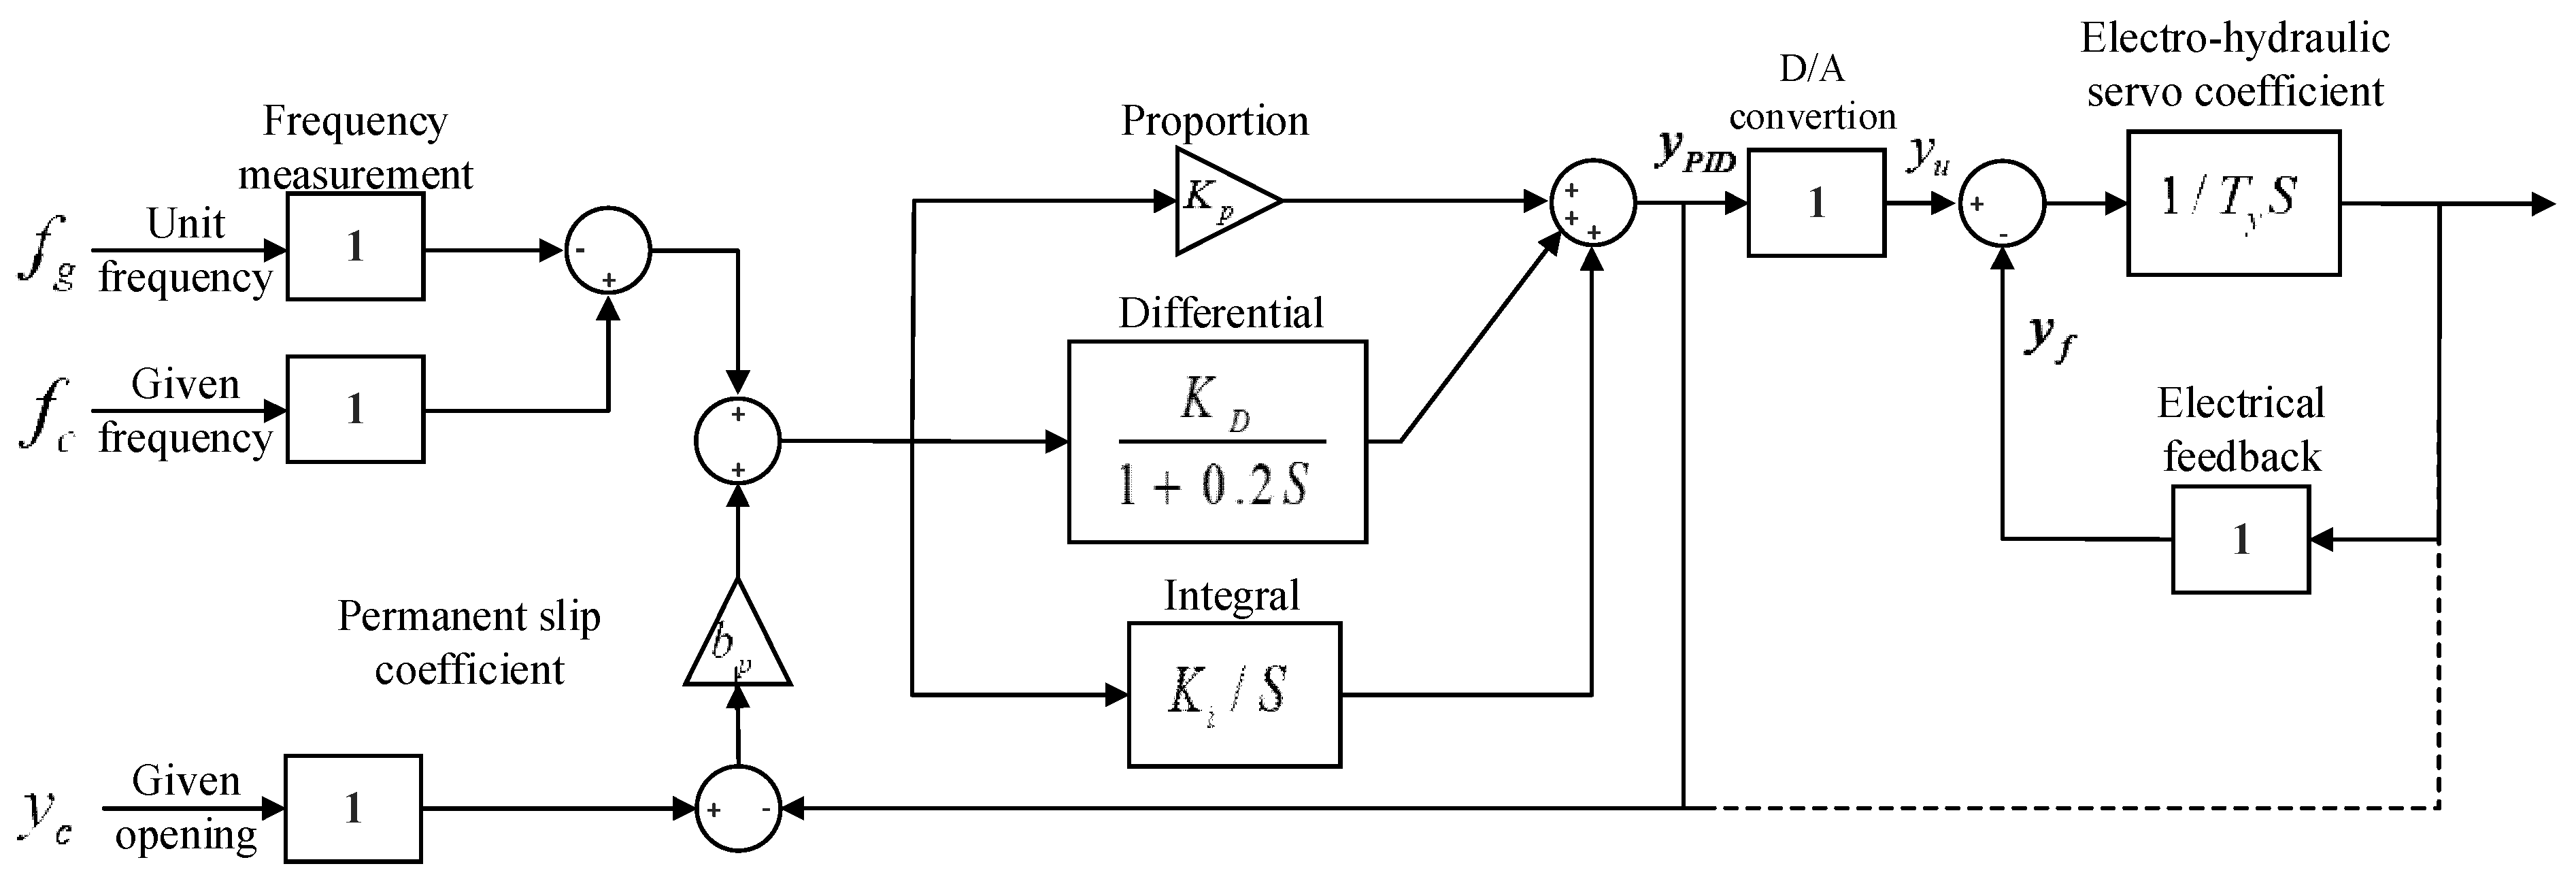
The hydraulic speed control system consists of the PID control system and the hydro-mechanical system. The PID control system belongs to a linear controller, which forms a control deviation between the reference value and the output value on the basis of the proportional-integral-differential loop to enable the frequency regulation [37,38]. Generally, the mechanism of the PID control system [39] is expressed as:
where Kp, Ki and KD are the proportional, the integral, and the differential adjustment coefficient, respectively. Tn, Td and bt are the acceleration time constant, the buffer time constant and the transient difference coefficient, respectively. Thus, the schematic diagram of the PID control system is shown in Figure 1.
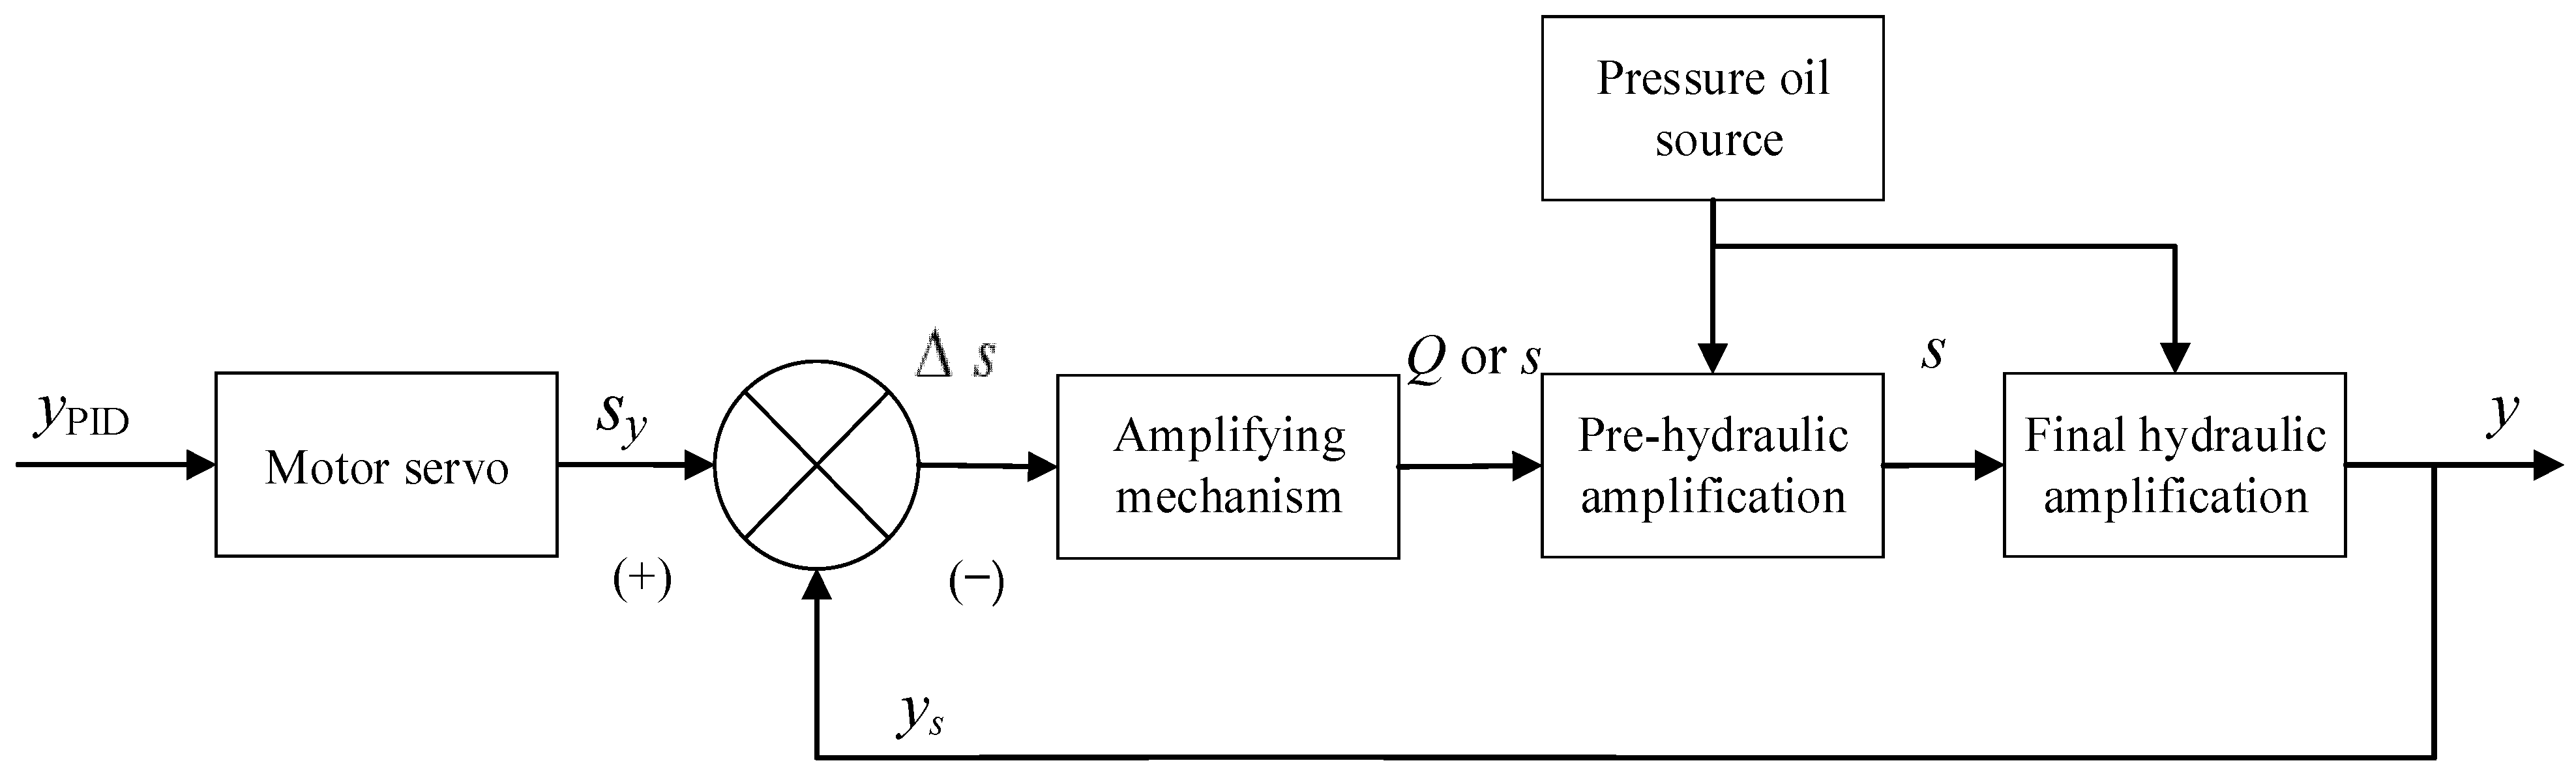
The hydro-mechanical system governs the hydraulic servomotor, which essentially belongs to an integral loop. The regulating performance of the hydro-mechanical system is described by the start time and stop time of the hydraulic servomotor. A conventional hydro-mechanical system is expressed by the transfer functions, as shown in Figure 2.
3.1.2. Hydro-Turbine and Penstock
There are two dynamic performance patterns that could reflect the characteristic of the penstock flow, i.e., the rigid water hammer and the elastic water hammer [40]. The elastic water hammer is better to describe the actual motion of the penstock flow compared with the rigid pattern. The transfer function of the penstock (GD(s)) [41] is expressed as:
where , , Tr, hω, and hf denote the relative hydro-turbine head caused by the flow variation, the relative flow deviation, the water hammer phase length, the penstock characteristic coefficient, and the penstock friction loss.
Based on Equation (8), the hydro-turbine characteristic is obtained as:
where q0 and hfc are the relative initial flow and the water head loss coefficient.
3.1.3. Hydraulic Generator
The rotor motion equation for the hydraulic generator is written as:
where Pmac is the mechanical power of generator rotor, Pe is the electromagnetic power, H is the inertia constant, KD is the damping coefficient, ω is the generator rotor speed, ωb is the reference value of the generator rotor speed, and θ is the rotor angle, respectively.
The electromagnetic equation of the generator is expressed as:
where T′d0 is the open-circuit transient time constant in d-axis, E′q is the transient electromotance in q-axis, Ef is the excitation potential of rotor, and X′d is the transient reactance in d-axis, respectively. Xd and Xq are the synchronous reactance in d-axis and q-axis, respectively. id and iq are the output currents in d-axis and q-axis, respectively. ed and eq are the terminal voltages in d-axis and q-axis, respectively.
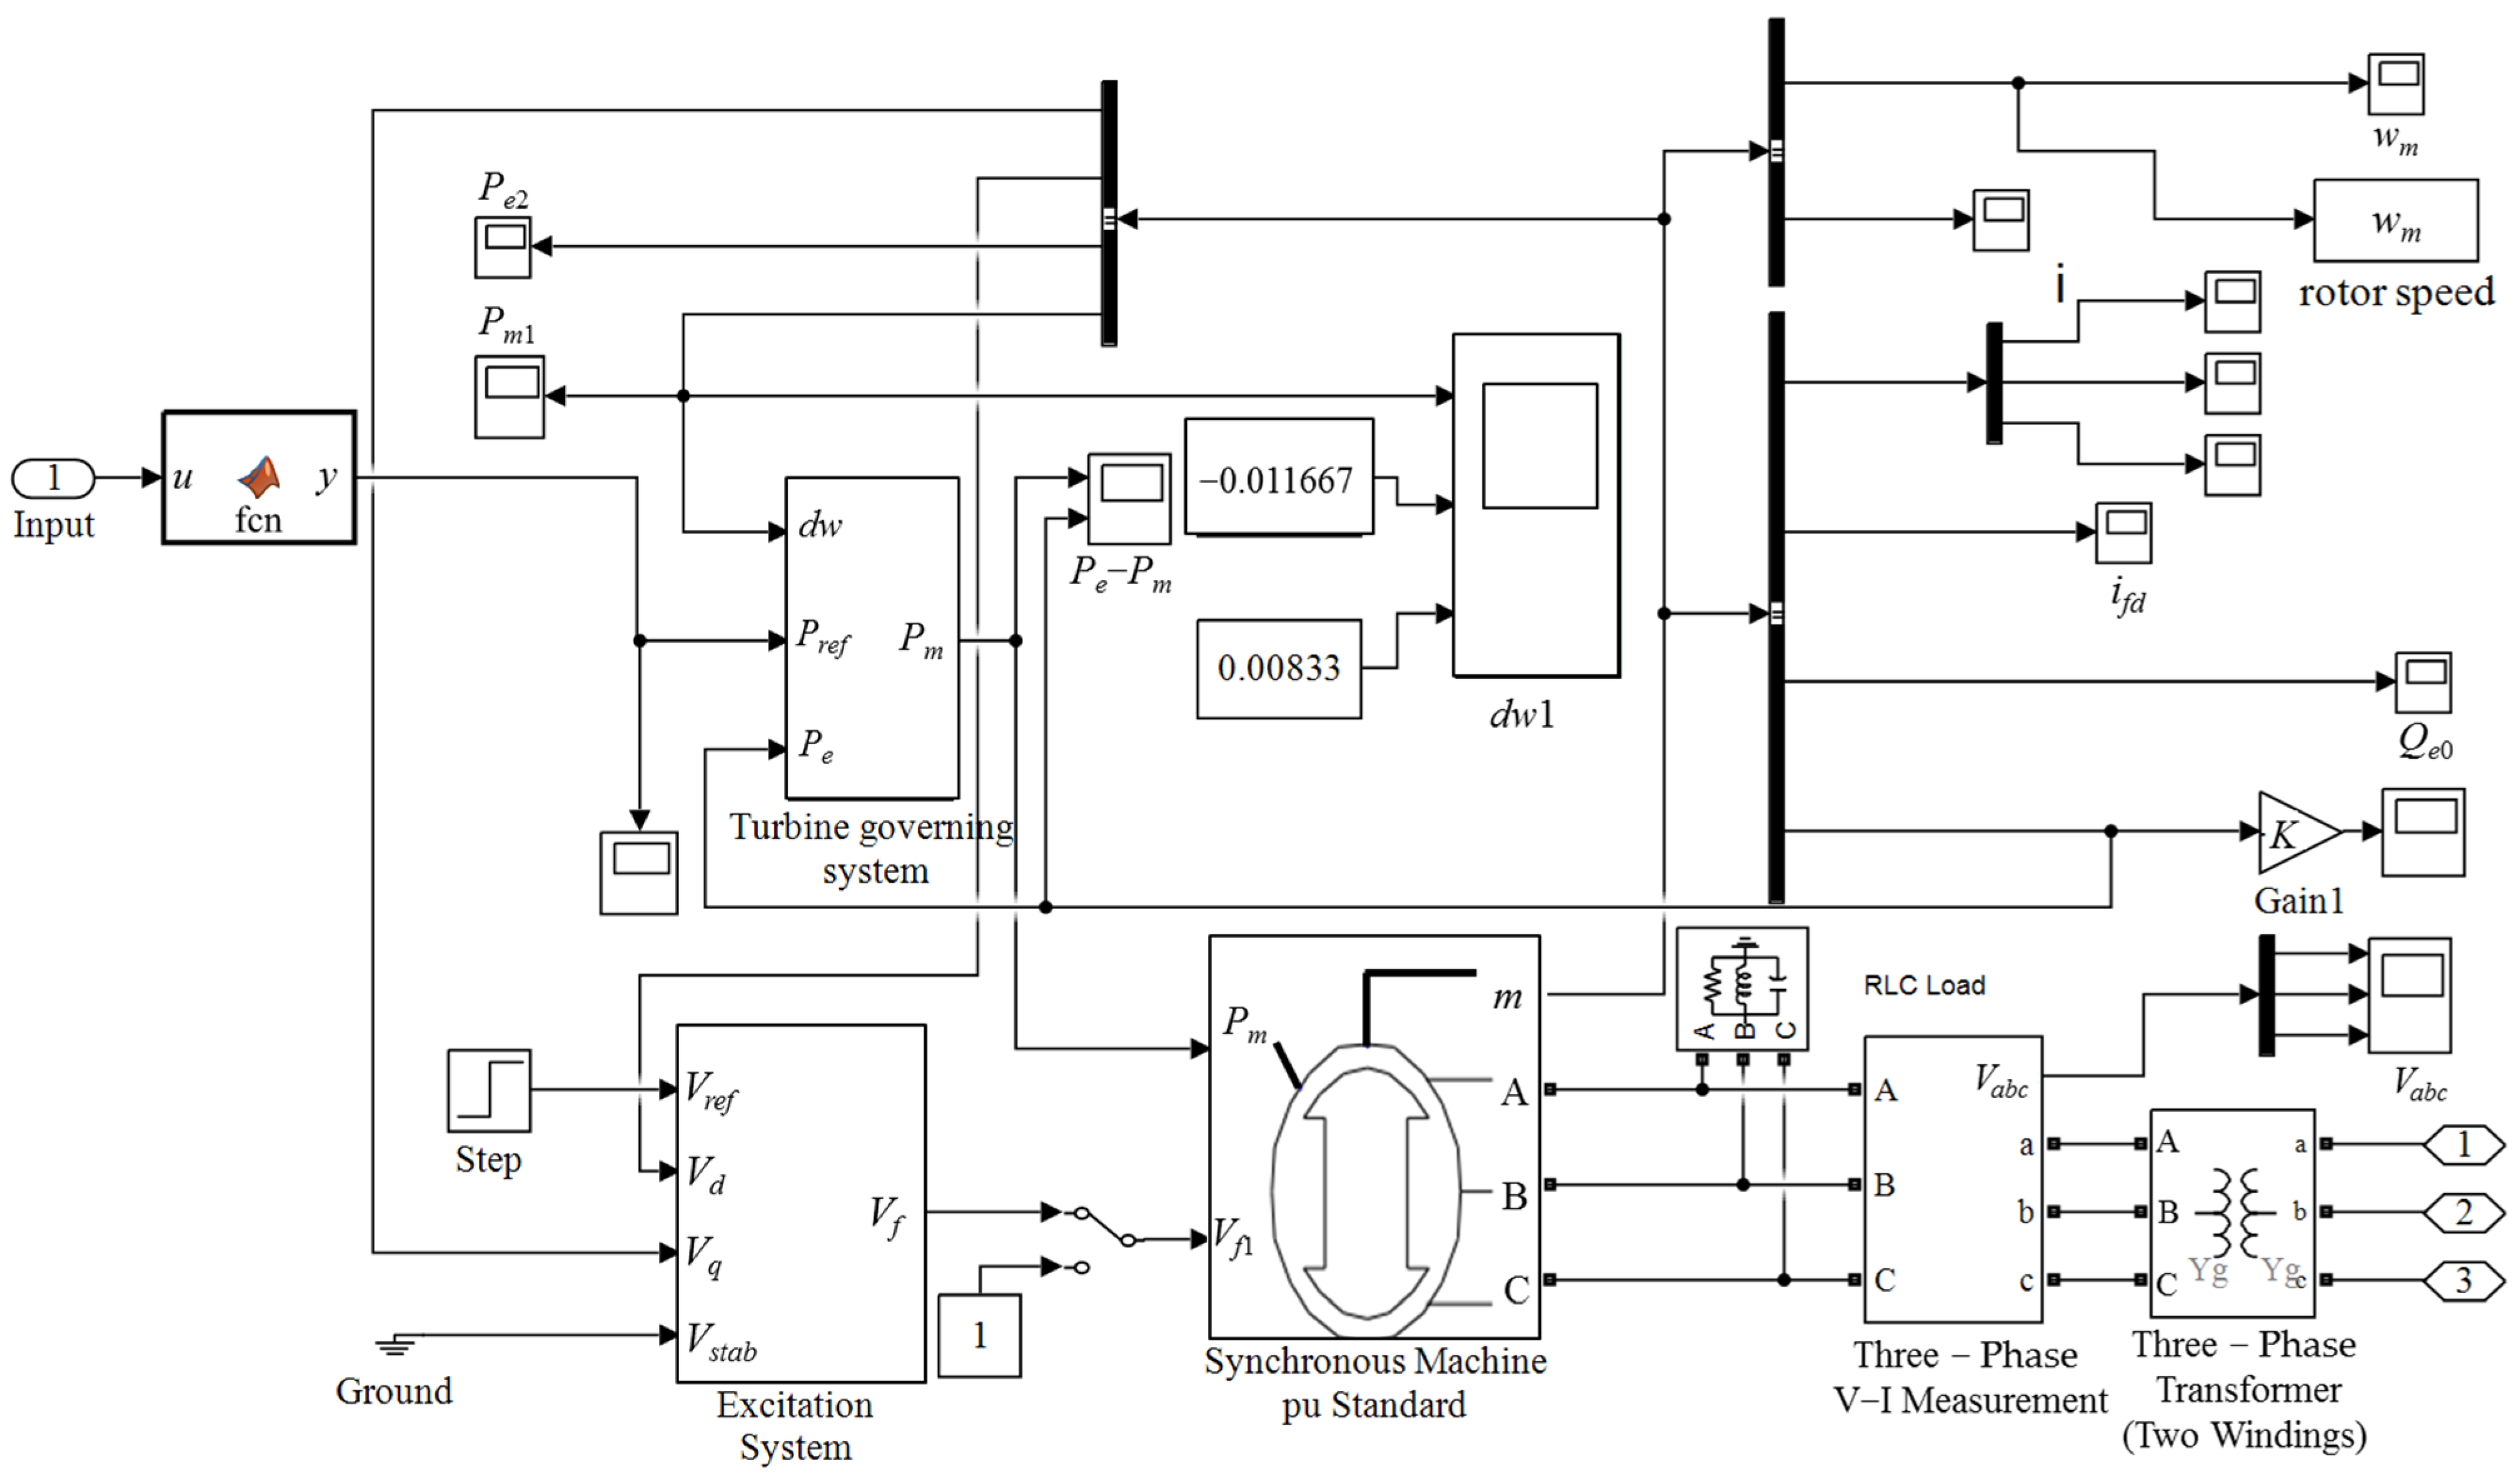
Therefore, based on the above considerations, the block diagram of the hydropower generation system is finally established based on MATLAB/Simulink, as shown in Figure 3.
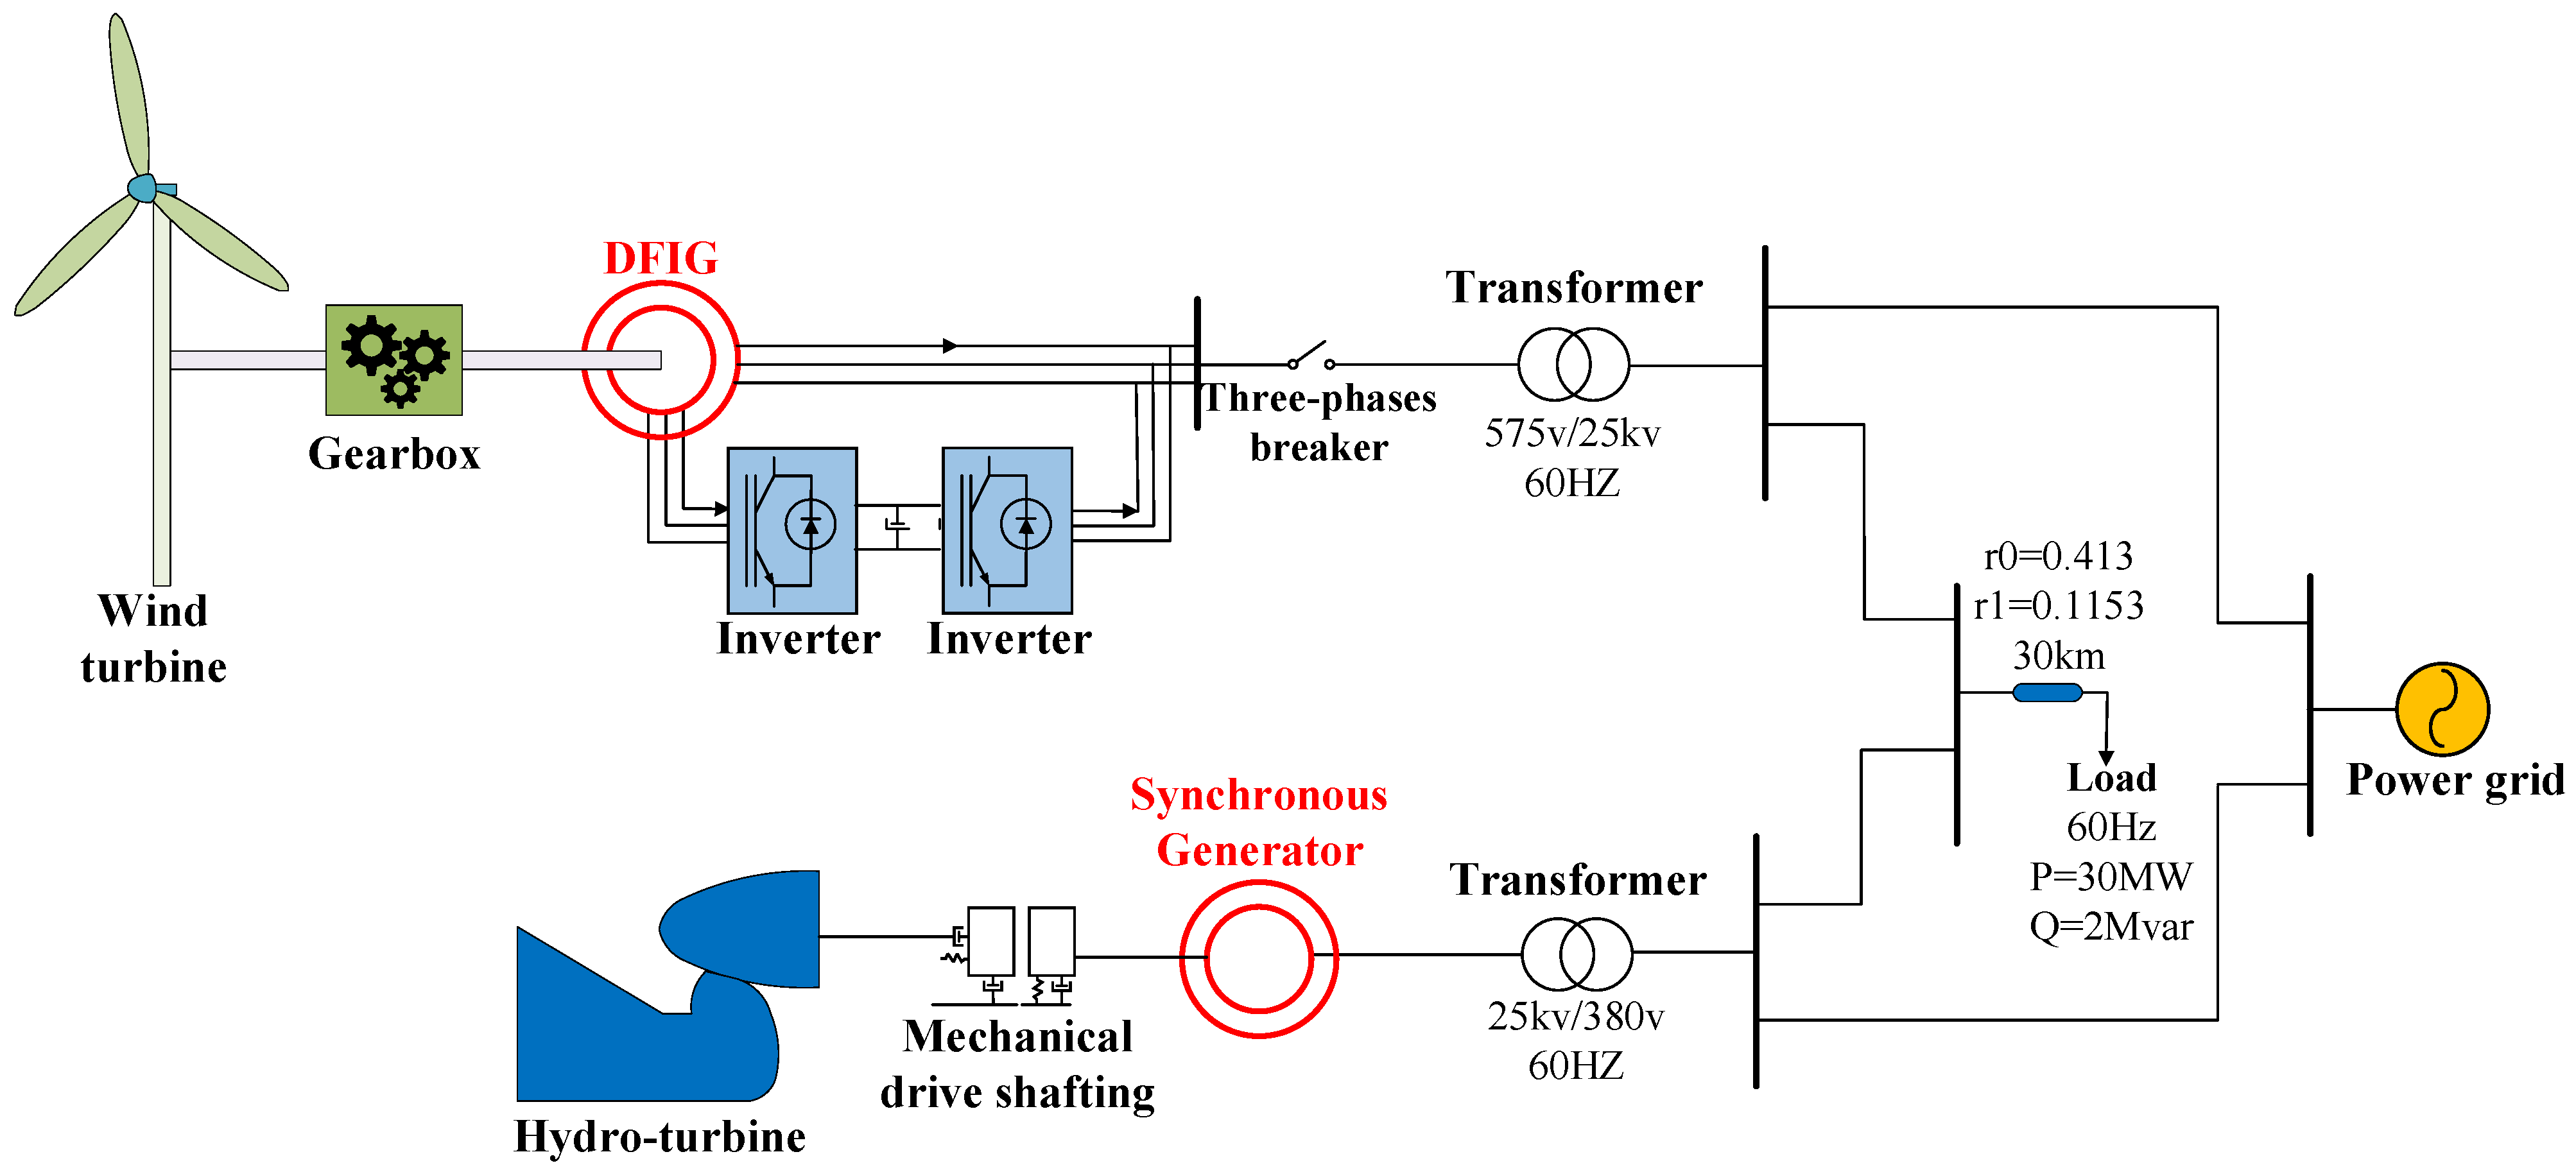
3.2. Wind Power System
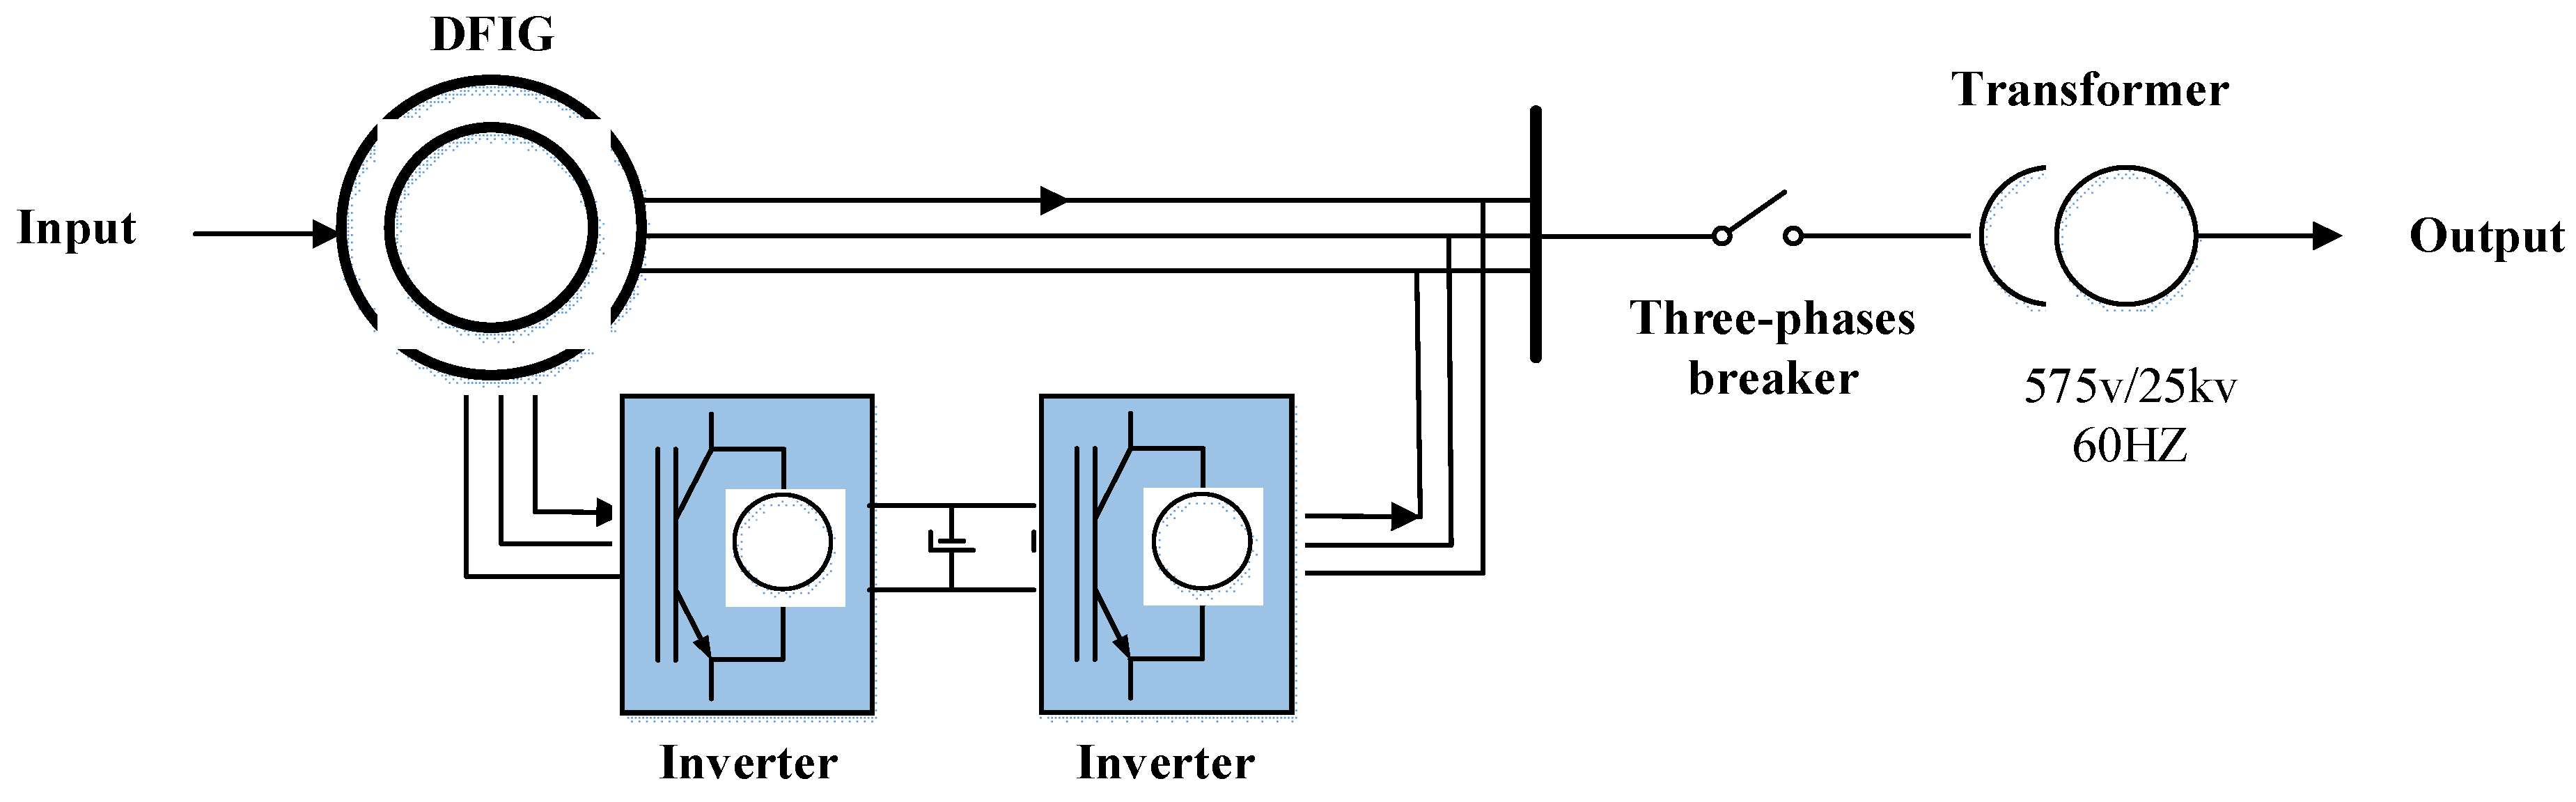
The wind power system mainly comprises the wind turbine, the double-fed induction generator (DFIG), the mechanical drive shaft system, and related control systems. The structural diagram of the wind power system is shown in Figure 4.
3.2.1. Wind Turbine
The captured mechanical power from the wind turbine is described as:
where ρ the air density. A and v stand for the swept area of blades and wind speed, respectively. Cp is the wind power coefficient. β and λ are the blade pitch angle and tip-speed-ratio.
3.2.2. DFIG Model
The electromagnetic property of the wind power system is described by the DFIG. The rotor winding of the DFIG connects with the power grid through the power electronic converter, which achieves the goal of the voltage, frequency and phase modulation regulation. This enables the DFIG to realize the variable-speed and constant-frequency power generation, in order to meet the reliability of power grids.
The dynamic model of the DFIG [42] is described as:
where Ed′ and Eq′ are the transient electromotances of DFIG in d-axis and q-axis, respectively. Udr and Uq are the field currents in d-axis and q-axis, respectively. Ids and Iqs are the rotor windings in d-axis and q-axis, respectively. xss, X′, X and T0′ are the synchronous resistance of generator, the transient resistance of generator, the magnetizing reactance, and the rotor short-circuit time constant, respectively.
3.2.3. Mechanical Drive Shaft System
The mechanical property of the wind power system is illustrated by the mechanical drive shaft system. In general, the mechanical drive shaft system is composed of the gearbox, the wind turbine, and the transmission shaft. Based on the equivalent concentrated mass method [43], the mechanical drive shaft system can be expressed as:
where Hm is the inertia time constant of equivalent mass block, Dm is the damping coefficient, Wm is the angular velocity, TW is the mechanical torque of wind turbine, and Te is the electromagnetic torque of the DFIG.
3.2.4. Control System
The control system includes speed regulator, pitch control, rotor-side converter controller, and grid-side converter controller. Please see Guan et al. [44] for detailed information about the modeling process.
Thus, by integrating the established hydropower generation system and the wind power system, the wind-hydropower hybrid model is finally illustrated in Figure 5.
4. Complementary Characteristics Analysis
This section aims to validate the proposed wind-hydro hybrid system from the perspective of complementary features. To enable the analysis, the model of resultant wind speed is presented in Section 4.1, and the complementary results between the hydropower and wind power are illustrated in Section 4.2.
4.1. Case Description
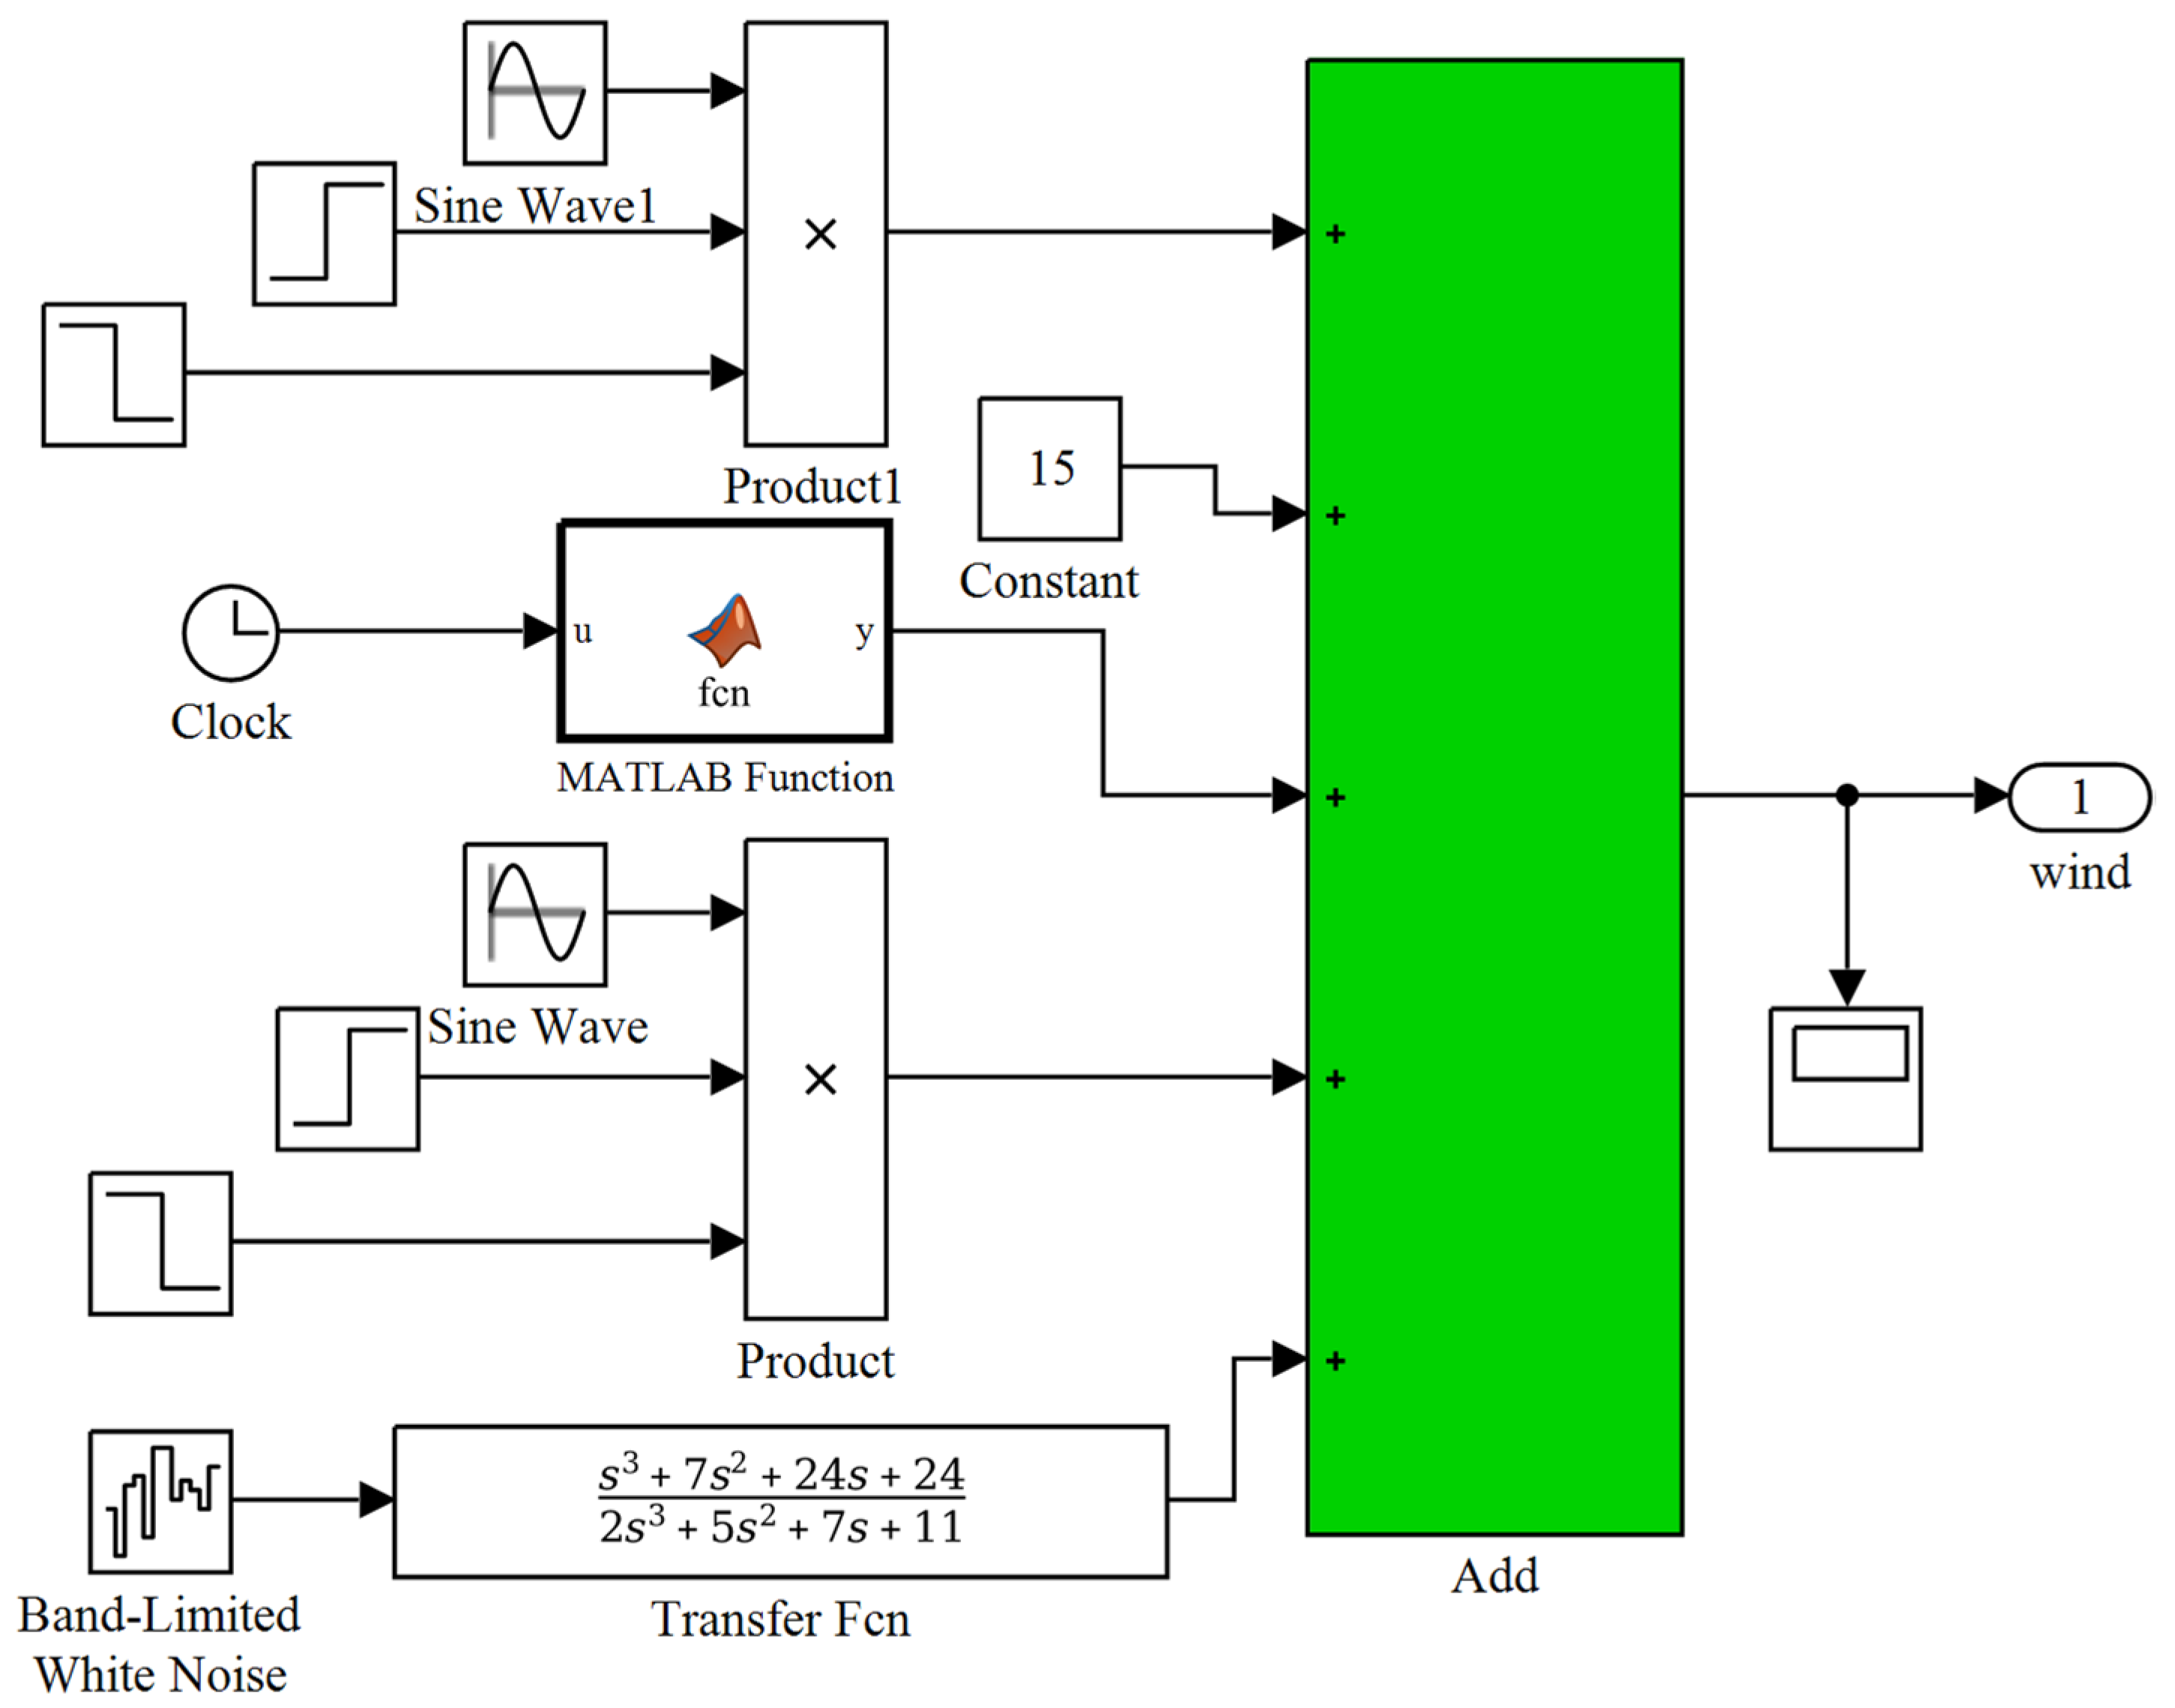
The uncertainty characteristic of wind speed is a key factor to influence the power fluctuation and the mechanical abrasion of the guide vane. Thus, it is a vital task to establish a wind speed model, that can better reflect the actual scenario of the wind speed. The commonly used wind speed models are basis wind, gradient wind, gusty wind, and random wind. Based on these, a model of resultant wind speed composed of the four wind speed types is established using MATLAB/SIMULINK. The modeling details are performed as follows.
- (i)
- Basic wind
The basic wind speed (Vhd) represents a steady state, which is generally expressed as:
- (ii)
- Gradient wind
The gradient wind describes the increase/decrease trend of the natural wind. In this work, the gradient wind (Vjb) starts increasing to 11 m/s from the 4th second to the 5th second, and the wind speed keeps this steady state within 2 s, and then decreases gradually to zero at the 8th second. Hence, the gradient wind is described as:
- (iii)
- Random wind
The randomness of irregularity characteristics revealed by the random wind, which is one of the key factors to result in wind power fluctuations. This type of wind speed (i.e., Vsj) is described as:
where Vnoise represents the amplitude of the stray disturbance signal, which is equal to 1. s is the Laplace operator.
- (iv)
- Gusty wind
If the strength of wind speed has a fluctuation property in a short time, such a gusty wind (i.e., Vz) is usually expressed as:
In light of Equations (15)–(18), the model of resultant wind speed is obtained in Equation (19), and the corresponding block diagram is shown in Figure 6.
4.2. Complementary Results
Wind power depends entirely on the wind speed conditions; therefore, it proves to be quite changeable due to the randomicity, intermittent, and volatility characteristics of wind speed. Hydropower is used to balance the fluctuation of wind power to maintain the power balance of the system. In other words, the hydropower output increases when the wind power decreases, and vice versa. To investigate the suppressing effect of the hydropower on the wind power fluctuation, second and hour time scales are selected to analyze the complementary profile of the hybrid system. The results are shown in Figure 7 and Figure 8.
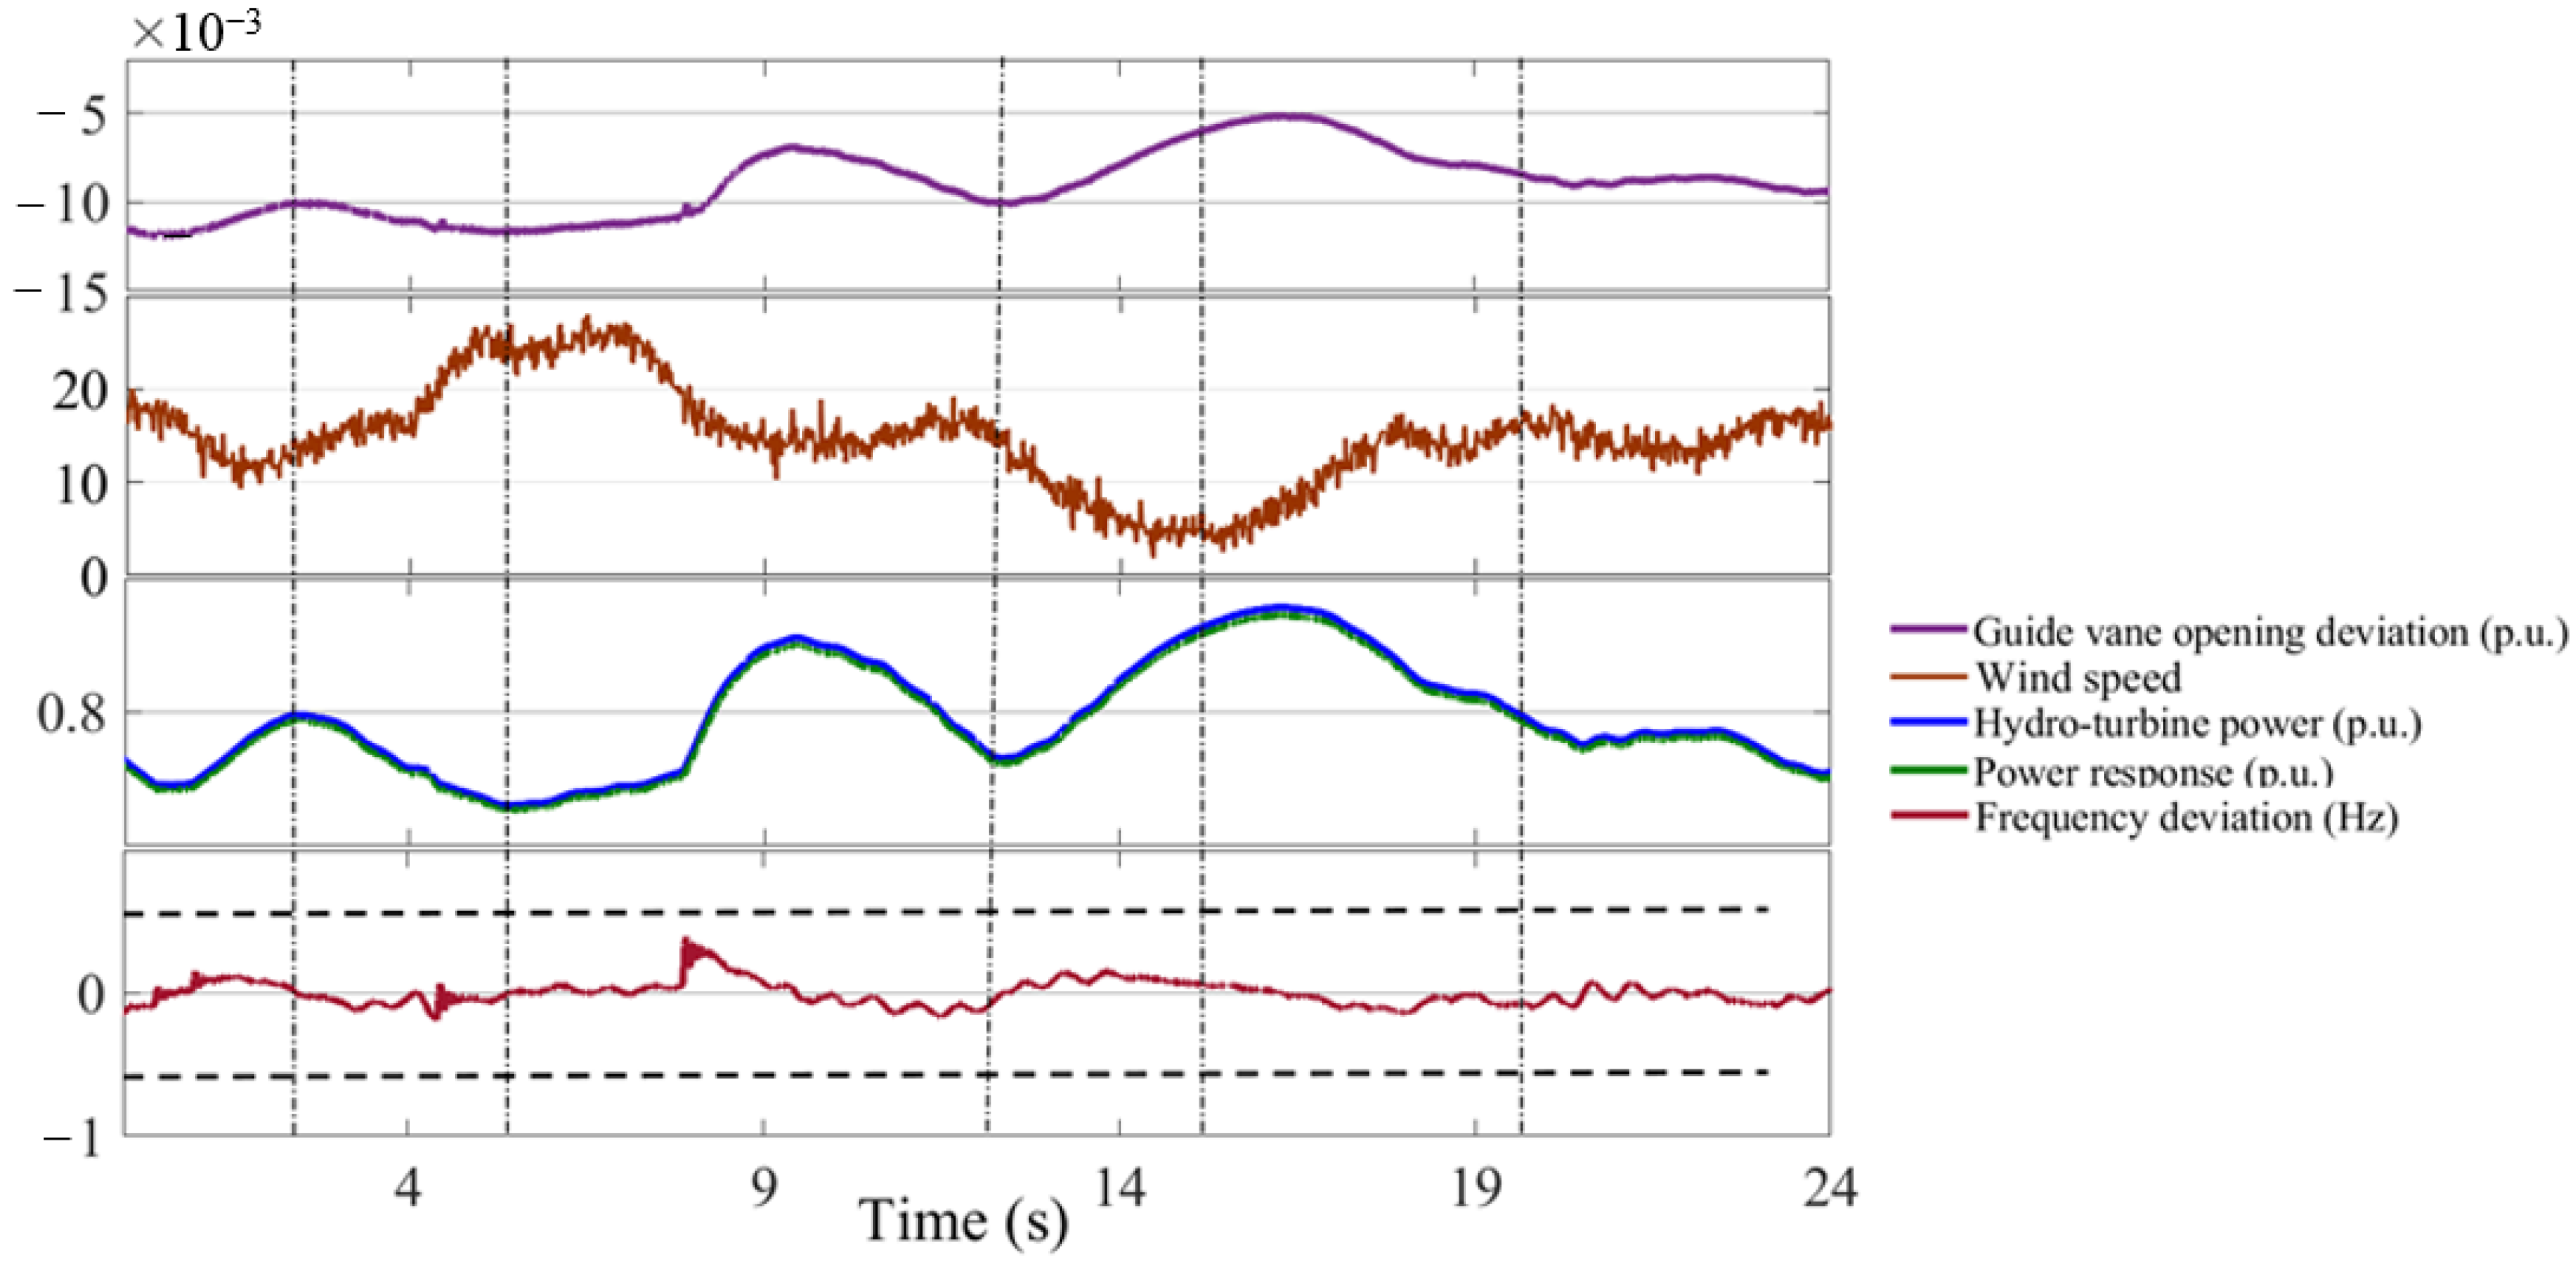
From Figure 7, the wind speed is obtained by the four fundamental wind speed types based on Equation (19). The basic wind speed remains constant. The gusty wind starting form is 4 s, and the duration is 10 s. Two-stage gradient wind is adopted, where the increasing gradient wind lasts from 3 s to 5 s, and the decelerating gradient wind lasts from 10 s to 15 s. The complementary feature of the hybrid system in the time scale of second is summed up in three aspects. First, for the increasing wind speed at the time range of (3 s, 5 s), the related deviations of the guide vane opening and the hydropower decrease, and the small fluctuation occurs in the frequency deviation, but does not exceed the accepted range (−0.2 Hz, +0.2 Hz). Comparing the performance in the time interval of (15 s, 19 s), it is found that a large amplitude fluctuation of wind speed results in a large fluctuation of wind power. To maintain the power balance, large variations of the guide vane opening, the hydro-turbine power and the power response occur. Secondly, regarding the decreasing wind speed at the time range (12 s, 15 s), the values of these performance indicators except for the frequency deviation show an increasing trend, which means that the small wind speed is corresponding to the excellent complementary property in the hybrid system. Third, regarding the steady state of wind speed within the time range (20 s, 23 s), the guide vane opening, the hydro-turbine power, the power response and the frequency show a relatively slight fluctuation, revealing that the hybrid system operates safely in this case.
The reliability of the complementary performance is mainly embodied in the fast response relationship between the hydro-turbine power and the power response. In Figure 7, there is an extremely high similarity (including trend and amplitude) between the hydro-turbine power and the power response, which reveals that the hydropower has the ability to complement timely the intermittent wind power to maintain the power grid stable. Additionally, it is clearly found that the frequency deviation in the accepted range (−0.2 Hz, +0.2 Hz) during the total 24 s. This also proves that there is an excellent complementary result in the time scale of seconds for the proposed wind–hydro-integrated power system. Therefore, the proposed model has certain reliability and effectiveness, which can be used to conduct the comprehensive benefits analysis.
The complementary feature in Figure 8 is revealed based on three typical times, i.e., the 6th hour, the 7th hour, and the 19th hour. The deviation of guide vane opening decreases from 0.005 to zero, in order to respond to the rapid decrease of the hydro-turbine power and the power response at the 6th hour. The values of the hydro-turbine power and the power response increase, and the frequency deviation changes in the accepted range of (−0.2 Hz, +0.2 Hz) at the 7th hour. Correspondingly, the deviation of the guide vane opening increases from 0.005 to 0.01. This means that the guide vane wears seriously and may increase the fatigue damage cost; in this case, in comparison with the situation at the 6th hour. With respect to the performance at the 19th hour, the hydro-turbine power and the power response first decrease dramatically and then increase rapidly, and the related frequency fluctuates significantly. In this situation, the deviation of guide vane opening first declines and then rises, which matches the real application in the power station. Moreover, it is observed that the power response quickly catches up with the variation of the hydro-turbine power, since there is a similar change trend for these two indices. This means that the hydropower system has a promising complementary characteristic in suppressing the fluctuation of wind power. Additionally, the amplitude and the change frequency of guide vane are relatively large in the time scale of hours compared with those in the time scale of seconds. As a result, the fatigue damage of the guide vane is more severe in the hour time-scale.
5. Comprehensive Regulation Benefits
This section focuses on the quantification of the comprehensive economic benefit of the wind-hydro hybrid system integrating with the coal-fired generators based on IEEE 14 Bus Power System. In Section 5.1, the bus connection scenario and the operation mode of the wind and hydropower and coal-fired generating units are described. Here, different wind and hydro ratios are set to investigate the wind power fluctuation, where the system demand is always the same. Section 5.2 investigates how the renewable energy participation effects the power fluctuation and the fatigue damage of guide vanes. Finally, the quantified regulation benefits are illustrated in Section 5.3.
5.1. Case Study
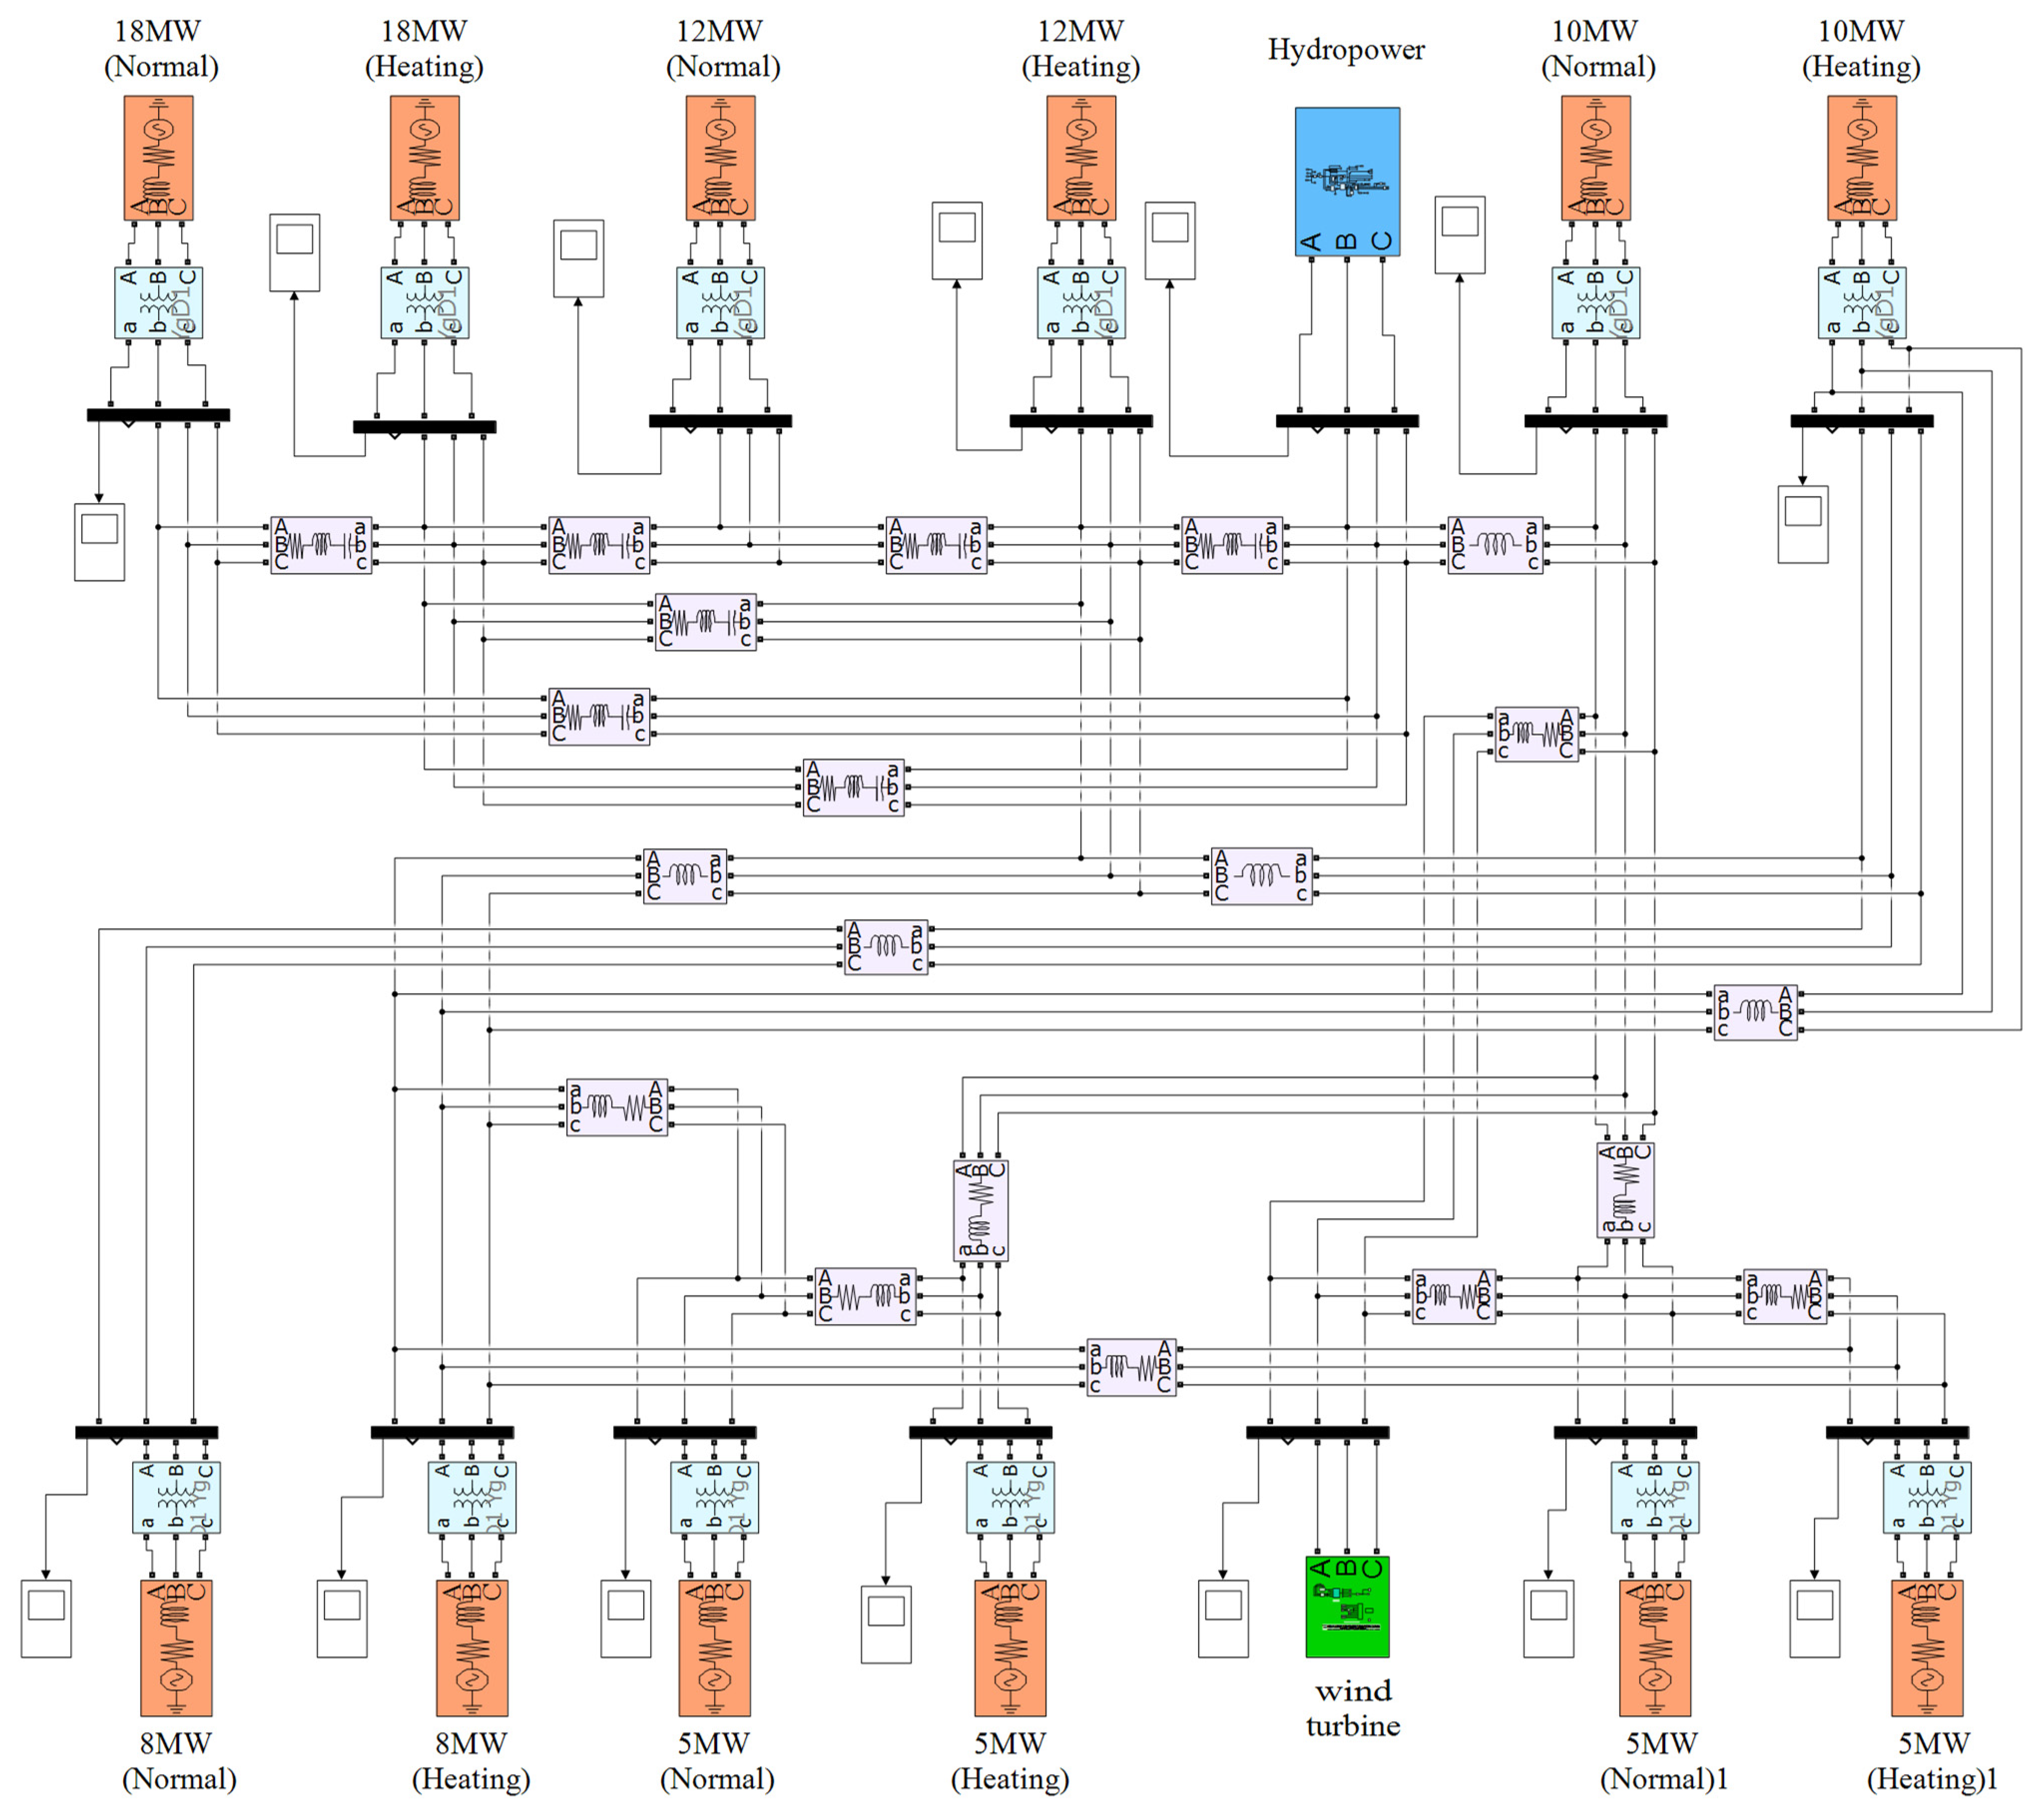
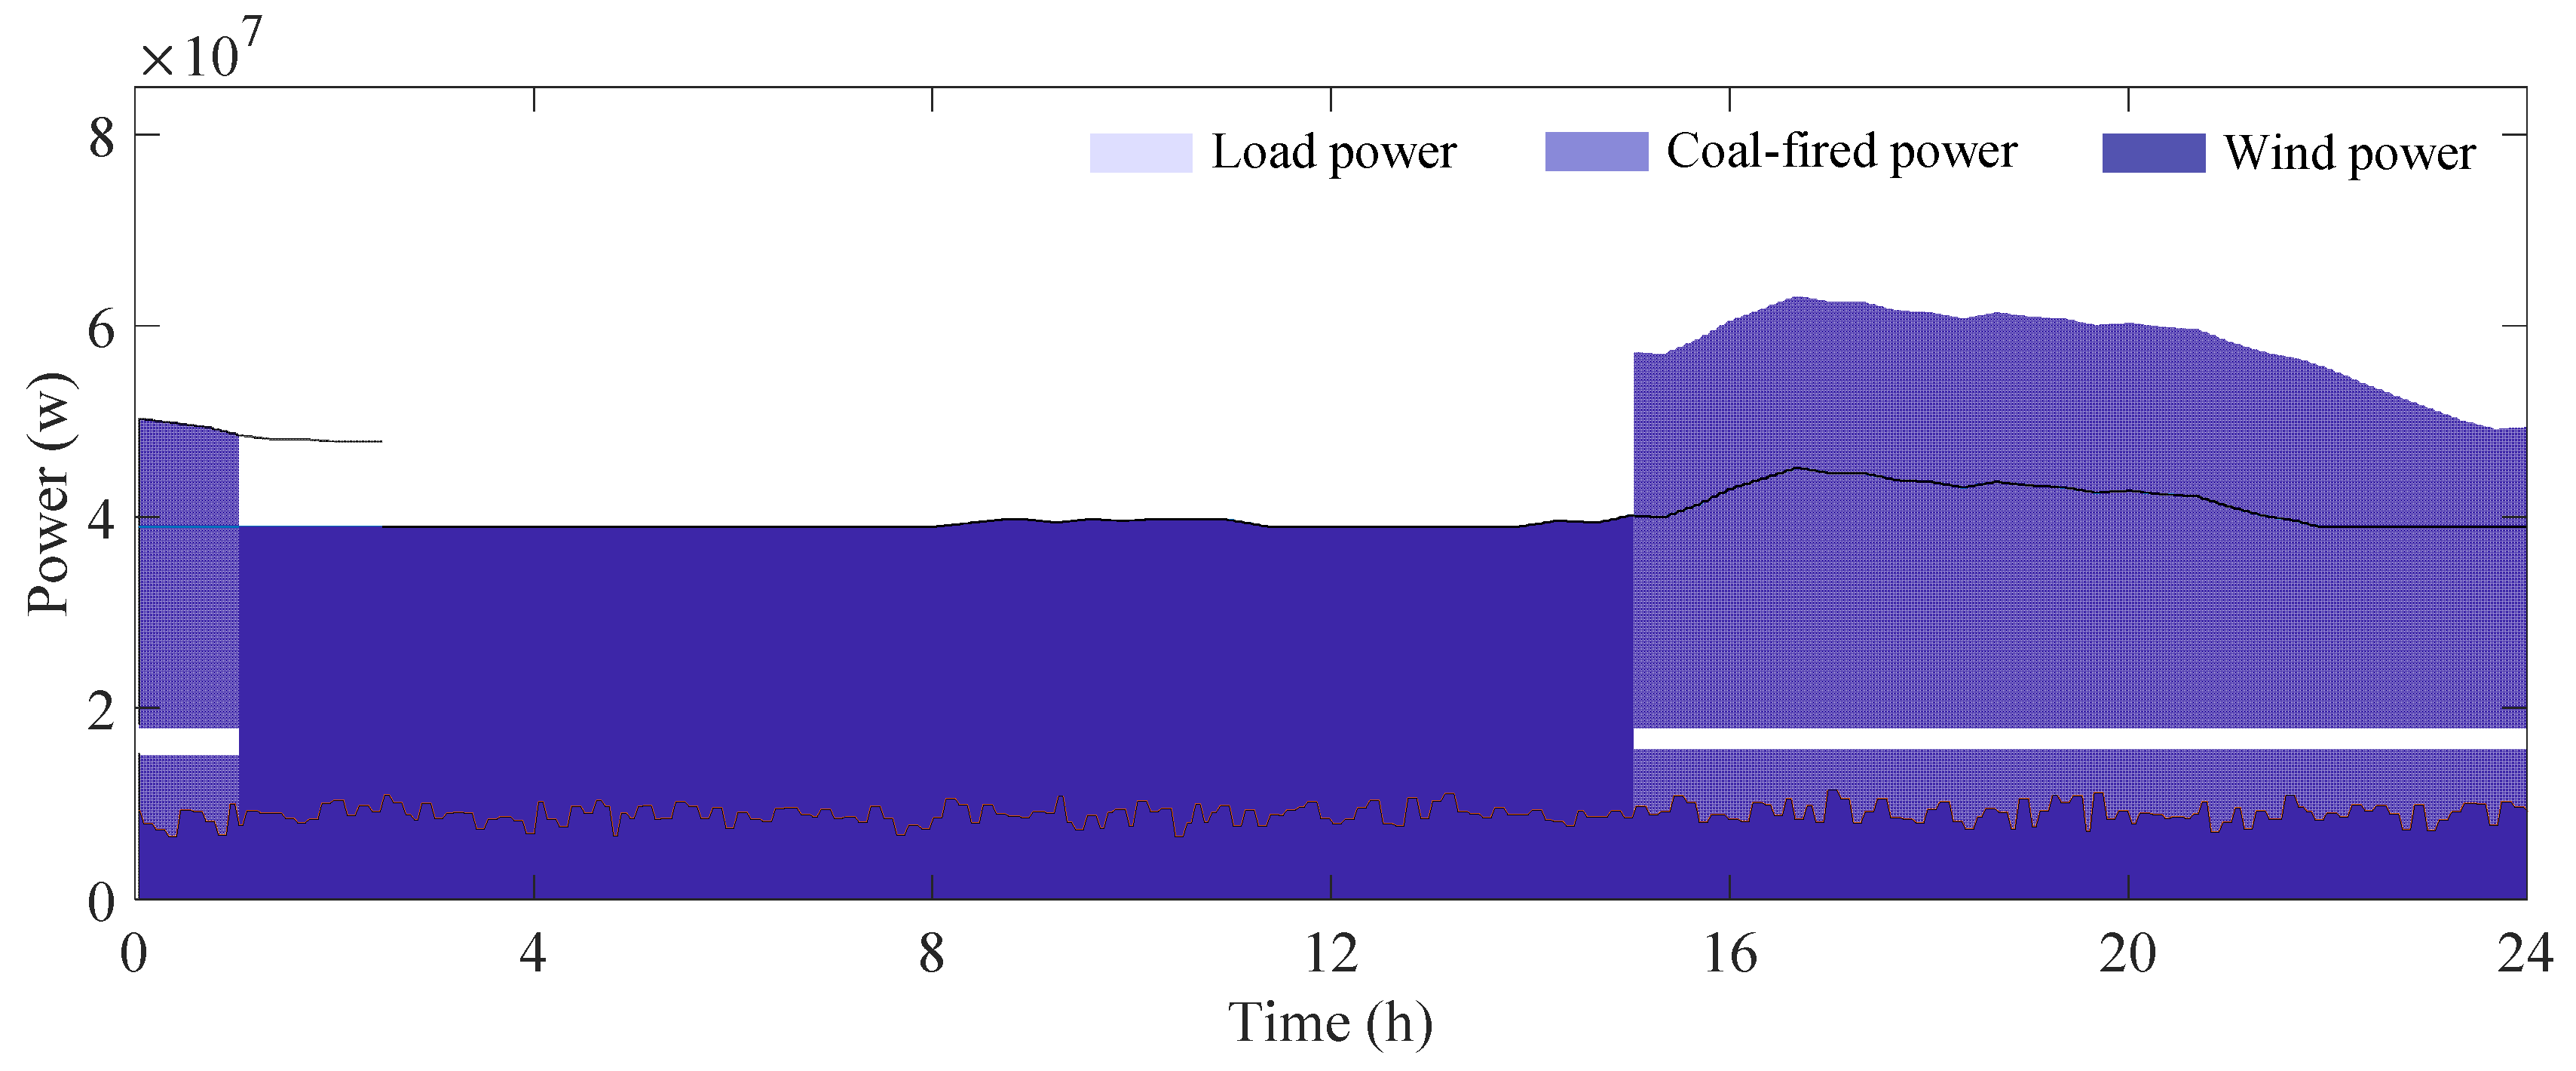
The IEEE 14 Bus Power System is designed by twelve coal-fired generators, a 30 MW hydropower generation system, and a 9 MW wind power system, as shown in Figure 9. The key specifications of the hydropower station are: Hydro-turbine: HLD294-LJ-178, Generator: FS29-14/4000, Governor: CVT-80-4 (PID). Herein, the total installed capacity of the twelve coal-fired generators is 116 MW, including two 18 MW normal/heating generators, two 12 MW normal/heating generators, two 10 MW normal/heating generators, two 8 MW normal/heating generators, and two 5 MW normal generators and two 5 MW heating generators. Detailed information about the coal-fired generators is listed in Table 1. The system demand (i.e., load power) changes according to the curve shown in Figure 10. In other words, no matter how the relations of wind to hydro changes, the demand is always the same. The different ratios of wind and hydro can reflect the fluctuation of wind power, so as to study the regulation performance of hydropower units. These results are the basis of investigating the guide vane fatigue loss, thus studying the comprehensive benefits of the hybrid power system.
The comprehensive evaluation is based on the time scale of hours, and the total calculated time is 24 h. Figure 10 shows the hourly variety rules with respect to the coal-fired power, wind power, and load demand. The working principle of this power station is concluded as: (i) The coal-fired system undertakes 85% load demand without unit shutdown, and it should operate between the maximum and minimum output power (as mentioned in Table 1), and (ii) The residual 15% of load demand is assigned to the wind and hydropower generation system, where the hydropower sector stop the electricity service if the wind power is enough.
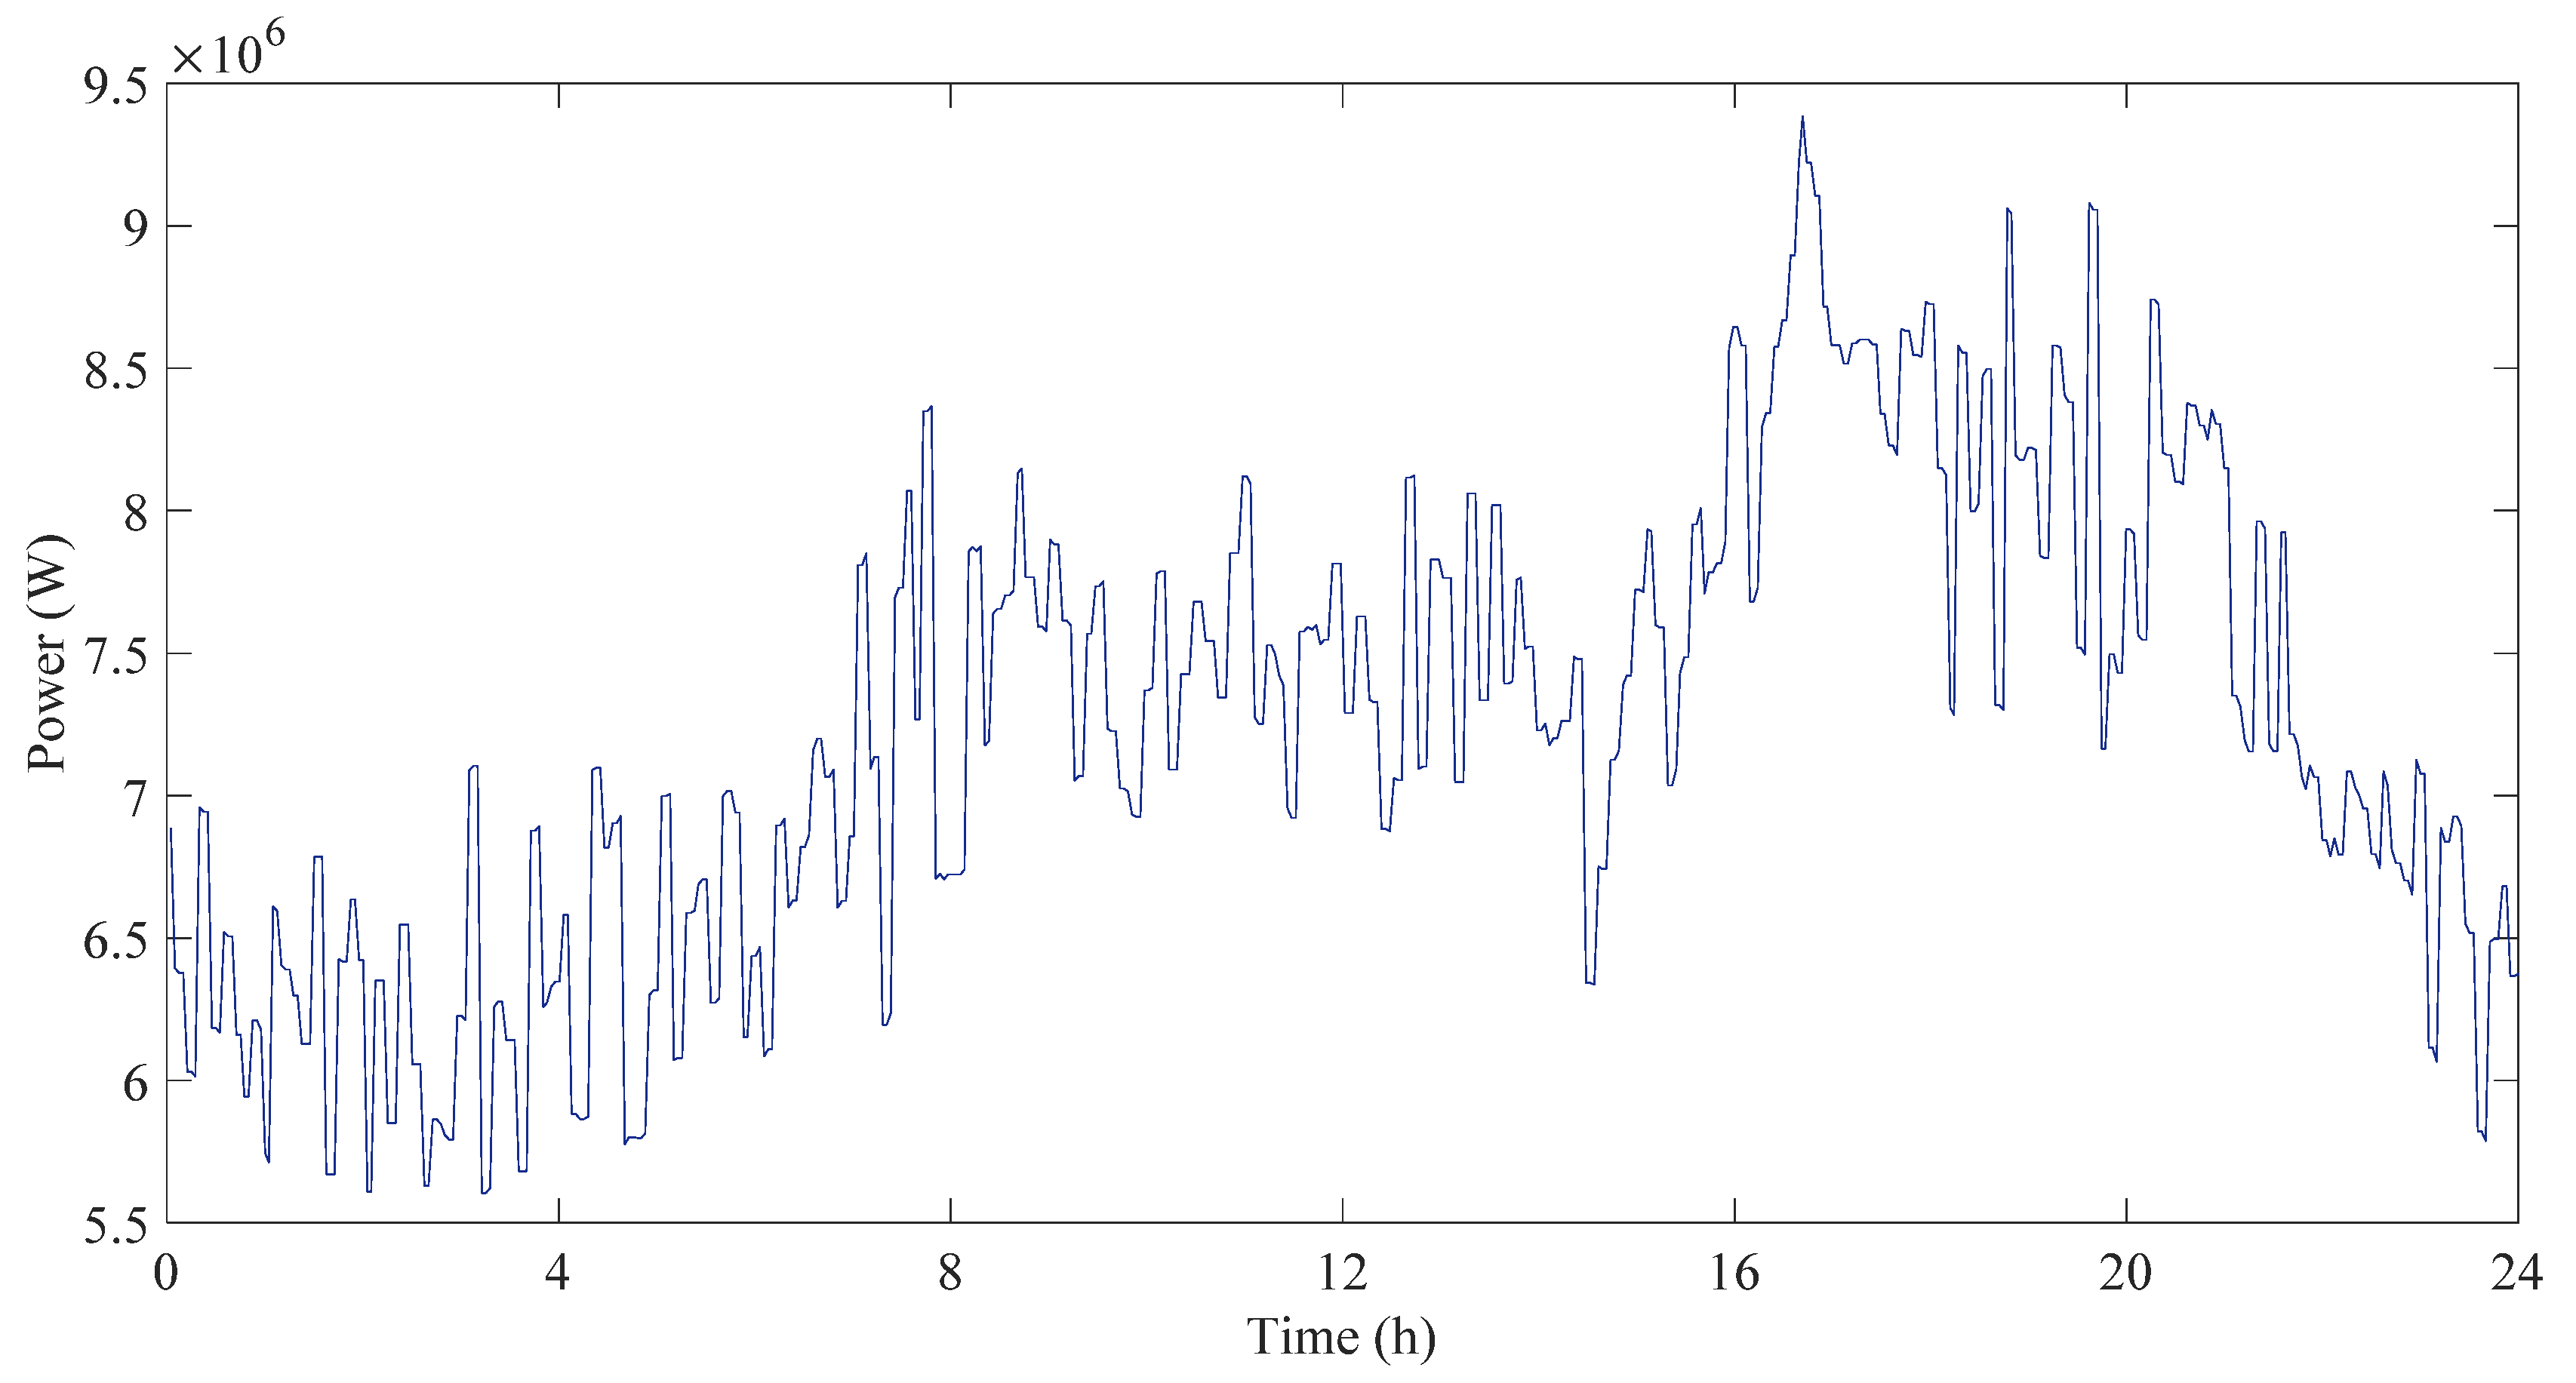
The hydraulic power is deduced by the difference between the load demand and the total power of the coal-fired/wind system in Figure 11. It is easily observed that the hydraulic power changes dramatic due to the fluctuation of wind power, where the difference between the maximum and minimum power is approximately 4000 KW and the fluctuation amplitude reaches 2000 KW in 0.2 h. This regulation process requires frequent switching of the guide vane opening, which is easy to result in the fatigue damage and the reduction of residual service life. This inevitably causes a massive economic loss of the power station.
5.2. Effect of Renewable Energy Participation on Power Fluctuation
The participation of different coal-fired and wind–hydropower quotas is an important factor affecting the complementary power performance of the hybrid system, since the appropriate energy quota is beneficial to reduce the fatigue damage of the guide vane and improve the economic and environmental benefits. In light of this consideration, this section explores the interaction relationship between the power fluctuation and the wind–hydropower participation. The installed capacity of coal-fired generator remains unchanged (i.e., 116 MW), while the ratio of wind-hydro power continuously increases from 16% to 25% during the complementary regulation process. The corresponding results are performed in Figure 12 and Figure 13.
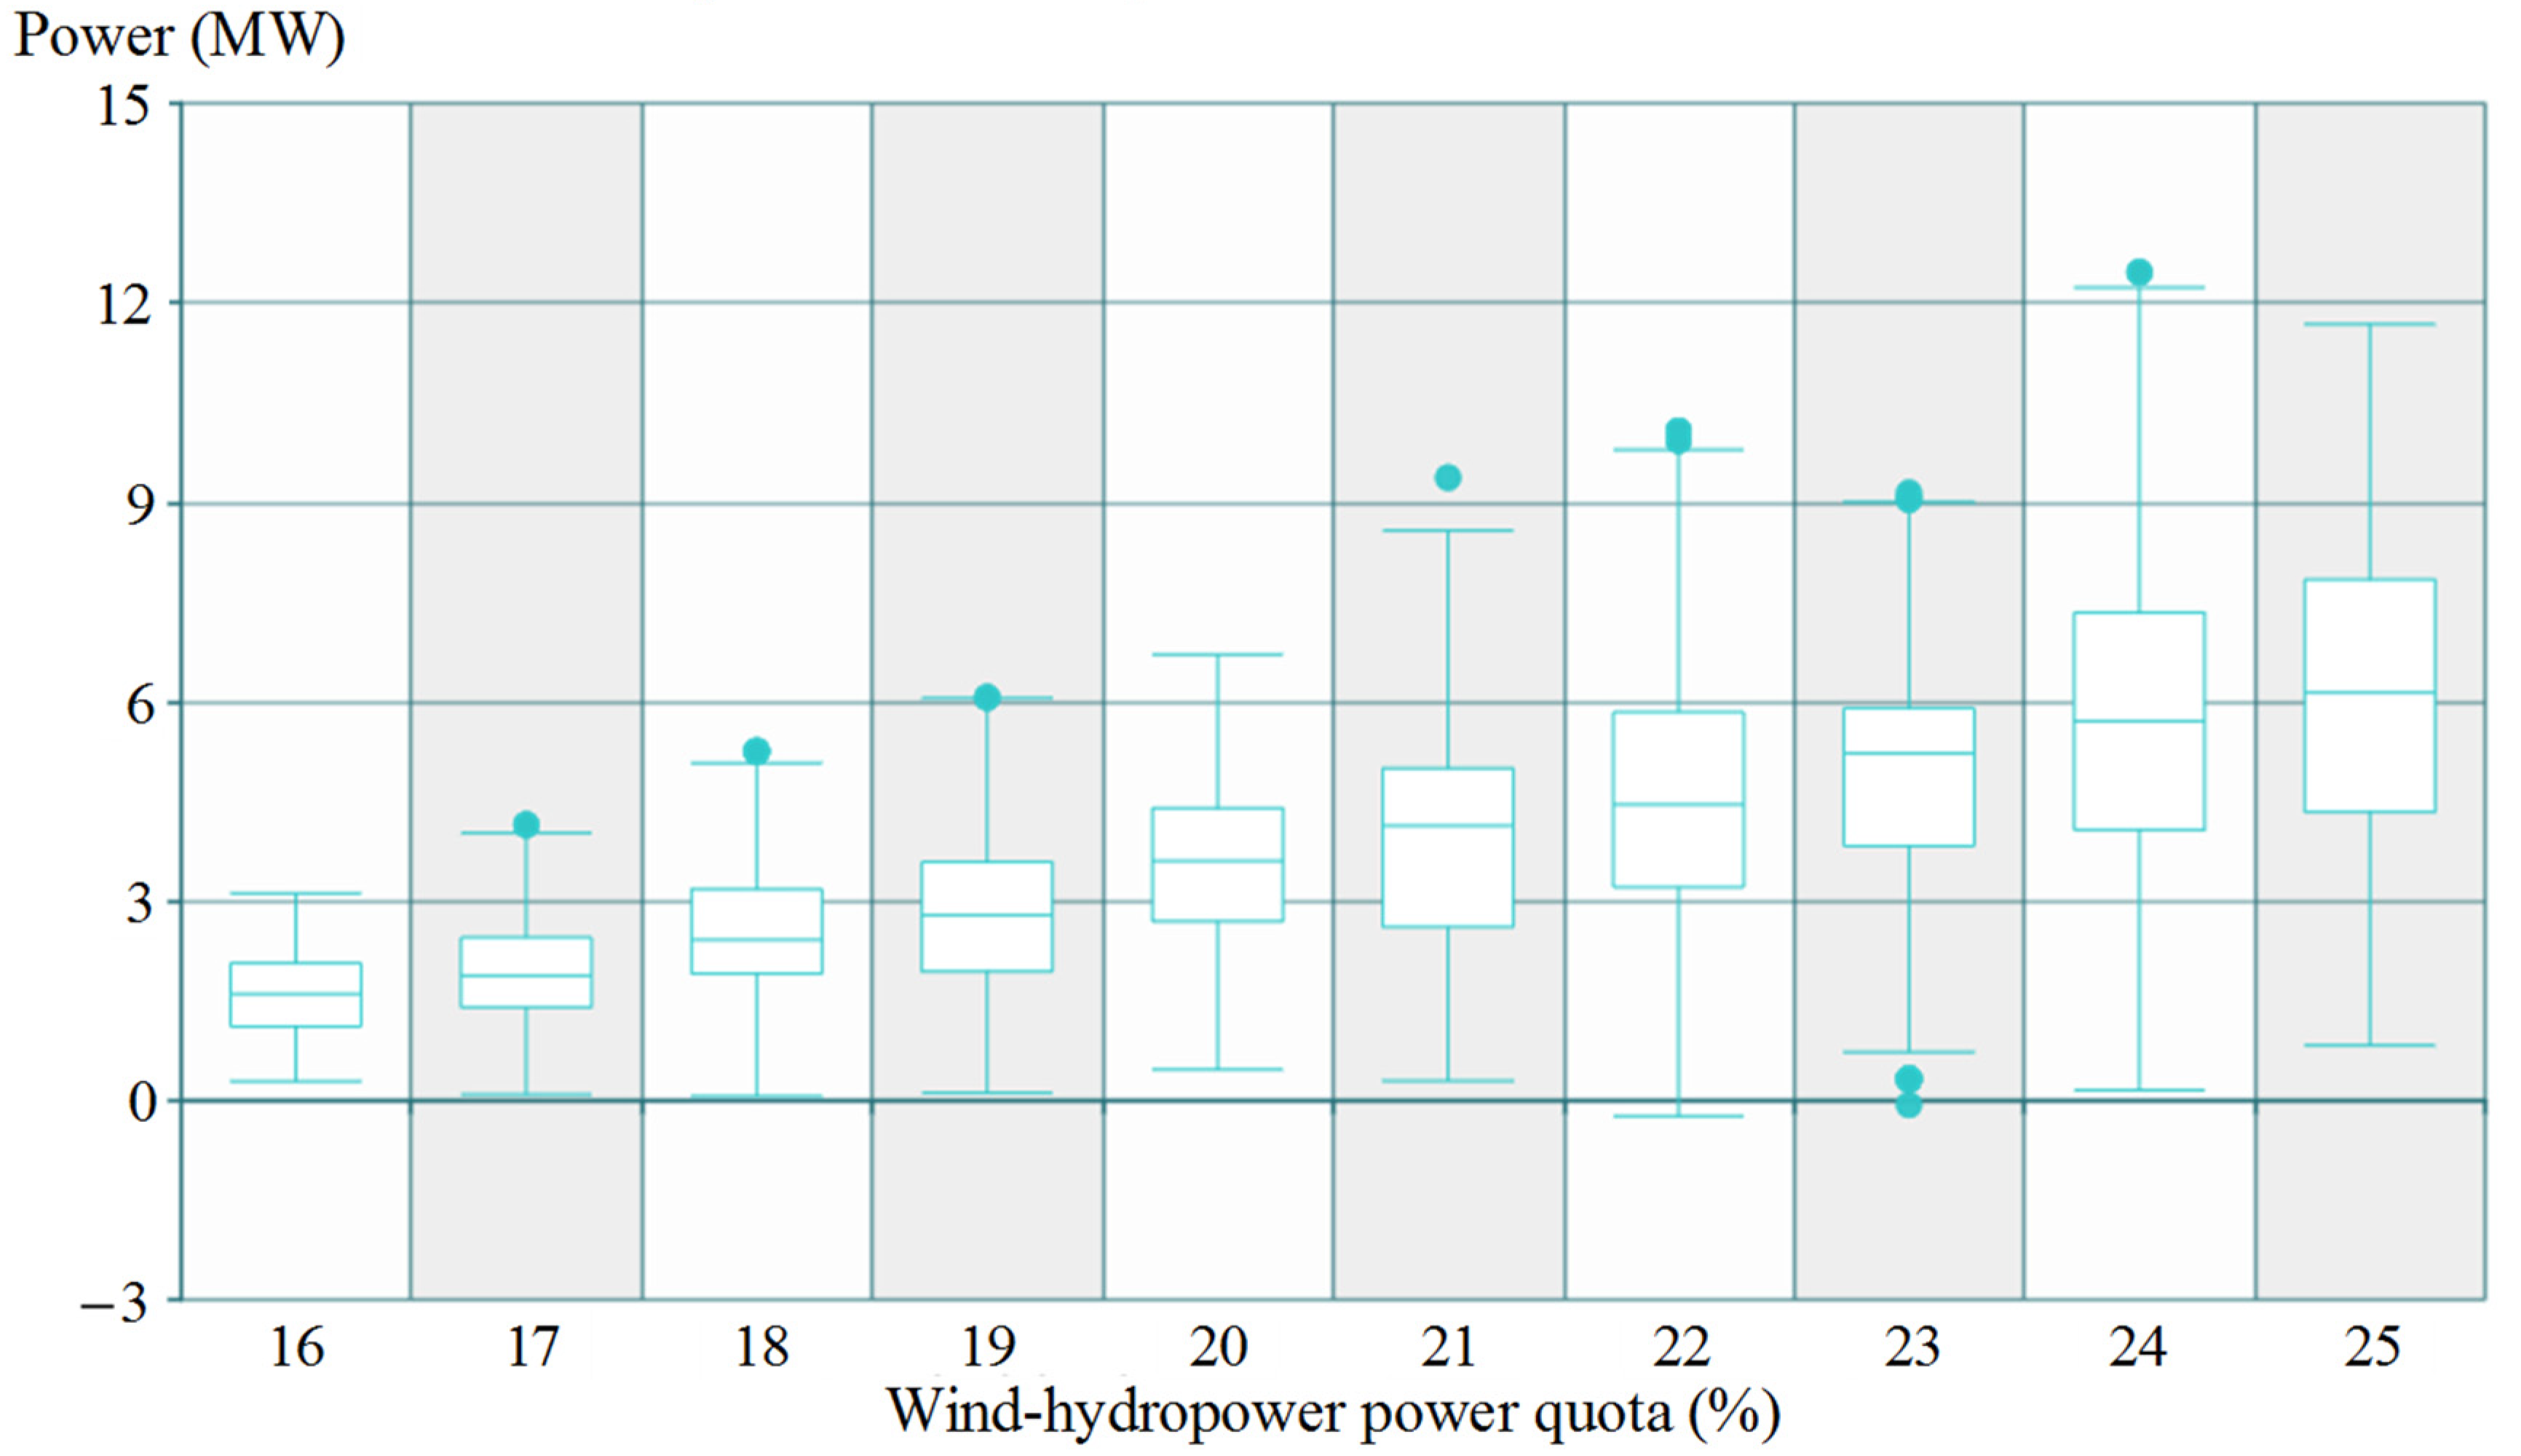
From Figure 12, the mid-value, upper quartile and lower quartile of the wind power output roughly show an increasing trend. The mid-value rises from 1.6 MW to 6.2 MW, the upper quartile changes between 2 MW and 7.8 MW, and the lower quartile varies from 1.2 MW to 4.6 MW. The mid-value reflects the increase of the wind power with the increase of the renewable energy participation from 16% to 25%. The upper quartile and lower quartile reveal that the wind power fiercely fluctuates due to the increasing installed capacity of wind energy. Meanwhile, the maximum of the wind power (12.2 MW) occurs at 24% wind and hydropower quota, while the 11.7 MW wind power at 25% wind and hydropower quota is in a second place. This means that the improved installed capacity of wind power can promote its generation ability.
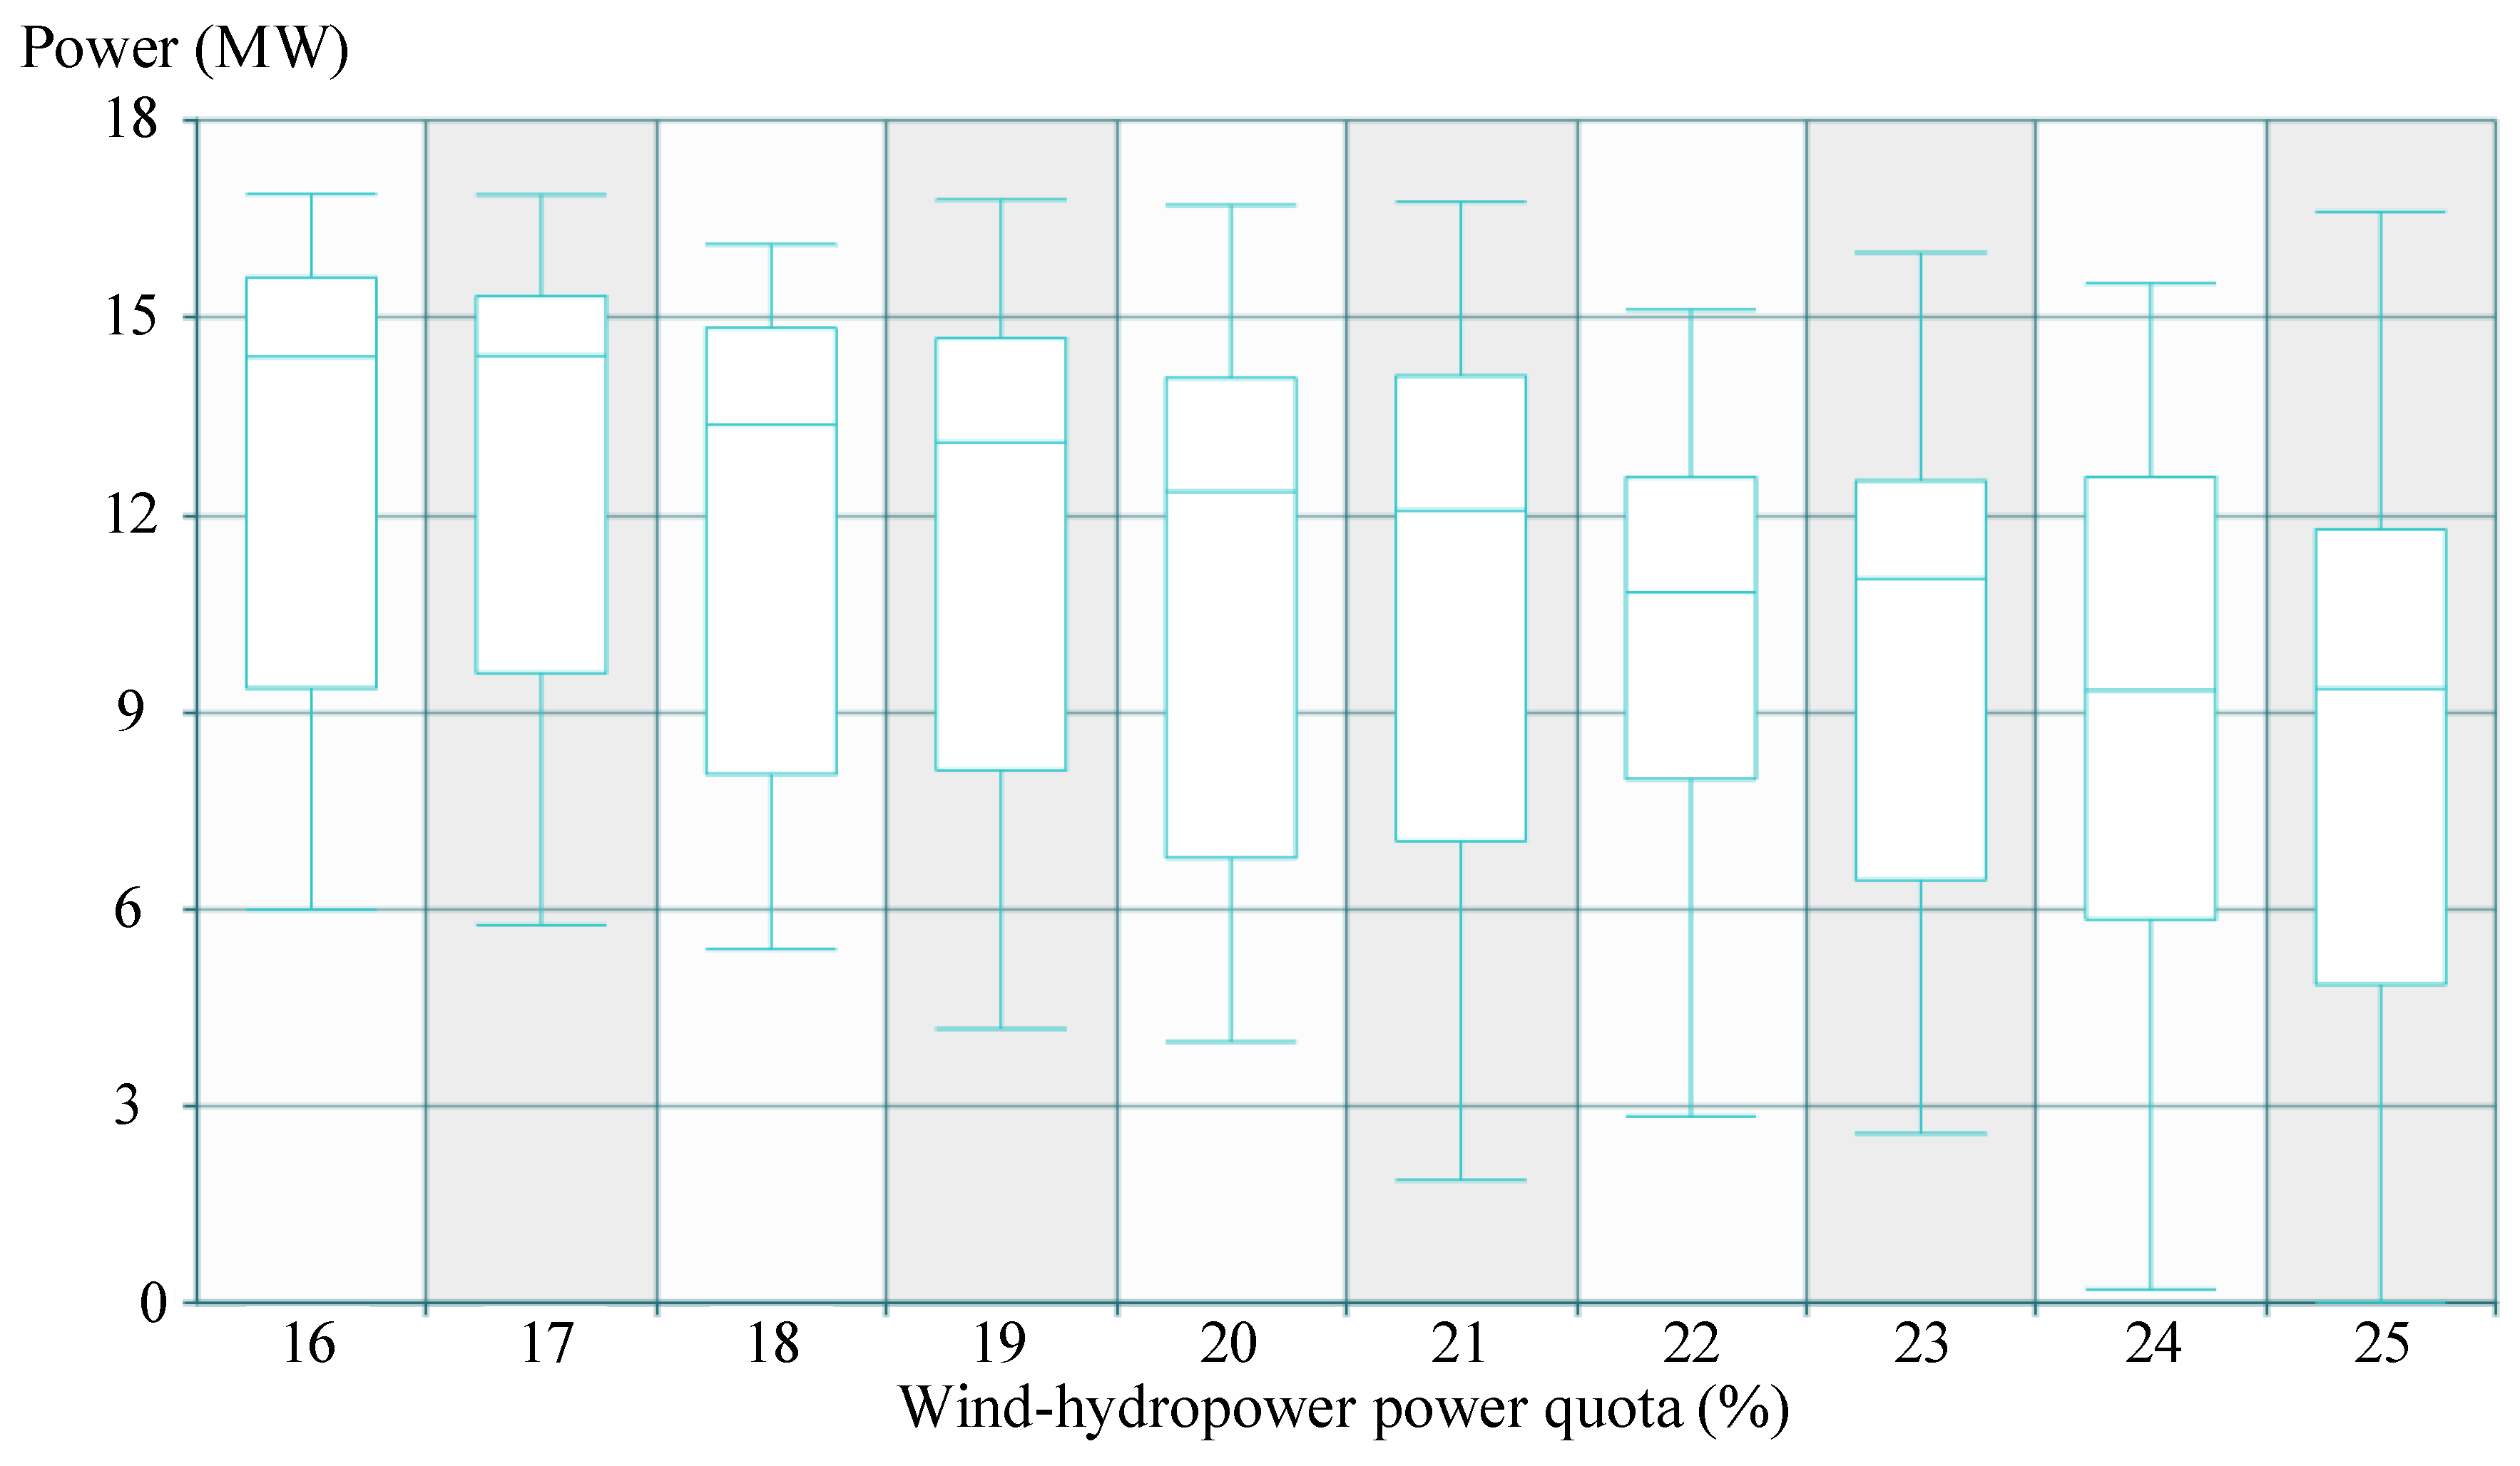
From Figure 13, the average output of the hydropower shows a decreasing trend, because its mid-value significantly declines from 14.1 MW to 9.3 MW with the increase of wind-hydropower quota. This can be explained by the suppressing effect of the hydropower on the injection of the increasing wind power. The hydropower difference between the upper quartile and lower quartile maintains a relatively large interval in this case, i.e., around (4.6 MW, 7 MW), implying that the guide vane should be frequently regulated to balance the wind power fluctuation. This easily leads to the fatigue damage of the guide vane and further causes economic loss to the power station. Moreover, with the increase of renewable energy participation, maximum hydropower (about 16.6 MW) occurs at 25% wind–hydropower quota. This is due to the increasing capacity contribution of the hydropower system.
From the above analysis, it is concluded that hydropower has a strong suppressing effect on the fluctuation of wind power. Specifically, the larger capacity participation of wind-hydro power generation, the stronger regulation ability to power fluctuations. However, this is achieved by accounting for the mechanical loss of guide vanes. The benefit problems are quantified in the next section to enable the comprehensive evaluation of the suppressing benefits of the hydropower on the multi-energy integrated power system.
5.3. Comprehensive Regulation Benefits
With the increasing participation of the renewable energy, the environmental benefit of wind and hydropower is enhanced, while the hump modulation benefit of the coal-fired generation decreases. Simultaneously, the wind and hydropower electricity prices are significantly higher than the coal-fired electricity price, which may make up for the hump modulation loss of the coal-fired generation. However, the guide vane fatigue loss generates during the complementary process in order to regulate the wind power fluctuation. It is worth noting that the load demand cannot be met if it only relies on wind and coal-fired generating units. In other words, the guide vane experiences a certain degree of switching due to balancing the power fluctuation, but frequent opening or closing will not occur.
To qualitatively assess the comprehensive economic benefit of the coal-fired/wind/hydropower generation system, this section is conducted based on the evaluation method presented in Section 2.
The real conditions for the benefit quantification include:
- (i)
- Based on the electricity status in China, the wind, hydropower and coal-fired electricity prices (i.e., Sf, Ss and Sh) are RMB 0.6/KW·h, RMB 0.35/KW·h, and RMB 0.25/KW·h, respectively.
- (ii)
- The standard coal heat combustion is −393.5 kJ/mol, and the corresponding combustion loss coefficient is 3%; meanwhile, based on the provision of International Carbon Emission Trading Market, the coal price of unit mass (Sm) equals to RMB 107.5/T.
- (iii)
- Based on China grid-connection ancillary services management, the peak-load compensation of the coal-fired power system (St) is RMB 500/MW.
- (iv)
- Both the start-up cost and shut-down costs of hydroelectric generation unit (i.e., Spq and Spt) are obedient to China’s power market standard, about RMB 20/MW.
- (v)
- The construction costs for the hydropower station, wind farm and coal-fired power station are RMB 3700/kW, RMB 30 million and RMB 100 million, respectively. The annual maintenance cost accounts for 2% total construction cost.
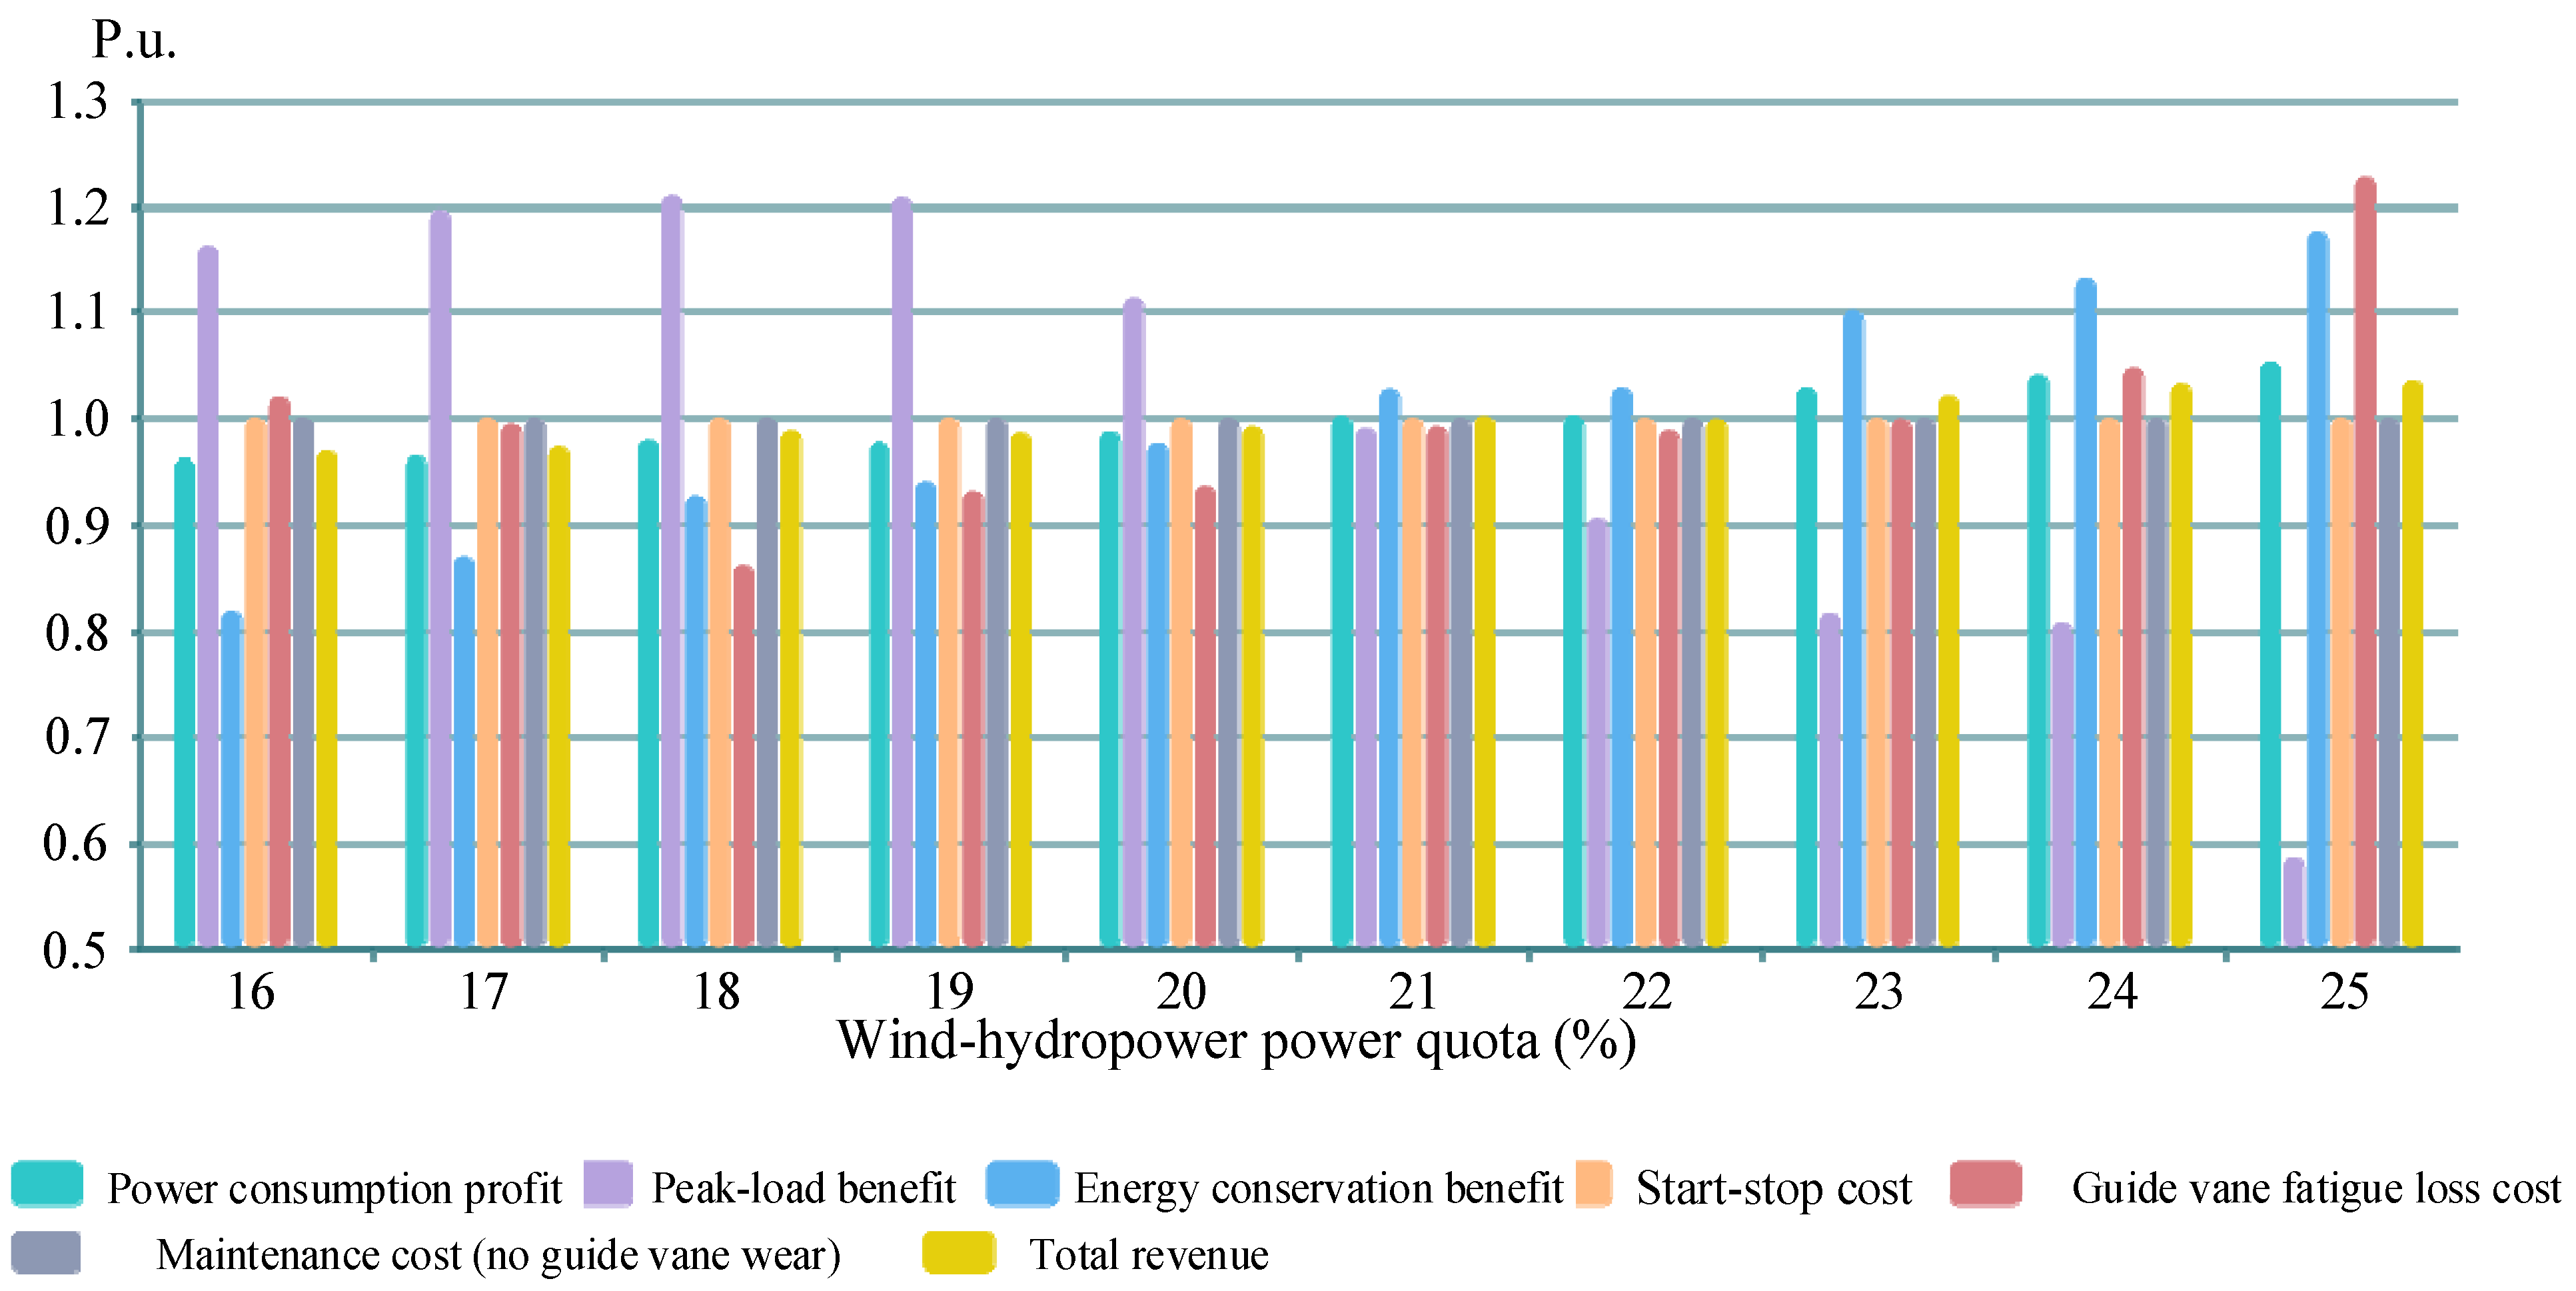
The comprehensive evaluation results are illustrated in Figure 14 and Table 2. There, the relative value of the quantified profit/cost is adopted in Figure 14, since the power consumption profit is obviously larger than the start-stop cost and guide vane fatigue loss cost. The relative value is represented by the ratio between the actual profit/cost and the base line value. The detailed actual profit/cost is further illustrated in Table 2.
From Figure 14 and Table 2, the power consumption profit generally performs an increasing trend with the improvement of the wind-hydropower participation; the total increased profit is RMB 1262.43 million. This is because the wind and hydropower electricity prices are higher than the coal-fired electricity price, and thus resulting in a higher power consumption profit per kilowatt-hour electricity. However, the power consumption profit is lower at 18% wind–hydropower quota compared with that at 19% quota (RMB 13,460.62 million vs. RMB 13,433.83 million), which is caused by the small unbalance quota of the wind power and hydropower.
There exists an inevitable decline trend for the peak-load profit of the coal-fired power system (in Figure 14 and Table 2) with an increasing share of wind power and hydropower. The profit of 16% quota decreases more than twice as much as the profit of 25% quota (RMB 675.43 million vs. RMB 341.46 million). It is interesting that the peak-load profit increases in the wind–hydropower quota interval (16%, 18%), it normally decreases in the quota interval (18%, 25%). This is attributed to two reasons: (i) Hydropower shows a better complementary effect at a relatively small capacity participation of the wind power in the quota interval (16%, 18%), and thus a longer peak-load regulation time of the coal-fired power system creates a higher peak-load profit, and (ii) The share of the coal-fired power system obviously decreases with the increase of wind-hydropower participation in the quota interval (18%, 25%), which leads to the significant decrease of the coal-fired peak-load profit. Furthermore, the wind power fluctuation enhances due to the complementary effect of the hydropower, which reduces the wind curtailment, and further promotes the energy conservation profit.
The injection of wind power increases the regulation task of the hydropower system. From Figure 14 and Table 2, the hydropower is able to regulate the wind power fluctuation due to the relatively small wind participation in the quota interval (16%, 18%). Meanwhile, the variation amplitude of the guide vane is relatively small, although the guide vane switches frequently, which cuts down the guide vane fatigue loss cost. Conversely, the fatigue loss cost shows an increasing trend between 18% and 25% quota, and the total increased fatigue loss cost is RMB 0.37 million. This is because the larger installed capacity of wind power, the larger amplitude fluctuation of guide vane opening. This aggravates the fatigue damage of the guide vane and further leads to the massive fatigue loss cost.
The total revenue in Table 2 is obtained based on the Equation (1) in Section 2. From Table 2, it can be seen that the general trend of the total revenue increases, with the wind-hydropower quota changing from 16% to 25%. Therefore, it can be concluded that the proper increase of wind and hydropower participation is good for the total economic and environmental benefits.
6. Conclusions
To investigate the comprehensive regulation benefits of hydropower generation system in reducing wind power fluctuation, a coal-fired/hydro/wind power system model is developed. Meanwhile, a comprehensive benefit evaluation method is proposed, where the power consumption profit, the peak load profit, the energy conservation profit, the guide vane fatigue cost, the maintenance cost, and the start-stop cost are defined. Based on this, different wind-hydropower quota scenes are set to quantify the complementary characteristic, power fluctuation and comprehensive regulation benefits. The main conclusions are summarized as follows.
- (1)
- The complementary characteristic of a second time scale is closely related to the wind speed patterns, while there exists three key times, i.e., the 6th hour, the 7th hour and the 19th hour in the time scale of hour. The frequency deviations for second and hour time scales not exceed the grid accepted range [−0.2 Hz, +0.2 Hz]. The hydropower system has a better complementary effect on suppressing wind power fluctuation.
- (2)
- With the wind-hydropower quota increasing, the wind power fiercely fluctuates and the wind power generation ability increases. The wind power output increases nearly three times when the wind-hydropower quota increases from 16% to 25%. Additionally, the larger wind-hydropower participation, the stronger hydraulic regulation ability to grid power fluctuations.
- (3)
- The power consumption profit and energy conservation profit increase with the wind-hydropower quota, increasing from 16% to 25%, while the guide vane fatigue loss coast shows a fluctuating trend. The total revenue shows an increasing tendency as a whole, which increases about RMB 928.62 million with the quota from 16% to 25%.
Author Contributions
Conceptualization, B.X. and S.Y.; methodology, B.X.; software, S.Y.; validation, B.X. and S.Y.; formal analysis, B.X. and J.Z. (Jingjing Zhang); investigation, J.Z. (Jingjing Zhang) and H.L.; resources, D.C.; data curation, D.C.; writing—original draft preparation, B.X., S.Y. and J.Z. (Jingjing Zhang); writing—review and editing, B.X., J.Z. (Jingjing Zhang) and J.Z. (Junzhi Zhang); visualization, S.Y. and H.L.; supervision, D.C.; project administration, D.C.; funding acquisition, B.X. All authors have read and agreed to the published version of the manuscript.
Funding
This research was funded by Beibei Xu of the Chinese Universities Scientific Fund, grant number 2452020210; Beibei Xu of the Open Research Fund Program of State Key Laboratory of Eco-hydraulics in the Northwest Arid Region, Xi’an University of Technology, grant number K4020121034; Beibei Xu of the Postdoctoral fund of Powerchina Northwest Engineering Corporation Limited, grant number kjb2021xz05. The APC was funded by Postdoctoral fund of Powerchina Northwest Engineering Corporation Limited, grant number kjb2021xz05.
Acknowledgments
This work was supported by the Chinese Universities Scientific Fund (No. 2452020210); Open Research Fund Program of State Key Laboratory of Eco-hydraulics in the Northwest Arid Region, Xi’an University of Technology, (No. K4020121034); Postdoctoral fund of Powerchina Northwest Engineering Corporation Limited (No. kjb2021xz05).
Conflicts of Interest
The authors declare no conflict of interest.
References
- Wang, X.; Chang, J.; Meng, X.; Wang, Y. Short-term hydro-thermal-wind-photovoltaic complementary operation of interconnected power systems. Appl. Energy 2018, 229, 945–962. [Google Scholar] [CrossRef]
- Silva, A.R.; Pimenta, F.M.; Assireu, A.T.; Spyrides, M.H.C. Complementarity of Brazil’s hydro and offshore wind power. Renew. Sustain. Energy Rev. 2016, 56, 413–427. [Google Scholar] [CrossRef]
- Hasanuzzaman, M.; Zubir, U.S.; Ilham, N.I.; Seng Che, H. Global electricity demand, generation, grid system, and renewable energy polices: A review. Wiley Interdiscip. Rev. Energy Environ. 2017, 6, 18. [Google Scholar] [CrossRef]
- Nema, P.; Nema, R.; Rangnekar, S. A current and future state of art development of hybrid energy system using wind and PV-solar: A review. Renew. Sustain. Energy Rev. 2009, 13, 2096–2103. [Google Scholar] [CrossRef]
- Geng, W.; Ming, Z.; Lilin, P.; Ximei, L.; Bo, L.; Jinhui, D. China’s new energy development: Status, constraints and reforms. Renew. Sustain. Energy Rev. 2016, 53, 885–896. [Google Scholar] [CrossRef]
- Paska, J.; Surma, T. Electricity generation from renewable energy sources in Poland. Renew. Energy 2014, 71, 286–294. [Google Scholar] [CrossRef]
- Xu, B.; Chen, D.; Venkateshkumar, M.; Xiao, Y.; Yue, Y.; Xing, Y.; Li, P. Modeling a pumped storage hydropower integrated to a hybrid power system with solar-wind power and its stability analysis. Appl. Energy 2019, 248, 446–462. [Google Scholar] [CrossRef]
- Zhang, J.; Li, H.; Chen, D.; Xu, B.; Mahmud, A. Flexibility assessment of a hybrid power system: Hydroelectric units in balancing the injection of wind power. Renew. Energy 2021, 171, 1313–1326. [Google Scholar] [CrossRef]
- Internation Hydropower Association (IHA). Hydropower Status Report: Sector Trends and Insights; International Hydropower Association: London, UK, 2020; pp. 1–54. [Google Scholar]
- Child, M.; Ilonen, R.; Vavilov, M.; Kolehmainen, M.; Breyer, C. Scenarios for sustainable energy in Scotland. Wind Energy 2019, 22, 666–684. [Google Scholar] [CrossRef]
- Fadai, D. Utilization of renewable energy sources for power generation in Iran. Renew. Sustain. Energy Rev. 2007, 11, 173–181. [Google Scholar] [CrossRef]
- Rosa, C.D.O.C.S.; Costa, K.A.; Christo, E.D.S.; Bertahone, P.B. Complementarity of Hydro, Photovoltaic, and Wind Power in Rio de Janeiro State. Sustainability 2017, 9, 1130. [Google Scholar]
- Hirth, L. The benefits of flexibility: The value of wind energy with hydropower. Appl. Energy 2016, 181, 210–223. [Google Scholar] [CrossRef]
- Zhang, X.; Ma, G.; Huang, W.; Chen, S.; Zhang, S. Short-Term Optimal Operation of a Wind-PV-Hydro Complementary Installation: Yalong River, Sichuan Province, China. Energies 2018, 11, 868. [Google Scholar] [CrossRef] [Green Version]
- Sørensen, P.E.; Cutululis, N.A.; Vigueras-Rodriguez, A.; Jensen, L.E.; Hjerrild, J.; Donovan, M.H.; Madsen, H. Power Fluctuations From Large Wind Farms. IEEE Trans. Power Syst. 2007, 22, 958–965. [Google Scholar] [CrossRef]
- Zeng, M.; Li, C.; Zhou, L. Progress and prospective on the police system of renewable energy in China. Renew. Sustain. Energy Rev. 2013, 20, 36–44. [Google Scholar] [CrossRef]
- Zhang, S.; Andrews-Speed, P.; Zhao, X.; He, Y. Interactions between renewable energy policy and renewable energy industrial policy: A critical analysis of China’s policy approach to renewable energies. Energy Policy 2013, 62, 342–353. [Google Scholar] [CrossRef]
- Cullen, R. Evaluating renewable energy policies. Aust. J. Agric. Resour. Econ. 2017, 61, 1–18. [Google Scholar] [CrossRef]
- Kilinc-Ata, N. The evaluation of renewable energy policies across EU countries and US states: An econometric approach. Energy Sustain. Dev. 2016, 31, 83–90. [Google Scholar] [CrossRef]
- Zhang, H.; Li, L.; Cao, J.; Zhao, M.; Wu, Q. Comparison of renewable energy policy evolution among the BRICs. Renew. Sustain. Energy Rev. 2011, 15, 4904–4909. [Google Scholar] [CrossRef]
- Levieux, L.I.; Inthamoussou, F.A.; de Battista, H. Power dispatch assessment of a wind farm and a hydropower plant: A case study in Argentina. Energy Convers. Manag. 2019, 180, 391–400. [Google Scholar] [CrossRef]
- Rosenberg, E.; Lind, A.; Espegren, K.A. The impact of future energy demand on renewable energy production—Case of Norway. Energy 2013, 61, 419–431. [Google Scholar] [CrossRef]
- Yu, X.; Yang, X.; Zhang, J. Stability analysis of hydro-turbine governing system including surge tanks under interconnected operation during small load disturbance. Renew. Energy 2019, 133, 1426–1435. [Google Scholar] [CrossRef]
- Hemmati, R.; Hooshmand, R.-A.; Khodabakhshian, A. Market based transmission expansion and reactive power planning with consideration of wind and load uncertainties. Renew. Sustain. Energy Rev. 2014, 29, 1–10. [Google Scholar] [CrossRef]
- Khan, M.R.B.; Pasupuleti, J.; Jidin, R. Load frequency control for mini-hydropower system: A new approach based on self-tuning fuzzy proportional-derivative scheme. Sustain. Energy Technol. Assess. 2018, 30, 253–262. [Google Scholar]
- Setoguchi, T.; Takao, M. Current status of self rectifying air turbines for wave energy conversion. Energy Convers. Manag. 2006, 47, 2382–2396. [Google Scholar] [CrossRef]
- Uzol, O.; Camcı, C. Aerodynamic loss characteristics of a turbine blade with trailing edge coolant ejection: Part 2—External aerodynamics, total pressure losses, and predictions. J. Turbomach. Trans. ASME 2001, 123, 249–257. [Google Scholar] [CrossRef]
- Martinez-Anido, C.B.; Brinkman, G.; Hodge, B.-M. The impact of wind power on electricity prices. Renew. Energy 2016, 94, 474–487. [Google Scholar] [CrossRef] [Green Version]
- Helseth, A.; Fodstad, M.; Askeland, M.; Mo, B.; Nilsen, O.B.; Pérez-Díaz, J.I.; Chazarra, M.; Guisández, I. Assessing hydropower operational profitability considering energy and reserve markets. IET Renew. Power Gener. 2017, 11, 1640–1647. [Google Scholar] [CrossRef] [Green Version]
- Zhao, Z.-Y.; Zhu, J.; Xia, B. Multi-fractal fluctuation features of thermal power coal price in China. Energy 2016, 117, 10–18. [Google Scholar] [CrossRef]
- Bai, X.; Jing, C.; Xiaofeng, G.; Yu, G. A Method to Evaluate Comprehensive Benefits of Hybrid Wind Power-Pumped Storage System. Power Syst. Technol. 2014, 38, 400–404. [Google Scholar]
- Castronuovo, E.D.; Lopes, J.A.P. On the Optimization of the Daily Operation of a Wind-Hydro Power Plant. IEEE Trans. Power Syst. 2004, 19, 1599–1606. [Google Scholar] [CrossRef] [Green Version]
- Yao, W.; Deng, C.; Li, D.; Chen, M.; Peng, P.; Zhang, A.H. Optimal Sizing of Seawater Pumped Storage Plant with Variable-Speed Units Considering Offshore Wind Power Accommodation. Sustainability 2019, 11, 1939. [Google Scholar] [CrossRef] [Green Version]
- Da, Z.; Xiliang, Z.; Jiankun, H.; Qimin, C. Offshore wind energy development in China: Current status and future perspective. Renew. Sustain. Energy Rev. 2011, 15, 4673–4684. [Google Scholar] [CrossRef]
- Katsaprakakis, D.A.; Christakis, D.G.; Stefanakis, I.; Spanos, P.; Stefanakis, N. Technical details regarding the design, the construction and the operation of seawater pumped storage systems. Energy 2013, 55, 619–630. [Google Scholar] [CrossRef]
- Arce, A.; Ohishi, T.; Soares, S. Optimal dispatch of generating units of the Itaipu hydroelectric plant. IEEE Trans. Power Syst. 2002, 17, 154–158. [Google Scholar] [CrossRef]
- Skogestad, S. Simple analytic rules for model reduction and PID controller tuning. J. Process Control 2004, 13, 291–309. [Google Scholar] [CrossRef] [Green Version]
- Han, J. From PID to Active Disturbance Rejection Control. IEEE Trans. Ind. Electron. 2009, 56, 900–906. [Google Scholar] [CrossRef]
- Wei, S.P. Simulation of Hqdiaulic Tuiline Rewqulating System; Huazhong University of Sciemce &Technology Press: Wuhan, China, 2011. (In Chinese) [Google Scholar]
- Zhou, D.Q.; Chen, H.X.; Chen, S.F. Research on Hydraulic Characteristics in Diversion Pipelines under a Load Rejection Process of a PSH Station. Water 2019, 11, 44. [Google Scholar] [CrossRef] [Green Version]
- Duan, C.; Minglu, Z.; Changbing, Z.; Mengjiao, Y.; Cheng, M.; Chunhe, S. Research on hydraulic-electric interference and optimisation of multi-turbine hydropower system based on the dual control mode. IET Renew. Power Gener. 2019, 13, 1096–1104. [Google Scholar] [CrossRef]
- Sun, T.; Chen, Z.; Blaabjerg, F. Voltage recovery of grid-connected wind turbines after a short-circuit fault. In Proceedings of the IEEE Power Electronics Specialists Conference, Aachen, Germany, 20–25 June 2004. [Google Scholar]
- Zhang, X.L. Construction of transient simulation model for wind turbine. Rural Econ. Sci.-Technol. 2016, 27, 37–38. (In Chinese) [Google Scholar]
- Guan, H.L. Studies on Small Signal Stability of Electric Power System in Respect of Large Wind Farm Connection; North China Electric Power University: Beijing, China, 2008. (In Chinese) [Google Scholar]
Figure 1.
Schematic diagram of PID control system. Parameters Kp, Ki and KD represent the proportional-integral-differential loop, and parameters bp, y and Ty represent the difference coefficient, the guide vane opening, and the relay time constant, respectively.
Figure 1.
Schematic diagram of PID control system. Parameters Kp, Ki and KD represent the proportional-integral-differential loop, and parameters bp, y and Ty represent the difference coefficient, the guide vane opening, and the relay time constant, respectively.

Figure 2.
Working diagram of the hydro-mechanical system defined by the transfer functions. Parameters yPID, sy, ys and y represent the microcomputer regulator output signal, the feedback signal, the mechanical displacement signal and the guide vane opening.
Figure 2.
Working diagram of the hydro-mechanical system defined by the transfer functions. Parameters yPID, sy, ys and y represent the microcomputer regulator output signal, the feedback signal, the mechanical displacement signal and the guide vane opening.

Figure 3.
Block diagram of the hydropower generation system. dw, Pref, Pe and Pm represent the deviation of generator rotor speed, the reference power, the electrical power and the hydro-turbine output power, respectively. Vref, Vd, Vq, Vstab and Vf represent the reference voltage, the stator voltage in d-axis, the stator voltage in q-axis, the stable voltage and the field voltage of excitation system. i, ifd and Qeo represent the stator current, the field current, the reactive power.

Figure 4.
Working mechanism of the DFIG in the wind farm.

Figure 5.
Block diagram of the grid-connected wind-hydropower integrated power system.

Figure 6.
Model of resultant wind speed, representing the basis wind, gradient wind, gusty wind, and random wind.
Figure 6.
Model of resultant wind speed, representing the basis wind, gradient wind, gusty wind, and random wind.

Figure 7.
Complementary results of the wind-hydropower hybrid power system in the time scale of seconds (24 s in total). The dotted lines for the frequency deviation denote the accepted values, i.e., ±0.2 Hz. The power response is equal to the difference between the load demand and the actual output of wind power. The “p.u.” is the short for the unit of guide vane opening, hydro-turbine power and power response, the “Hz” is the short for the unit of frequency deviation, and the “s” is the short for the time unit.

Figure 8.
Complementary results of the wind-hydro hybrid power system in the time scale of hours (24 h in total). The dotted lines for the frequency deviation denote the accepted values, i.e., ±0.2 Hz. The power response is equal to the difference between the load demand and the actual output of wind power. The “p.u.” is short for the unit of guide vane opening, hydro-turbine power and power response, the “Hz” is short for the unit of frequency deviation, and the “h” is short for the time unit.

Figure 9.
Case study of IEEE 14 Bus Power System. This power model consists of twelve coal-fired generators, a 30 MW hydropower generation system, and a 9 MW wind power system.
Figure 9.
Case study of IEEE 14 Bus Power System. This power model consists of twelve coal-fired generators, a 30 MW hydropower generation system, and a 9 MW wind power system.

Figure 10.
Hourly variety rules on a typical day with respect to the coal-fired power, wind power and load demand of a power station. The “W” is the short for the unit of coal-fired power, wind power and load demand, and the “h” is the short for the time unit.
Figure 10.
Hourly variety rules on a typical day with respect to the coal-fired power, wind power and load demand of a power station. The “W” is the short for the unit of coal-fired power, wind power and load demand, and the “h” is the short for the time unit.

Figure 11.
Suppressing hydraulic power used to complement the intermittent injection of wind power. The “W” is short for the unit of coal-fired power, wind power and load demand, and the “h” is short for the time unit.
Figure 11.
Suppressing hydraulic power used to complement the intermittent injection of wind power. The “W” is short for the unit of coal-fired power, wind power and load demand, and the “h” is short for the time unit.

Figure 12.
Box plot of the wind power fluctuation under different wind-hydropower quota scenarios. The “W” is short for the unit of wind power, and “%” is short for the unit of energy quota.
Figure 12.
Box plot of the wind power fluctuation under different wind-hydropower quota scenarios. The “W” is short for the unit of wind power, and “%” is short for the unit of energy quota.

Figure 13.
Box plot of the hydraulic power fluctuation under different wind-hydropower quota scenarios. The “W” is the short for the unit of hydraulic power, and the “%” is the short for the unit of energy quota.
Figure 13.
Box plot of the hydraulic power fluctuation under different wind-hydropower quota scenarios. The “W” is the short for the unit of hydraulic power, and the “%” is the short for the unit of energy quota.

Figure 14.
Comprehensive regulation benefit of wind–hydropower renewable energy in improving the utilization of coal-fired generation. Y-axis uses the relative value of the quantified profit/cost to represent the volatility coefficient, and the relative value is equal to the ratio between the actual value and base line value. The “P.u.” is short for the profit/cost unit, and “%” is short for the unit of energy quota.


Table 1.
Operation modes of generator units.
| Unit Type | Number of Units | Rated Output/MW | Minimum Output/MW |
|---|---|---|---|
| 18 MW | 1 | 18 | 6 |
| 18 MW | 1 | 18 | 8 |
| 12 MW | 1 | 12 | 4 |
| 12 MW | 1 | 12 | 5 |
| 10 MW | 1 | 10 | 3 |
| 10 MW | 1 | 10 | 4 |
| 8 MW | 1 | 8 | 2 |
| 8 MW | 1 | 8 | 3 |
| 5 MW | 2 | 5 | 1 |
| 5 MW | 2 | 5 | 1 |
| Sum | 12 | 116 | 39 |
Table 2.
The quantified comprehensive regulation benefits of the coal-fired/wind/hydropower hybrid power system.
Table 2.
The quantified comprehensive regulation benefits of the coal-fired/wind/hydropower hybrid power system.
| Quota | Power Consumption Profit | Peak-Load Profit | Energy Conservation Profit | Start-Stop Cost | Guide Vane Fatigue Loss Cost | Maintenance Cost (No Guide Vane Wear) | Total Revenue |
|---|---|---|---|---|---|---|---|
| 16% | 13,227.16 | 675.43 | 1.23 | 21.90 | 1.82 | 482.00 | 13,398.11 |
| 17% | 13,259.65 | 695.33 | 1.31 | 21.90 | 1.77 | 482.00 | 13,450.61 |
| 18% | 13,460.62 | 702.63 | 1.39 | 21.90 | 1.53 | 482.00 | 13,659.20 |
| 19% | 13,433.83 | 701.53 | 1.41 | 21.90 | 1.66 | 482.00 | 13,631.21 |
| 20% | 13,574.50 | 646.60 | 1.47 | 21.90 | 1.67 | 482.00 | 13,716.99 |
| 21% | 13,777.14 | 575.42 | 1.55 | 21.90 | 1.77 | 482.00 | 13,848.44 |
| 22% | 13,784.41 | 526.33 | 1.55 | 21.90 | 1.76 | 482.00 | 13,806.62 |
| 23% | 14,152.15 | 474.87 | 1.66 | 21.90 | 1.78 | 482.00 | 14,122.99 |
| 24% | 14,321.87 | 469.57 | 1.70 | 21.90 | 1.87 | 482.00 | 14,287.38 |
| 25% | 14,489.59 | 341.46 | 1.77 | 21.90 | 2.19 | 482.00 | 14,326.73 |
Publisher’s Note: MDPI stays neutral with regard to jurisdictional claims in published maps and institutional affiliations. |
© 2021 by the authors. Licensee MDPI, Basel, Switzerland. This article is an open access article distributed under the terms and conditions of the Creative Commons Attribution (CC BY) license (https://creativecommons.org/licenses/by/4.0/).
Share and Cite
MDPI and ACS Style
Xu, B.; Zhang, J.; Yuan, S.; Li, H.; Chen, D.; Zhang, J. Comprehensive Regulation Benefits of Hydropower Generation System in Reducing Wind Power Fluctuation. Water 2021, 13, 2987. https://doi.org/10.3390/w13212987
AMA Style
Xu B, Zhang J, Yuan S, Li H, Chen D, Zhang J. Comprehensive Regulation Benefits of Hydropower Generation System in Reducing Wind Power Fluctuation. Water. 2021; 13(21):2987. https://doi.org/10.3390/w13212987
Chicago/Turabian StyleXu, Beibei, Jingjing Zhang, Shuai Yuan, Huanhuan Li, Diyi Chen, and Junzhi Zhang. 2021. "Comprehensive Regulation Benefits of Hydropower Generation System in Reducing Wind Power Fluctuation" Water 13, no. 21: 2987. https://doi.org/10.3390/w13212987
Note that from the first issue of 2016, this journal uses article numbers instead of page numbers. See further details here.