
Analysis of Bound Water and Its Influence Factors in Mixed Clayey Soils
by
 ,
,
Er-Jing Yang
1,2, 
Zhao-Tian Zeng
2,*,
Hong-Yan Mo
2,*,
Tao Hu
1,
Cheng-Lin Yang
2 and
Shuang-Hui Tang
2 1
Yellow River Conservancy Technical Institute, Kaifeng 475004, China
2
College of Civil and Architectural Engineering, Guilin University of Technology, Guilin 541004, China
*
Authors to whom correspondence should be addressed.
Water 2021, 13(21), 2991; https://doi.org/10.3390/w13212991
Submission received: 18 September 2021
/
Revised: 19 October 2021
/
Accepted: 19 October 2021
/
Published: 22 October 2021
(This article belongs to the Special Issue Water–Rock/Soil Interaction)
Abstract
:Bound water is an important factor in controlling the physical, chemical and mechanical properties of clayey soils, and it plays an important role in geotechnical engineering disaster prevention and environmental protection. There are many factors (such as soil texture, mineral composition, specific surface area (SSA), organic matter content, porosity and so on) that affect bound water in natural clayey soils. However, the main factors are mineral composition and specific surface area (SSA). Experimental tests on specific surface area and isothermal adsorption of a series of artificial mixed clayey soils were carried out to determine the different types of bound water. On this basis, the relationship between the bound water of mixed clayey soils and influencing factors of mineral composition and specific surface area are discussed. The results show that relative humidities of RH = 0.90 and 0.98, in an isothermal adsorption method, are the boundary-dividing points between strongly bound water and weakly bound water, and between weakly bound water and free water, respectively. The bound water content of the mixed clayey soils increased linearly with the montmorillonite content and specific surface area. Clay’s mineral composition (montmorillonite) was found to be the most fundamental influencing factor.
1. Introduction
Clay minerals are the main components of clayey soil, which adsorb bound water because of their hydration-activation centers. Bound water is one of the important factors in controlling the multiple physical and chemical properties of clay, including consistence, plasticity, dispersion, expansion, and shrinkage [1,2,3,4,5,6,7]. It is very meaningful to quantify the boundaries between different types of bound water in clays. The quantified boundaries help to predict the physical–chemical processes that occur after clay minerals are combined with water, and control the special physical, chemical, and mechanical properties of hydrated clay. It plays an important role in geotechnical engineering disaster prevention and environmental protection [8,9].
For a long time, scholars at home and abroad have carried out in-depth research around the types and boundaries of bound water in clays, leading to the development of the volumetric bottle and isothermal adsorption (IA), thermogravimetric analysis (TGA), infrared spectroscopy, ion exchange, nuclear magnetic resonance (NMR) and theoretical formula methods [10]. Specifically among them, isothermal adsorption (IA) is based on adsorption theory [11,12], which has a definite physical meaning and relatively simple test operation. At the same time, it can capture the hydration process of clays and the changes in various physical parameters after clay adsorbs and binds water. In recent years, this method has been widely used in the field of geotechnical engineering. For example, Wang [13,14] adopted isothermal adsorption to quantitatively determine the amount of adsorbed bound water on a clay surface and its limits. Wang [15], Li [16], and Song [17] used isothermal adsorption to divide the types and boundaries of bound water in loess, but the boundaries of strongly and weakly bound water were different, due to differences in the assessed soil samples. Wu [18] carried out isothermal adsorption tests on soft clays in three regions (Shanghai, Tianjin and Suzhou in China). It was found that the amount of bound water of soft clays in the three regions was different, but their boundaries between strongly and weakly bound water was P/Ps = 0.9. The above research results indicate that differences in bound water content of various clays are mainly due to a variety of factors such as mineral composition, specific surface area, and so on. Therefore, it is necessary to study the relationship between these factors and bound water content.
However, there are many factors (such as soil texture, mineral composition, specific surface area (SSA), organic matter content, porosity and so on) that affect bound water in clayey soils in nature. This paper only discusses the influence of mineral composition and SSA on bound water; a series of artificial clayey soils, formed from specific minerals mixed in different ratios, is used for relevant tests in order to facilitate the control of test conditions. This study carried out isothermal adsorption tests on a series of artificially mixed clays and found the types of bound water adsorbed by clayey soils and their boundaries. On this basis, the relationship between the combined waters of mixed clayey soils and influencing factors, such as mineral composition and specific surface area, are discussed.
2. Experimental Materials and Methods
2.1. Experimental Materials
Commercial high-purity powders, such as sodium montmorillonite (Mnt), kaolin (Kln), and feldspar (Fsp) were used in the experiments. The main physical properties of these powders are presented in Table 1. To disclose the influence of mineral composition on bound water adsorption by clays, a series of artificially mixed clayey soils (Table 2) were prepared from these powders in different mix rations. All clay samples were filtered through a 0.075-mm sieve, dried to constant weight in an oven at 250 °C for 24 h, cooled to room temperature in a dryer, relocated to a clean airtight plastic bottle, labeled, and finally stored in a dryer for later use.
2.2. Experimental Methods
2.2.1. Specific Surface Area Test—Methylene Blue Adsorption
The methylene blue adsorption method (MB) (EN 933-9, 2009) [19] was used to determine the specific surface area (SSA) of the above samples (S-1~S-13). The test procedure was as follows:
(1) About 30 g of mixed dry samples, with some distilled water, were put into a beaker to prepare a certain amount of soil–water mixture. The mixture was stirred for 5 min with a mechanical agitator at 600 r/min.
(2) The prepared methylene blue solution was added into the mixed solution drop by drop, continued stirring for 1 minute at 400 r/min; Then, a drop of the mixed solution was dipped onto the filter paper with a glass rod with diameter of about 8 mm.
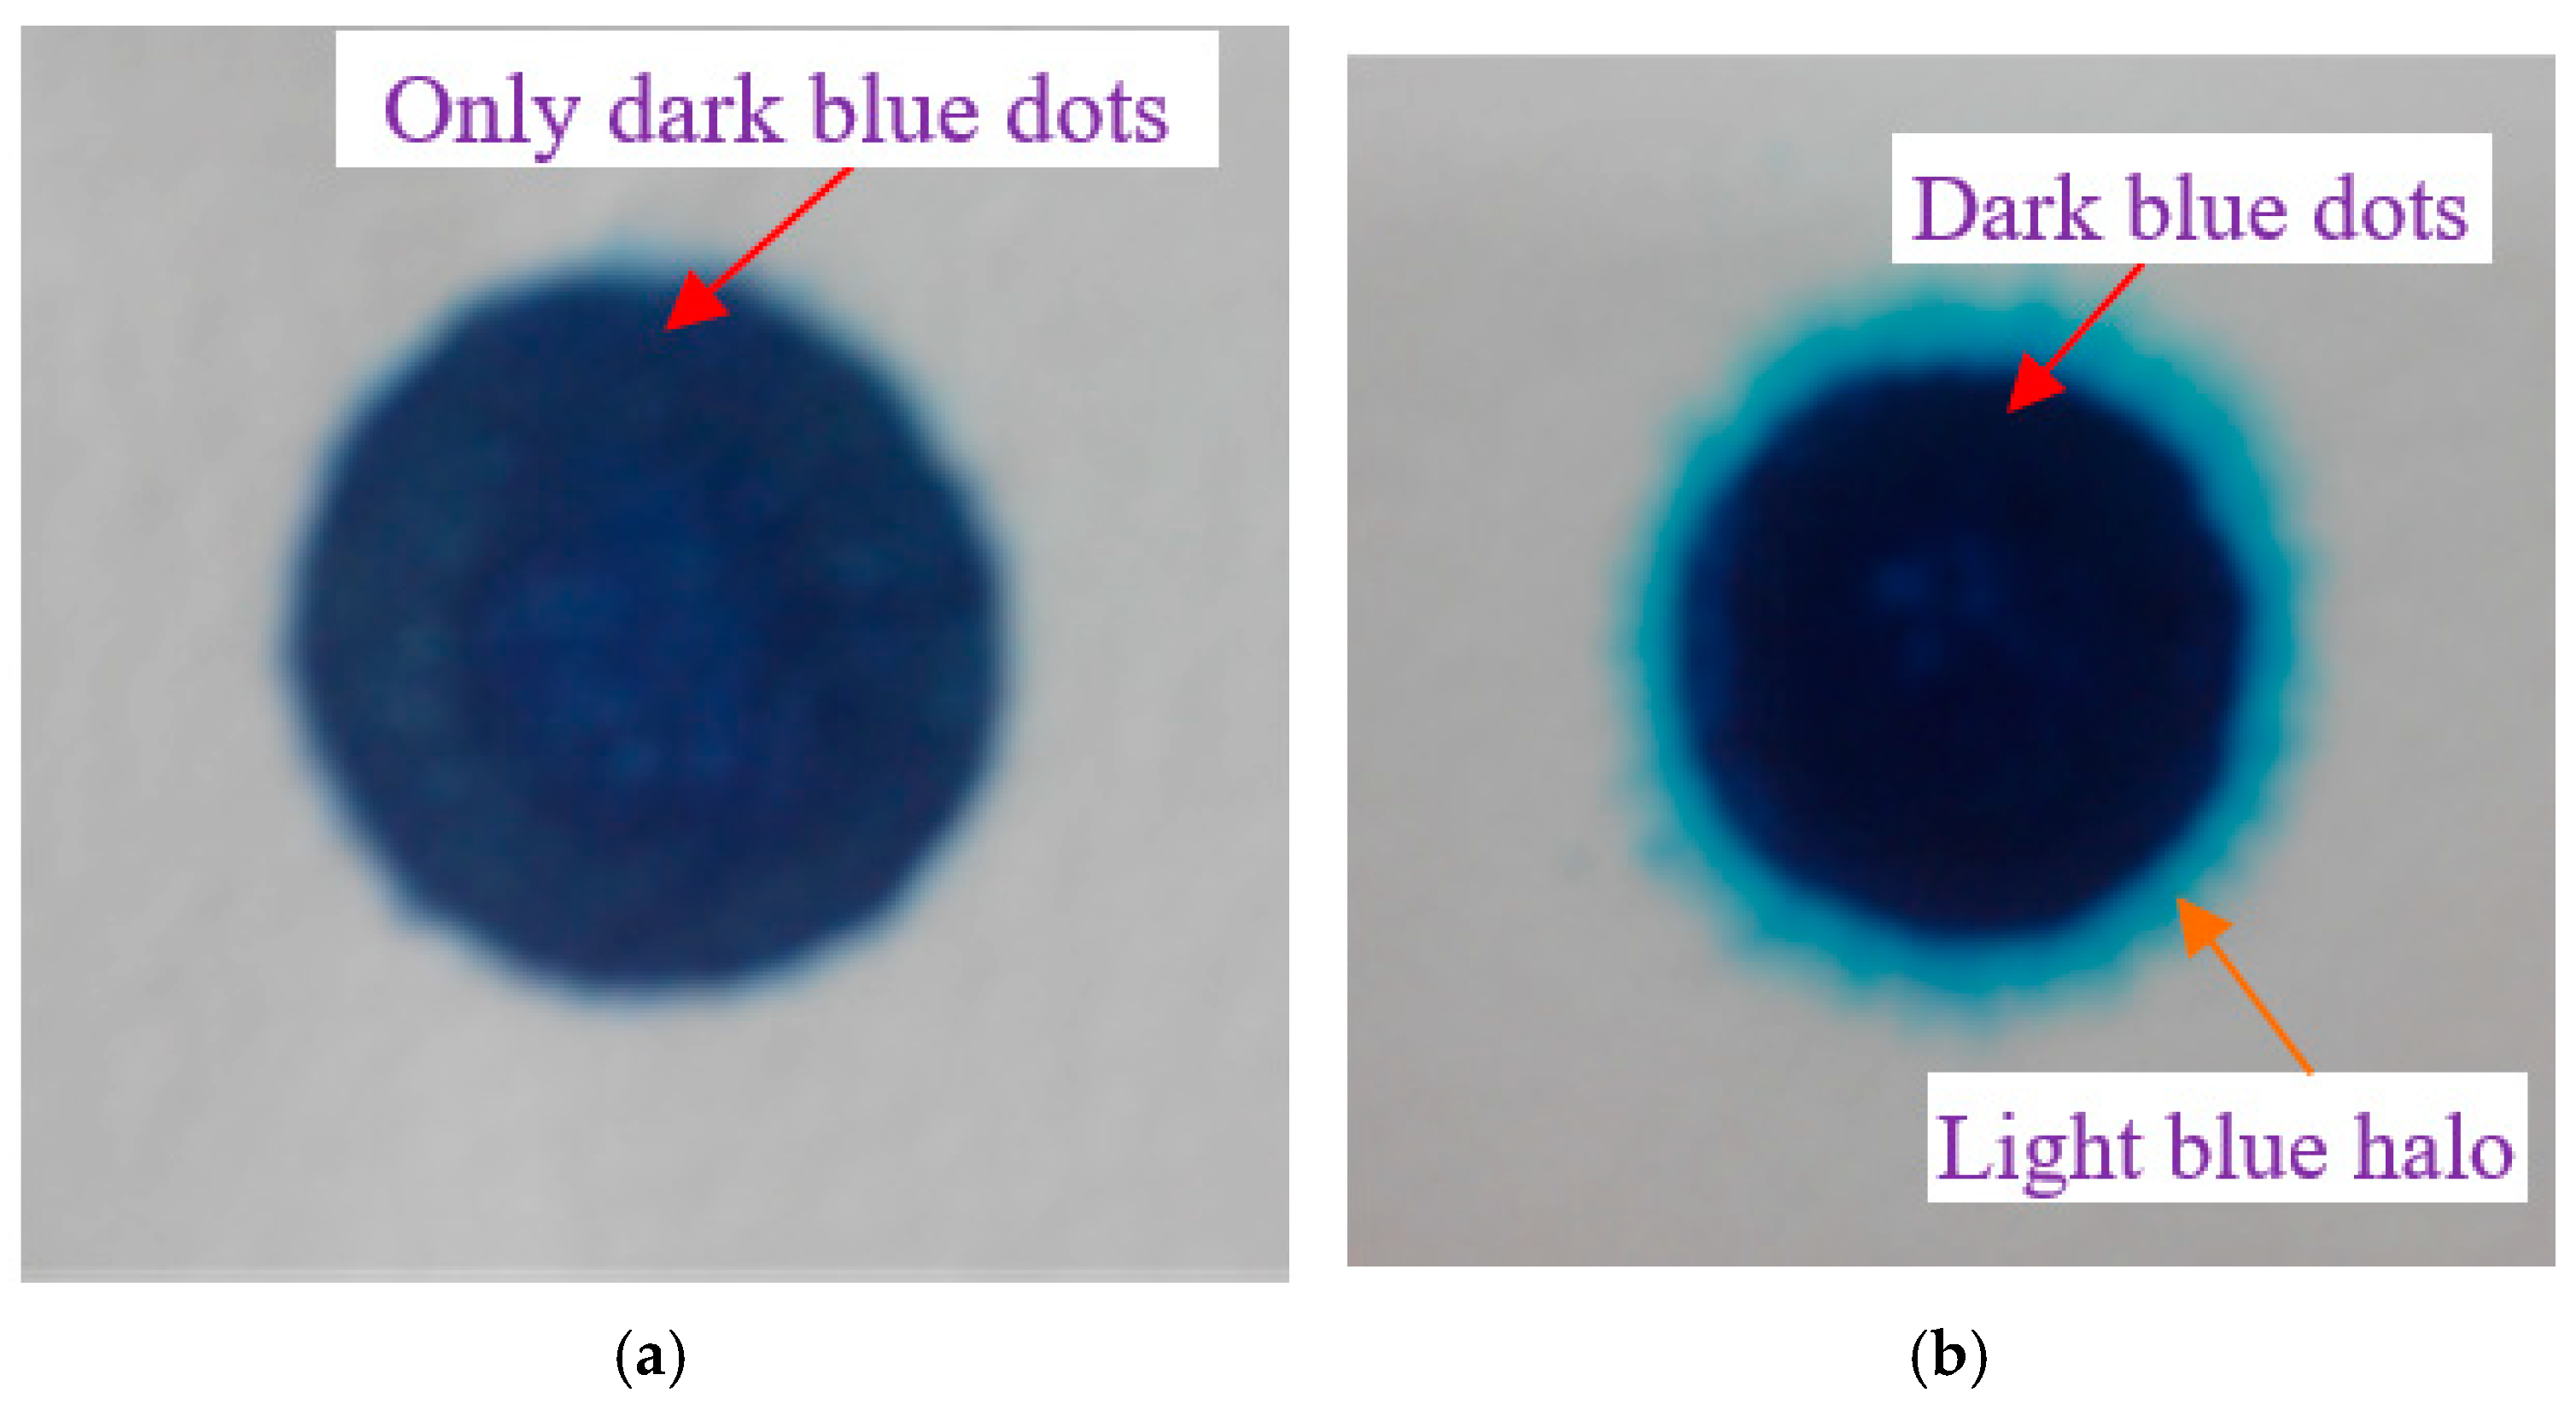
(3) If only a blue dot appears on the filter paper (Figure 1a), step (2) was repeated. When a stable blue halo (Figure 1b), with a width of about 1 mm and surrounding the dark blue part, appears on the filter paper, we stopped dripping when the blue halo had remained for 5 min (indicating that the soil sample has absorbed methylene blue molecules to saturation) and finally recorded the total volume of added methylene blue solution, completing the test procedure.
Average values were obtained twice for each sample. Due to the large specific surface area of montmorillonite and the amount of methylene blue solution required for the test, 5–10 g was determined to be an appropriate amount of soil for samples containing montmorillonite, and 30 g for soil samples without montmorillonite.
The formula for calculating the specific surface area (SSA) of soils by methylene blue method is shown as follows:
In equation: SSA is specific surface area (m2/g); CMB is methylene blue concentration (g/mL); V is the volume of methylene blue solution adsorbed (mL); NA is the Avogadro constant, which equals to 6.02 × 10²³ mol−1; AMB is the area covered by one MB molecule, which equals 130 Å2; ms is the quality of dried soil sample; 319.87 is the molar mass of the MB molecule.
2.2.2. Bound Water Determination—Isothermal Adsorption Method
Based on the adsorption theory, the adsorption isotherm method (IA) was adopted to measure the variation in the amount of bound water adsorbed by solid particles per unit weight, with pressure and humidity kept constant [13,14,15,16,17]. Key to our tests was the control of the relative humidity (RH) in the glass dryer with a saturated salt solution. The samples were weighed by a 1/10,000 analytical balance (measuring span: 200 g, and measuring accuracy: 0.1 mg). The experimental temperature was controlled at around 20 ± 0.5 °C. The experimental process was carried out in the following steps:
(1) Twelve saturated salt solutions representing different relative humidities were prepared in a constant-temperature environment (T = 20 °C), as shown in Table 3 [20]. Then, the configured salt solutions were poured into 12 desiccators, the edge of the lid of each desiccator was sealed with petroleum jelly, and the humidity of the environment inside the desiccator was left to equilibrate for more than 10 days. When solid salt precipitated from the solution had formed, the solution was considered be saturated [21]. The humidity of the environment, with RH = 100%, was controlled using distilled water.
(2) Then, 3–5 g soil samples were weighed on the analytical balance, laid flat in an aluminum box (two parallel experiments for each soil sample), and the aluminum box of soil samples was placed on a ceramic plate in the desiccator. Then, the soil samples were weighed once every 24 h, their weights recorded until the difference between their front and rear masses did not exceed 0.0005 g—that is, until the adsorption of bound water had reached equilibrium, at which point the experiment had finished.
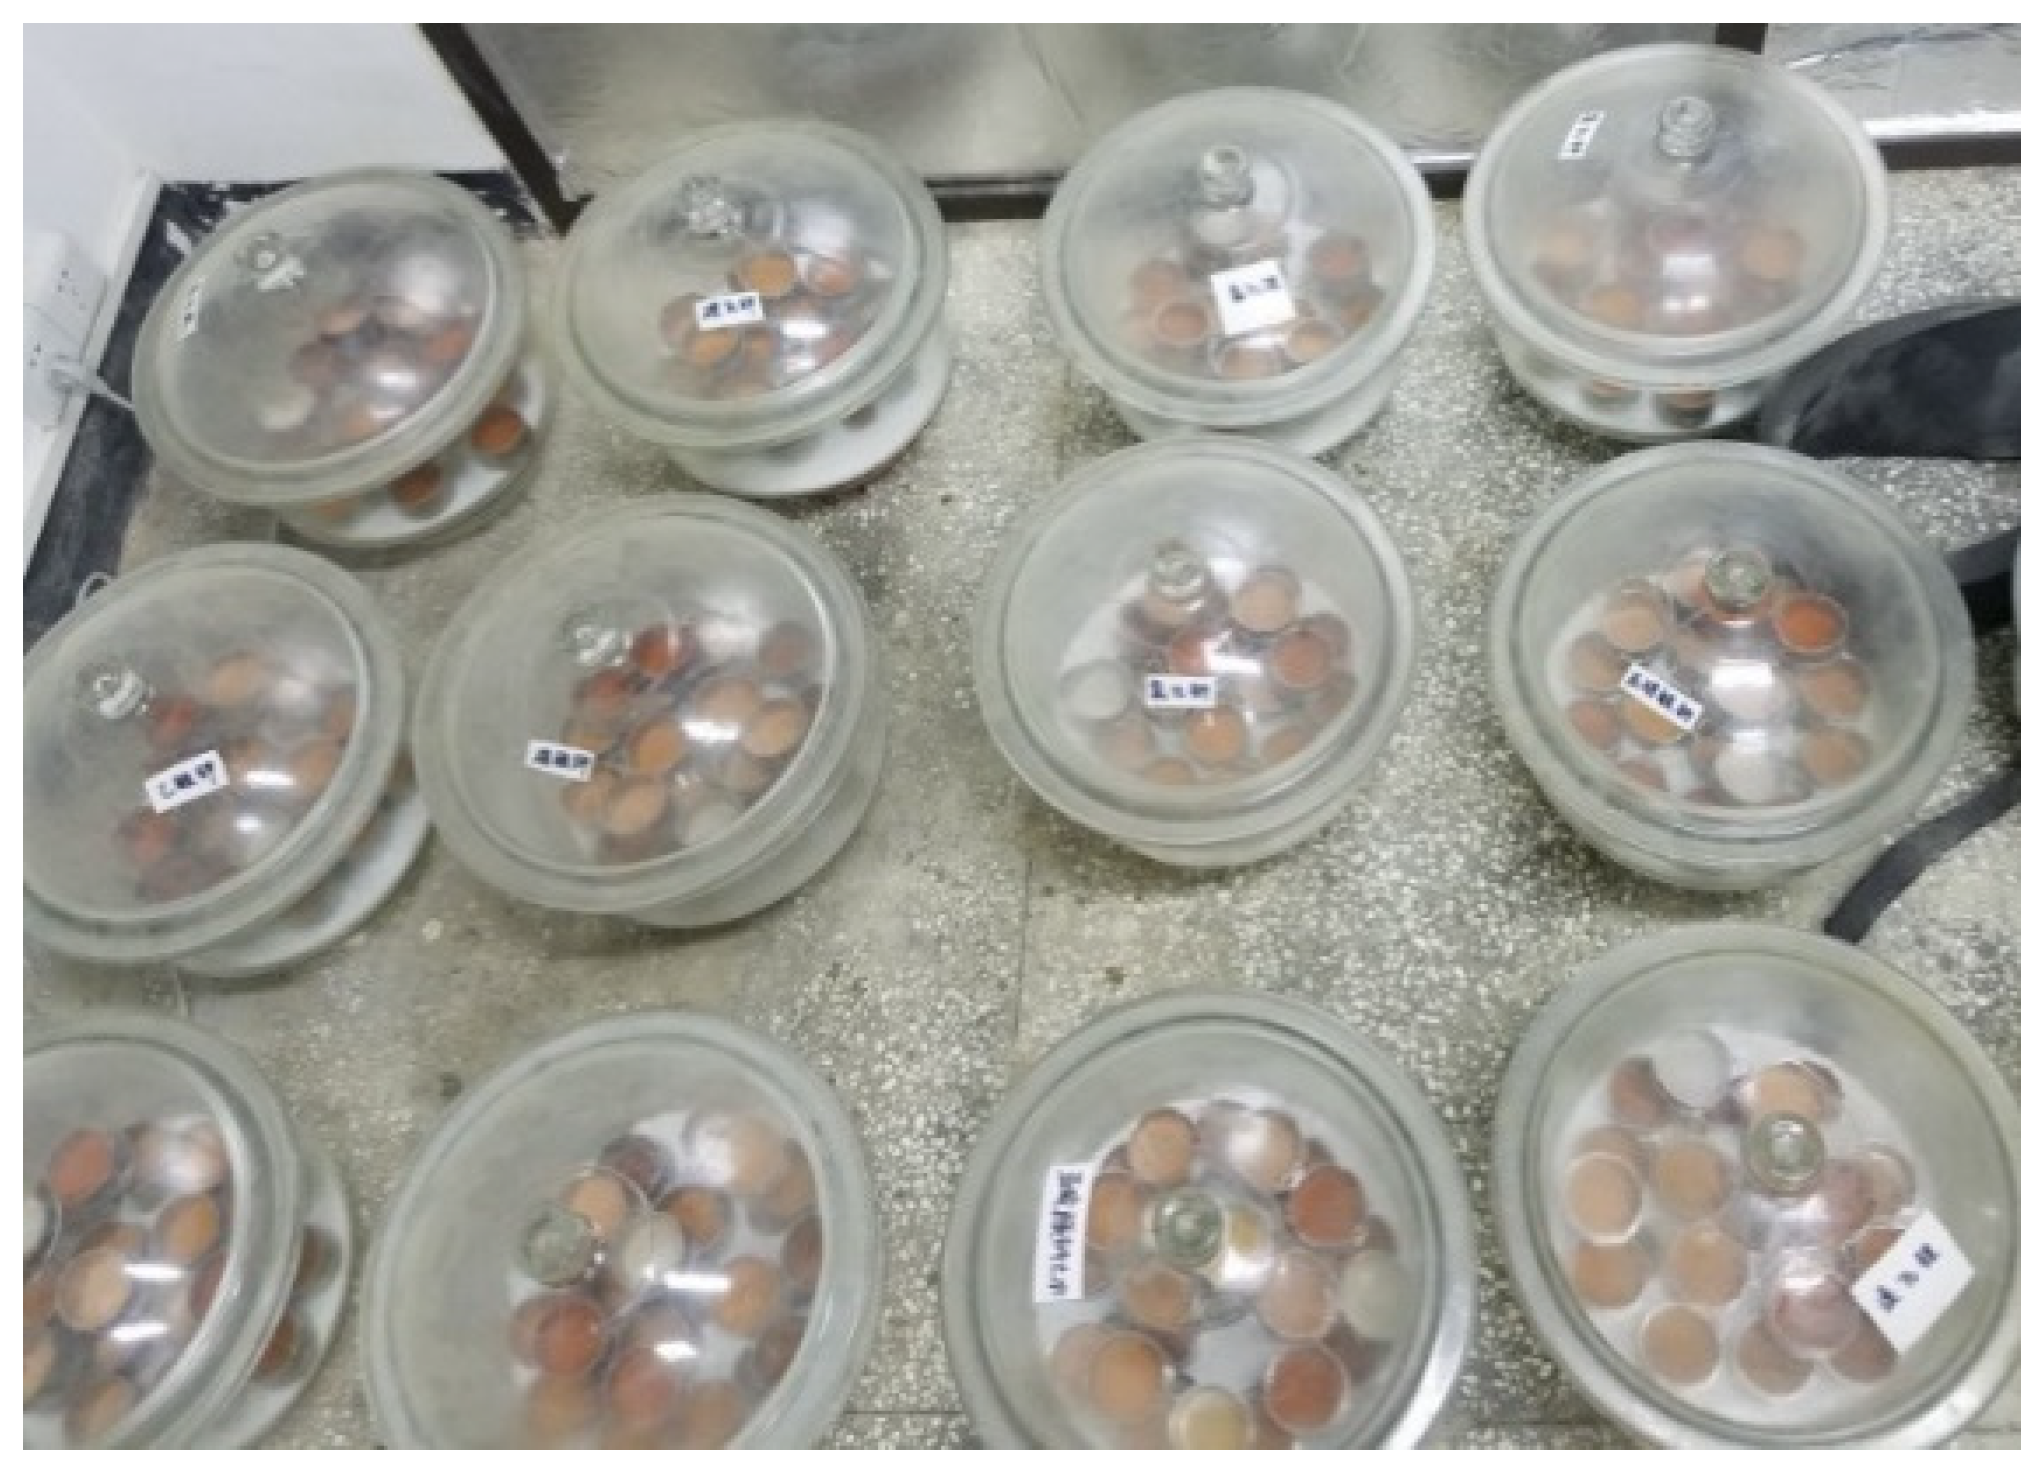
In order to shorten the experimental time, all the soil samples with 12 RH environments were tested simultaneously, as shown in Figure 2.
2.2.3. Superimposed Adsorption Isotherms
Tang [3] reported that the superpositional amounts of adsorbed bound water in mixed soils is proportionally superimposed upon by the amounts of water adsorptively bound by each of two minerals under humidity. The relationship curve of the superposition-bound water and relative humidity (RH) is named the superimposed adsorption isotherm.
The formula for calculating the amounts of bound water by superimposed adsorption is as follows:
where: , are the amounts of superimposed adsorption bound water of mixed clayey soils at a given relative humidity (RH), respectively; , , are the amounts of adsorbed bound water of montmorillonite, kaolin and feldspar at a certain relative humidity (RH), respectively; , , are the percentages of montmorillonite, kaolin and feldspar in the mixed soils, respectively.
3. Experimental Results and Analysis
3.1. Specific Surface Area Experiment
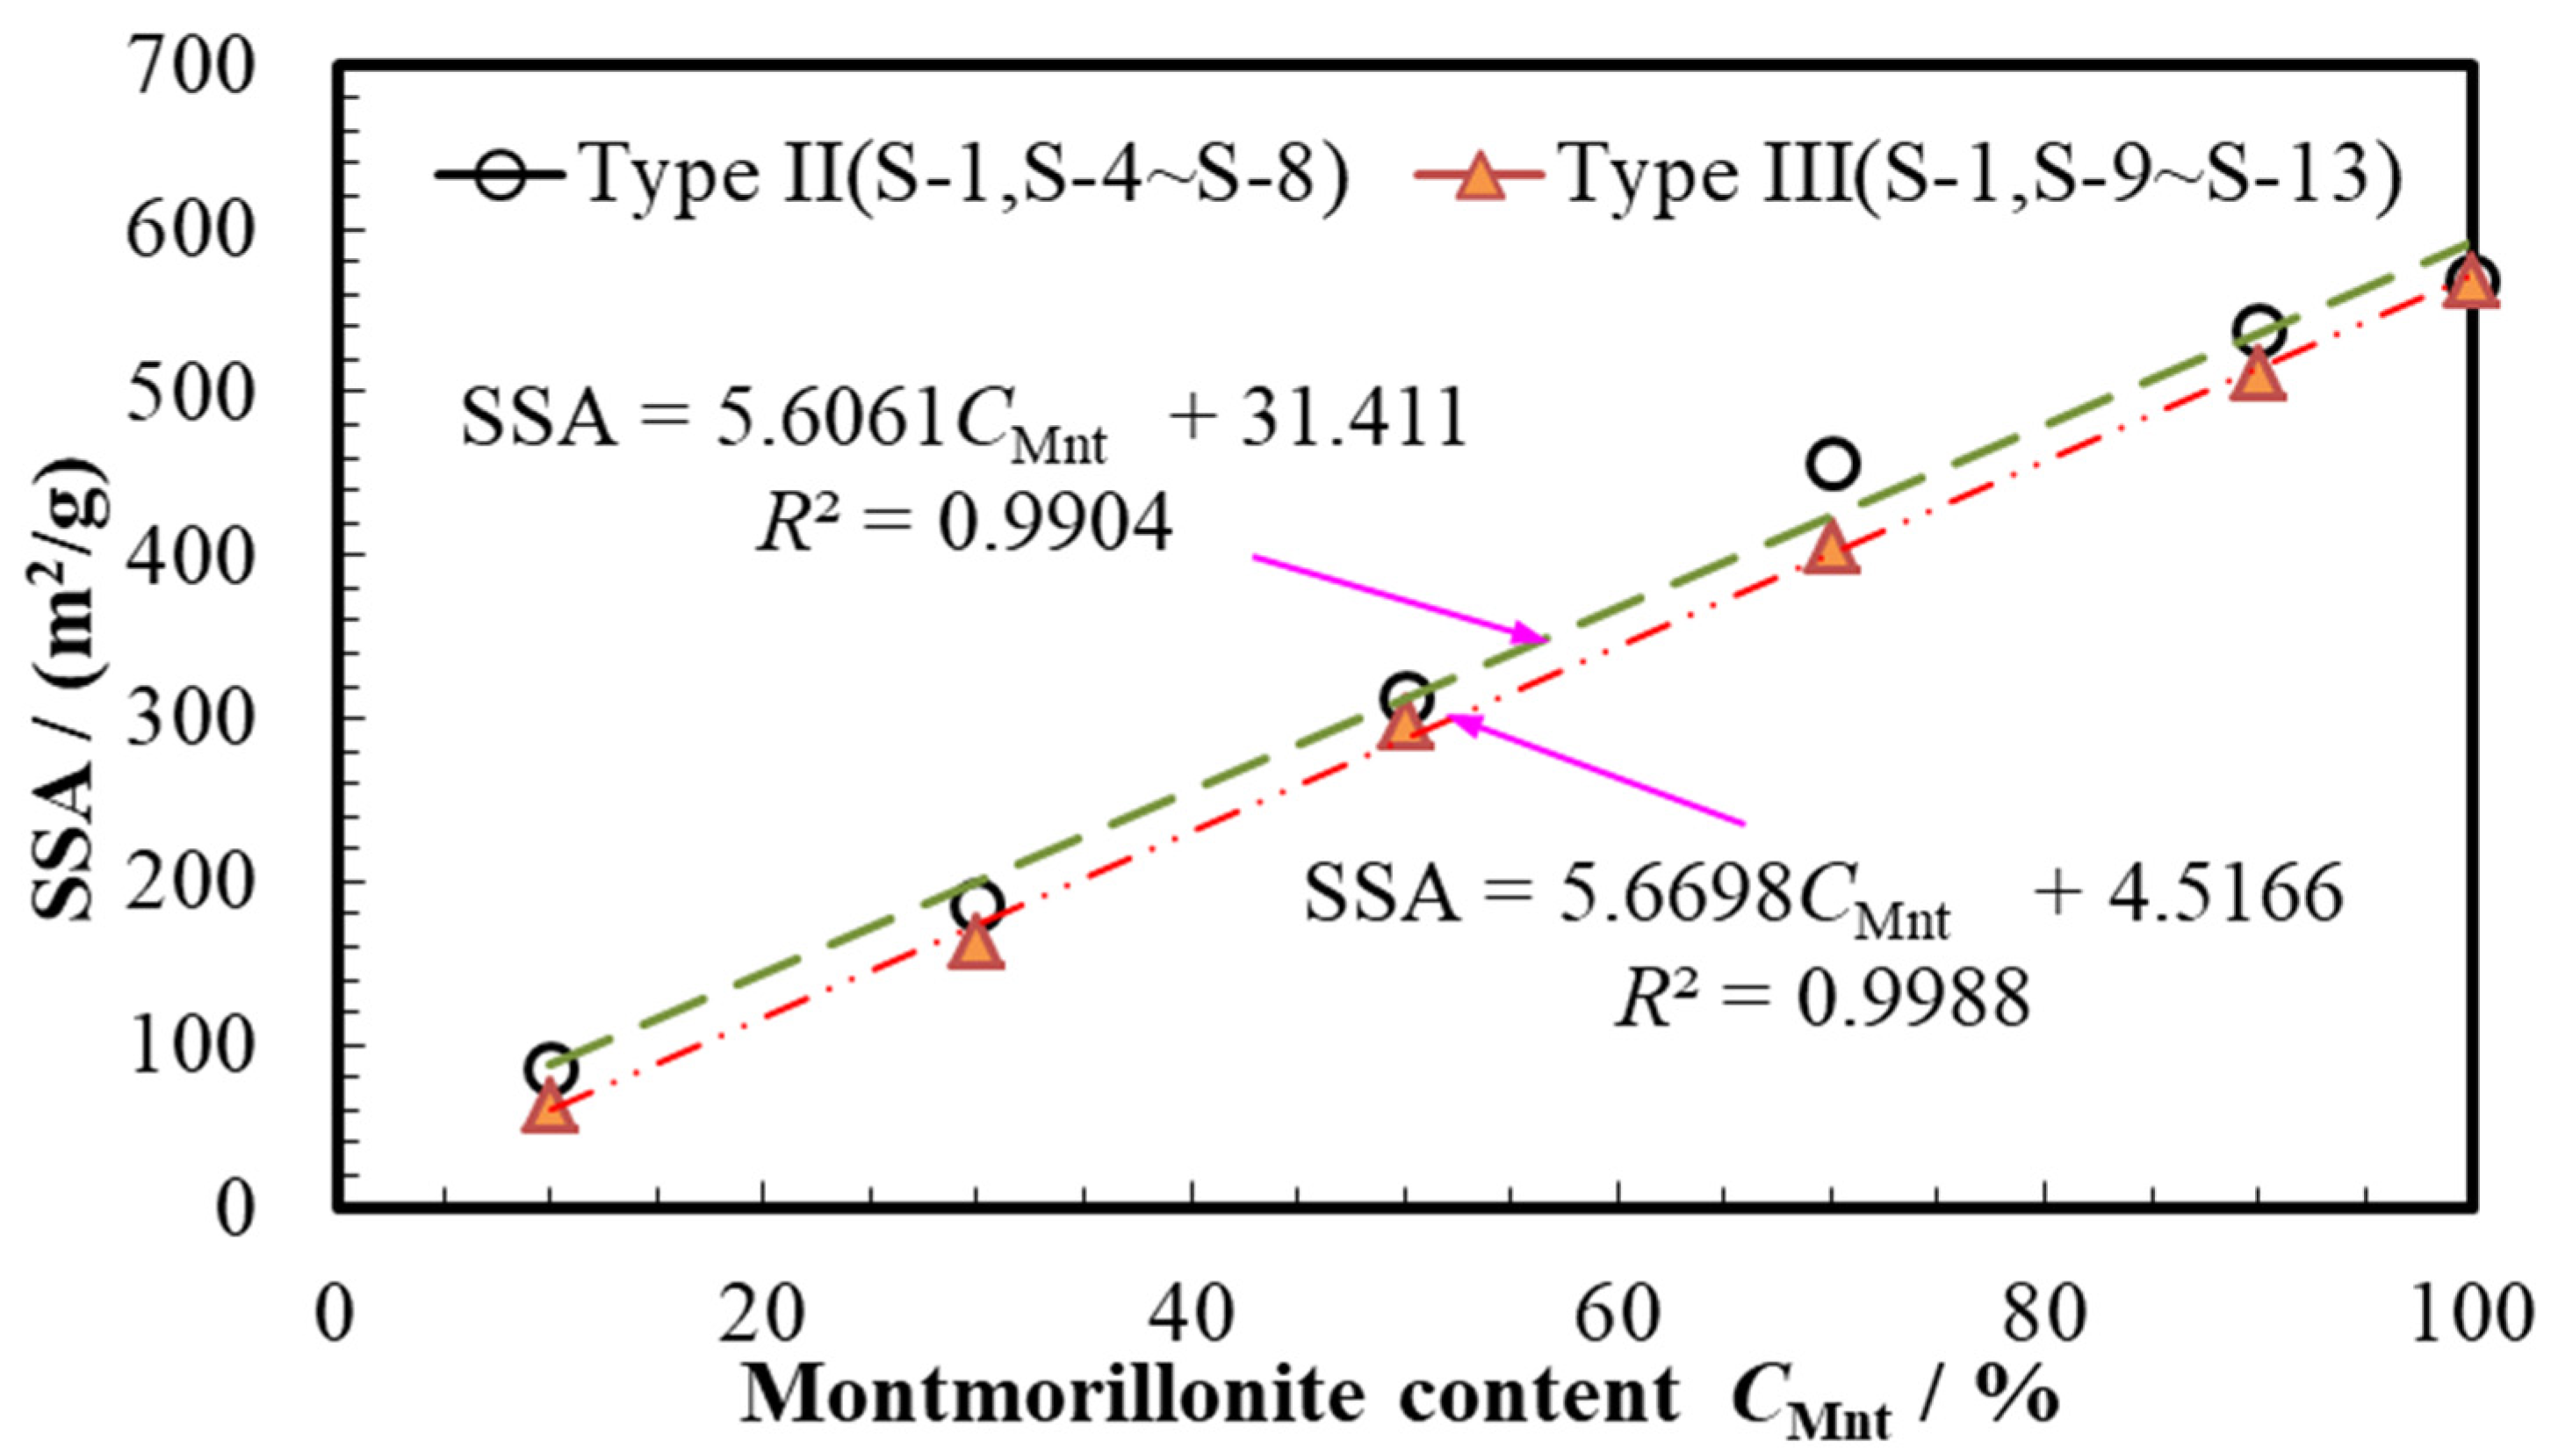
The SSA experimental results of the soil samples determined by the methylene blue method are shown in Table 4. It can be seen that from Table 4 that for type I clay samples of a single mineral (S-1~S-3), montmorillonite (SSAS-1 = 569.05 m2/g) had the largest specific surface area, followed by kaolinite (SSAS-2 = 20.64 m2/g), and potassium feldspar had (SSAS-3 = 4.28 m2/g) the smallest. For both types of mixed clayey soil samples (Types II and III), the specific surface area (SSA) increased linearly with montmorillonite content (CMnt.) increasing, which is shown as Figure 3. The reason is that montmorillonite has a 2:1 crystal structure with interlayer domains between adjacent crystal layers, into which water and other polar molecules can enter, and therefore it has both a large internal and external specific surface area. Kaolinite has a 1:1 crystal structure with no interlayer domains between crystal layers, and kaolinite only has an external specific surface area, and therefore its specific surface area is relatively low. Potassium feldspar is a non-clay mineral, and its specific surface area is even lower, compared with clay minerals. As a result, the total specific surface area of both mixes increases linearly as the montmorillonite content increases; both montmorillonite and kaolinite are clay minerals, so the specific surface area of both clay mineral mixes (Type II) is significantly higher than that of the montmorillonite (clay mineral) + potassium feldspar (non-clay mineral) mixes (Type III) under the same conditions.
3.2. Bound Water Determination Experiment
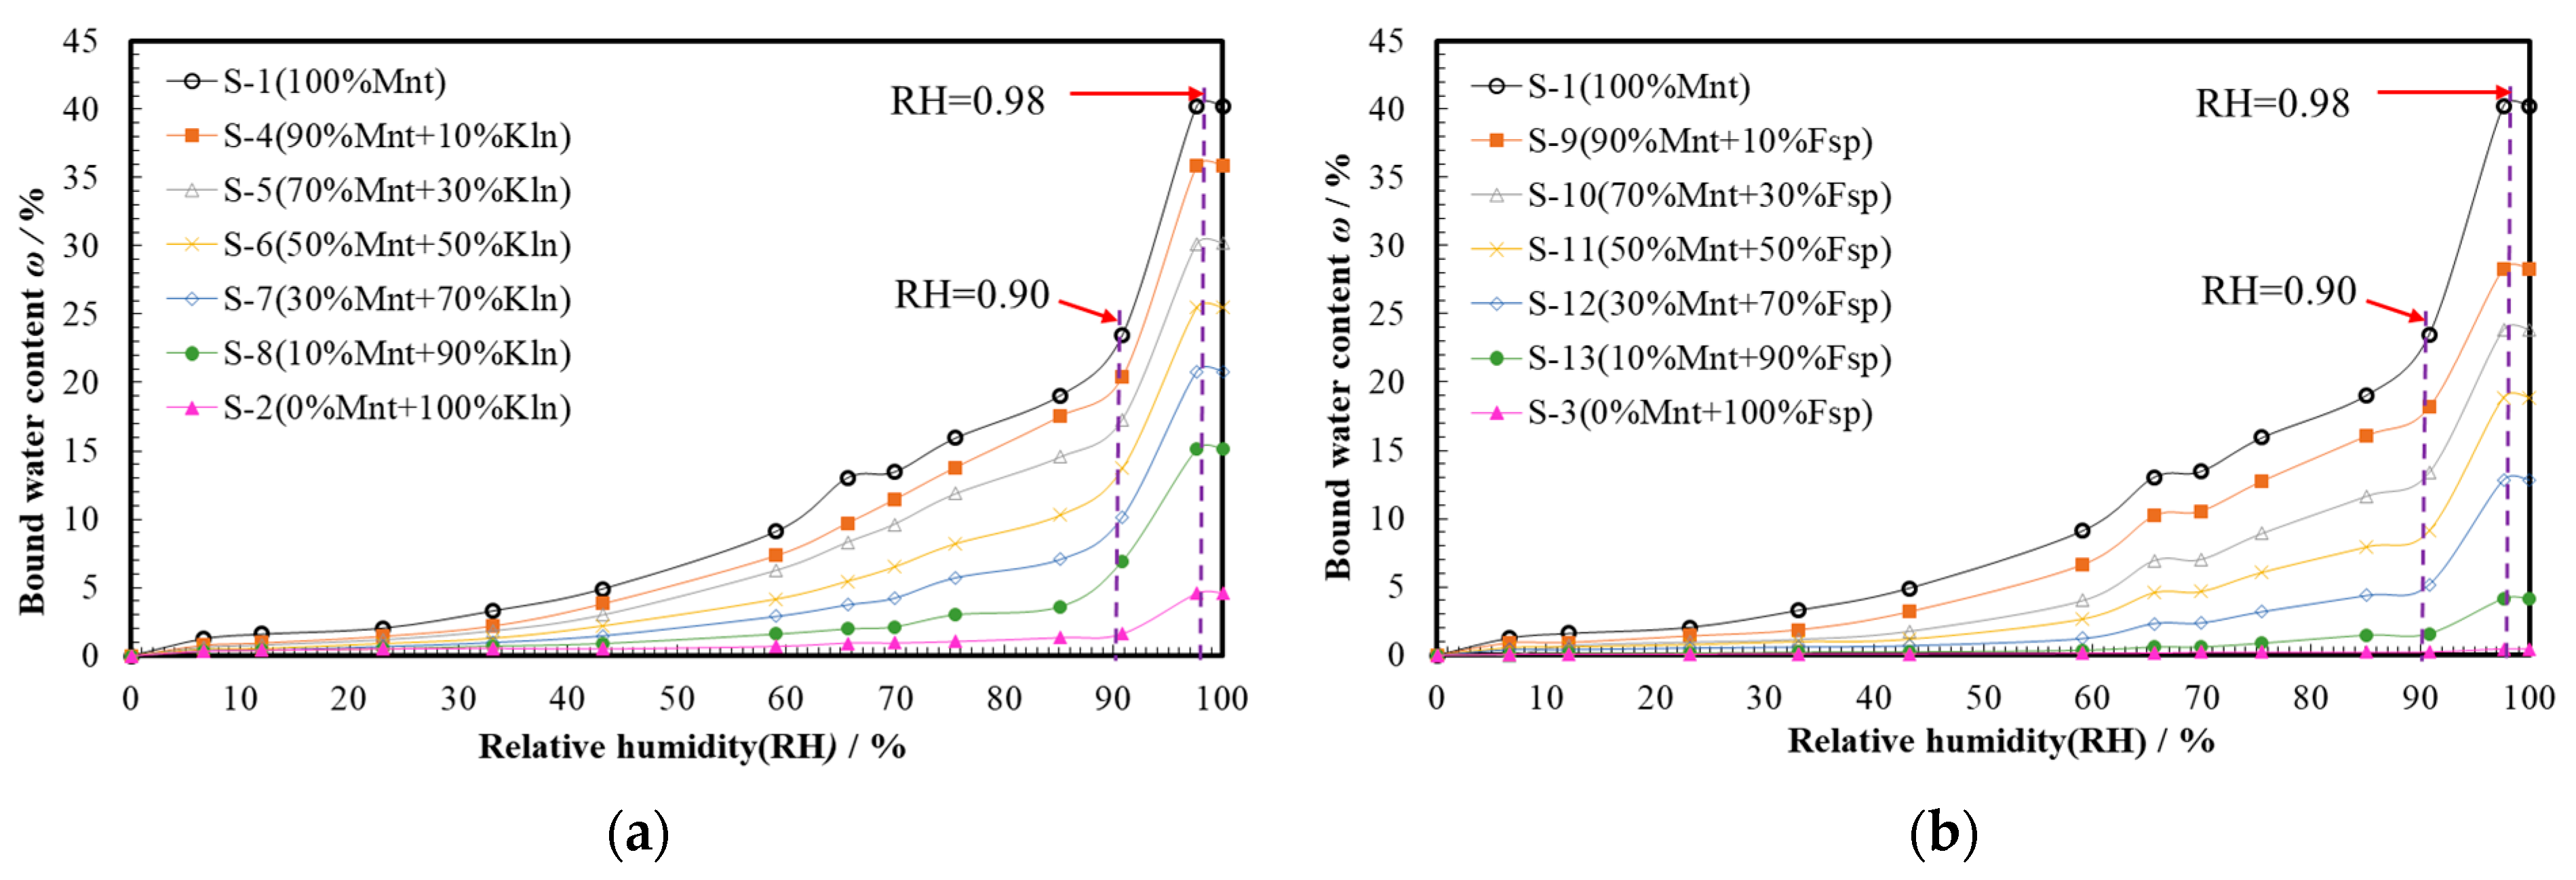
Figure 4 shows the isothermal sorption experimental results for the above-mentioned 12 clayey soil specimens (except for S-3, which is a non-clayey soil). It can be seen that with the increase of RH, the adsorption pattern of all the specimens is consistent. The isothermal adsorption lines show an obvious S-shape, which characterized by fast first, medium slow, and then fast until stable adsorption. This indicates that the mechanism of clay adsorption of bound water is different in different stages, and is consistent with Type IV isotherms from the isothermal adsorption line classification diagram proposed by the International Union of Pure and Applied Chemistry. Type IV isotherms are the result of multilayer adsorption and the capillary condensation of mesoporous (2–50 nm) adsorbates; the experimental phenomenon in this paper is in agreement with the results of Martin [22] and Osipov [23] for clay minerals.
The isothermal adsorption line shows a convex upward trend, indicating that soil–water interaction is greater than water–water attraction in clayey soils. Due to the heterogeneity of the clay surface, the clay is more likely to be convex in the low RH range due to the presence of some high energy parts. Whereas at high RH, the clay has a single pore size distribution, and the isothermal adsorption lines rise gently. Therefore, the isothermal adsorption line shows an S-shape over a RH range from 0 to 1.0. Further study shows that there are two distinct turning points in the isothermal sorption line when RH is between 0 nd 1.0; that is, when relative humidity is 0.90 and 0.98. This feature suggests that the mechanism of water vapour sorption by clay minerals is much more complex than Langmuir’s single-molecule sorption theory, and that it cannot be explained by the single-molecule layer sorption theory, but, rather, is more similar to the characteristics of multi-molecule layer sorption. Therefore, the water vapour adsorption of clay minerals belongs to multi-molecular layer adsorption, and the adsorption process is localised in clay mineral exchange sites, exchangeable ions, crystal breaks and crystal angles, unimolecular layer adsorption, bimolecular layer adsorption, multi-molecular layer adsorption, up to continuous adsorption.
Related studies [10] have shown that the adsorption water of clay minerals has a qualitative change when RH = 0.9 or 0.88. Wang [14] believes that RH = 0.90 and RH = 0.98 are two characteristic points. Specifically, RH = 0.90 is the boundary between strongly bound water and weakly bound water on a clay surface, and RH = 0.98 is the boundary between weakly bound and free water. When RH ≤ 0.9, with the increase of RH, the adsorbed water molecules from the activation center connect the clay mineral crystal angle and fracture surface to the interaction with the clay mineral surface to form a single molecular layer of water and a bimolecular layer of water. When RH is equal to 0.9, this process ends. In this process, the water adsorbed on the clay surface interacts strongly with the clay mineral surface, which is chemical adsorption, in the form of chemical bonds. The adsorbed water is affected by the short-distance interaction between clay particles and water, categorizable as a solid phase. The adsorbed water is called strongly bound water. When 0.90 ≤ RH ≤ 0.98, the isothermal adsorption curve rises rapidly, and the adsorbed water on the clay surface is influenced by the long-distance interaction between the adsorbed water and the clay surface, which involves both physical and chemical adsorption—not categorized as a solid phase—and the adsorbed bound water on the clay surface, in this process, exists as multi-layer, continuous adsorption, controlling the permeation of the hydrated ion-diffusion layer formed on the clay mineral’s surface; while this may be accompanied by capillary condensation effects, this part of multi-layer, continuous adsorption forms bonded water, called weakly bonded water. However, when 0.98 < RH < 1.0, dry clay powder absorbs bound water at a constant speed, and free water appears in the bound water at this time. Therefore, RH = 0.90 is the boundary point between strongly bound water and weakly bound water on a clay surface, and RH = 0.98 is the boundary point between weakly bound water and free water. The same conclusion was also obtained by Wu [18] and Zhang [24] in their studies on bound water in soft soils and loess, respectively.
According to the two characteristic humidity points of the above isothermal adsorption lines, the amounts of total bound water, strongly bound water, and weakly bound water of the various mixed clayey soils is shown in Table 5.
3.3. Influencing Factors Analysis of the Bound Water
3.3.1. Influence of Mineral Composition
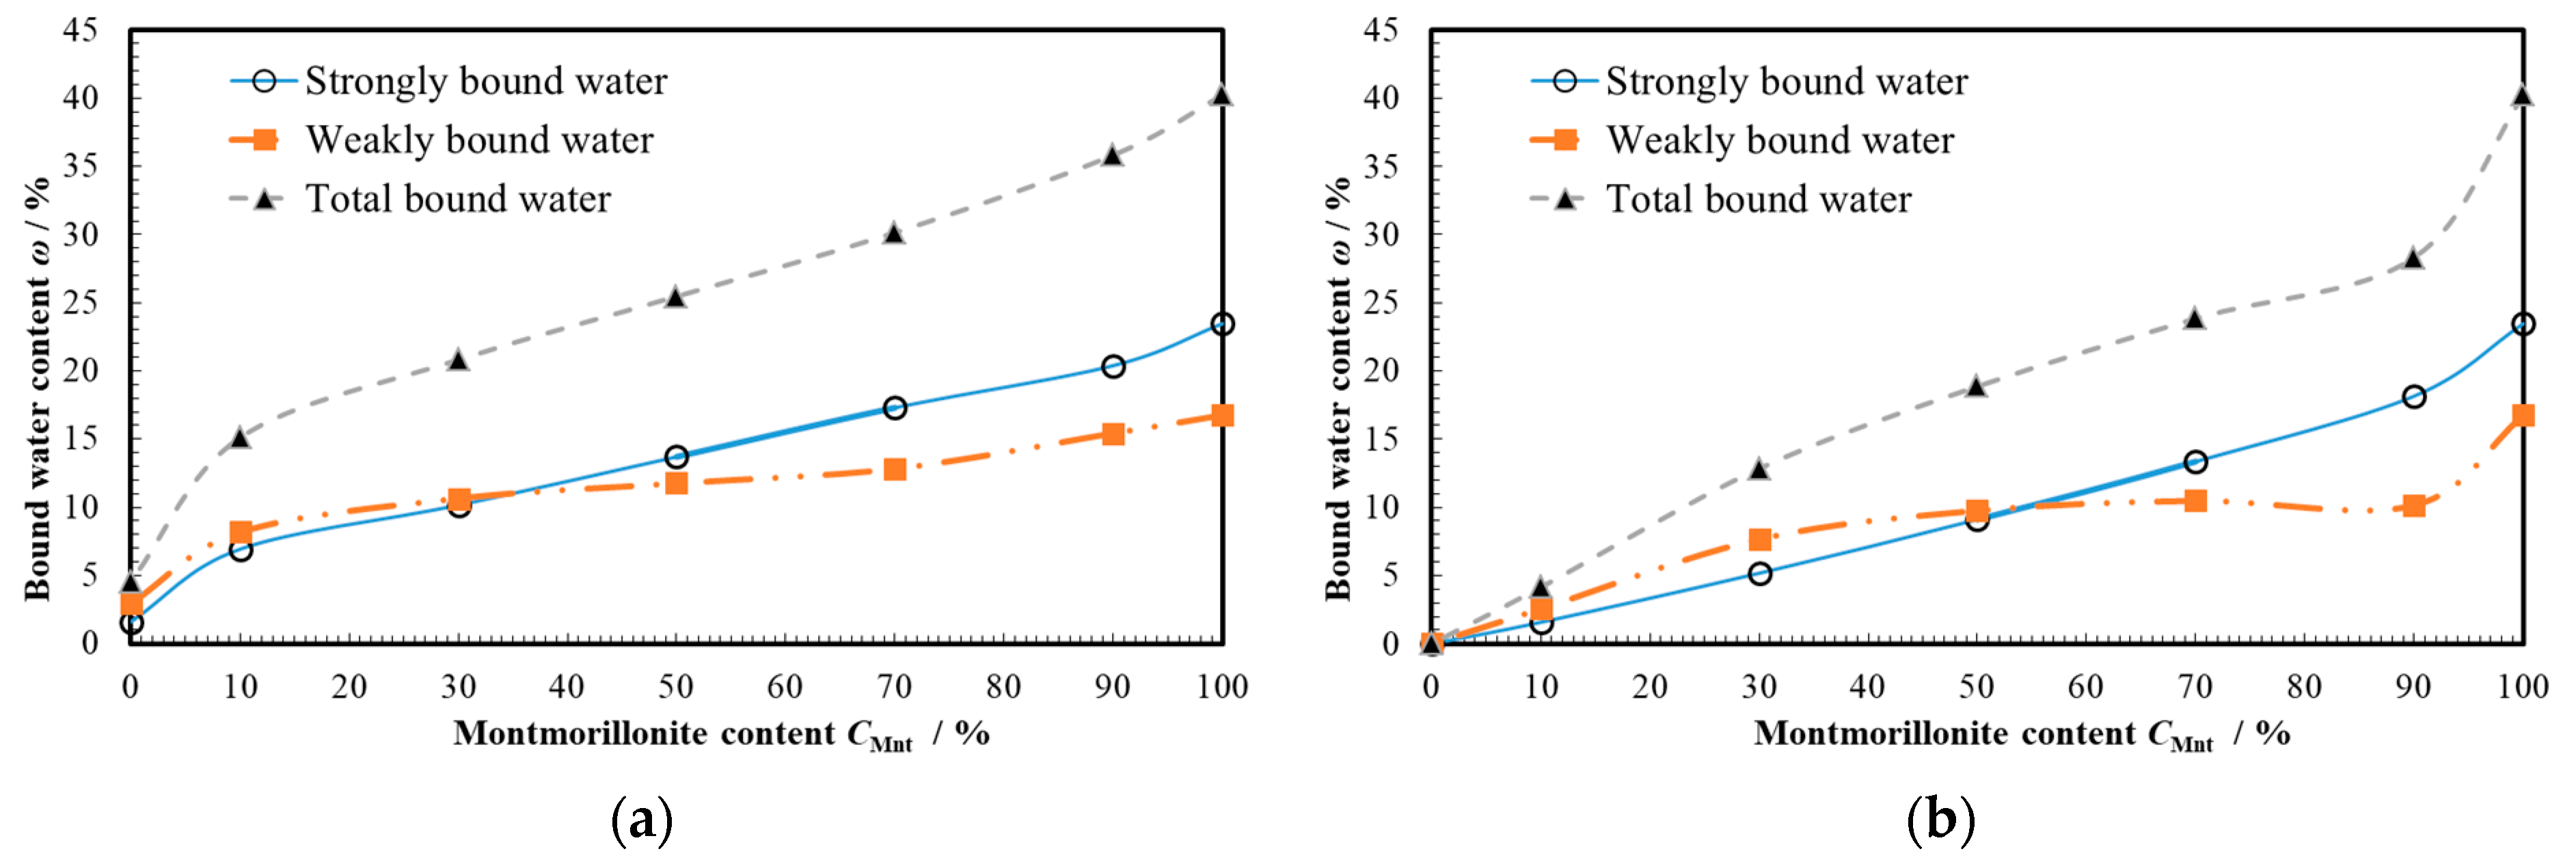
According to Table 4 and Table 5, the relationship between the mineral composition (montmorillonite) and the amount of bound water can be obtained, as shown in Figure 5.
It can be seen in Figure 5 that the higher the montmorillonite content, the higher the amount of bound water adsorbed by the mixed clayey soils. For the mixture of montmorillonite + kaolinite (Figure 5a), the amounts of adsorbed bound water (total bound water, strongly bound water and weakly bound water) all increase rapidly in montmorillonite-content ranges of 0–10%; while, when montmorillonite content exceeded 10%, the amounts of adsorbed bound water all increased slowly. For the mixture of montmorillonite + feldspar (Figure 5b), total bound water and weakly bound water both increased rapidly, in the range of 0–30%; whereas, when montmorillonite content was in the range of 30–90%, the total bound water and weakly bound water both increased slowly; and, when montmorillonite content exceeded 90%, the total bound water and weakly bound water both increased rapidly again. However, the strongly bound water increased linearly with montmorillonite content (CMnt.) over all RHs.
Figure 5 also shows that there is an intersection between the curves of the strongly bound water–montmorillonite content and weakly bound water–montmorillonite content of the mixed soils, for both Type II and Type III. When the montmorillonite content of the Type II soils varied from 0% to 30% (0–50% for Type III soils), the amount of strongly bound water adsorbed by the mixed soil was less than the amount of weakly bound water. However, when montmorillonite content exceeded 30% (50% for Type III soils), the strongly bound water absorbed by the mixed soil was greater than for weakly bound water. The reason for this may be that the clay particles shared the bound-water film (mainly the weakly bound water film); because the strongly bound water was in a solid phase, the volume of strongly bound water was almost unaffected. The above-mentioned phenomenon may be caused by the common bound-water film (mainly weakly bound water) between the clay particles; again, because the strongly bound water was in a solid phase, the volume of strongly bound water was almost unaffected. When the montmorillonite content was low, the distribution of montmorillonite particles was relatively dispersed, and each clay particle was able to form its own strongly and weakly bound-water film (i.e., diffuse double layer). As the montmorillonite content increases, the distribution of montmorillonite particles becomes dense, and the bound water films between the soil particles are in contact with each other and may even appear to overlap or share the phenomenon.
It can be seen that the higher the clay mineral content in cohesive soil, the closer the bound water absorbed by the soil sample is to clay minerals with strong water absorption. With the increase of clay mineral content, the adsorption and cementation between particles are strengthened, and the amount of water bound by soil adsorption is controlled by the clay mineral. Mitchell [1] believes that “clay only accounts for 1/3 of the solid part of the soil at most, so that the granular particles cannot be directly contacted, and the clay can control the behavior of the soil”. This conclusion is well verified by our test results.
3.3.2. Influence of Specific Surface Area (SSA)
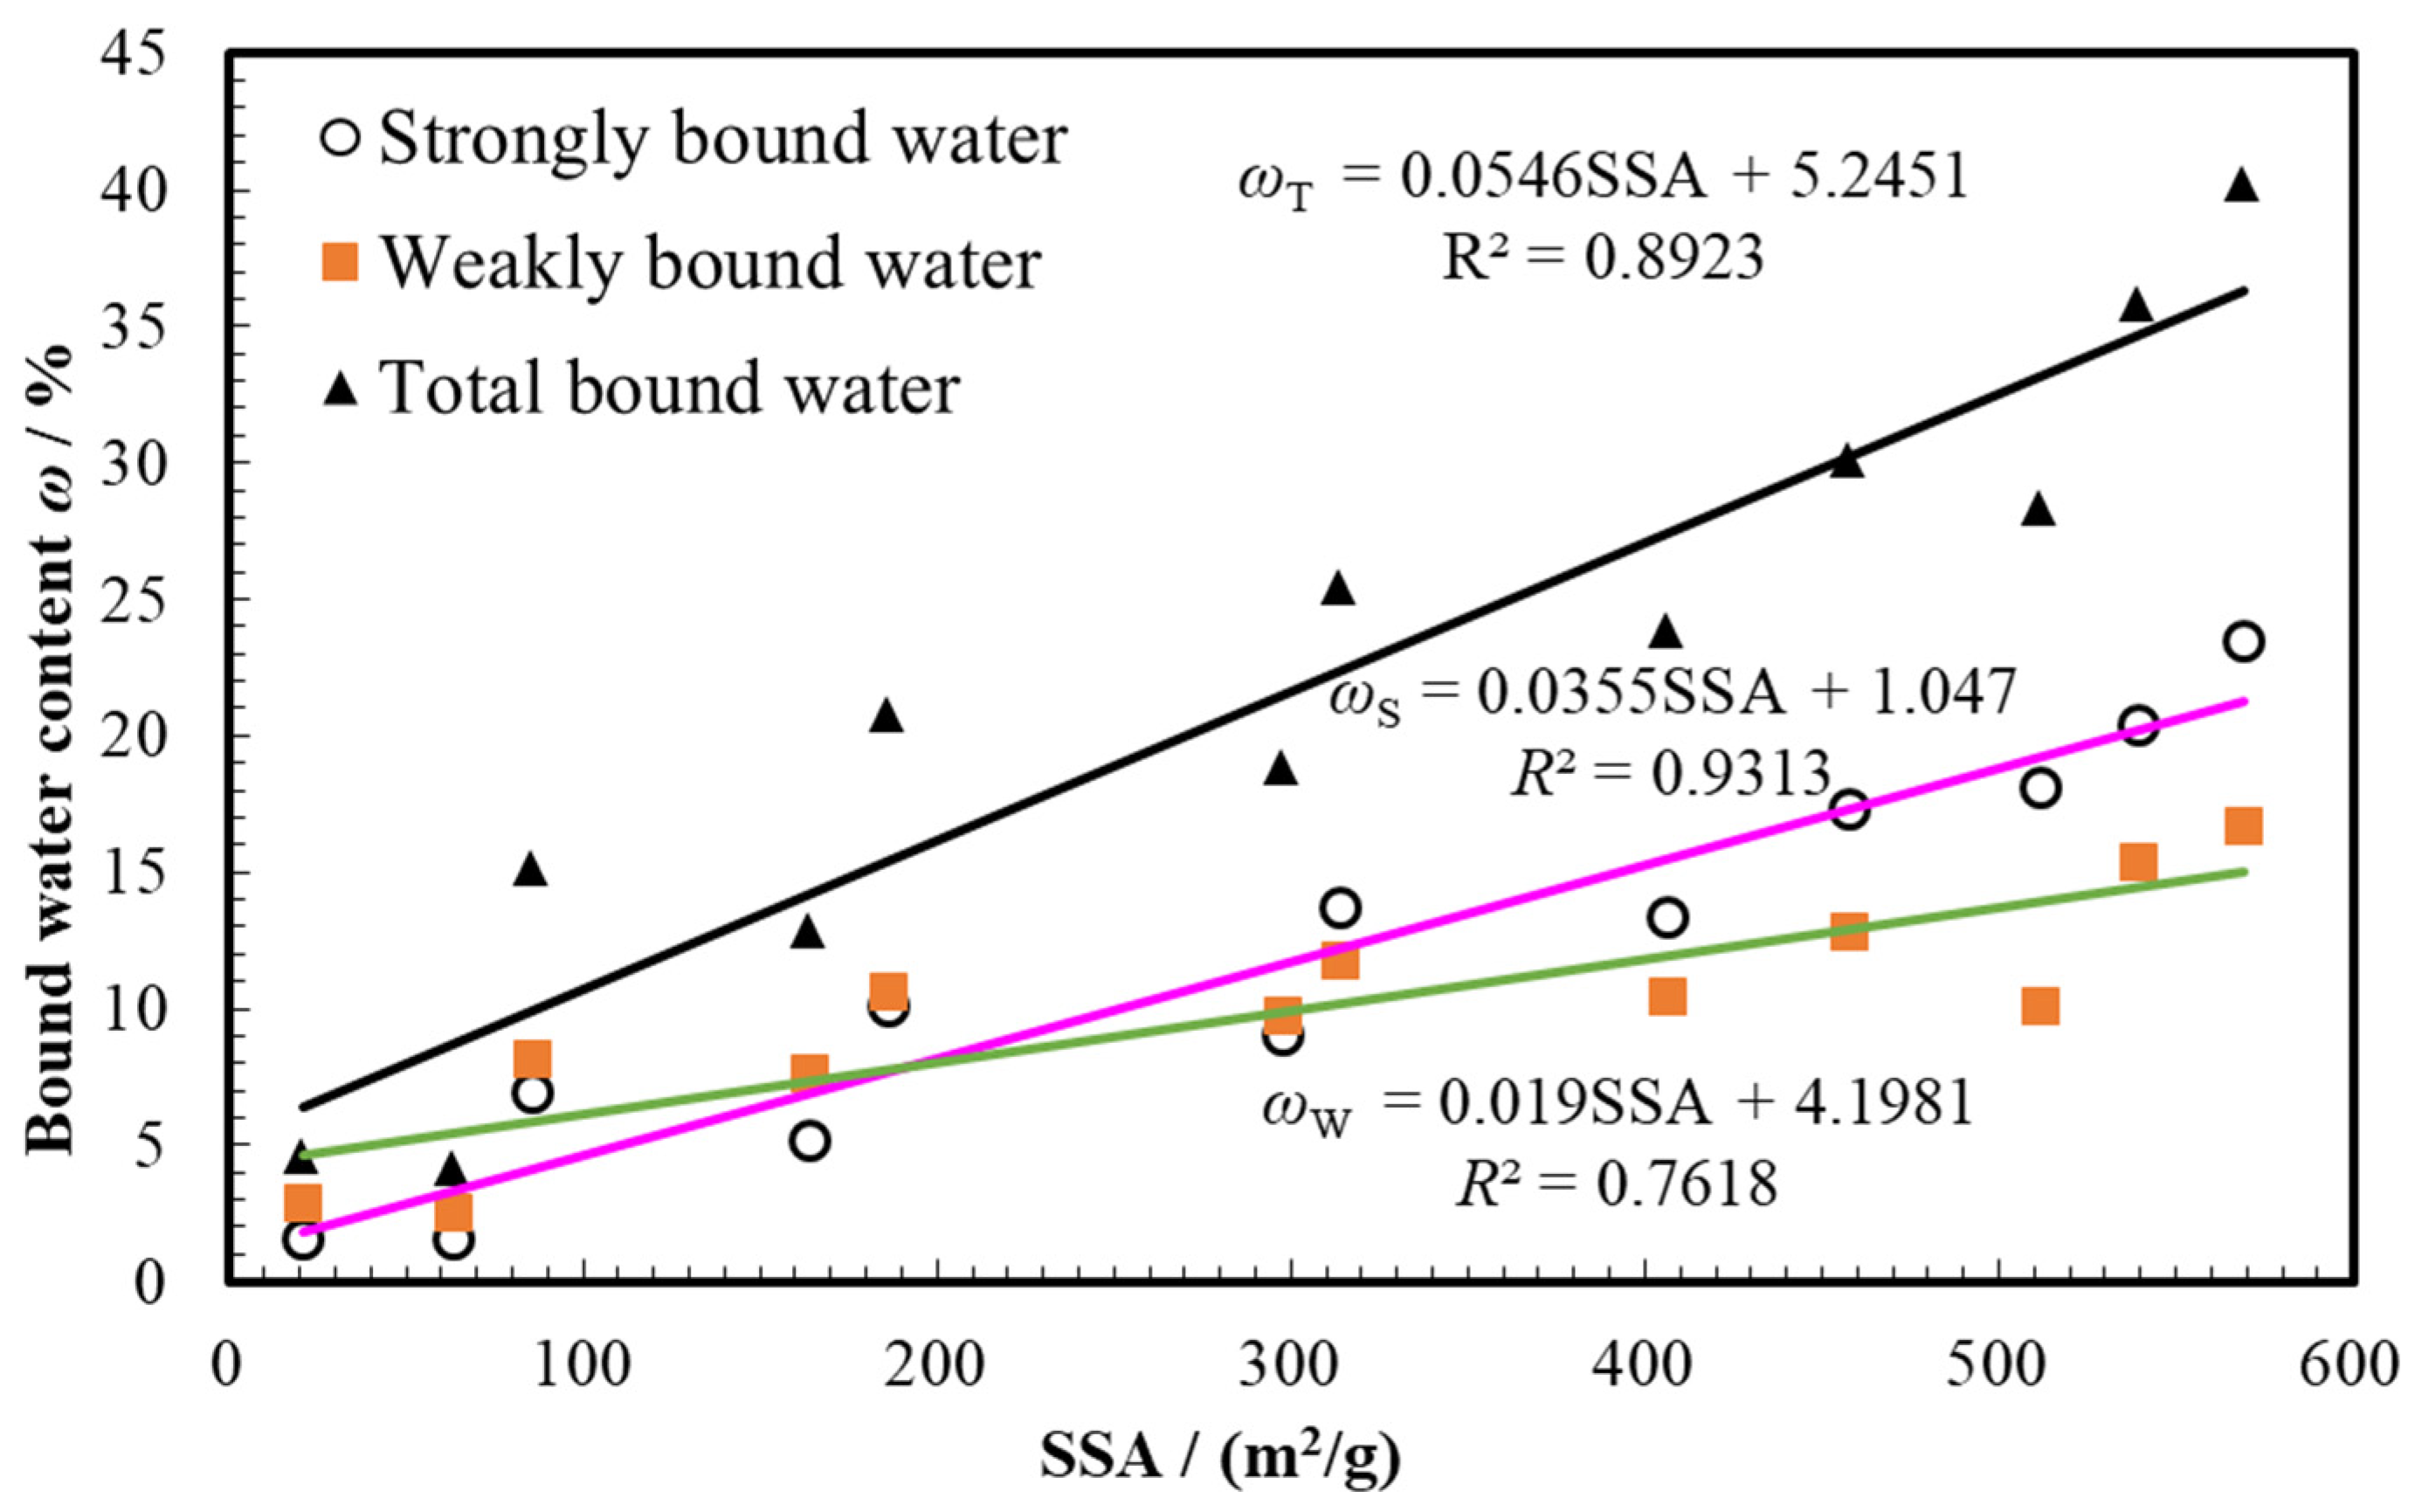
The specific surface area (SSA) is closely related to the surface activity and interface characteristics of soil particles. When the size of clay particles reaches micron level, the surface energy and surface activity of particles are continuously improved with the increase of specific surface area, the surface and interface properties of particles will change greatly, and the ability of absorbing and binding water is also greatly improved [1]. Therefore, the specific surface area (SSA) of cohesive soil can be used to characterize the adsorbed water amount on the surface of soil particles. The specific surface areas of different minerals vary greatly, so the surface energy and surface activity of particles are different, and the adsorbed water amount is also different.
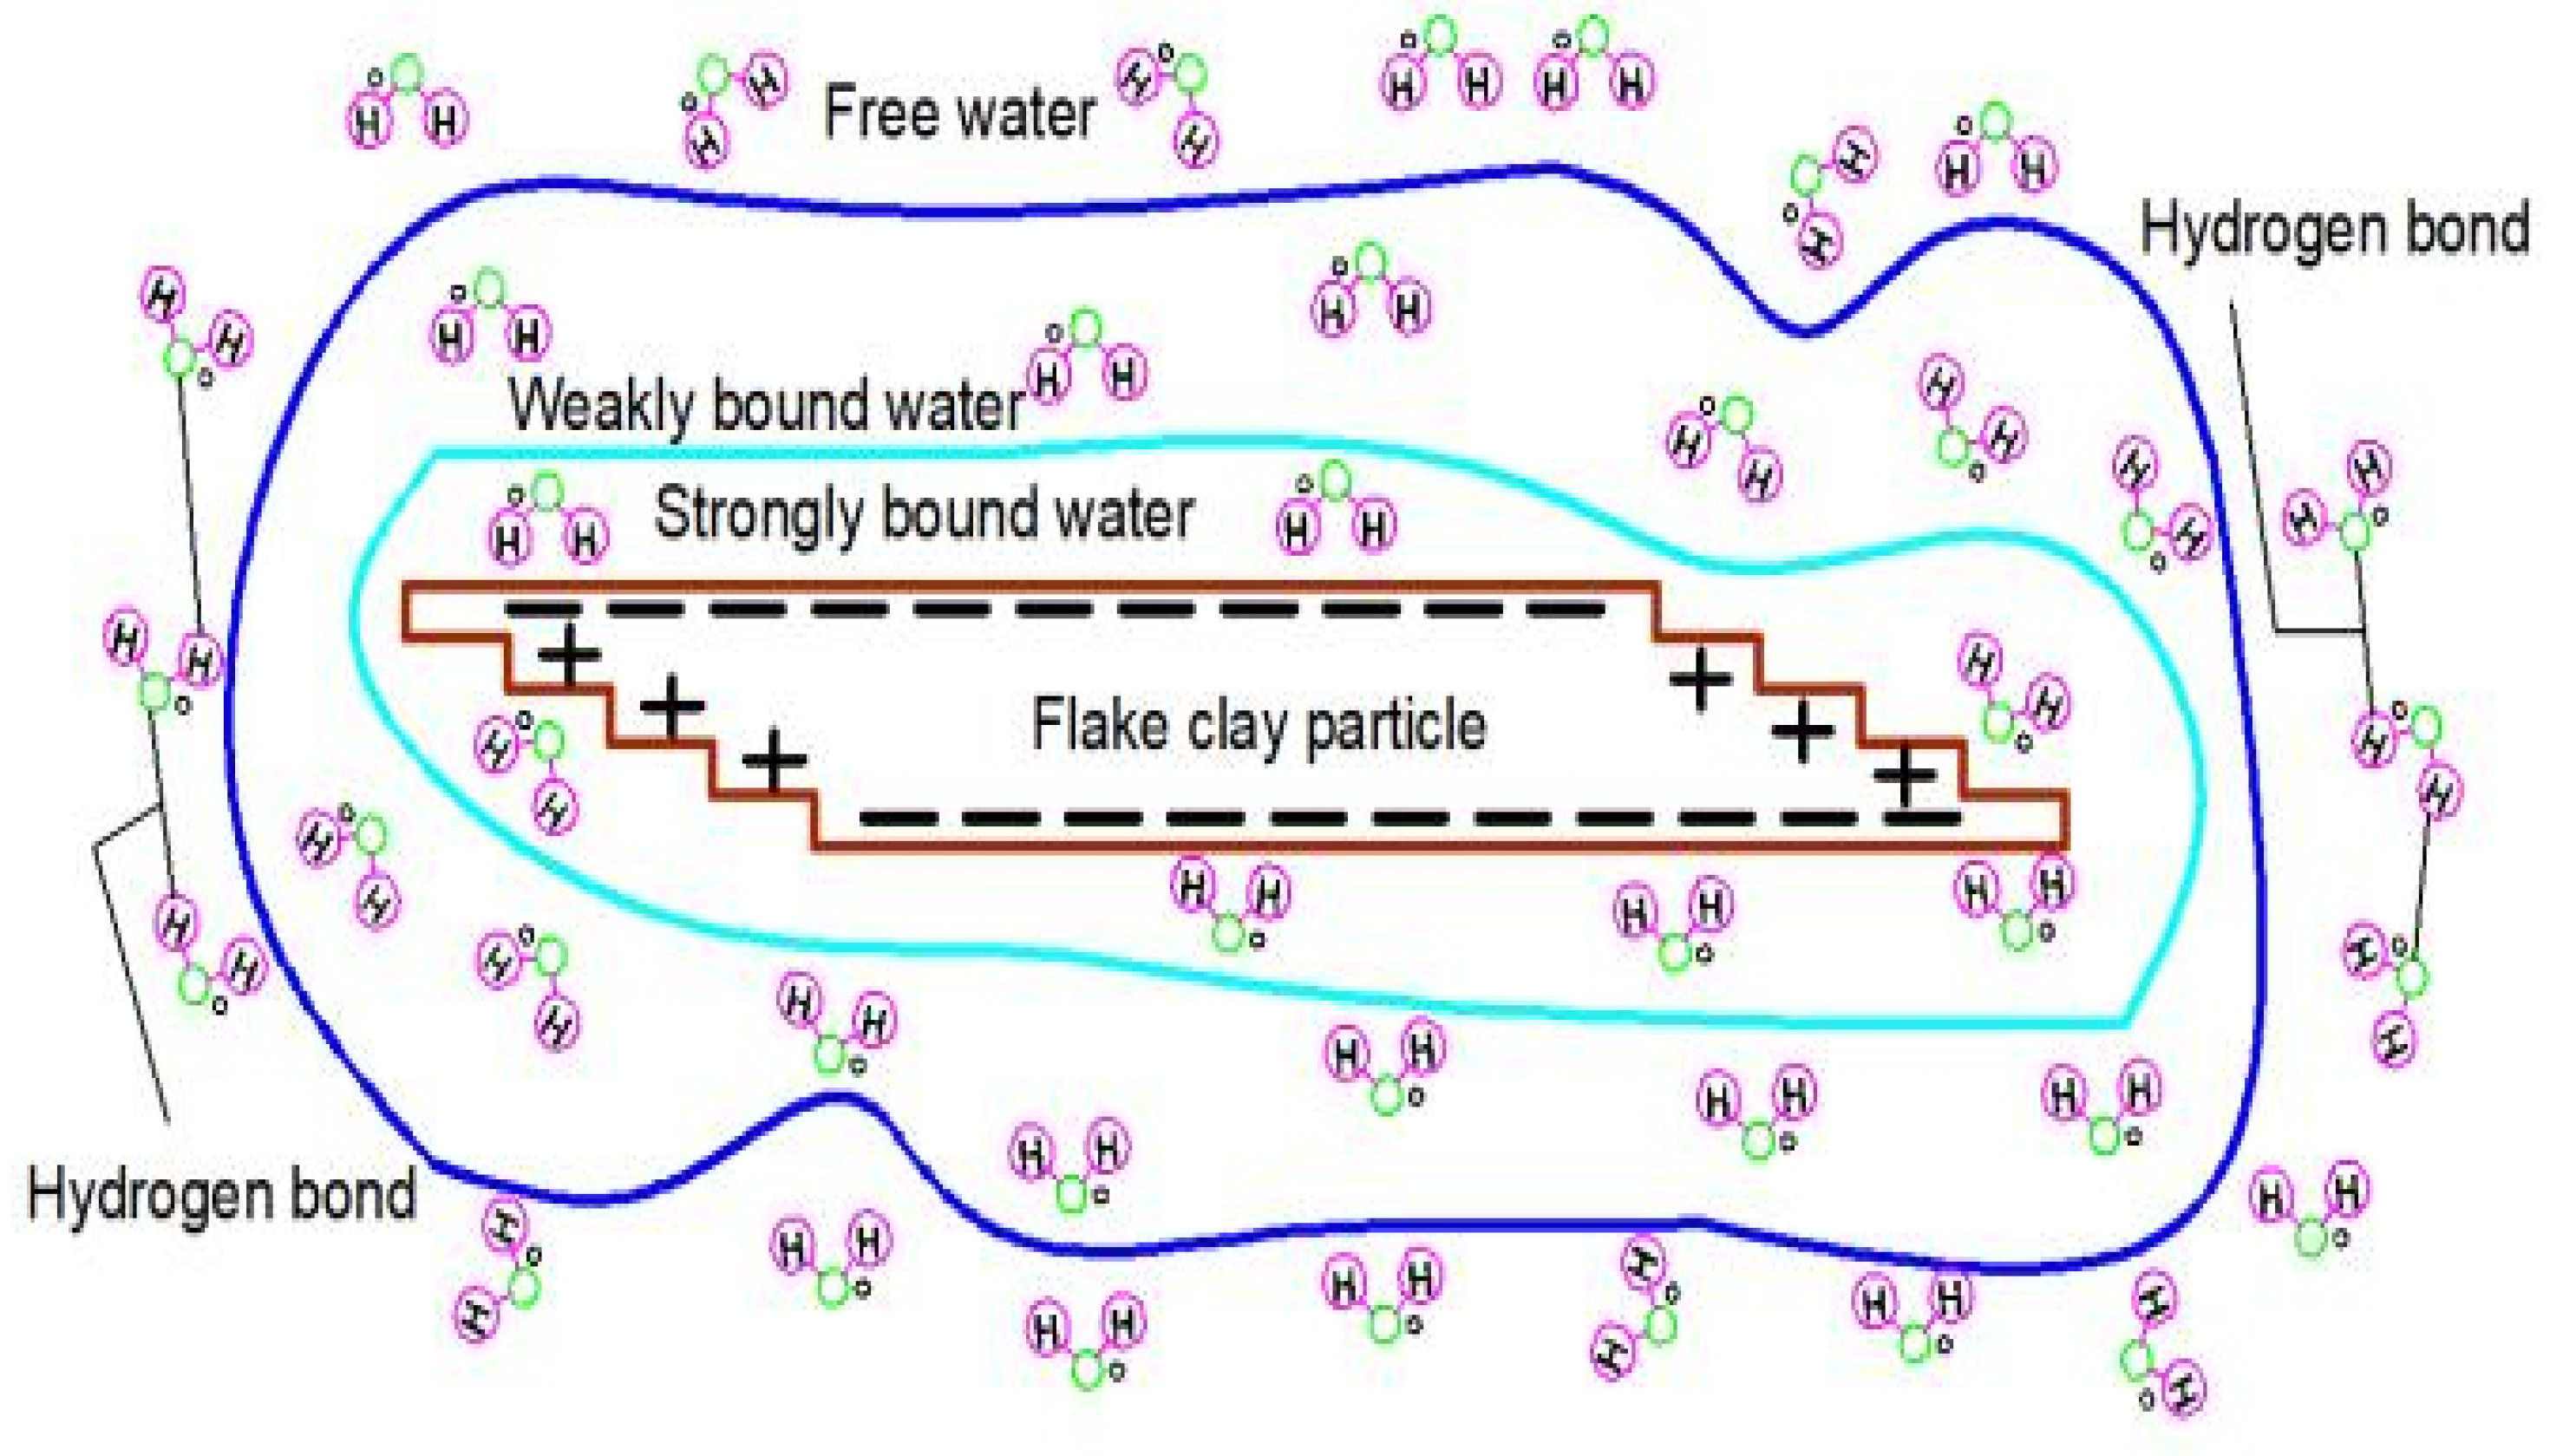
Figure 6 shows the relationship between the bound water and the specific surface areas (SSA) of the mixed soils. It can be seen from Figure 6 that the adsorbed bound water of the mixed clay tends to increase linearly with SSA. Specially, strongly bound water had the highest linear correlation with specific surface area (R2 = 0.9313), followed by total bound water (R2 = 0.8923), and the weakly bound water had the lowest (R2 = 0.7618). The above variation pattern can be explained in terms of clay mineralogy [1]: clay minerals are generally flat and have hydration-activation centers, which can adsorb bound water under various effects such as hydrogen-bonding connection, the electrostatic gravitational force, the van der Waals force, and osmotic adsorption. According to the action of the above forces, adsorbed bound water is categorized as strongly bound, weakly bound or free water depending on their distance from clay particles, which are taken to be the center, as shown in Figure 7. Generally speaking, strongly bound water is generally closely adsorbed on the surface of clay particles by hydrogen bonding, which belongs to the solid phase category and is most significantly affected by the specific surface area of clay particles. Weakly bound water is generally adsorbed in the outer layer of strongly bound water by the van der Waals force within the diffusion layer of the double-electric layer, and is significantly weakened by the specific surface area of clay particles, due to its distance from clay particles and the influence of various other forces.
3.4. Superimposed Adsorption Isotherms
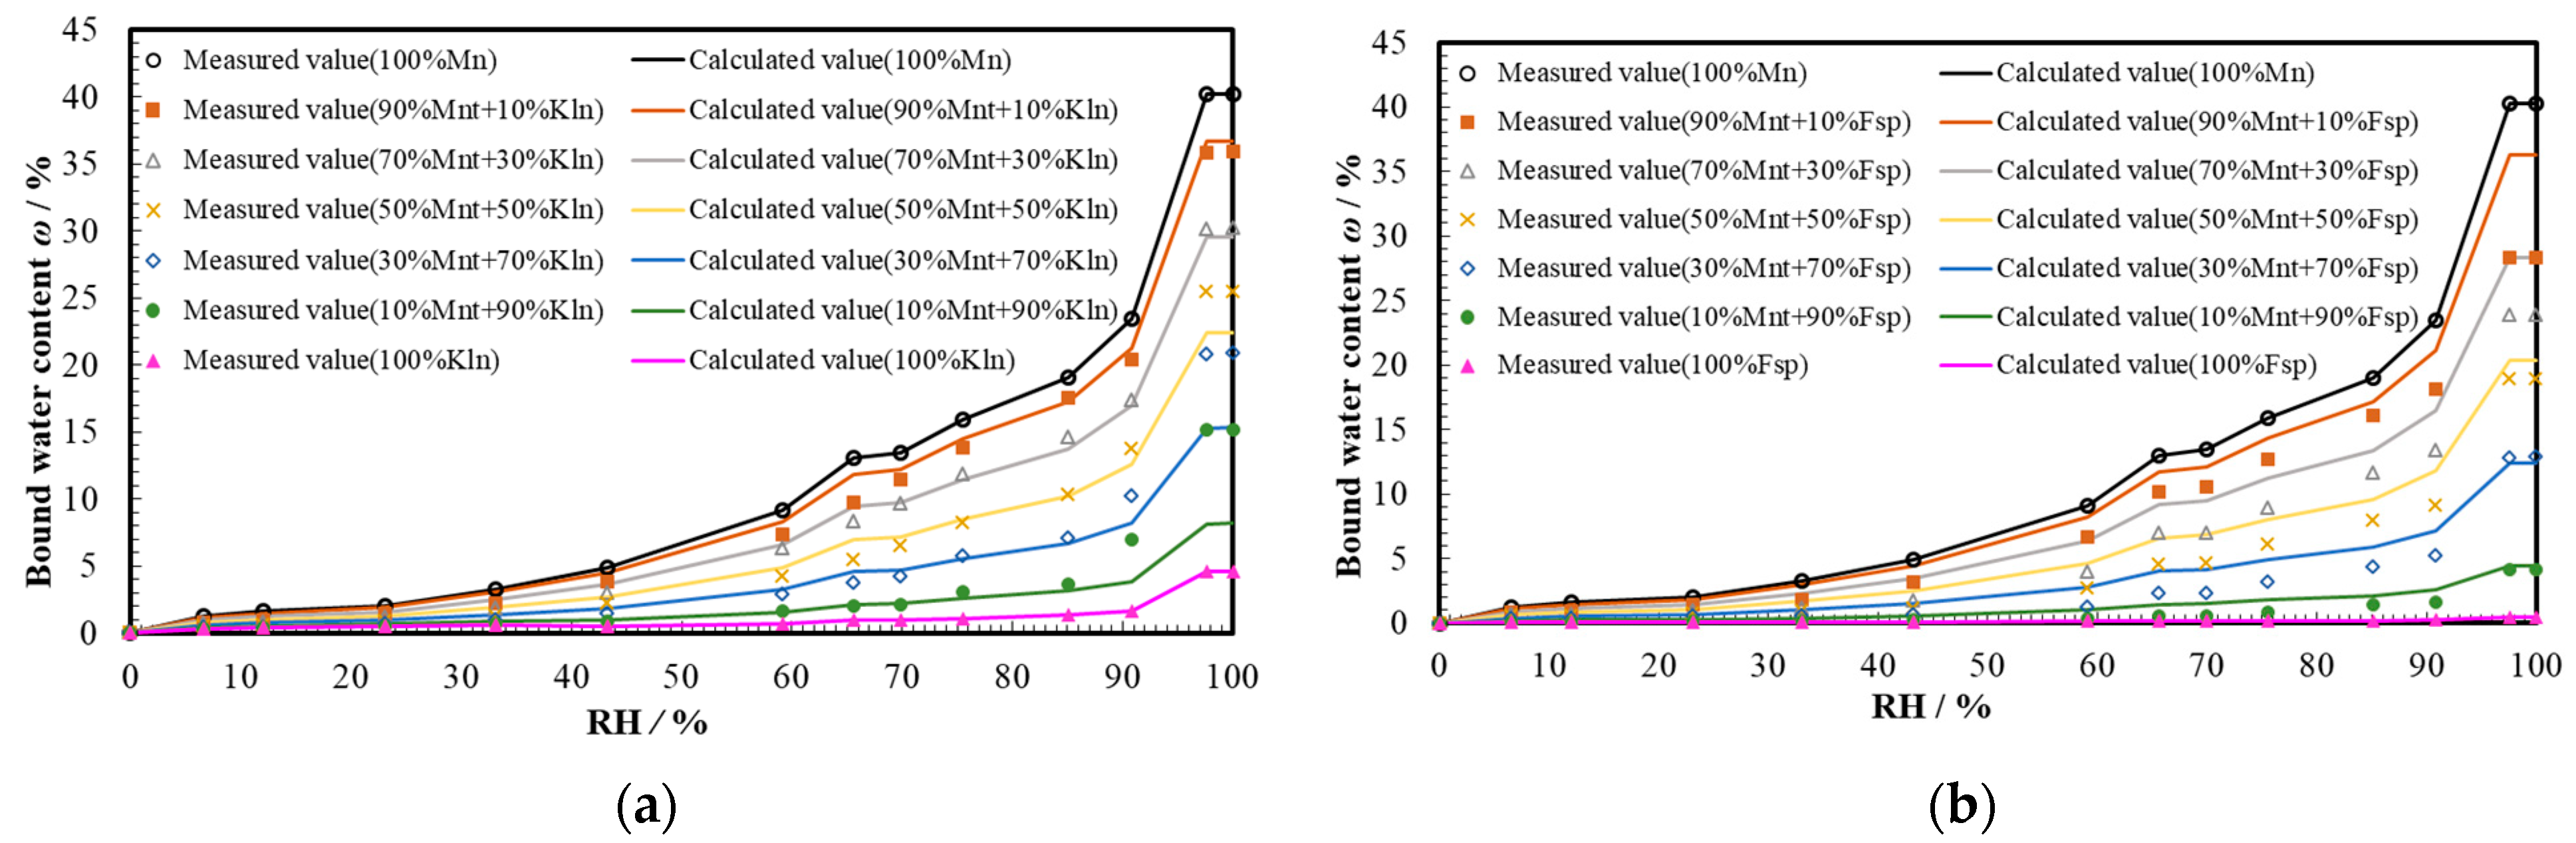
The above-mentioned analysis indicates that the amount of bound water in mixed clayey soils is closely related to two influencing factors—the mineral composition of the clay (montmorillonite content CMnt.) and specific surface area (SSA). In fact, the specific surface area (SSA) of a mixed clayey soil is linearly related to its montmorillonite content CMnt., shown in Figure 3. Therefore, the amount of adsorptive bound water in the mixed clayey soils is essentially attributed to its mineral composition (montmorillonite content). The two types of mixed clayey soils studied in this paper were combinations of two minerals (i.e., Type II: montmorillonite + kaolinite and Type III: montmorillonite + feldspar), so the adsorptive bound water of the mixed clayey soils can be calculated by proportionally superimposing the adsorptive bound water of each mineral and at each moisture level, following from Equations (2) and (3). Thus, superimposed adsorption isotherms were formed, as shown in Figure 8.
As can be seen from Figure 8a, the superimposed adsorption isotherm of the type II mixed soils (montmorillonite + kaolin) was in good agreement with the isothermal adsorption experimental results at RH < 0.85, so the superimposition of the adsorption-bound water from each clay mineral can be used to estimate the total adsorption-bound water of the montmorillonite + kaolin mixture. As can be seen from Figure 8b, the superimposed sorption isotherms of the Type III mixed soils (montmorillonite + feldspar) were largely greater than the test data and differed significantly from the experimental data; therefore, we concluded that the superimposition of the sorption-bound water of individual minerals cannot be used to estimate the sorption-bound water of the montmorillonite and feldspar mixtures themselves.
4. Conclusions
This study conducted isothermal adsorption tests on a series of artificially mixed clays and found the types and boundaries of bound water adsorbed by clayey soils. On this basis, the relationship between the combined amounts of water of mixed clayey soils and influencing factors thereof, such as mineral composition and specific surface area, were discussed. Our conclusions, which follows, may provide a theoretical basis and analytical model for geotechnical engineering disaster prevention and environmental protection.
(1) The specific surface area (SSA) of mixed clayey soils increased linearly with the content of montmorillonite (CMnt.).
(2) There are two distinct characteristic relative humidities (RH = 0.90 and RH = 0.98) in the isothermal adsorption curves of mixed clayey soils, the former being the boundary between strongly bound water and weakly bound water, and the latter being the boundary between weakly bound water and free water.
(3) For mixed clayey soils of the same mineral composition, the amount of adsorbed bound water increases with the increase of the montmorillonite content (CMnt.), and specific surface area (SSA) shows a roughly linear relationship with it, as well. In fact, clays’ mineral compositions (montmorillonite) was the most fundamental influencing factor.
(4) In the ranges of relative humidity (RH) between 0 and 0.85, the superimposed adsorption isotherms of the Type II mixed soils (montmorillonite + kaolin) were in good agreement with experimental data, while those of Type III mixed soils (montmorillonite + feldspar) largely exceeded the experimental data and differed significantly from the experimental data.
Author Contributions
Data curation, T.H. and S.-H.T.; Investigation, C.-L.Y.; Supervision, Z.-T.Z.; Writing—original draft, E.-J.Y.; Writing—review and editing, H.-Y.M. All authors have read and agreed to the published version of the manuscript.
Funding
This research was funded by the National Natural Science Foundation of China [Grant No. 41962014, 42167020], the Natural Science Foundation of Guangxi Province, China [Grant No. 2019GXNSFAA245025; 2018GXNSFAA138182; 2018GXNSFDA281038].
Institutional Review Board Statement
Not applicable.
Informed Consent Statement
Not applicable.
Data Availability Statement
Conflicts of Interest
The authors declare that they have no known competing financial interests or personal relationships that could have appeared to influence the work reported in this paper.
References
- Mitchell, J.K.; Soga, K. Fundamentals of Soil Behavior, 3rd ed.; John Wiley: New York, NY, USA, 2005. [Google Scholar]
- Zhao, C.G.; Bai, B. Fundamentals of Soil Mechanics; Tsinghua University Press: Beijing, China, 2009. [Google Scholar]
- Tang, S.H. Research on Bound Water and Its Influence on Thermal Conductivity of Red Clay; Guilin University of Technology: Guilin, China, 2017. [Google Scholar]
- Wu, Y.D. Research on Influence of Water Content on Physical—Mechanical Properties of Red Clay and Its Micro-Mechanism; Guilin University of Technology: Guilin, China, 2019. [Google Scholar]
- Yun, W.Y. Testing Study on Absorbed Water in Expansive and Shrinkable Soil; Guilin University of Technology: Guilin, China, 2019. [Google Scholar]
- Xu, Y.S.; Sun, D.A.; Zeng, Z.T.; Lv, H.B. Temperature dependence of apparent thermal conductivity of compacted bentonites as buffer material for high-level radioactive waste repository. Appl. Clay Sci. 2019, 174, 10–14. [Google Scholar] [CrossRef]
- Xie, Y.H.; Zeng, Z.T.; Zhang, B.H.; Zhang, Y.; Tang, S.H. Analysis and modeling of bound water adsorption by mixed clay based on adsorption theory. Arab. J. Geosci. 2021, 14, 1–11. [Google Scholar] [CrossRef]
- Sun, D.A.; Liu, W.J.; Lv, H.B. Soil-water characteristic curve of Guilin lateritic clay. Rock Soil Mech. 2014, 35, 3345–3351. [Google Scholar]
- Tan, Y.Z.; Xu, X.; Ming, H.J.; Sun, D.A. Analysis of double-layered buffer in high-level waste repository. Ann. Nucl. Energy 2021, 165, 108660. [Google Scholar] [CrossRef]
- Li, S.L.; Bo, Z.Z.; Qin, S.J. Translation Anthology of Absorbed Water in Soils; Geological Publishing House: Beijing, China, 1982. [Google Scholar]
- Langmuir, I. The adsorption of gases on plane surface of glass, mica and platinum. J. Am. Chem. Soc. 1918, 40, 361–403. [Google Scholar] [CrossRef] [Green Version]
- Brunauer, S.; Emmett, P.H.; Teller, E. Gases in multimolecular layers. J. Am. Chem. Soc. 1938, 60, 309–319. [Google Scholar] [CrossRef]
- Wang, P.Q. The Study for Quantitative Analysis of Water on Clays and Their Hydration Mechanism; Southwest Petroleum Institute: Chengdu, China, 2001. [Google Scholar]
- Wang, P.Q. Determination of bound water boundary on clay surface by isothermal adsorption. J. Southwest Pet. Inst. 2005, 27, 57–61. [Google Scholar]
- Wang, T.X.; Li, Y.L.; Su, L.J. Types and boundaries of bound water on loess particle surface. Chin. J. Geotech. Eng. 2014, 36, 942–948. [Google Scholar]
- Li, Y.L. Bound Water Properties and Moisture Migration in Unsaturated Loess; Xi’an University of Architecture and Technology: Xi’an, China, 2015. [Google Scholar]
- Song, Y.P. Influence of Bound Water on Physical and Mechanical Properties of Loess; Chang’an University: Xi’an, China, 2018. [Google Scholar]
- Wu, Q. Research on Influence of Bond Water on Secondary Consolidation and Long Term Strength of Soft Clay; Jilin University: Changchun, China, 2015. [Google Scholar]
- EN 933-9. Tests for Geometrical Properties of Aggregates-Part 9: Assessment of Fines-Methylene Blue Test; European Committee for Standardization: Brussels, Belgium, 2009. [Google Scholar]
- Hao, G.Z.; Xing, L.Y.; Liang, Q.W. Humidity fixing point of saturated brine solution (1)-principle and preparation. Sensor World 1999, 11, 1–4. [Google Scholar]
- Krachenbuehl, F.; Stoeckli, H.F.; Brunner, F.; Kahr, G.; Müller-Vonmoos, M. Study of the water-bentonite system by vapour adsorption, immersion calorimetry and x-ray techniques: 1. Micropore volumes and internal surface areas, following Dubinin’s theory. Clay Miner. 1987, 22, 1–9. [Google Scholar] [CrossRef]
- Martin, R.T. Adsorbed water on clay: A review. Clays Clay Miner. 1960, 9, 28–70. [Google Scholar] [CrossRef]
- Osipov, V.I. Nanofilms of adsorbed water in clay: Mechanism of formation and properties. Water Resour. 2012, 39, 709–721. [Google Scholar] [CrossRef]
- Zhang, Z.H. Research on Suction of Unsaturated Loess-Bonded Water; Chang’an University: Xi’an, China, 2018. [Google Scholar]
Figure 1.
Determination of testing end. (a) Titration process; (b) titration end point.

Figure 2.
Isothermal adsorption process.

Figure 3.
Relationship between SSA and CMnt. of soils.

Figure 4.
Isothermal adsorption curves of mixed clayey soils. (a) Type II (mixed soils with Mnt + Kln). (b) Type III (mixed soils with Mnt + Fsp).
Figure 4.
Isothermal adsorption curves of mixed clayey soils. (a) Type II (mixed soils with Mnt + Kln). (b) Type III (mixed soils with Mnt + Fsp).

Figure 5.
Relationship between bound water and Mnt. content. (a) Type II (mixed soils with Mnt + Kln). (b) Type III (mixed soils with Mnt + Fsp).
Figure 5.
Relationship between bound water and Mnt. content. (a) Type II (mixed soils with Mnt + Kln). (b) Type III (mixed soils with Mnt + Fsp).

Figure 6.
Relationship between bound water and SSA of soils.

Figure 7.
Bound water distributed on a clay particle surface.

Figure 8.
Superposition isotherms adsorption of mixed soils. (a) Type II (mixed soils with Mnt + Kln), (b) Type III (mixed soils with Mnt + Fsp).
Figure 8.
Superposition isotherms adsorption of mixed soils. (a) Type II (mixed soils with Mnt + Kln), (b) Type III (mixed soils with Mnt + Fsp).


Table 1.
Main physical properties of mineral powders.
| Mineral Powders | Specific Gravity Gs | Liquid Limit ωL/% | Plastic Limit ωP/% | Plastic Index Ip/% |
|---|---|---|---|---|
| montmorillonite (Mnt) | 2.70 | 177.00 | 29.26 | 147.24 |
| kaolin (Kln) | 2.63 | 32.48 | 22.15 | 10.33 |
| feldspar (Fsp) | 2.60 | — | — | — |
Table 2.
Mineral compositions of mixed soil samples.
| Clayey Soil Type | Sample Number | Sample Name | Mineral Composition and Content (%) | ||
|---|---|---|---|---|---|
| Montmorillonite (Mnt) | Kaolinite (Kln) | Feldspar (Fsp) | |||
| Type I: single mineral | S-1 | 100%Mnt | 100 | — | — |
| S-2 | 100%Kln | — | 100 | — | |
| S-3 | 100%Fsp | — | — | 100 | |
| Type II: mixed minerals (montmorillonite and kaolinite) | S-4 | 90%Mnt + 10%Kln | 90 | 10 | — |
| S-5 | 70%Mnt + 30%Kln | 70 | 30 | — | |
| S-6 | 50%Mnt + 50%Kln | 50 | 50 | — | |
| S-7 | 30%Mnt + 70%Kln | 30 | 70 | — | |
| S-8 | 10%Mnt + 90%Kln | 10 | 90 | — | |
| Type III: mixed minerals (montmorillonite and feldspar) | S-9 | 90%Mnt + 10%Fsp | 90 | — | 10 |
| S-10 | 70%Mnt + 30%Fsp | 70 | — | 30 | |
| S-11 | 50%Mnt + 50%Fsp | 50 | — | 50 | |
| S-12 | 30%Mnt + 70%Fsp | 30 | — | 70 | |
| S-13 | 10%Mnt + 90%Fsp | 10 | — | 90 | |
Table 3.
Saturated salt solution and its corresponding relative humidity.
| Saturated Salt Solution | RH (%) | Saturated Salt Solution | RH (%) |
|---|---|---|---|
| LiBr | 6.6 | NaNO2 | 65.6 |
| LiCl·H2O | 12 | KI | 69.9 |
| CH3COOK | 23.1 | NaCl | 75.5 |
| MgCl2·6H2O | 33.1 | KCl | 85.1 |
| K2CO3 | 43.2 | NaSO3·7H2O | 90.8 |
| NaBr | 59.1 | K2SO4 | 97.6 |
Table 4.
Specific surface areas (SSA) of mixed soil samples.
| Sample Number | S-1 | S-2 | S-3 | S-4 | S-5 | S-6 | S-7 | S-8 | S-9 | S-10 | S-11 | S-12 | S-13 |
|---|---|---|---|---|---|---|---|---|---|---|---|---|---|
| SSA (m2/g) | 569.05 | 20.64 | 4.28 | 85.59 | 185.94 | 313.42 | 457.45 | 539.17 | 62.84 | 164.05 | 297.57 | 406.24 | 511.79 |
Table 5.
Bound water of mixed clayey soils.
| Sample Number | Strongly Bound Water/% | Weakly Bound Water/% | Total Bound Water/% |
|---|---|---|---|
| S-1 | 23.478 | 16.757 | 40.235 |
| S-2 | 1.610 | 2.946 | 4.556 |
| S-4 | 6.935 | 8.174 | 15.109 |
| S-5 | 10.165 | 10.653 | 20.818 |
| S-6 | 13.707 | 11.762 | 25.469 |
| S-7 | 17.313 | 12.837 | 30.150 |
| S-8 | 20.401 | 15.436 | 35.837 |
| S-9 | 1.582 | 2.556 | 4.138 |
| S-10 | 5.174 | 7.665 | 12.839 |
| S-11 | 9.110 | 9.763 | 18.873 |
| S-12 | 13.366 | 10.484 | 23.850 |
| S-13 | 18.166 | 10.146 | 28.312 |
Publisher’s Note: MDPI stays neutral with regard to jurisdictional claims in published maps and institutional affiliations. |
© 2021 by the authors. Licensee MDPI, Basel, Switzerland. This article is an open access article distributed under the terms and conditions of the Creative Commons Attribution (CC BY) license (https://creativecommons.org/licenses/by/4.0/).
Share and Cite
MDPI and ACS Style
Yang, E.-J.; Zeng, Z.-T.; Mo, H.-Y.; Hu, T.; Yang, C.-L.; Tang, S.-H. Analysis of Bound Water and Its Influence Factors in Mixed Clayey Soils. Water 2021, 13, 2991. https://doi.org/10.3390/w13212991
AMA Style
Yang E-J, Zeng Z-T, Mo H-Y, Hu T, Yang C-L, Tang S-H. Analysis of Bound Water and Its Influence Factors in Mixed Clayey Soils. Water. 2021; 13(21):2991. https://doi.org/10.3390/w13212991
Chicago/Turabian StyleYang, Er-Jing, Zhao-Tian Zeng, Hong-Yan Mo, Tao Hu, Cheng-Lin Yang, and Shuang-Hui Tang. 2021. "Analysis of Bound Water and Its Influence Factors in Mixed Clayey Soils" Water 13, no. 21: 2991. https://doi.org/10.3390/w13212991
Note that from the first issue of 2016, this journal uses article numbers instead of page numbers. See further details here.