Article

Optical, Geochemical and Mineralogical Characteristics of Light-Absorbing Impurities Deposited on Djankuat Glacier in the Caucasus Mountains

by
Stanislav Kutuzov
1,2,*,
Maria Shahgedanova
3,
Viktoria Krupskaya
4 and
Sergey Goryachkin
1
1
Institute of Geography, Russian Academy of Sciences, 119017 Moscow, Russia
2
Faculty of Geography and Geoinformation Technologies, National Research University Higher School of Economics, 101000 Moscow, Russia
3
Department of Geography and Environmental Science, University of Reading, Whiteknights RG6 6AB, UK
4
Institute of Geology of Ore Deposits, Petrology, Mineralogy and Geochemistry of the Russian Academy of Sciences, 119017 Moscow, Russia
*
Author to whom correspondence should be addressed.
Water 2021, 13(21), 2993; https://doi.org/10.3390/w13212993
Submission received: 12 August 2021 / Revised: 17 October 2021 / Accepted: 19 October 2021 / Published: 22 October 2021
(This article belongs to the Special Issue Geochemistry of Landscape and Soil)

Abstract

:
Supra-glacial material, including light-absorbing impurities (LAI) such as mineral dust of crustal and soil origin, black carbon, algae and cryoconite, reduce the reflectance of snow and glacier ice. The reduction depends on the amount of LAI and their physical and chemical properties, which vary spatially and temporally. Spectral reflectance data and snow and ice samples, containing LAI, were collected in the ablation zone of the Djankuat Glacier, Central Caucasus, Russia. The spectra of the samples containing mineral dust transported from deserts were characterized by negative visible near-infrared gradients and were different from the spectra of clean aged snow and exposed glacier ice and from the samples containing mineral dust produced locally. Geochemical and mineralogical analysis using X-ray diffraction and X-ray fluorescence spectrometry showed that samples containing desert dust were characterised by a high proportion of clay materials and such minerals as smectites, illite–smectites and palygorskite and by a smaller size of mineral particles. They were enriched in chromium, zinc and vanadium. The latter served as an indicator of dust transport over or origin from the oil-producing regions of the Middle East. There was a strong negative correlation between the amount of organic matter and mineral dust in the collected samples and the albedo of surfaces from which the samples were collected. The results suggested that organic matter reduced albedo more efficiently than mineral dust. The study highlighted the importance of supra-glacial material in changing the surface reflectivity of snow and glaciers in the Caucasus region.

1. Introduction

Mountain glaciers and high-elevation snow pack are important components of water balance in many regions worldwide. They make a significant contribution to runoff providing a vital ecosystem service to millions of people [1,2,3]. Changes in the albedo of snow and glacier ice are an important control over snow and glacier melt alongside air temperature. Albedo is controlled by several factors including the size of snow grains, water content of snow and amount and composition of light-absorbing impurities (LAI) deposited on snow and ice. LAI generate direct positive at-surface radiative forcing (RF) increasing melt [4] and evoke a positive feedback whereby higher melt rates lead to an earlier loss of snow cover and exposure of the darker firn and bare ice surfaces, which absorb more energy resulting in further loss of snow and ice [5,6,7]. The most common supra-glacial LAI are algae and products of biogenic decay (cryoconite) [8,9], black carbon (BC) [10,11] and mineral dust [12,13,14]. The latter is derived either from crustal materials or from soils and is produced locally or/and transported from remote regions, predominantly from deserts [15,16].
The most efficient LAI are BC and cryoconite. The Sixth IPCC report [17] estimated the effective radiative forcing (ERF) of BC as +0.08 (0.00 to 0.18) W m−2. Cryoconite is a dark-coloured granular sediment that is a mixture of mineral and soil particles and organic matter including products of microbiological activity and organo–mineral interactions. Although there are no large-scale assessments of its RF, local studies showed that it can be as efficient as BC [8,18]. Although mineral dust absorbs less solar radiation per unit mass than BC and cryoconite, other factors make it an important control over snow and glacier melt because the at-surface RF of LAI depends on the spatial extent, elevation and timing of deposition. The latter controls the occurrence of positive air temperatures and snow accumulation after a deposition event. Those events, which occur in late spring and in summer, are climatologically significant.
Radiative effects of LAI are highly variable over snow and glacier surfaces and uncertainties, associated with the RF of LAI, are high [11]. Currently, there are few observations of changes in the reflective properties of snow and glacier ice affected by different types of LAI [8,19,20,21,22]. There are also few studies linking spectral signatures of mineral dust with its geochemical composition [13,23], although similar assessments exist for algae [24,25] and supra-glacial debris [26].
The Caucasus Mountains is one of the glacierized regions affected by the deposition of desert dust, and its occurrence, sources and chemical composition were investigated using ice cores extracted at Mt. Elbrus, satellite imagery, and air trajectory modelling [16,27]. The deposition of desert dust on Mt. Elbrus occurs, on average, 3–4 times a year predominantly between March and June, and the main sources are the northern Sahara and the Middle East. Although the largest changes in albedo occur following deposition events, the contribution of the at-surface RF of dust to melt is most significant during the melt season when dust, buried in snowpack, emerges on the snow and ice surface often mixing with other LAI such as cryoconite or mineral deposits derived from the nearby exposed terrain. Glaciers in the Caucasus are losing mass at an increasing rate [28,29,30] and negative mass balance leads to a rapid reduction in glacier area, exposure of the sub-glacier terrain and an increase in the supra-glacial debris cover [31,32]. The observed increase in summer temperature and the incoming shortwave radiation drive glacier recession [33]. The deposition of LAI of different types and darkening of the glacier surface are also likely to contribute to glacier melt.
The aim of this paper is to examine variability in spectral reflectance over snow and glacier ice in the central Greater Caucasus during the melt season. The specific objectives are (i) to characterise optical, geochemical and mineralogical characteristics of different types of LAI using in situ measurements of spectral reflectance and (ii) to characterise links between the elemental and mineral composition of LAI and their spectral signatures.

2. Materials and Methods

The methodology consisted of (i) in situ collection of reflectance spectra and samples of snow and ice, (ii) analysis of spectral signatures to different types of LAI, (iii) analysis of mineralogy and geochemistry of the collected samples, and (iv) establishing qualitative links between the spectral signatures, chemical composition, and mineralogy.
The in situ measurements of spectral reflectance of snow and ice samples were collected from the Djankuat Glacier located in the central sector of the Glavny (Main) Ridge of the Greater Caucasus (43.12° N; 42.45° E; ~2790–3050 m a.s.l.) on 7–11 August 2013 (Figure 1). The melt season begins on Djankuat in late May–early June and continues until the middle of September [31,34]. In 2020, the cumulative mass balance of the Djankuat Glacier reached −14.4 m w.e. since the beginning of observation in 1968 with a mean equilibrium line altitude of 3213 m a.s.l. [35]. In the 2007–2017 period, the glacier area decreased from 2.68 km2 to 2.42 km2, or by 10% [31].

2.1. In Situ Spectral Measurements

At the time of measurements, the glacier surface was represented by patches of aged melting snow with grain size varying between 1 and 1.5 mm. The maximum snow depth reached 1.5 m and a considerable proportion of glacier was represented by the exposed firn areas and glacier ice. To ensure detailed representation of surface characteristics, 18 plots of approximately 10 m × 10 m were selected in the ablation zone of the glacier (Figure 1) and, within each plot, measurements were taken at three–four points. Each measurement point was labelled with a plot and point number (e.g., S1/1). In total, 50 points at 18 plots were sampled in the elevation range from 2800 to 3030 m a.s.l. (Table S1).
An SVC HR-1024i high resolution portable spectroradiometer with the spectral range of 350–2500 nm, and 1024 channels was used. Spectral Resolution (FWHM) is 3.3 nm, 700 nm; ≤9.5 nm, 1500 nm; ≤6.5 nm, 2100 nm. The measurements were taken around mid-day in bright sunshine and spectral reflectance was calculated with reference to a Spectralon plate. At least three measurements were taken at each point using 4° lens. The spectrally-integrated albedo was calculated from total hemispherical-directional reflectance in the 372–1050 nm wavelength range of the target surface and that of the Spectralon plate. In total, 142 spectra were analysed. All calculations were performed using the Field Spectroscopy Facility (FSF) Post Processing Toolbox for processing spectra in MATLAB software (https://fsf.nerc.ac.uk/resources/post-processing/ (accessed on 1 October 2021)).
In order to detect the presence of impurities on snow, firn and glacier surface the visible near-infrared (VIS-NIR) reflectance gradient was analysed. The spectral signatures of snow and ice show high reflectance in the visible range and strong absorption in the NIR wavelengths. The presence of mineral dust on glacier surface decreases spectral albedo in the visible wavelengths from approximately 0.95 to as low as 0.30 and shifts the maximum reflectance towards NIR [14,36]. Therefore, negative values of the VIS-NIR gradient are used as indicator of the presence of mineral dust on snow and glacier surface. In this study, the wavelengths of 0.47 µm (VIS) and 0.86 µm (NIR) were selected to be consistent with the MODIS spectral bands (2 and 3) because most published studies attempting to detect the presence of dust on glacier surface are based on MODIS imagery.

2.2. Sample Collection and Analyses

At each measurement point, snow and ice samples were collected by removing the top 1–2 cm layer of the 30 cm × 30 cm plots (Figure 2). The samples were placed in sterile plastic bags, melted at room temperature, and filtered using the pre-weighed 0.2 µm Millipore filters. The filters were dried at 65 °C for 24 h and weighed using laboratory analytical scales with the accuracy of 0.0001 g (Analytical Balance MS105, Reading University, Reading, UK). The mass of LAI per unit area was obtained from the difference of the dry weights of a filter and the sampling area and expressed in g m−2.
The loss-on-ignition method was used to separate mineral dust from the organic matter other than BC and quantify the amount of mineral dust/BC and organic LAI in each sample. The weighed dried filters containing LAI were burned at 350 °C using 1000 degree Celsius muffle furnace (Reading University, Reading, UK). Combustion at this temperature did not eliminate BC, which potentially could be present in the samples. BC, however, causes more uniform reduction in reflectance in VIS-NIR spectrum than either mineral dust or organic components resulting in overall lower reflection and ‘flat’ spectra [4].
X-ray diffraction (XRD) was used to semi-quantitatively identify mineral composition of the samples and X-ray fluorescence spectrometry (XRF) was used to provide a quantitative measurement of weight percentages of the major elemental composition as oxides and trace elements as parts per million.
X-ray diffraction patterns were obtained with a Bruker AXS D5000 diffractometer (Reading University, Reading, UK). The mineral composition was analysed according to the method of Moore and Reynolds [37], the quantitative composition was estimated with the Rietveld method [38] using Profex software (Version 3.14.3), [39]. The sizes of coherent scattering regions (CSRs), which can be correlated with sizes of crystallites, were calculated in the Jade 6.0 program using the Scherrer equation. For quartz, the average crystallite size was calculated, and for illite, the CSR size was measured along the C axis, which correlates with the particle thickness and is the most significant parameter for clay minerals.
For XRF, pressed powder pellets were prepared from the ground samples and major and trace elements were measured on the pellets. Samples were analysed using Panalytical MagixPro XRF spectrometer (Reading University, Reading, UK) with an Rb 4 kW X-ray tube. The spectrometer was calibrated and the samples were analysed using Panalytical SuperQ analytical software. A wide range of international reference standards were used for calibration [40] and GSP-1 and DR-N standards were analysed at the same time as the collected samples to act as internal check standards. The nominal detection limit of trace elements measurements was 5 ppm.

2.3. Statistical Analysis

The Complete Linkage cluster analysis was run on the spectral measurements. The multiple spectra (three or more) collected at each point were averaged. The input data consisted of the average spectra for each point with the spectral range of 372–2463 nm. The obtained clusters were interpreted with regard to spectral characteristics of cluster members, elemental and mineral composition of samples collected from each measurement point, and amount of organic material.

3. Results

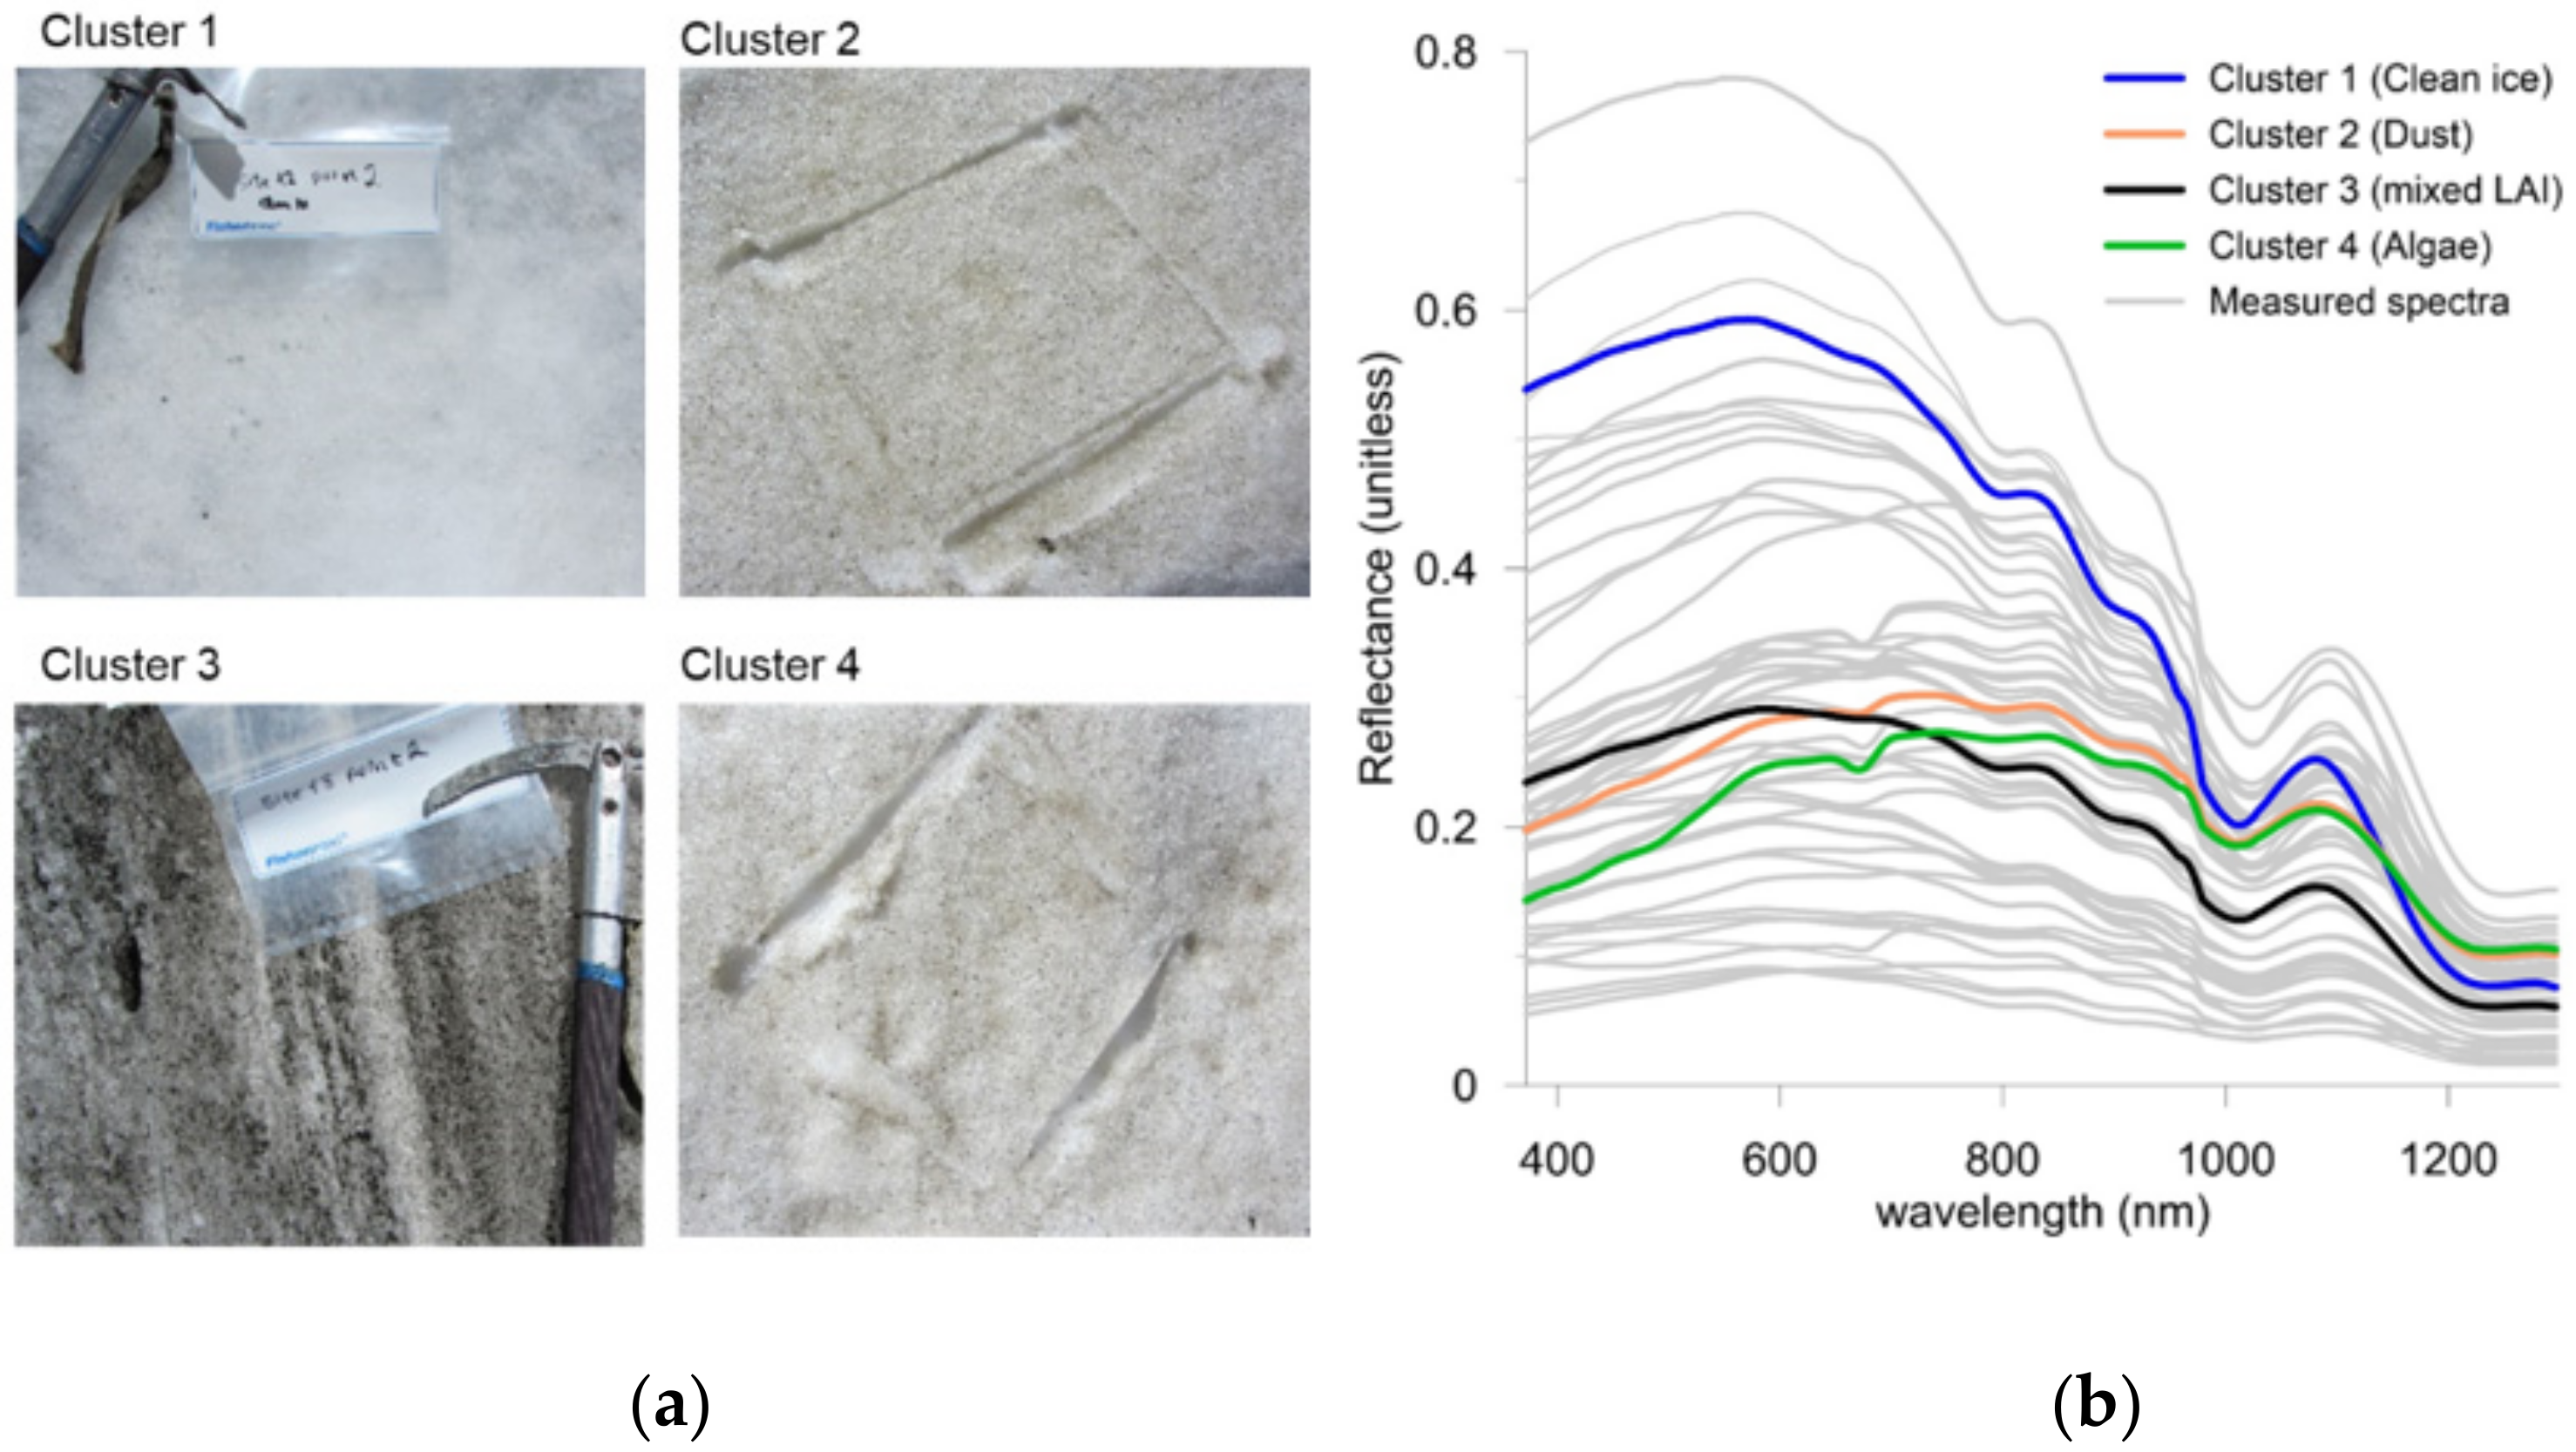
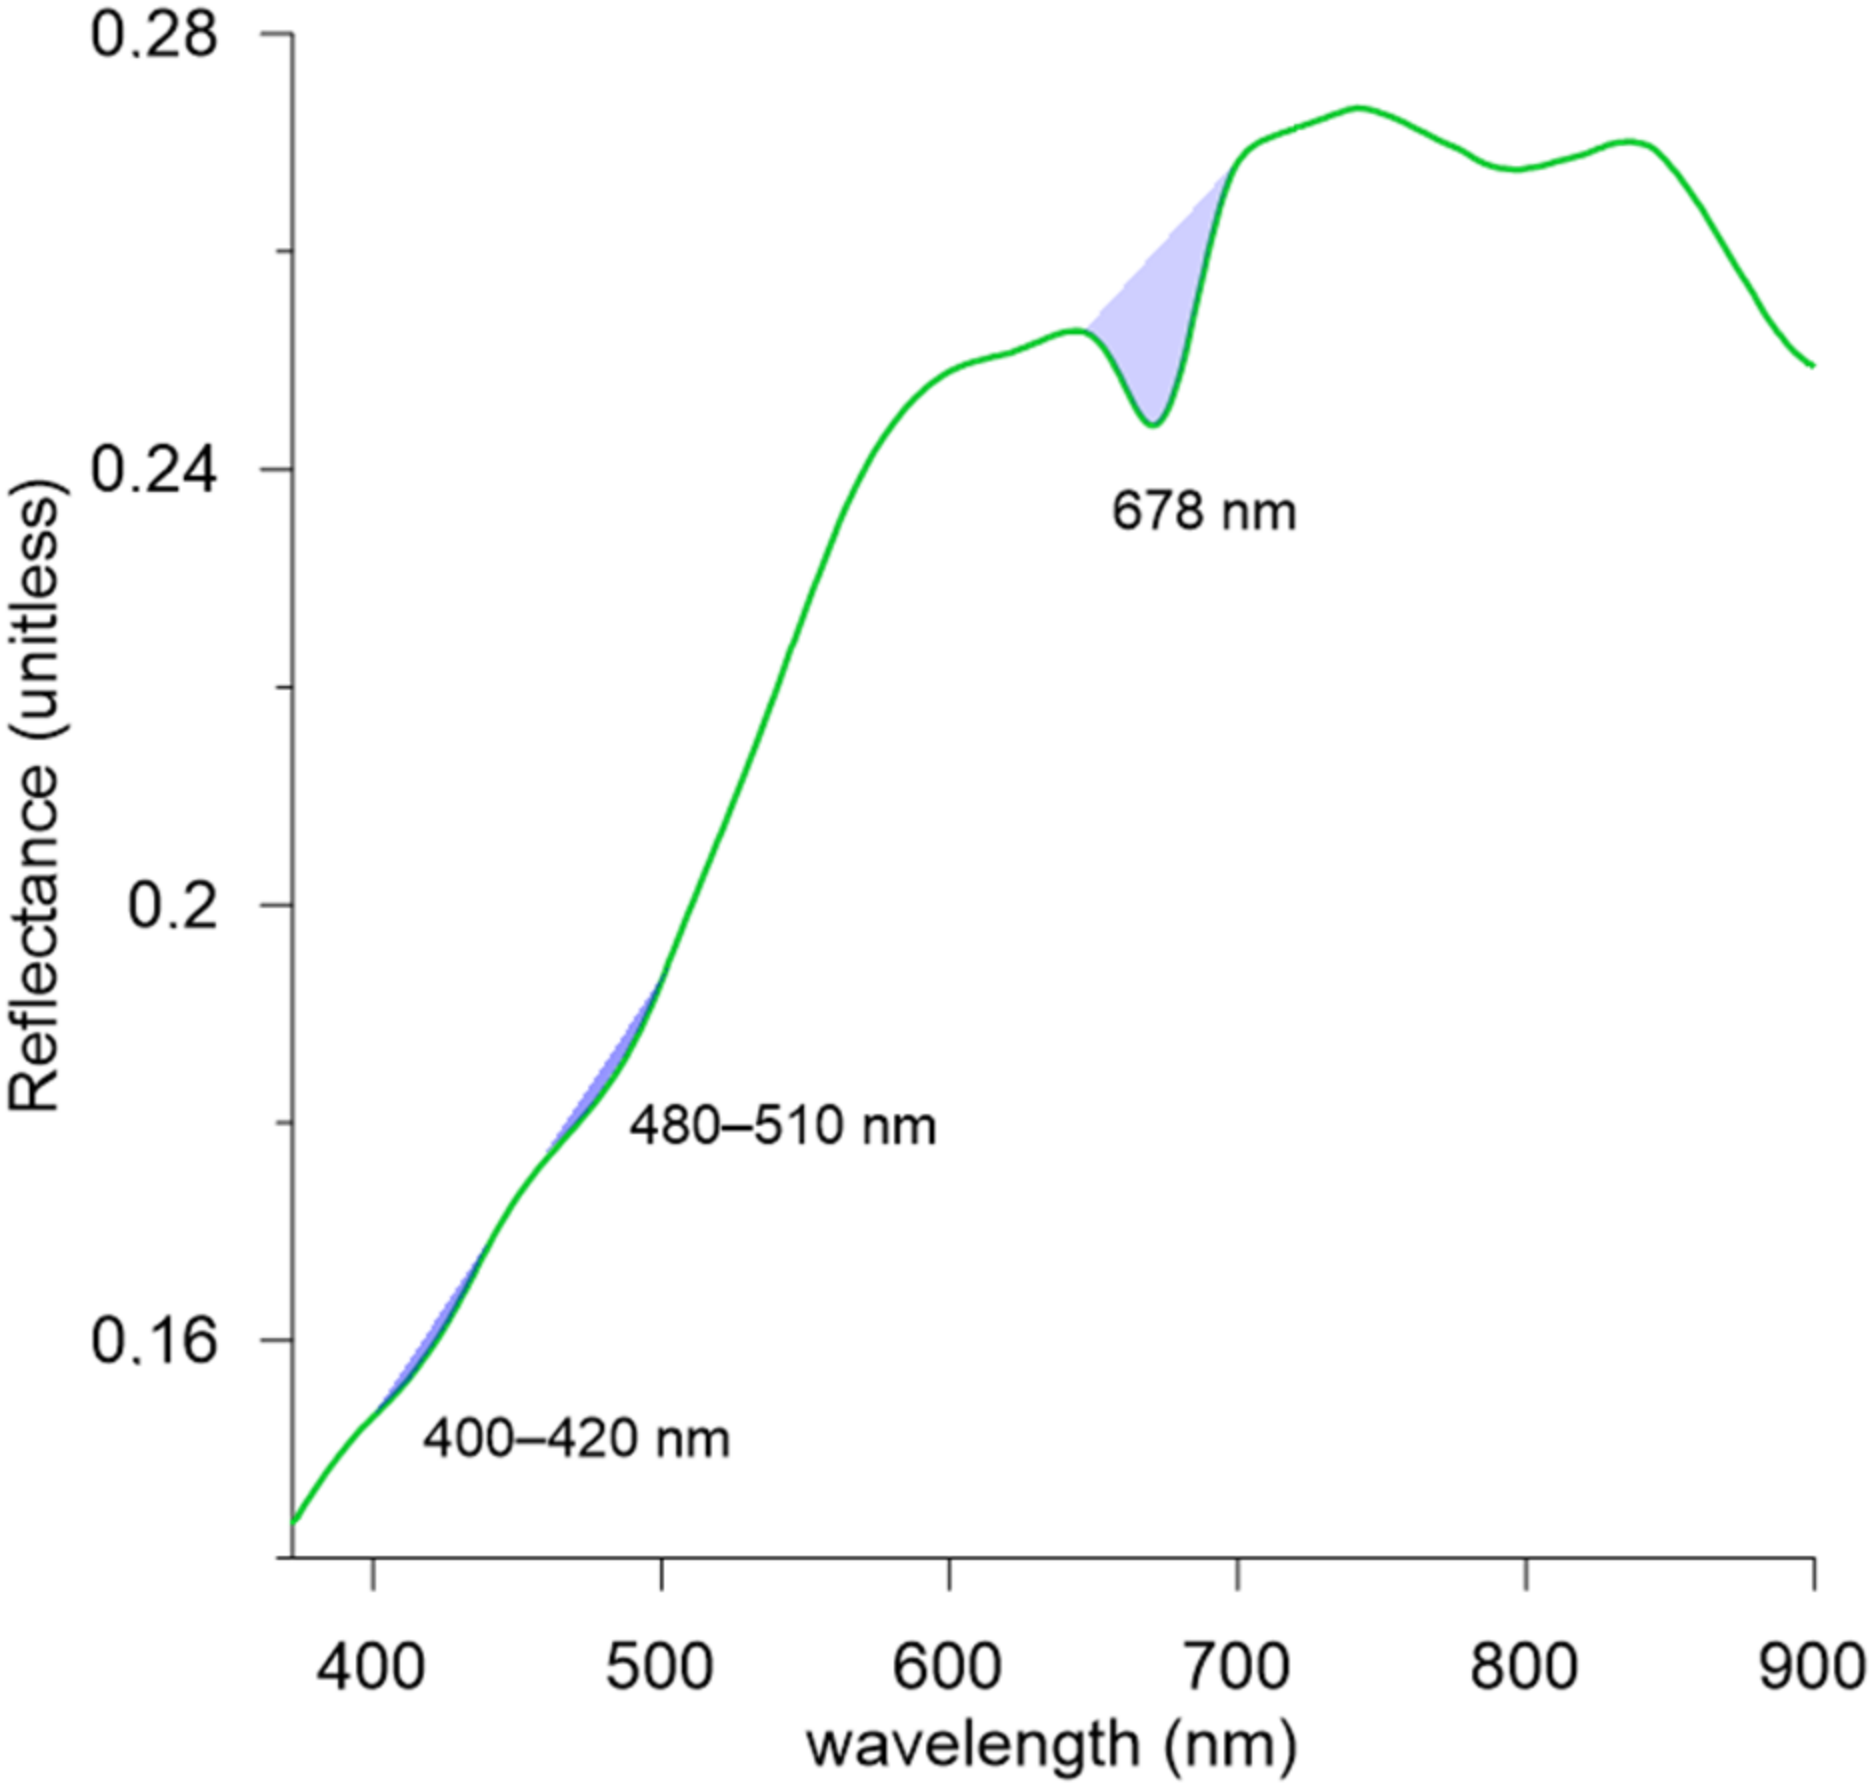
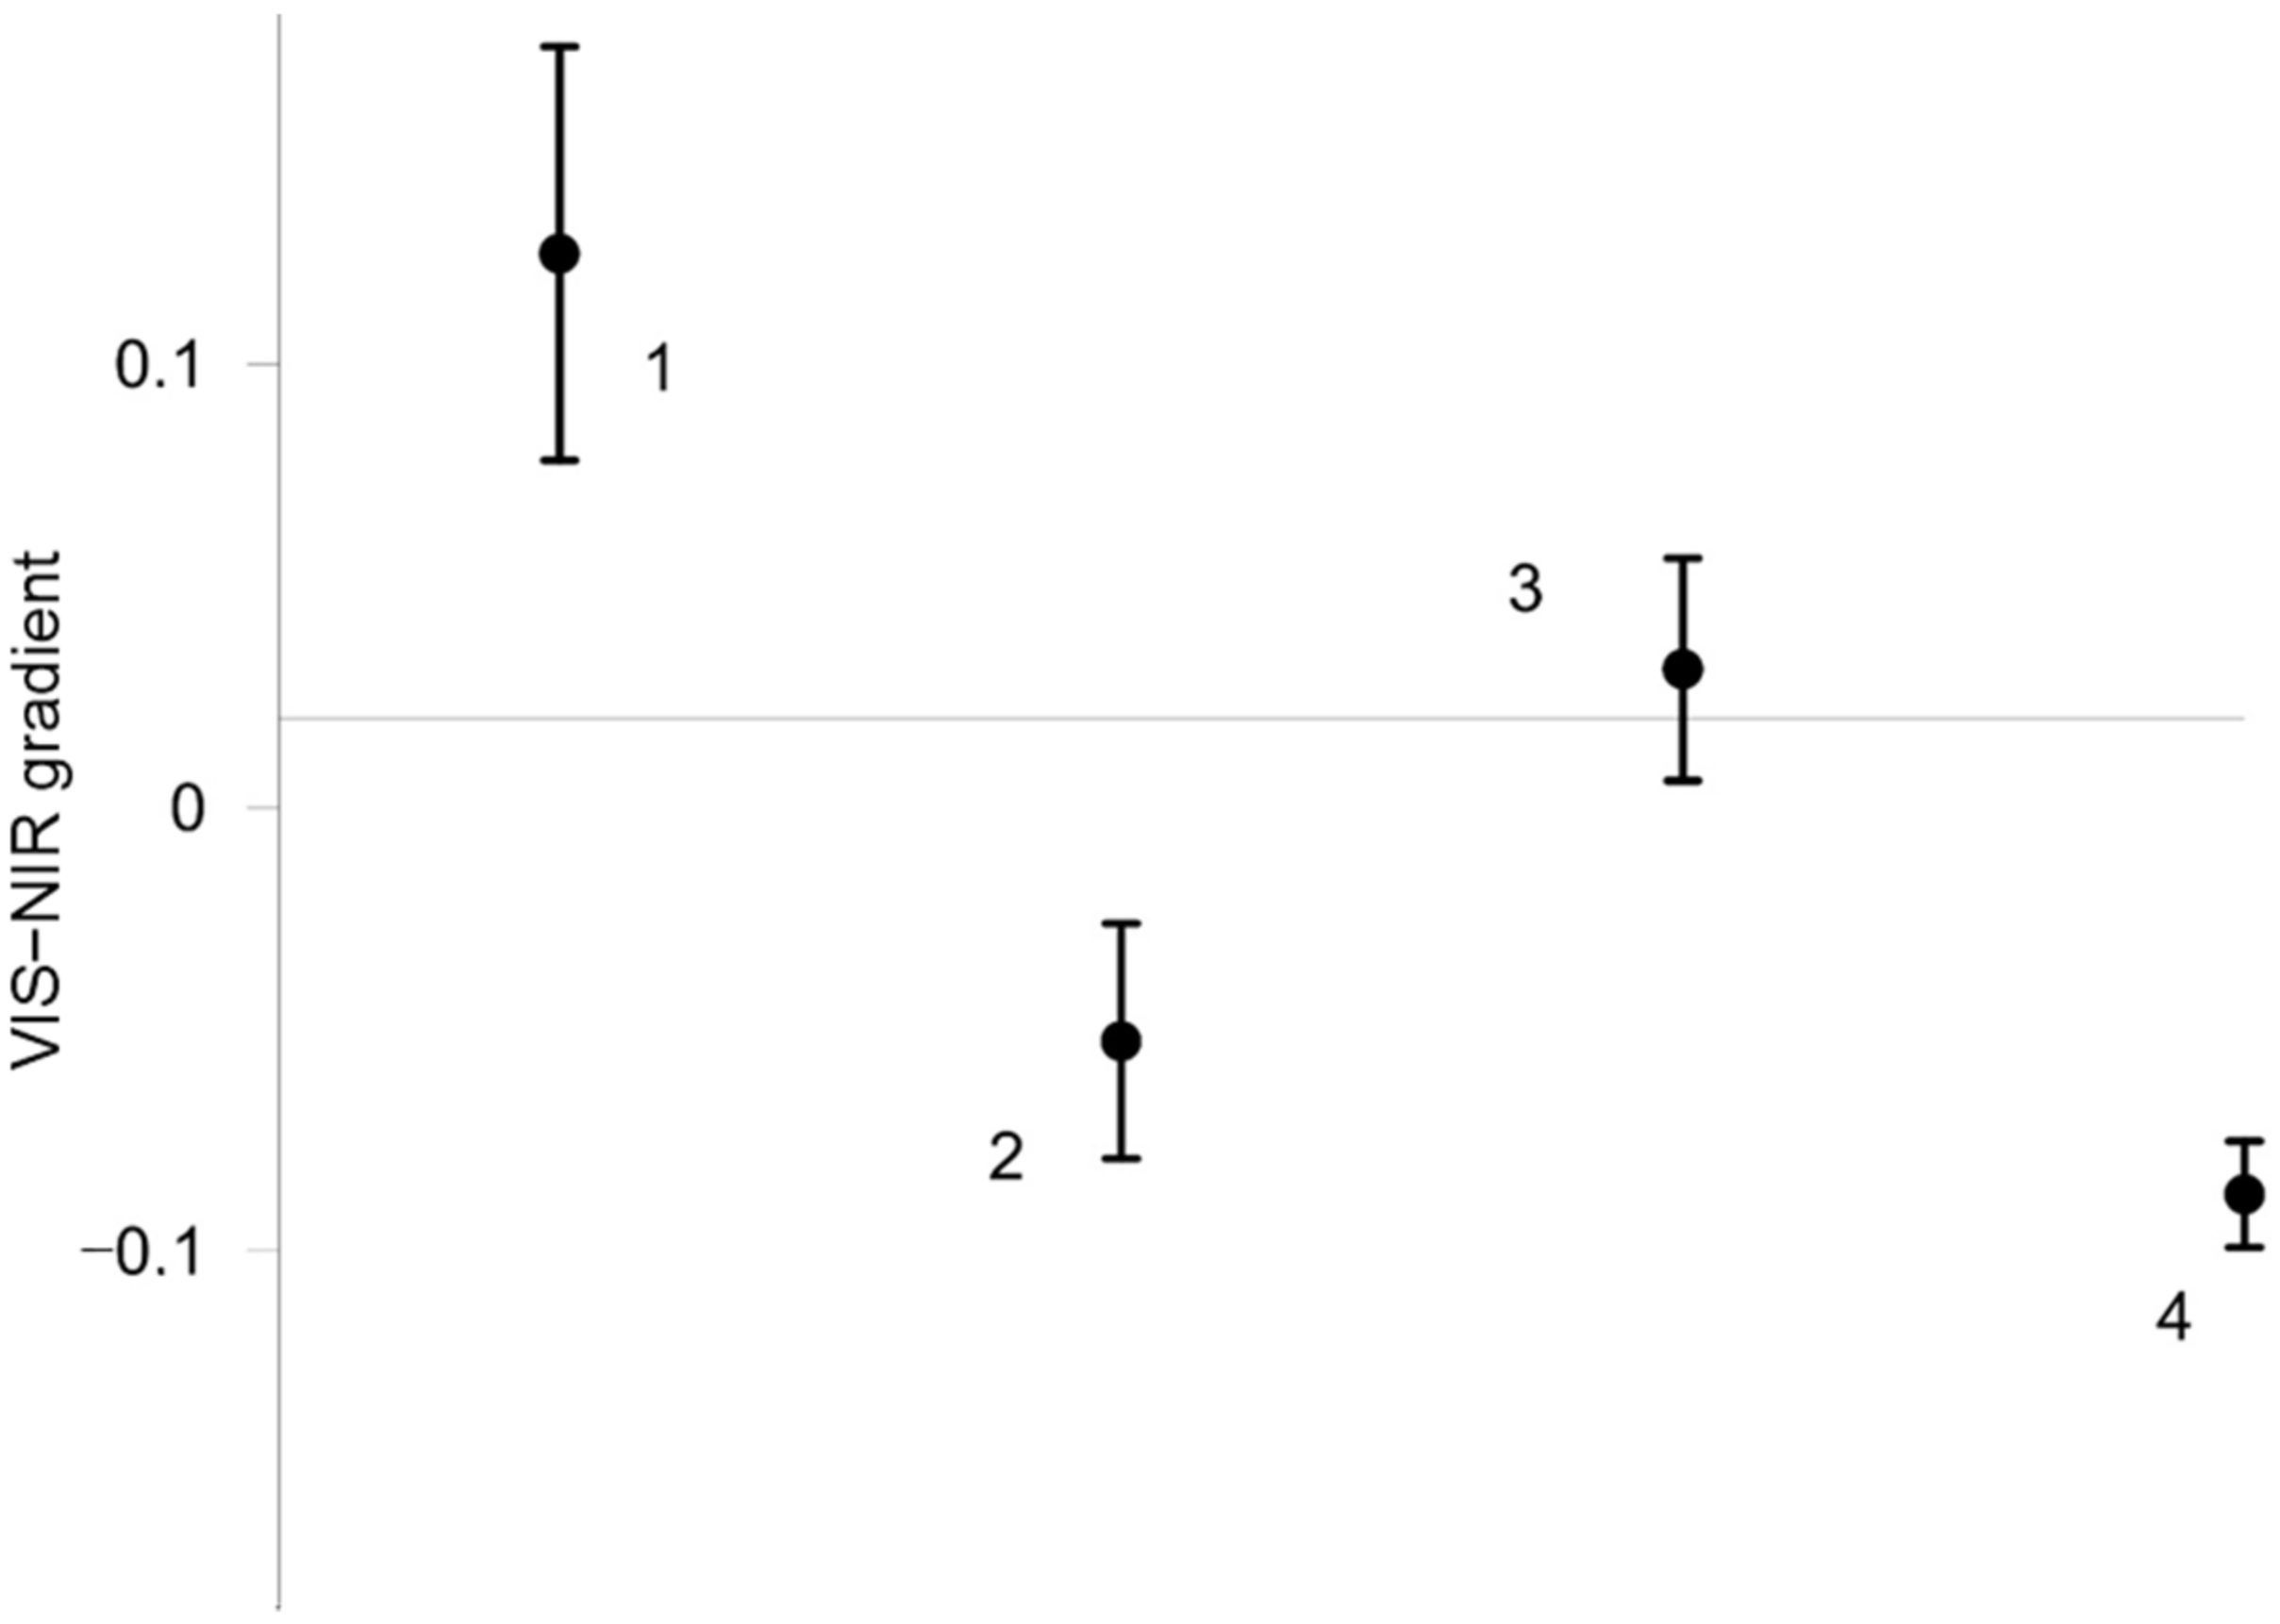
3.1. Spectral Reflectance

The collected spectra are shown in Figure 2. The application of cluster analysis generated four clusters (Table 1; Figure 2) predominantly according to the shapes of the spectra and VIS-NIR gradient values, while the absolute reflectance values varied significantly between measurement sites within the clusters (Table 1; Figure 2). The obtained clusters were labelled: (1) clean aged snow and ice; (2) mineral dust; (3) mixed LAI; (4) algae (Figure 2).
Cluster 1 contained spectra collected from the relatively clean aged snow (one spectrum) or exposed glacier ice without visible LAI (seven spectra).
Cluster 2 was dominated by samples collected from the aged snow and ice surfaces with the presence of dust and other LAI. Thirteen measurement points were distributed over the eight study plots and prevailed at sites covered in snow (two plots) and, at lower elevations, at two firn patches.
Cluster 3 exhibited the highest within-cluster variability in reflectance values varying between 0.07 and 0.52 at 0.47 µm (Table 1). This cluster was represented by glacier ice surfaces with large amounts of LAI.
Cluster 4 contained two spectra (Table 1). Characteristic of this cluster was a decline in reflectance at approximately 0.68 µm (Figure 2a and Figure 3) corresponding to the biological chlorophyll absorption minimum [9,41]. The chlorophyll-related absorption feature was clearly visible in Cluster 4 and, to a lesser extent, in Cluster 2, indicating the presence of biogenic products in both clusters.
Figure 4 shows the VIS-NIR gradients expressed as absolute difference between reflectance at 0.47 µm and 0.86 µm for the four clusters. The ANOVA test showed that there is statistically significant difference in VIS-NIR gradient values between all four clusters. All spectra in Cluster 1 and 23 (out of 26) spectra in Cluster 3 exhibited positive gradients, while all spectra in Clusters 2 and 4 were characterised by negative values (Figure 4).

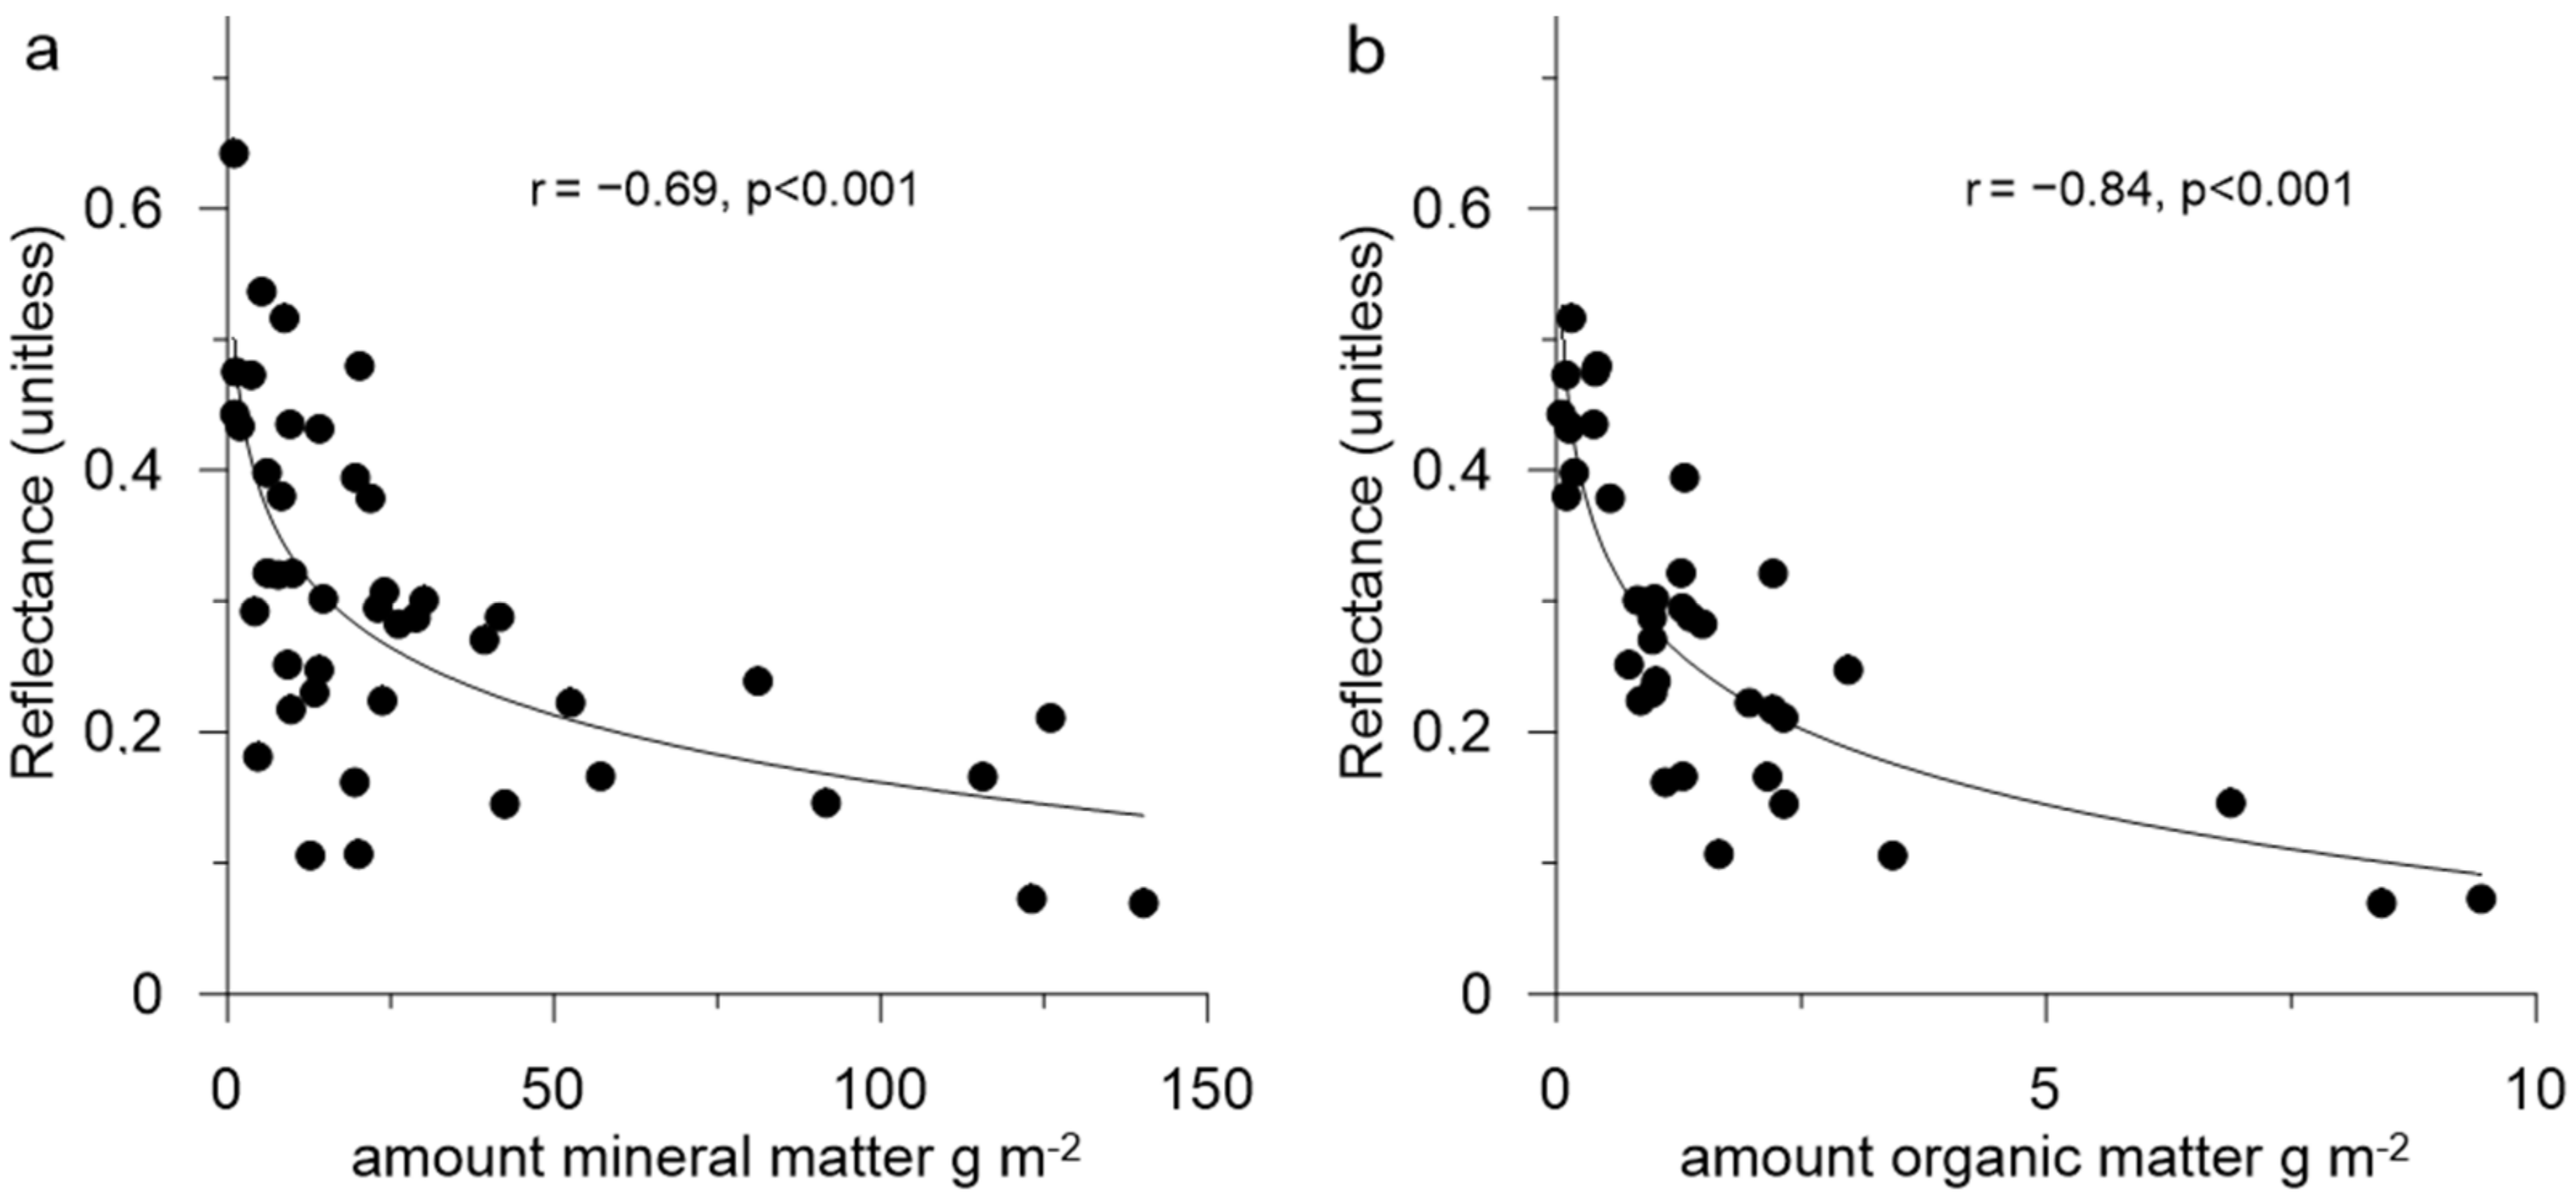
3.2. Concentrations and Composition of LAI

The dry weight of LAI varied considerably between 1 g m−2 and 149 g m−2 with an average of 31 g m−2 and a standard deviation of ±38 g m−2. The lowest LAI content was measured in the samples corresponding to Cluster 1 (Table 1). Samples attributed to Clusters 2 and 3 were characterised by higher dust load and exhibited high variability between the sampling sites. On average, six samples collected from the snow surface (average of 10 g m−2) were less polluted in comparison with the samples collected from the exposed ice surfaces (33 g m−2).
The ratios of organic matter to total dry weight of the samples ranged between 0.9% and 23.2% and did not exhibit significant correlation with altitude, although the ratios were lower on ice than the snow surface. The proportions of organic material in the samples corresponding to the spectra grouped in Clusters 1 and 3 were lower than in the samples corresponding to Clusters 2 and 4 (Table 1). Organic matter accounted for 8.5 ± 7.4% of the total weight of the Cluster 2 samples and, in six snow samples, it accounted for 17–23% of the samples’ weight. A distinct reduction in reflections at approximately 0.68 µm in the cluster-average spectra in Cluster 4, and a less well-pronounced reduction in Cluster 2, confirmed a higher presence of organic material than in other clusters.
Analysis of the amount of inorganic and organic matter in the samples collected from the glacier surface together with spectral reflectance measured at the same points enabled us to establish of relationships between these variables. There is a statistically significant negative correlation between the amount of mineral and organic matter and the broadband albedo (300–1050 nm) of the samples collected at the Djankuat Glacier (Figure 5). Even though the variability in the albedo values is high, there is clear evidence that surface concentrations of LAI in excess of 50 g m2 reduce albedo to less than 0.3.
The highest negative correlation was found using logarithmic regression. The correlation coefficients (r) for the relationship between albedo and the amounts of mineral and organic matter were −0.69 and −0.84, respectively, although organic matter constituted a lesser part of the total mass of the samples than mineral particles.
In the six samples collected at snow patches (Clusters 2 and 4), the amount of organic matter was higher in comparison to samples from exposed glacier ice due to the presence of algae and other biogenic products. In these samples, concentrations of inorganic impurities were as low as 7–14 g m−2, but reflectance at 0.47 µm declined to 0.11–0.48 in comparison to 0.43–0.77 of clean snow likely due to the presence of organic material, which accounted for 17–23% of the total weight of the snow samples. We performed an experiment by repeating the spectral reflectance measurements at the same site (plot 4) on the untouched snow surface and after the removal of the upper 5 cm of dusted snow. The reflectance at 0.47 µm increased from 0.18 to 0.49 despite the similar snow grain size, confirming a strong influence of LAI on reflectance.

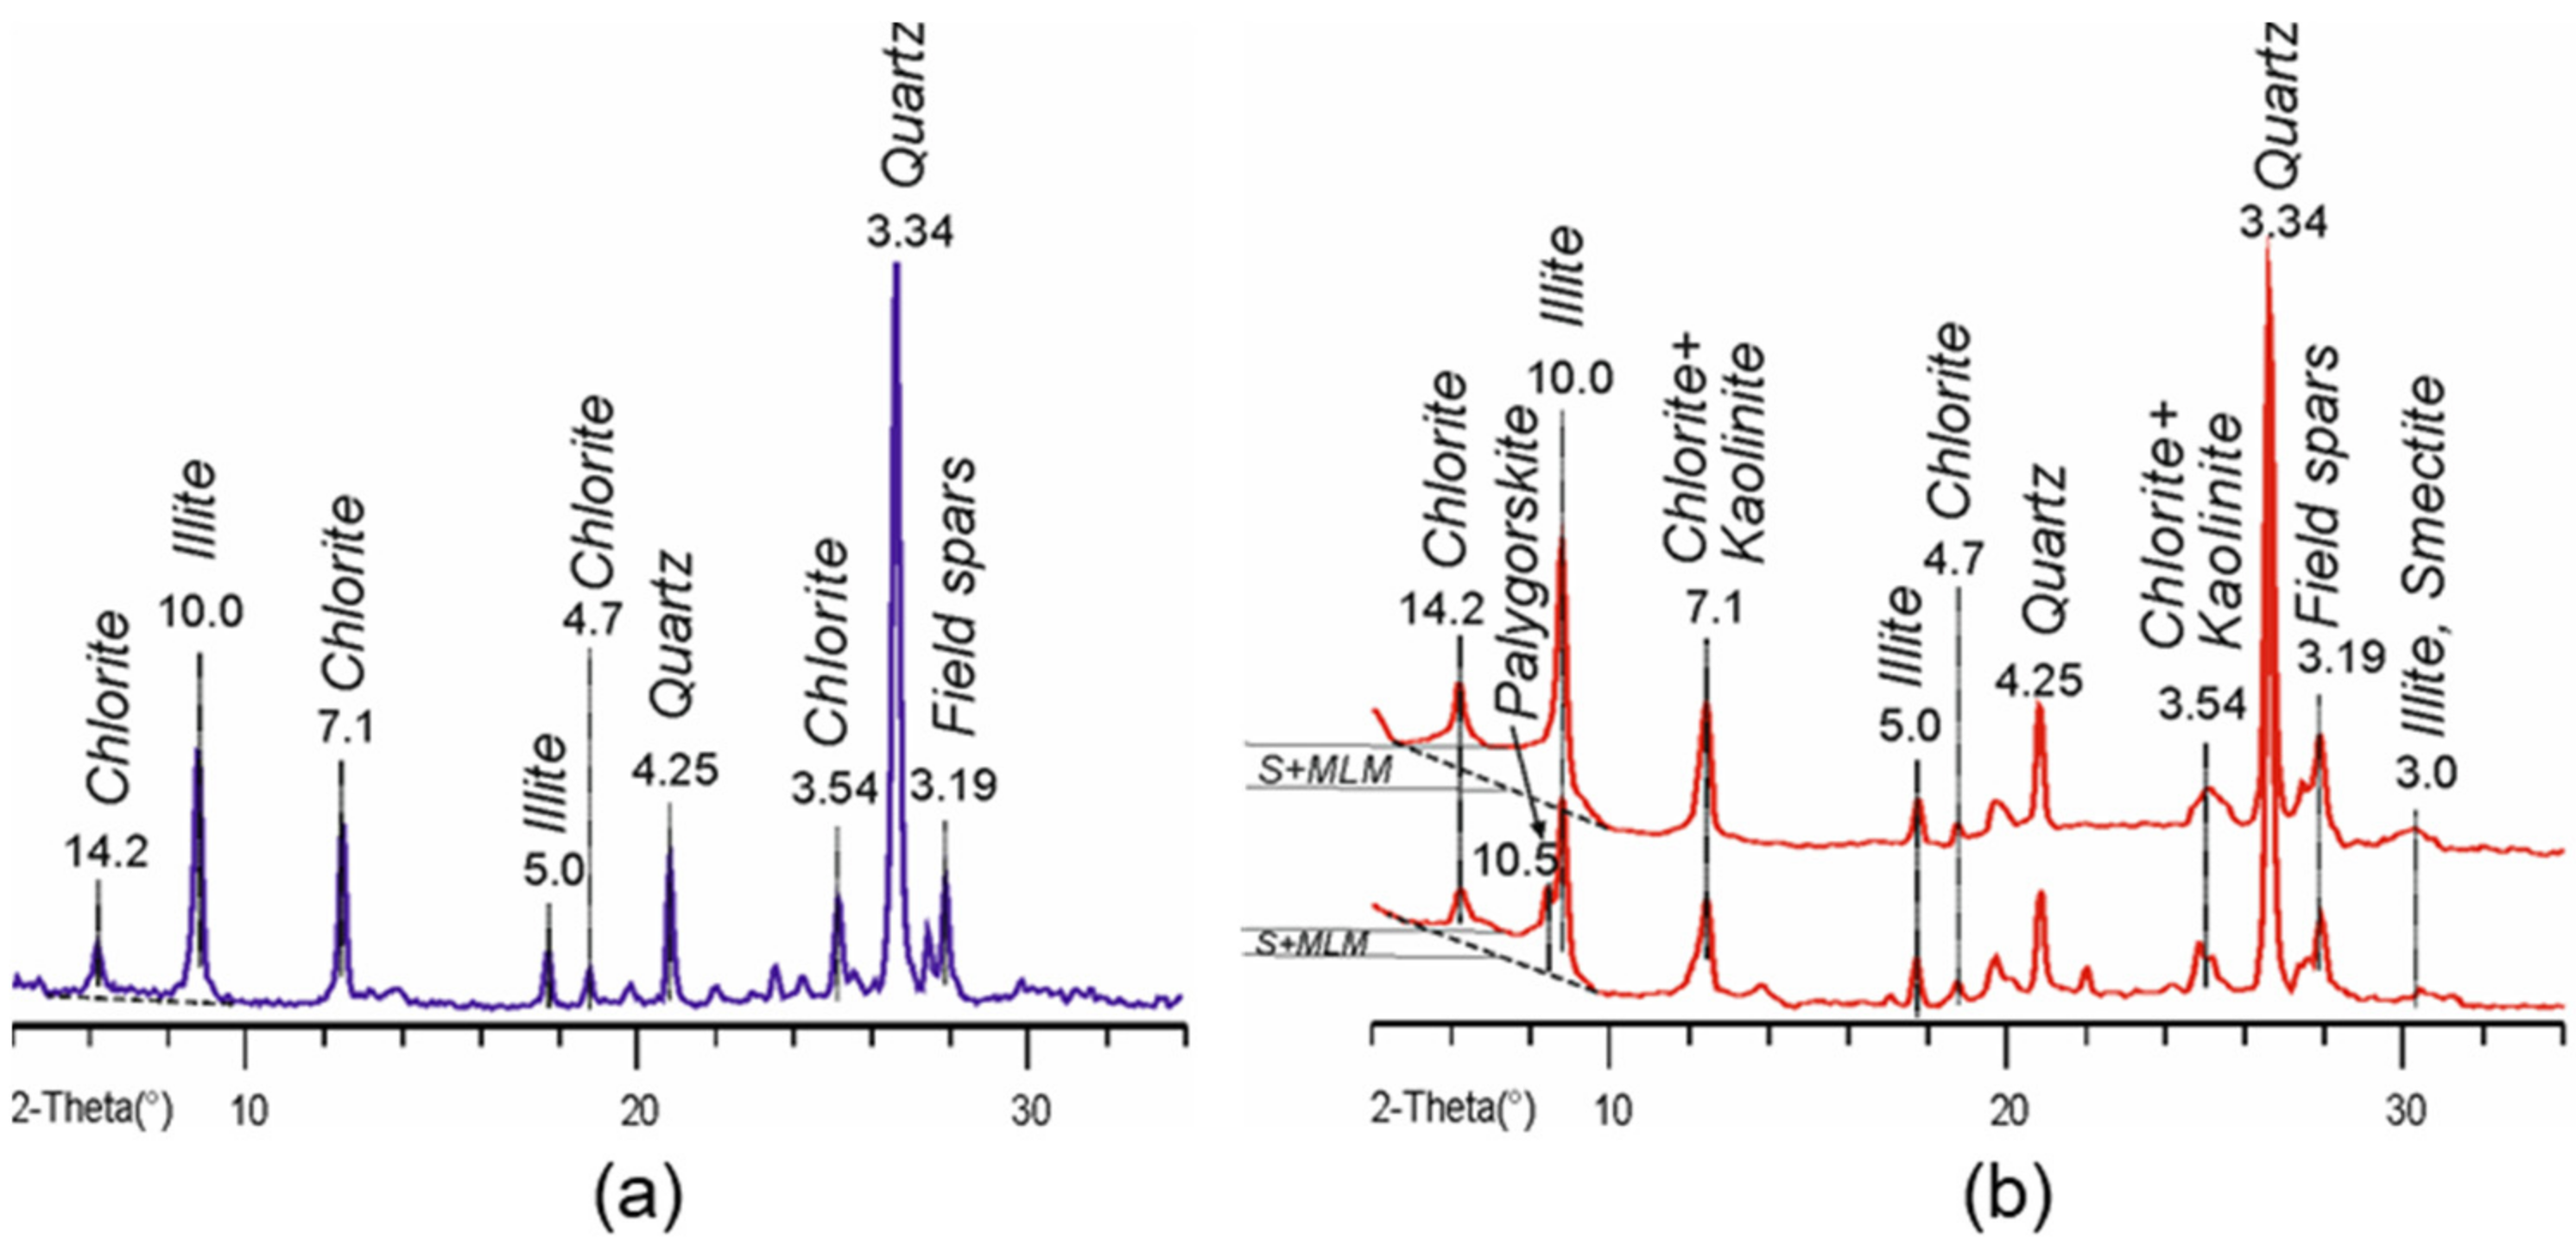
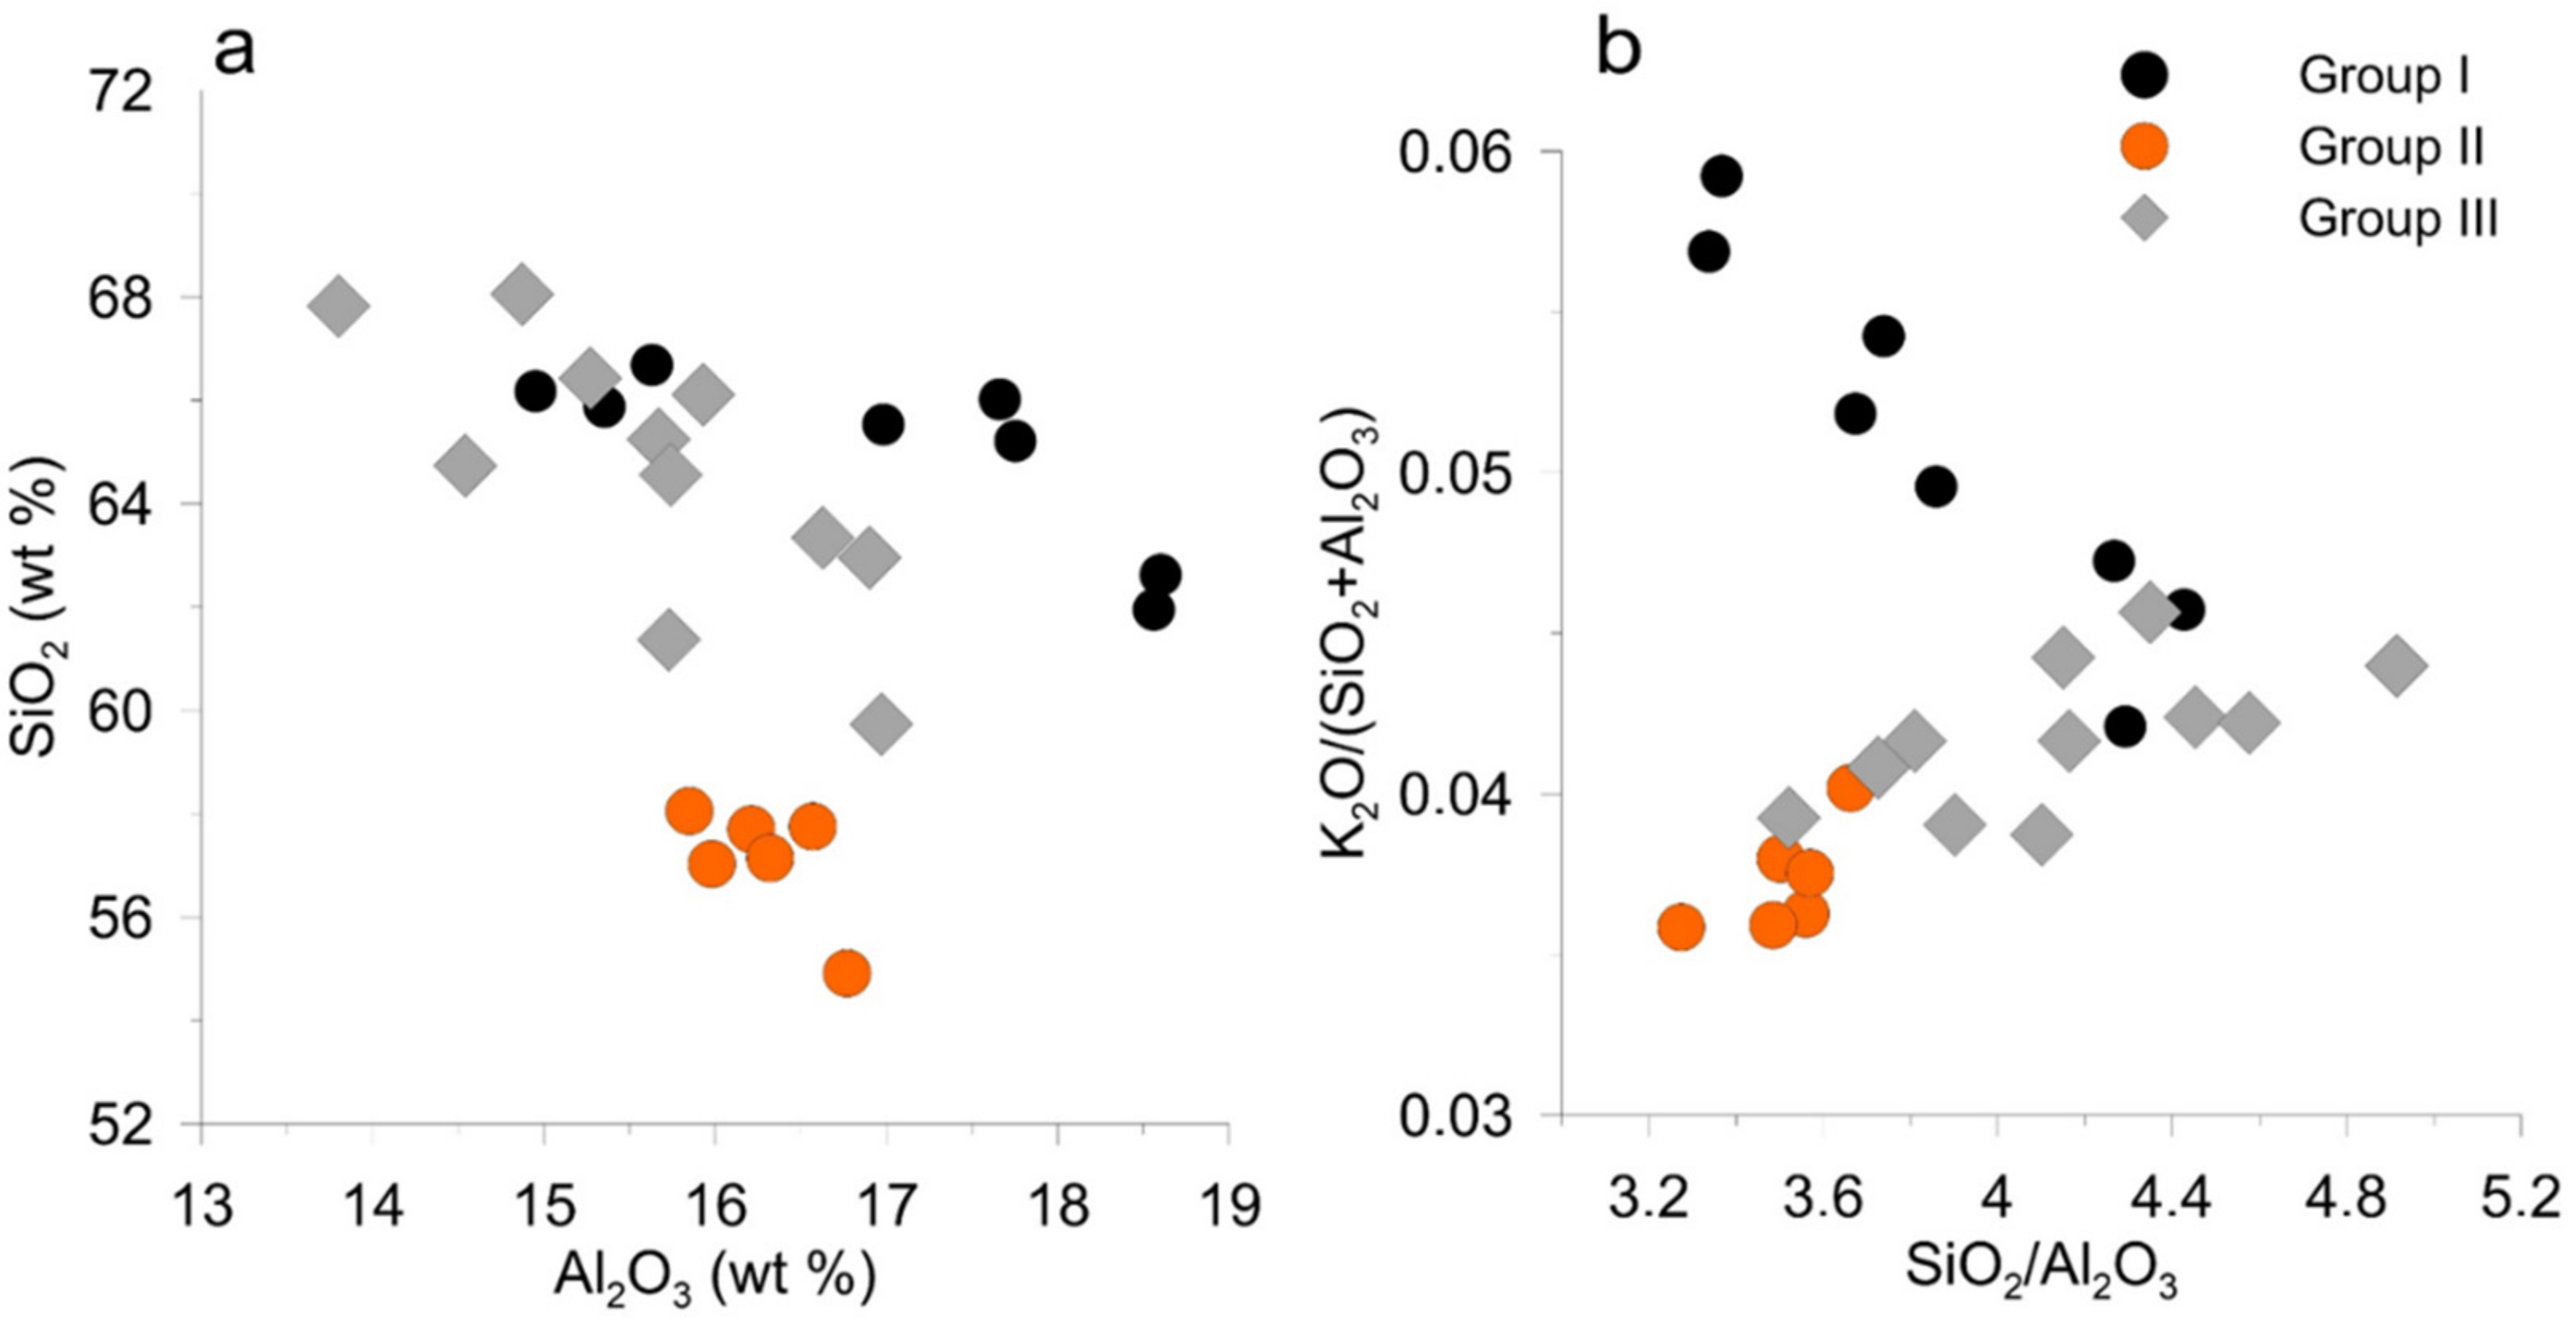
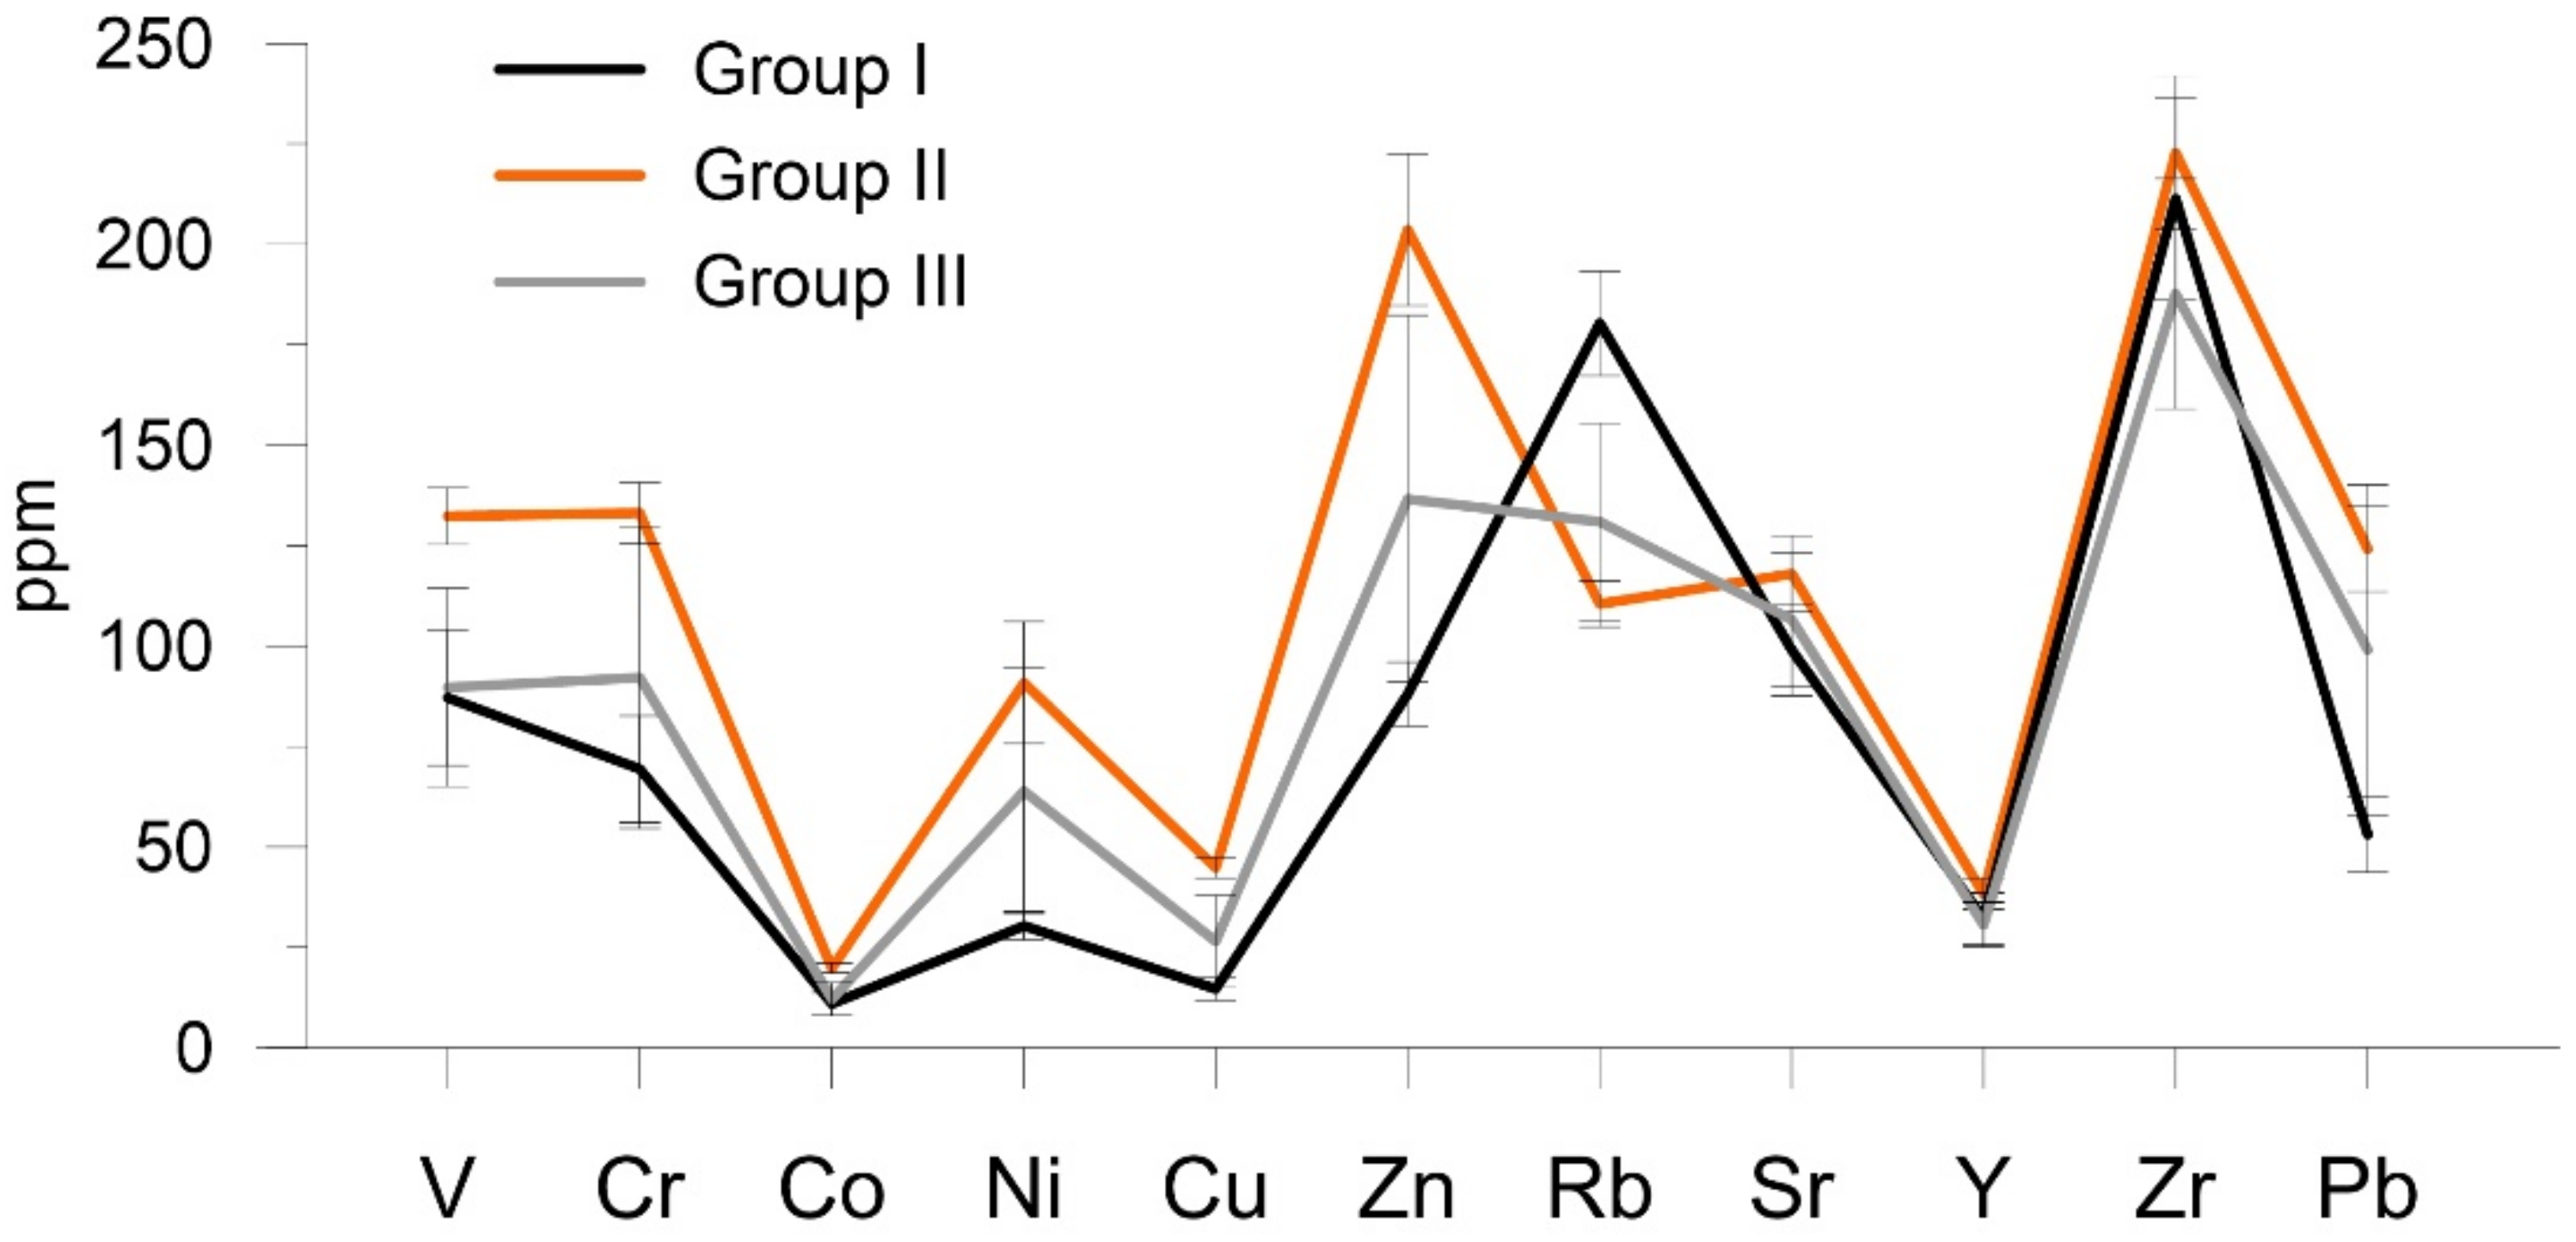
3.3. Mineralogy and Geochemistry

All collected samples had similar mineralogy, but ratios between the abundances of different minerals varied. In the collected samples, clay minerals included illite, smectite, mixed-layer minerals of the illite–smectite, kaolinite and palygorskite series. The non-clay minerals include quartz, feldspars (mainly albite and microcline), and amphiboles.
Three groups were clearly distinguished according to the X-ray diffraction patterns of clay to non-clay minerals. The first group of samples was characterized by a significant predominance of non-clay minerals with a high content of quartz and feldspars. Among its clay minerals, illites (micas) and chlorites prevailed, while smectites, kaolinite and other clay minerals were sparse. The mean size of quartz crystallites was 85.6 nm and the mean thickness of illite particles was 61.3 nm. The typical X-ray diffraction patterns of the group of samples in which clay minerals were sparse are shown in Figure 6a. These samples, collected from the exposed ice surface and attributed primarily to Clusters 1 and 3, were most likely derived from the local moraine material and rock outcrops.
The second group was characterized by a higher proportion of clay minerals. Smectites and mixed-layer clay minerals were widely represented, as well as kaolinite and palygorskite. The mean size of quartz crystallites was smaller (61.8 nm) as well as the mean thickness of illite particles (31.4 nm). Its typical X-ray diffraction patterns are shown in Figure 6b. Importantly, palygorskite is found in sediments and soils in arid regions and is, therefore, considered as a tracer of aeolian dust [42,43]. All samples with a high proportion of clay minerals, including palygorskite, were collected from the snow surfaces and attributed to Cluster 2.
The third group of samples was characterized by a mixed mineral assemblage. The content of clay and non-clay minerals varied within narrow limits and did not reach the values characteristic of the first and second groups. This group of samples was associated with Clusters 1 and 3.
The geochemical composition of the insoluble materials was consistent with the mineralogy of the samples (Table 2). All samples were characterized by the high proportions of SiO2 (54.9–68.0%) and Al2O3 (13.8–18.6%), followed by Fe2O3 (3.9–8.6%), K2O (2.6–4.8%) and MgO (1.4–3.8%). The concentrations of Na2O, P2O5, CaO, TiO2 and MnO were generally low and did not exceed 2.9%.
Ratios between SiO2 and Al2O3 showed that samples containing a larger proportion of clay minerals also formed a distinct group with the lower ratio values (Figure 7a). Potassium is associated with mica, illites and the mixed layered illite–smectite clay minerals with K-field spars and, therefore, cannot be used as a single tracer of desert dust. However, K2O/SiO2 + Al2O3 versus SiO2/Al2O3 ratios allow us to distinguish three groups of samples consistent with the identified mineralogical groups (Figure 6b). Samples with a predominance of non-clay minerals also contained more K2O in comparison with samples containing larger proportion of clay minerals. At the same time, their K2O/SiO2 + Al2O3 versus SiO2/Al2O3 ratios were higher because of the higher content of mica and quartz and lower amount of clay minerals in the locally-derived materials.
With regard to concentrations of trace elements, the main differences between samples with abundance of clay minerals and samples with supra-glacial material of non-clay and mixed mineralogy were in the significantly higher concentrations of V, Cr and Zn and lower concentrations of Rb in the former (Table 1, Figure 8).

4. Discussion

A number of studies have shown that LAI deposited on the surface of snow and ice significantly reduce glacier albedo, accelerating glacier melt [8,20,22,44]. However, the relationships between spectral reflectance and the amount and composition of the supra-glacial materials in different geographical regions are understood less well.
While it is difficult to discriminate between desert dust and other LAI using broadband albedo, the use of spectral albedo measurements enables this distinction through the links between the visible near-infrared (VIS-NIR) reflectance gradient and the presence of mineral dust in samples. The spectral signatures of snow and ice show high reflectance in the visible range and strong absorption in the NIR wavelengths. The presence of mineral dust on the glacier surface decreases spectral albedo in the visible wavelengths from approximately 0.95 to as low as 0.30 and shifts the maximum reflectance towards NIR [14,36]. Therefore, negative values of the VIS-NIR gradient are used as an indicator of the presence of mineral dust on snow and the glacier surface in both in situ and satellite measurement [36,45,46]. The VIS-NIR gradients for Clusters 2 and 4 are characterised by negative values between −0.02 µm and −0.1 µm, and these values are consistent with those reported by [46]. Reflectance at 0.47 µm varied between 0.43–0.77 for clean snow samples in cluster 1 (Figure 2a; Table 1), which is consistent with reports from other in situ spectral measurements (e.g., [12,47]). The cluster-averaged reflectance values were significantly higher in both VIS and NIR in comparison with other clusters (Table 1). The reflectance spectrum in Cluster 4 has several characteristic absorption features in the visible wavelengths associated with absorption by algal chlorophyll and carotenoids within the 0.37–0.68 μm range and algal chlorophyll at approximately 0.68 μm [24,41]. In the Cluster 4 spectra, the 0.37–0.68 μm absorption features were not expressed well, most likely because they were obscured by the presence of other LAI (Figure 3).
The abundance of impurities in the ablation zone of the Djankuat Glacier (36 ± 38 g m−2) is higher than values reported for Canadian Arctic, Greenland, Alaskan and Siberian glaciers, but 4–10 times lower than for Asian glaciers in the Altay, Himalayas and the Tien Shan ([48] and references therein). There is less windblown material available in the central Caucasus in comparison with the semi-arid and arid regions of High Mountain Asia. The estimates of dust flux, previously obtained from the analyses of ice cores, showed that, on average, dust deposition in the accumulation zones of glaciers located on Mount Kazbek (4500 m a.s.l.) and Mount Elbrus (5115 m a.s.l.) were 13 g m2 a−1 and 2.5 g m2 a−1, respectively [49]. The desert dust deposition events make a significant contribution to the total dust flux at these sites [16]. Surface concentrations measured on the Djankuat Glacier located at lower elevations, were much higher due to the additional input from local sources such as rock outcrops, moraines and exposed soils.
There was a statistically significant negative correlation between the amount of mineral and organic matter on the glacier surface and spectrally-integrated albedo. The highest correlation was found for concentrations of organic matter, which suggests that organic matter decreases snow albedo more efficiently, in line with previous studies [22].
Two important features were noted in the mineral composition of the supra-glacial material: the presence and content of clay minerals, and the size of mineral crystallites (for non-clay minerals, the average particle size; for clay minerals, particle thickness). Taken together, these characteristics serve as indicators of mineral dust provenance. A significant increase in the proportion of clay minerals indicates the predominant effect of aeolian transfer of aerosol, which is also confirmed by a decrease in the size of crystallites of all minerals (both clay and non-clay). The small size and shape of clay particles allow their transport over long distances from source regions. Smectites and illite–smectites are common soil minerals in different climatic zones and are sampled under wide humidity and temperature conditions. Palygorskite, found in individual samples collected from the snow surface at the Djankuat Glacier, presently forms in arid and semi-arid zones, for example, in saline soils or lagoon sediments. In the geological past, this mineral also had a very limited occurrence and, as a result, rarely gets into modern sediments due to the weathering of ancient rocks. The discovery of palygorskite in the samples of mineral dust (Group II) collected on Djankuat points at its desert origin and aeolian transport, which was also noted by other researchers [43]. Group I, with the predominance of non-clay minerals quartz and feldspars, can be attributed to local sources (moraines, rock outcrops), and group III represents a mixed origin of debris.
Geochemical analysis supported the classification of LAI depending on the main source (aeolian, local, mixed). Aeolian dust dominated in the samples attributed to Clusters 2 and 4, while the local and mixed materials were found in Clusters 1 and 3.
In the samples attributed to Cluster 2, concentrations of V, Cr and Zn were significantly higher than in the samples associated with other clusters, while concentrations of Rb were lower. Rb is geochemically associated with K due to the co-occurrence in K-feldspars and micas, which is consistent with the different mineralogy of the local and desert dust samples. The enrichment of aeolian samples in Zn and Cr is consistent with the fact that desert dust serves as a vector for the transportation of anthropogenic pollutants. High atmospheric concentrations of V are associated with the combustion of fossil fuels, particularly oil [50], and the observed enrichment of aeolian samples in V was consistent with its origin in or passage over the oil-producing regions of the Middle East.
The importance of dust deposition dust events in shortening snow cover duration in the Caucasus was highlighted recently. A strong dust deposition event in 2018 shortened the snow cover duration by 12 to 30 days which equalled the effect of an extra average daily radiative forcing of 35 W m−2 [51]. It was also found that the impact of dust was stronger when the snowpack was melting later because solar irradiance increased with day length. Our results suggest that the effect of spring dust deposition events persist till the end of the ablation season on glaciers in the Caucasus, affecting glacier melt and mass balance. This is particularly important since the frequency and intensity of dust deposition events on the Caucasus glaciers has increased in recent decades, which has led to a rise in dust flux by the factor of four in comparison with the beginning of the 20th century [52] and might have been an additional factor in the deglaciation in this region.

5. Conclusions

Variability in the spectral reflectance of LAI deposited on the glacier surface was investigated in the ablation zone of the Djankuat Glacier. All spectra were divided into four clusters depending on their shape and, primarily, in accordance with the VIS-NIR gradient. The reflectance values at 0.47 µm varied between 0.43 and 0.77 for clean aged snow/firn and ice, between 0.1 and 0.35 for snow and ice on which aeolian dust and organic matter were present, and between 0.07 and 0.51 for bare ice surfaces with high mineral content.
Obtained results show that spectrally-integrated albedo depends on the amount of inorganic and organic LAI on the snow, firn and ice surfaces logarithmically with a stronger association with organic matter. The abundance of impurities in the ablation zone of the Djankuat Glacier was higher than in Canadian Arctic, Greenland, Alaskan and Siberian glaciers but 4–10 times lower than on Asian glaciers.
The ratio between clay and non-clay minerals was a good indicator of dust origin. An increase in the proportion of clay minerals such as smectites and mixed-layer clay minerals, as well as kaolinite and palygorskite, indicated a remote desert origin and aeolian transportation of the mineral particles. The geochemical composition of insoluble materials, and especially the presence of Cr, Zn and V, also pointed to aeolian transport in agreement with the mineralogical analysis.
The study highlighted the importance of supra-glacial material in changing the surface reflectance of snow and glaciers. There is a need for further investigation of the links between the deposition of LAI, snow melt and glacier recession of both inorganic and organic origin in the Caucasus Mountains.

Supplementary Materials

The following are available online at https://www.mdpi.com/article/10.3390/w13212993/s1, Table S1. Study sites.

Author Contributions

S.K. and M.S. developed the concept of the paper, carried out the fieldwork and analysis of the collected spectra, and wrote the original draft of the paper. V.K. and S.G. conducted most of the mineralogical and geochemical analyses. All authors have read and agreed to the published version of the manuscript.

Funding

The fieldwork was funded by the EU FP7 project Dust Impacts on Glaciated Environments (DIOGENES; grant number 275071) based at the University of Reading, UK. The reanalysis of the data and completion of the paper were supported by the Russian Science Foundation (Project 20-17-00212) and the UK Royal Society International Exchanges Cost Share grant IEC\R2\202193 (analytical data gathering). S.K. work was supported by the State Assignment of the Institute of Geography, RAS (0148-2019-0004). V.K. work was supported by the theme of the State Assignment of IGEM RAS (121041500220-0).

Institutional Review Board Statement

Not applicable.

Informed Consent Statement

Not applicable.

Data Availability Statement

The data presented in this study are available on request from the corresponding author.

Acknowledgments

We thank V.V. Popovnin and students of the Lomonosov’s MSU for their help during field work at the Djankuat Glacier.

Conflicts of Interest

The authors declare no conflict of interest. The funders had no role in the design of the study; in the collection, analyses, or interpretation of data; in the writing of the manuscript, or in the decision to publish the results.

References

  1. Huss, M.; Bookhagen, B.; Huggel, C.; Jacobsen, D.; Bradley, R.S.; Clague, J.J.; Vuille, M.; Buytaert, W.; Cayan, D.R.; Greenwood, G.; et al. Toward mountains without permanent snow and ice. Earth Future 2017, 5, 418–435. [Google Scholar] [CrossRef]
  2. Huss, M.; Hock, R. Global-scale hydrological response to future glacier mass loss. Nat. Clim. Chang. 2018, 8, 135–140. [Google Scholar] [CrossRef] [Green Version]
  3. Hock, R.; Bliss, A.; Marzeion, B.; Giesen, R.H.; Hirabayashi, Y.; Huss, M.; Radić, V.; Slangen, A.B.A. GlacierMIP—A model intercomparison of global-scale glacier mass-balance models and projections. J. Glaciol. 2019, 65, 453–467. [Google Scholar] [CrossRef] [Green Version]
  4. Wiscombe, J.W.; Warren, S.G. A Model for the Spectral Albedo of Snow. II: Snow Containing Atmospheric Aerosols. J. Atmos. Sci. 1980, 37, 2734–2745. [Google Scholar] [CrossRef] [Green Version]
  5. Klok, E.J.; Greuell, W.; Oerlemans, J. Temporal and spatial variation of the surface albedo of Morteratschgletscher, Switzerland, as derived from 12 Landsat images. J. Glaciol. 2003, 49, 491–502. [Google Scholar] [CrossRef] [Green Version]
  6. Naegeli, K.; Huss, M.; Hoelzle, M. Change detection of bare-ice albedo in the Swiss Alps. Cryosphere 2019, 13, 397–412. [Google Scholar] [CrossRef] [Green Version]
  7. Naegeli, K.; Damm, A.; Huss, M.; Wulf, H.; Schaepman, M.; Hoelzle, M. Cross-Comparison of Albedo Products for Glacier Surfaces Derived from Airborne and Satellite (Sentinel-2 and Landsat 8) Optical Data. Remote Sens. 2017, 9, 110. [Google Scholar] [CrossRef] [Green Version]
  8. Di Mauro, B.; Baccolo, G.; Garzonio, R.; Giardino, C.; Massabò, D.; Piazzalunga, A.; Rossini, M.; Colombo, R. Impact of impurities and cryoconite on the optical properties of the Morteratsch Glacier (Swiss Alps). Cryosphere 2017, 11, 2393–2409. [Google Scholar] [CrossRef] [Green Version]
  9. Takeuchi, N. Temporal and spatial variations in spectral reflectance and characteristics of surface dust on Gulkana Glacier, Alaska Range. J. Glaciol. 2009, 55, 701–709. [Google Scholar] [CrossRef] [Green Version]
  10. Hadley, O.L.; Kirchstetter, T.W. Black-carbon reduction of snow albedo. Nat. Clim. Chang. 2012, 2, 437–440. [Google Scholar] [CrossRef]
  11. Bond, T.; Doherty, S.; Fahey, D.; Forster, P.; Berntsen, T.; DeAngelo, B.J.; Flanner, M.; Ghan, S.; Kaercher, B.; Koch, D.; et al. Bounding the role of black carbon in the climate system: A scientific assessment. J. Geophys. Res. Atmos. 2013, 118, 5380–5552. [Google Scholar] [CrossRef]
  12. Painter, T.H.; Barrett, A.P.; Landry, C.C.; Neff, J.; Cassidy, M.P.; Lawrence, C.; McBride, K.E.; Farmer, G.L. Impact of disturbed desert soils on duration of mountain snow cover. Geophys. Res. Lett. 2007, 34, L12502. [Google Scholar] [CrossRef] [Green Version]
  13. Di Mauro, B.; Fava, F.; Ferrero, L.; Garzonio, R.; Baccolo, G.; Delmonte, B.; Colombo, R. Mineral dust impact on snow radiative properties in the European Alps combining ground, UAV, and satellite observations. J. Geophys. Res. 2015, 120, 6080–6097. [Google Scholar] [CrossRef]
  14. Painter, T.H.; Skiles, S.M.K.; Deems, J.S.; Bryant, A.C.; Landry, C.C. Dust radiative forcing in snow of the Upper Colorado River Basin: 1. A 6 year record of energy balance, radiation, and dust concentrations. Water Resour. Res. 2012, 48, W07521. [Google Scholar] [CrossRef] [Green Version]
  15. Sodemann, H.; Palmer, A.S.; Schwierz, C.; Schwikowski, M.; Wernli, H. The transport history of two Saharan dust events archived in an Alpine ice core. Atmos. Chem. Phys. Discuss. 2006, 6, 667–688. [Google Scholar] [CrossRef] [Green Version]
  16. Kutuzov, S.; Shahgedanova, M.; Mikhalenko, V.; Ginot, P.; Lavrentiev, I.; Kemp, S. High-resolution provenance of desert dust deposited on Mt. Elbrus, Caucasus in 2009–2012 using snow pit and firn core records. Cryosphere 2013, 7, 1481–1498. [Google Scholar] [CrossRef] [Green Version]
  17. IPCC. Climate Change 2021: The Physical Science Basis. Contribution of Working Group I to the Sixth Assessment Report of the Intergovernmental Panel on Climate Change; Masson-Delmotte, V., Zhai, P., Priani, A., Connors, S.L., Pean, C., Berger, S., Caud, N., Chen, Y., Goldfarb, L., Gomis, M.I., et al., Eds.; Cambridge University Press: Cambridge, UK, 2021. [Google Scholar]
  18. Li, Y.; Kang, S.; Chen, J.; Hu, Z.; Wang, K.; Paudyal, R.; Liu, J.; Wang, X.; Qin, X.; Sillanpää, M. Black carbon in a glacier and snow cover on the northeastern Tibetan Plateau: Concentrations, radiative forcing and potential source from local topsoil. Sci. Total Environ. 2019, 686, 1030–1038. [Google Scholar] [CrossRef]
  19. Dumont, M.; Brun, E.; Picard, G.; Michou, M.; Libois, Q.; Petit, J.-R.; Geyer, M.; Morin, S.; Josse, B. Contribution of light-absorbing impurities in snow to Greenland’s darkening since 2009. Nat. Geosci. 2014, 7, 509–512. [Google Scholar] [CrossRef]
  20. Hartl, L.; Felbauer, L.; Schwaizer, G.; Fischer, A. Small-scale spatial variability in bare-ice reflectance at Jamtalferner, Austria. Cryosphere 2020, 14, 4063–4081. [Google Scholar] [CrossRef]
  21. Azzoni, R.S.; Senese, A.; Zerboni, A.; Maugeri, M.; Smiraglia, C.; Diolaiuti, G.A. Estimating ice albedo from fine debris cover quantified by a semi-automatic method: The case study of Forni Glacier, Italian Alps. Cryosphere 2016, 10, 665–679. [Google Scholar] [CrossRef] [Green Version]
  22. Yue, X.; Li, Z.; Zhao, J.; Fan, J.; Takeuchi, N.; Wang, L. Variation in Albedo and Its Relationship with Surface Dust at Urumqi Glacier No. 1 in Tien Shan, China. Front. Earth Sci. 2020, 8, 110. [Google Scholar] [CrossRef]
  23. Di Mauro, B.; Garzonio, R.; Rossini, M.; Filippa, G.; Pogliotti, P.; Galvagno, M.; Morra di Cella, U.; Migliavacca, M.; Baccolo, G.; Clemenza, M.; et al. Saharan dust events in the European Alps: Role in snowmelt and geochemical characterization. Cryosphere 2019, 13, 1147–1165. [Google Scholar] [CrossRef] [Green Version]
  24. Stibal, M.; Box, J.E.; Cameron, K.A.; Langen, P.L.; Yallop, M.L.; Mottram, R.H.; Khan, A.L.; Molotch, N.P.; Chrismas, N.A.M.; Quaglia, F.C.; et al. Algae Drive Enhanced Darkening of Bare Ice on the Greenland Ice Sheet. Geophys. Res. Lett. 2017, 44, 11,463–11,471. [Google Scholar] [CrossRef]
  25. Khan, A.L.; Dierssen, H.M.; Scambos, T.A.; Höfer, J.; Cordero, R.R. Spectral characterization, radiative forcing and pigment content of coastal Antarctic snow algae: Approaches to spectrally discriminate red and green communities and their impact on snowmelt. Cryosphere 2021, 15, 133–148. [Google Scholar] [CrossRef]
  26. Casey, K.A.; Kääb, A.; Benn, D.I. Geochemical characterization of supraglacial debris via in situ and optical remote sensing methods: A case study in Khumbu Himalaya, Nepal. Cryosphere 2012, 6, 85–100. [Google Scholar] [CrossRef] [Green Version]
  27. Shahgedanova, M.; Kutuzov, S.; White, K.H.; Nosenko, G. Using the significant dust deposition event on the glaciers of Mt. Elbrus, Caucasus Mountains, Russia on 5 May 2009 to develop a method for dating and “provenancing” of desert dust events recorded in snow pack. Atmos. Chem. Phys. 2013, 13, 1797–1808. [Google Scholar] [CrossRef] [Green Version]
  28. Kutuzov, S.; Lavrentiev, I.; Smirnov, A.; Nosenko, G.; Petrakov, D. Volume Changes of Elbrus Glaciers From 1997 to 2017. Front. Earth Sci. 2019, 7, 153. [Google Scholar] [CrossRef] [Green Version]
  29. Zemp, M.; Huss, M.; Thibert, E.; Eckert, N.; McNabb, R.; Huber, J.; Barandun, M.; Machguth, H.; Nussbaumer, S.U.; Gärtner-Roer, I.; et al. Global glacier mass changes and their contributions to sea-level rise from 1961 to 2016. Nature 2019, 568, 382–386. [Google Scholar] [CrossRef]
  30. Shahgedanova, M.; Nosenko, G.; Kutuzov, S.; Rototaeva, O.; Khromova, T. Deglaciation of the Caucasus Mountains, Russia/Georgia, in the 21st century observed with ASTER satellite imagery and aerial photography. Cryosphere 2014, 8, 2367–2379. [Google Scholar] [CrossRef] [Green Version]
  31. Rets, E.P.; Popovnin, V.V.; Toropov, P.A.; Smirnov, A.M.; Tokarev, I.V.; Chizhova, J.N.; Budantseva, N.A.; Vasil’chuk, Y.K.; Kireeva, M.B.; Ekaykin, A.A.; et al. Djankuat glacier station in the North Caucasus, Russia: A database of glaciological, hydrological, and meteorological observations and stable isotope sampling results during 2007–2017. Earth Syst. Sci. Data 2019, 11, 1463–1481. [Google Scholar] [CrossRef] [Green Version]
  32. Rezepkin, A.A.; Popovnin, V.V. Influence of the surface moraine on the state of Djankuat Glacier (Central Caucasus) by 2025. Ice Snow 2018, 58, 307–321. [Google Scholar] [CrossRef]
  33. Toropov, P.A.; Aleshina, M.A.; Grachev, A.M. Large-scale climatic factors driving glacier recession in the Greater Caucasus, 20th–21st century. Int. J. Climatol. 2019, 39, 4703–4720. [Google Scholar] [CrossRef]
  34. Shahgedanova, M.; Hagg, W.; Hassell, D.; Stokes, C.; Popovnin, V. Climate Change, Glacier Retreat, and Water Availability in the Caucasus Region. In Threats to Global Water Security; Jones, A.A., Vardanian, T.G., Hakopian, C., Eds.; Springer: Dordrecht, The Netherlands, 2009; pp. 131–143. [Google Scholar]
  35. World Glacier Monitoring Service. Available online: https://wgms.ch/ (accessed on 12 August 2021).
  36. Skiles, S.M.; Painter, T.; Okin, G.S. A method to retrieve the spectral complex refractive index and single scattering optical properties of dust deposited in mountain snow. J. Glaciol. 2017, 63, 133–147. [Google Scholar] [CrossRef] [Green Version]
  37. Moore, D.M.; Reynolds, R.C., Jr. X-ray Diffraction and the Identification and Analysis of Clay Minerals; Oxford University Press: Oxford, UK; New York, NY, USA, 1999. [Google Scholar]
  38. Post, J.E.; Bish, D.L. Rietveld refinement of crystal structures using powder X-ray diffraction data. In Modern Powder Diffraction; Mineralogical Society of America Reviews in Mineralogy: Washington, DC, USA; Volume 20, pp. 277–308.
  39. Doebelin, N.; Kleeberg, R. Profex: A graphical user interface for the Rietveld refinement programBGMN. J. Appl. Crystallogr. 2015, 48, 1573–1580. [Google Scholar] [CrossRef] [PubMed] [Green Version]
  40. Govindaraju, K. 1989 Compilation of working values and sample description for 272 geostandards. Geostand. Geoanalytical Res. 1989, 13, 1–113. [Google Scholar] [CrossRef]
  41. Painter, T.H.; Duval, B.; Thomas, W.H.; Mendez, M.; Heintzelman, S.; Dozier, J. Detection and Quantification of Snow Algae with an Airborne Imaging Spectrometer. Appl. Environ. Microbiol. 2001, 67, 5267–5272. [Google Scholar] [CrossRef] [Green Version]
  42. Pey, J.; Revuelto, J.; Moreno, N.; Alonso-González, E.; Bartolomé, M.; Reyes, J.; Gascoin, S.; López-Moreno, J.I. Snow impurities in the central Pyrenees: From their geochemical and mineralogical composition towards their impacts on snow Albedo. Atmosphere 2020, 11, 937. [Google Scholar] [CrossRef]
  43. Thevenon, F.; Chiaradia, M.; Adatte, T.; Hueglin, C.; Poté, J. Characterization of Modern and Fossil Mineral Dust Transported to High Altitude in the Western Alps: Saharan Sources and Transport Patterns. Adv. Meteorol. 2012, 2012, 674385. [Google Scholar] [CrossRef] [Green Version]
  44. Gabbi, J.; Huss, M.; Bauder, A.; Cao, F.; Schwikowski, M. The impact of Saharan dust and black carbon on albedo and long-term mass balance of an Alpine glacier. Cryosphere 2015, 9, 1385–1400. [Google Scholar] [CrossRef] [Green Version]
  45. Painter, T.H.; Bryant, A.C.; Skiles, S.M. Radiative forcing by light absorbing impurities in snow from MODIS surface reflectance data. Geophys. Res. Lett. 2012, 39, L17502. [Google Scholar] [CrossRef]
  46. Gautam, R.; Hsu, N.C.; Lau, W.K.-M.; Yasunari, T.J. Satellite observations of desert dust-induced Himalayan snow darkening. Geophys. Res. Lett. 2013, 40, 988–993. [Google Scholar] [CrossRef] [Green Version]
  47. Ganey, G.Q.; Loso, M.G.; Burgess, A.B.; Dial, R.J. The role of microbes in snowmelt and radiative forcing on an Alaskan icefield. Nat. Geosci. 2017, 10, 754–759. [Google Scholar] [CrossRef] [Green Version]
  48. Takeuchi, N.; Nagatsuka, N.; Uetake, J.; Shimada, R. Spatial variations in impurities (cryoconite) on glaciers in northwest Greenland. Bull. Glaciol. Res. 2014, 32, 85–94. [Google Scholar] [CrossRef] [Green Version]
  49. Kutuzov, S.S.; Mikhalenko, V.N.; Grachev, A.M.; Ginot, P.; Lavrentiev, I.I.; Kozachek, A.V.; Krupskaya, V.V.; Ekaykin, A.A.; Tielidze, L.G.; Toropov, P.A. First geophysical and shallow ice core investigation of the Kazbek plateau glacier, Caucasus Mountains. Environ. Earth Sci. 2016, 75, 1488. [Google Scholar] [CrossRef]
  50. Schlesinger, W.H.; Klein, E.M.; Vengosh, A. Global biogeochemical cycle of vanadium. Proc. Natl. Acad. Sci. USA 2017, 114, E11092–E11100. [Google Scholar] [CrossRef] [Green Version]
  51. Dumont, M.; Tuzet, F.; Gascoin, S.; Picard, G.; Kutuzov, S.; Lafaysse, M.; Cluzet, B.; Nheili, R.; Painter, T.H. Accelerated Snow Melt in the Russian Caucasus Mountains After the Saharan Dust Outbreak in March 2018. J. Geophys. Res. Earth Surf. 2020, 125, e2020JF005641. [Google Scholar] [CrossRef]
  52. Kutuzov, S.; Legrand, M.; Preunkert, S.; Ginot, P.; Mikhalenko, V. The Elbrus (Caucasus, Russia) ice core record—Part 2: History of desert dust deposition. Atmos. Chem. Phys. 2019, 19, 14133–14148. [Google Scholar] [CrossRef] [Green Version]
Figure 1. (a) Location of the Djankuat Glacier; (b) location of the measurement plots (Spot 6 image from 11 August 2013 is used as a background; glacier boundaries are shown in red); (c) general view of the glacier from plot 3 (c); spectral reflectance measurements at plot 4 (d). Note presence of dust (brown colour) on the snow surface on both, the satellite image and the terrestrial photographs.
Water 13 02993 g001
Figure 2. Spectral reflectance (individual spectra are shown as grey lines and cluster-averaged spectra as bold colour lines) (a). Photographs of the typical sampling plots (b). Vertical lines show 470 nm and 860 nm used for VIS-NIR gradient calculations.
Water 13 02993 g002
Figure 3. Mean spectrum of the Cluster 4 measurements displaying the main absorption features associated with algal chlorophyll and carotenoids (400–680 nm) and chlorophyll (678 nm).
Water 13 02993 g003
Figure 4. The VIS-NIR gradient values expressed as absolute difference between reflectance at 470 nm and 860 nm for four clusters. Dots and bars show cluster means and standard deviations, respectively.
Water 13 02993 g004
Figure 5. Relationship between spectrally-integrated albedo (300–1050 nm) and the amount of mineral (a) and organic (b) matter.
Water 13 02993 g005
Figure 6. X-ray diffraction patterns of samples with the predominance of non-clay minerals (a) and with abundance of clay minerals (b).
Water 13 02993 g006
Figure 7. (a) SiO2 vs. Al2O3 and (b) K2O/SiO2 + Al2O3 vs. SiO2/Al2O3 ratios in the analysed samples attributed to three groups by mineral composition.
Water 13 02993 g007
Figure 8. Concentrations of trace elements measured in the collected samples using XRF. The samples are attributed to three groups by mineralogy.
Water 13 02993 g008
Table 1. Results of cluster analysis of the reflectance spectra. Cluster mean values ± standard deviation are shown unless indicated otherwise.
ParametersCluster 1Cluster 2Cluster 3Cluster 4
Number of samples713262
Spectrally-integrated albedo0.49 ± 0.080.26 ± 0.080.25 ± 0.130.23 ± 0.02
Reflectance at 0.47 µm0.57 ± 0.110.23 ± 0.070.26 ± 0.130.18 ± 0.01
Range at 0.47 µm0.43−0.770.09−0.350.07−0.520.17−0.19
Reflectance at 0.86 µm0.43 ± 0.070.28 ± 0.090.23 ± 0.120.26 ± 0.02
Range at 0.86 µm 0.34−0.560.12−0.430.05−0.460.24−0.28
LAI content, g m−2 4.3 ± 3.328.8 ± 33.438.7 ± 42.614.5 ± 3.6
Organic matter (LOI), % 3.3 ± 2.28.5 ± 7.45.9 ± 5.018.0 ± 0.5
Table 2. Chemical composition of the samples. All samples are divided into three groups based on mineralogy. Mean values and standard deviation are shown for each group.
Sample Group Na2OMgOAl2O3SiO2P2O5K2OCaOTiO2MnOFe2O3
Percentage of total weight
Group IMean0.723.4416.2857.100.252.740.511.110.097.95
σ0.180.210.351.140.020.140.100.040.010.43
Group IIMean1.771.9516.9465.010.144.170.430.750.065.36
σ0.420.291.451.750.030.480.140.140.010.96
Group IIIMean1.932.3815.6464.580.183.350.770.780.065.44
σ0.620.650.992.580.030.250.120.170.021.19
VCrCoNiCuZnRbSrYZr
ppm
Group IMean132.33133.1719.8390.8344.83203.67110.50118.0038.33222.83
σ7.067.581.2115.202.5418.925.749.473.9419.13
Group IIMean87.1369.3810.8830.3814.6388.00180.3898.8832.13211.38
σ16.8613.292.893.532.748.0013.0311.226.4725.08
Group IIIMean89.6492.1812.0963.9126.45136.64130.91106.4530.64187.73
σ24.6637.544.1230.7911.4845.7224.5516.595.5628.65
Publisher’s Note: MDPI stays neutral with regard to jurisdictional claims in published maps and institutional affiliations.

