Article

Modelling of Water Drop Movement and Distribution in No Wind and Windy Conditions for Different Nozzle Sizes

1
High-Tech Key Laboratory of Agricultural Equipment and Intelligence of Jiangsu Province, Jiangsu University, Zhenjiang 212013, China
2
Research Centre of Fluid Machinery Engineering and Technology, Jiangsu University, Zhenjiang 212013, China
3
Department of Civil Engineering, Koforidua Technical University, P.O. Box 191, Koforidua 03420, Ghana
4
Jiangsu Key Laboratory for Information Agriculture, Nanjing Agricultural University, Nanjing 210095, China
*
Author to whom correspondence should be addressed.
Water 2021, 13(21), 3006; https://doi.org/10.3390/w13213006
Submission received: 7 September 2021 / Revised: 9 October 2021 / Accepted: 13 October 2021 / Published: 26 October 2021
(This article belongs to the Special Issue Advances in Sprinkler Irrigation Systems and Water Saving)

Abstract

:
A numerical model was developed to determine the water drop movement and mean droplet size diameter at any distance from a sprinkler as a function of nozzle size and pressure. Droplet size data from 4, 5, 6, and 7 mm nozzle sizes verified the model. Data for model prediction were generated throughout lab experiments. The results demonstrated that the correlation between the observed and predicted droplet size diameter values for all the nozzle sizes and pressures is quite good. Nozzle size and pressure had a major influence on droplet size. Higher pressure produced smaller droplets over the entire application profile. The wetted distance downwind from the sprinkler increased as wind velocity increased, for example at a constant working pressure of 300 kPa, at wind speeds of 3.5 m/s and 4.5 m/s, 20% and 32% of the total volume exceeded the wet radius respectively. Larger droplets (3.9–4.5 mm), accounting for 3.6% and 6.3% of the total number of distributed droplets, respectively. The model can also predict the droplet size distribution at any wind direction overall the irrigated pattern.

1. Introduction

Irrigation sprinklers deliver many water drops of different sizes, which have the characteristics of sprinkler nozzle and pressure configuration. The performance of sprinklers is usually classified as overlapping uniformity and droplet size distribution [1,2,3,4]. It is attributed to the physical characteristics of the sprinkler, nozzle configuration, working pressure, sprinkler spacing, and environmental conditions (wind speed and direction). In other words, the hydraulic performance of the sprinkler is a function of its physical characteristics, geometric parameters, and environmental conditions [5,6,7]. Therefore, the different types and sizes of sprinklers have different hydraulic performance characteristics. Working pressure and nozzle characteristics (nozzle opening size, shape, and angle) are the main factors controlling sprinkler performance [8,9]. A study conducted by [10] demonstrated that the droplet size distribution from agricultural sprinklers showed that decreasing droplet size with increasing relative velocity of the water to the air, and Ref. [11] reported that nozzle pressure had a major influence on droplet size. It was established that a higher pressure produced smaller droplets over the application profile. The authors in [12] found that for both circular and square nozzles, increasing pressure decreased droplet size in overall droplet spectra, and for a given pressure, changing nozzle shape from circular to square also decreased droplet size.
The droplet size distribution varies with distance from the sprinkler [13,14,15,16]. Knowledge of droplet size distribution is important because they determine the effect of droplets from sprinklers on wind, evaporation, and impact on the soil surface [17,18,19]. Manufacturers are interested in knowing the size, percentage, or volume of droplets and where they are deposited to compare products, evaluate designs, and predict the effects of operating conditions such as pressure. Over the years, several simulation studies have been conducted to simulate various aspects of the impact of wind on water droplets in sprinklers [20,21,22,23,24,25]. Many factors affect the trajectory and loss of water droplets, which complicates the overall description and estimation of water droplet drift. The authors in [26,27,28,29], in 1995, studied the movement of water droplets in the air mainly affected by drag and gravity. The authors in Ref. [10], in 1989, determined the volume average droplet diameter at any distance from the nozzle according to the nozzle size and pressure. The model was validated by 4.0 mm, 3.2 mm circular, and 3.5 mm square nozzles. The authors in Ref. [30] studied the effect of wind and reported that the wind at right angles to the wind has lengthened the model. The authors confirmed that the size distribution of water droplets changes with the distance from the nozzle. However, it is important to understand the size distribution of water droplets, because they determine the effect of water droplets on wind, evaporation, and response to soil surface effects. The existing complete fluidic sprinkler is known for its rotation problems, particularly when operated at low-pressure conditions. Therefore, the fluidic component and nozzle were optimized, leading to the development of a new type of sprinkler called the dynamic fluidic sprinkler (DFS). In the current studies, no work has been conducted on the droplet size traveling distance of the (DFS). Therefore, it is very important to study the distribution of droplet size and the traveling distance of the (DFS), which is of great theoretical value and practical significance. These variables were measured using 2D-Video distrometer. The objective of this study was to develop a model for droplet size traveling distance and to verify the accuracy of the results through experimental data.

2. Materials and Method

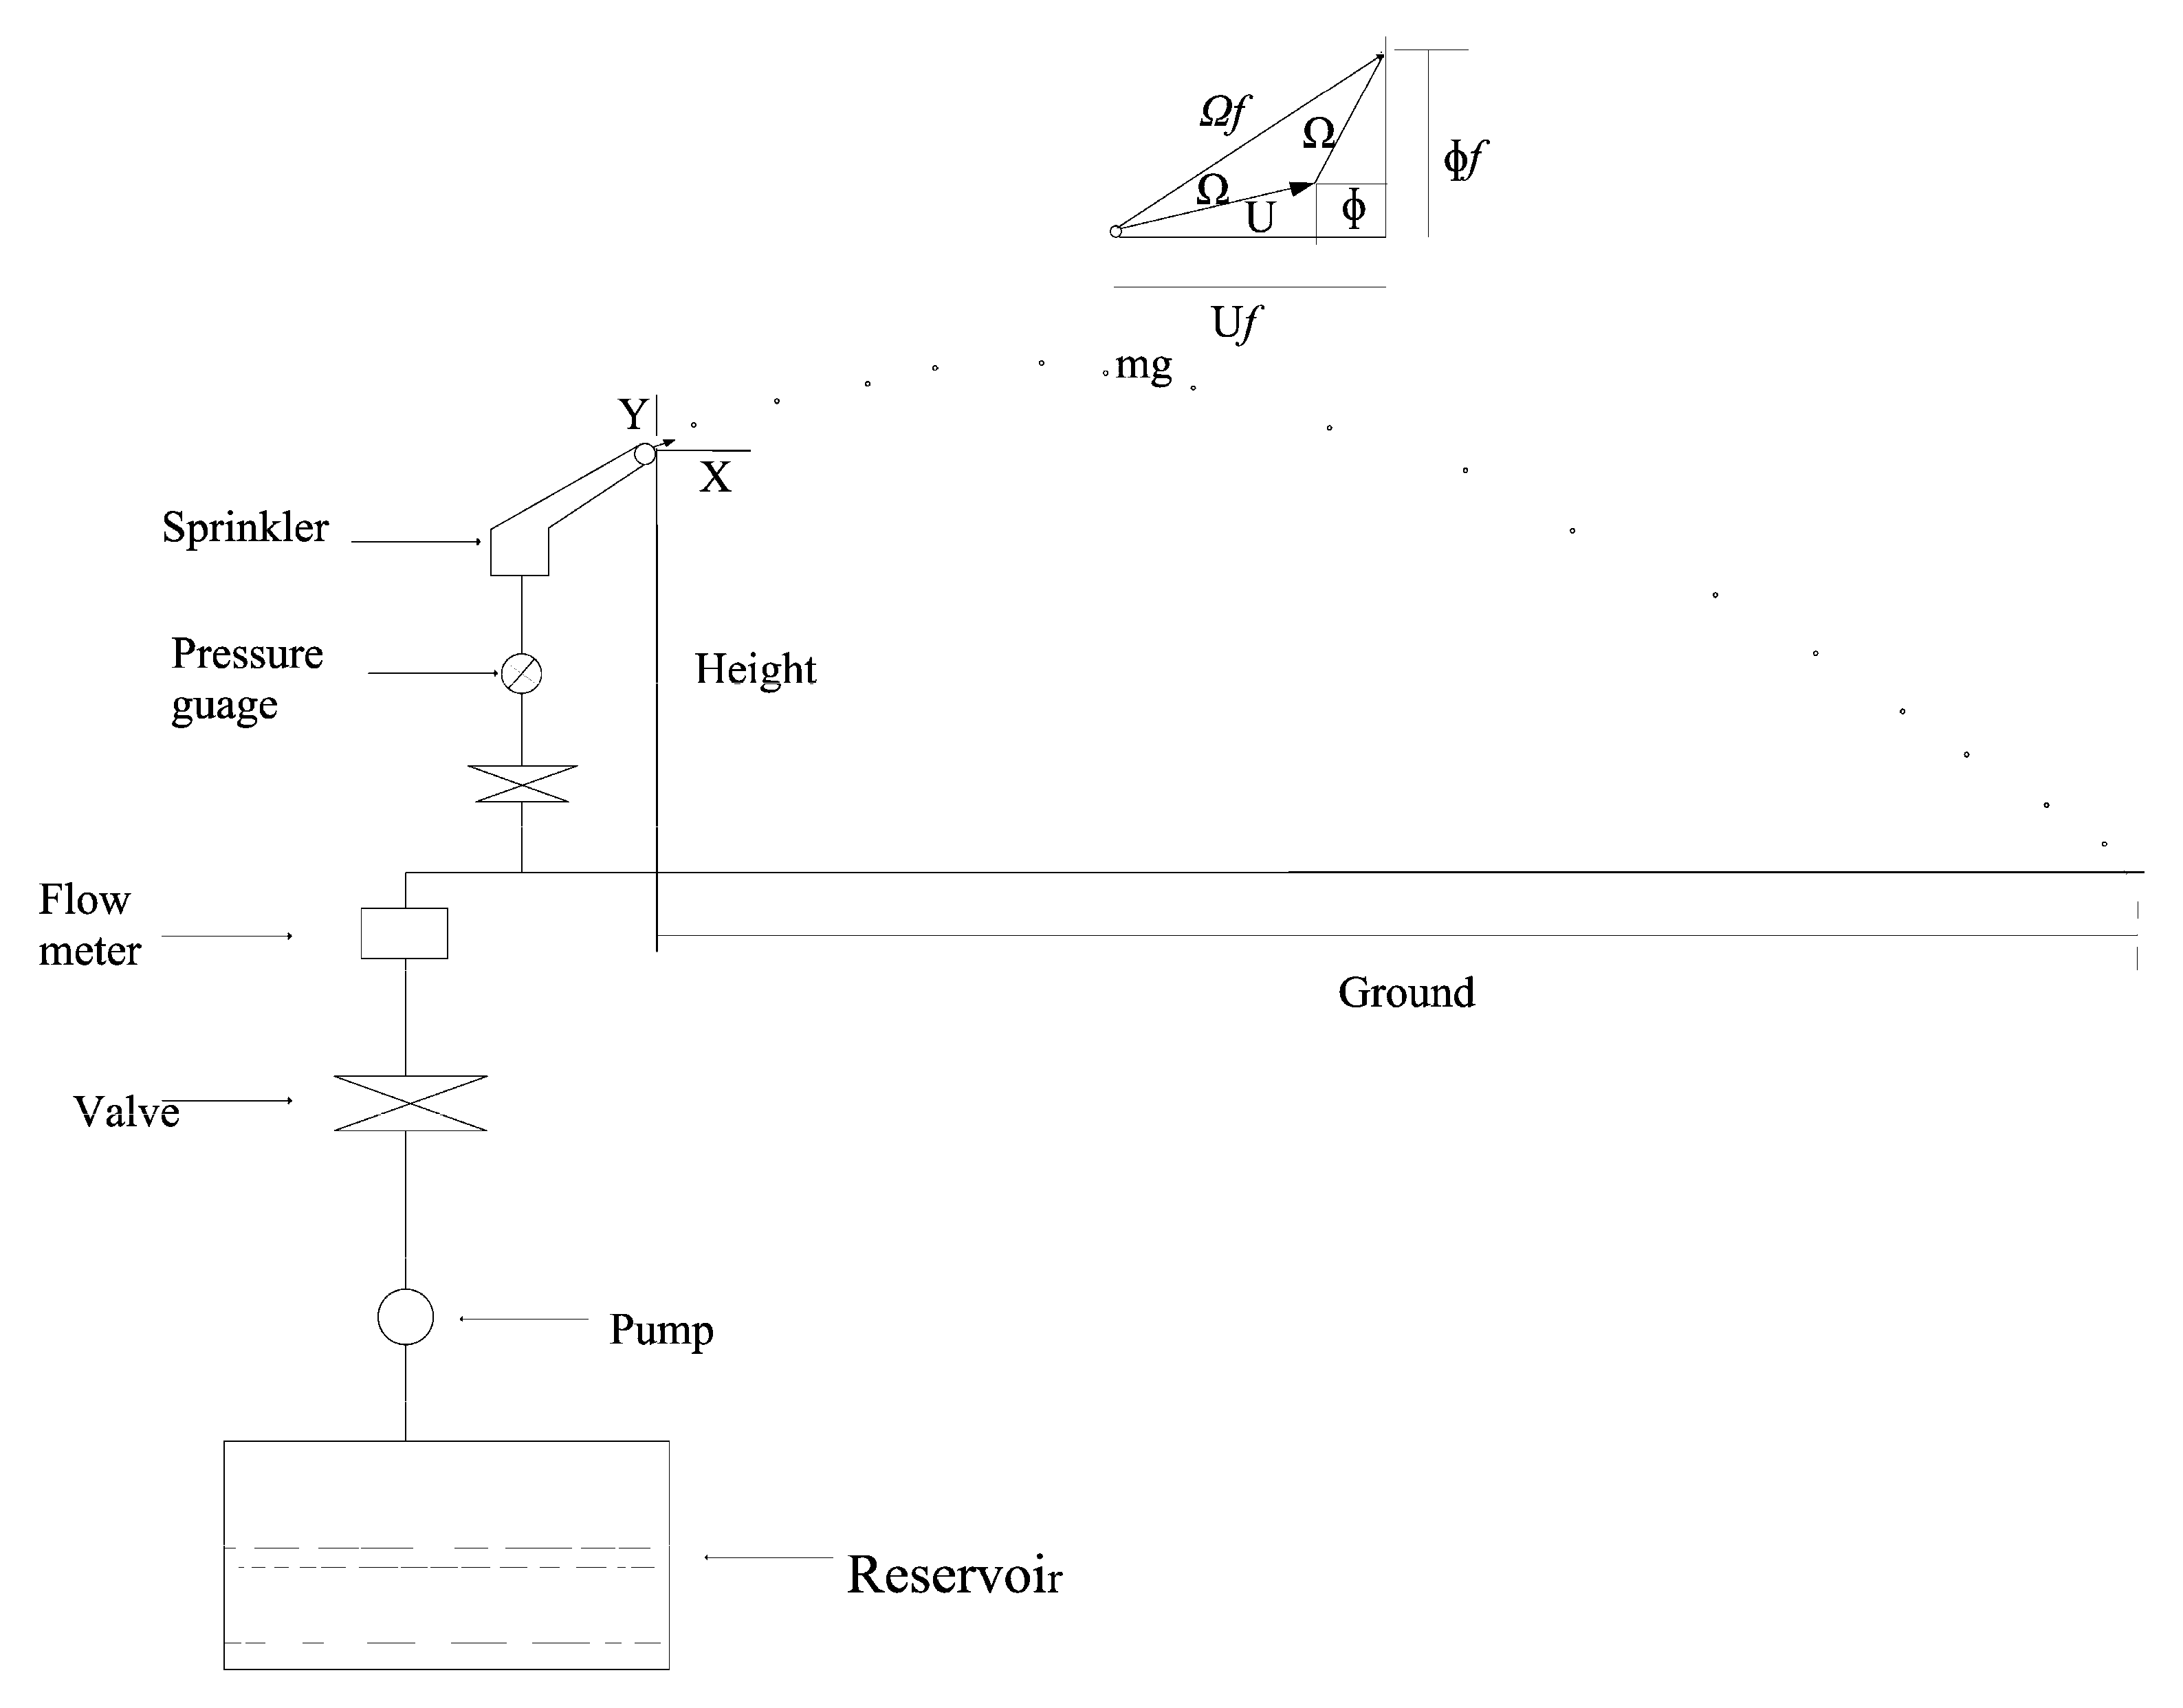
2.1. Boundary Condition

The ballistic approach was adopted to model the drop trajectory until reaching the ground surface. The following assumptions were made; the movement of the drop is influenced by; (a) its initial velocity vector; (b) gravity acting in a vertical direction (c) the wind vector acting in the horizontal plane; and (d) the resistance force applied in the direction opposite to the relative movement of the drop in the air. Due to the complexity of the spray jet process, the model considers the following aspects: (1) The jet is disintegrated at the nozzle exit into individual drops with different diameters moving independently in the air; (2) the drag coefficient is independent of the sprinkler height over the ground surface; and (3) different sized drops fall at a different distance. Droplet travel distance under no wind condition is undisturbed, and thus, a characteristic of the droplet size for a given configuration. The height of the sprinkler is 1.9 m, droplet diameter range considered; 0 < droplet diameter (mm) < 6; wind speed; 0, 2.5, 3.5 and 4.5 (m/s), operating pressure, 150, 200, 250 and 300 kPa. Nozzle sizes 4, 5, 6 and 7 mm.

2.2. Model of Droplet Motion

Figure 1 presents a schematic diagram of the droplet trajectory under no wind conditions. The effect of wind drift of sprinkler spray on drops distribution of a single sprinkler has been analyzed. The water jet ejected from a sprinkler nozzle is assumed to be a flux of spherical water drops having various drops diameter. Therefore, the sprinkler discharge profile is determined by the trajectories of water drops and its volumetric distribution. Several models have been developed by considering a sprinkler as a device emitting numerous droplets of diameter as functions of their traveled distances [18,19,31]. The ballistic theory, equations of motion for discharged water drops were adopted and are expressed as:
d 2 k d t 2 = 3 4 ρ a ρ x q ( μ f μ ) V r
d 2 l d t 2 = 3 4 ρ a ρ x q ( Φ f Φ ) V r
d 2 p d t 2 = 3 4 ρ a ρ x q ( β f ) V r g
where k and l are the q distances in the horizontal and vertical directions (m), ρ a , ρ x is the density ratio of air and water, respectively; t is time (s) and g is the acceleration due to gravity. q is the air drag coefficient of the droplet moving at the speed, V r .
V r = [ ( μ f μ ) 2 + ( Φ f Φ ) 2 + β 2 f ]
while μ and σ are the horizontal and vertical components of the droplet velocity, respectively; μ f , σ f and β f are the x, y, and z components of the wind velocity, respectively. Given that the logarithmic profile of wind speed is generally considered to be a reliable estimator of the actual field condition, the absolute wind speeds were calculated for all the conditions is:
W r = W m = I n [ ( n B ) n o ] I n [ ( n r B ) n o ]
W m = air velocity (m/s) measured at reference height, n r (m) above ground. B and n 0 are roughness height (m) and roughness parameter (m) respectively, both are functions of crop height (h), given by:
log d = 0.997 log h 0.1536 a n d log n o = 0.997 log h 0.883
The fourth-order Runge-Kutta numerical integration techniques were used to solve Equations (1)–(3) for droplet movement.

2.3. Empirical Model of the Drag Coefficient

The drag force acting on the trajectories and contact points of drops discharged from the sprinkler nozzle under the same pressure was determined by using Equations (5) and (6):
q = [ ( a R e ) c + b c ] 1 2
υ = q ( 2 g H ) 1 2
where, a = 24; b = 0.32; c = 0.52; D the droplet diameter (m) and υ , the kinematic viscosity of air (m2 s−1). The adopted relationship compares very well with the well-known set of relations by [19]. The model applies not only to the turbulent-flow regime, but also to the Stokes regime. However, it shows some deviation from experimental data for Re > 104. The velocity of the sprinkler jet exiting from the nozzle was calculated as follows:
V = C D ( 2 g H ) 0.5
where H (m)is the working pressure head at the nozzle, and CD is the discharge coefficient, =0.98.

2.4. Droplet Travel Distance

The simulation was performed by using Matrix Laboratory (MATLAB R2014a) software to predict the droplet size traveling distance, as shown in (Figure 1). The horizontal distance between the nozzle exit and the droplet landing point was simulated as the droplet travel distance. Droplet travel distance under no wind condition is undisturbed, and thus a characteristic of the droplet size for a given configuration. Droplet travel distance was simulated by substituting Equations (4) through (6) into Equations (1) and (2), for the droplet distribution. The input data were nozzle sizes, pressure, Trajectory distance, riser height, orifice coefficient, wind speed. A 0.1 mm droplet diameter increment was used starting from 0.1 mm to maximum droplet diameter. Finally, the model gives the droplet diameter and its distance from sprinkler as an output.

2.5. Estimation of the Droplet Size Distribution

Several sprinkler irrigation mathematical models considering droplet distribution have been developed in the last [12,29,30,31,32] presented a simulation scheme based on obtaining drop size distribution from the sprinkler radial water curve for a given sprinkler pressure combination under no wind conditions. In this study, [17] empirical model was adopted for the simulation. The reason for using the model was that it has been found to compare very well the inaccuracy to the well-known Upper Limit Log-Normal (ULLN) distribution model. The exponential model can be expressed as:
P v = ( 1 e 0.693 ( D D 50 ) n ) × 100
where P v is the percentage (0/0) of the total drops that are smaller than D; D is drop diameter (mm); D 50 is volume mean drop diameter (mm); n is the dimensionless exponent.
D 50 = a d + b d R
n = a n + bn R
The regression coefficients used for estimating the drop size distribution parameters for the dynamic fluidic sprinkler with a small round nozzle (5 mm) are as follows:
a d = 0.29 ;   b d = 12,000 ;   a n = 2.04 ;   b n = 1400
where R is the ratio of the nozzle diameter to the pressure at the base of the sprinkler device.

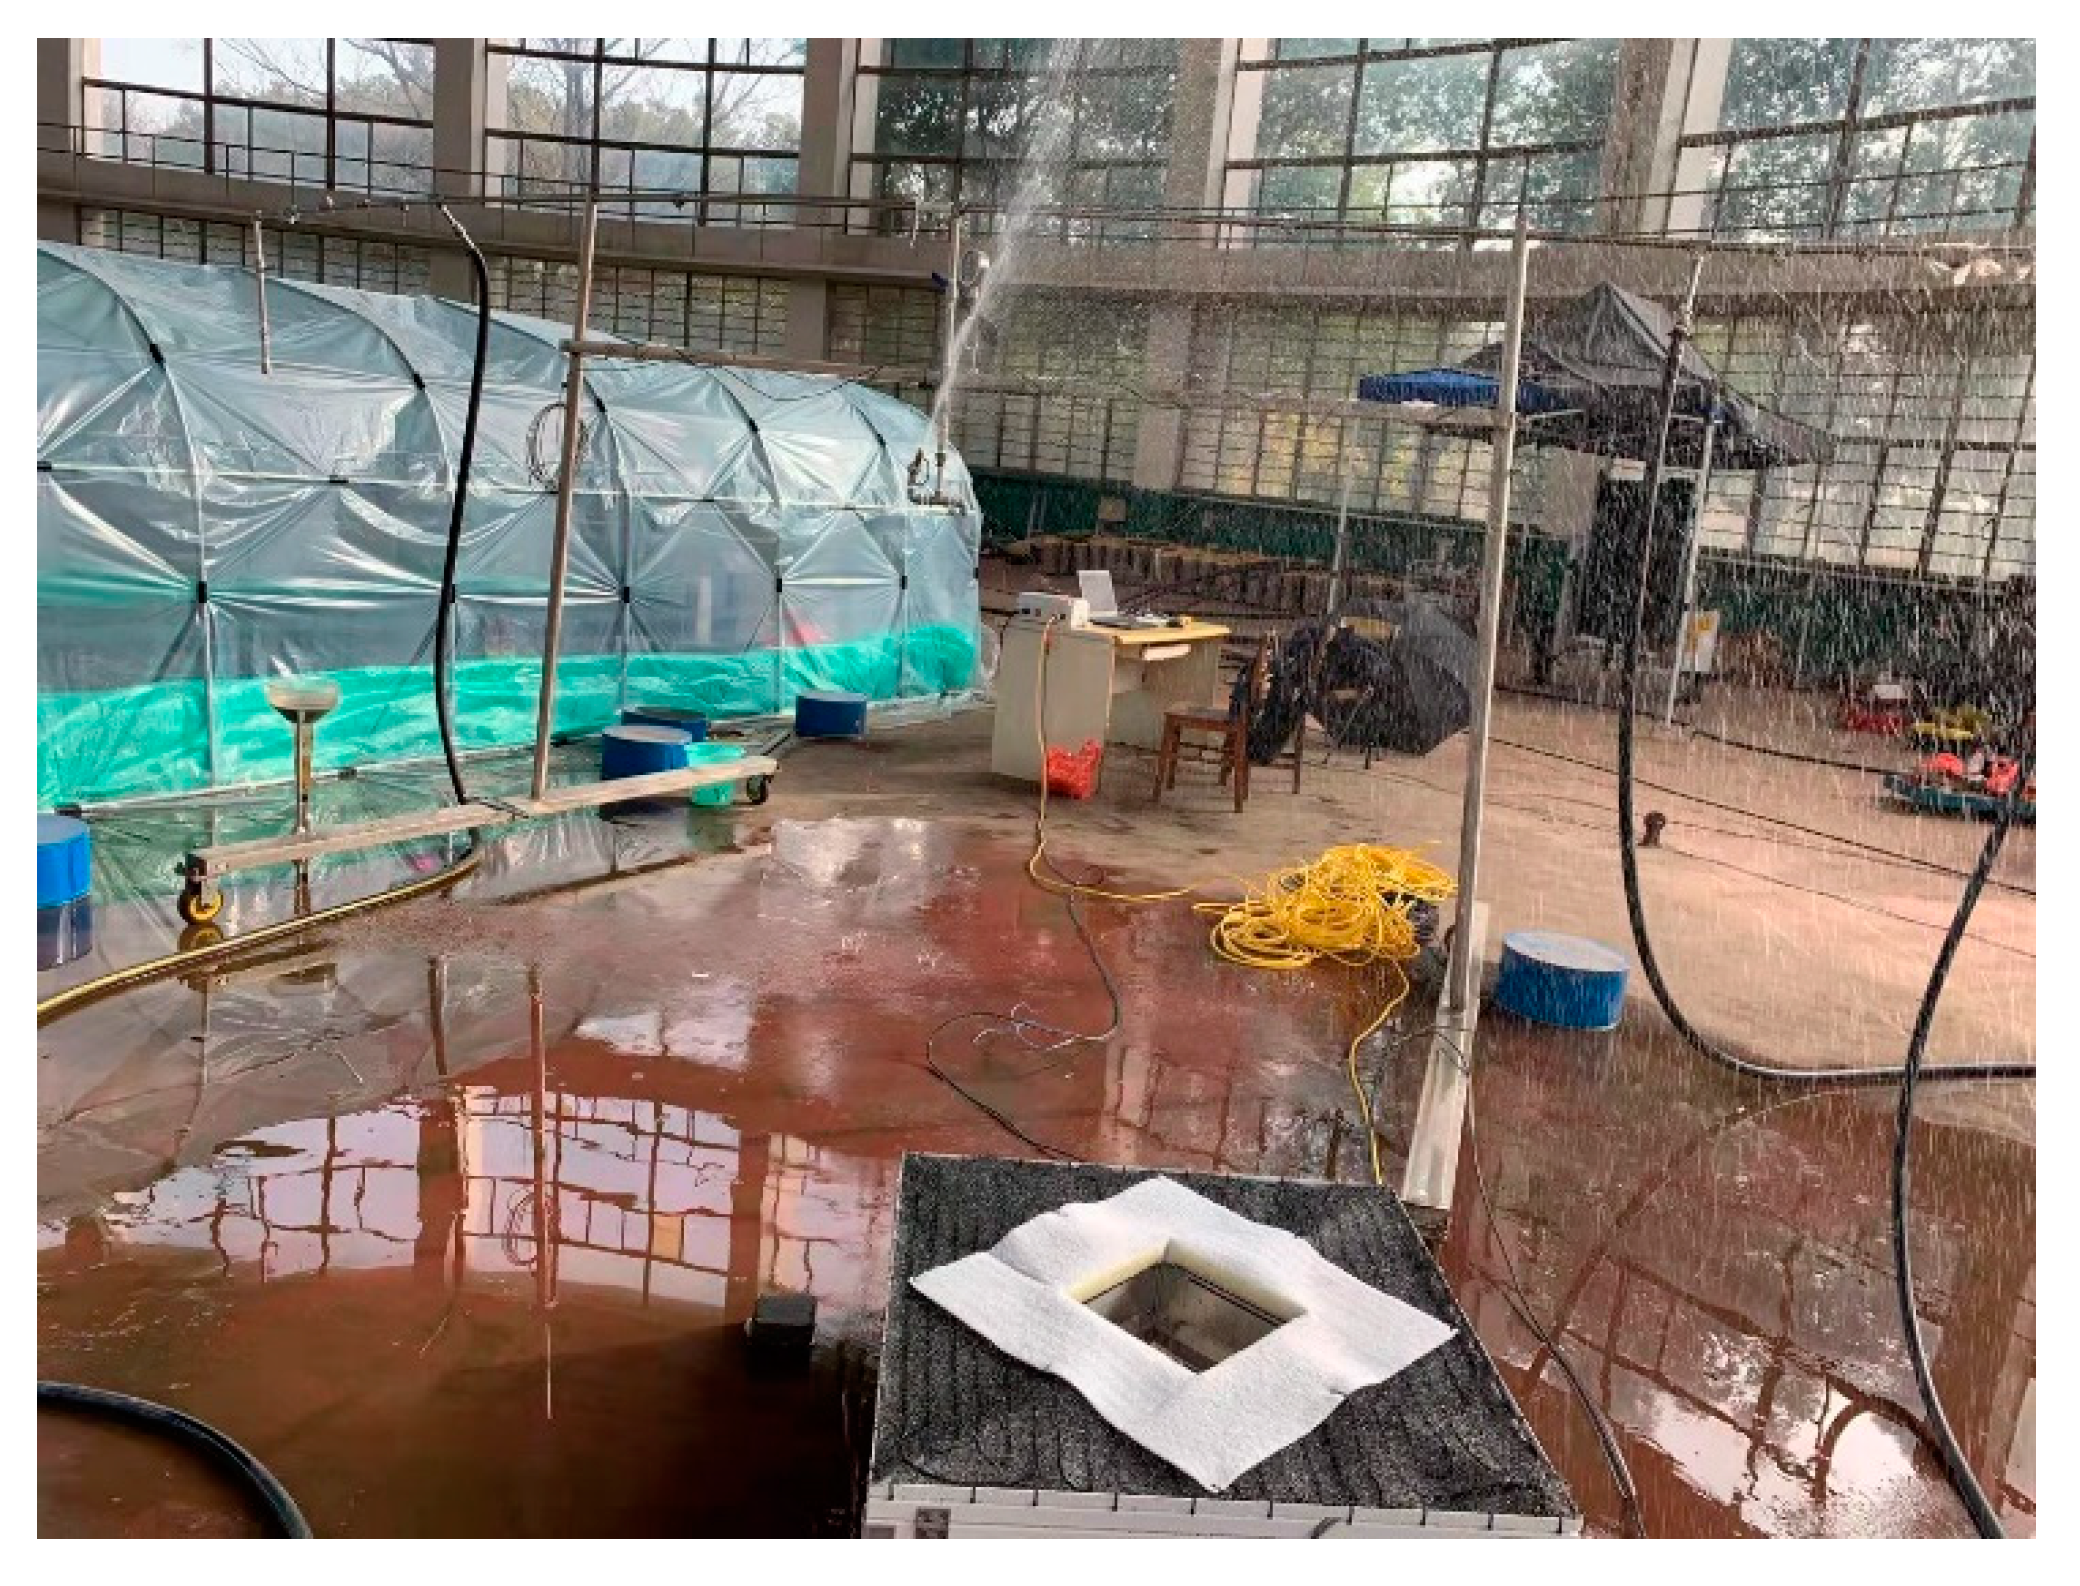
2.6. Experimental Procedure

The sprinkler used in this study was specifically manufactured as an experimental sample by the Research Center of Fluid Machinery Engineering and Technology (Jiangsu University, Zhenjiang City, Jiangsu Province, China). The test nozzles were self-designed and locally machined using a wire-cut electric discharge machining process. The inlet diameter of the nozzle was set as 15 mm, while the outlet diameters were chosen as 4, 5, 6, and 7 mm and the shape of the nozzle was circular. Experiments were carried out in the sprinkler irrigation laboratory of Jiangsu University, China. The experiment setup is schematically presented in (Figure 2). The diameter of the circular shaped indoor laboratory was 44 m and height of 18 m. The materials used for the experiment include; centrifugal pump, electromagnetic flow meter, and piezometer, valve, and dynamic fluidic sprinkler. The sprinkler was mounted on a height of 1.9 m from the ground, with an elevation angle of 23°. The riser was at an angle of 90° to the horizontal from which 0.9 m above the ground. As shown in Figure 2, water was drawn from the reservoir through the main pipe and ejected from the sprinkler. The experiment lasted for 4 h and the water temperature was 3 °C. Before the test was undertaken, the sprinkler was operated for several minutes to standardize the environmental conditions. A radial line was marked on the ground, extending from the sprinkler to the last observation point. Droplet sizes were determined using a 2D-Video Distrometer technique. It has the following specification, drop diameter measurement range from 0.125 to 6.5 mm with an increment of 0.125 mm and the measuring area is 1 m long, 1 mm wide with a thickness of 0.2 m and it was manufactured by Oanneum Research Digital-Institute of Information and Communication Technologies Steyrergasse 17, A-8010 Graz (Austria/Europe). The working principle is that two CCD line scan cameras face the opening of the lighting units. The object in the measurement area (determined by the cross-section of the two light paths viewed from above) blocks the light and is detected as shadows by the cameras. Further optical elements of the light paths, which have been omitted from this picture for the sake of simplicity, are two mirrors and a pair of slit plates that can contribute to the compact dimensions of the device and its insensitivity concerning spray. Each camera contains a small embedded computer that is responsible for handling the data capture process, the analysis of the data and its conversion and compression into a format suitable for further processing and transporting to the indoor user terminal. The droplet measurement was carried out at 2 m intervals along the radial direction of the sprinkler under a working pressure of 150, 200, 250 and 300 kPa. The sprinkler was allowed to spray over the measurement area a least five minutes to ensure a sufficient number of drops. A minimum of 100,000 drops were produced by the indoor user terminal only 92% of the drop sizes were analyzed after filtering.

2.7. Model Verification

To verify the model output, the predicted values were correlated to the measured values. A linear regression model of Y =   β + β 1 X was established with the predicted droplet diameter as the dependent variable (Y) and the observed droplet diameter as the independent variable (X). If the regression model is an ideal predictor of droplet diameter, the linear regression constants (β) and (β1) will be equal to 0 and 1, respectively. [32] pointed out that the values or R2 (coefficient of determination) varies between 0 and 1 and provides an index of goodness of model fit. If the R2 value is greater than or equal to 0.90, at least 90% of the variability is explained. This is generally considered to be very appropriate. On the other hand, the R2 value of 0.80 is considered a good fit. An R 2 value as low as 0.60 is sometimes considered acceptable or even good. The evaluation of a linear model of different nozzles is based on values of β , β 1 , R2, R, and the standard error of estimation (Γ) which is defined as follows:
Γ = i = n i = n ( Π m Π p ) 2 n
where, Π m = measured droplet diameter, (mm); Π p = predicted droplet diameter, (mm); Γ = standard error of estimation; n = number of observation.
The R 2 and Γ (standard error of estimate linear model) indicate the scatter points about the regression equation. R (correlation coefficient) indicates the degree of association between the observed and predicted values. To assist further in this evaluation, another index, known as the coefficient of efficient ( ϖ ) was used. This coefficient was used by [27]. If R and ϖ are close to each other, the model is free from any bias all or part of the data. ( ϖ ) is defined below as:
ϖ = i = n i = n ( Ψ o i Ψ o i ¯ ) 2 i = n i = n ( Ψ o i Ψ p ) i = n i n ( Ψ o i Ψ 0 i ¯ ) 2
where ϖ = coefficient of efficient; n = number of observations; ψ o i = value of observed measurements, (mm), ψ p = value of predicted measurements, (mm), o ψ i = average observed value, (mm).

3. Results and Discussion

Table 1 presents arithmetic mean droplet size diameter (mm) for different nozzle sizes and operating pressures along with the throw. Within a certain distance from the sprinkler, the average droplet diameter (arithmetic, volume, and median) usually increased with the increase of distance. Between 2 and 10 m, the volumetric drop diameter increased by 7.1%. Moreover, small water droplets were concentrated near the sprinkler, resulting in an average volumetric and median diameter less than 1 mm, while a volumetric and median diameter of more than 5.5 mm can be observed at a distance of 12 m. Similar findings were previously reported by many authors [33,34,35].

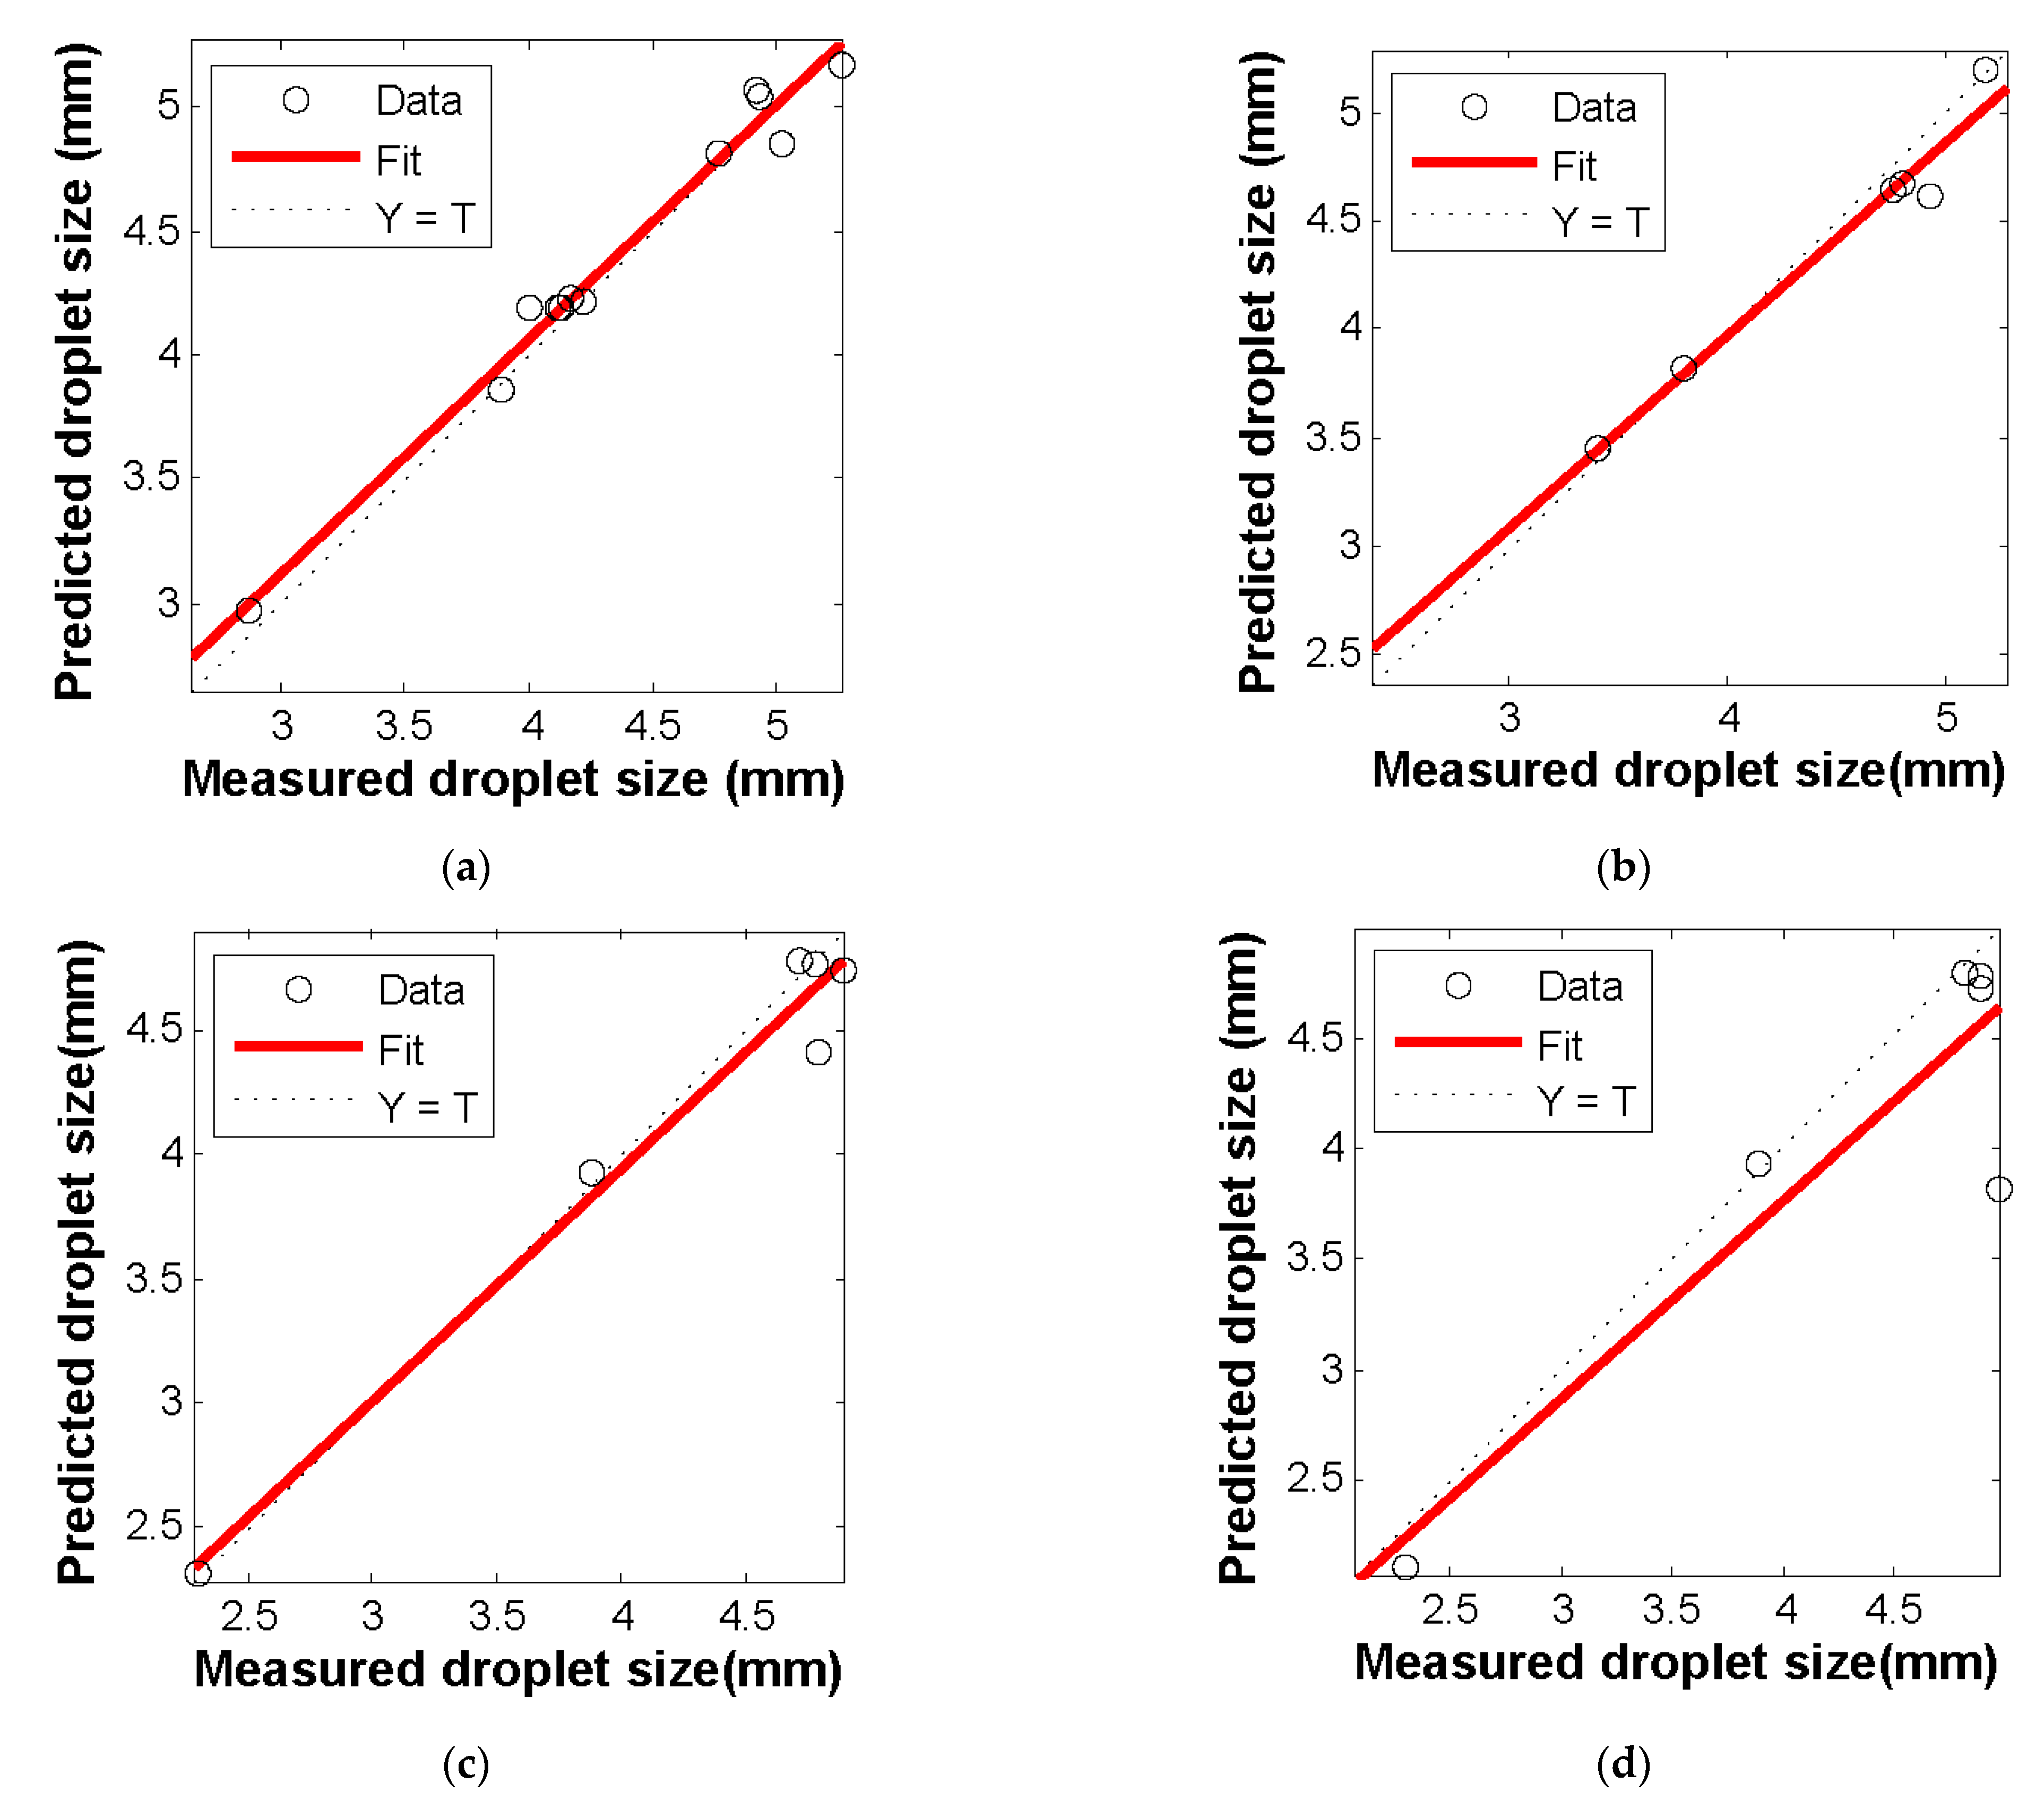
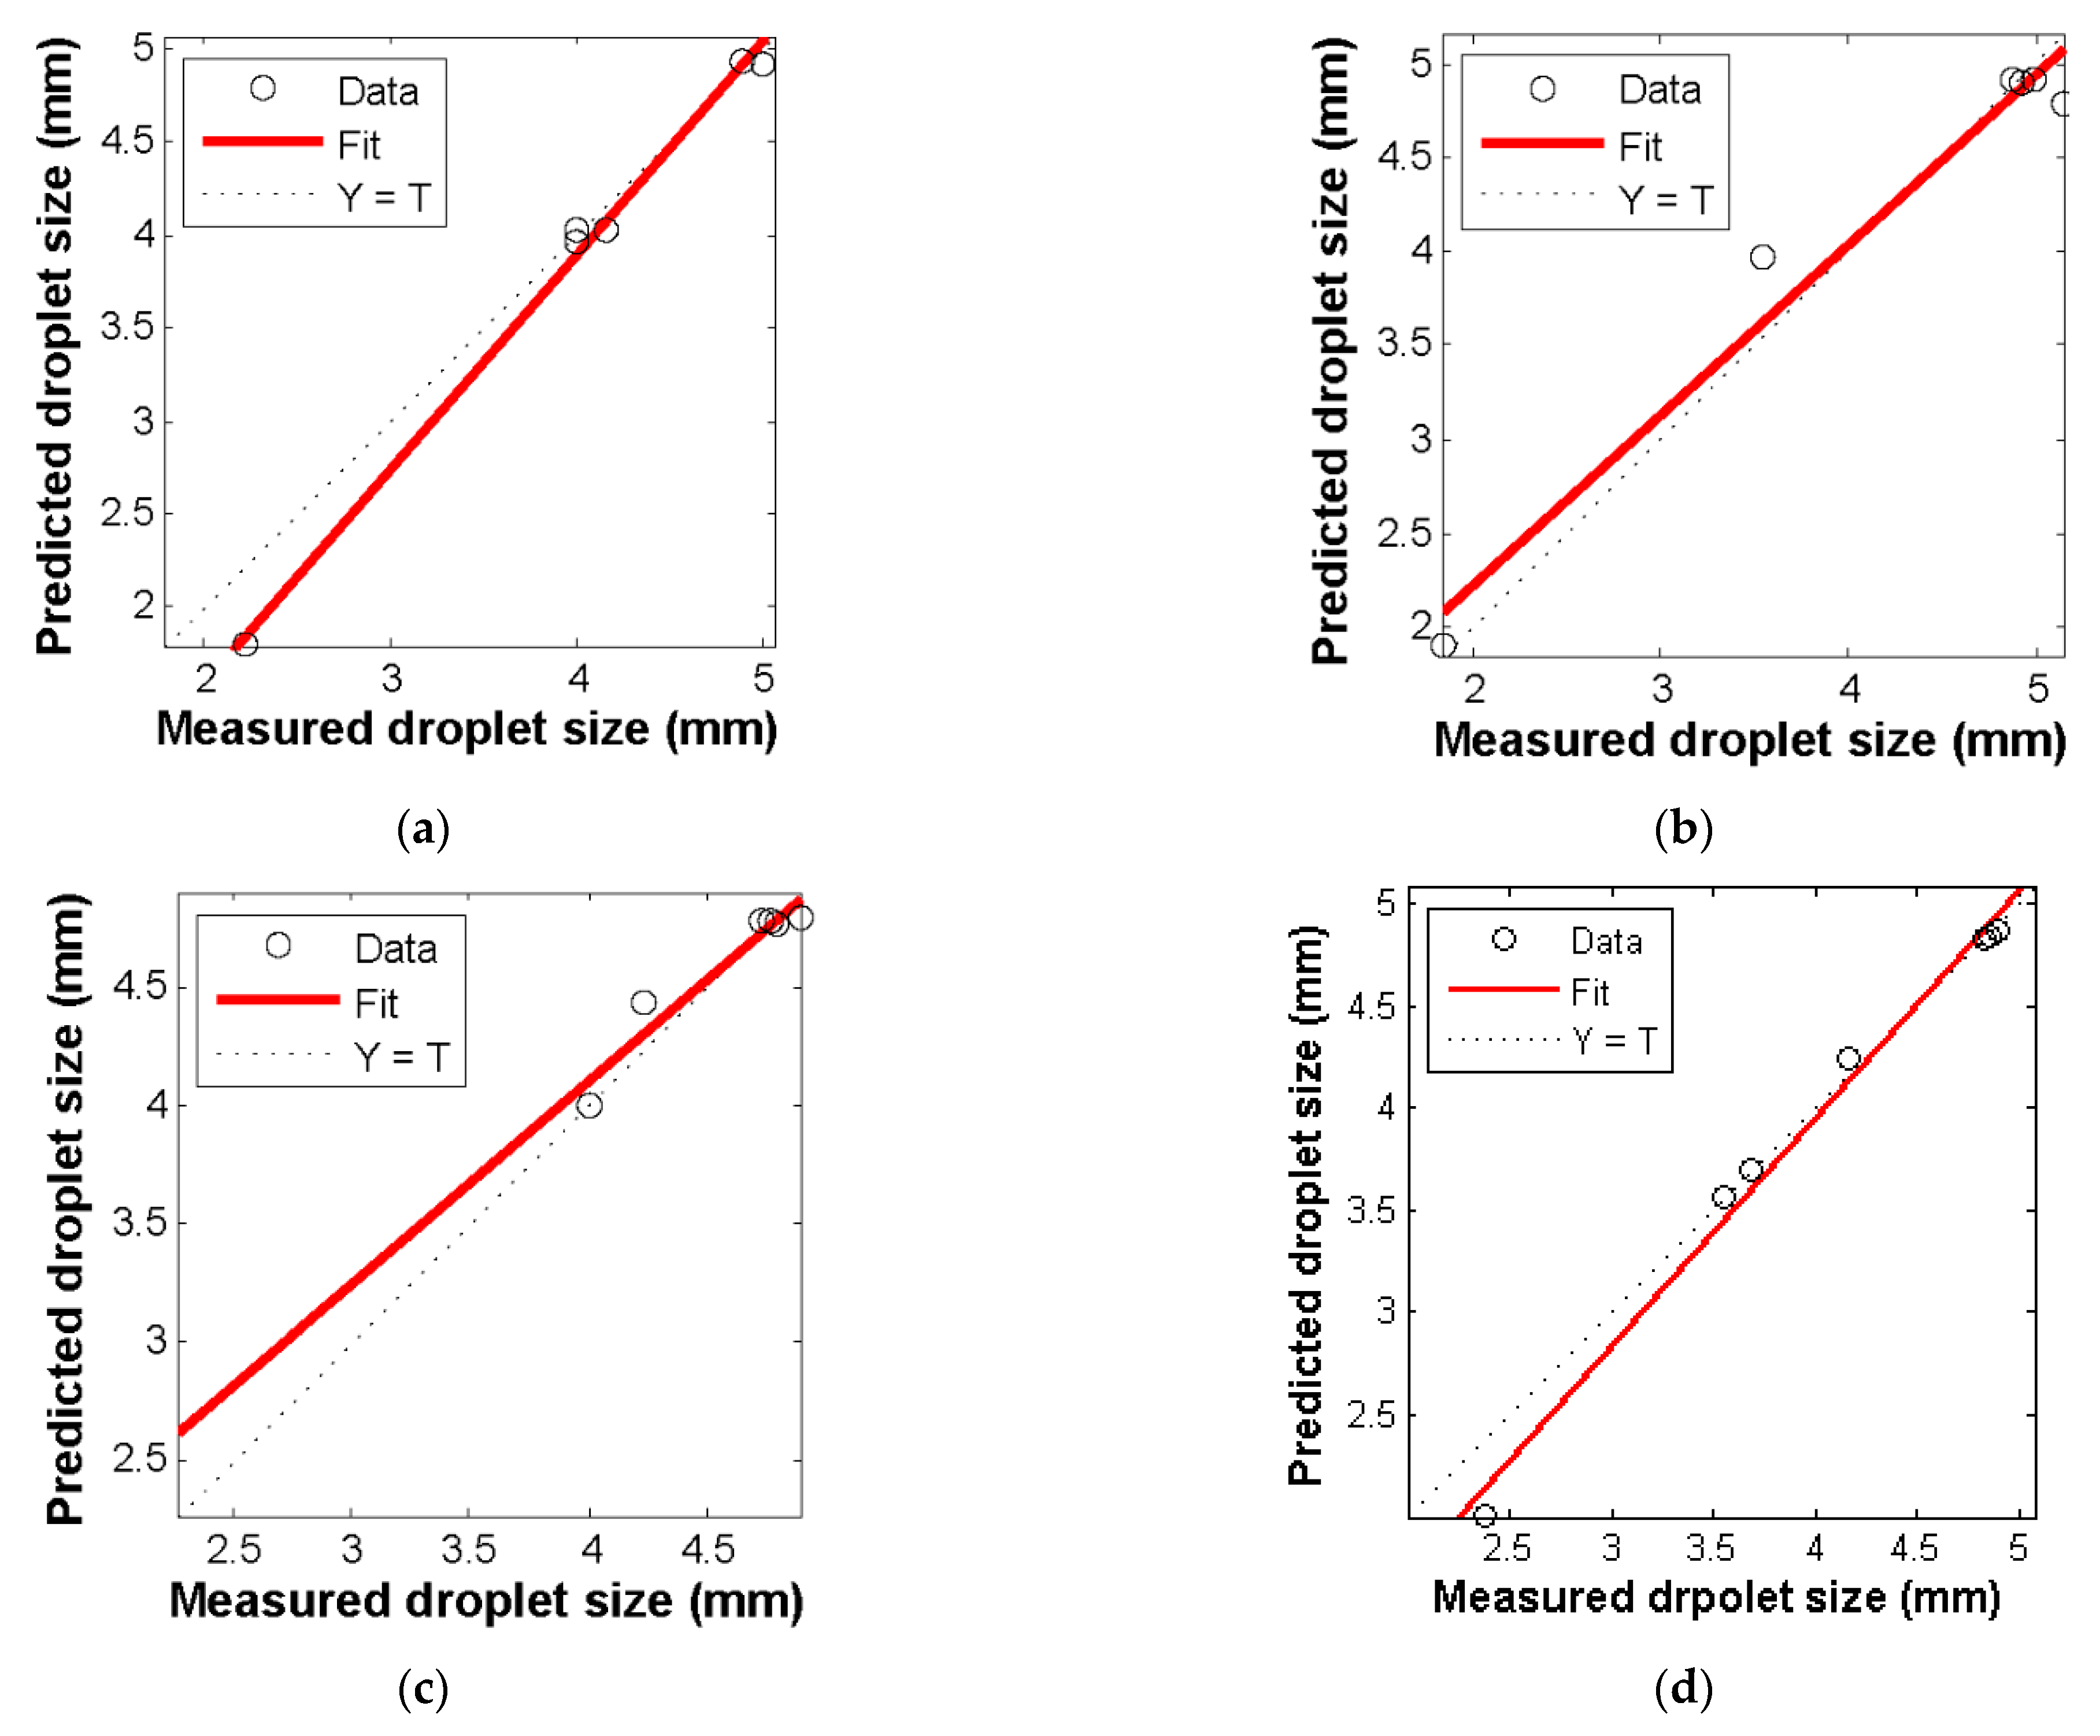
3.1. Comparison of the Measured versus Predicted Droplet Size Diameter

Figure 3 shows a graphical comparison of droplet size diameters measured and predicted at 150 kPa for different nozzle sizes 4, 5, 6, and 7 mm. In general, the value of β 1 is close to 1 and β close to zero, accompanied by low λ and high R2, R, and ϖ values, which indicates satisfactory prediction by the model. As the slope, β 1 , and the intercept β are significantly different from 1.0 and 0, respectively, at the 99% level of confidence, a bias exists within the model estimation. This deviation oscillates between over and less estimation which depends mainly on β and β 1 values. Table 2 shows the evaluation results and statistical parameters of the droplet diameter.
Through a comprehensive evaluation of the four kinds of nozzles, it can be found that the R2 value of all nozzle sizes is greater than 0.92, and the ϖ value is close to R2. β and β1 are close to 1 and 0, respectively. Furthermore, R2 values are high, less difference between R2 and ϖ , and Γ values are minimal. In general, the correlation between the observed and predicted droplet diameter values for all the nozzle sizes is satisfactory. This shows that the output of the model is suitable, and the deviation in the nozzle can be attributed to the experimental error, the change of the manufacturer, and uncalculated factors.

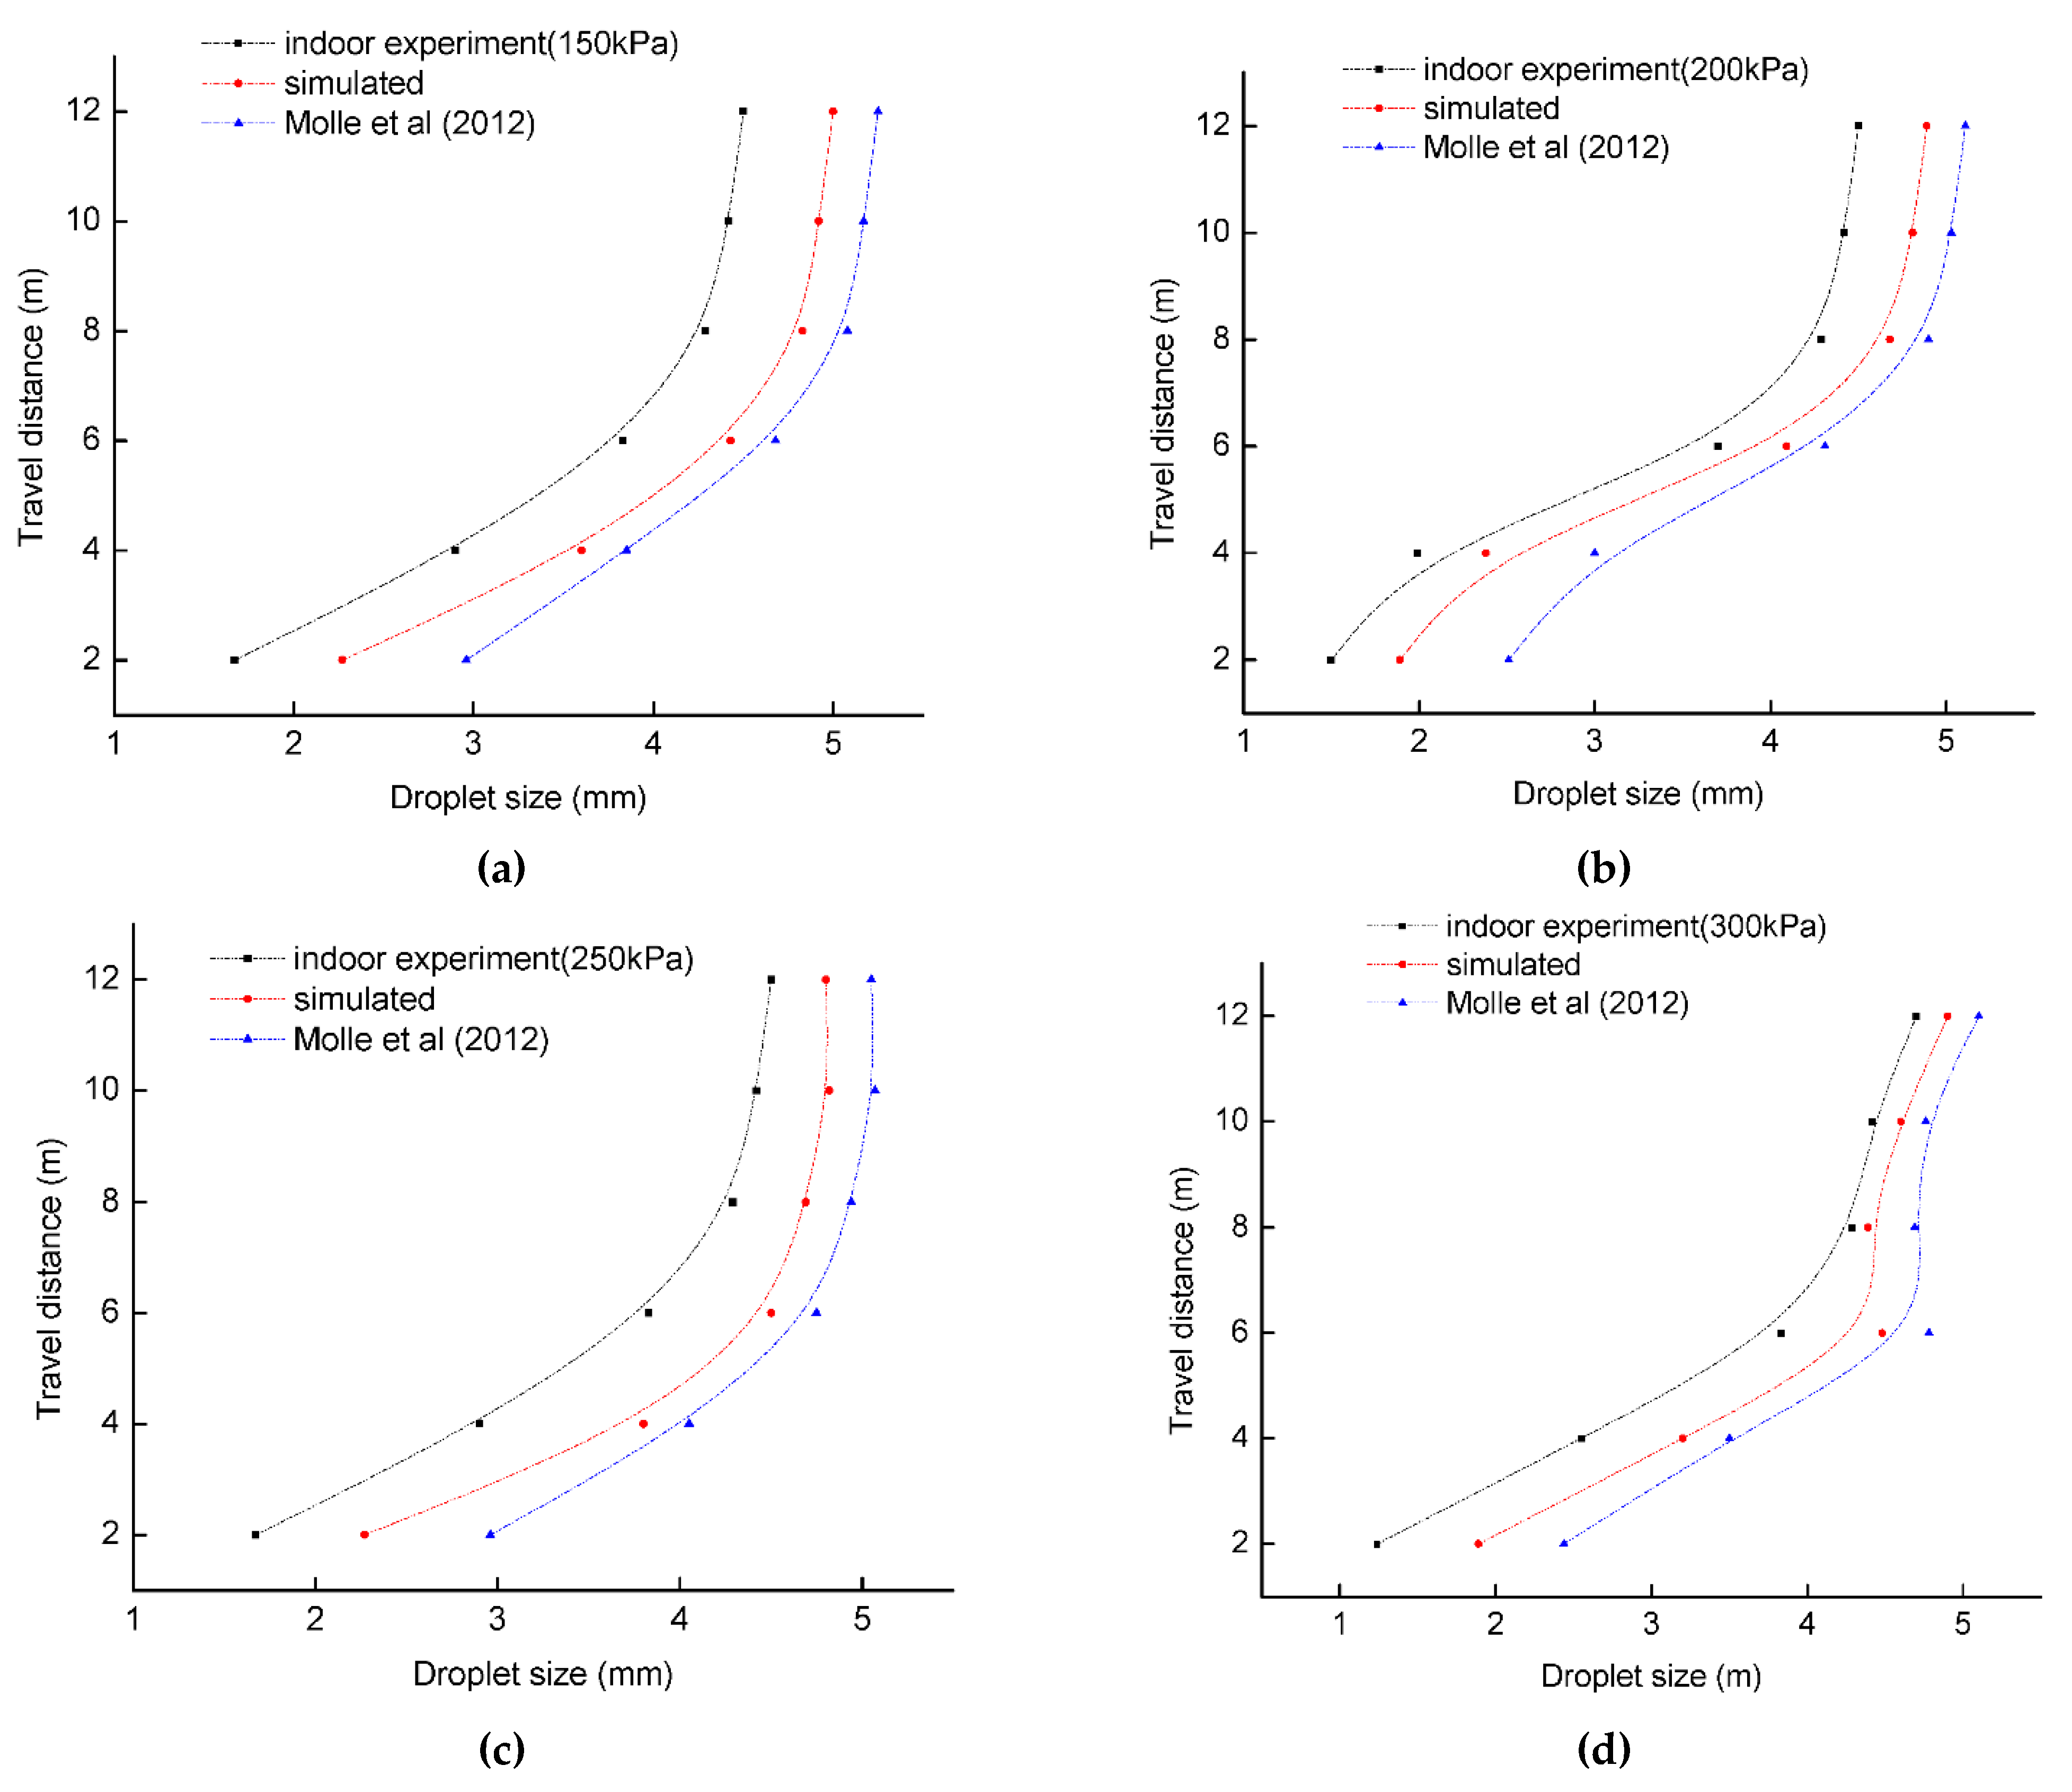
3.2. Comparison of the Measured versus Predicted Droplet Sizes for Different Pressures

Figure 4 presents a comparison between the measured droplet diameter and the predicted droplet diameter at different working pressures of 150, 200, 250, and 300 kPa. The results show that β1 is close to 1, β is close to 0, with low Γ and high R2, R and ϖ values, the prediction results of the model are satisfactory. At the 99% confidence level, the slope β1 and intercept β are not significantly different from 1.0 and 0, respectively, so the model estimation is biased. This deviation oscillates between over and less estimation, which are mainly dependent on the values of β and β1. The evaluation results and statistical parameters of droplet diameter are given in the Table 3.
Through a comprehensive evaluation of the four pressure indexes, it can be found that R2 values for all sprinkler base pressures are greater than 0.91 and ϖ values are close to R2. β and β1 are close to 1 and 0, respectively. Besides, R2 values are high, less difference between R2 and ϖ , and Γ   values are minimal. In general, the correlation between the observed and predicted droplet diameters at 150 kPa, 200 kPa, and 250 kPa is more satisfactory than that of 300 kPa.

3.3. Comparison between Other Simulated Travel Distance

Figure 5 shows the comparative analysis of the droplet travel distance between model and our model. It is clear from Figure 5 that our model is consistent with model for the difference in the size range of large and small droplets. However, our model differs from [7]. This difference is mainly due to differences in the operating parameters used in the simulation.

3.4. Compare the Droplet Size Distribution Model Prediction in Zero and Windy Conditions

The computer model was used to simulate droplet travel distances from the sprinkler for three wind speeds with downwind direction, and zero wind conditions are compared in Figure 6. The droplet with a diameter of less than 1 mm traveled farthest. In the range of 1.5 mm to 5.5 mm, the traveled distance increases with the increase of droplet size and wind speed. The drift distance is the difference between the travel distance of the droplets in the same nozzle pressure configuration under the conditions of no wind and wind. Figure 6 is showing the extent of drift decreases as droplet size increases.
This highlights that the degree of drift is relatively more sensitive to the change of the size area of small droplets than that of large droplets, which makes the size of small droplets more prone to wind drift. Therefore, if the droplet distribution in a spray is seriously skewed to smaller droplet sizes, the distribution pattern can easily be distorted under the influence of wind. The drift distance increases with the increase of wind speed. From Figure 6, it is important to note that smaller diameter (0.5 to 1 mm) droplets were widely drifted compared to larger droplets (1.5 to 5.5 mm). For example, when the condition was 300 kPa and 2.5 m/s, the droplet between 0.5 mm and 3.94 mm did not exceed the characteristic wetting radius even though they were drifted. Only droplets with an average diameter of 4.45 mm, a frequency of 0.92%, as well as droplets with an average diameter range of less than 0.2 mm and a frequency of less than 3% of the total number of droplets, moved outside the wetting radius.
The remaining droplets have a higher probability of distorting the distribution pattern. This observation is particularly important because it partially answers the questions raised by [36,37], distinguishing between water droplets that may cause loss of wind drift and high probability water droplets that only distort the distribution pattern. Although larger droplets account for only a small part of the number of droplets in all droplet distributions under consideration, they constitute a high percentage of loss if they are wind drifted due to their larger size per droplet. For example, at a constant working pressure of 300 kPa, at wind speeds of 3.5 m/s and 4.5 m/s, 20% and 32% of the total volume exceeded the wet radius, respectively. These are larger droplets (3.9–4.5 mm), accounting for 3.6% and 6.3% of the total number of distributed droplets, respectively. Therefore, the percentage of large droplets in the distribution spectrum is not only significant for predicting droplet effects [38,39], but also more important for estimating wind drift losses, as they are likely to fall outside the wetting radius.

4. Conclusions

A computer model of droplet size distribution under zero and windy conditions was established. (1) The model with different nozzle sizes (4, 5, 6 and 7 mm) and different pressures (150, 200, 250, and 300 kPa) was verified. (2) The best results predicted by the computer model were at 5, 6, 4 and 7 mm. For working pressure, the best results were obtained at 150 kPa and 200 KPa, 250 kPa, and 300 kPa. In general, the correlation between the observed and predicted droplet size diameter values for all sprinkler base pressures and the nozzle is quite good. The model was used to predict the pattern shape in no wind and windy conditions. The wetted distance downwind from the sprinkler increased as wind velocity increased, for example, at a constant working pressure of 300 kPa, at wind speeds of 3.5 m/s and 4.5 m/s, 20%, and 32% of the total volume exceeded the wet radius respectively. Larger droplets (3.9–4.5 mm), accounted for 3.6% and 6.3% of the total number of distributed droplets, respectively.

Author Contributions

X.Z. supervision and revision; J.K.L. experimental design, data acquisition, A.F. analysis and writing the original manuscript; X.J. main supervisor and acquisition of funding; J.L. Investigation; and S.A.O. data acquisition; F.A.D. data analysis and visualization. All authors have read and agreed to the published version of the manuscript.

Funding

The Key R&D Project of Jiangsu Province (Modern Agriculture) (No. BE2021341, BE2019306), a project funded by the priority academic program development of Jiangsu University higher education institutions (No. PAPD-2018-87), Independent Innovation Fund Project of Agricultural Science and Technology in Jiangsu Province (No.CX(20)2037), and Jiangsu Key Laboratory for Information Agriculture.

Institutional Review Board Statement

Not applicable.

Informed Consent Statement

Not applicable.

Data Availability Statement

The data presented in this study is available on request from the corresponding author.

Acknowledgments

The authors are greatly indebted to the Key R&D Project of Jiangsu Province (Modern Agriculture) (No. BE2021341, BE2019306), a project funded by the priority academic program development of Jiangsu University higher education institutions (No. PAPD-2018-87), Independent Innovation Fund Project of Agricultural Science and Technology in Jiangsu Province (No.CX(20)2037), and Jiangsu Key Laboratory for Information Agriculture.

Conflicts of Interest

The authors declare no conflict of interest.

References

  1. Wrachien, D.; Lnrenzini, G. Modeling jet flow and losses in sprinkler irrigation overview and perspective of a new approach. Biosys. Eng. 2006, 94, 297–309. [Google Scholar] [CrossRef]
  2. Silva, W.L.C.; Larry, G.J. Modeling evaporation and microclimate change in sprinkler irrigation I. Model formulation and calibration. Trans. ASAE 1988, 31, 1481–1486. [Google Scholar] [CrossRef]
  3. Liu, J.P.; Liu, W.Z.; Bao, Y.; Zhang, Q.; Liu, X.F. Drop size distribution experiments of gas-liquid two phase’s fluidic sprinkler. J. Drain. Irrig. Mach. Eng. 2017, 35, 731–736. [Google Scholar]
  4. Zhu, X.Y.; Zhang, A.Y.; Zhang, L.G.; Shi, Y.J.; Jiang, N. Research on atomization performance of low-pressure atomization nozzle. J. Drain. Irrig. Mach. Eng. 2021, 39, 210–216. [Google Scholar]
  5. Liu, J.P.; Li, T.; Zhang, Q. Experimental study on influence of flow channel structure on hydraulic performance of low-pressure rotary sprinkler. J. Drain. Irrig. Mach. Eng. 2021, 39, 312–317. [Google Scholar]
  6. Zhu, X.Y.; Fordjour, A.; Yuan, S.Q.; Dwomoh, F.; Ye, D.X. Evaluation of hydraulic performance characteristics of a newly designed dynamic fluidic sprinkler. Water 2018, 10, 1301. [Google Scholar] [CrossRef] [Green Version]
  7. Molle, B.; Tomas, S.; Hendawi, M. Evaporation and wind drift losses during sprinkler irrigation influenced by droplet size distribution. Irrig. Drain. 2012, 61, 240–250. [Google Scholar] [CrossRef]
  8. Zhu, X.Y.; Yuan, S.Q.; Jiang, J.Y.; Liu, J.P.; Liu, X.F. Comparison of fluidic and impact sprinklers based on hydraulic performance. Irrig. Sci. 2015, 33, 367–374. [Google Scholar] [CrossRef]
  9. Shi, Y.J.; Zhu, X.Y.; Hu, G.; Zhang, A.Y.; Li, J.P. Effect of water distribution on different working conditions for sprinkler irrigation. J. Drain. Irrig. Mach. Eng. 2021, 39, 318–324. [Google Scholar]
  10. Hills, D.J.; Yuping, G. Sprinkler volume mean droplet diameter as a function of pressure. Trans. ASAE 1989, 32, 471–476. [Google Scholar] [CrossRef]
  11. Li, J. Effect of pressure and nozzle shape on the characteristics of sprinkler droplet spectra. J. Agric. Eng. Res. 1997, 66, 15–21. [Google Scholar] [CrossRef]
  12. Solomon, K.H.; Kincaid, D.C.; Bezdek, J.C. Drop size distributions for irrigation spray nozzles. Trans. ASAE 1985, 28, 1966–1974. [Google Scholar] [CrossRef]
  13. Chen, D.; Wallender, W.W. Droplet size distribution and water application with low-pressure sprinklers. Trans. ASAE 1985, 28, 511–516. [Google Scholar] [CrossRef]
  14. Zhu, X.; Yuan, S.; Liu, J. Effect of sprinkler head geometrical parameters on the hydraulic performance of fluidic sprinkler. J. Irrig. Drain. Eng. 2012, 138, 1943–4774. [Google Scholar] [CrossRef]
  15. Zhang, L.; Zhou, W.; Li, D.X. Research progress in irrigation mode selection of high-efficiency water-saving agriculture. J. Drain. Irrig. Mach. Eng. 2019, 37, 447–453. [Google Scholar]
  16. Yao, J.C.; Wang, X.K.; Zhang, S.C.; Xu, S.R.; Jin, B.B.; Ding, S.W. Orthogonal test of important parameters affecting hydraulic performance of negative pressure feedback jet sprinkler. J. Drain. Irrig. Mach. Eng. 2021, 39, 966–972. [Google Scholar]
  17. Xue, Z.L.; Wang, X.K.; Fan, E.D.; Xu, S.R.; Wang, X.; Zhang, C.X. Structure optimization and test of three-way pulse jet tee. J. Drain. Irrig. Mach. Eng. 2020, 38, 751–756. [Google Scholar]
  18. Xu, S.R.; Wang, X.K.; Xiao, S.Q.; Fan, E.D. Numerical simulation and optimization of structural parameters of the jet-pulse tee. J. Drain. Irrig. Mach. Eng. 2019, 37, 270–276. [Google Scholar]
  19. Fukui, Y.; Nakanishi, K.; Okamura, J. Computer evaluation of sprinkler irrigation uniformity. Irrig. Sci. 1980, 2, 23–32. [Google Scholar] [CrossRef]
  20. Liu, J.; Zhu, X.; Yuan, S.; Fordjour, A. Modeling the application depth and water distribution of a linearly moving irrigation system. Water 2019, 11, 827. [Google Scholar] [CrossRef] [Green Version]
  21. Li, Y.B.; Liu, J.P. Prospects for development of water saving irrigation equipment and technology in China. J. Drain. Irrig. Mach. Eng. 2020, 38, 738–742. [Google Scholar]
  22. Seginer, I. Tangential velocity of sprinkler drops. Trans. ASAE 1965, 3, 90–93. [Google Scholar] [CrossRef]
  23. Teske, M.E.; Thistle, H.W.; Londergan, R.J. Modification of droplet evaporation in the simulation of fine droplet motion using AGDISP. Trans. ASABE 2011, 54, 417–421. [Google Scholar] [CrossRef]
  24. Xiang, Q.J.; Xu, Z.D.; Chen, C. Experiments on air and water suction capability of 30PY impact sprinkler. J. Drain. Irrig. Mach. Eng. 2018, 36, 82–87. [Google Scholar]
  25. Li, J.; Kawano, H.; Yu, K. Droplet size distributions from different shaped sprinkler nozzles. Trans. ASAE 1994, 37, 1871–1878. [Google Scholar] [CrossRef]
  26. Song, H.B.; Yoon, S.H.; Lee, D.H. Flow and heat transfer characteristic of a two dimensional oblique wall attaching offset jet. Int. J. Heat Mass Transf. 2000, 43, 2395–2404. [Google Scholar] [CrossRef]
  27. Sharaf, G.A. Evaluation of pressure distribution and lateral flow rates along drip tape lateral. J. Agric. Eng. Res. 2003, 20, 542–556. [Google Scholar]
  28. Li, H.; Tang, P.; Chen, C.; Zhang, Z.Y.; Xia, H.M. Research status and development trend of fertilization equipment used infertigation in China. J. Drain. Irrig. Mach. Eng. 2021, 39, 200–209. [Google Scholar]
  29. Liu, J.P.; Liu, X.F.; Zhu, X.Y.; Yuan, S.Q. Droplet characterization of a complete fluidic sprinkler with different nozzle dimensions. Biosyst. Eng. 2016, 65, 2–529. [Google Scholar]
  30. Fordjour, A.; Zhu, X.; Yuan, S.; Dwomoh, F.; Zakaria, I. Numerical simulation and experimental study on internal flow characteristics in the dynamic fluidic sprinkler. Appl. Eng. Agric. 2020, 36, 61–70. [Google Scholar] [CrossRef]
  31. DeBor, D.W.; Monnens, M.J.; Kincaid, D.C. Measurement of sprinkler droplet size. Appl. Engrg. Agr. 2011, 17, 11–115. [Google Scholar] [CrossRef] [Green Version]
  32. Gregory, J.M.; Fedler, C.B. Model evaluation and research verification (MERV). ASAE Paper No. 1986, 86, 5032. [Google Scholar]
  33. Hu, G.; Zhu, X.Y.; Yuan, S.Q.; Zhang, L.G.; Li, Y.F. Comparison of ranges of fluidic sprinkler predicted with BP and RBF neural network models. J. Drain. Irrig. Mach. Eng. 2019, 37, 263–269. [Google Scholar]
  34. Li, J.; Hiroshi, K. Simulating water-droplet movement from noncircular sprinkler nozzles. J. Irrig. Drain. Div. ASCE 1995, 121, 152–185. [Google Scholar] [CrossRef]
  35. Seginer, L.; Kantz, D.; Nir, D. The distortion by the wind of the distribution patterns of single sprinklers. Agric Water Manag. 1991, 19, 314–359. [Google Scholar] [CrossRef]
  36. Edling, R.J. Kinetic energy, evaporation and wind drift of droplets from low pressure irrigation nozzles. Trans. ASAE 1985, 28, 1543–1550. [Google Scholar] [CrossRef]
  37. Liu, J.P.; Xu, J.E.; Li, T.; Zaman, M. Relationship between solar energy and sprinkler hydraulic performance of solar sprinkler irrigation system. J. Drain. Irrig. Mach. Eng. 2021, 39, 637–642. [Google Scholar]
  38. Nash, J.E.; Sutcliffe, J.V. River flow forecasting through conceptual models. I.A. Discuss. Princ. J. Hydrol. 1970, 10, 282–324. [Google Scholar]
  39. Forst, K.R.; Schwalen, H.C. Evapotranspiration sprinkler irrigation. Trans. ASAE 1960, 3, 18–20.24. [Google Scholar]
Figure 1. Schematic diagram of the droplet trajectory under no wind conditions.
Water 13 03006 g001
Figure 2. Experimental setup in the indoor laboratory.
Water 13 03006 g002
Figure 3. A graphical comparison of the measured versus predicted droplet size diameter for different 4, 5 and 6 mm. (a) 4 mm nozzle size; (b) 5 mm nozzle size; (c) 6 mm nozzle size; (d) 7 mm nozzle size.
Water 13 03006 g003
Figure 4. Comparison of the measured versus predicted droplet sizes for different pressures (a) 150, (b) 200, (c) 250 and (d) 300 kPa.
Water 13 03006 g004
Figure 5. Comparison between experiment, simulated and Molle et al. (2012) [7]. (a) 150 kPa, (b) 200 kPa, (c) 250 kPa, and (d) 300 kPa.
Water 13 03006 g005
Figure 6. Effect of wind speed on droplet size distribution compared with zero wind conditions at constant pressure (150 kPa).
Water 13 03006 g006
Table 1. Arithmetic mean droplet size diameter (mm) for different nozzle sizes and operating pressures.
Pressure (kPa)Nozzle Size (mm)Distance from Sprinkler (m)
24681012
15040.350.741.31.52.62.81
50.780.941.362.483.033.11
60.650.961.532.313.03.2
70.510.831.52.42.452.7
20040.310.751.231.312.362.489
50.460.881.31.82.82.93
60.450.81.321.752.372.51
70.510.831.361.962.392.41
25040.30.720.921.111.532.36
50.420.761.21.722.642.67
60.430.761.241.522.232.45
70.50.81.351.682.312.35
30040.260.680.850.982.032.33
50.410.771.081.602.122.34
60.370.781.041.252.072.31
70.480.81.051.632.2227
Table 2. Indices of the different orifice shapes in predicting droplet diameter.
ParameterNozzle Size (mm)
4567
n41414141
β 0.8520.8430.8410.597
β 1 0.220.270.3220.519
ϖ 0.9310.9810.9670.943
R0.9640.9840.98310.910
R20.9720.98920.9860.956
Γ 0.2140.1920.230.215
Table 3. Indices of the different sprinkler base pressures in predicting droplet diameter.
ParameterPressure (kPa)
150200250300
n20202020
β 0.8620.8230.8410.697
β 1 0.2450.2550.3110.418
ϖ 0.9710.9670.9651.246
R0.9640.9530.9370.912
R20.9810.9750.9730.954
Γ 0.1140.1820.200.218
Publisher’s Note: MDPI stays neutral with regard to jurisdictional claims in published maps and institutional affiliations.

