
Do Water Bodies Show Better Ecological Status in Natura 2000 Protected Areas Than Non-Protected Ones?—The Case of Greece

 ,
,  ,
,  and
and
Abstract
:1. Introduction
2. Materials and Methods
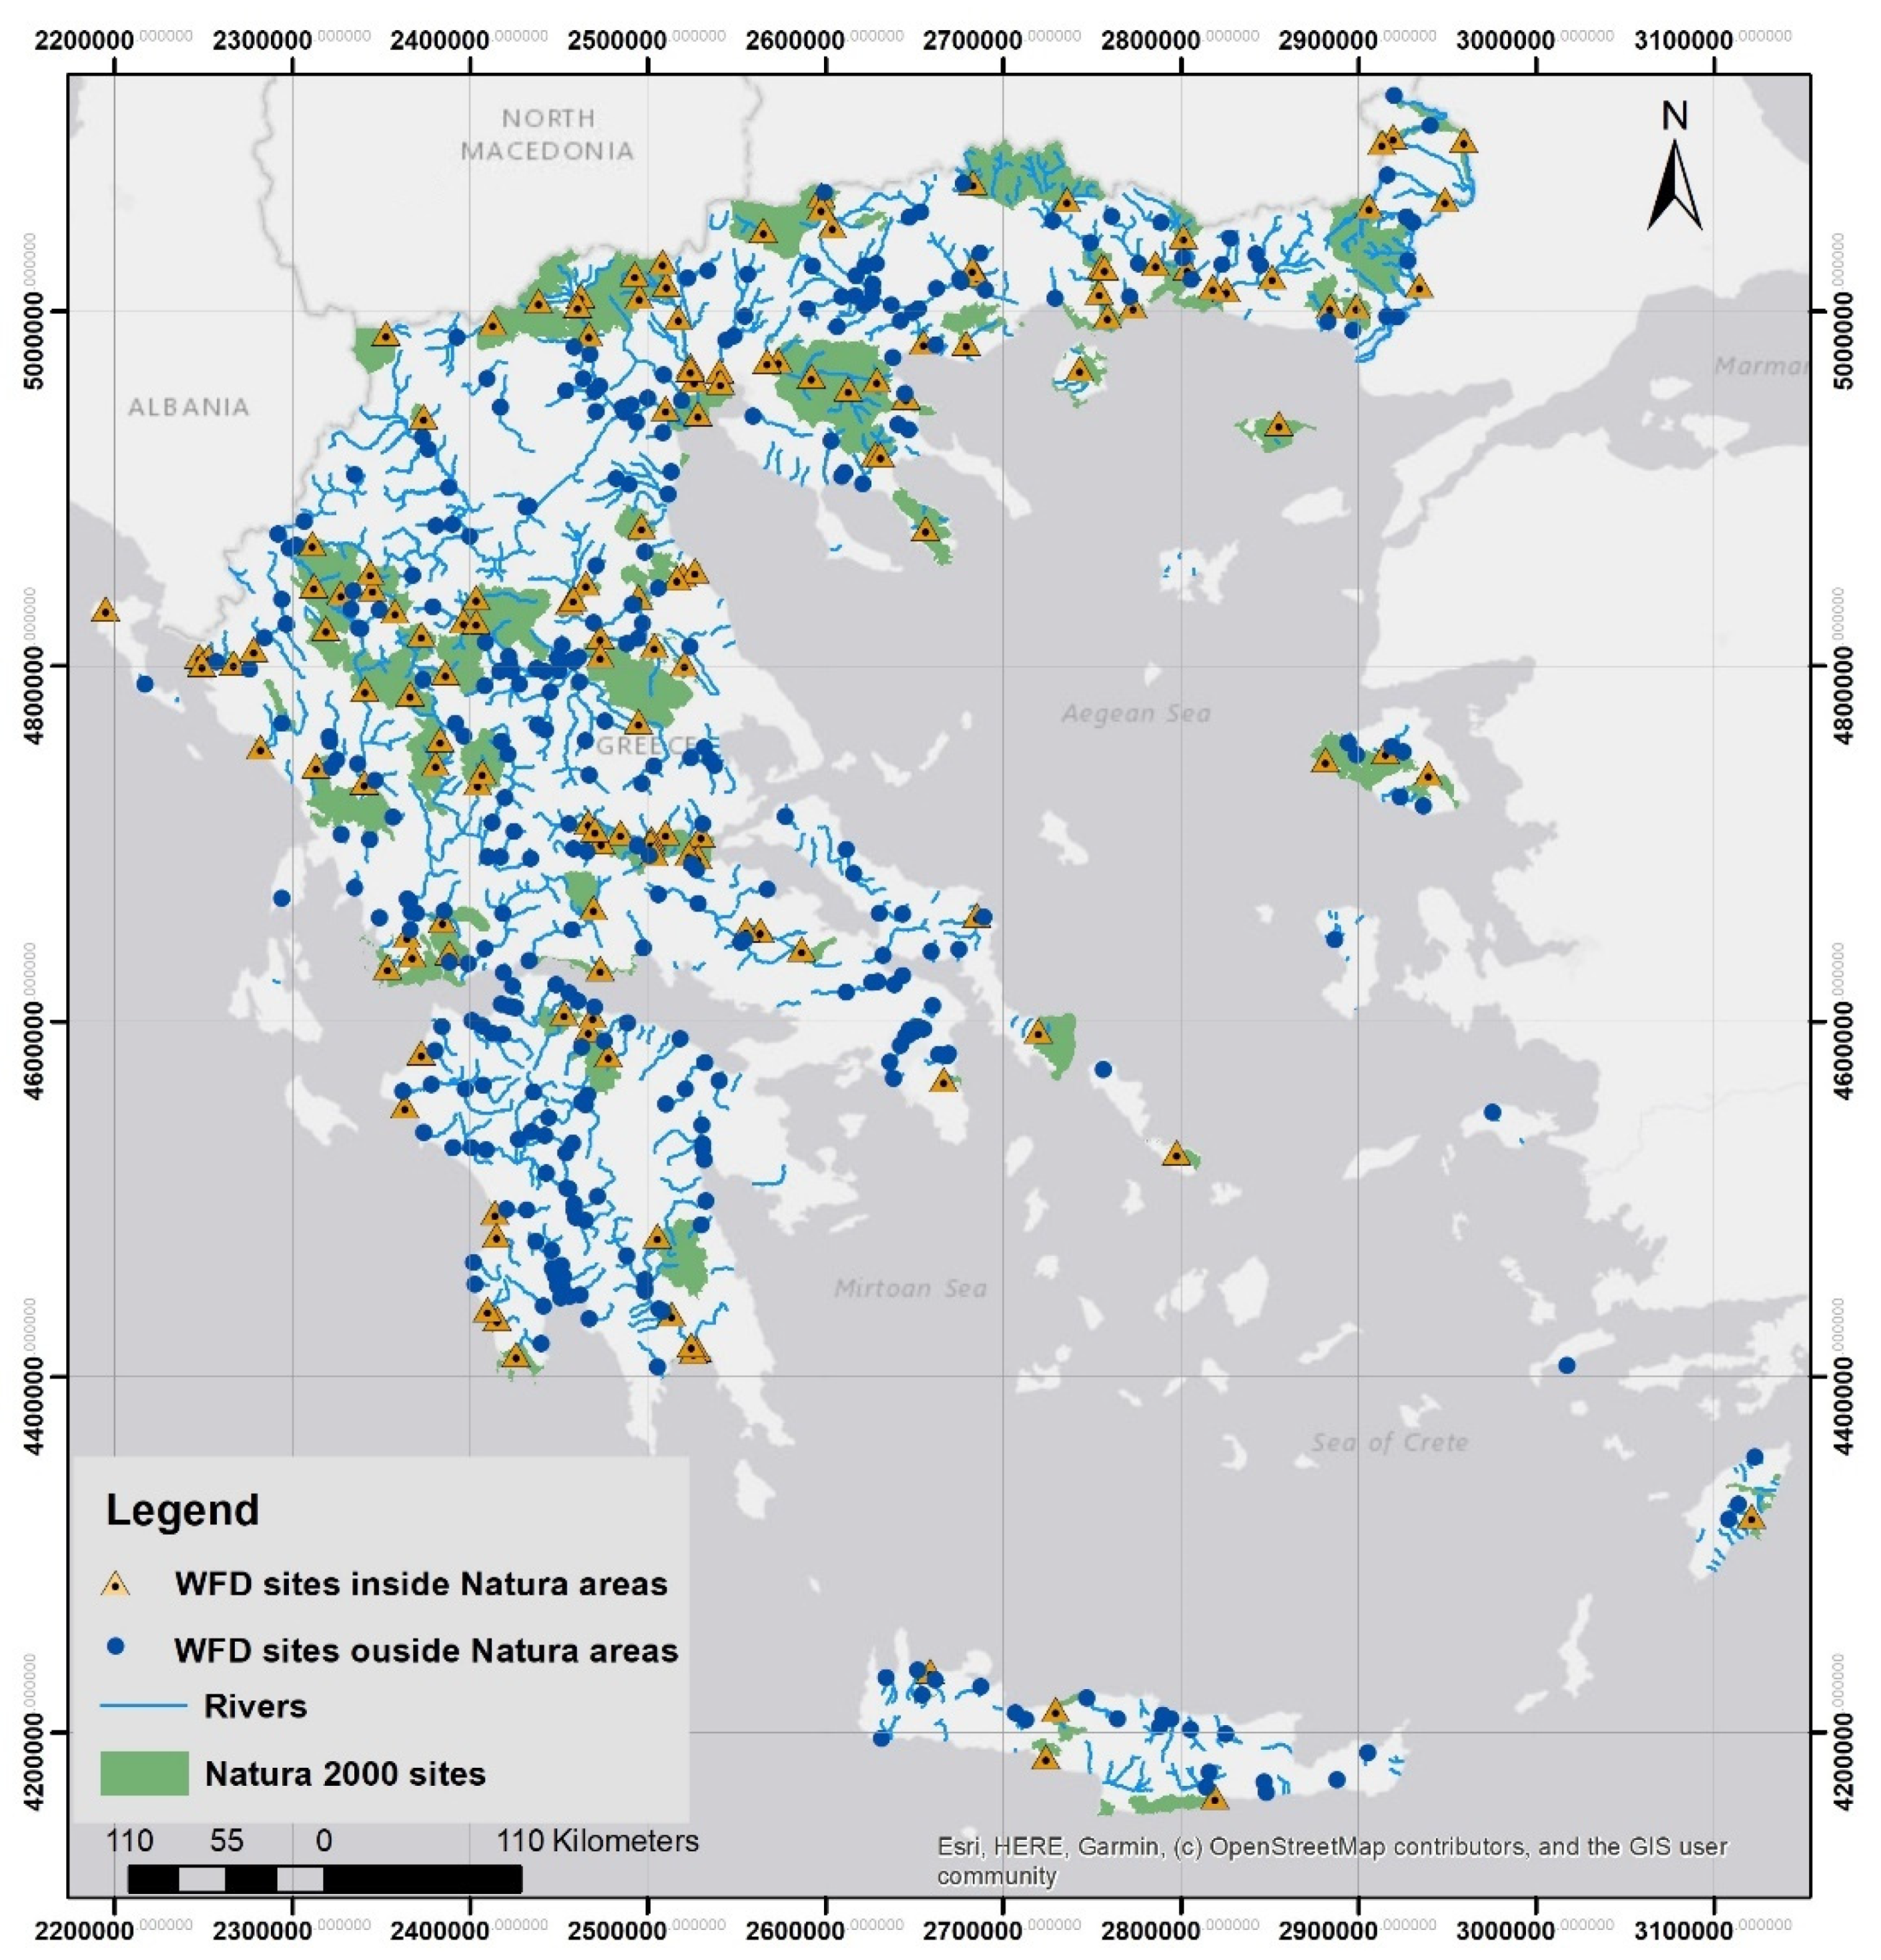
2.1. Study Area
2.2. Compilation of Data
2.3. Statistical Analysis
3. Results
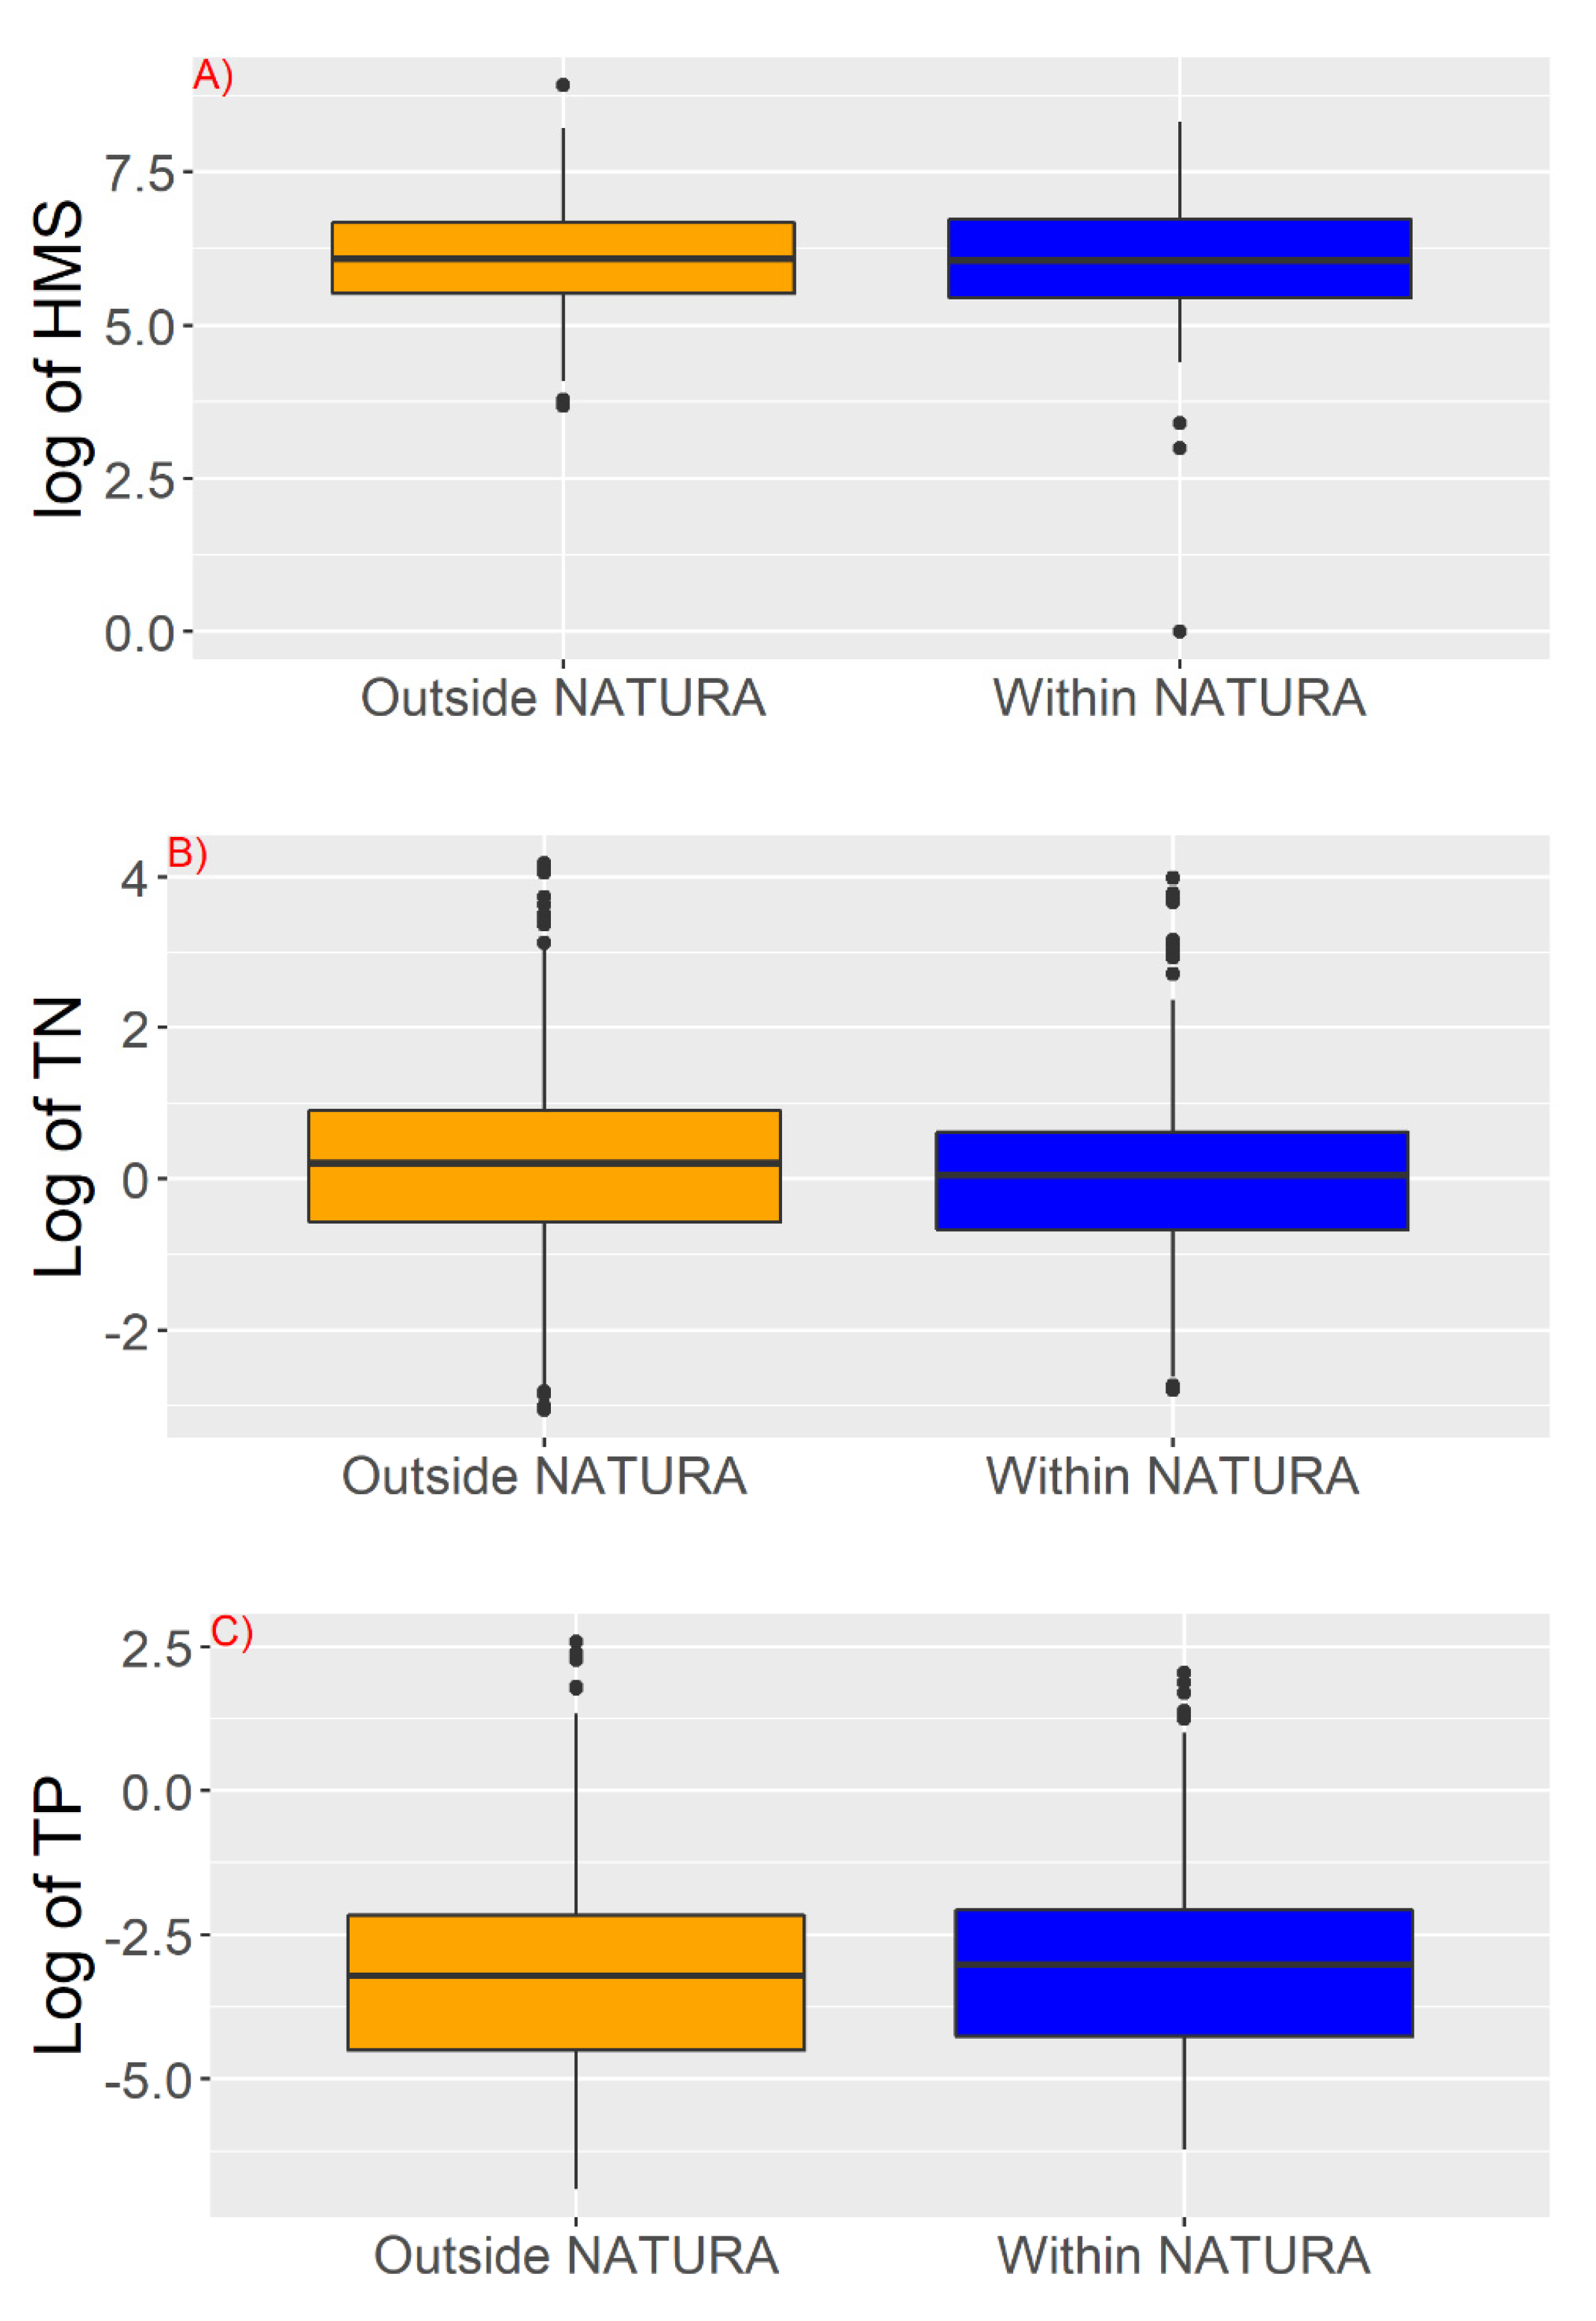
3.1. Water Quality and Hydromorphological Modifications
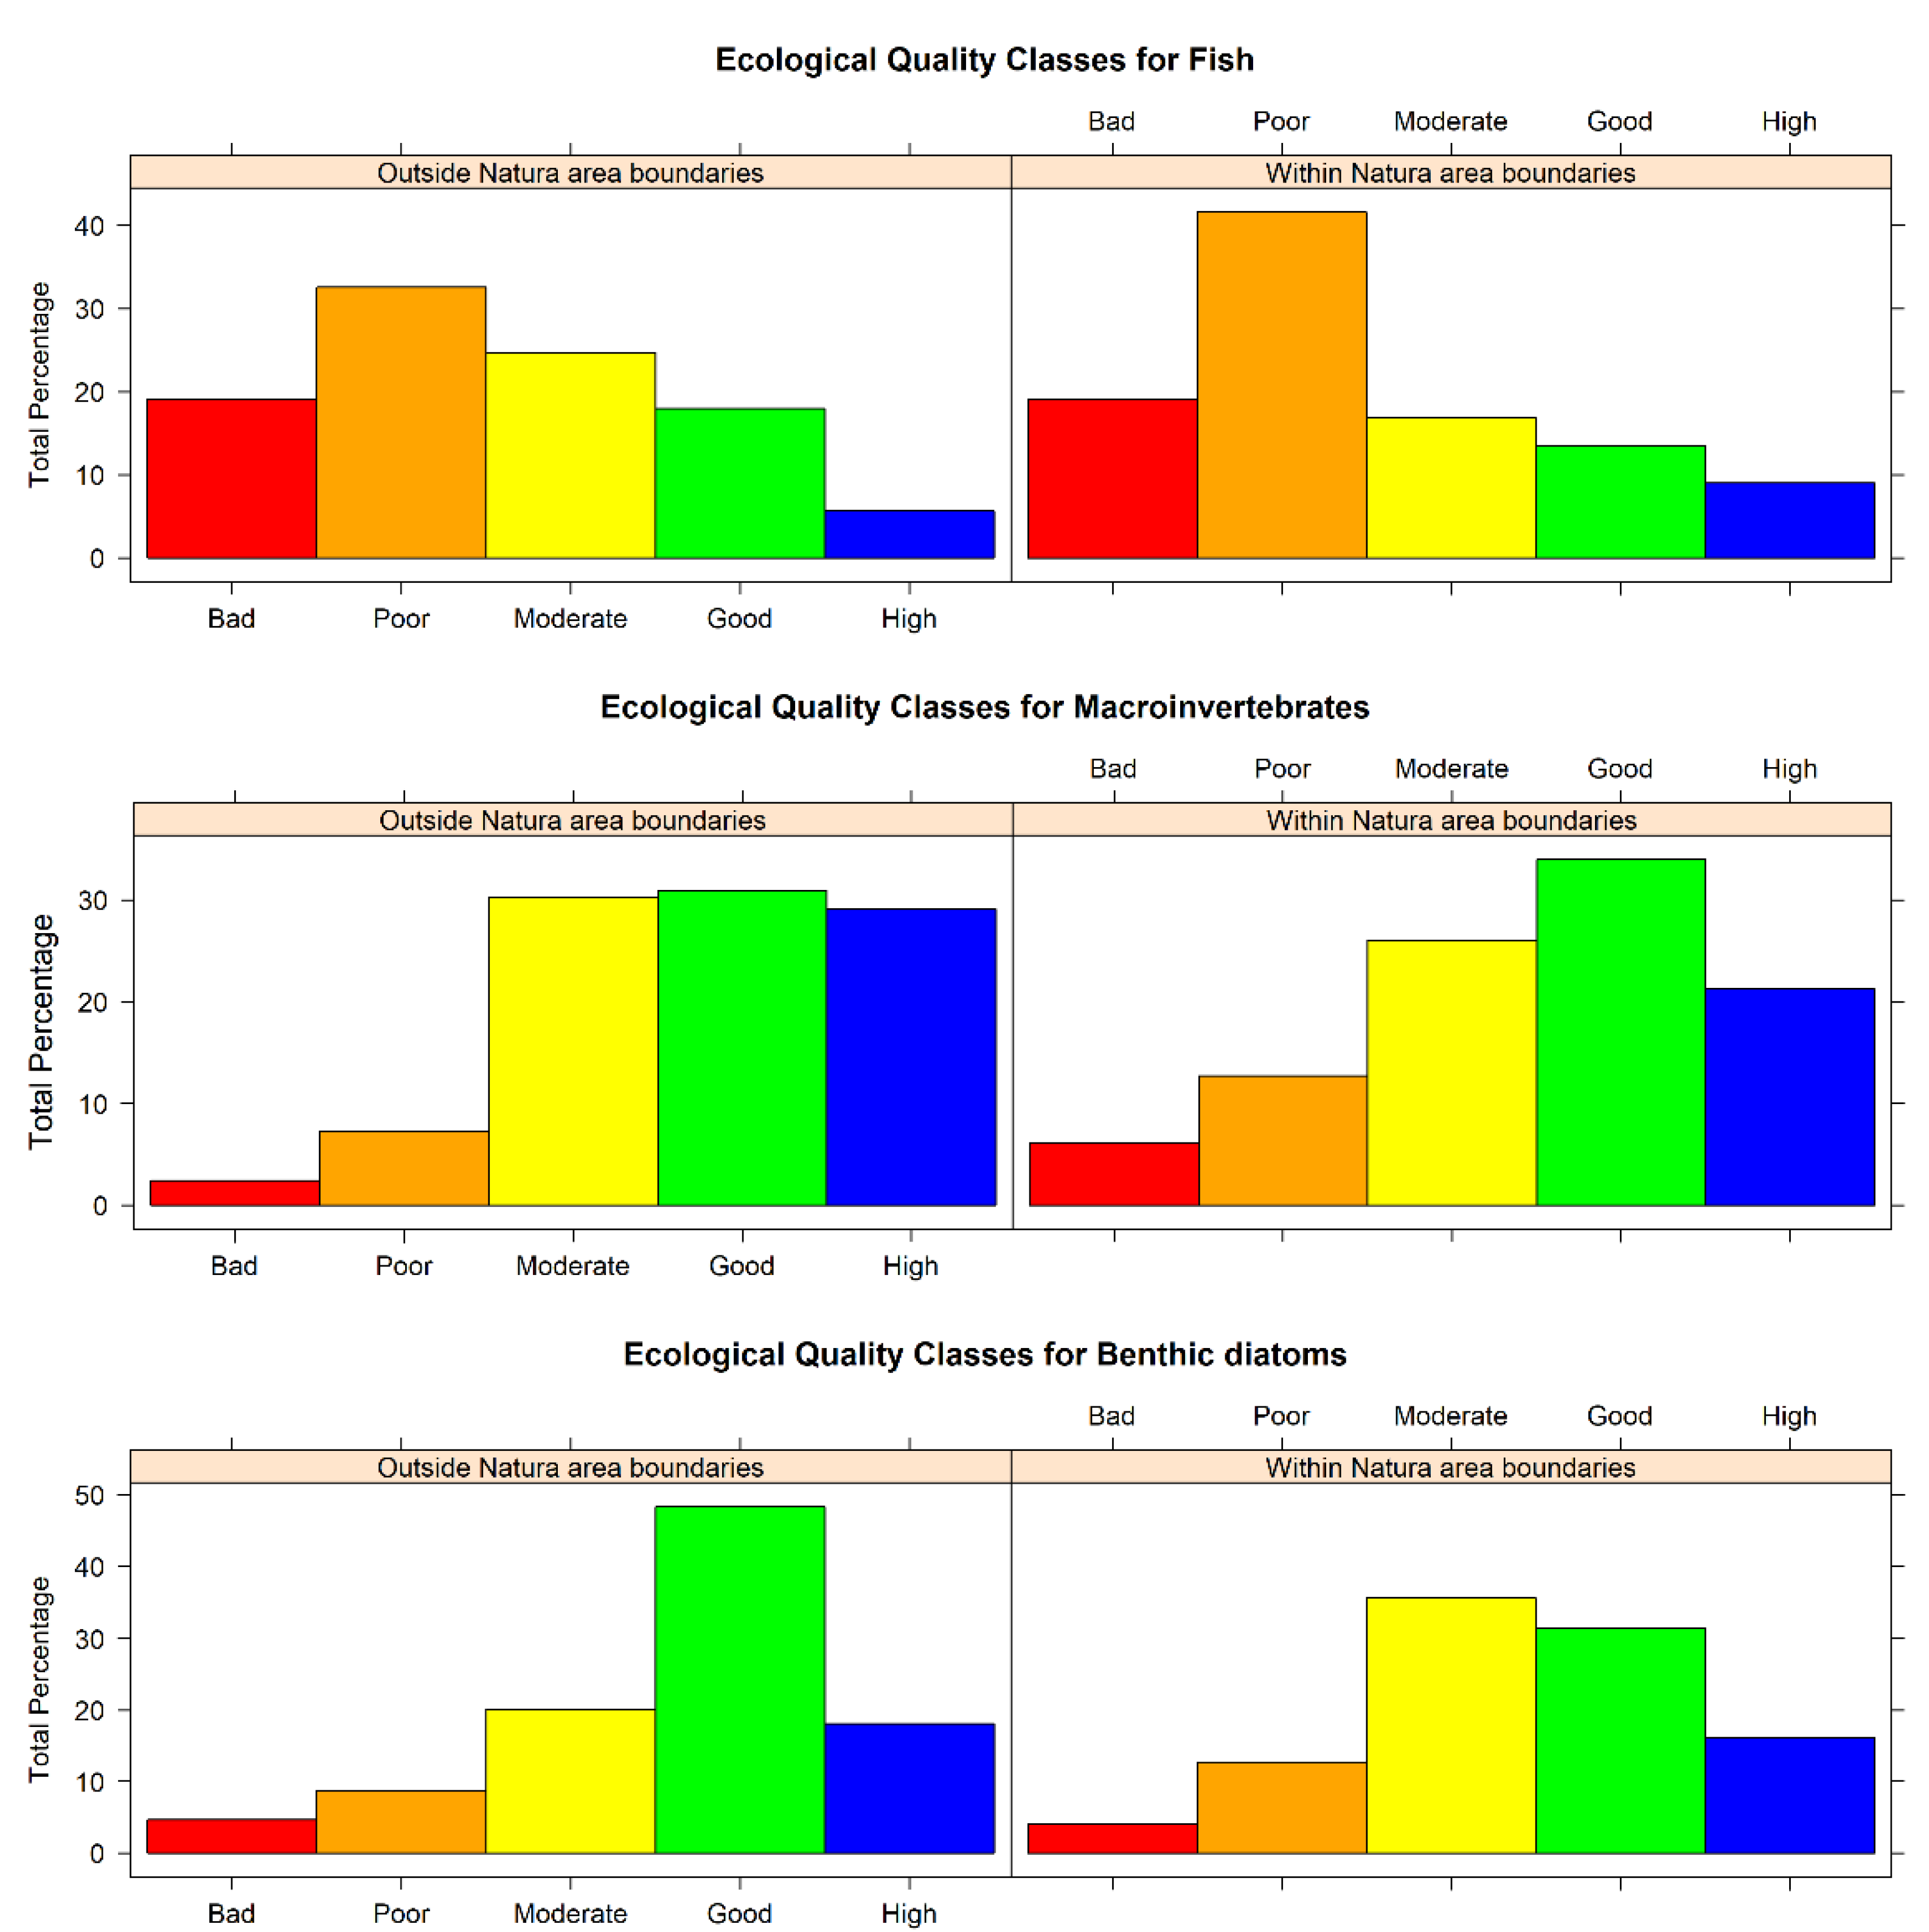
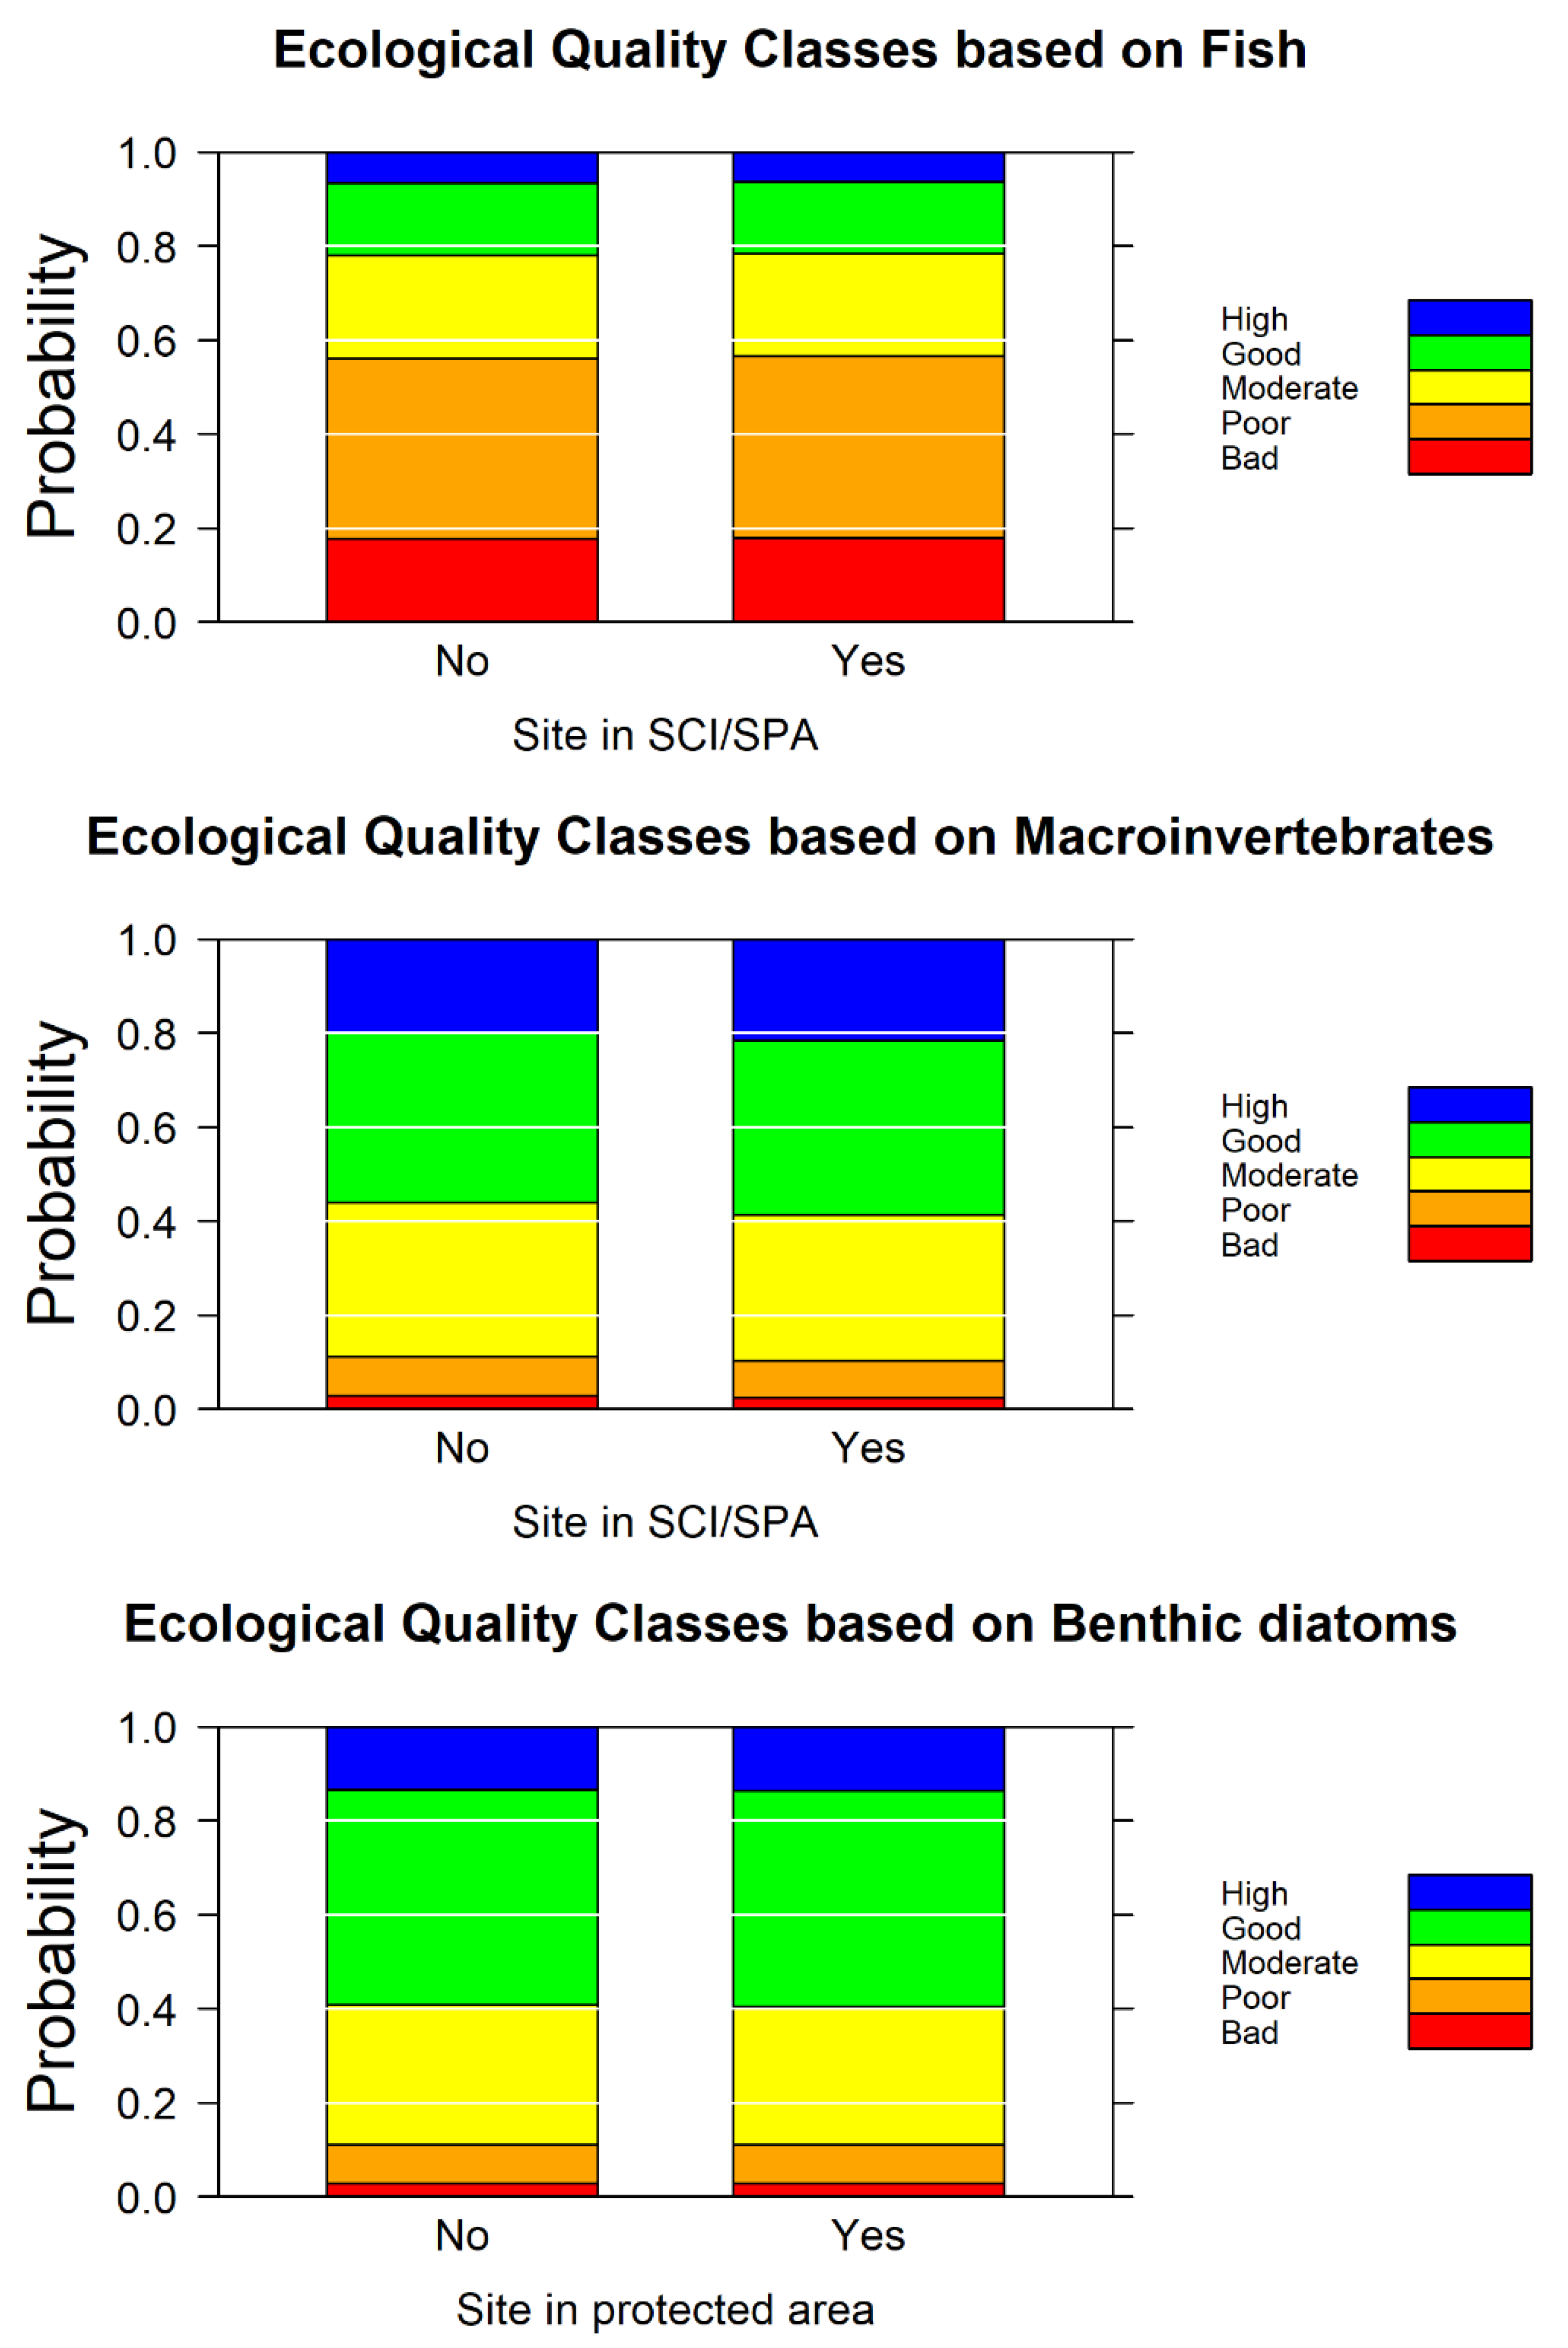
3.2. Ecological Quality within and outside the Natura Network
4. Discussion
5. Conclusions
Author Contributions
Funding
Institutional Review Board Statement
Informed Consent Statement
Acknowledgments
Conflicts of Interest
References
- Gleick, P.H. Water resources. In Encyclopedia of Climate and Weather; Schneider, S., Ed.; Oxford University Press: New York, NY, USA, 1996; pp. 817–823. [Google Scholar]
- Garcia-Moreno, J.; Harrison, I.J.; Dudgeon, D.; Clausnitzer, V.; Darwall, W.; Farrell, T.; Savy, C.; Tockner, K.; Tubbs, N. Sustaining freshwater biodiversity in the Anthropocene. In The Global Water System in the Anthropocene: Challenges for Science and Governance; Springer International Publishing: New York, NY, USA, 2014; pp. 247–270. ISBN 9783319075488. [Google Scholar]
- Reid, A.J.; Carlson, A.K.; Creed, I.F.; Eliason, E.J.; Gell, P.A.; Johnson, P.T.J.; Kidd, K.A.; MacCormack, T.J.; Olden, J.D.; Ormerod, S.J.; et al. Emerging threats and persistent conservation challenges for freshwater biodiversity. Biol. Rev. 2019, 94, 849–873. [Google Scholar] [CrossRef] [Green Version]
- Grizzetti, B.; Pistocchi, A.; Liquete, C.; Udias, A.; Bouraoui, F.; Bund, W. Van de Human pressures and ecological status of European rivers. Sci. Rep. 2017, 2017, 1–11. [Google Scholar] [CrossRef] [Green Version]
- European Commission Council Directive of 2 April 1979 on the conservation of wild birds. Off. J. Eur. Communities 1979, 103, 18. [CrossRef]
- European Commission. Directive 2009/28/EC of the European Parliament and of the Council of 23 April 2009 on the promotion of the use of energy from renewable sources and amending and subsequently repealing Directives 2001/77/EC and 2003/30/EC. Off. J. Eur. Union 2009, 140, 46. [Google Scholar]
- Janauer, G.A.; Albrecht, J.; Stratmann, L. Synergies and conflicts between water framework directive and natura 2000: Legal requirements, technical guidance and experiences from practice. GeoPlanet Earth Planet. Sci. 2015, 15, 9–29. [Google Scholar] [CrossRef] [Green Version]
- Skoulikidis, N.T.; Karaouzas, I.; Amaxidis, Y.; Lazaridou, M.; Zessner, M. Impact of EU Environmental Policy Implementation on the Quality and Status of Greek Rivers. Water 2021, 13, 1858. [Google Scholar] [CrossRef]
- Herbert, M.E.; Mcintyre, P.B.; Doran, P.J.; Allan, J.D.; Abell, R. Terrestrial reserve networks do not adequately represent aquatic ecosystems. Conserv. Biol. 2010, 24, 1002–1011. [Google Scholar] [CrossRef]
- Van Rees, C.B.; Waylen, K.A.; Schmidt-Kloiber, A.; Thackeray, S.J.; Kalinkat, G.; Martens, K.; Domisch, S.; Lillebø, A.I.; Hermoso, V.; Grossart, H.P.; et al. Safeguarding freshwater life beyond 2020: Recommendations for the new global biodiversity framework from the European experience. Conserv. Lett. 2020, 14, 1–17. [Google Scholar] [CrossRef]
- Spiliopoulou, K.; Dimitrakopoulos, P.G.; Brooks, T.M.; Kelaidi, G.; Paragamian, K.; Kati, V.; Oikonomou, A.; Vavylis, D.; Trigas, P.; Lymberakis, P.; et al. The Natura 2000 network and the ranges of threatened species in Greece. Biodivers. Conserv. 2021, 30, 945–961. [Google Scholar] [CrossRef]
- Coates, D. Strategic plan for biodiversity (2011–2020) and the aichi biodiversity targets. In The Wetland Book; Springer: Dordrecht, The Netherlands, 2016; pp. 1–7. [Google Scholar]
- Secretariat of the Convention on Biological Diversity. Global Biodiversity Outlook 2; Montreal, QC, Canada, 2006. [Google Scholar]
- The Intergovernmental Science-Policy Platform on Biodiversity and Ecosystem Services. Summary for Policymakers of the Global Assessment Report on Biodiversity and Ecosystem Services of the Intergovernmental Science-Policy Platform on Biodiversity and Ecosystem Services; IPBES Secretariat: Bonn, Germany, 2019. [Google Scholar]
- CBD. Convention on Biological Diversity. Available online: https://www.cbd.int/conferences/post2020 (accessed on 22 April 2021).
- European Commission. European Commission Directive of the European Parliament and of the Council 2000/60/EC. Establishing a Framework for Community Action in the Field of Water Policy. Off. J. Eur. Parliam. 2000, L327, 1–82. [Google Scholar]
- European Union. The EU Biodiversity Strategy to 2020; European Union: Brussels, Belgium, 2011. [Google Scholar] [CrossRef]
- European Commission. European Commission Links between the Water Framework Directive and Nature Directives: Frequently Asked Questions; European Commission: Brussels, Belgium, 2011. [Google Scholar]
- Sundseth, K. Working towards Creating Synergies between the WFD, MSFD and the Habitats and Birds Directives: Selected Case Studies; Ecosystems LTD/N2K GROUP. October 2015. Available online: https://ec.europa.eu/environment/nature/natura2000/management/docs/Compilation%20WFD%20MSFD%20HBD.pdf (accessed on 15 June 2021).
- European Environment Agency. Management Effectiveness in the EU’s Natura 2000 Network of Protected Areas; European Environment Agency: København, Denmark, 2020. [Google Scholar]
- Piggott, J.J.; Townsend, C.R.; Matthaei, C.D. Reconceptualizing synergism and antagonism among multiple stressors. Ecol. Evol. 2015, 5, 1538–1547. [Google Scholar] [CrossRef] [PubMed]
- MoEE. 5th National Report to the Convention on Biological Diversity. 2016. Available online: https://www.cbd.int/doc/world/gr/gr-nr-05-en.pdf (accessed on 15 June 2021).
- Oikonomou, A.; Stefanidis, K. α- and β-Diversity Patterns of Macrophytes and Freshwater Fishes are Driven by Different Factors and Processes in Lakes of the Unexplored Southern Balkan Biodiversity Hotspot. Water 2020, 12, 1984. [Google Scholar] [CrossRef]
- Oikonomou, A.; Leprieur, F.; Leonardos, I.D. Biogeography of freshwater fishes of the Balkan Peninsula. Hydrobiologia 2014, 738, 205–220. [Google Scholar] [CrossRef]
- OECD. OECD Environmental Performance Reviews: Greece 2020; OECD: Paris, France, 2020; 157p. [Google Scholar] [CrossRef]
- Stefanidis, K.; Latsiou, A.; Kouvarda, T.; Lampou, A.; Kalaitzakis, N.; Gritzalis, K.; Dimitriou, E. Disentangling the Main Components of Hydromorphological Modifications at Reach Scale in Rivers of Greece. Hydrology 2020, 7, 22. [Google Scholar] [CrossRef] [Green Version]
- Latsiou, A.; Kouvarda, T.; Stefanidis, K.; Papaioannou, G.; Gritzalis, K.; Dimitriou, E. Pressures and Status of the Riparian Vegetation in Greek Rivers: Overview and Preliminary Assessment. Hydrology 2021, 8, 55. [Google Scholar] [CrossRef]
- Grilli, L.; Rampichini, C. Ordered logit model. In Encyclopedia of Quality of Life and Well-Being Research; Michalos, A.C., Ed.; Springer: Dordrecht, The Netherlands, 2014; pp. 4510–4513. ISBN 978-94-007-0753-5. [Google Scholar]
- R Core Team. R: A Language and Environment for Statistical Computing; R Core Team: Vienna, Austria, 2020. [Google Scholar]
- Trein, P.; Biesbroek, R.; Bolognesi, T.; Cejudo, G.M.; Duffy, R.; Hustedt, T.; Meyer, I. Policy Coordination and Integration: A Research Agenda. Public Adm. Rev. 2021, 81, 973–977. [Google Scholar] [CrossRef] [Green Version]
- Adam, C.; Steinebach, Y.; Knill, C. Neglected challenges to evidence-based policy-making: The problem of policy accumulation. Policy Sci. 2018, 51, 269–290. [Google Scholar] [CrossRef]
- Bolognesi, T.; Nahrath, S. Environmental Governance Dynamics: Some Micro Foundations of Macro Failures. Ecol. Econ. 2020, 170, 106555. [Google Scholar] [CrossRef]
- Bolognesi, T.; Gerlak, A.K.; Giuliani, G. Explaining and measuring social-ecological pathways: The case of global changes and water security. Sustainability 2018, 10, 4378. [Google Scholar] [CrossRef] [Green Version]
- Lemm, J.U.; Venohr, M.; Globevnik, L.; Stefanidis, K.; Panagopoulos, Y.; van Gils, J.; Posthuma, L.; Kristensen, P.; Feld, C.K.; Mahnkopf, J.; et al. Multiple stressors determine river ecological status at the European scale: Towards an integrated understanding of river status deterioration. Glob. Chang. Biol. 2021, 20, 1962–1975. [Google Scholar] [CrossRef]
- Hale, R.; Piggott, J.J.; Swearer, S.E. Describing and understanding behavioral responses to multiple stressors and multiple stimuli. Ecol. Evol. 2017, 7, 38–47. [Google Scholar] [CrossRef]
- Birk, S.; Chapman, D.; Carvalho, L.; Spears, B.M.; Andersen, H.E.; Argillier, C.; Auer, S.; Baattrup-Pedersen, A.; Banin, L.; Beklioğlu, M.; et al. Impacts of multiple stressors on freshwater biota across spatial scales and ecosystems. Nat. Ecol. Evol. 2020, 4, 1060–1068. [Google Scholar] [CrossRef] [PubMed]
- Spears, B.M.; Chapman, D.; Carvalho, L.; Rankinen, K.; Stefanidis, K.; Ives, S.; Vuorio, K.; Birk, S. Assessing multiple stressor effects to inform climate change management responses in three European catchments. Inland Waters 2021, 1–13. [Google Scholar] [CrossRef]
- Piggott, J.J.; Townsend, C.R.; Matthaei, C.D. Climate warming and agricultural stressors interact to determine stream macroinvertebrate community dynamics. Glob. Chang. Biol. 2015, 21, 1887–1906. [Google Scholar] [CrossRef]
- Spears, B.M.; Chapman, D.S.; Carvalho, L.; Feld, C.K.; Gessner, M.O.; Piggott, J.J.; Banin, L.F.; Gutiérrez-Cánovas, C.; Solheim, A.L.; Richardson, J.A.; et al. Making waves. Bridging theory and practice towards multiple stressor management in freshwater ecosystems. Water Res. 2021, 196, 116981. [Google Scholar] [CrossRef]
- Calapez, A.R.; Serra, S.R.Q.; Santos, J.M.; Branco, P.; Ferreira, T.; Hein, T.; Brito, A.G.; Feio, M.J. The effect of hypoxia and flow decrease in macroinvertebrate functional responses: A trait-based approach to multiple-stressors in mesocosms. Sci. Total Environ. 2018, 637–638, 647–656. [Google Scholar] [CrossRef]
- Carvalho, L.; Mackay, E.B.; Cardoso, A.C.; Baattrup-Pedersen, A.; Birk, S.; Blackstock, K.L.; Borics, G.; Borja, A.; Feld, C.K.; Ferreira, M.T.; et al. Protecting and restoring Europe’s waters: An analysis of the future development needs of the Water Framework Directive. Sci. Total Environ. 2019, 658, 1228–1238. [Google Scholar] [CrossRef]
- Stefanidis, K.; Panagopoulos, Y.; Mimikou, M. Impact assessment of agricultural driven stressors on benthic macroinvertebrates using simulated data. Sci. Total Environ. 2016, 540, 32–42. [Google Scholar] [CrossRef]
- Stefanidis, K.; Papaioannou, G.; Markogianni, V.; Dimitriou, E. Water Quality and Hydromorphological Variability in Greek Rivers: A Nationwide Assessment with Implications for Management. Water 2019, 11, 1680. [Google Scholar] [CrossRef] [Green Version]
- Smeti, E.; von Schiller, D.; Karaouzas, I.; Laschou, S.; Vardakas, L.; Sabater, S.; Tornés, E.; Monllor-Alcaraz, L.S.; Guillem-Argiles, N.; Martinez, E.; et al. Multiple stressor effects on biodiversity and ecosystem functioning in a Mediterranean temporary river. Sci. Total Environ. 2019, 647, 1179–1187. [Google Scholar] [CrossRef] [PubMed]
- European Commission. The Environmental Implementation Review 2019 GREECE; Directorate-General for Environment, European Commission: Brussels, Belgium, 2019. [Google Scholar]
- Loga, M.; Wierzchołowska-Dziedzic, A.; Martyszunis, A. The problem of water body status misclassification-a Hierarchical Approach. Environ. Monit. Assess. 2018, 190, 1–16. [Google Scholar] [CrossRef] [Green Version]
- Snell, M.A.; Barker, P.A.; Surridge, B.W.J.; Benskin, C.M.W.H.; Barber, N.; Reaney, S.M.; Tych, W.; Mindham, D.; Large, A.R.G.; Burke, S.; et al. Strong and recurring seasonality revealed within stream diatom assemblages. Sci. Rep. 2019, 9, 1–7. [Google Scholar] [CrossRef] [Green Version]
- Zogaris, S.; Skoulikidis, N.; Dimitriou, E. River and wetland restoration in Greece: Lessons from biodiversity conservation initiatives. Handb. Environ. Chem. 2018, 59, 403–431. [Google Scholar] [CrossRef]
- Verdonschot, P.F.M.; Spears, B.M.; Feld, C.K.; Brucet, S.; Keizer-Vlek, H.; Borja, A.; Elliott, M.; Kernan, M.; Johnson, R.K. A comparative review of recovery processes in rivers, lakes, estuarine and coastal waters. Hydrobiologia 2013, 704, 453–474. [Google Scholar] [CrossRef]
- Vermaat, J.E.; Wagtendonk, A.J.; Brouwer, R.; Sheremet, O.; Ansink, E.; Brockhoff, T.; Plug, M.; Hellsten, S.; Aroviita, J.; Tylec, L.; et al. Assessing the societal benefits of river restoration using the ecosystem services approach. Hydrobiologia 2016, 769, 121–135. [Google Scholar] [CrossRef] [Green Version]
- Haase, P.; Hering, D.; Jähnig, S.C.; Lorenz, A.W.; Sundermann, A. The impact of hydromorphological restoration on river ecological status: A comparison of fish, benthic invertebrates, and macrophytes. Hydrobiologia 2013, 704, 475–488. [Google Scholar] [CrossRef]
- MoEE. National Biodiversity Strategy & Action Plan; Ministry of Environment, Energy & Climate Change: Athens, Greece, 2014; ISBN 9789607284334.
- Stefanidis, K.; Sarika, M.; Papastegiadou, E. Exploring environmental predictors of aquatic macrophytes in water-dependent Natura 2000 sites of high conservation value: Results from a long-term study of macrophytes in Greek lakes. Aquat. Conserv. Mar. Freshw. Ecosyst. 2019, 29, 1133–1148. [Google Scholar] [CrossRef]
- Weigelhofer, G.; Feldbacher, E.; Trauner, D.; Pölz, E.; Hein, T.; Funk, A. Integrating Conflicting Goals of the EC Water Framework Directive and the EC Habitats Directives into Floodplain Restoration Schemes. Front. Environ. Sci. 2020, 8, 225. [Google Scholar] [CrossRef]
- Schröder, N.J.S.; Newig, J.; Watson, N. Bright Spots for Local WFD Implementation Through Collaboration with Nature Conservation Authorities? Water Altern. 2020, 13, 582–617. [Google Scholar]
- Beunen, R.; van der Knaap, W.G.M.; Biesbroek, G.R. Implementation and integration of EU environmental directives. Experiences from The Netherlands. Environ. Policy Gov. 2009, 19, 57–69. [Google Scholar] [CrossRef]
- Lehtoranta, V.; Louhi, P. Does conservation in Natura 2000 areas promote water quality improvement? Findings from a contingent valuation study on environmental benefits and residents’ preferences. Environ. Sci. Policy 2021, 124, 226–234. [Google Scholar] [CrossRef]


| River Basin District (RBD) | No. of Sites within Protected Area | Total Number of WFD Sites |
|---|---|---|
| GR01 (Western Peloponnese) | 5 | 44 |
| GR02 (Northern Peloponnese) | 6 | 34 |
| GR03 (Eastern Peloponnese) | 5 | 18 |
| GR04 (Western Sterea Ellada) | 14 | 45 |
| GR05 (Epirus) | 17 | 40 |
| GR06 (Attica) | 1 | 13 |
| GR07 (East. Sterea Ellada) | 17 | 44 |
| GR08 (Thessaly) | 15 | 54 |
| GR09 (Western Macedonia) | 9 | 38 |
| GR10 (Central Macedonia) | 20 | 36 |
| GR11 (Eastern Macedonia) | 8 | 35 |
| GR12 (Thrace) | 23 | 46 |
| GR13 (Crete) | 4 | 25 |
| GR14 (Aegean Islands) | 5 | 18 |
| Total | 148 | 490 |
| Chi-Squared | p-Value | |
|---|---|---|
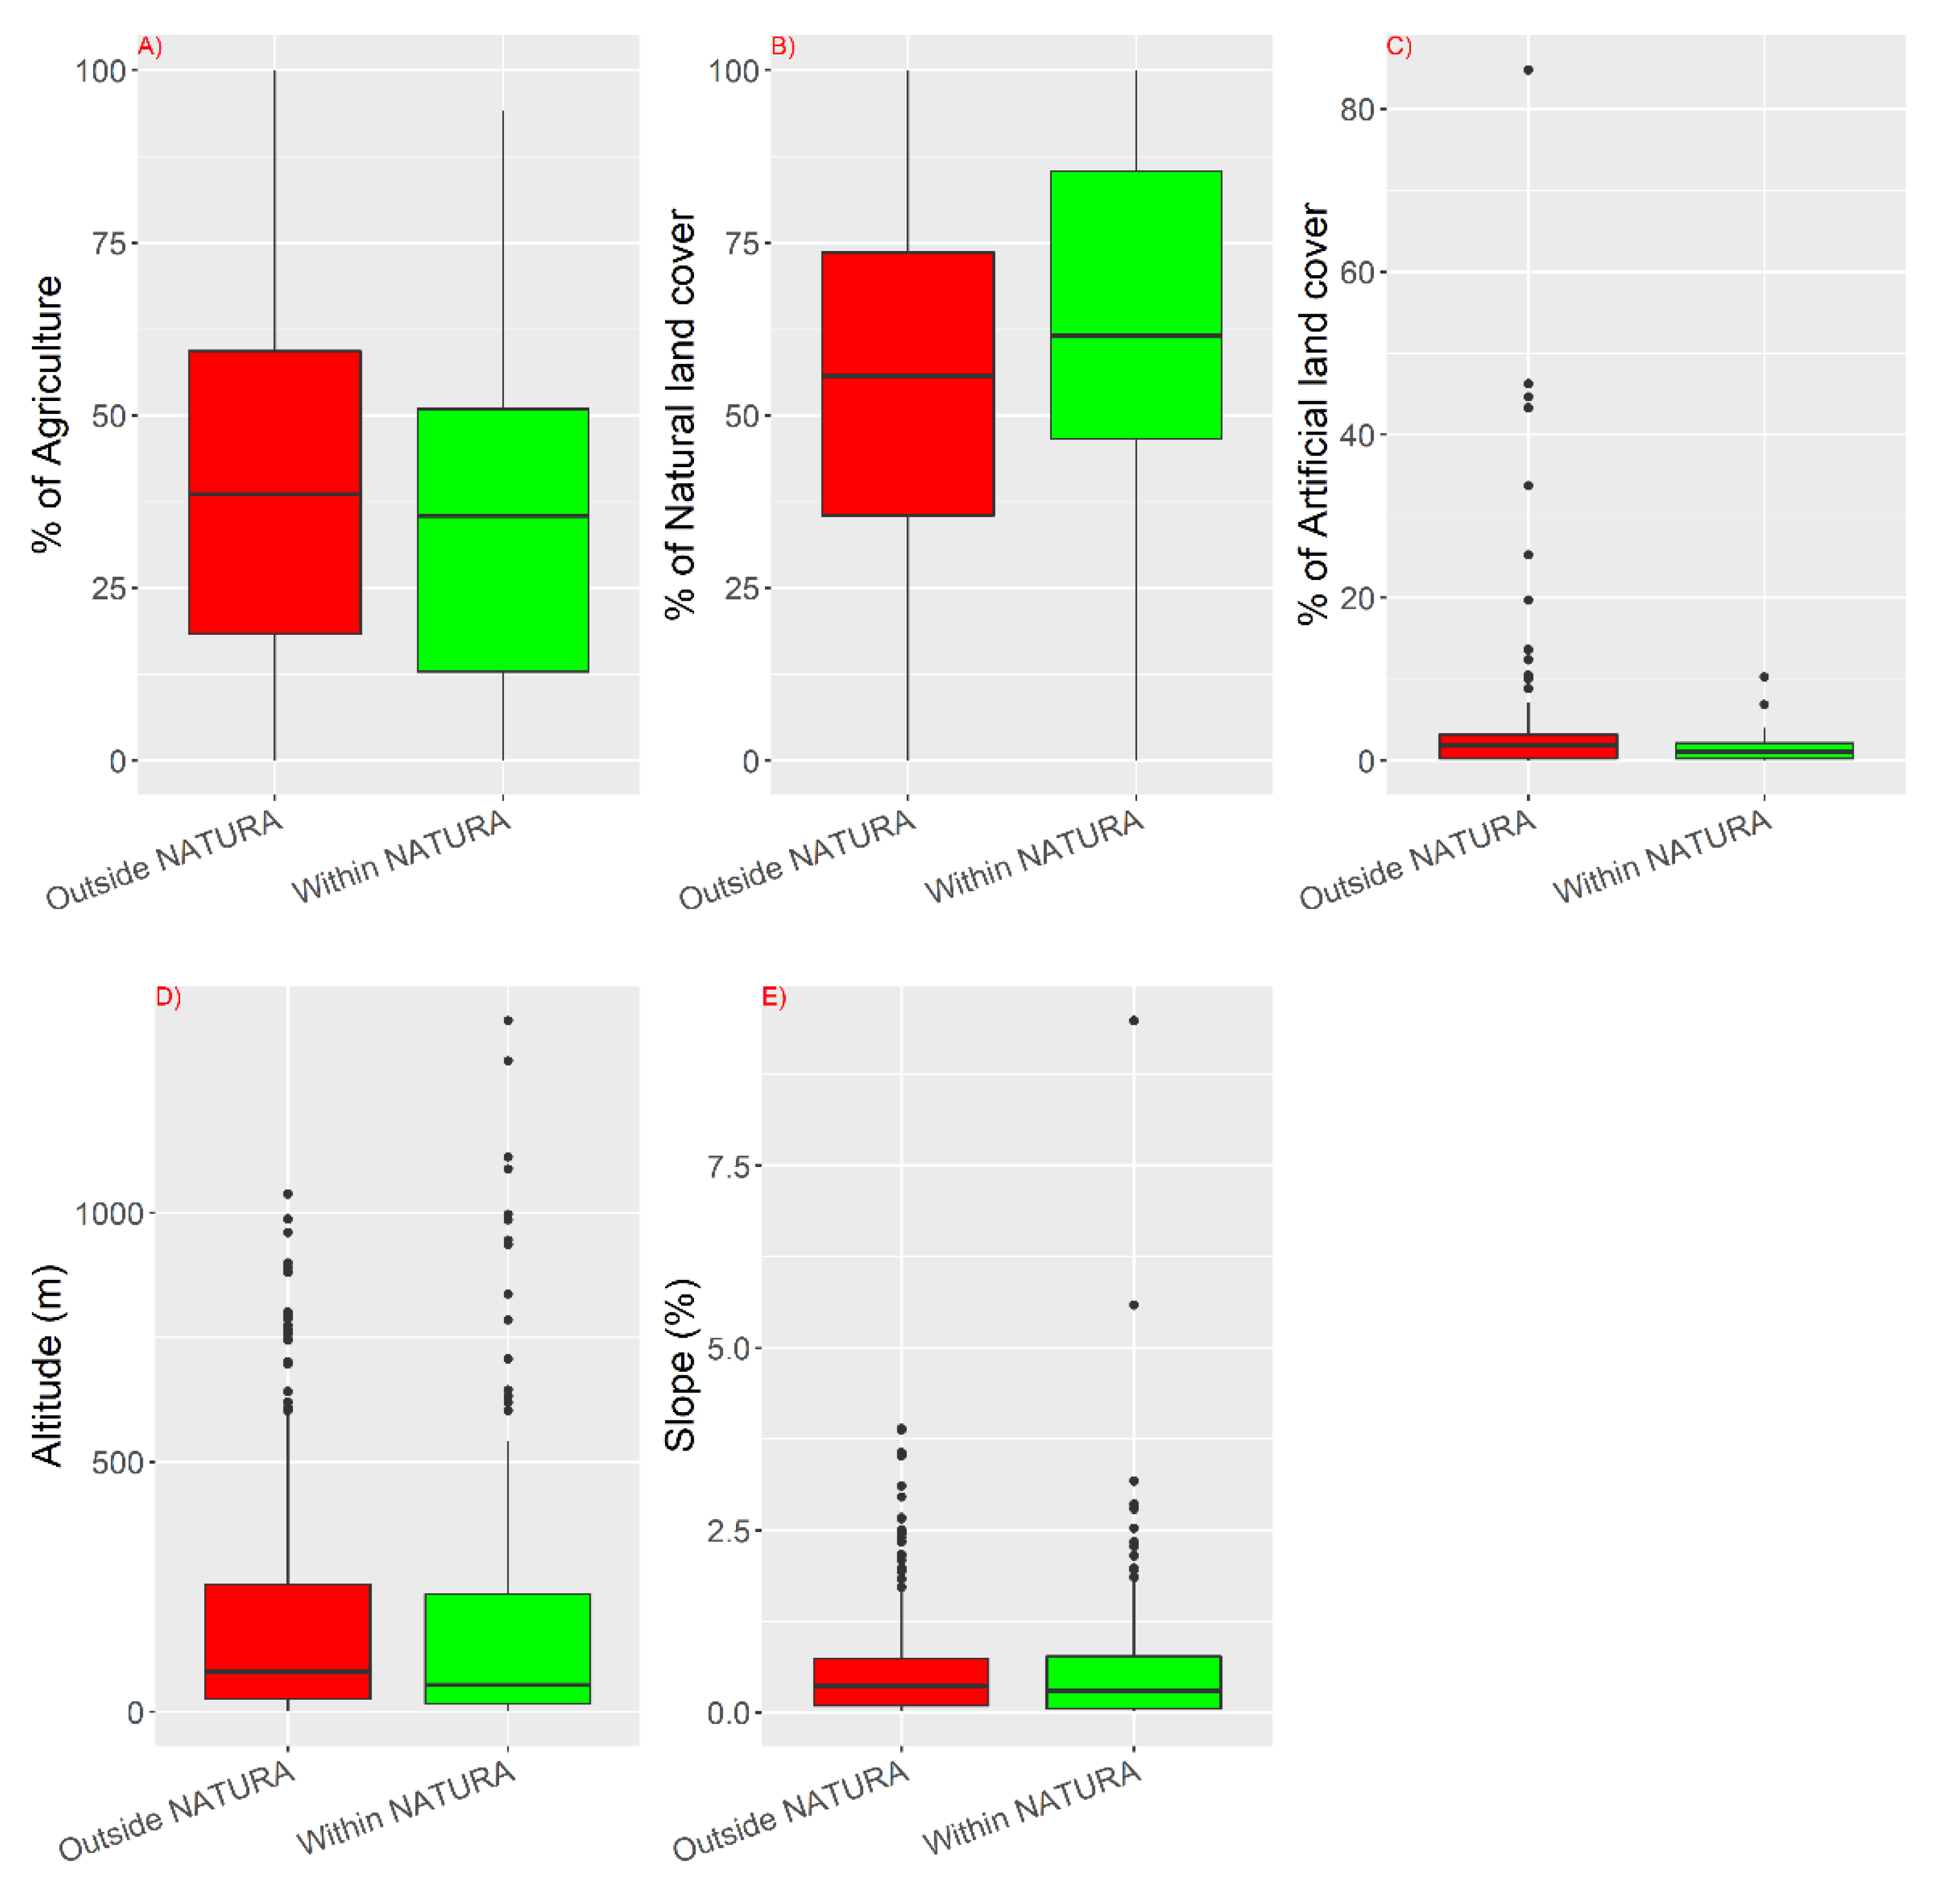
| % Agriculture | 2.385 | 0.123 |
| % Artificial | 3.614 | 0.057 |
| % Near Natural | 4.551 | 0.034 |
| Altitude | 3.6232 | 0.057 |
| Slope % | 2.2602 | 0.133 |
| HMS | 0.255 | 0.631 |
| TN | 6.207 | 0.012 |
| TP | 3.087 | 0.078 |
| Fish | Macroinvertebrates | Diatoms | |
|---|---|---|---|
| Chi-squared | 0.334 | 3.499 | 5.576 |
| p-value | 0.563 | 0.061 | 0.018 |
| Response | Predictors | |||
|---|---|---|---|---|
| Conservation Status | River Type | Sampling Season | Year | |
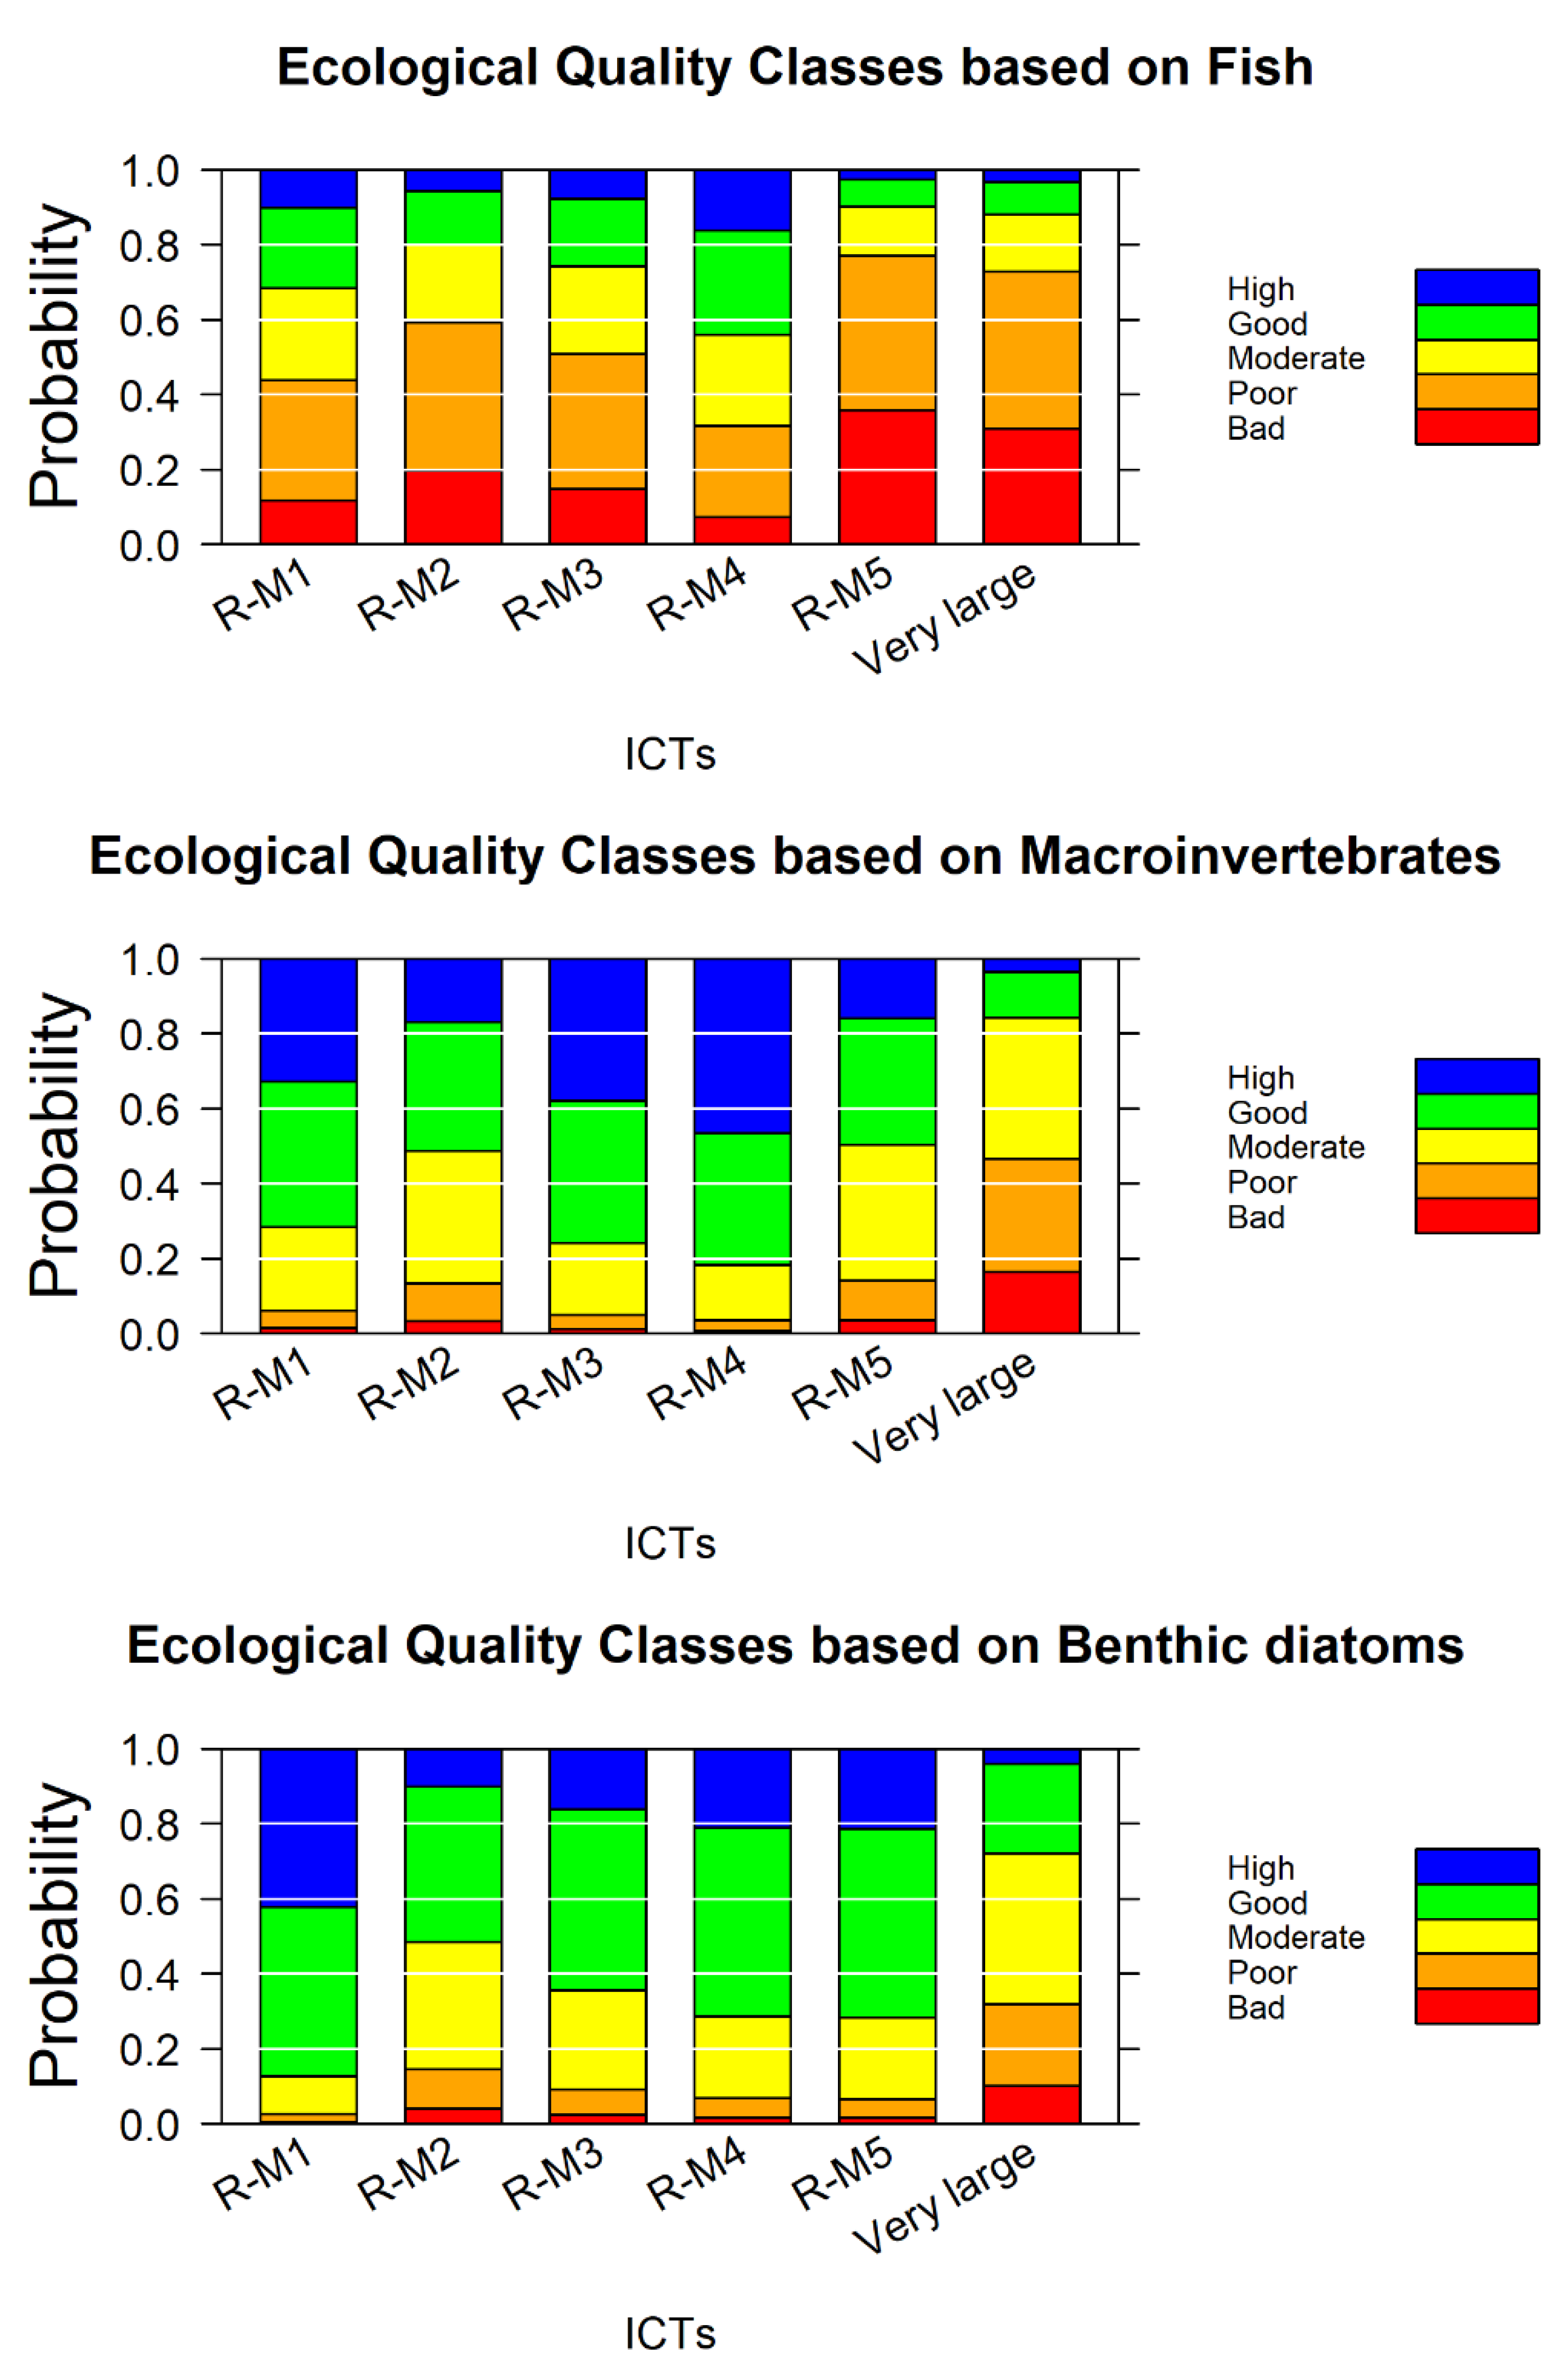
| Ecological quality class based on fish | NS | p = 0.021 | NS | NS |
| Ecological quality class based on macroinvertebrates | NS | p ≤ 0.001 | NS | NS |
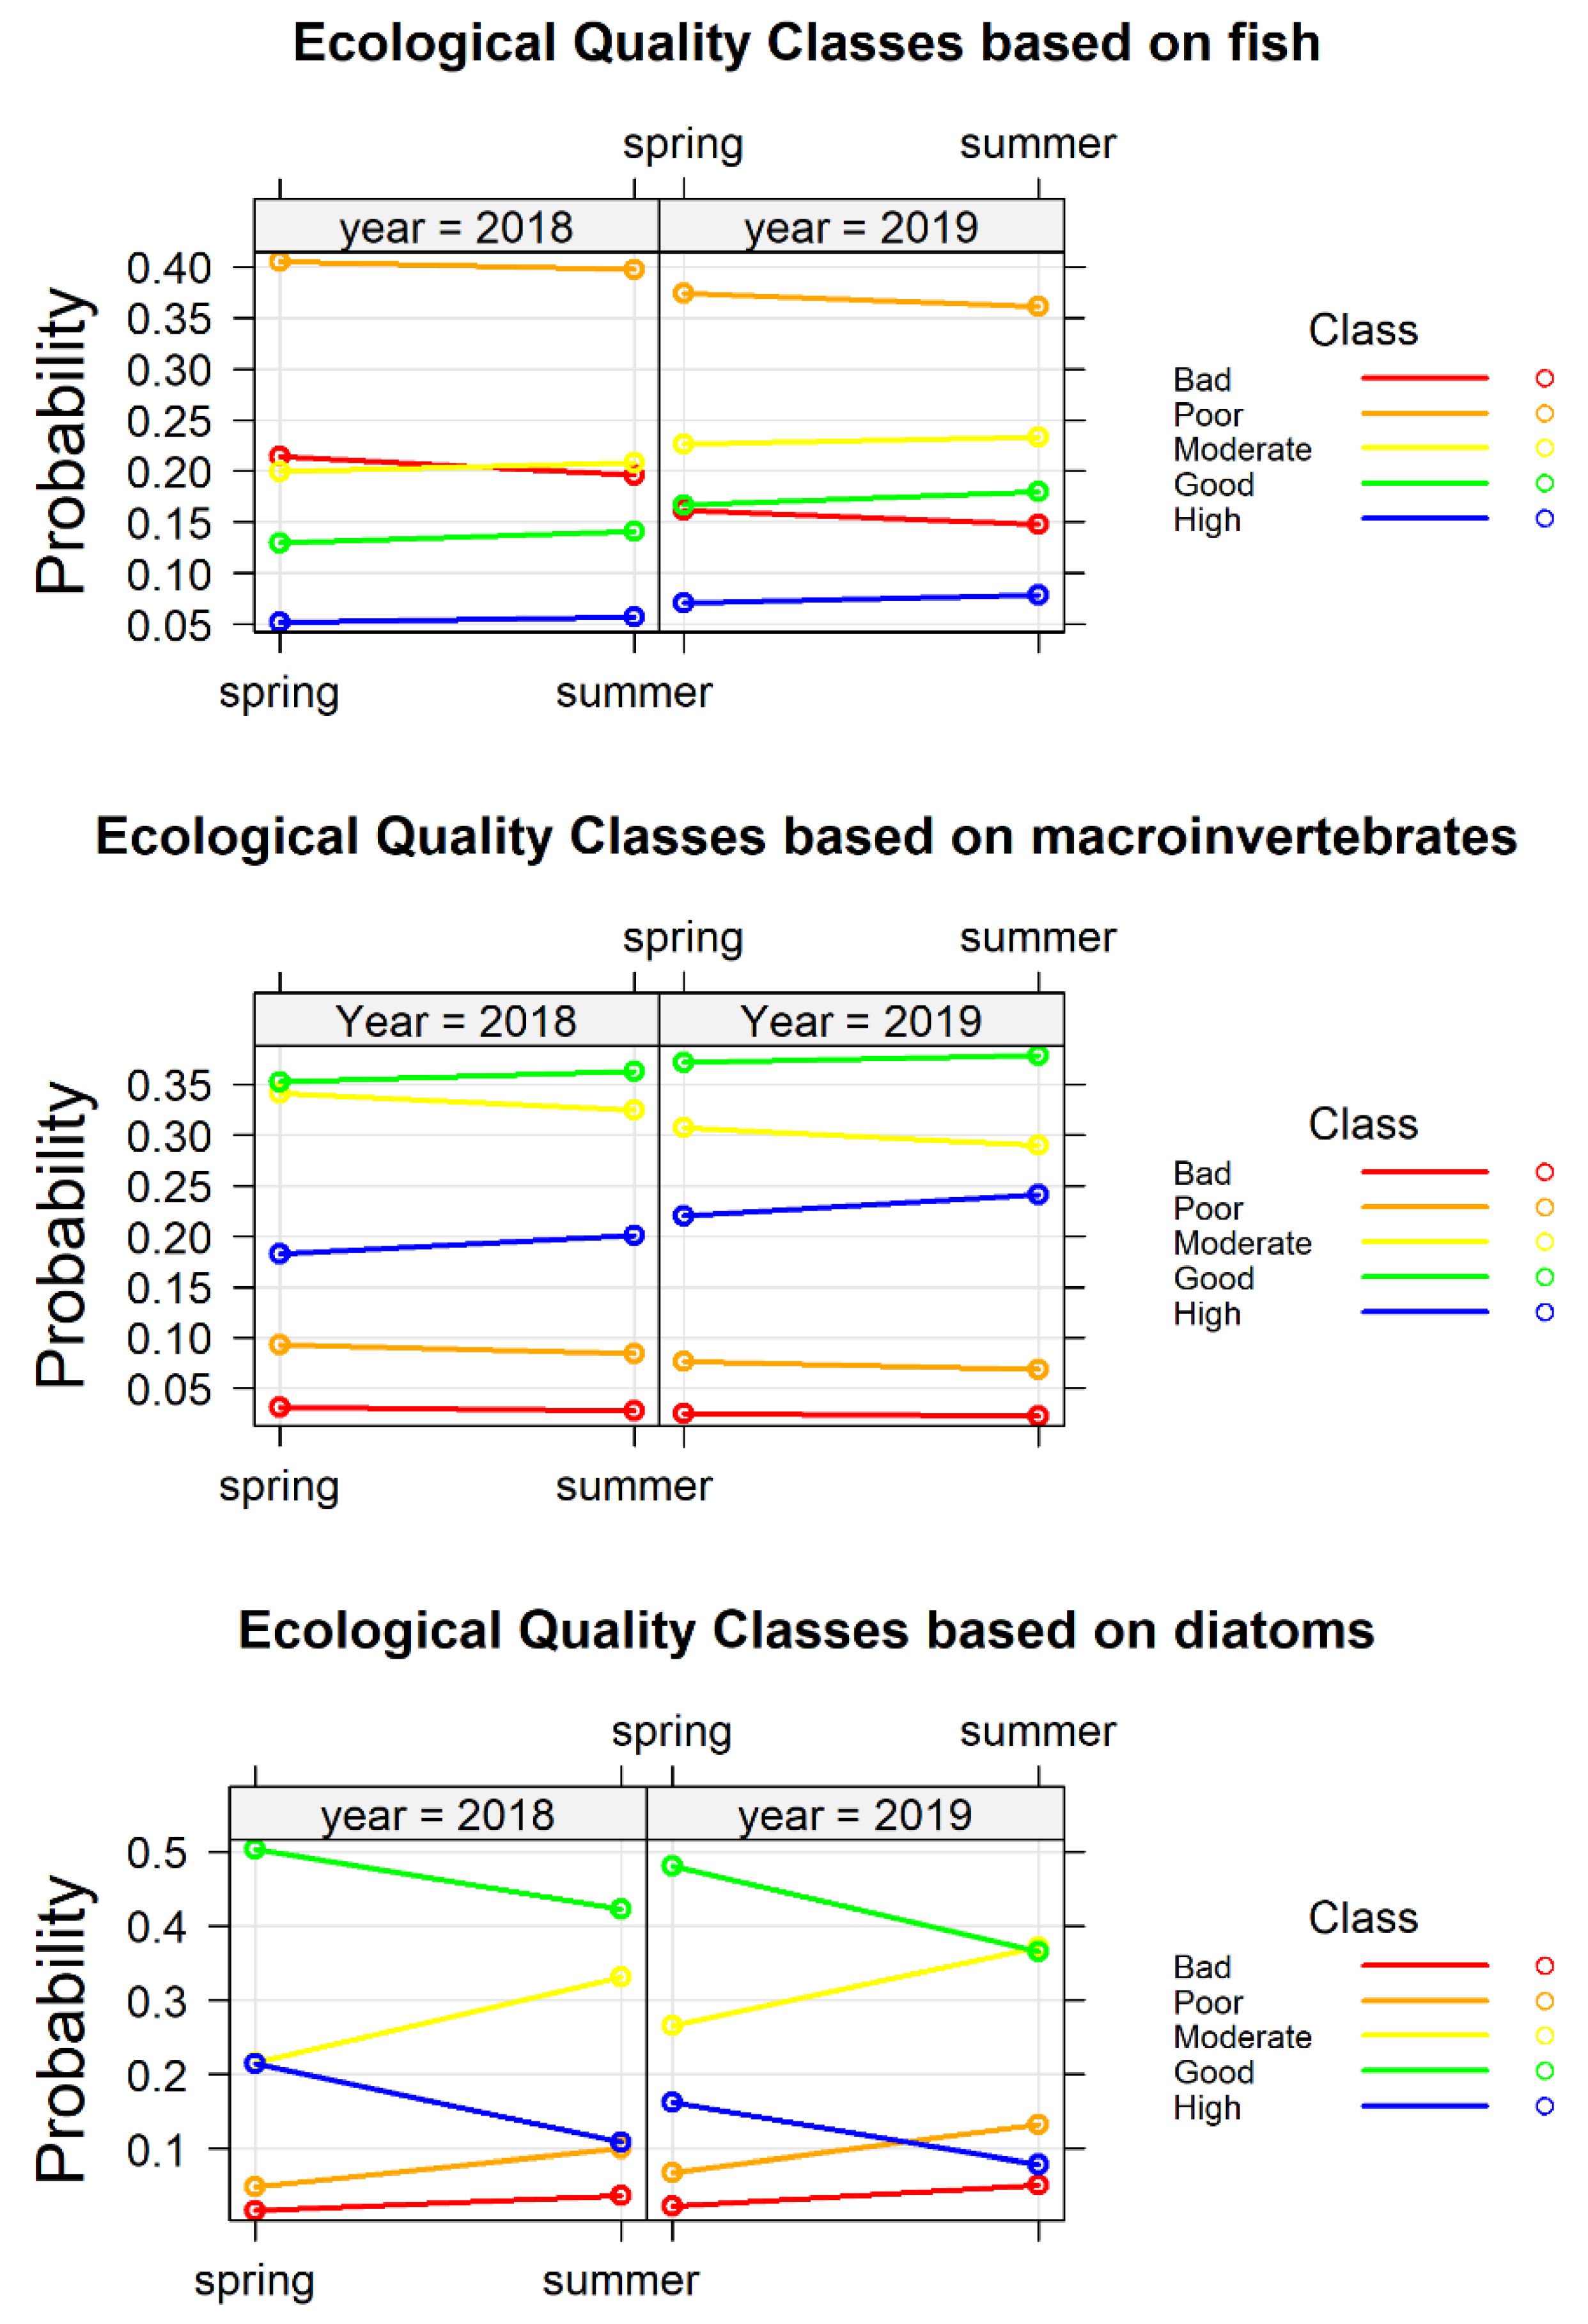
| Ecological quality class based on benthic diatoms | NS | p ≤ 0.001 | p ≤ 0.001 | NS |
Publisher’s Note: MDPI stays neutral with regard to jurisdictional claims in published maps and institutional affiliations. |
© 2021 by the authors. Licensee MDPI, Basel, Switzerland. This article is an open access article distributed under the terms and conditions of the Creative Commons Attribution (CC BY) license (https://creativecommons.org/licenses/by/4.0/).
Share and Cite
Stefanidis, K.; Oikonomou, A.; Stoumboudi, M.; Dimitriou, E.; Skoulikidis, N.T. Do Water Bodies Show Better Ecological Status in Natura 2000 Protected Areas Than Non-Protected Ones?—The Case of Greece. Water 2021, 13, 3007. https://doi.org/10.3390/w13213007
Stefanidis K, Oikonomou A, Stoumboudi M, Dimitriou E, Skoulikidis NT. Do Water Bodies Show Better Ecological Status in Natura 2000 Protected Areas Than Non-Protected Ones?—The Case of Greece. Water. 2021; 13(21):3007. https://doi.org/10.3390/w13213007
Chicago/Turabian StyleStefanidis, Konstantinos, Anthi Oikonomou, Maria Stoumboudi, Elias Dimitriou, and Nikolaos Theodor Skoulikidis. 2021. "Do Water Bodies Show Better Ecological Status in Natura 2000 Protected Areas Than Non-Protected Ones?—The Case of Greece" Water 13, no. 21: 3007. https://doi.org/10.3390/w13213007