Article

Vertical Boundary Mixing Events during Stratification Govern Heat and Nutrient Dynamics in a Windy Tropical Reservoir Lake with Important Water-Level Fluctuations: A Long-Term (2001–2021) Study

by
Martín Merino-Ibarra
1,*,
Jorge A. Ramírez-Zierold
2,
Patricia M. Valdespino-Castillo
3,4,
Fermin S. Castillo-Sandoval
1,
Andrea P. Guzmán-Arias
3,
Mariel Barjau-Aguilar
3,
Emiliano Monroy-Ríos
3,
Luz M. López-Gómez
3,
Arantxa Sacristán-Ramírez
3,5,
José G. Quintanilla-Terminel
3,
Roberto González-De Zayas
6,
Jorge Jimenez-Contreras
7,
María E. Valeriano-Riveros
2,
Gloria Vilaclara-Fatjó
7 and
Salvador Sánchez-Carrillo
8
1
Unidad Académica de Ecología y Biodiversidad Marina, Instituto de Ciencias del Mar y Limnología, Universidad Nacional Autónoma de México, México City 4510, Mexico
2
Patronato ProValle de Bravo A.C., México City 51200, Mexico
3
Posgrado en Ciencias del Mar y Limnología, Universidad Nacional Autónoma de México, México City 4510, Mexico
4
Lawrence Berkeley National Laboratory, MBIB Division, Berkeley, CA 94720, USA
5
Department of Oceanography, College of Geosciences, Texas A&M University, College Station, TX 77843, USA
6
Departamento de Ingeniería Hidráulica, Facultad de Ciencias Técnicas, Universidad de Ciego de Ávila, Carretera a Morón Km 9, Ciego de Ávila 65100, Cuba
7
Facultad de Estudios Superiores Iztacala, Universidad Nacional Autónoma de México, México City 4510, Mexico
8
Departamento de Biogeoquímica y Ecología Microbiana, Museo Nacional de Ciencias Naturales, Consejo Superior de Investigaciones Científicas (MNCN-CSIC), Serrano 115 bis, E-28006 Madrid, Spain
*
Author to whom correspondence should be addressed.
Water 2021, 13(21), 3011; https://doi.org/10.3390/w13213011
Submission received: 11 August 2021 / Revised: 5 October 2021 / Accepted: 20 October 2021 / Published: 27 October 2021

Abstract

:
Physical processes play important roles in controlling eutrophication and oligotrophication. In stratified lakes, internal waves can cause vertical transport of heat and nutrients without breaking the stratification, through boundary mixing events. Such is the case in tropical Valle de Bravo (VB) reservoir lake, where strong diurnal winds drive internal waves, boundary mixing, and hypolimnetic warming during stratification periods. We monitored VB during 21 years (2001–2021) when important water-level fluctuations occurred, affecting mixing and nutrient flux. Stability also varied as a function of water level. Hypolimnetic warming (0.009–0.028 °C day−1) occurred in all the stratifications monitored. We analyzed temperature distributions and modeled the hypolimnion heat budget to assess vertical mixing between layers (0.639–3.515 × 10⁻⁶ m3 day−1), vertical diffusivity coefficient KZ (2.5 × 10⁻⁶–13.6 × 10⁻⁶ m2 s−1), and vertical nutrient transport to the epilimnion. Nutrient flux from the metalimnion to the epilimnion ranged 0.42–5.99 mg P m−2day−1 for soluble reactive phosphorus (SRP) and 5.8–101.7 mg N m−2day−1 for dissolved inorganic nitrogen (DIN). Vertical mixing and the associated nutrient fluxes increase evidently as the water level decreases 8 m below capacity, and they can increase up to fivefold if the water level drops over 12 m. The observed changes related to water level affect nutrient recycling, ecosystemic metabolic balance, and planktonic composition of VB.

1. Introduction

Understanding mechanisms that control eutrophication and oligotrophication is an issue that involves fascinating theoretical and applied possibilities. The vertical exchange between the warm surface layer (epilimnion) and the colder hypolimnion below the thermocline boundary in stratified systems is an understudied critical process that may affect the nutrient dynamics and, consequently, their trophic condition [1]. In lakes characterized by stable stratification, vertical transport of dissolved materials is generally restricted by the metalimnetic barrier. Therefore, in stratified eutrophic lakes, primary producers inhabiting the epilimnion are often limited by the low availability of dissolved nutrients, while in the hypolimnion, concentrations of these elements can be much higher due to the microbial transformation of settling organic material and to their release from the bottom sediments, e.g., [2]. Thus, any physical mechanism responsible for significant cross-metalimnetic upward mass transport will be important in controlling the system’s productivity and its trophic condition.
External loading and deep-water entrainment are usually the two dominant sources of nutrients to lakes at an annual time scale, yet their relative importance during the period of stratification and low nutrient availability is under discussion [3]. As crossing the metalimnetic density barrier requires energy, entrainment—the transport of nutrients from the deep water—has been considered low or negligible during strong stratification [4]. Recent works, however, suggest that the vertical flux of nutrients across the thermocline may be an important driver of epilimnetic metabolism in some stratified lakes [5]. In this case, the energy required has often been shown to come from processes such as wind mixing and shear production within boundary layers of the lake [6]. Intense periodical winds can drive internal waves, which can cause increased dissipation of turbulent kinetic energy, both at the periphery and the center of the lake [7]. A recent study [8] reports that the synchronization of internal waves can even provoke enhanced shear in the hypolimnion and vertical diffusivity (Kz), reaching up to 10−4 m2 s−1. Nevertheless, processes driving the enhancement of boundary mixing events and hypolimnetic entrainment are still understudied, and even more seldom approached in tropical lakes [9,10].
This kind of process likely occurs in Valle de Bravo (VB) [11], a deep monomictic tropical reservoir lake in Central Mexico, which is daily swept by strong diurnal (12:00 a.m.–19:00 p.m.) winds (7.4–16.5 m s−1). Important vertical diurnal displacements of the thermocline at the extremes of the reservoir lake reveal the internal waves driven by diel winds in VB [12]. Through the interaction of the thermocline with the bottom and margins of the lake, these internal waves drive daily boundary mixing events in VB during the stratification period, when hypolimnetic warming occurs [11]. Regular, long-term monitoring of VB has shown that this hypolimnetic warming occurs during every seasonal stratification period. While boundary-mixing events are not strong enough to break the stratification in VB, their cumulative effect drives this observed increase in the hypolimnetic temperature, which varies depending on the intensity and frequency of the mixing events at VB [11,13,14].
Additionally, because VB is a reservoir used for water supply, it exhibits important water level fluctuations (WLFs), as a result of the variations on water demand and on rainfall in its basin [15]. This is a relevant characteristic of VB because it is well known that important WLFs can affect multiple processes in water bodies [9,13,16]. In particular, long-term studies on the metabolic balance of VB have shown that it varies as a function of water level and suggest that low water levels probably intensify the boundary mixing events that occur in VB [14].
In fact, it is well known that mixing processes and their variability can significantly affect multiple aspects, including nutrient availability and budgets [5,7,9,11,15], ecosystem metabolism [5,14], as well as plankton composition and dominance [13,17] in all kinds of water bodies. In VB, there are, additionally, other important management issues—such as toxic cyanobacterial blooms—that challenge its value and use as a touristic hot spot [11], which are also affected by these mixing processes and their variability associated with WLFs. This has been outlined as a broadly found issue by [9], who stressed that the response of aquatic ecosystems, particularly deep lakes, to WLFs is an understudied field of crucial importance to the management of water resources.
As important WLFs have been occurring in VB in the past two decades, their long-term study can contribute to the understanding of their effects on mixing and biogeochemical processes. Such an understanding can be useful to cope with the eutrophication of deep monomictic lakes and reservoirs, which is an urgent management issue [18]. We monitored this reservoir lake for over 21 years, and in this study, we (1) report on the variability of temperature distributions in the water column of the windy reservoir lake of VB and (2) used the hypolimnetic temperature increase rates observed during each of the stratification periods to calculate the vertical mixing, the coefficient of vertical eddy diffusivity (Kz), and the vertical nutrient entrainment into the epilimnetic zone for each stratification of 2001–2021. As nutrients are non-conservative and rapidly affected by multiple processes (e.g., [19,20,21,22]), we did not compare these fluxes with the epilimnetic nutrient concentrations but rather with the changes in its biogeochemical processes and communities. Such a long-term series reveals the variation in the intensity of water mixing and nutrient entrainment as a function of water level fluctuations (WLFs). Comprehension of reservoir hydrodynamics is essential for maintaining good water quality and drinking water safety, as well as for predicting future changes [23]. Furthermore, the important ecological effects and implications of vertical mixing variations are discussed so that they can be used, along with other relevant considerations, in the context of the management of tropical lakes and reservoirs [18].

2. Materials and Methods
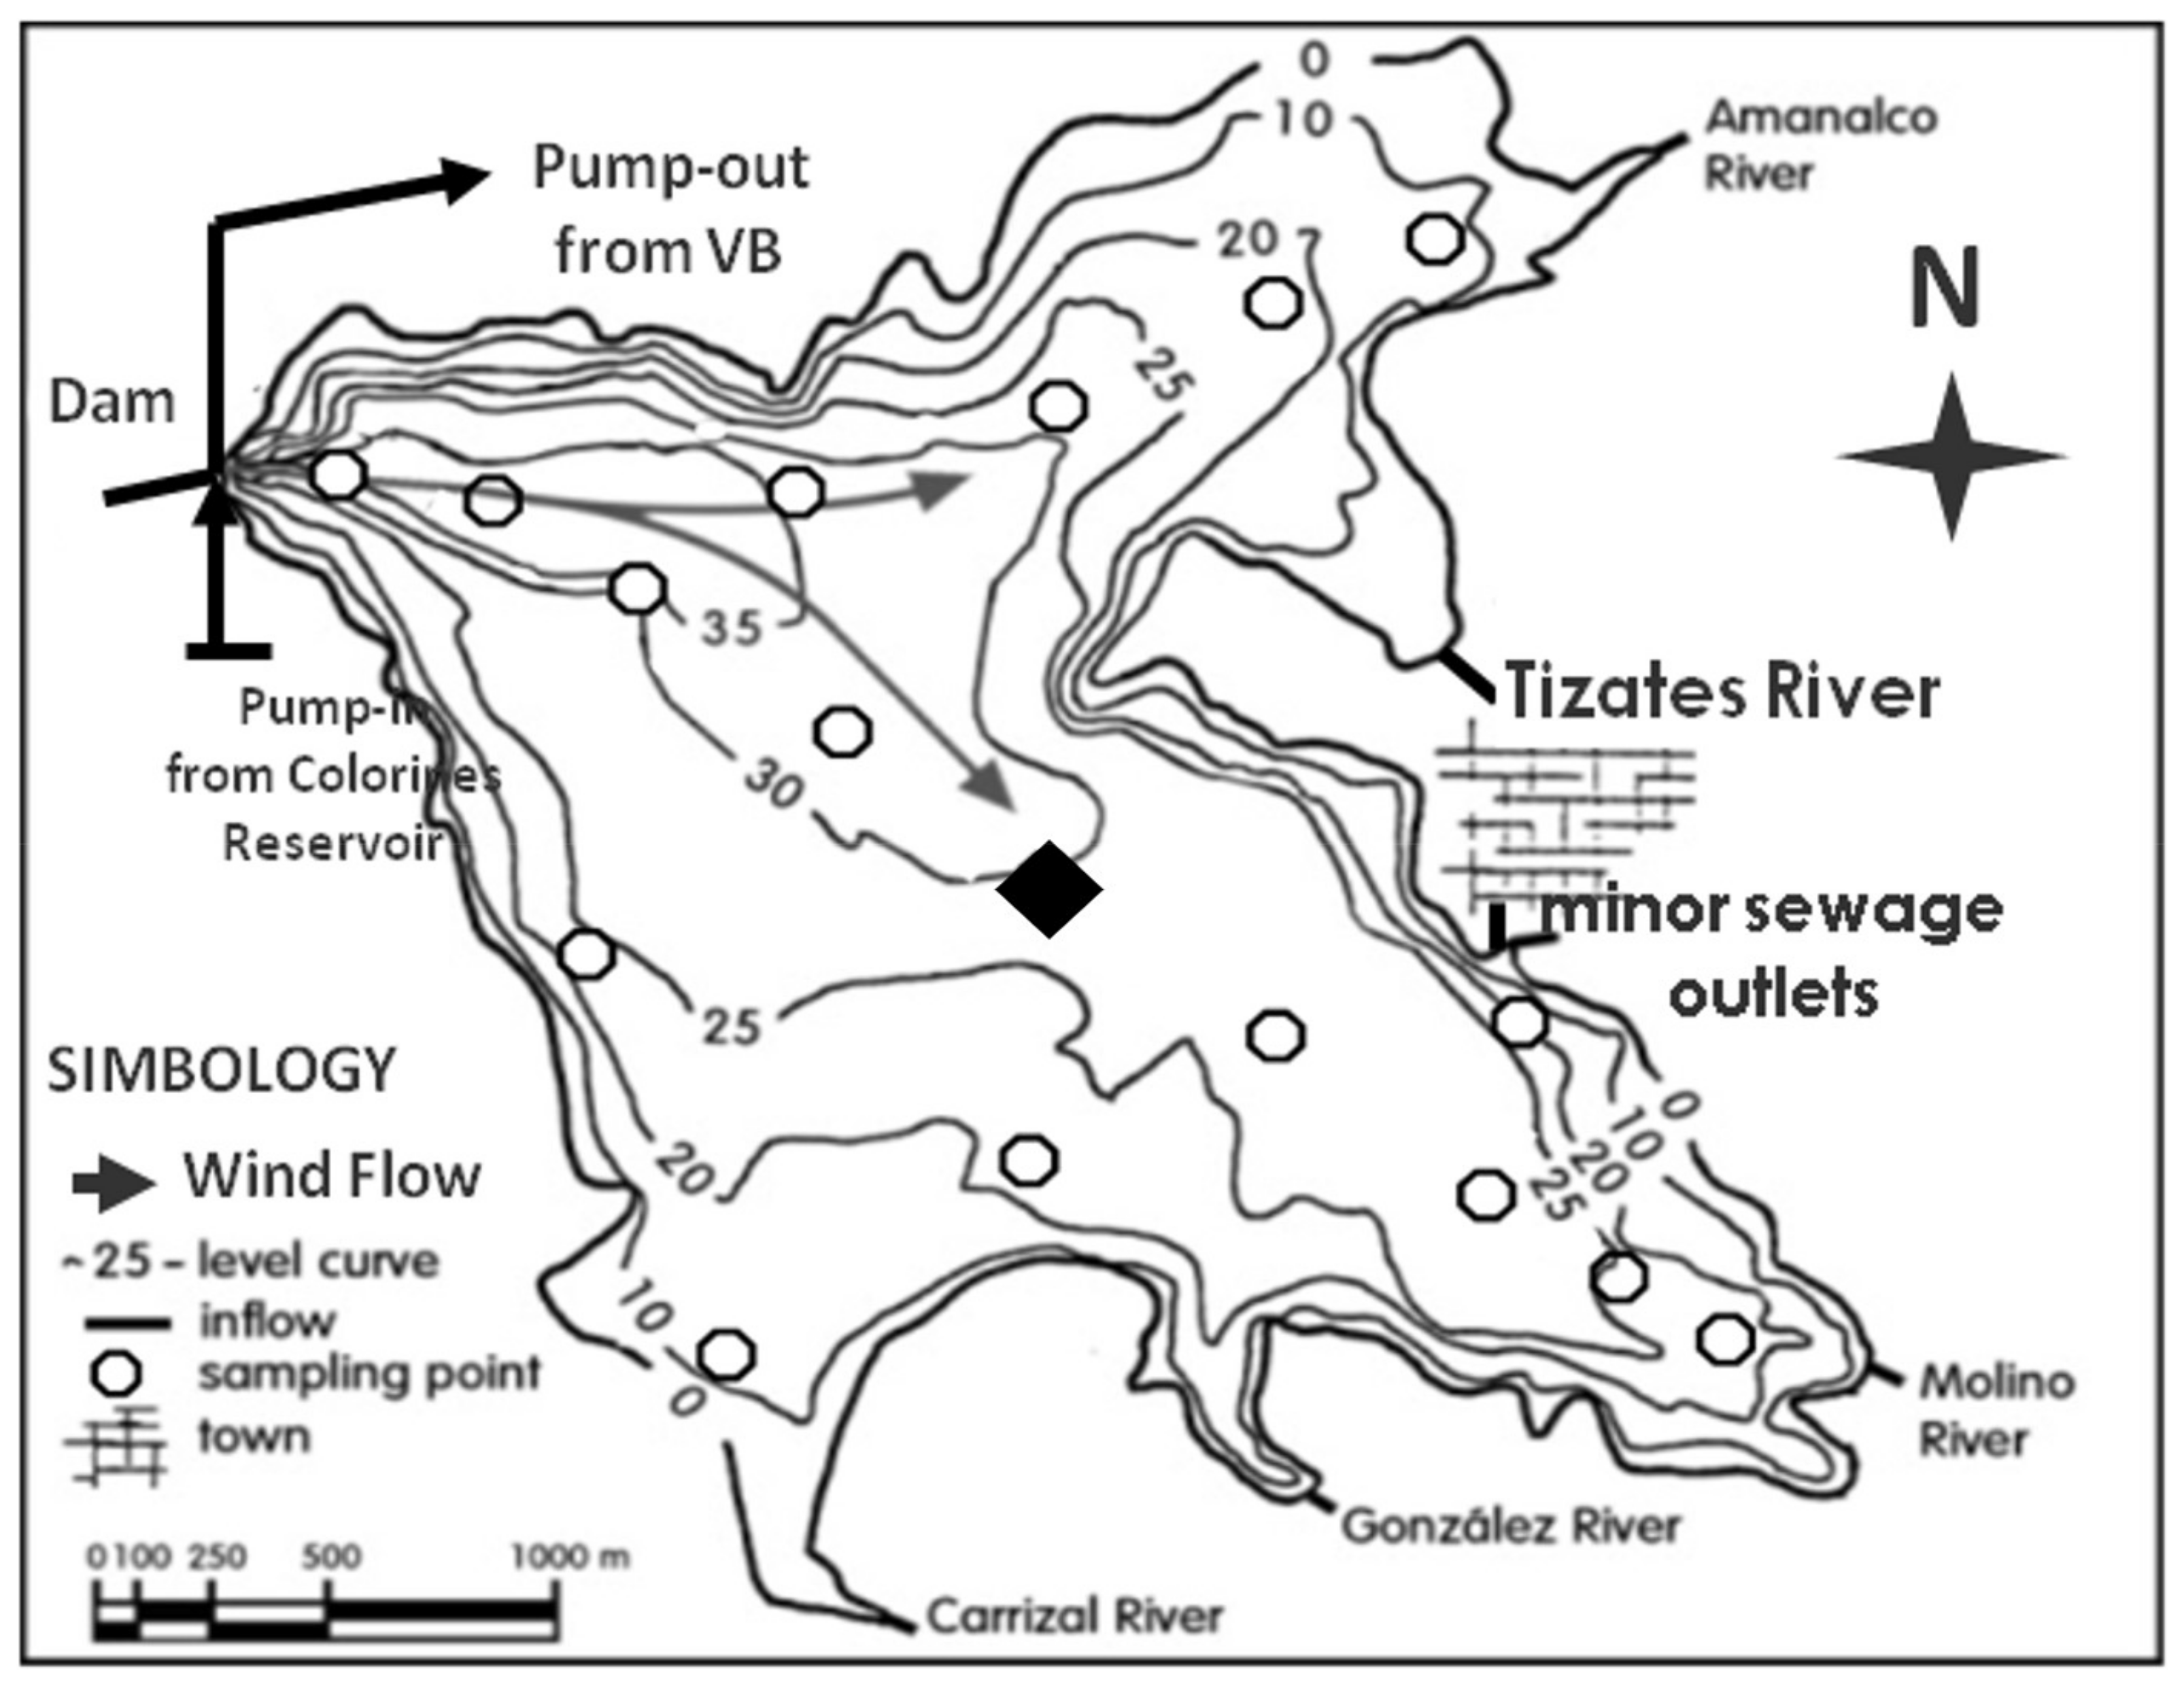
2.1. Study Area

Valle de Bravo (VB) has a surface of 18.6 km2, a mean depth of 21.1 m, and a maximum depth of 38.6 m. It is the largest of seven reservoirs in central Mexico (19°21′30″ N; 100°11′00″ W) that form the Cutzamala System, which provides 30% of the drinking water supply to the Mexico City Metropolitan Area and other cities. The maximum capacity of this reservoir is 391 × 106 m3. There are no spill outflows, but water is regularly withdrawn from VB by the National Water Agency (CONAGUA); on average, 221 × 106 m3 have withdrawn annually from this reservoir. Water is replenished to this high-altitude (1830 m a.s.l. at its maximum water level) tropical reservoir through its 547 km2 watershed by four main rivers (Amanalco, Molino, González y Carrizal) and at least three sewage outlets, including Tizates, a former river [15].
Through these rivers and sewages, VB receives very high external loadings of P and N (120.8 × 10³ kg P y−1 and 591.8 × 10³ kg N y−1 during 2002–2005, as already reported [15]). Due to these high external loads, this reservoir lake has become a hypereutrophic system, in which there are very high primary production rates (3.60 g C m−2 day−1 measured [14] during 2006–2015) in the photic layer, at the same time when the reservoir lake as a whole is heterotrophic. Due to its depth, VB behaves as a monomictic lake [11], and when it stratifies, it exhibits drastic biochemical differences between the epilimnion and the hypolimnion. During stratification, the hypolimnion becomes anoxic, and nutrient concentrations in the hypolimnion are high (SRP = 1.25 µ M , DIN = 36.3 µ M , see [11]), while in the epilimnion, they decrease to an order of magnitude lower levels in the epilimnion (SRP = 0.28 µ M , DIN = 3.1 µ M , see [11]).
VB is located in the tropical latitudinal zone with trade winds, rainy around summer, and mostly dry the rest of the year. Climate plays an important role for VB, mainly due to rain and wind patterns. It is sub-humid, warm to temperate with very pronounced dry and rainy seasons. Mean annual precipitation is 947 mm, most of which (809 mm, 86%) fall in the rainy months (June–October), while barely 14% (138 mm) of the rain falls distributed throughout the six months (November–May) of the dry season. The mean temperature in VB is 18.7 °C, the minimum annual temperatures (mean 9.0 °C) occur during January, and the maximum (mean 28.0 °C) during May, before the onset of the rainy season. The diurnal temperature variation is important (mean 11.5 °C) and can reach up to 14 °C in January. The climate of this deep reservoir lake is also characterized, as previously mentioned, by strong diurnal winds that blow along its two arms, of which the longer has a 6.9 km length (Figure 1). The wind at VB exhibits a regular diurnal pattern (12:00 a.m.–19:00 p.m.) blowing from the reservoir’s dam (WNW) into the valley arms (SSE). Diurnal wind speed averages 5.5 m s−1 and frequently reaches over 10 m s−1 [11].
Limnologically, VB exhibits a warm monomictic thermal regime, similar to other water bodies of the Mexican tropical highlands, except for the occurrence of a continuous increase in its hypolimnetic temperature during the stratification period [11]. In contrast, no hypolimnetic temperature increase has been observed or reported in any other water bodies of the Mexican tropical highlands, except for an almost negligible increase in [24].

2.2. Long-Term Monitoring of VB

VB monitoring was performed monthly at up to 17 sampling stations distributed throughout the water body and along the wind axis (Figure 1). During the initial years of the monitoring (2001–2003), all the stations shown in Figure 1 were sampled to identify and include any spatial variations that could occur. However, as the existence of horizontal homogeneity in VB was confirmed [11,25], the number of stations was reduced, initially to five stations, and from September 2007 on to a single sampling station at the center of the lake, to extend the viability of the long-term monitoring that has proceeded since then. The reservoir’s water level during each sampling date was obtained from the government official reports, and the area of the reservoir lake at different depths was obtained from the bathymetry reported by [11].
Temperature and dissolved oxygen (DO) were measured at 1 m vertical intervals using an Hydrolab DS4/SVR4 (Austin, TX, USA) (from February 2001 to September 2004) or a Yellow Springs Instruments (YSI, Yellow Springs, OH, USA) field probe (from October 2004 to January 2019) and an in situ Aqua Troll 500 (In-Situ, Fort Collins, CO, USA) (from February 2019 to September 2021), which were previously intercalibrated. Water samples were collected with a 1.5 L Uwitec (Mondsee, Austria) sampler at regular vertical intervals (0, 1, 2, 4, 8, 12, 17, 20, 24, 28, and 32 m, when possible) all the way down to the bottom of the lake. Subsamples for nutrients (dissolved inorganic nitrogen (DIN) = [NH4+ + NO2 + NO3], and soluble reactive phosphorus (SRP) analysis were held in polypropylene containers after filtration with 0.45 and 0.22 µm Millipore™ type HA (Bedford, MA, USA) nitrocellulose membranes and were kept frozen until their analysis (within 24 to 48 h) in a San plus Skalar (Breda, The Netherlands) segmented-flow continuous auto-analyzer, using the methods and circuits suggested by [26].

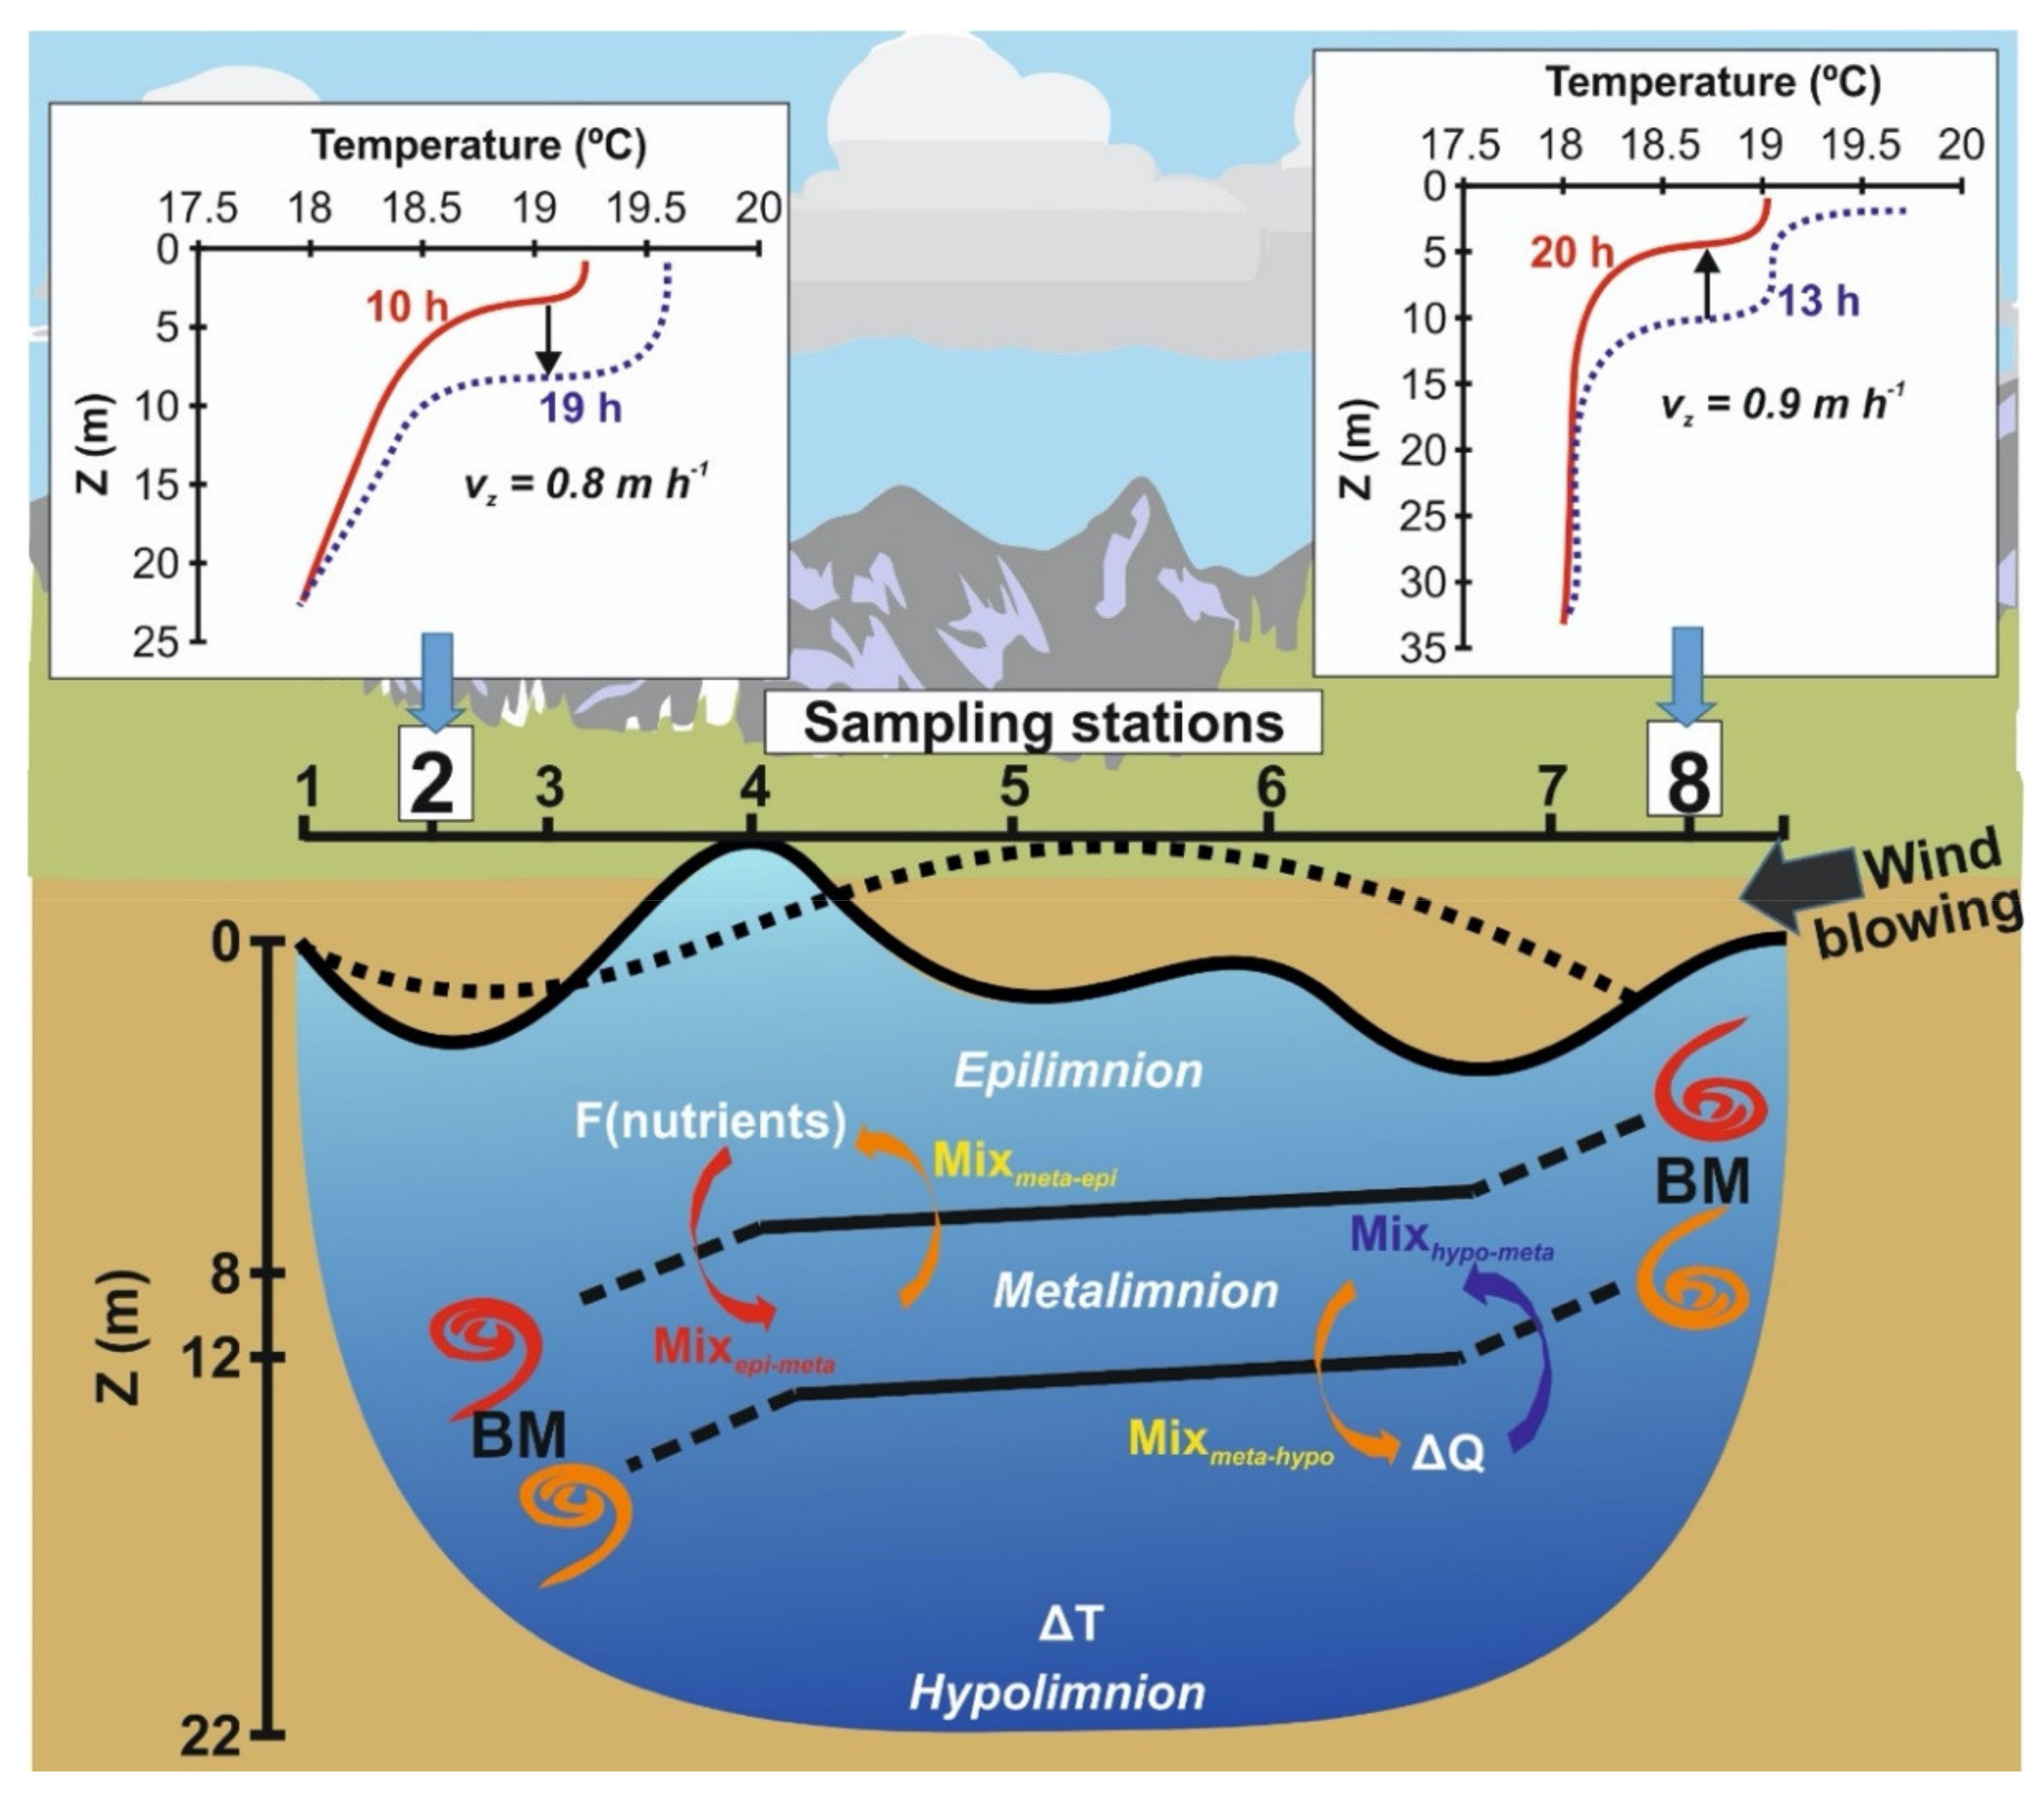
2.3. Vertical Mixing Model and Calculations

Our approach is based on the increasing evidence [6,27,28,29] that turbulence generated by internal waves breaking in boundary mixing events can transport nutrients and gases vertically through the metalimnion in systems where a source of external energy, such as wind, drives these processes, as summarized in Figure 2. In VB, these mixing events drive continuous warming of the hypolimnion that continues along all the stratification periods.
To assess if hypolimnetic warming reduced the stability of the stratification (S), stability was calculated for each sampling date following [30], integrating from the surface to the maximum depth (Equations (1) and (2)). Stability is expressed in work units per surface lake area because it represents the amount of work that would be required to mix the reservoir lake into an isothermal state. It describes how much the center of mass of the lake has been lowered by the stratification process.
S = g/Ao ∑ (ρz − ρm) (z − zg) AzΔz
where
ρm = 1/V ∫Azρzdz
where S is the stability of stratification (J m−2); g is the acceleration of gravity (m s−2); Ao is the surface area of the reservoir lake (m2); ρz is the water density at depth z (g m−3); ρm is the mean water density of the lake (g m−3); zg is the depth at which the mean density is found (m); Az is the area at any depth z; V is the volume of the reservoir lake (m3).

2.4. Hypolimnetic Heat Balance and Calculation of Vertical Water Mixing

There are not any geothermal or groundwater sources of heat in VB that could be driving the warming of the hypolimnion [11]. The high turbidity of the reservoir water—mean Secchi depth is of only 1.4 m (stratification averages range: 1.15–1.65) during the stratification periods [14]—constrains the penetration of solar radiation heating to the first few meters of the epilimnion. Therefore, the hypolimnetic thermal increase we found was entirely attributed to vertical mixing events. We used the simplest model possible, considering the three distinct water layers in a monomictic lake: the warm epilimnion, metalimnion or thermocline layer, and the colder hypolimnion (Figure 2). As there are no other heat inputs to the hypolimnion of VB, it is reasonable to trace back the vertical mixing from the metalimnion to the hypolimnion, Mixmeta-hypo, from the observed hypolimnetic temperature increases. This was carried out through a heat balance of the hypolimnion (Equation (3)), considering both the heat exchange due to a) vertical mixing of water (ΔQhypomix, cal d−1) and b) thermal conductivity flux (ΔQhypocond, cal day−1), as
ΔQhypotot = ΔQhypomix + ΔQhypocond
Total heating of the hypolimnion, ΔQhypotot, was calculated (Equation (4)) for each period between samplings (Δt, days), using the observed temperature increase (ΔThypo, °C), the calorific capacity of water, (c, cal g−1 °C−1), the volume of the hypolimnion (Vhypo, m3), and the mean hypolimnetic density (ρhypo, g m−3), for a period Δt, as
ΔQhypotot = (ΔThypo c/Δt) × Vhypo × ρhypo
The conductivity heat flux, ΔQhypocond, was calculated from the vertical temperature gradient (ΔTepi-hypo) at the metalimnion–hypolimnion frontier and the water thermal conductivity. Then, the mixing heat exchange (ΔQhypomix) was calculated by subtracting the thermal conductivity flux from the total heat exchange (resolving from Equation (3)).
In turn, the volume of water exchanged (Mixmeta-hypo, m3 d−1) was calculated from the obtained heat exchange due to mixing (ΔQhypomix, cal day−1), as
Mixmeta-hypo = ΔQhypomixhypo c (Tepi − Thypo)
where: c is the calorific capacity of water (cal g−1 °C−1), ρhypo is the mean hypolimnetic density (g m−3), calculated as the mean of the ρ values measured in the hypolimnion, Tmeta is the mean metalimnetic temperature (°C), and Thypo is the mean hypolimnetic temperature (°C), all three calculated averaging the measurements from the two samplings used for each period calculation.
The vertical diffusivity coefficient, Kz (m2 s−1) sensu [6,8] was calculated from the vertical water flow (Mixmeta-hypo), multiplying it by the mean vertical distance between the two layers (Zmeta-hypo ~4 m) and dividing it by the exchange area (Area meta-hypo) at the depth of the base of the metalimnion and the top of the hypolimnion (Equation (6)), which was estimated at 1.2 × 10⁷ m2 using the bathymetry of the reservoir published in [11] and the corresponding conversion of units.
Kz = Mixmeta-hypo (Zmeta-hypo)/Area meta-hypo

2.5. Calculation of Vertical Nutrient Fluxes

To assess the vertical flux of nutrients toward the epilimnion, estimates of both the metalimnetic concentration of nutrients and of the vertical rate of metalimnetic water mixed into the epilimnion (Mixmeta-epi) are needed.
Despite the hypolimnetic warming, because the thermal structure did not change notably in VB between samplings, and the reservoir lake remained stratified during the spring to autumn months, it is reasonable to assume a steady-state condition of vertical mixing, in which vertical water exchange between the epilimnion and the metalimnion is similar to vertical water exchange between this thermocline layer and the hypolimnion in both directions (Figure 2, Equation (7)).
Mixepi-meta ≈ Mixmeta-hypo ≈ Mixhypo-meta ≈ Mixmeta-epi
We, therefore, used the calculated Mixmeta-hypo to estimate Mixmeta-epi, the vertical water flux responsible for transporting nutrients to the epilimnion. Therefore, the nutrient entrainment, or flux to the epilimnion (F (nutrients)), for each period between samplings was calculated as the product of mean nutrient concentration in each layer multiplied by Mixmeta-hypo.
F (nutrients) = Mixmeta-hypo × (nutrients)
where F (nutrients) is the ascending nutrient flux (kg day−1), Mixmeta-hypo is the exchange of water between layers (m3 day−1), and [nutrients] is the mean metalimnetic concentration of SRP, ammonia, or DIN (kg m−3) (Equation (8)).

2.6. Data Statistical Analysis

Regression analysis and Pearson´s determination coefficients were used to investigate the relations among the variables studied and to obtain the mean hypolimnetic warming rate for each of the stratification periods. Microsoft Excel for Mac 2019 (King County, WA, USA) was used for these analyses.

3. Results

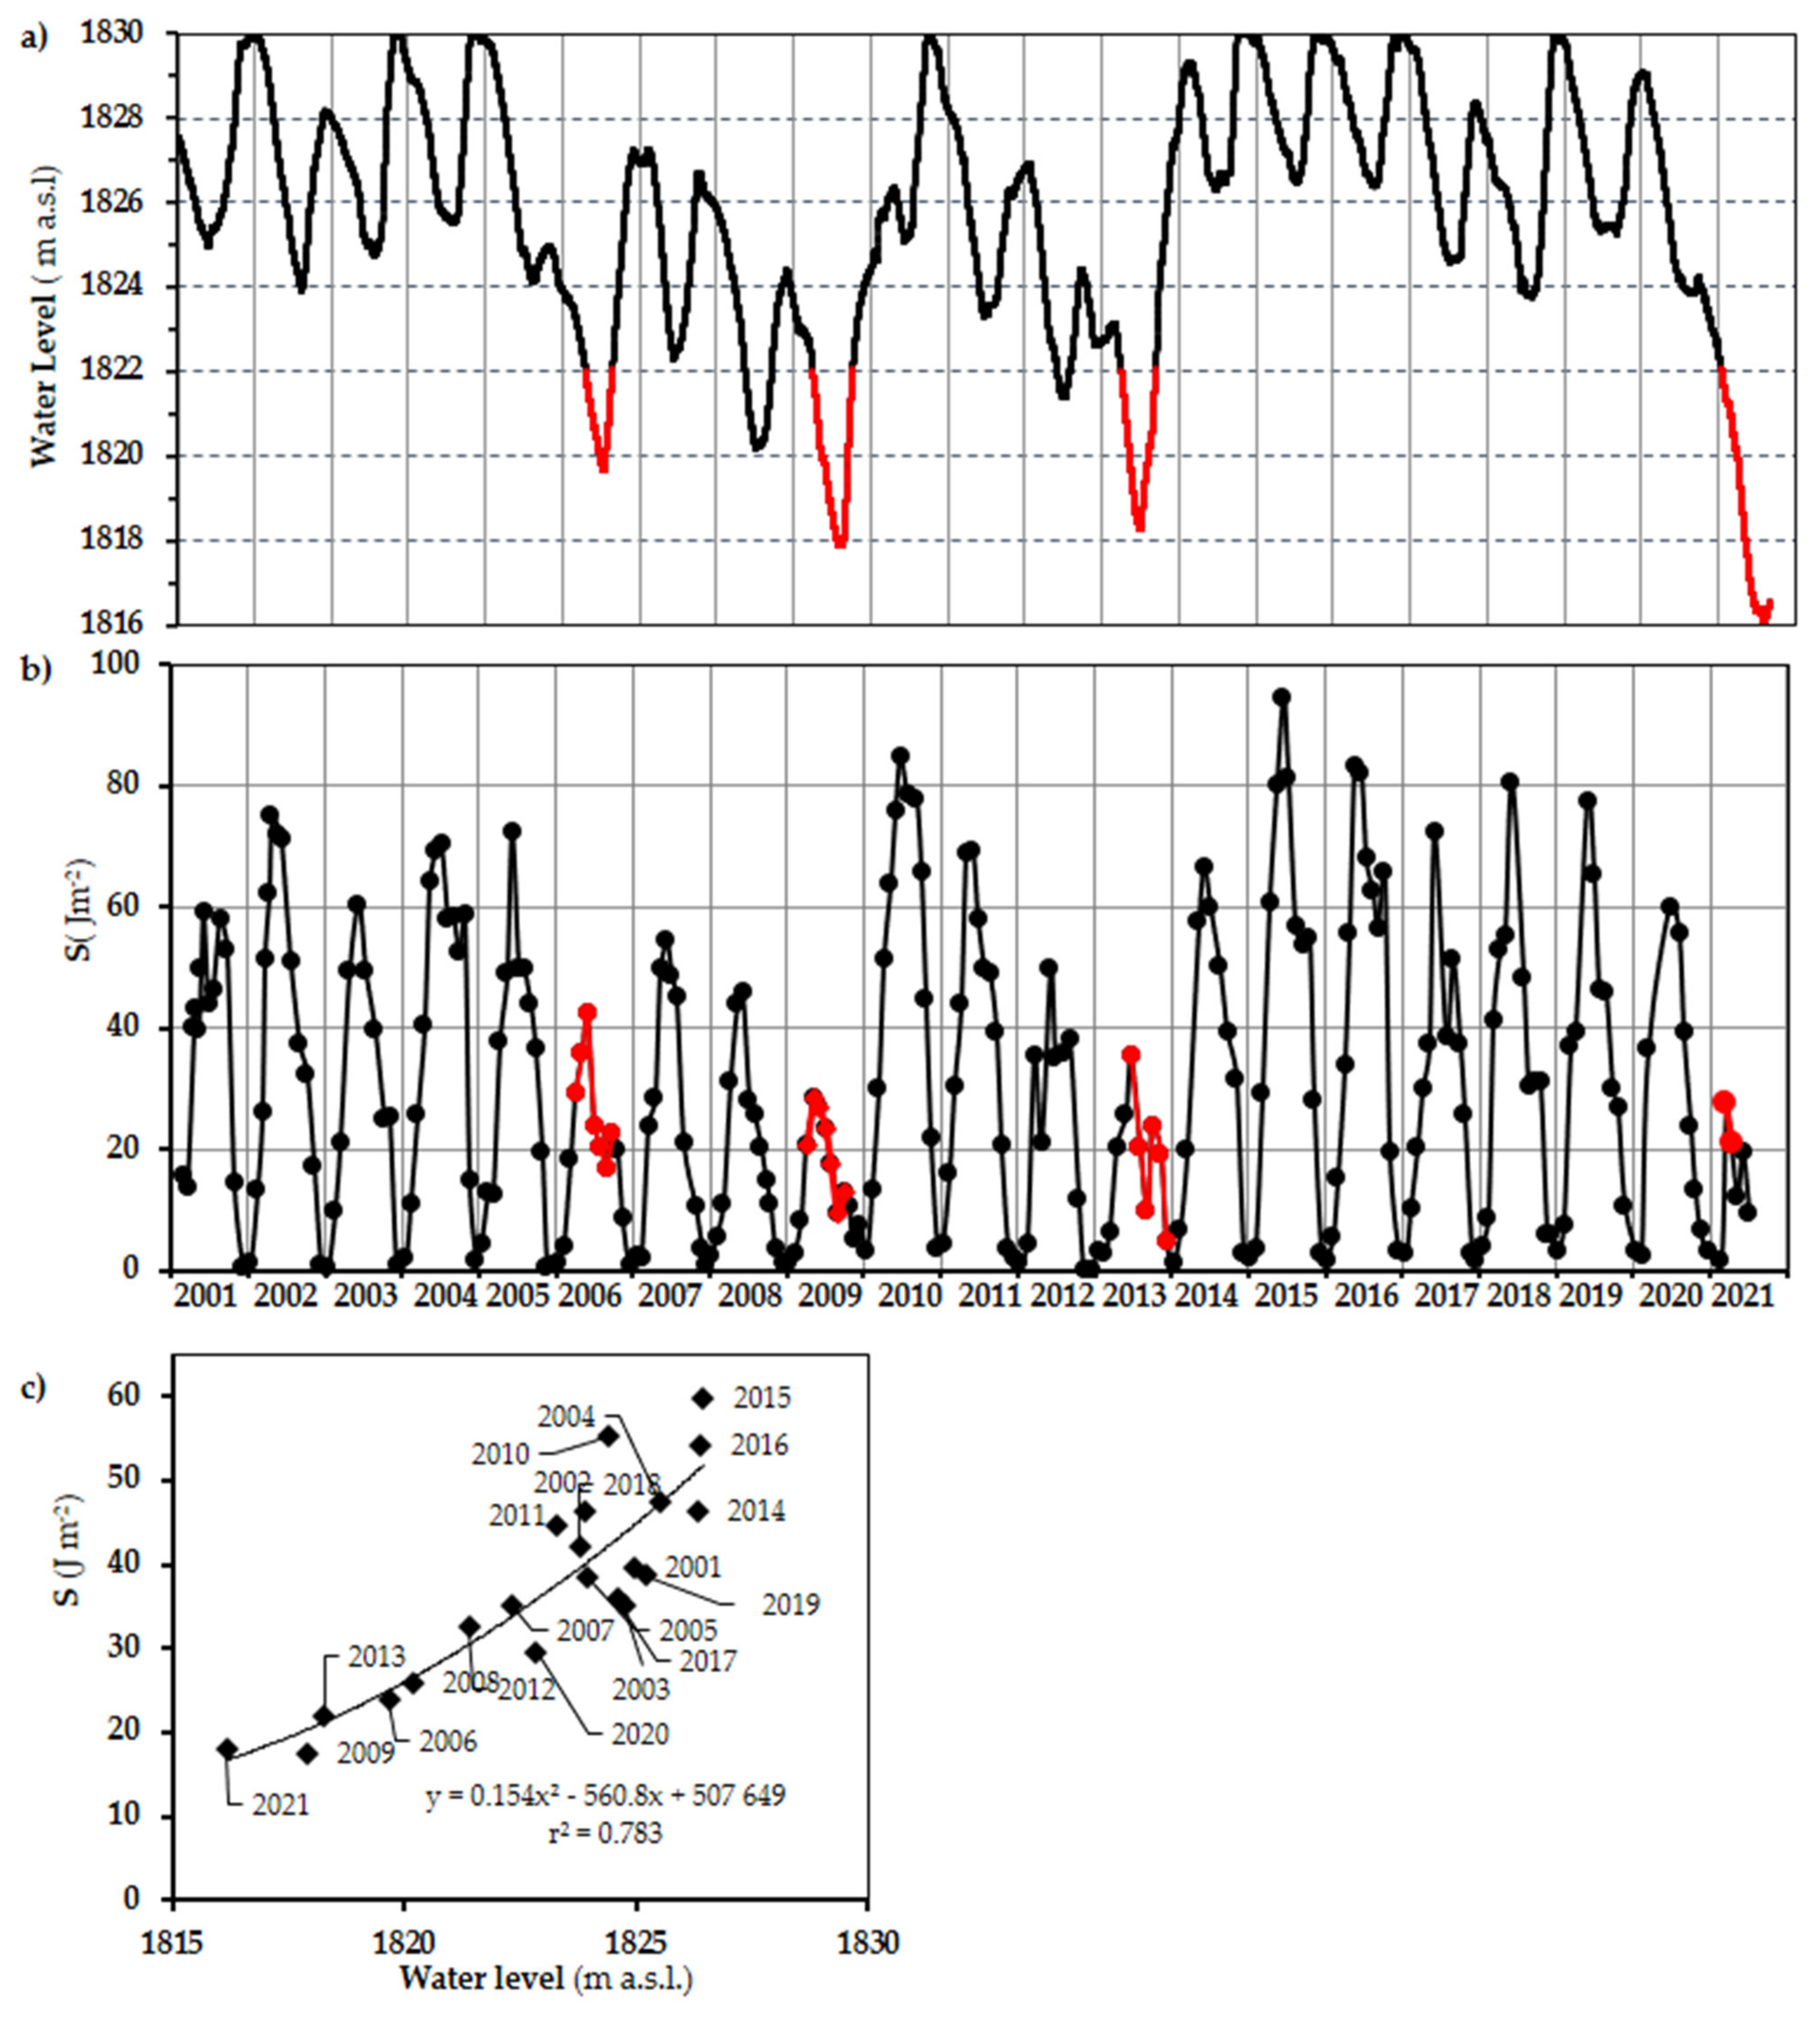
3.1. Water Level Fluctuations (WLFs) in VB during 2001–2021

A seasonal variation on the water level of VB was observed during the full study period (Figure 3a), which followed the seasonal rain variations for the region, where the rainy season is from June to October. These seasonal water level variations were generally of only 4–6 m, between the reservoir lake’s capacity (maximum level 1830 m a.s.l.) at the end of the rainy season and a minimum of 1824 to 1826 m a.s.l. by the end of the dry season (Figure 3a). However, the level of the reservoir lake varied more drastically during 2005–2013, decreasing over 12 m below its capacity and remaining well below its maximum level for several years, except for 2010 (Figure 3a). Then, VB returned to water levels close to its capacity for several years (2014–2020), until the level fell drastically again in 2021. Overall, four extraordinary minimum water levels were reached in the summers of 2006 (1819.7 m a.s.l.), 2009 (1817.9 m a.s.l.), 2013 (1818.3 m a.s.l.), and 2021 (1816.2 m a.s.l.), which are outlined in red color in Figure 3 and Figure 4 to facilitate their identification. Despite these high WLFs, stability maintained marked annual cycles that show that the stratification was not broken during any of the stratification periods of 2001–2021 (Figure 3b).

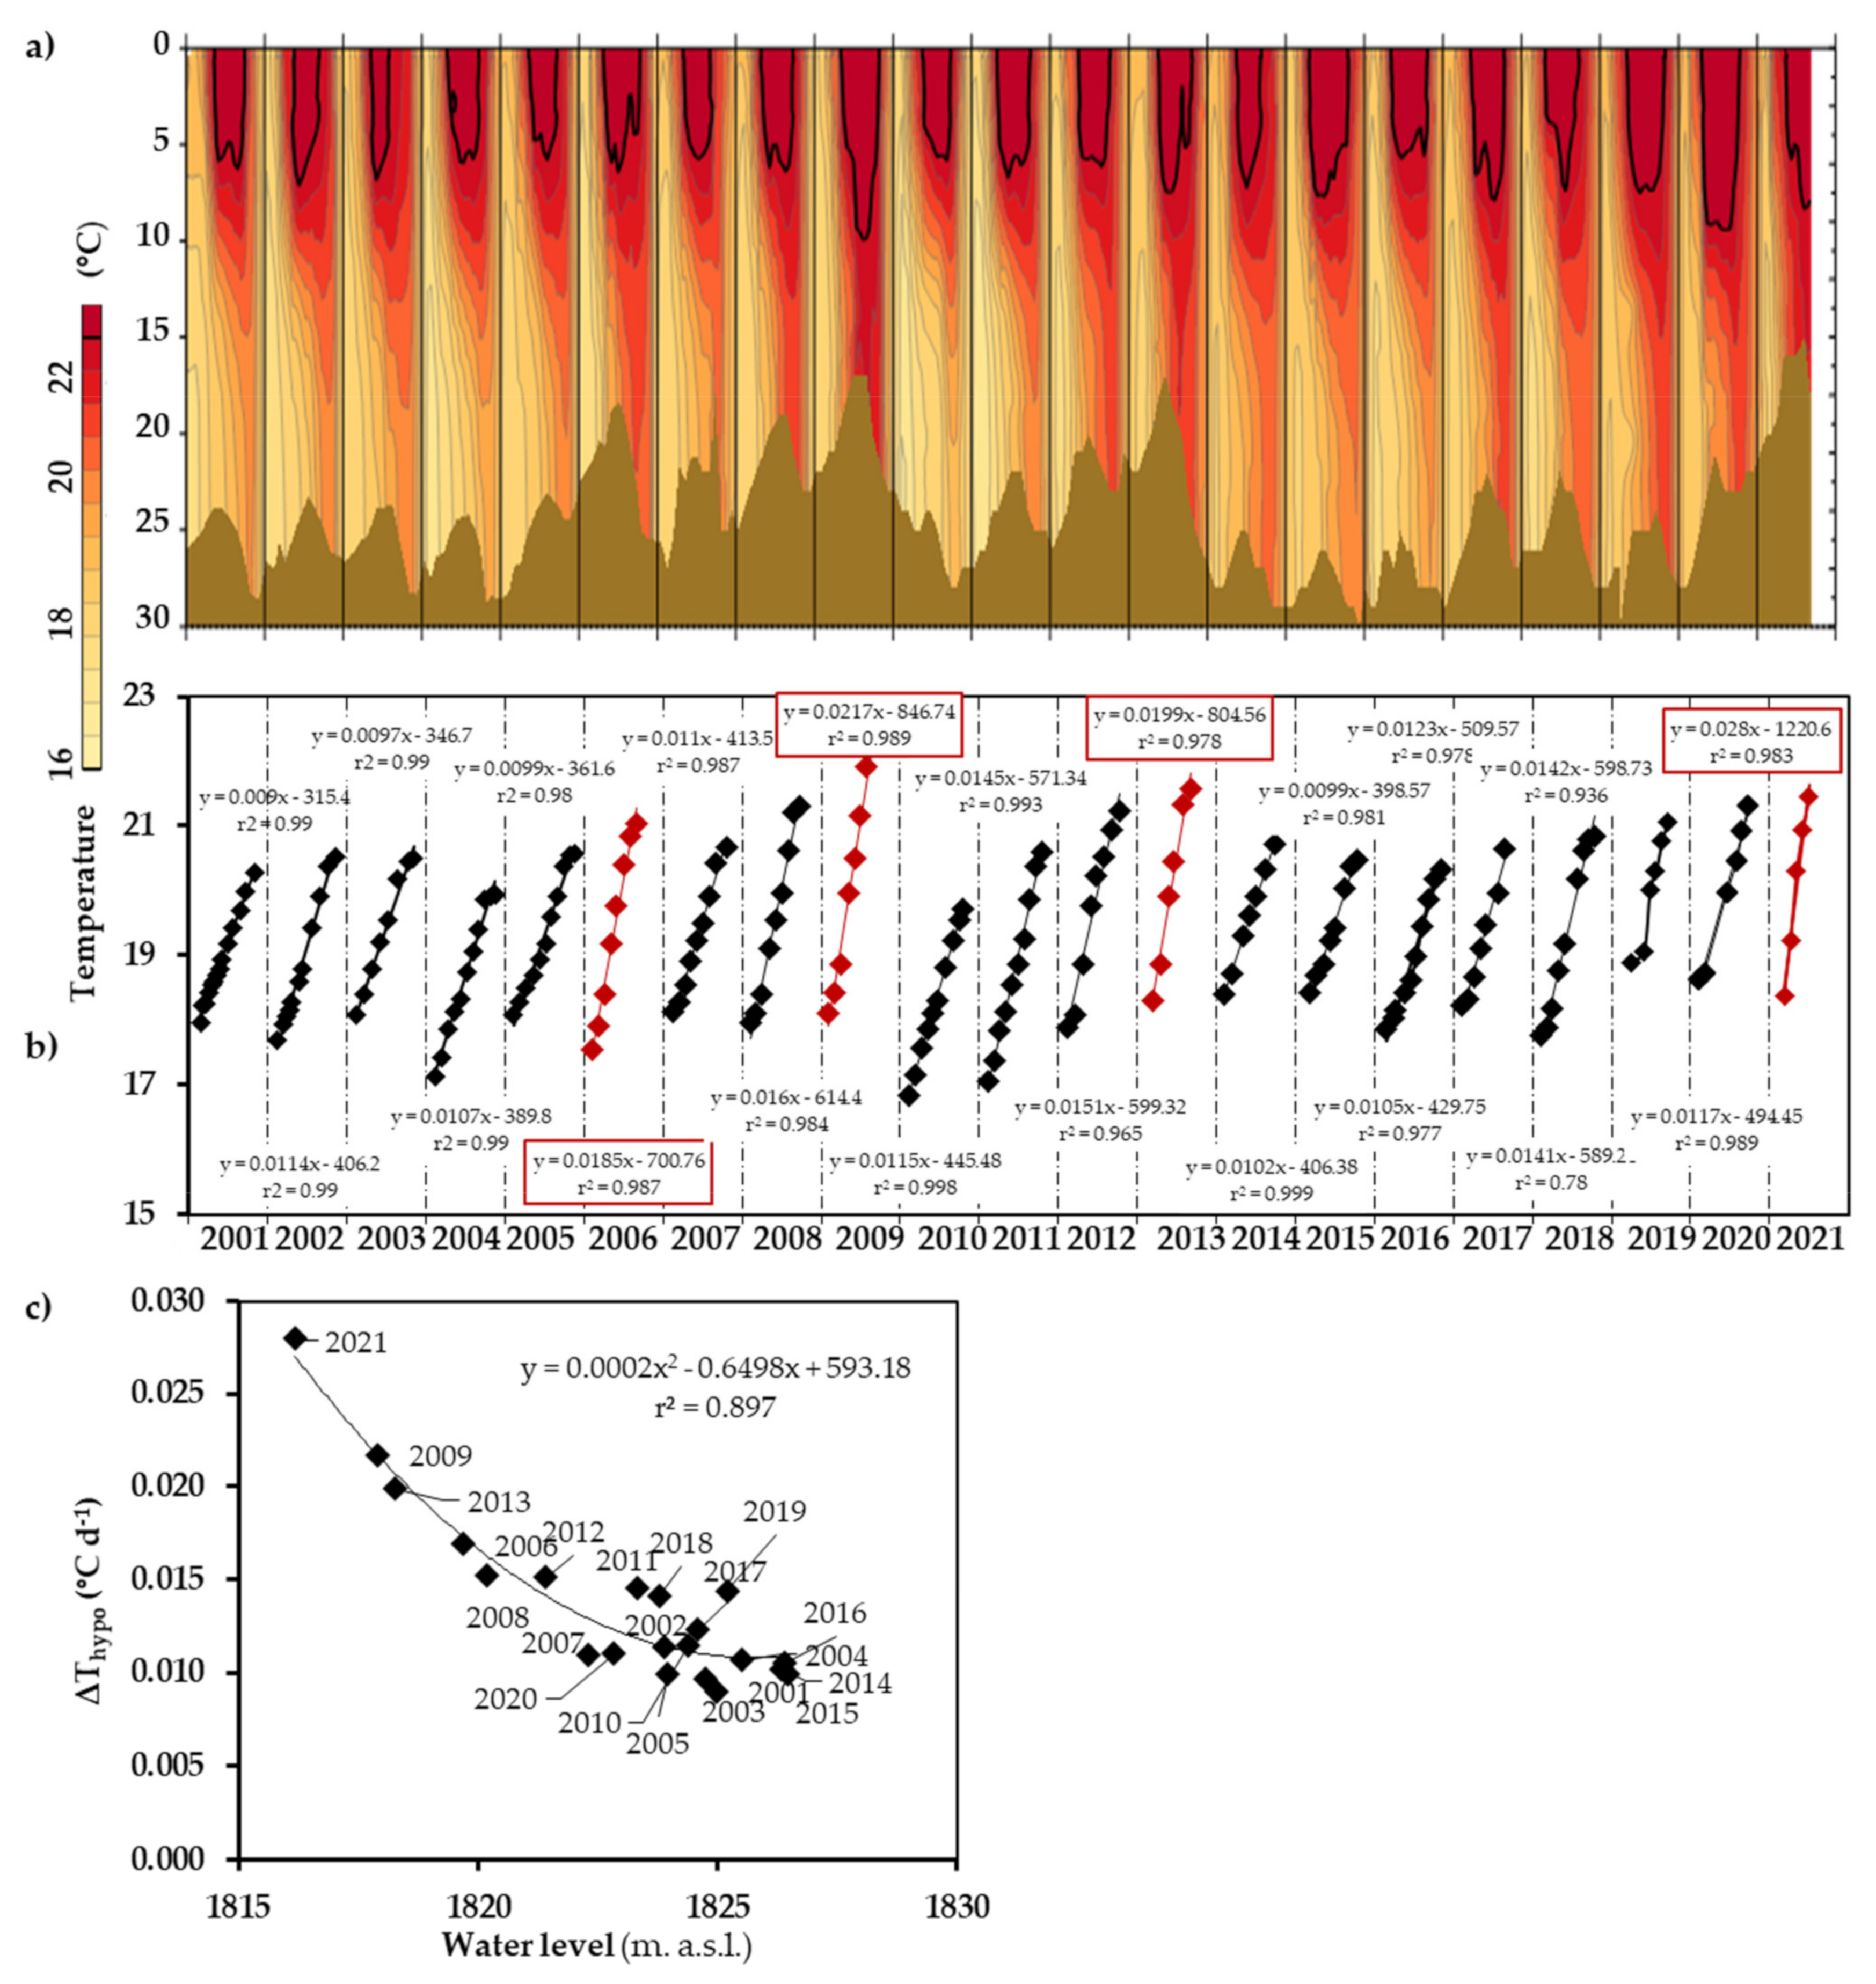
3.2. Thermal Regime and Stratification

VB behaved as a warm monomictic lake every year during 2001–2021, with a mean stratification period of 219.8 ± 30.6 days. A typical seasonal pattern occurred in the reservoir during the 21 years studied: the maximum surface temperature was reached in June, with slight variations (23.0–23.9 °C) among years (Figure 4a). Circulation began in November, and the water column remained homogeneous every winter, at least from December through January. The time variations of the vertical thermal distribution show that the epilimnion extended quite regularly among years to a depth of ~6 m, and a little deeper in some of the years, particularly in the two lowest level years (2009 and 2021). As expected, the stability of the water column also followed a seasonal pattern, reaching high values (>20.0 J m−2) during all the stratification periods and decreasing to zero every year during the mixing periods (Figure 3b). This seasonal pattern of stability confirms that stratification was never broken during any of the stratifications between 2001 and 2021. Nevertheless, the mean stability observed during each of the stratifications diminished significantly as the water level decreased (Figure 3c). In fact, as shown in Figure 3c, stability exhibited a direct and significant polynomial relationship with the water level of the reservoir lake.

3.3. Hypolimnetic Warming

The mean temperature of the hypolimnion of VB increased between consecutive samplings during each and every stratification period of the 21 years here reported (Figure 4). The rates of temperature increase between consecutive samplings ranged overall 0.0003–0.04 °C day−1, while the mean rates for each entire stratification period, as estimated by linear regressions in Figure 4b ranged from 0.009 to 0.028 °C day−1, and the maximum mean increases occurred during the stratifications of 2021 (0.028 °C day−1), 2009 (0.022 °C day−1), 2013 (0.020 °C day−1), and 2006 (0.019 °C day−1). Although linear regression yielded high coefficients of determination for all the stratification periods (r2 ranging from 0.936 to 0.999), some of the stratifications showed a slight sigmoidal trend (e.g., 2016, 2012, 2018, 2005), which could be related to the transitions between stratification and circulation periods. The mean thermal increase during the stratification showed a strong (r2 = 0.897) second-order inverse relation with the mean water level for that year: the lower the level of the lake, the higher the rate of hypolimnetic warming (Figure 4c).

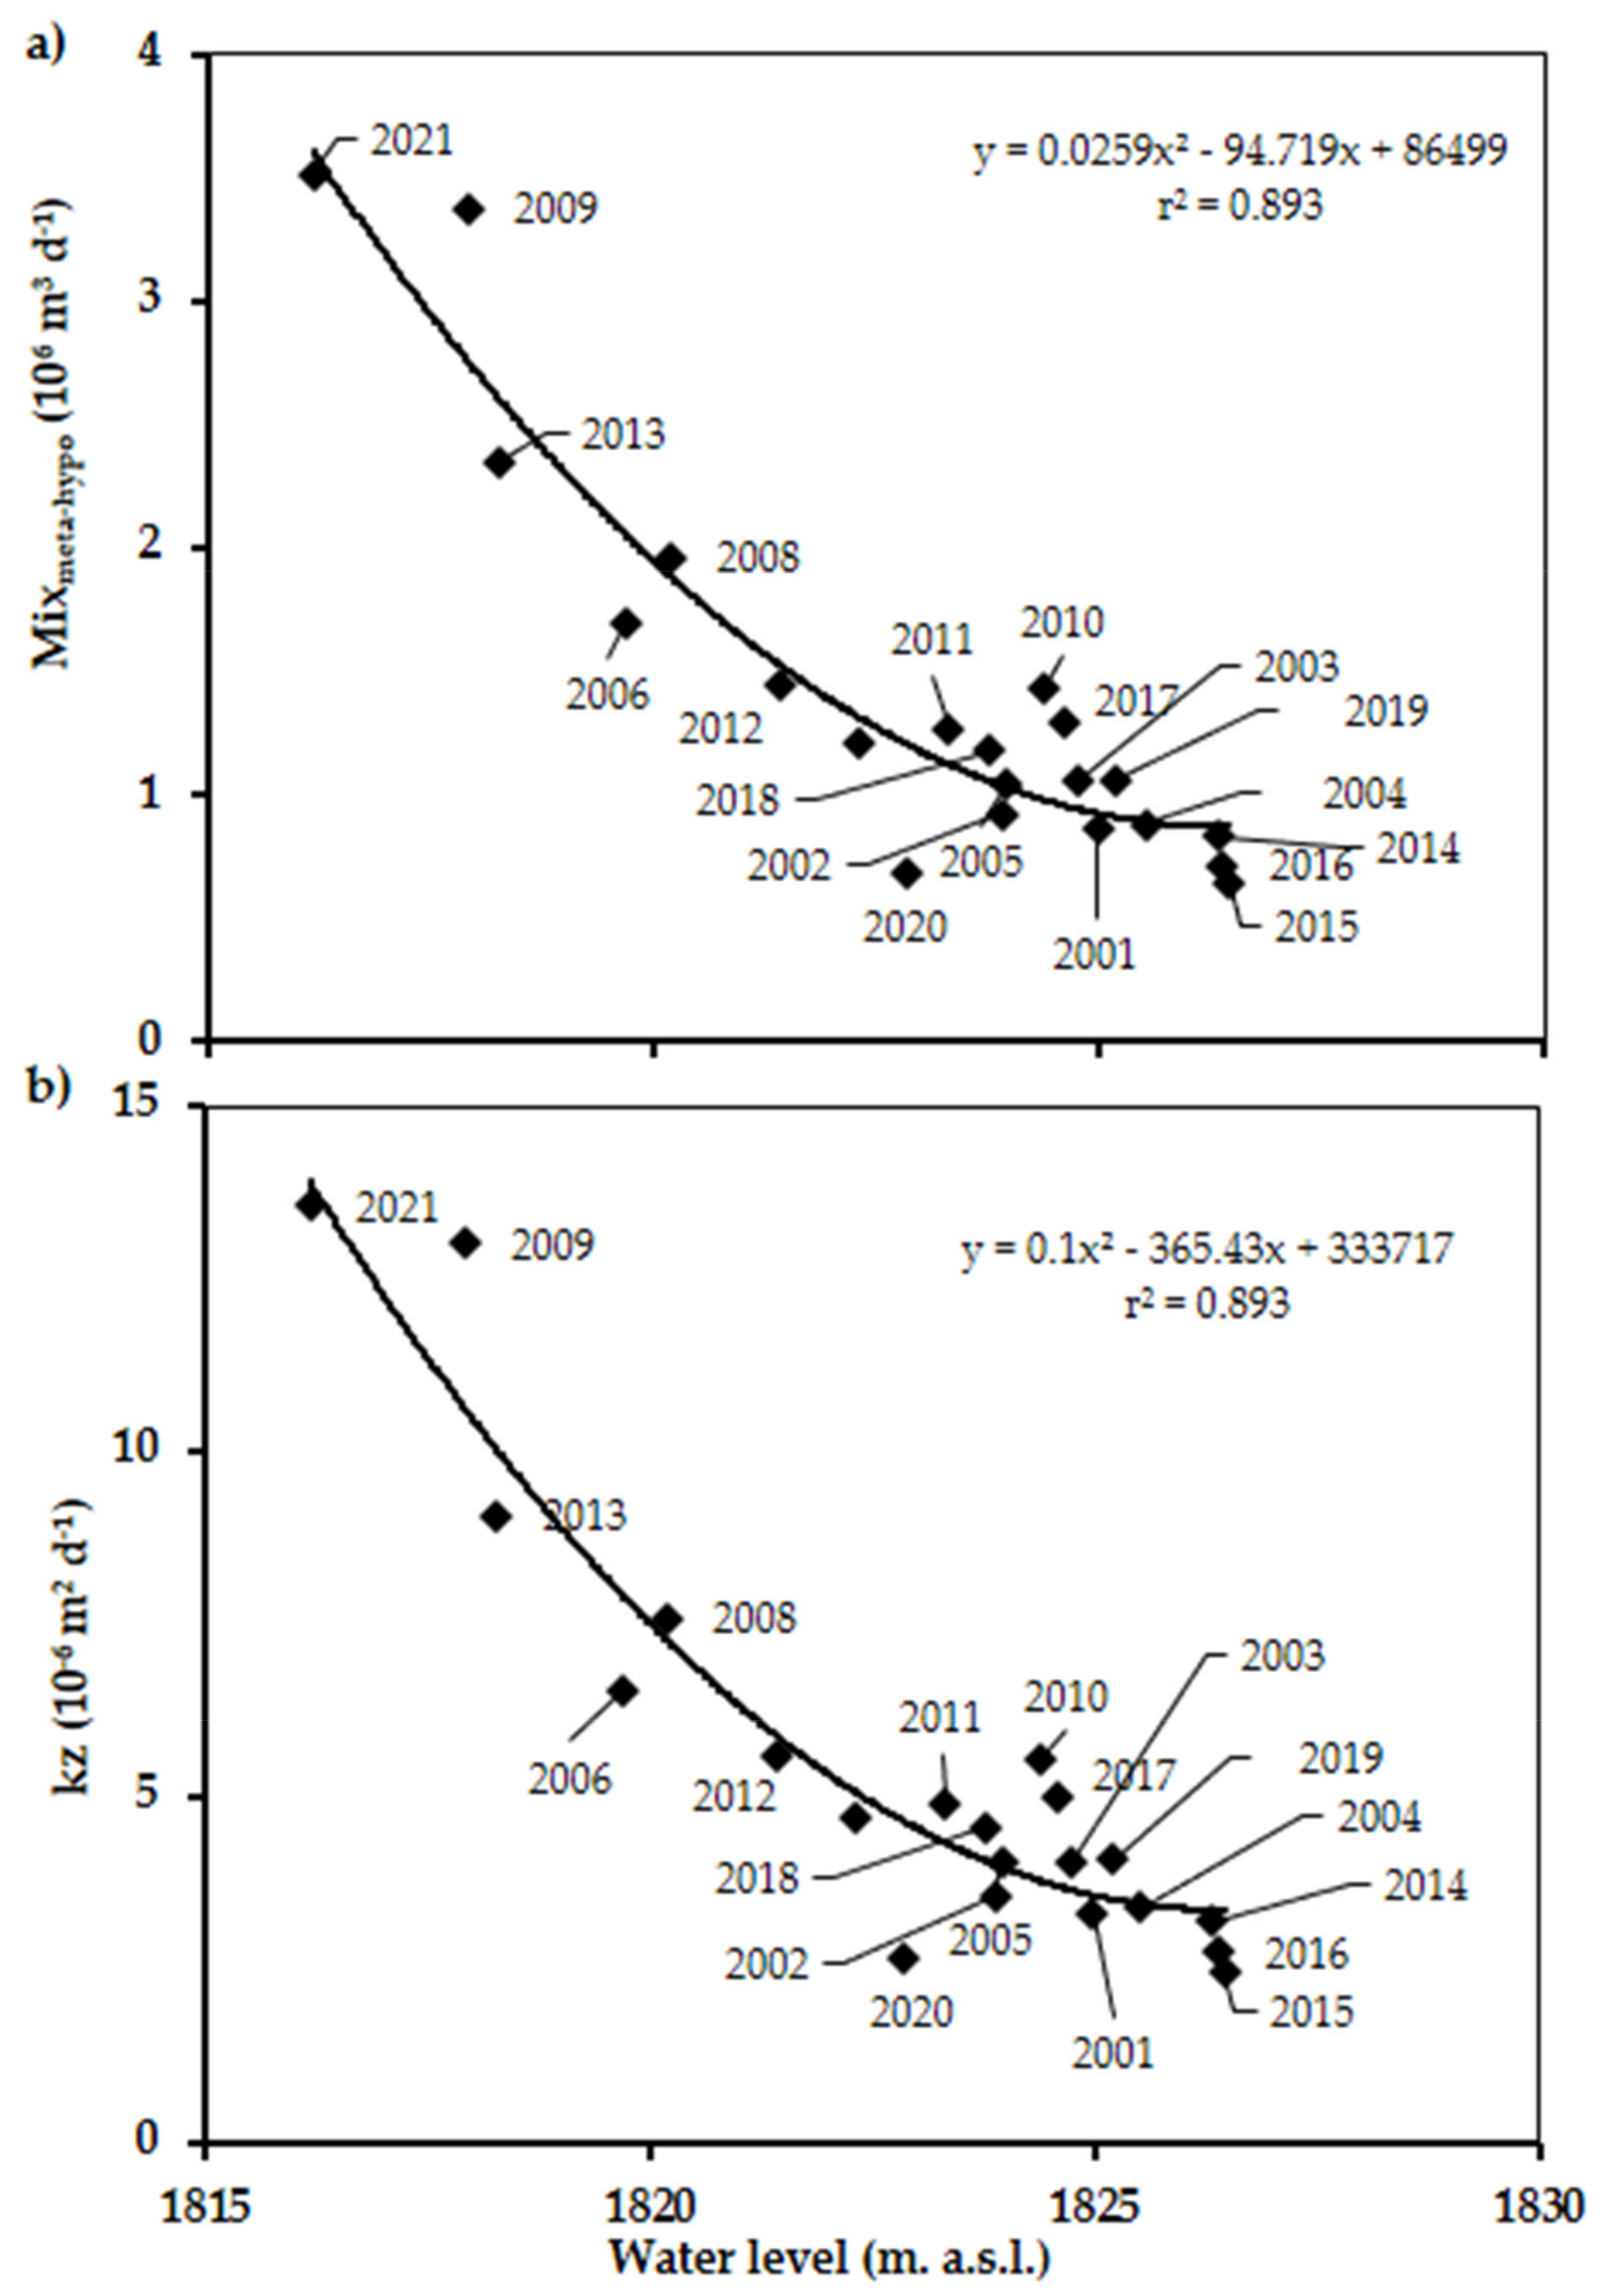
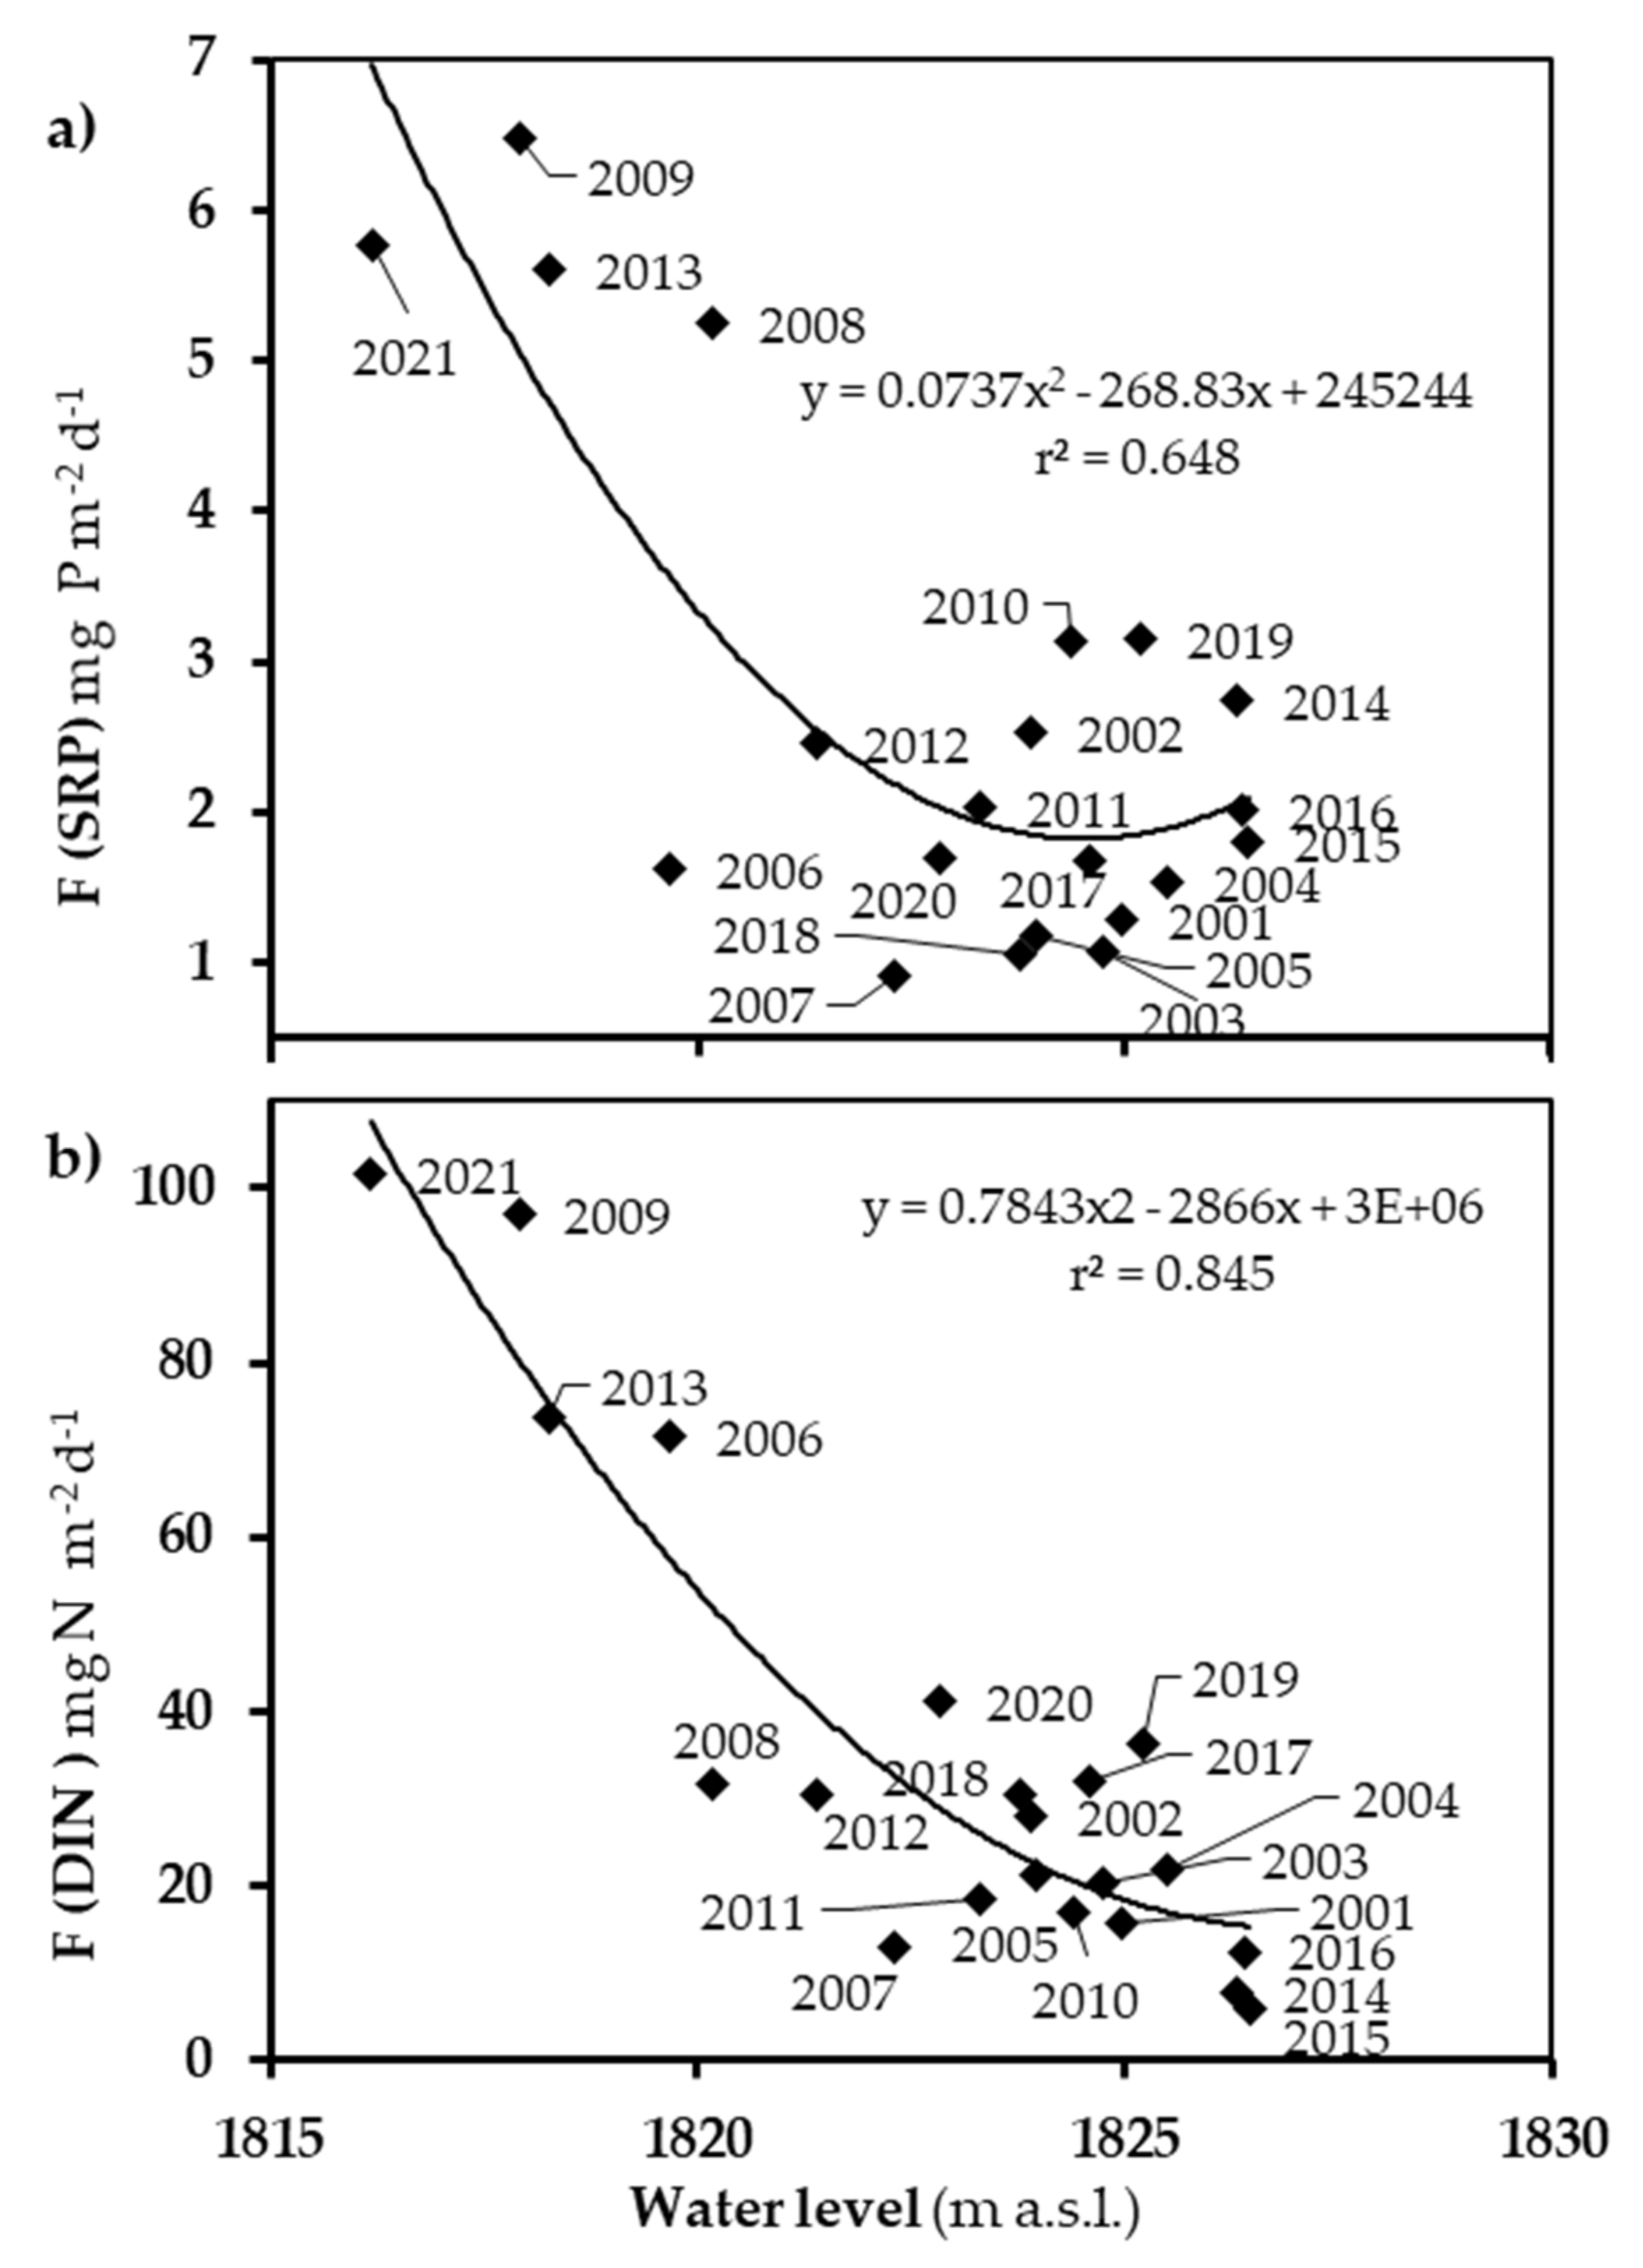
3.4. Mixmeta-hypo, Kz, and Nutrient Fluxes

The rate of vertical water mixing (Mixmeta-hypo) ranged from 0.639 × 10⁶ m3 day−1 to 3.515 106 m3 day−1 among the stratifications, with lowest in 2015 and highest in 2021 (Table 1). These mixing rates correspond to a daily volume of 0.16% to 0.90% of the 391 × 106 m3 day−1 total capacity of the reservoir lake (see Section 2.1. Study Area). Furthermore, these rates showed an inverse relationship with the mean water level for each year, with a good fit (r2 = 0.893) through a polynomial second order regression (Figure 5a).
The mean calculated vertical diffusivity coefficients (Kz) followed a similar pattern among years, ranging from a 2.5 × 10⁻⁶ m2 s−1 average during the stratification of 2015 to a mean of 13.6 × 10⁻⁶ m2 s−1 during the stratification of 2021 (Table 1, Figure 5b) when the water level was lowest during the full period. On the monthly scale of our calculations, the range of the Kz values calculated was wider, from as low as 4.0 × 10⁻⁸ m2 s−1 to as high as 5.0 × 10⁻⁵ m2 s−1 (Table 2).
Vertical nutrient fluxes toward the epilimnion (Table 1) also varied inversely with the lake´s water level, following a pattern similar to that of Mixmeta-hypo and Kz (Figure 6). SRP vertical flux to the epilimnion ranged from 0.42 to 5.99 mg P m−2 day−1 among the different stratification periods and averaged 2.12 mg P m−2 day−1 for the full 21 years studied. DIN vertical flux to the epilimnion ranged from 5.79 to 101.7 mg N m−2 day−1 among the different stratifications and averaged 34.63 mg N m−2 day−1 for the 21 years studied. Significant inverse correlations (r2 = 0.648 for SRP and r2 = 0.845 for DIN) were obtained with the water level, although—as expected—nutrient fluxes exhibited a higher variability because of the additional variability of nutrient concentration, as can be seen in Figure 6.

4. Discussion

The access of nutrients into the photic zone has major implications for the primary production and trophic webs of water bodies. This is largely controlled by physical factors that include the wind regime and water level fluctuations. The approach used here was derived from long-term observation throughout two decades of monthly monitoring at VB, where strong winds, eutrophication, and water extraction for Mexico City interact in a system where explosive phytoplankton blooms are frequent [11,17]. In such a complex system, the assessment of the vertical exchange of water and nutrients and its variations can help to reveal the mixing and nutrient environment to which plankton is exposed, and nutrient budgets can be refined. From this understanding, insight and prediction of the processes involved could be derived, which, eventually, become useful tools for the management of similar lakes and reservoirs in the global change scenarios to come.
Even though major WLFs have been recorded in VB during the past 21 years, our observations demonstrated that this tropical reservoir lake behaves regularly as a monomictic tropical lake, exhibiting a long and stable stratification from spring to autumn and a circulation period during the winter [10,11,14,15]. Moderate seasonal changes in the water level of VB occur every year as a function of seasonal rainfall variations in its basin, but higher WLFs are results of longer-term climatic variability and management decisions that consider requirements of water for human consumption and water availability within the Cutzamala water supply system as a whole; thus, they occur on multi-annual time scales. Therefore, a long-term series, as the one here reported, is required to include enough water level variability to allow the identification of patterns and the effects of these variations in tropical deep lakes such as VB. The magnitude of WLFs in VB during this period was so high that a level decrease of up to almost 14 m was registered, which is more than half of the mean depth of the reservoir lake when it is at its maximum level. It is, however, remarkable that VB remained stratified during the warm months (March to November) of each and all of the years (2001–2021) included in our sampling period.

4.1. Hypolimnetic Warming Allows the Assessment of Vertical Mixing Rates during Stratification

Our temperature measurements also showed that the hypolimnion warmed steadily during every stratification in VB throughout the entire observation period, although the warming rate varied from year to year. We attribute this warming to vertical mixing events that are likely driven by internal waves caused by the wind pattern in VB, which has a very regular diurnal oscillation [11]. This is in agreement with the findings of [6,27,28,29] in similar systems, where internal waves have been proposed to drive boundary mixing and generate vertical nutrient transport. In the absence of other heat sources than vertical mixing in VB, we used the hypolimnetic warming rates to assess vertical mixing in VB during the stratification periods. Table 2 shows that our calculated coefficients (mean 9.9 × 10⁻⁶ m2 s−1, range 1.2 × 10⁻⁷ m2 s−1 to 5.0 × 10⁻⁵ m2 s−1) are amidst the range of values reported in specific studies of vertical diffusivity, even on the lower part of the range but always above molecular conductivity (10−8 m2 s−1), supporting the fact that we were investigating mixing processes. Higher average Kz than those we calculated have been reported, both in tropical (e.g., Lake Lanao [33] in the Philippines and Kranji Reservoir [34] in Singapore) and in temperate (e.g., Lake Constance [38] in the border between Germany and Switzerland) systems. In particular, at the intensely studied Lake Kinneret, where internal waves and boundary mixing are known to drive vertical mixing [36], measured vertical diffusivities are on average about an order of magnitude higher than our mean of monthly Kz estimates.
Nevertheless, our monthly vertical diffusivity values are, on average, comparable and slightly higher than those reported for other tropical lakes, including Lake Valencia [39] in Venezuela, Lake McIlvaine [40] in Rhodesia, and Lake Matano [41] in Indonesia, and are also higher than those found in some temperate lakes, such as Mono Lake [6,42], Lake Alpnach [43] in Switzerland and Castle Lake [44] in California. Similar to our findings, Kz values have been found to vary around three orders of magnitude within the metalimnetic layer [45].
When comparing with other vertical diffusivity reports, it should be noted that our estimates assessed the combined effect of vertical mixing events that occurred during a full month, i.e., between two consecutive sampling dates, while direct diffusivity measurements (such as most of those pooled together in Table 2) are performed on much smaller time scales and likely register the peak values that occur during mixing events. In contrast, our estimates are smoothed values over the full period between sampling and are likely more representative of the long-term mixing rates. For instance, at Lake Kinneret, where mixing processes are amongst the most well known, a study [36] outlines the variability that might affect the representativity of short-term measurements: “most of the time the vertical flux through the metalimnion was negligible, but, at times, the eddy diffusivity did reach values as high as 10−2 m2 s−1”. We believe that, by integrating the effect of these relevant vertical mixing pulses, our results likely better represent actual mixing rates at the near-monthly scale. Nevertheless, to fully verify this in future research, we will explore the mixing intensity at short-time scales.

4.2. Vertical Mixing Increases Up to Fivefold as the Water Level Decreases

In terms of their importance for VB, the magnitude of the vertical water exchange rates here calculated (Table 1) imply that 5–11% of the total volume of the reservoir lake is being exchanged monthly between layers during the stratification period of the years when the water level is relatively high. However, as Figure 5 shows, vertical mixing varied significantly among the stratification periods as a function of the lowest water level for each year. During the lowest water level years, the vertical exchange can reach up to 26% (e.g., 2009 and 2021) of the lake’s volume in a single month. When integrated for the full stratification periods, these volumes of water represent 40–83% of the total lake´s volume being exchanged between layers, and this exchange can reach up to 190% of the lake´s volume in the lower level and stronger mixing years, such as 2009 and 2021.
These magnitudes suggest that vertical transport can be much higher than what would be expected from the traditional paradigm of stratification and metalimnetic barrier [2] and could also provide a physical mechanism to explain the sustained heterotrophic behavior (e.g., sustained high respiration rates) found for VB even under stratification conditions [14], as discussed further ahead.
The calculated vertical nutrient fluxes also increased substantially during the low water level stratifications in VB (Figure 6), reaching the highest values among the relatively few systems for which these fluxes were assessed (Table 3). When the average for all the years in the 2001–2021 period are considered, including both lower and higher-level years, our estimates of vertical nutrient fluxes of SRP and ammonia in VB are similar to those that have been calculated for other lakes (Table 3), such as Kivu [46], Mendota [47], McIlwaine [40] and Malawi [48]. However, the vertical nutrient fluxes for the stratification of the years with the lowest water level (2009 and 2021) would be higher in VB than all those in Table 3, with the only exception of Lake Delavan in Wisconsin, where an SRP flux as high as 15.2 of mg P m−2 d−1 was estimated by [35]. This can be due to, in part, the relatively low proportion of our estimated SRP flux with respect to the DIN flux (overall mean 36.2), which can be due to P retention in the sediments] [49,50], as previously suggested by [15]. Nevertheless, when low-water years are compared with the rest, our results clearly show that the vertical nutrient flux from the hypolimnion increases in VB by an order of magnitude when the water level drops sharply (≈12 m), a factor that has not been considered in water reservoir management until now.

4.3. The Contribution of Vertical Nutrient Fluxes to the Surface Layer Budget Can More than Duplicate as the Water Level Decreases

It is also interesting to compare the vertical transport here calculated (due to internal loading) with the high N and P external loadings VB receives [15], mainly from urban wastewaters and agricultural land uses in the VB basin [52]. The nutrient vertical entrainment to the euphotic zone here reported represents, on average, about 12% of the total phosphorus annually entering the reservoir through its main tributaries (16.9 ± 8.7 mg P m−2 day−1 [15]). Nevertheless, this proportion clearly increases when the level falls below 8 m (Figure 6), and it can more than duplicate, reaching up to >35% if the level decreases to 12 m or more.
Thus, the water level can alter significantly the amount of nutrients available in the euphotic zone of the reservoir lake during stratification, and therefore, its primary production and functional eutrophication level, as identified by [14]. This is consistent with the particularity of VB being more productive during stratification than during the circulation period [13,14,17], during which nutrients would not be segregated to the hypolimnion and circulate freely. In fact, VB reaches its highest phytoplanktonic diatoms biomass peaks during the stratification periods, contrasting with warm monomictic lakes and reservoirs in either temperate zones or high altitudes at tropical latitudes which typically reach their highest phytoplanktonic diatoms biomasses during circulation [17].
The intensification of vertical mixing and nutrient transport during low water stratifications could favor more intensive recycling of nutrients in VB when the water level is low, while N and P fluxes to the sediments through sedimentation would likely be higher when the water level is high, and vertical transport decreases. Furthermore, the changes in metabolism found in VB [13], associated with the variation in vertical mixing, have been found to alter both the metabolic balance and the role of the reservoir lake as a source or sink of carbon to the atmosphere [14], and all this would depend largely on the variation in water level.

4.4. The Assessment of Vertical Nutrient Fluxes Also Helps Understanding Some Ecological Variations

A cascade of ecosystemic processes can be affected by boundary mixing and vertical nutrient transport, as has been addressed broadly in the literature [53,54,55,56,57,58]. At the same time, the temperature and nutrient signals of these processes are rapidly blurred in the surface layer, both by surface heat transport and by the multiple processes that make nutrients non-conservative, including competitive assimilation and transformation processes (e.g., [19,20,21,22]). Furthermore, N and P nutrients reaching the epilimnion are readily assimilated, keeping its surface concentration low, for example, in a typical stratification in VB [11]. However, there are also multiple indirect effects of vertical mixing and nutrient supply that have been observed in VB. Previous reports of oxygen dynamics in VB and plankton community composition and abundance [17,25] have been correlated with WLFs and boundary mixing, and comprise indirect evidence consistent with the nutrient transport results presented here. In more detail, the observation of ephemeral patches of oxygen below the photic zone (following the proposal of [59]), in the typically anoxic summer–autumn hypolimnion of VB [13], also supports the occurrence of frequent (≈daily) events of mixing during stratification. Moreover, low water periods, when our results indicate higher vertical mixing rates, were also correlated with higher respiration rates in VB in a 10 year-time series [14], pushing the metabolic balance to ecosystemic heterotrophy. This is likely because enhanced mixing makes possible the oxidation of reduced species accumulated in the hypolimnion, including ammonia [11] and organic matter [15].
Boundary mixing events in the summer stratified period have been also correlated with important impacts in the plankton communities, for example, with a diversification and biomass increase in the zooplankton community [13]. In particular, cladocerans and copepods have been observed to increase their abundance during low water level periods [13]. This is remarkable because rotifers are normally the most prevalent zooplankton group in VB [60]. Additionally, the enhancement of phytoplankton biomass has also been reported during a low water level stratification compared with the same period in a year of high water level conditions [17]. This is consistent with—and would be expected to occur as a result of—the intensification of nutrient inputs to the epilimnion through boundary mixing here predicted. Furthermore, important changes in phytoplankton groups were also observed in the same study, in which low water levels were characterized by increasing biomass of planktonic diatoms and a significant decrease in harmful cyanobacteria (filamentous Nostocales and coccoids, e.g., Microcystis). The effects of these changes in phytoplankton [17,58] and zooplankton [60] in the rest of the ecosystem are still to be studied. In particular, changes in zooplankton composition could favor fisheries availability [13]. Finally, there are also important effects of WLFs on littoral communities [9], which are still to be studied in VB.
Comprehension of lake and reservoir hydrodynamics is key for good water quality, for drinking water safety, as well as for predicting future changes [23]. Understanding the relationships between temperature and vertical transport is key to modeling emergent ecosystem functions in a warmer world [18]. In VB, vertical mixing and nutrient fluxes increases are evident when the level decreases below 8 m and can increase several-fold when the level falls down below 12 m. Altogether, the multiple consequences of WLFs in windy tropical lakes such as VB can alter both the ecology of the reservoir lake and its suitability for sustained water exploitation by the main users. The effects we identified here should be accounted for by water managers [18,23], who should outweigh them against the particular needs of water distribution and other reservoir lake uses when making decisions that may affect the water level of reservoirs and lakes.

5. Conclusions

The monomictic reservoir lake of VB exhibited hypolimnetic warming during all the stratification periods of 2001–2021. Vertical mixing calculated from this warming showed there is a significant vertical exchange in this reservoir lake during the stratification months, comparable to the vertical diffusivity found for other tropical and temperate water bodies where vertical mixing is important. Our results showed that vertical mixing during stratification increases in VB as the level of the reservoir lake decreases. We attribute this to the enhancement of boundary mixing events as internal waves intensify their interaction with the lake´s bottom and margins, as found for other lakes and reservoirs that have a similar wind forcing. Vertical diffusivity coefficients calculated for VB are within the range found in other water bodies, although they average the vertical mixing occurring over monthly-to-annual scales, while most direct measurements reported for other water bodies address peak mixing pulses.
The vertical nutrient transport in VB would be enough to overcome the stratification barrier and sustain the observed eutrophic conditions during stratification. This is consistent with the fact that VB is more productive during stratification than in the circulation period when nutrients are not segregated to the hypolimnion. Mixing and mean vertical nutrient entrainment to the epilimnion in VB is similar to in other studied systems but becomes much higher during years with low water levels. These increases become evident when the water level decreases more than 8 m below the reservoir capacity and can increase several-fold when the level drops down below 12 m. It is important that managers support long-term monitoring and also consider that water level also affects significantly the planktonic communities and the metabolic balance of the ecosystem, as well as the recycling of the external nutrient loading to the reservoir lake and the fraction accumulated at the bottom of VB.
Overall, our results provide insight into the physical controllers of the trophic status in windy tropical water bodies with high water-level fluctuations. It allows for the prediction of vertical mixing and nutrient entrainment as a function of the water level of lakes and reservoirs, providing an additional tool for water authorities and lake or reservoir users to improve their management strategies for VB and for similar water bodies.

Author Contributions

Conceptualization, M.M.-I.; methodology, M.M.-I., E.M.-R., J.A.R.-Z. and F.S.C.-S.; validation, M.M.-I. and S.S.-C.; formal analysis, J.A.R.-Z.; investigation, all authors participated in the data collection, including A.P.G.-A., L.M.L.-G., A.S.-R., J.G.Q.-T., R.G.-D.Z., J.J.-C., M.E.V.-R. and G.V.-F.; resources and data curation, F.S.C.-S.; writing—original draft preparation, M.M.-I., J.A.R.-Z. and P.M.V.-C.; writing—review and editing, M.M.-I., P.M.V.-C., G.V.-F., J.A.R.-Z. and M.B.-A.; visualization, J.A.R.-Z.; supervision, S.S.-C.; project administration and funding acquisition, M.M.-I. All authors have read and agreed to the published version of the manuscript.

Funding

This research was funded by UNAM (PAPIIT-IN207702 and PAPIIT-IN111321) and by CONACYT-SEMARNAT (C01-1125) projects to M.M.-I.

Institutional Review Board Statement

Not applicable.

Informed Consent Statement

Not applicable.

Data Availability Statement

Not applicable.

Acknowledgments

We thank Provalle A.C., Marina Azul, and Naútico Avandaro Sailing Clubs for their support of this research with boats and docking facilities. We also thank all the Aquatic Biogeochemistry Lab collaborators, including, Lourdes N. Murueta, Flor Árcega, Irina Cruz, Sofía Montalvo, Rebeca Sánchez, Claudia N. Saavedra, Patricia Memije, Alfredo Gallardo, Felipe Solís, Federico Serna Blanco, Arturo Alvarez, Felipe Solis, Mónica Olson, Karina Castro, Abraham Vargas, Julio Díaz-Valenzuela, Julio A. Lestayo-González, and all the students that have assisted us, both in the field and in the laboratory, during this 21 years of monitoring and analyses. We also acknowledge the stimulating support from VB lovers, particularly Alberto Dana, Esther Carrillo, Daniel Coranguez, and Tito Benítez.

Conflicts of Interest

The authors declare no conflict of interest. The funders had no role in the design of the study; in the collection, analyses, or interpretation of data; in the writing of the manuscript, or in the decision to publish the results.

References

  1. Imberger, J. Flux paths in a stratified lake: A review. In Physical Processes in Lakes and Oceans; Coastal and Estuarine Studies; American Geophysical Union: Washington, DC, USA, 1998; pp. 1–17. ISBN 9781118665381. [Google Scholar]
  2. Kalff, J. Limnology: Inland Water Ecosystems; Prentice Hall: Upper Saddle River, NJ, USA, 2002; ISBN 0130337757. [Google Scholar]
  3. Kamarainen, A.M.; Penczykowski, R.M.; van de Bogert, M.C.; Hanson, P.C.; Carpenter, S.R. Phosphorus sources and demand during summer in a eutrophic lake. Aquat. Sci. 2009, 71, 214–227. [Google Scholar] [CrossRef]
  4. Lean, D.R.S.; Abbott, A.A.; Pick, F. Phosphorus deficiency of lake Ontario plankton. Can. J. Fish. Aquat. Sci. 1987, 44, 2069–2076. [Google Scholar] [CrossRef]
  5. Staehr, P.; Sand-Jensen, K. Temporal dynamics and regulation of lake metabolism. Limnol. Oceanogr. 2007, 52, 108–120. [Google Scholar] [CrossRef] [Green Version]
  6. MacIntyre, S.; Flynn, K.M.; Jellison, R.; Romero, J.R. Boundary mixing and nutrient fluxes in Mono Lake, California. Limnol. Oceanogr. 1999, 44, 512–529. [Google Scholar] [CrossRef]
  7. MacIntyre, S.; Jellison, R. Nutrient fluxes from upwelling and enhanced turbulence at the top of the pycnocline in Mono Lake, California. Hydrobiologia 2001, 466, 13–29. [Google Scholar] [CrossRef]
  8. Auger, G.; Yamazaki, H.; Nagai, T.; Jiao, C.; Kumagai, M. Hypolimnetic turbulence generation associated with superposition of large-scale internal waves in a strongly stratified lake: Lake Biwa, Japan. Limnology 2013, 14, 229–238. [Google Scholar] [CrossRef]
  9. Zohary, T.; Ostrovsky, I. Ecological impacts of excessive water level fluctuations in stratified freshwater lakes. Inland Waters 2011, 1, 47–59. [Google Scholar] [CrossRef]
  10. Valdespino-Castillo, P.M.; Merino-Ibarra, M.; Ramírez-Zierold, J.A.; Castillo, F.S.; González-de-Zayas, R.; Carnero-Bravo, V. Hacia el inventario de flujos de carbono en aguas tropicales: Unificar métodos. Tecnol. Cienc. Agua 2019, 10, 234–252. [Google Scholar] [CrossRef]
  11. Merino-Ibarra, M.; Monroy-Ríos, E.; Vilaclara, G.; Castillo, F.S.; Gallegos, M.E.; Ramírez-Zierold, J. Physical and chemical limnology of a wind-swept tropical highland reservoir. Aquat. Ecol. 2007, 42, 335–345. [Google Scholar] [CrossRef]
  12. Merino, M.; Monroy, E.; Castillo, S.; Ramírez, J.; Gallegos, M.E.; Alcocer, J. Wind-driven upwelling indicated by hydrological variability in a tropical eutrophied reservoir, Valle de Bravo, Mexico. In Proceedings of the 4th International Conference on Reservoir Limnology and Water Quality, České Budějovice, Czech Republic, 12–16 August 2002; pp. 228–231. [Google Scholar]
  13. Valdespino-Castillo, P.M.; Merino-Ibarra, M.; Jiménez-Contreras, J.; Sandoval, F.S.C.; Ramírez-Zierold, J.A. Community metabolism in a deep (stratified) tropical reservoir during a period of high water-level fluctuations. Environ. Monit. Assess. 2014, 186, 6505–6520. [Google Scholar] [CrossRef] [Green Version]
  14. Guimarais-Bermejo, M.O.; Merino-Ibarra, M.; Valdespino-Castillo, P.; Sandoval, F.S.C.; Ramírez-Zierold, J.A. Metabolism in a deep hypertrophic aquatic ecosystem with high water-level fluctuations: A decade of records confirms sustained net heterotrophy. PeerJ 2018, 6, e5205. [Google Scholar] [CrossRef] [PubMed] [Green Version]
  15. Ramírez-Zierold, J.A.; Merino-Ibarra, M.; Monroy-Ríos, E.; Olson, M.; Castillo, F.S.; Gallegos, M.E.; Vilaclara, G. Changing water, phosphorus and nitrogen budgets for Valle de Bravo reservoir, water supply for Mexico City Metropolitan Area. Lake Reserv. Manag. 2010, 26, 23–34. [Google Scholar] [CrossRef]
  16. Fadel, A.; Lemaire, B.J.; Vinçon-Leite, B.; Atoui, A.; Slim, K.; Tassin, B. On the successful use of a simplified model to simulate the succession of toxic cyanobacteria in a hypereutrophic reservoir with a highly fluctuating water level. Environ. Sci. Pollut. Res. 2017, 24, 20934–20948. [Google Scholar] [CrossRef] [PubMed]
  17. Valeriano-Riveros, M.E.; Vilaclara, G.; Castillo-Sandoval, F.S.; Merino-Ibarra, M. Phytoplankton composition changes during water level fluctuations in a high-altitude, tropical reservoir. Inland Waters 2014, 4, 337–348. [Google Scholar] [CrossRef]
  18. May, L.; Aura, C.M.; Becker, V.; Briddon, C.L.; Carvalho, L.R.; Dobel, A.J.; Jamwal, P.; Kamphuis, B.; Marinho, M.M.; McGowan, S.; et al. Getting into hot water: Water quality in tropical lakes in relation to their utilisation. IOP Conf. Ser. Earth Environ. Sci. 2021, 789, 012021. [Google Scholar] [CrossRef]
  19. Bootsma, H.A.; Hecky, R.E. Water Quality Report, Lake Malawi/Nyasa Biodiversity Conservation Project; Southern African Development Community (SADC/GEF): Gaborone, Botswana; Global Environment Facility (GEF): Washington, DC, USA, 1999. [Google Scholar]
  20. Palter, J.; Lozier, M.S.; Barber, R.T. The effect of advection on the nutrient reservoir in the North Atlantic subtropical gyre. Nature 2005, 437, 687–692. [Google Scholar] [CrossRef] [PubMed]
  21. Lin, S.-S.; Shen, S.-L.; Zhou, A.; Lyu, H.-M. Assessment and management of lake eutrophication: A case study in Lake Erhai, China. Sci. Total Environ. 2021, 751, 141618. [Google Scholar] [CrossRef]
  22. Díaz-Torres, O.; de Anda, J.; Lugo-Melchor, O.Y.; Pacheco, A.; Orozco-Nunnelly, D.A.; Shear, H.; Senés-Guerrero, C.; Gradilla-Hernández, M.S. Rapid changes in the phytoplankton community of a subtropical, shallow, hypereutrophic lake during the rainy season. Front. Microbiol. 2021, 12, 415. [Google Scholar] [CrossRef] [PubMed]
  23. Ishikawa, M.; Bleninger, T.; Lorke, A. Hydrodynamics and mixing mechanisms in a subtropical reservoir. Inland Waters 2021, 11, 1–16. [Google Scholar] [CrossRef]
  24. Alcocer, J.; Merino-Ibarra, M.; Ramírez-Zierold, J.A.; Oseguera, L.A.; Cortés-Guzmán, D.; Castillo-Sandoval, F.S.; Guzmán-Arias, A.P.; Pérez-Ramírez, M.G. Lake Alchichica limnology. In Lake Alchichica Limnology. The Uniqueness of a Tropical Maar Lake; Springer Nature: Berlin/Heidelberg, Germany, 2021; p. 491. ISBN 978-3-030-79095-0. in press. [Google Scholar]
  25. Nandini, S.; Merino-Ibarra, M.; Sarma, S.S.S. Seasonal changes in the zooplankton abundances of the reservoir Valle de Bravo (State of Mexico, Mexico). Lake Reserv. Manag. 2008, 24, 321–330. [Google Scholar] [CrossRef] [Green Version]
  26. Kirkwood, D.S. Sanplus Segmented Flow Analyzer and its Applications. Seawater Analysis; Skalar: Amsterdam, The Netherlands, 1994. [Google Scholar]
  27. Thorpe, S.A. Statically unstable layers produced by overturning internal gravity waves. J. Fluid Mech. 1994, 260, 333–350. [Google Scholar] [CrossRef]
  28. MacIntyre, S.; Melack, J.M. Vertical and horizontal transport in lakes: Linking littoral, benthic, and pelagic habitats. J. N. Am. Benthol. Soc. 1995, 14, 599–615. [Google Scholar] [CrossRef]
  29. Ostrovsky, I.; Yacobi, Y.Z.; Walline, P.; Kalikhman, I. Seiche-induced mixing: Its impact on lake productivity. Limnol. Oceanogr. 1996, 41, 323–332. [Google Scholar] [CrossRef]
  30. Idso, S.B. On the concept of lake stability 1. Limnol. Oceanogr. 1973, 18, 681–683. [Google Scholar] [CrossRef]
  31. MacIntyre, S. Vertical mixing in a shallow, eutrophic lake: Possible consequences for the light climate of phytoplankton. Limnol. Oceanogr. 1993, 38, 798–817. [Google Scholar] [CrossRef]
  32. Brookes, J. Effects of diurnal vertical mixing and stratification on phytoplankton productivity in geothermal Lake Rotowhero, New Zealand. Inland Waters 2013, 3, 369–376. [Google Scholar] [CrossRef] [Green Version]
  33. Lewis, W.M. Vertical eddy diffusivities in a large tropical lake 1. Limnol. Oceanogr. 1982, 27, 161–163. [Google Scholar] [CrossRef]
  34. Yang, P.; Fong, D.A.; Lo, E.; Monismith, S.G. Vertical mixing in a shallow tropical reservoir. Limnology 2019, 20, 279–296. [Google Scholar] [CrossRef]
  35. Stauffer, R.E. Vertical nutrient transport and its effects on epilimnetic phosphorus in four calcareous lakes. Hydrobiologia 1987, 154, 87–102. [Google Scholar] [CrossRef]
  36. Saggio, A.; Imberger, J. Mixing and turbulent fluxes in the metalimnion of a stratified lake. Limnol. Oceanogr. 2001, 46, 392–409. [Google Scholar] [CrossRef]
  37. Bormans, M.; Ford, P.W.; Fabbro, L.; Hancock, G. Onset and persistence of cyanobacterial blooms in a large impounded tropical river, Australia. Mar. Freshw. Res. 2004, 55, 1–15. [Google Scholar] [CrossRef]
  38. Preusse, M.; Peeters, F.; Lorke, A. Internal waves and the generation of turbulence in the thermocline of a large lake. Limnol. Oceanogr. 2010, 55, 2353–2365. [Google Scholar] [CrossRef] [Green Version]
  39. Lewis, W.M.J. Temperature, heat, and mixing in Lake Valencia, Venezuela 1. Limnol. Oceanogr. 1983, 28, 273–286. [Google Scholar] [CrossRef] [Green Version]
  40. Robarts, R.D.; Ward, P.R.B. Vertical diffusion and nutrient transport in a tropical lake (Lake McIlwaine, Rhodesia). Hydrobiologia 1978, 59, 213–221. [Google Scholar] [CrossRef]
  41. Katsev, S.; Crowe, S.A.; Mucci, A.; Sundby, B.; Nomosatryo, S.; Haffner, G.D.; Fowle, D.A. Mixing and its effects on biogeochemistry in the persistently stratified, deep, tropical Lake Matano, Indonesia. Limnol. Oceanogr. 2010, 55, 763–776. [Google Scholar] [CrossRef]
  42. Jellison, R.; Melack, J.M. Meromixis in hypersaline Mono Lake, California. 1. Stratification and vertical mixing during the onset, persistence, and breakdown of meromixis. Limnol. Oceanogr. 1993, 38, 1008–1019. [Google Scholar] [CrossRef]
  43. Goudsmit, G.-H.; Peeters, F.; Gloor, M.; Wüest, A. Boundary versus internal diapycnal mixing in stratified natural waters. J. Geophys. Res. Space Phys. 1997, 102, 27903–27914. [Google Scholar] [CrossRef] [Green Version]
  44. Jassby, A.; Powell, T. Vertical patterns of eddy diffusion during stratification in Castle Lake, California 1. Limnol. Oceanogr. 1975, 20, 530–543. [Google Scholar] [CrossRef]
  45. Lin, S.; Boegman, L.; Rao, Y. Characterizing spatial and temporal distributions of turbulent mixing and dissipation in Lake Erie. J. Great Lakes Res. 2021, 47, 168–179. [Google Scholar] [CrossRef]
  46. Pasche, N.; Dinkel, C.; MuxFCller, B.; Schmid, M.; Est, A.W.; Wehrli, B. Physical and biogeochemical limits to internal nutrient loading of meromictic Lake Kivu. Limnol. Oceanogr. 2009, 54, 1863–1873. [Google Scholar] [CrossRef] [Green Version]
  47. Kamarainen, A.M.; Yuan, H.; Wu, C.H.; Carpenter, S.R. Estimates of phosphorus entrainment in Lake Mendota: A comparison of one-dimensional and three-dimensional approaches. Limnol. Oceanogr. Methods 2009, 7, 553–567. [Google Scholar] [CrossRef]
  48. Hamblin, P.F.; Bootsma, H.A.; Hecky, R.E. Modeling nutrient upwelling in Lake Malawi/Nyasa. J. Great Lakes Res. 2003, 29, 34–47. [Google Scholar] [CrossRef]
  49. Duan, S.; Newcomer-Johnson, T.; Mayer, P.; Kaushal, S. Phosphorus retention in stormwater control structures across streamflow in urban and suburban watersheds. Water 2016, 8, 390. [Google Scholar] [CrossRef] [Green Version]
  50. Lau, M.P.; Valerio, G.; Pilotti, M.; Hupfer, M. Intermittent meromixis controls the trophic state of warming deep lakes. Sci. Rep. 2020, 10, 1–16. [Google Scholar] [CrossRef]
  51. Edwards, R.L.; Priscu, J.C. McMurdo LTER: Relationships between vertical nutrient flux and phytoplankton biomass and productivity in lakes of the Taylor Valley, Antarctica. Antarct. J. US 1995, 30, 294–295. [Google Scholar]
  52. Cendejas, J.C.; Ramírez, L.M.; Zierold, J.R.; Valenzuela, J.D.; Ibarra, M.M.; de Tagle, S.M.S.; Téllez, A.C. Evaluation of the impacts of land use in water quality and the role of nature-based solutions: A citizen science-based study. Sustainability 2021, 13, 10519. [Google Scholar] [CrossRef]
  53. Pomati, F.; Matthews, B.; Jokela, J.; Schildknecht, A.; Ibelings, B.W. Effects of re-oligotrophication and climate warming on plankton richness and community stability in a deep mesotrophic lake. Oikos 2012, 121, 1317–1327. [Google Scholar] [CrossRef]
  54. Matzinger, A.; Schmid, M.; Veljanoska-Sarafiloska, E.; Patceva, S.; Guseska, D.; Wagner, B.; Müller, B.; Sturm, M.; Wüest, A. Eutrophication of ancient Lake Ohrid: Global warming amplifies detrimental effects of increased nutrient inputs. Limnol. Oceanogr. 2007, 52, 338–353. [Google Scholar] [CrossRef]
  55. Rabalais, N.N.; Turner, R.E.; Díaz, R.J.; Justić, D. Global change and eutrophication of coastal waters. ICES J. Mar. Sci. 2009, 66, 1528–1537. [Google Scholar] [CrossRef]
  56. Boyce, D.G.; Lewis, M.R.; Worm, B. Global phytoplankton decline over the past century. Nature 2010, 466, 591–596. [Google Scholar] [CrossRef]
  57. Bartosiewicz, M.; Przytulska, A.; Deshpande, B.N.; Antoniades, D.; Cortes, A.; MacIntyre, S.; Lehmann, M.; Laurion, I. Effects of climate change and episodic heat events on cyanobacteria in a eutrophic polymictic lake. Sci. Total Environ. 2019, 693, 133414. [Google Scholar] [CrossRef]
  58. Xu, H.; Yan, M.; Long, L.; Ma, J.; Ji, D.; Liu, D.; Yang, Z. Modeling the effects of hydrodynamics on thermal stratification and algal blooms in the Xiangxi Bay of Three Gorges Reservoir. Front. Ecol. Evol. 2021, 8, 453. [Google Scholar] [CrossRef]
  59. De Crop, W.; Verschuren, D. Determining patterns of stratification and mixing in tropical crater lakes through intermittent water-column profiling: A case study in western Uganda. J. Afr. Earth Sci. 2019, 153, 17–30. [Google Scholar] [CrossRef]
  60. Gutiérrez, S.G.; Sarma, S.S.S.; Nandini, S. Seasonal variations of rotifers from a high altitude urban shallow water body, La Cantera Oriente (Mexico City, Mexico). Chin. J. Oceanol. Limnol. 2016, 35, 1387–1397. [Google Scholar] [CrossRef]
Figure 1. Bathymetric map of Valle de Bravo (VB) reservoir lake (modified from [15]) showing sampling stations, main inputs (rivers and sewages), and water withdrawal route. Central station sampled throughout the studied period indicated by ♦. Depth contours in m below the maximum level of the lake. Daily wind pathways over both arms are also indicated (➔).
Water 13 03011 g001
Figure 2. Observed daily thermocline oscillation driven by diurnal wind forcing in VB (top diagrams, taken from [12]), and conceptual mixing model processes considered (see Section 2.4 for further explanation). BM and the spiral symbols represent the boundary mixing events that occur due to the interaction of the thermocline with the bottom and margins of the reservoir lake.
Water 13 03011 g002
Figure 3. Time variations in VB during 2001–2021 o: (a) water level (daily resolution, m a.s.l), (b) stability of stratification (S, J m−2), and (c) relationship between mean S and minimum water level during the stratification periods. Red lines outline the four years with extraordinary minimum water levels (2006, 2009, 2013, and 2021) in some of the graphs.
Water 13 03011 g003
Figure 4. Temperature distribution and hypolimnetic water warming in VB during 2001–2021: (a) temporal evolution of the vertical distribution of temperature (°C) in this reservoir lake, in which the 22.5 °C isotherms is used to outline the epilimnion; (b) hypolimnetic temperature variation (°C) during each stratification period sampled from 2001 to 2021 (the slopes of the regressions were used to assess the mean warming rate for each of the stratifications), in which the four years with extraordinary minimum water levels (2006, 2009, 2013, and 2021) are outlined in red; (c) variation in the mean hypolimnetic temperature increase rate (°C day−1) as a function of the minimum annual water level throughout 2001–2021.
Water 13 03011 g004
Figure 5. (a) Mean vertical mixing rates (Mixmeta-hypo, 106 m3day−1) and (b) Kz (m2 s−1) plotted against the annual minimum water level (m a.s.l.) of VB during 2001–2021.
Water 13 03011 g005
Figure 6. Mean rates of nutrient vertical flux (F) of (a) SRP (mg P m−2 day−1) and (b) DIN (mg N m−2 day−1) plotted against the annual minimum water level (m a.s.l) of VB during 2001–2021.
Water 13 03011 g006
Table 1. Mean vertical water mixing rates (106 m3 day−1), mean vertical diffusivity coefficients, Kz (m2 s−1), and mean rates of nutrient vertical flux, F, of SRP (mg P m−2 day−1) and DIN (mg N m−2 day−1) calculated for the stratification periods of 2001–2021 in VB.
Stratification
Period
Mixmeta-hypo
(106 m3 day−1)
Kz
(m2 s−1)
F (SRP)
(mg P m−2 day−1)
F (DIN)
(mg N m−2 day−1)
20010.8613.3 × 10−60.7915.9
20020.9243.6 × 10−62.0328.0
20031.0574.1 × 10−60.5720.3
20040.8803.4 × 10−61.0321.7
20051.0464.0 × 10−60.6821.1
20061.6916.5 × 10−61.1271.5
20071.2124.7 × 10−60.4213.0
20081.9637.6 × 10−64.7531.6
20093.37313.0 × 10−65.9997.1
20101.4395.6 × 10−62.6417.0
20111.2714.9 × 10−61.5418.6
20121.4466.6 × 10−61.9530.4
20132.3499.1 × 10−65.1173.8
20140.8323.2 × 10−62.247.6
20150.6392.5 × 10−61.305.8
20160.7122.7 × 10−61.5212.5
20171.2965.0 × 10−61.1732.0
20181.1804.6 × 10−60.5630.4
20191.0594.1 × 10−62.6536.3
20200.6912.6 × 10−61.2041.0
20213.51513.6 × 10−65.27101.7
2001–2021 Mean1.2893.1 × 10−62.1234.6
Table 2. Mean and range of the vertical diffusion coefficients Kz (m2 s−1) obtained for VB during the stratification periods of 2001–2021 and a comparison with Kz reported for other water bodies. The mean and range (in parenthesis) of Kz values are included. Data are ordered from higher to lower Kz mean values, and the position of VB among other lakes and reservoirs is outlined in bold characters and green shading. When not reported, mean Kz were calculated from the values available. The value for molecular conductivity is included to show the lower limit of Kz when mixing is null, and only molecular movements occur.
KzLocationReference
Mean(Range)
9.9 × 10⁻⁶(1.2 × 10⁻⁷–5.0 × 10⁻⁵)VB (monthly)This study
3.1 × 10⁻⁶(2.5 × 10⁻⁶–13.6 × 10⁻⁶)VB (annual mean)This study
5.0 × 10⁻⁴(1.0 × 10⁻⁵–1.0 × 10⁻³)North Lake, Australia[31] MacIntyre 1993
1.0 × 10⁻⁴(8.0 × 10⁻⁵–1.3 × 10⁻⁴)Lake Rotowhero, New Zealand[32] Brookes et al. 2013
6.5 × 10⁻⁵(2.2 × 10⁻⁵–1.1 × 10⁻⁴)Lake Lanao, Philippines[33] Lewis 1982
5.1 × 10⁻⁵(1.0 × 10⁻⁶–1.0 × 10⁻⁴)Lake Biwa, Japan[8] Auger et al. 2014
5.1 × 10⁻⁵(1.0 × 10⁻⁶–1.0 × 10⁻⁴)Kranji Reservoir, Singapore[34] Yang et al. 2019
4.5 × 10⁻⁵(1.0 × 10⁻⁶–9.0 × 10⁻⁵)Green Lake,[35] Stauffer 1987
4.5 × 10⁻⁵(8.0 × 10⁻⁵–1.0 × 10⁻⁵)Lake Kinneret, Israel[36] Saggio and Imberger 2001
1.8 × 10⁻⁵(1.6 × 10⁻⁵–2.1 × 10⁻⁵)Fitzroy River Barrage, Australia[37] Bormans et al. 2004
1.2 × 10⁻⁵ Lake Constance, Germany-Switzerland[38] Preusse et al. 2010
9.9 × 10⁻⁶(4.0 × 10⁻⁸–5.0 × 10⁻⁵)Valle de Bravo (monthly)This study
6.0 × 10⁻⁶(9.0 × 10⁻⁶–1.1 × 10⁻⁵)Lake Valencia, Venezuela[39] Lewis 1983
6.0 × 10⁻⁶(6.0 × 10⁻⁶–5.0 × 10⁻⁵)Lake McIlwaine, Rhodesia[40] Robarts and Ward 1978
5.0 × 10⁻⁶ Lake Matano, Indonesia[41] Katsev et al. 2010
3.4 × 10⁻⁶(1.0 × 10⁻⁷–2.6 × 10⁻⁵)Mono Lake, California[42] Jellison and Melack 1993
3.1 × 10⁻⁶(2.5 × 10⁻⁶–13.6 × 10⁻⁶)Valle de Bravo (annual mean)This study
2.2 × 10⁻⁶(3.0 × 10⁻⁶–8.0 × 10⁻⁵)Lake Alpnach (central Switzerland)[43] Goudsmith et al. 1997
1.3 × 10⁻⁶(2.0 × 10⁻⁷–2.5 × 10⁻⁶)Castle Lake, California[44] Jassby and Powell 1975
1.0 × 10⁻⁶(1.0 × 10⁻⁸–1.0 × 10⁻⁴)Mono Lake, California[6] MacIntyre et al. 1999
1.0 × 10⁻⁸ Molecular conductivity[6] MacIntyre et al. 1999
Table 3. Mean Nutrient fluxes obtained for VB during the stratification periods of 2001–2021 and during the stratifications with the lowest water level. Fluxes reported from other lakes are also included for comparison. Other lakes’ data are ordered by increasing SRP flux, and the position of VB fluxes among these values is outlined in bold characters and green shading.
SRP
(mg P m−2 day−1)
Ammonia
(mg N m−2 day−1)
DIN
(mg N m−2 day−1)
LakeReference
0.10 Lake Fish, Wisconsin, USA[35] Stauffer 1987
1.606.2 Lake McIlwaine, Rhodesia[40] Robarts and Ward 1978
2.1213.934.6Valle de Bravo (overall mean)This study
2.71 Lake Kivu, Africa[46] Pasche et al. 2009
2.59 Lake Mendota, Wisconsin, USA[47] Kamarainen et al. 2009
~3.00~20.0 Lake Malawi/Nyasa, Africa[48] Hamblin et al. 2003
3.20 Lakes of Taylor Valley, Antarctica[51] Edwards and Priscu 1995
5.50 Lake Green, Wisconsin, USA[35] Stauffer 1987
5.9966.0101.7Valle de Bravo (lowest water level)This study
15.20 Lake Delavan, Wisconsin, USA[35] Stauffer 1987
39.2 Mono Lake, California, USA[6] MacIntyre et al. 1999
Publisher’s Note: MDPI stays neutral with regard to jurisdictional claims in published maps and institutional affiliations.

