Article

Genome Sequencing of SARS-CoV-2 Allows Monitoring of Variants of Concern through Wastewater

1
Environmental Research and Innovation Department (ERIN), Luxembourg Institute of Science and Technology (LIST), L-4422 Belvaux, Luxembourg
2
Luxembourg Centre for Systems Biomedicine, University of Luxembourg, 7 Avenue des Hauts-Fourneaux, L-4362 Esch-sur-Alzette, Luxembourg
3
Laboratoire National de Santé, Department of Microbiology, 1 Rue Louis Rech, L-3555 Dudelange, Luxembourg
4
Department of Life Sciences and Medicine, Faculty of Science, Technology and Medicine, University of Luxembourg, 2 Avenue de l’Université, L-4362 Esch-sur-Alzette, Luxembourg
*
Author to whom correspondence should be addressed.
Water 2021, 13(21), 3018; https://doi.org/10.3390/w13213018
Submission received: 27 September 2021 / Revised: 21 October 2021 / Accepted: 22 October 2021 / Published: 27 October 2021
(This article belongs to the Special Issue SARS-CoV-2 in Wastewater: Methods, Epidemiology and Future Goals)

Abstract

:
Monitoring SARS-CoV-2 in wastewater has shown to be an effective tool for epidemiological surveillance. More specifically, RNA levels determined with RT-qPCR have been shown to track with the infection dynamics within the population. However, the surveillance of individual lineages circulating in the population based on genomic sequencing of wastewater samples is challenging, as the genetic material constitutes a mixture of different viral haplotypes. Here, we identify specific signature mutations from individual SARS-CoV-2 lineages in wastewater samples to estimate lineages circulating in Luxembourg. We compare circulating lineages and mutations to those detected in clinical samples amongst infected individuals. We show that especially for dominant lineages, the allele frequencies of signature mutations correspond to the occurrence of particular lineages in the population. In addition, we provide evidence that regional clusters can also be discerned. We focused on the time period between November 2020 and March 2021 in which several variants of concern emerged and specifically traced the lineage B.1.1.7, which became dominant in Luxembourg during that time. During the subsequent time points, we were able to reconstruct short haplotypes, highlighting the co-occurrence of several signature mutations. Our results highlight the potential of genomic surveillance in wastewater samples based on amplicon short-read data. By extension, our work provides the basis for the early detection of novel SARS-CoV-2 variants.

1. Introduction

The severe acute respiratory syndrome coronavirus 2 (SARS-CoV-2) pandemic has dramatically affected all countries worldwide. In Luxembourg, the first SARS-CoV-2 positive case was identified on 29 February 2020, also marking the beginning of the national genomic surveillance by sequencing. A large proportion of SARS-CoV-2 positive samples has been sequenced to identify viral lineages in circulation, and aggregated results are published weekly (https://lns.lu/revilux; accessed on 12 July 2021). Monitoring efforts also include a mass screening program to regularly perform RT-qPCR tests on residents and crossborder workers [1].
Additionally, biweekly monitoring of Luxembourg wastewater samples provides an overview of up to 73% of the population (https://www.list.lu/en/covid-19/coronastep/; accessed on 9 June 2021). While SARS-CoV-2 is primarily transmitted through aerosols [2], the virus can also persistently be detected in the urine and feces of infected people [3,4,5]. The presence of this virus in the excreta of infected patients led researchers to question its transmission through the water cycle and its persistence in the environment [6,7,8]. Based on current knowledge, the ability of the SARS-CoV-2 to be present and transported in water systems exists, but transmission via water currently seems unlikely [9]. From an epidemiological point of view, the concentration of SARS-CoV-2 in wastewater has been shown to be proportional to the number of COVID-19 cases in the catchment area, which enables wastewater-based surveillance [10,11,12,13,14]. Even though, further evaluation is required in terms of transmissibility [15] or stability [16] of SARS-CoV-2 in effluents, wastewater-based surveillance emerged as a valuable monitoring tool [17,18] with the potential to mitigate delays of individual testing [11].
In addition to its role as an early warning system, wastewater-based surveillance also offers the possibility of identifying the dominant variant of SARS-CoV-2 in order to reconstruct viral phylogenies [19]. Since both symptomatic and asymptomatic individuals contribute to sewage inputs, the resulting pooled sample of excreta from the entire population may provide a more complete picture of the genomic diversity of SARS-CoV-2 circulating in a community than clinical testing and sequencing alone. The regular appearance of novel variants of concern (VOCs), such as B.1.1.7 [20], P.1 [21], B.1.351 [22] and more recently B.1.617.2 [23], further illustrates the need for a genotypic surveillance. These VOCs are generally associated with increased infectivity [22,24], and they quickly started to emerge as dominant lineages in several countries by the end of 2020. The SARS-COV-2 B.1.617.2 variant is currently spreading quickly across Europe and has now become the dominant strain across much of the region. It continues to spread, displacing the circulation of other variants.
To identify viral genotypes from wastewater treatment plant (WWTP) samples, commonly targeted sequencing approaches are applied in which overlapping amplicons covering the SARS-CoV-2 genome are sequenced [25]. However, also untargeted metatranscriptomic sequencing followed by viral enrichment can provide sufficient information to distinguish circulating genotypes [26]. The identified strains or mutations frequently correspond to those detected in a clinical setting [27,28], but genomic sequencing of wastewater samples also provides the possibility to detect novel mutations [29]. However, genotyping SARS-CoV-2 in wastewater remains challenging as the samples represent a mixture of viral genomes and, particularly with short-read data, provide insufficient phasing information to reconstruct viral haplotypes [27]. Tracing individual signature mutations in wastewater can provide valuable information on the spread of VOCs [17], and the allele frequencies of individual mutations could be linked to observations from clinical sequencing early on during the pandemic [30].
Here, we present an approach to assess SARS-CoV-2 lineages circulating in the Luxembourg population from genomic sequencing of WWTP samples. We compare characteristic mutations of lineages present in patient-derived consensus sequences to corresponding mutations detected in wastewater over time and by location. Additionally, we reconstruct haplotypes of specific genomic regions from short-read data based on mutation co-occurrence. Our results emphasize the role of wastewater-based genomic epidemiology particularly regarding tracing the spread of novel VOCs.

2. Materials and Methods

2.1. Wastewater Sample Collection and Processing

Wastewater samples were collected throughout the country (Luxembourg) at the inlet of 13 WWTPs of various sizes and capacities, namely Beggen (BEG), Bettembourg (BET), Bleesbruck (BLEE), Boevange (BOEV), Echternach (ECH), Grevenmacher (GRE), Hespérange (HESP), Mersch (MER), Pétange (PET), Schifflange (SCH), Troisvierges (VIE), Uebersyren (UEB) and Wiltz (WIL). Altogether, the monitored WWTPs cover approximately 73% of the population of Luxembourg (445,302 people of a total of 614,000, census of 2019). Samples analyzed in this study were collected between 30 March 2020 and 4 March 2021.
Wastewater samples were collected over a 24 h period using automatic samplers (Teledyne ISCO, Lincoln, NE, USA). Each composite sample was then transported to the laboratory at 4 °C, and viral RNA was isolated on the day of sampling. Larger particles (debris, bacteria) were removed from the samples by centrifugation at 2400× g for 20 min at 4 °C. A volume of 120 mL of supernatant was filtered through Amicon® Plus-15 centrifugal ultrafilter with a cutoff of 10 kDa (Millipore, Burlington, MA, USA) by centrifugation at 3220× g for 25 min at 4 °C. The resulting concentrate was collected, and 140 µL was then processed to manually extract viral RNA using the QIAamp Viral RNA mini kit (Qiagen, Hilden, Germany), according to the manufacturer’s protocol. Elution of viral RNA was performed in 60 μL of elution buffer and stored at −80 °C until RT-qPCR analysis.

2.2. SARS-CoV-2 RNA Detection in Wastewater Samples

After RNA extraction, detection of SARS-CoV-2 RNA was performed by RT-qPCR. The Allplex™ SARS-CoV-2 Assay kit (Seegene, Düsseldorf, Germany) was used for the detection of 4-target genes (E gene, RdRP gene, N gene and S gene) for multiplex RT-qPCR, according to the manufacturers’ protocol. Fluorophores used for E gene of Sarbecovirus, RdRP/S gene, and N gene of SARS-CoV-2 were FAM, Cal Red 610 and Quasar 670, respectively. The PCR plate with 94 wells of samples’ extracted RNA and 2 wells for positive and negative controls were prepared on the Seegene STARlet®. RT-qPCR was carried out on the CFX96™ Real-Time PCR Detection System® (Bio-Rad, Hercules, CA, USA) with the following cycling conditions: initial phase 50 °C for 20 min, second phase: 95 °C for 15 min, third phase: 45 cycles of 10 s at 95 °C, followed by 60 °C for 15 s, and final fourth phase 10 s at 72 °C. The samples were analyzed with the Seegene® Viewer Software v3.19.001 (Seegene, Düsseldorf, Germany).

2.3. Amplicon Sequencing of Wastewater Samples

Wastewater samples presenting one of the three SARS-CoV-2-specific CT values resulting from the Allplex™ SARS-CoV-2 Assay below 35 were subjected to an amplicon sequencing method initially implemented for the clinical samples. First, viral RNA reverse transcription and amplification was performed using a primer scheme based on the ARTIC version 1 protocol (https://www.protocols.io/view/ncov-2019-sequencing-protocol-bbmuik6w; accessed on 15 July 2021), generating 100 overlapping fragments of approximately 900 bp according to an adaptation of the initial primer scheme. Then, library preparation was performed with the DNA Prep, (M) Tagmentation kit (Illumina, San Diego, CA, USA) using 1–2 indexes to sequence 96–192 samples per flow cell, following the manufacturers’ instructions adapted for a paired-end 150 bp strategy. Samples were processed for sequencing on a MiniSeq® or MiSeq® instrument (Illumina, San Diego, CA, USA).
A total of 157 SARS-CoV-2 positive wastewater samples were selected for sequencing according to the above criterion. Among them, sequencing data were obtained for 98 samples, mappings for 92, of which 79 samples had at least 70% reference coverage. Samples utilized for the analysis of mutations (79) were collected between 30 March 2020 and 4 March 2021 with most samples (58) collected between week 42 of 2020 and week 1 of 2021. Of the 13 sampling locations considered here, most samples used for the mutation analysis were obtained from the following 5 sites: BEG (18), PET (13), SCH (11), BET (7) and HESP (7).

2.4. SARS-CoV-2 Genome Sequences from Luxembourg Patients

Consensus SARS-CoV-2 genome sequences for Luxembourg patients (min. reference genome coverage 90%) were downloaded from GISAID [31] on the 4 June 2021, which included 9133 sequences in total and 5149 sequences dating from 29 February 2020 to 8 March 2021. The genome sequences were analyzed with a pipeline based on Nextstrain, Washington, DC, USA, [32], including alignments to the reference sequence NC_045512.2, calling of single nucleotide polymorphisms (SNPs), and assignment of PANGO lineages with Pangolin v.3.1.7 (https://github.com/cov-lineages/pangolin; accessed on 16 July 2021). Virus variant call format (VCF) files were annotated with the SARS-CoV-2 28 April 2020 version of Annovar [33]. Location information, i.e., the affiliated WWTP to a patient’s postal address, could be matched to 6641 sequences in total and 3762 sequences dating from 29 February 2020 to 8 March 2021.

2.5. Lineage Specific Signature Mutations

Clinical sequences could be assigned to 123 distinct PANGO lineages. Characteristic amino acid mutations for each of the lineages appearing in clinical samples were downloaded from outbreak.info (https://outbreak.info/ accessed on 15 July 2021). Characteristic mutations were considered signature mutations if they appeared uniquely in only one specific PANGO lineage within the set of Luxembourg patient consensus sequences.
Additionally, sublineages were grouped to reduce complexity. Sequences not assigned to a “B” lineage were grouped to the first level (“A”, “C”, “P”), and all “B” sub-lineages except “B.1.1.X” were grouped (e.g., B.1.177.77 was grouped with B.1.177 and B.1.160.28 was grouped with B.1.160). In addition, for grouped lineages, unique signature mutations were determined and utilized as markers to compare allele frequencies. We focused on the most common lineages with sufficient representation in signature mutations (at least 3), in genome sequences from SARS-CoV-2 positive individuals in Luxembourg: B.1.1.420, B.1.1.7, B.1.160, B.1.177, B.1.221, B.1.258, B.1.351 and B.1.474.

2.6. Variant Calling

FASTQ raw reads were preprocessed using IMP pipeline version 3 (https://git-r3lab.uni.lu/IMP/imp3; accessed on 4 June 2021) [34]. IMP preprocessing included FastQC (https://github.com/s-andrews/FastQC; accessed on 4 June 2021), read trimming and adapter removal using Trimmomatic [35], removal of ribosomal RNAs, and filtering for human reads against the hg38 genome build. The output of the preprocessing step is three FASTQ files, r1, r2 and se.
Variants were called with a variant-calling pipeline adapted from the workflow described in Popa et al. [36]. Reads were mapped on the SARS-CoV-2 genome (GenBank: MN908947.3, RefSeq: NC_045512.2) using BWA-MEM v0.7.17 [37] and samtools [38]. Duplicate reads were removed using Picard v2.26.2 (https://github.com/broadinstitute/picard; accessed on 15 July 2021). For calling variants (low frequency and major variants), the read alignment file was realigned using the Viterbi method provided by LoFreq v2.1.5 [39]. After adding InDel qualities, variants were called using LoFreq. Variant filtering was performed with LoFreq and Bcftools v1.2 [38] using the default parameters. Major variants were extracted from unfiltered LoFreq calls for variants with allele frequency (AF) > 0.95 and maximal possible strand bias (SB) value. Resulting VCF files were then normalized using bcftools. Variant annotation was performed with SnpEff v5.0 [40] and SnpSift v4.3 [41] or the SARS-CoV2 28 April 2020 version of Annovar.

2.7. Haplotype Reconstruction

For each sample, regions that could potentially be linked by SNPs co-occurring on the same read were determined from the called variants. Specifically, ranges consisted of SNPs within 130 base-pairs given the read length of 150 bp. For ranges spanning a signature mutation, haplotypes were reconstructed with Gretel v0.094 [42] for each of the sample-specific interval(s) using the alignment files and further refined retaining only the haplotypes whose variants were present in the sample-specific VCF files.

2.8. Statistical Analysis

Alignment files for each sample were analyzed with WeeSAM v.1.6 (https://github.com/centre-for-virus-research/weeSAM; accessed on 17 July 2021). Samples with reference sequence coverage below 70% were discarded from subsequent analyses.
Statistical analysis of the samples and mutations was performed in R v4.0.3, including utilization of the following packages: tidyverse v1.3.10, here v1.0.1, ISOweek v0.6–2, lubridate v1.7.10, RColorBrewer v1.1–2, viridis v0.5.1, ComplexHeatmap v2.6.2 and readxl v1.3.1.
For determining correlations between allele frequencies (WWTP samples) and occurrence of mutation in patient-derived samples, samples were grouped by calendar week, considering only weeks with at least 1 WWTP sample with the mutation and at least 10 clinical samples. Additionally, samples were also grouped by geographic location (WWTP of origin). The R function cor.test was applied.

3. Results

3.1. Overview of Available Clinical Sequences

Genome sequencing of patient-derived samples from Luxembourg was carried out from the very beginning of the pandemic. Sequencing efforts increased with a spike in SARS-CoV-2 positive cases in the population in the third week of October 2020 (Figure S1 in Supplementary Material). The weekly sequencing coverage, i.e., the ratio of sequenced samples to positive cases, during the period 1 October 2020 and 8 March 2021 was 11.7% on average (min: 2.5%, max: 29.4%) (Supplementary Data S1). The major lineages in circulation, determined from clinical samples, during October 2020 were B.1.221, B.1.160, or B.1.177, while from the end of December 2020 B.1.1.7 and B.1.351 was detected at increasing numbers and B.1.1.7 became the dominant lineage by the end of January 2021 (Figure S2 in Supplementary Material).

3.2. Overview of Sequencing of Wastewater Samples

A total of 79 wastewater samples were sequenced and passed the coverage threshold. The average initial CT value of those samples before sequencing was 33.89 (min: 32.18, max: 37.00, sd: 1.00; Supplementary Data S2). Average sequencing depth slightly anticorrelated with CT values (Pearson correlation coefficient: −0.34, p-value: 0.0025, adjusted R2: 0.10). Overall, the average sequencing depth of wastewater samples was 960.95 (min: 48.66, max: 2393.56, sd: 580.20). Most sequenced samples were collected between October and December 2020 with an additional batch of sequences sampled in January to March 2021, albeit at lower sequencing depth (Figure S4 in Supplementary Material).
We detected 4432 distinct nucleotide mutations (Supplementary Data S3), of which 1,120 (25%) could also be observed in consensus sequences from clinical samples. Most of 231 recurring mutations (defined here as present in more than five samples, Figure 1) can also be observed in the clinical consensus sequences (164 of 231 mutations, 71%), with a mean allele frequency (AF) of 0.28 (mean minimum AF: 0.07, mean maximum AF: 0.67). Most mutations could be classified as missense variants (Table 1). The largest discrepancy for recurring mutations detected in wastewater and clinical samples can be observed for the S gene (Table 1, Figure 1).
Particularly, a segment of the S gene proved to be enriched for mutations consistently detected over time, however at relatively low allele frequencies (Figure 1). These could not be detected in several wastewater samples with low average sequencing depth. Overall, the observed pattern of mutations varied over time with some consistency. Samples from different locations did not show distinctive patterns (Figure 1), except for specific regional clusters based on individual signature mutations.

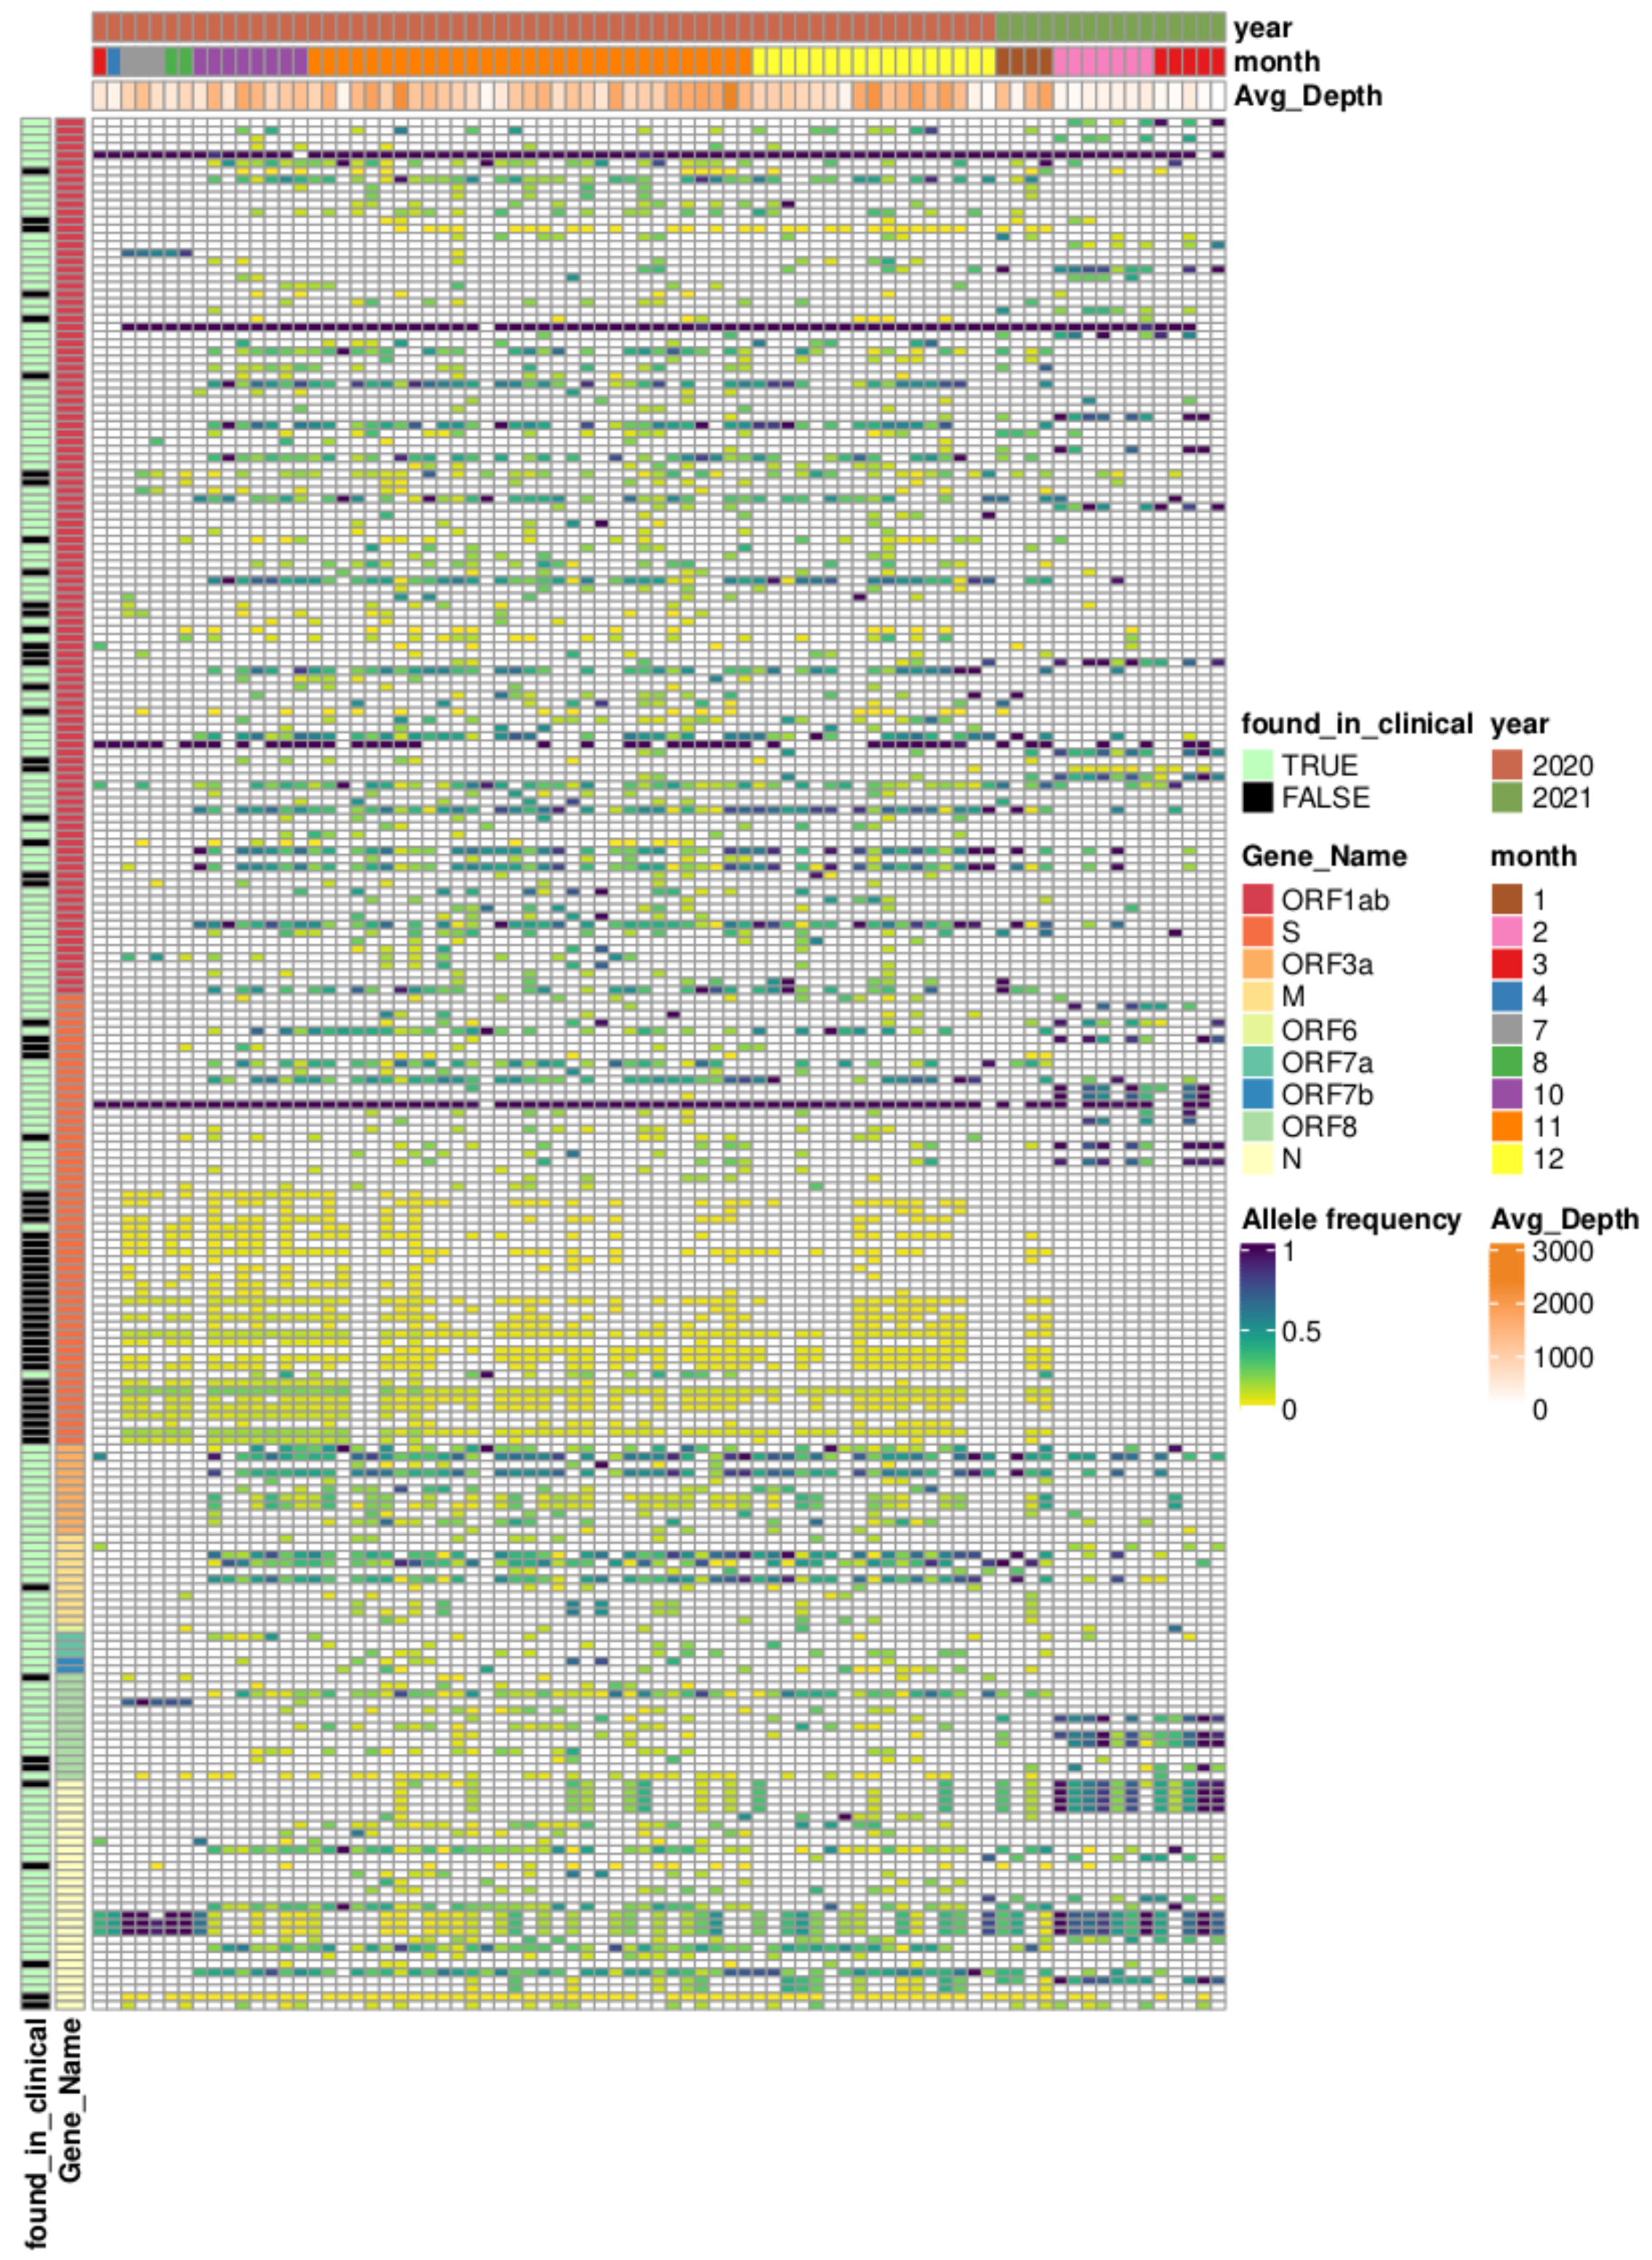
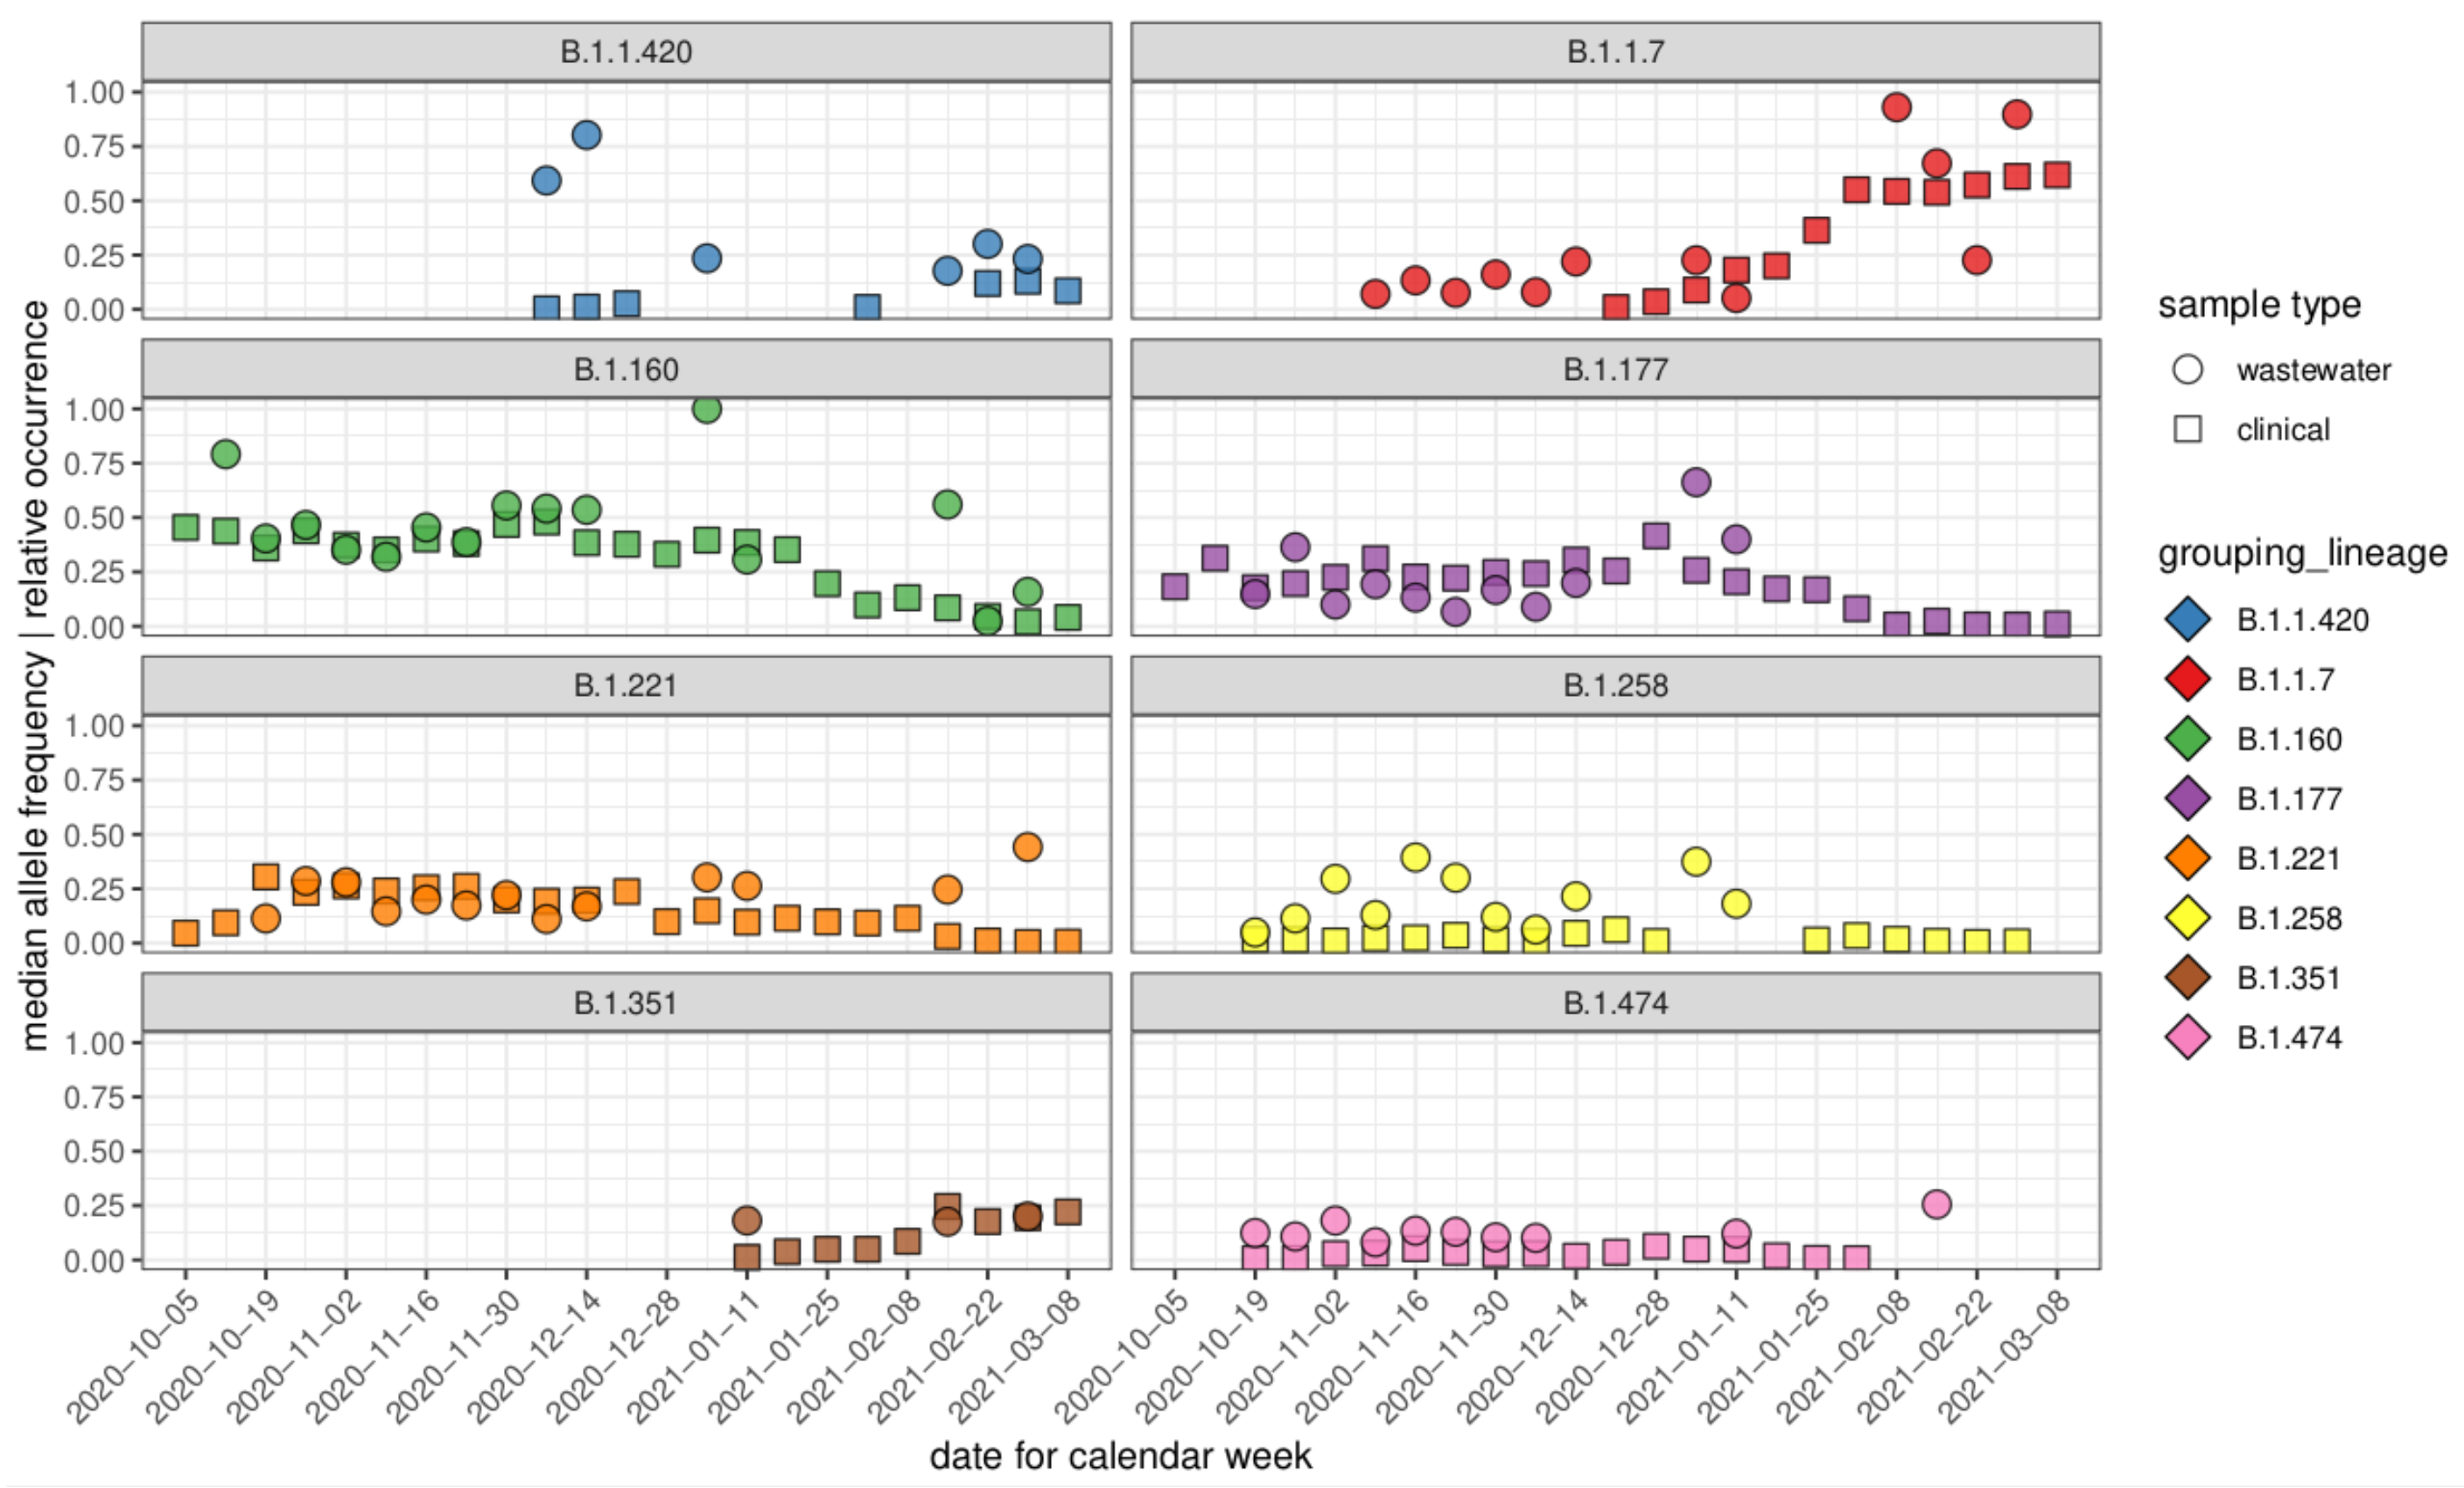
3.3. Comparison of Allele Frequencies and Relative Occurrence

To trace lineages in mixed wastewater samples, we downloaded characteristic amino acid mutations for each of the lineages assigned to clinical samples with Pangolin, i.e., a total of 123 distinct lineages, from outbreak.info [29] (Supplementary Data S4). Characteristic mutations were screened for uniqueness in the set, respectively, for the associated lineage or grouped lineage, yielding several signature mutations for most prevalent lineages (Figure S3 in Supplementary Material).
In order to predict circulating SARS-CoV-2 lineages from the wastewater samples, we compared allele frequencies of signature mutations to the frequencies of lineages in clinical consensus sequences. Grouping samples by calendar week and lineage, we observed a high resemblance of the median allele frequency of signature mutations to the relative frequency of the respective lineages assigned to clinical samples (Figure 2). This was the case for more abundant (B.1.160) and less abundant lineages such as B.1.474. During the period of higher sample availability (October to December 2020), a greater overlap was observed, but the sequencing depth also affects whether median allele frequencies of signature mutations can be interpreted as predictive for lineage abundances (Figure S5 in Supplementary Material). During later time periods (February, March 2021) with fewer samples, sequenced at a lower depth, a greater variance can be observed.
This relationship between signature mutation allele frequencies and circulating lineages also depends on the number of signature mutations utilized. For individual characteristic mutations, only a weak linear relationship could be inferred between the occurrence of a mutation in clinical sequences and the allele frequency in wastewater-derived sequences (Figure S6 in Supplementary Material).
Overall, the allele frequencies of characteristic amino acid mutations in wastewater were positively correlated with the occurrence of the same mutation in clinical samples when detected within the same calendar week with at least 10 clinical samples (Pearson correlation coefficient: 0.74, p-value < 2.2 × 10⁻¹⁶, comparing 1018 datapoints including 343 unique AA mutations and 18 calendar weeks).

3.4. Characteristic Mutations of VOCs

A primary interest in the monitoring of wastewater samples is screening for the novel variants of concern. Particularly, lineage B.1.1.7 was of primary interest during the sampled interval. For several samples, we observed that an increasing number of signature mutations of B.1.1.7, at low frequencies, could be detected already in November (10 distinct mutations, mean allele frequency (: 0.14) and December (6 distinct mutations, : 0.17) 2020 before the first clinical isolate assigned to the lineage in Luxembourg on 24 December 2020 (Figure 3, Figure 4, Supplementary Data S5). During the period where B.1.1.7 emerged as the dominant lineage circulating in Luxembourg (February, March 2021), a larger number of samples allowed for the detection of signature in the wastewater samples, as well as at higher allele frequencies.
However, particularly for samples in November 2020, the signature mutations for B.1.1.7 were detected sparsely, and several key mutations, such as S:N501Y or S:E484K, could not be detected in many of the respective samples (Figure S7 in Supplementary Material). For B.1.351 and P.1, the few characteristic mutations consistently detected in earlier time points (B.1.351: ORF3A:Q57H, N:T205I, ORF1A:T265I; P.1: S:P26S) (Figure S7 in Supplementary Material) are not specific to these VOCs.

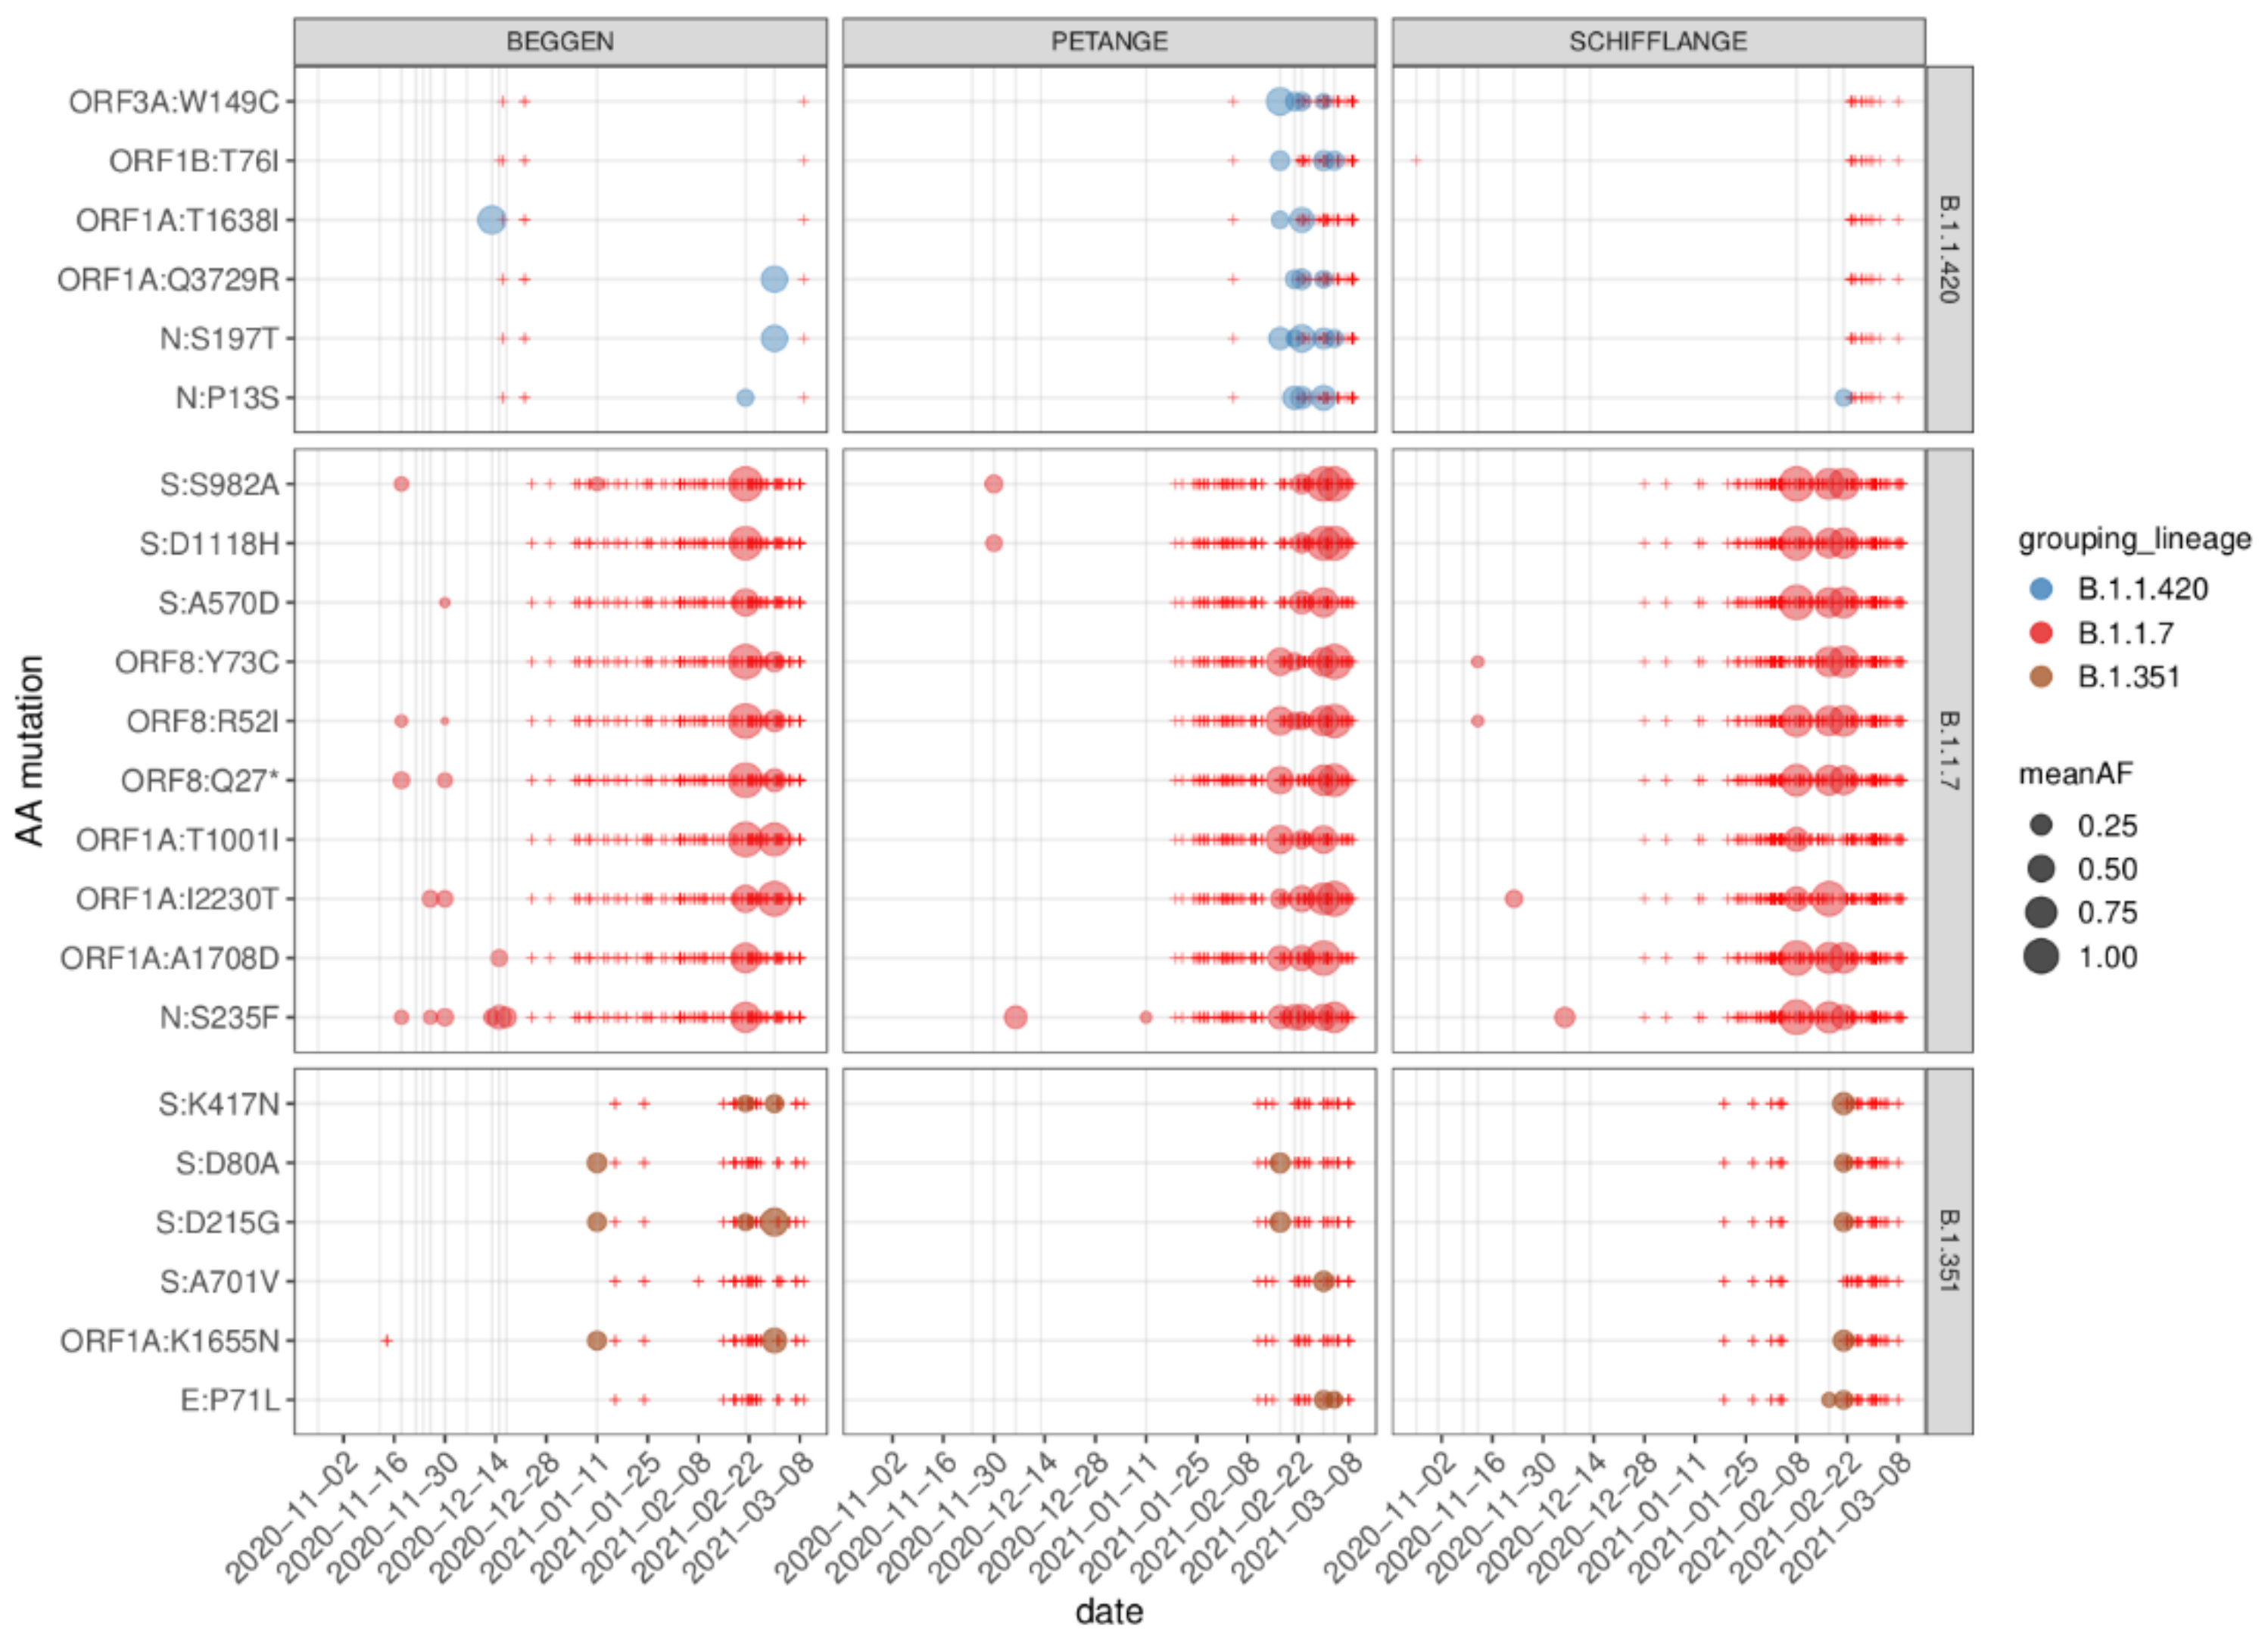
3.5. Regionally Specific Mutations

To assess the regional patterns of mutations, those detected in WWTP and clinical samples were screened according to their geographical location. Comparing individual mutations and their frequencies grouped by week and location resulted in a slight improvement in terms of correlation of WWTP allele frequency and occurrence in clinical samples (Pearson correlation coefficient: 0.76, p-value < 2.2 × 10⁻¹⁶, comparing 1023 datapoints for 216 unique AA mutations, 14 calendar weeks and 8 locations). In total, 26 amino acid mutations were detected uniquely in the same location within WWTP and clinical samples, including only one characteristic mutation for a lineage. However, several signature mutations for B.1.1.420 were found at high frequencies in February and March 2021 samples from PET, corresponding to an increasing prevalence of those mutations within clinical samples (Figure 4).

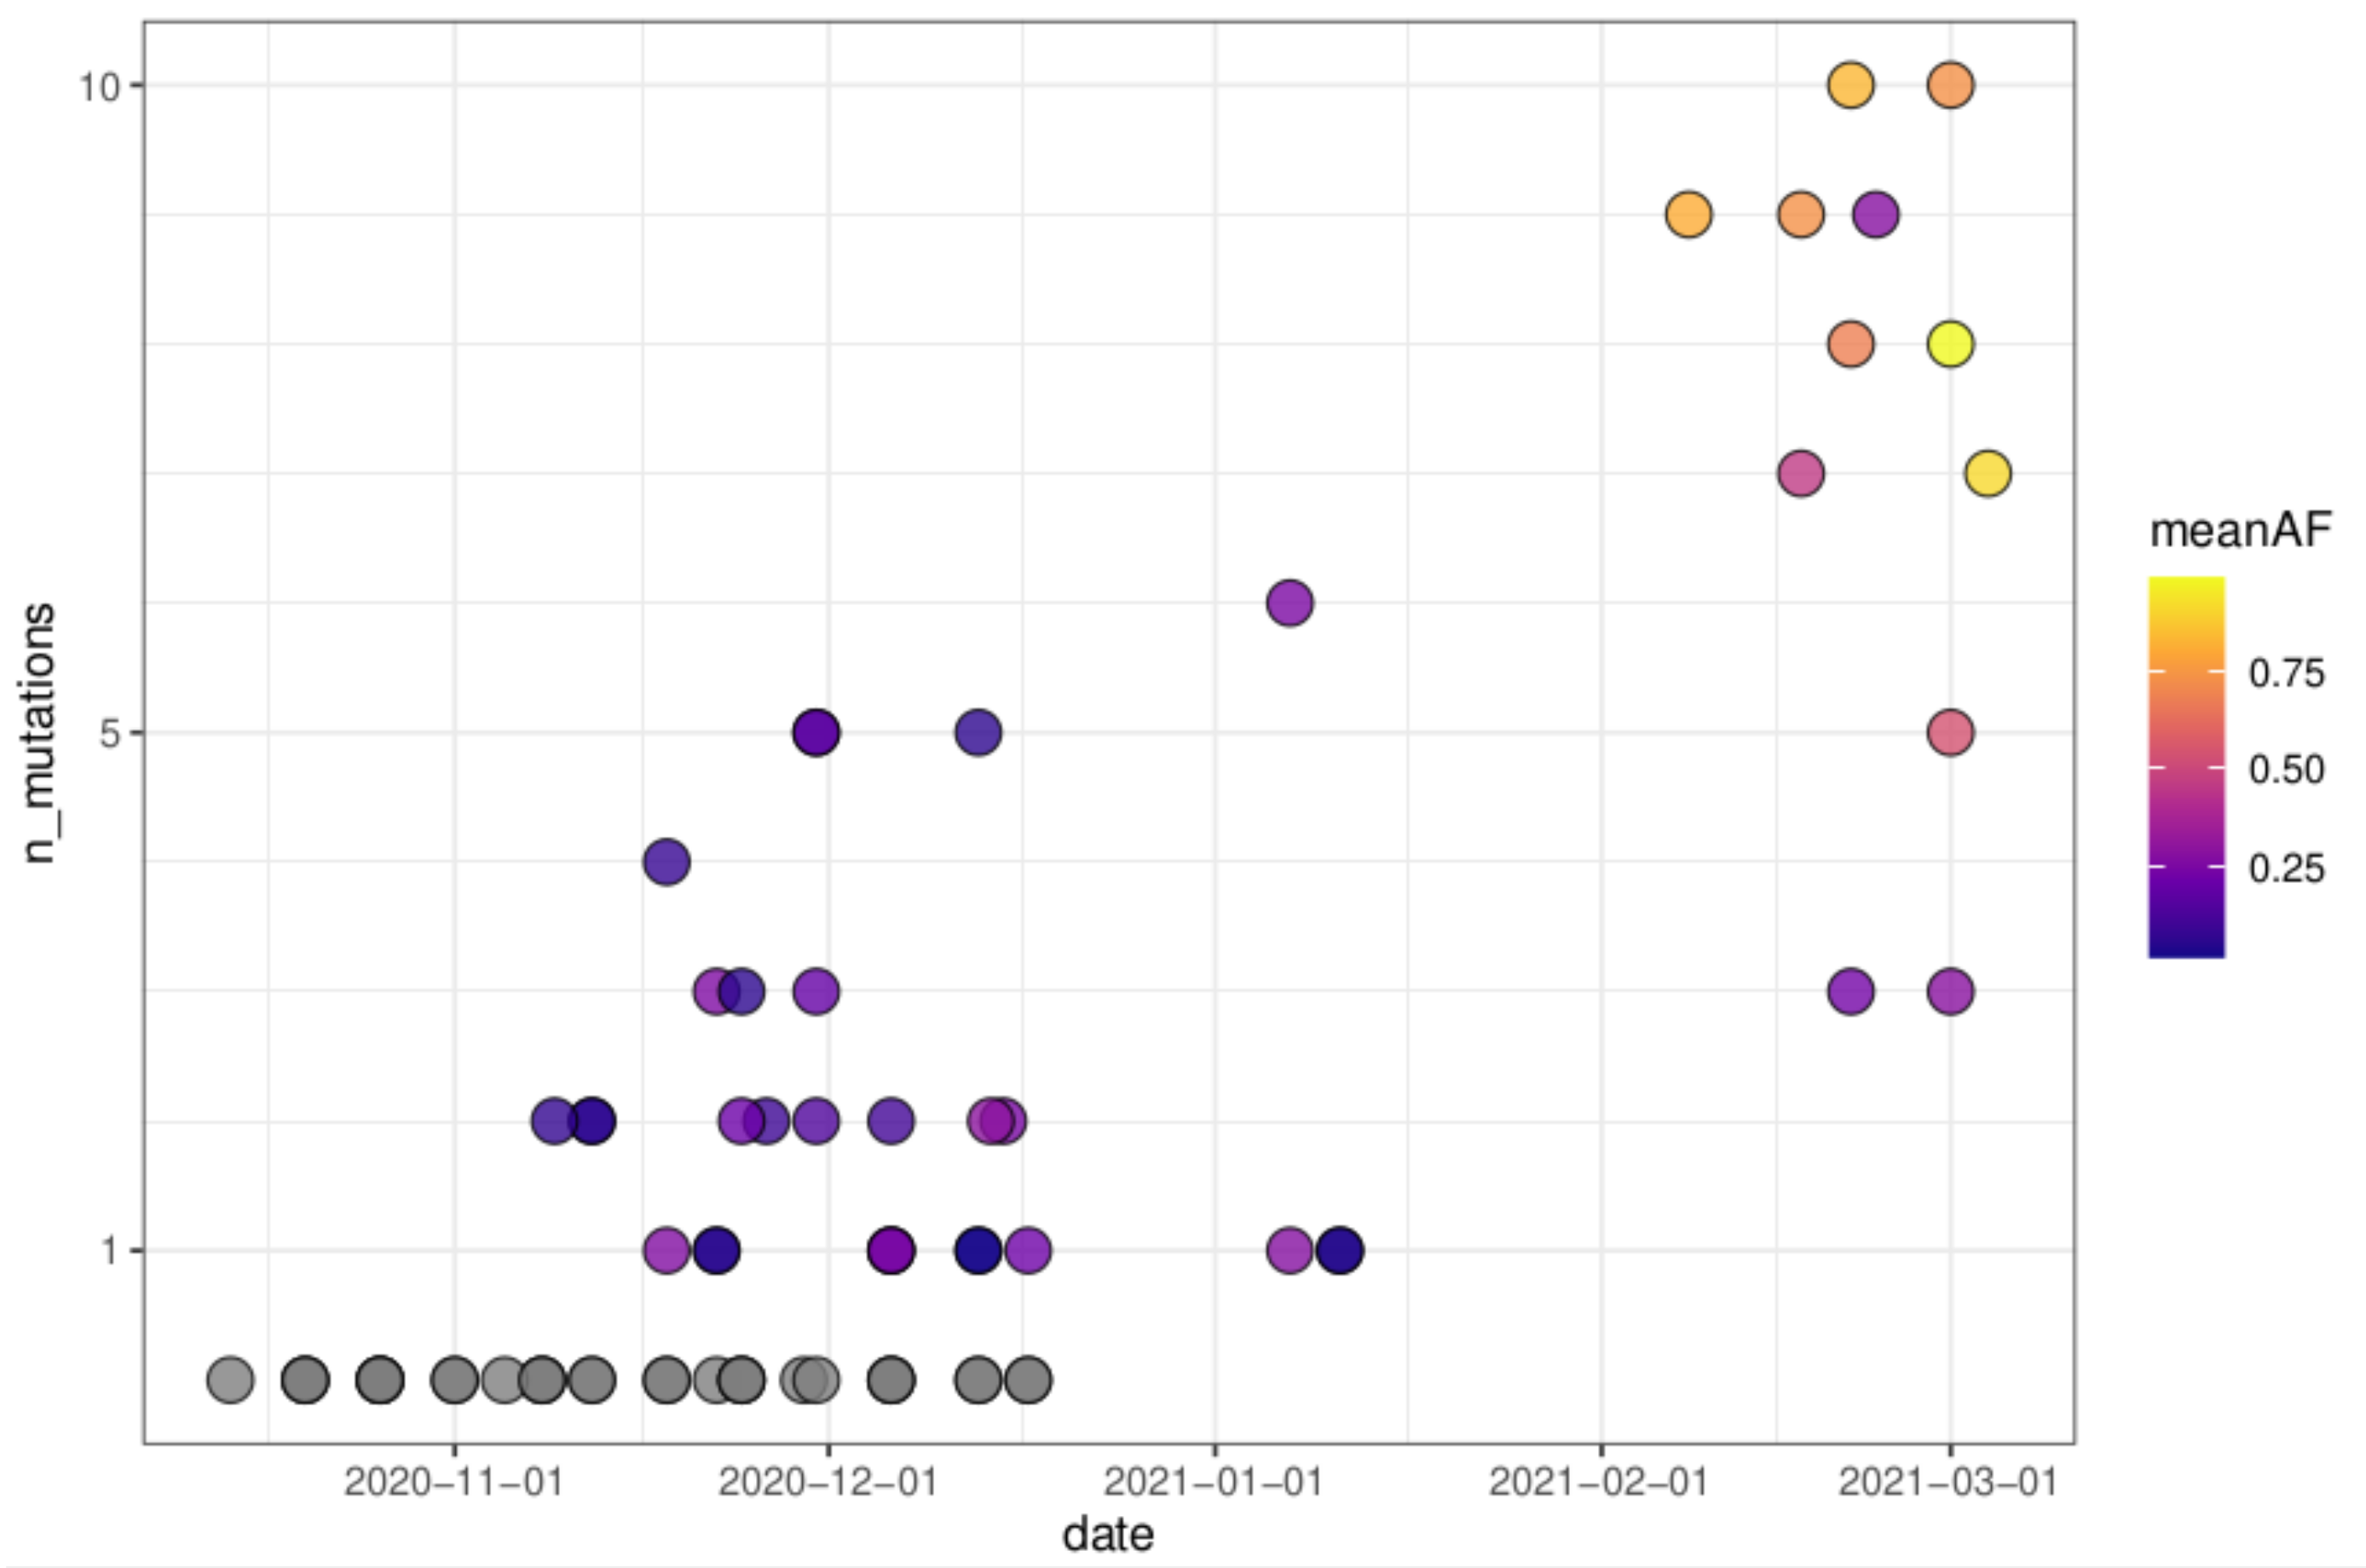
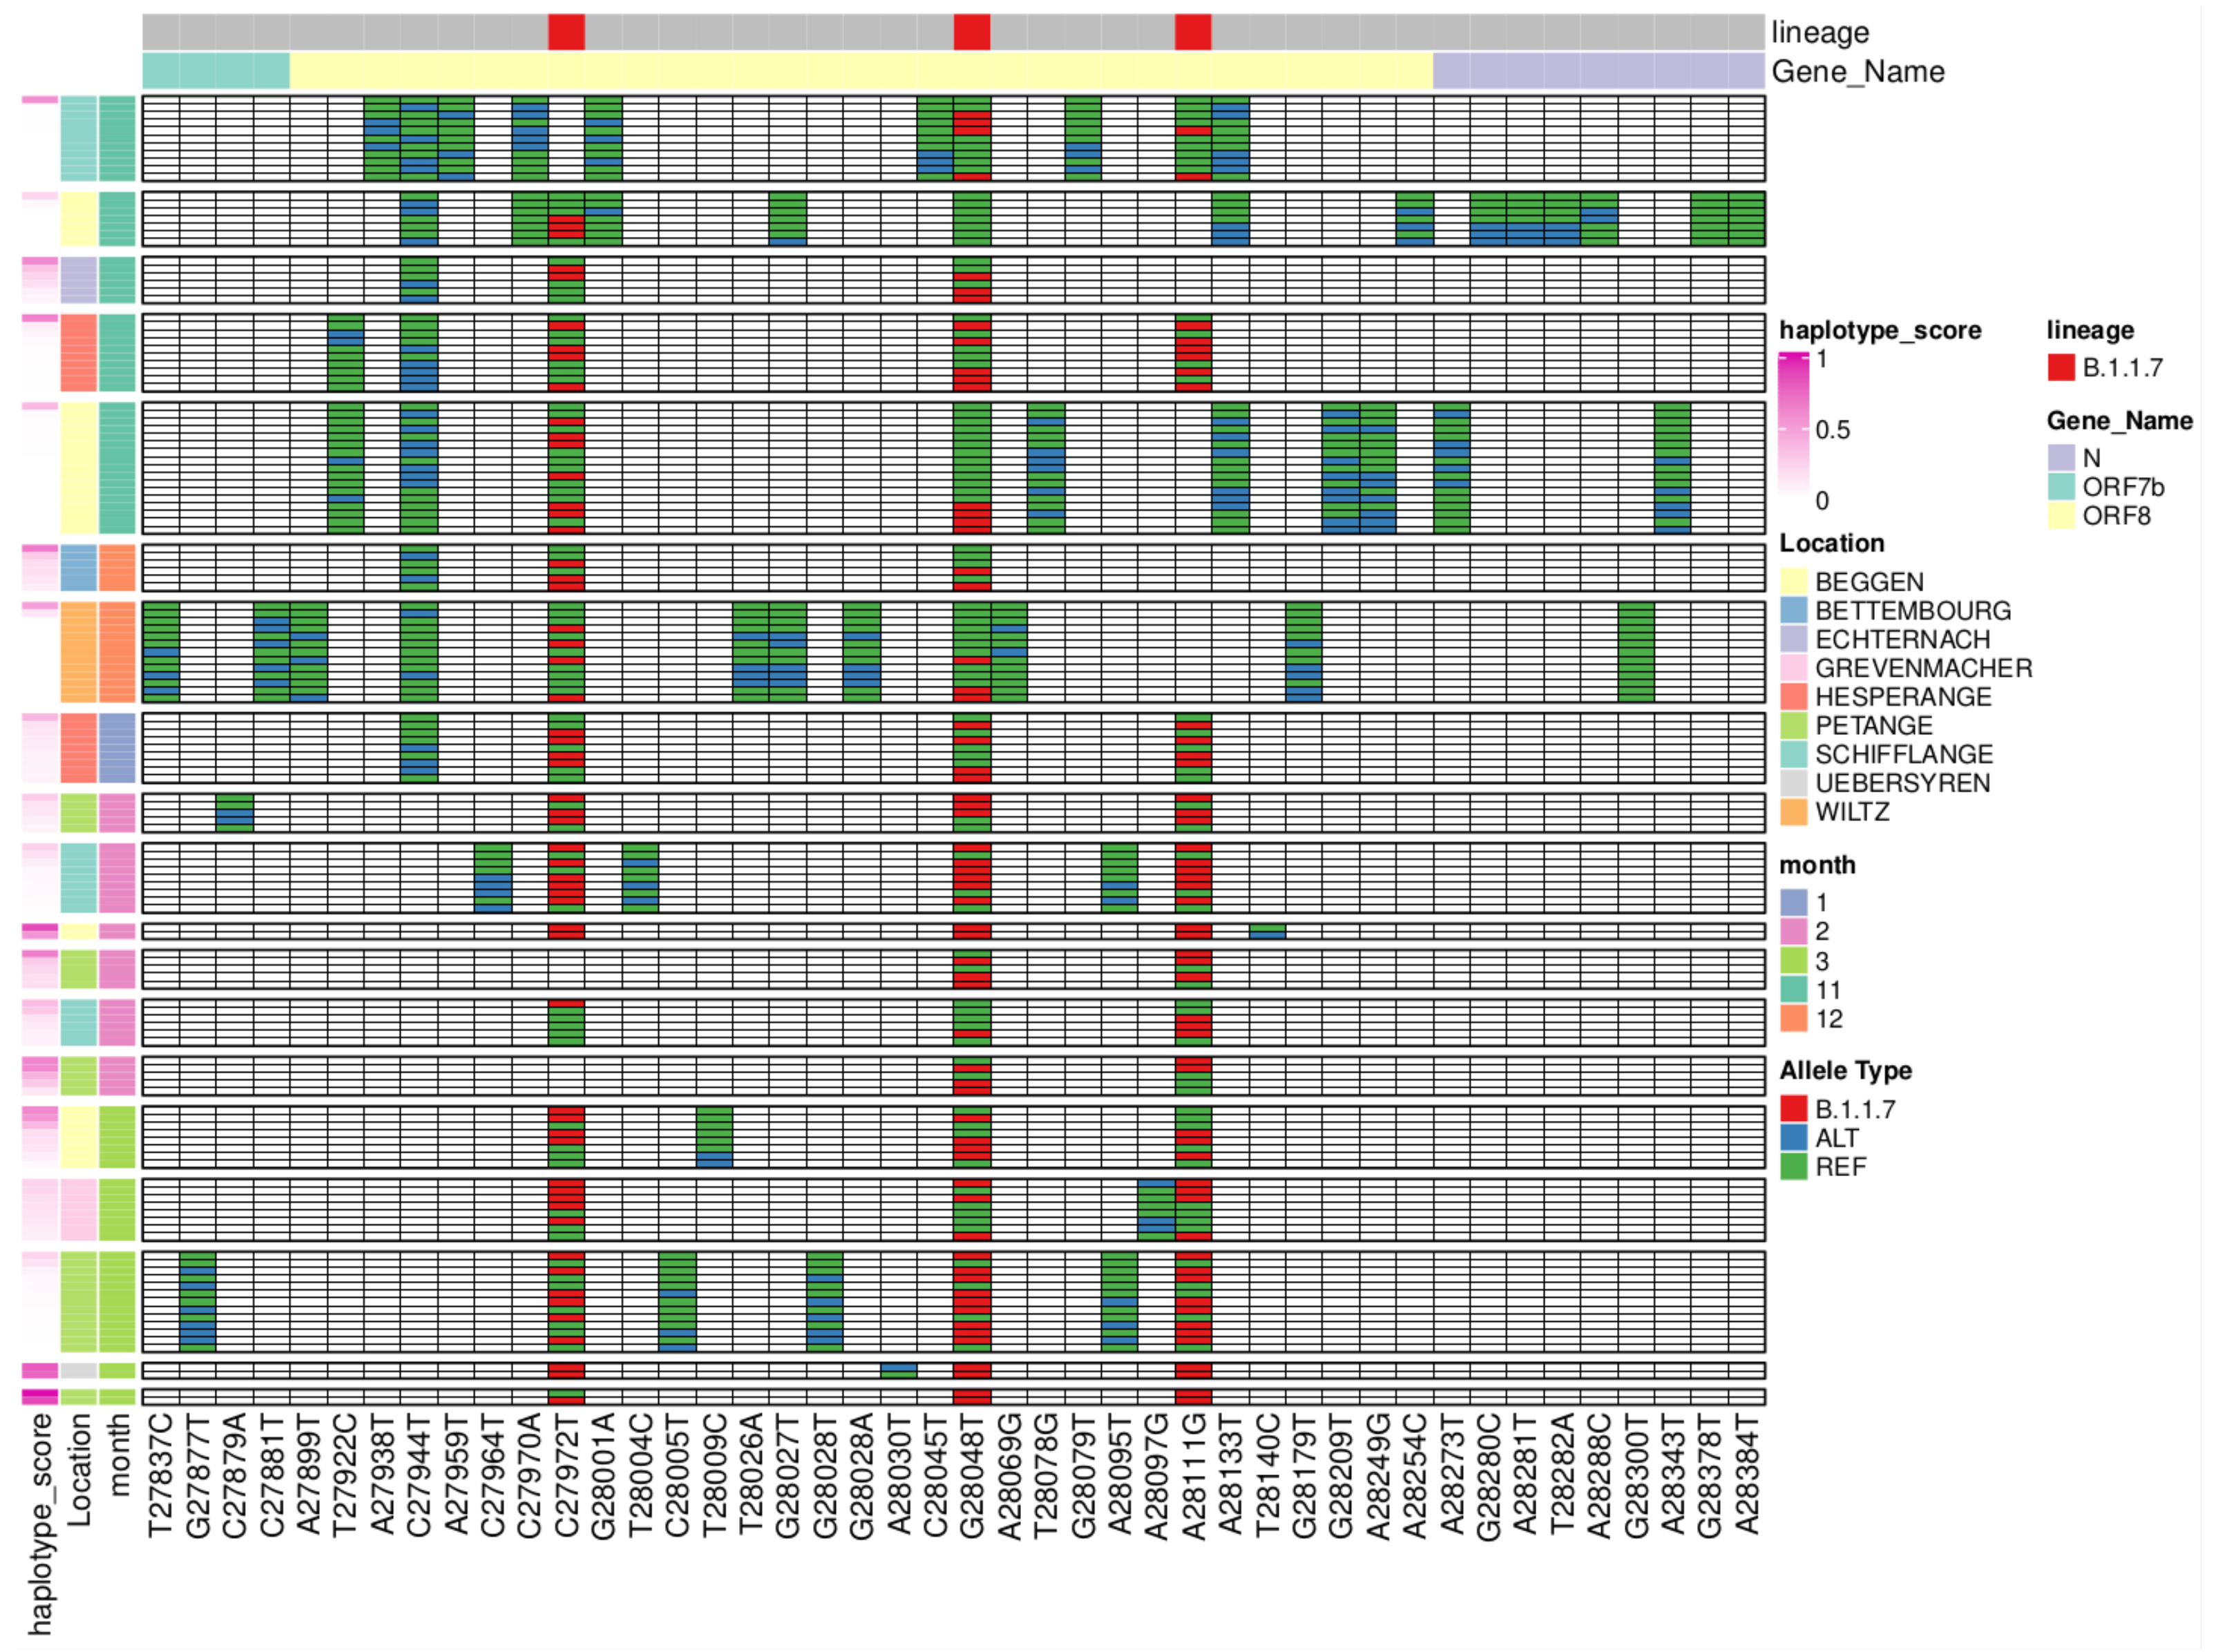
3.6. Reconstruction of Short Lineage-Specific Haplotypes

In order to identify whether signature mutations co-occur on the same reads, we reconstructed haplotypes for sample-specific genomic ranges linked by SNPs at maximum 130 bps apart from each other. We identified 179 ranges including at least two signature mutations of the same lineage with mean length of 228 bps and maximum length of 1390 bps. Most ranges included signature mutations for B.1.1.7 (60), followed by B.1.221 (55), and B.1.160 (28).
Focusing on B.1.1.7 specific haplotypes, we determined ranges in 19 samples between positions 27,737 and 28,484 including up to three signature mutations (Figure 5): C27972T (ORF8:Q27*), G28048T (ORF8:R52I) and A28111G (ORF8:Y73C). In samples of earlier time points (November and December 2020), these signature mutations can sometimes already be detected, but they do rarely occur in the same predicted haplotypes. Additionally, the haplotypes containing early B.1.1.7 signatures are predicted at lower scores reflecting a lack of evidence in counts of SNP co-occurrence, which can also be caused by the low abundance of these haplotypes.
Later time points coinciding with higher spread of B.1.1.7 in the population tend to show more reliably predicted haplotypes include shared signature alleles for B.1.1.7 at higher prevalence (Figure 5). This indicates that for this region, signature mutations tend to co-occur on the same reads; i.e., they can be linked by SNP co-occurrence on the same reads, derived from the same viral genomes.

4. Discussion

Genomic sequencing of SARS-CoV-2 from wastewater has the potential to be a valuable tool in population-wide monitoring of circulating lineages. Here, we show that detecting low and major frequency mutations from wastewater samples is possible by sequencing overlapping amplicons. Similar recent results support the same approach for such a purpose [43]. Even though, only roughly one third of all mutations can be matched to those called from patient-derived sequences, most of the recurrent mutations and lineage specific mutations can be found in both datasets.
Tracing signature mutations, or quasi-signature mutations [44], does not allow in general for the reconstructing of full-length haplotypes of SARS-CoV-2 and thus assessing the combinations of characteristic mutations. We show that for genomic regions enriched in mutations, haplotype reconstruction based on SNP co-occurrence could be feasible, but we were mainly able to predict short haplotypes for abundant lineages. The emergent genotypes are difficult to distinguish from spuriously predicted haplotypes. Coupled approaches with Illumina short-read and Oxford Nanopore-based long-read sequencing data have greater potential to allow for the reconstruction of full-length haplotypes from mixed samples [28,45].
In our comparison of clinical and WWTP samples during the period from October 2020 to March 2021, the timeframe in which B.1.1.7 emerged as dominant lineage in Luxembourg, we see that particularly for lineages with multiple unique signature mutations, the allele frequencies of mutations detected in wastewater corresponds to the occurrence of these lineages in the population. With a limited number of present signature mutations, this relationship becomes more variable, and especially for lowly abundant or emerging lineages, high-sequencing depth is required for capturing relevant mutations. While the detection of signature mutations for B.1.1.7 predates the detection in a clinical isolate as has been observed before [27], tracing emerging VOCs in wastewater data may remain challenging. Today, the SARS-CoV-2 variant B.1.1.7. has been de-escalated and no longer belongs to VOCs, mainly because it no longer circulates in the population. The B.1.617.2 variant is the dominant strain worldwide, including Luxembourg. It will continue to spread, displacing the circulation of the other variants, unless a new, more competitive virus emerges. Our findings and methodology presented here strongly position high-throughput sequencing of wastewater samples as a credible tool for analyzing the spread, dynamics and evolution of SARS-CoV-2 variants.
While the systematic sampling of wastewater allowed temporal and spatial monitoring of the epidemic, several samples did not contain a sufficient viral load to be sequenced. However, we were able to identify a local cluster of mutations related to B.1.1.420 in February and March 2021 for the location of PET. This cluster corresponds to a local outbreak with 92 SARS-CoV-2 positive cases in a retirement home in the area of the PET WWTP. This highlights the potential of wastewater monitoring to detect regionally specific clusters, as has been observed previously [27,28], even though the regional differences within Luxembourg are low, given the small size of the country. The detection of regional clusters also depends on factors such as mobility within the respective areas, which could be considered in a refined analysis.
Overall, genomic sequencing of SARS-CoV-2 represents a valuable addition to the sequencing of clinical isolates particularly for tracing VOCs in a wide proportion of the population. Even though, short-read sequencing data only allowed for the detection of individual signature mutations, and the cross-section of allele frequencies within several samples allowed for comprehensive tracing of circulating lineages, regionally specific clusters, and emergent VOCs.

Supplementary Materials

The following are available online at https://www.mdpi.com/article/10.3390/w13213018/s1, Figure S1: Weekly sequencing coverage, Figure S2: Lineages in clinical consensus sequences, Figure S3: Number of signature mutations for grouped lineages, Figure S4: Mapping statistics for wastewater samples, Figure S5: Differences relative occurrence and allele frequencies with sequencing depth and number of signature mutations, Figure S6: Comparison relative occurrence and allele frequencies grouped by week, Figure S7: VOC mutations over time, Supplementary Data S1: Overview table with information on collected WWTP samples, Supplementary Data S2: Numbers on sequenced samples and weekly positive cases between 5 October 2020 and 8 March 2021, Supplementary Data S3: Characteristic mutations for linages downloaded from outbreak.info, Supplementary Data S4: Variant calls from the WWTP sequencing data including annotations, Supplementary Data S5: Metadata of clinical samples downloaded from GISAID, including annotated location of closest WWTP.

Author Contributions

Conceptualization: L.O., M.H. and G.F.; sampling: L.O., C.W. and H.-M.C.; wastewater sample processing: L.O. and C.W.; SARS-CoV-2 RNA extraction: L.O. and C.W.; RT-qPCR and sequencing: J.T.; data curation: A.W.-B., M.H., A.F.d., F.D. and P.M.; bioinformatics data treatment: A.W.-B., M.H., A.F.d., F.D. and P.M.; writing—original draft preparation: M.H.; writing—review and editing: M.H., L.O., G.F., J.T., F.D., A.F.d., P.M., P.W., H.-M.C. and A.W.-B.; funding acquisition and project administration: L.O. All authors have read and agreed to the published version of the manuscript.

Funding

This work is supported by the Fondation André Losch and by the Fond National de la Recherche (FNR) under project 14806023 (CORONASTEP+), project 14744547 (Co-PhyloDyn) and project 14735280 (UCovis).

Institutional Review Board Statement

Not applicable.

Informed Consent Statement

Not applicable.

Data Availability Statement

Patient-derived sequences were downloaded from GISAID (4 June 2021). Weekly numbers of infected people were obtained from ECDC and downloaded (https://www.ecdc.europa.eu/en/publications-data/data-national-14-day-notification-rate-covid-19; accessed on 22 June 2021). Raw reads for sequencing data derived from WWTP samples have been uploaded to NCBI and are accessible under BioProject PRJNA765031. Preprocessing: IMP3 available from https://git-r3lab.uni.lu/IMP/imp3 accessed on 20 June 2021 includes FastQC available from https://github.com/s-andrews/FastQC accessed on 20 June 2021. Picard is available from https://github.com/broadinstitute/picard; accessed on 20 June 2021. The phylodynamics PDP pipeline-based Nextstrain and the variant-calling pipeline using LoFreq are available on https://git-r3lab.uni.lu/covid19-genomics accessed on 20 June 2021. Code for statistical analyses and generating figures is available in the following repository: https://git.list.lu/malte.herold/coronastep-variant-analysis-scripts/ accessed on 20 June 2021.

Acknowledgments

The authors would like to thank all the wastewater syndicates (SIACH, SIVEC, STEP, SIDERO, SIDEN and SIDEST), the “Ville de Luxembourg”, the “Gemeng Hesper” as well as the “Administration de la Gestion de l’Eau” (AGE) for their kind and valuable assistance in the wastewater sample collection, the acquisition of wastewater parameters and the collection of demographic data. Some experiments presented in this work were carried out using the high performance computing facilities of the University of Luxembourg (https://hpc.uni.lu; accessed on 1 July 2021).

Conflicts of Interest

The authors declare no conflict of interest. The funders had no role in the design of the study; in the collection, analyses, or interpretation of data; in the writing of the manuscript, or in the decision to publish the results.

References

  1. Wilmes, P.; Zimmer, J.; Schulz, J.; Glod, F.; Veiber, L.; Mombaerts, L.; Rodrigues, B.; Aalto, A.; Pastore, J.; Snoeck, C.J.; et al. SARS-CoV-2 transmission risk from asymptomatic carriers: Results from a mass screening programme in Luxembourg. Lancet Reg. Health Eur. 2021, 4, 100056. [Google Scholar] [CrossRef] [PubMed]
  2. Tang, S.; Mao, Y.; Jones, R.M.; Tan, Q.; Ji, J.S.; Li, N.; Shen, J.; Lv, Y.; Pan, L.; Ding, P.; et al. Aerosol transmission of SARS-CoV-2? Evidence, prevention and control. Environ. Int. 2020, 144, 106039. [Google Scholar] [CrossRef] [PubMed]
  3. Gupta, S.; Parker, J.; Smits, S.; Underwood, J.; Dolwani, S. Persistent viral shedding of SARS-CoV-2 in faeces—A rapid review. Colorectal. Dis. 2020, 22, 611–620. [Google Scholar] [CrossRef] [PubMed]
  4. Miura, F.; Kitajima, M.; Omori, R. Duration of SARS-CoV-2 viral shedding in faeces as a parameter for wastewater-based epidemiology: Re-analysis of patient data using a shedding dynamics model. Sci. Total Environ. 2021, 769, 144549. [Google Scholar] [CrossRef]
  5. Crank, K.; Chen, W.; Bivins, A.; Lowry, S.; Bibby, K. Contribution of SARS-CoV-2 RNA shedding routes to RNA loads in wastewater. Sci. Total Environ. 2022, 806, 150376. [Google Scholar] [CrossRef]
  6. Sala-Comorera, L.; Reynolds, L.J.; Martin, N.A.; O’Sullivan, J.J.; Meijer, W.G.; Fletcher, N.F. Decay of infectious SARS-CoV-2 and surrogates in aquatic environments. Water Res. 2021, 201, 117090. [Google Scholar] [CrossRef]
  7. Han, J.; He, S. Urban flooding events pose risks of virus spread during the novel coronavirus (COVID-19) pandemic. Sci. Total Environ. 2021, 755, 142491. [Google Scholar] [CrossRef]
  8. Wathore, R.; Gupta, A.; Bherwani, H.; Labhasetwar, N. Understanding air and water borne transmission and survival of coronavirus: Insights and way forward for SARS-CoV-2. Sci. Total Environ. 2020, 749, 141486. [Google Scholar] [CrossRef]
  9. Paul, D.; Kolar, P.; Hall, S.G. A review of the impact of environmental factors on the fate and transport of coronaviruses in aqueous environments. NPJ Clean Water 2021, 4, 7. [Google Scholar] [CrossRef]
  10. Wurtzer, S.; Marechal, V.; Mouchel, J.; Maday, Y.; Teyssou, R.; Richard, E.; Almayrac, J.; Moulin, L. Evaluation of lockdown impact on SARS-CoV-2 dynamics through viral genome quantification in Paris wastewaters. MedRxiv 2020. [Google Scholar] [CrossRef]
  11. Peccia, J.; Zulli, A.; Brackney, D.E.; Grubaugh, N.D.; Kaplan, E.H.; Casanovas-Massana, A.; Ko, A.I.; Malik, A.A.; Wang, D.; Wang, M.; et al. Measurement of SARS-CoV-2 RNA in wastewater tracks community infection dynamics. Nat. Biotechnol. 2020, 38, 1164–1167. [Google Scholar] [CrossRef]
  12. Hillary, L.S.; Farkas, K.; Maher, K.H.; Lucaci, A.; Thorpe, J.; Distaso, M.A.; Gaze, W.H.; Paterson, S.; Burke, T.; Connor, T.R.; et al. Monitoring SARS-CoV-2 in municipal wastewater to evaluate the success of lockdown measures for controlling COVID-19 in the UK. Water Res. 2021, 200, 117214. [Google Scholar] [CrossRef]
  13. Medema, G.; Been, F.; Heijnen, L.; Petterson, S. Implementation of environmental surveillance for SARS-CoV-2 virus to support public health decisions: Opportunities and challenges. Curr. Opin. Environ. Sci. Health 2020, 17, 49–71. [Google Scholar] [CrossRef]
  14. Medema, G.; Heijnen, L.; Elsinga, G.; Italiaander, R.; Brouwer, A. Presence of SARS-Coronavirus-2 RNA in Sewage and Correlation with Reported COVID-19 Prevalence in the Early Stage of the Epidemic in The Netherlands. Environ. Sci. Technol. Lett. 2020, 7, 511–516. [Google Scholar] [CrossRef]
  15. Ahmed, W.; Bibby, K.; D’Aoust, P.M.; Delatolla, R.; Gerba, C.P.; Haas, C.N.; Hamilton, K.A.; Hewitt, J.; Julian, T.R.; Kaya, D.; et al. Differentiating between the possibility and probability of SARS-CoV-2 transmission associated with wastewater: Empirical evidence is needed to substantiate risk. FEMS Microbes 2021, 2. [Google Scholar] [CrossRef]
  16. Hart, O.E.; Halden, R.U. Computational analysis of SARS-CoV-2/COVID-19 surveillance by wastewater-based epidemiology locally and globally: Feasibility, economy, opportunities and challenges. Sci. Total Environ. 2020, 730, 138875. [Google Scholar] [CrossRef]
  17. McClary-Gutierrez, J.; Mattioli, M.; Marcenac, P.; Silverman, A.; Boehm, A.; Bibby, K.; Balliet, M.; de los Reyes, F.; Gerrity, D.; Griffith, J.; et al. SARS-CoV-2 Wastewater Surveillance for Public Health Action. Emerg. Infect. Dis. J. 2021, 27, 1. [Google Scholar] [CrossRef]
  18. Lundy, L.; Fatta-Kassinos, D.; Slobodnik, J.; Karaolia, P.; Cirka, L.; Kreuzinger, N.; Castiglioni, S.; Bijlsma, L.; Dulio, V.; Deviller, G.; et al. Making Waves: Collaboration in the time of SARS-CoV-2—Rapid development of an international co-operation and wastewater surveillance database to support public health decision-making. Water Res. 2021, 199, 117167. [Google Scholar] [CrossRef]
  19. Nemudryi, A.; Nemudraia, A.; Wiegand, T.; Surya, K.; Buyukyoruk, M.; Cicha, C.; Vanderwood, K.K.; Wilkinson, R.; Wiedenheft, B. Temporal Detection and Phylogenetic Assessment of SARS-CoV-2 in Municipal Wastewater. Cell Rep. Med. 2020, 1, 100098. [Google Scholar] [CrossRef]
  20. Rambaut, A.; Loman, N.; Pybus, O.; Barclay, W.; Barrett, J.; Carabelli, A.; Connor, T.; Peacock, T.; Robertson, D.L.; Volz, E.; et al. Preliminary Genomic Characterisation of an Emergent SARS-CoV-2 Lineage in the UK Defined by a Novel Set of Spike Mutations. 2020. Available online: https://virological.org/t/preliminary-genomic-characterisation-of-an-emergent-sars-cov-2-lineage-in-the-uk-defined-by-a-novel-set-of-spike-mutations/563 (accessed on 3 August 2021).
  21. Faria, N.R.; Mellan, T.A.; Whittaker, C.; Claro, I.M.; Candido, D.D.S.; Mishra, S.; Crispim, M.A.E.; Sales, F.C.S.; Hawryluk, I.; McCrone, J.T.; et al. Genomics and epidemiology of the P.1 SARS-CoV-2 lineage in Manaus, Brazil. Science 2021, 372, 815–821. [Google Scholar] [CrossRef]
  22. Tegally, H.; Wilkinson, E.; Giovanetti, M.; Iranzadeh, A.; Fonseca, V.; Giandhari, J.; Doolabh, D.; Pillay, S.; San, E.J.; Msomi, N.; et al. Emergence and rapid spread of a new severe acute respiratory syndrome-related coronavirus 2 (SARS-CoV-2) lineage with multiple spike mutations in South Africa. medRxiv 2020. [Google Scholar] [CrossRef]
  23. Cherian, S.; Potdar, V.; Jadhav, S.; Yadav, P.; Gupta, N.; Das, M.; Rakshit, P.; Singh, S.; Abraham, P.; Panda, S.; et al. SARS-CoV-2 Spike Mutations, L452R, T478K, E484Q and P681R, in the Second Wave of COVID-19 in Maharashtra, India. Microorganisms 2021, 9, 1542. [Google Scholar] [CrossRef] [PubMed]
  24. Davies, N.G.; Abbott, S.; Barnard, R.C.; Jarvis, C.I.; Kucharski, A.J.; Munday, J.D.; Pearson, C.A.B.; Russell, T.W.; Tully, D.C.; Washburne, A.D.; et al. Estimated transmissibility and impact of SARS-CoV-2 lineage B.1.1.7 in England. Science 2021, 372, eabg3055. [Google Scholar] [CrossRef] [PubMed]
  25. Gohl, D.M.; Garbe, J.; Grady, P.; Daniel, J.; Watson, R.H.B.; Auch, B.; Nelson, A.; Yohe, S.; Beckman, K.B. A rapid, cost-effective tailed amplicon method for sequencing SARS-CoV-2. BMC Genomics 2020, 21, 863. [Google Scholar] [CrossRef]
  26. Crits-Christoph, A.; Kantor, R.S.; Olm, M.R.; Whitney, O.N.; Al-Shayeb, B.; Lou, Y.C.; Flamholz, A.; Kennedy, L.C.; Greenwald, H.; Hinkle, A.; et al. Genome Sequencing of Sewage Detects Regionally Prevalent SARS-CoV-2 Variants. mBio 2021, 12, e02703–e02720. [Google Scholar] [CrossRef]
  27. Jahn, K.; Dreifuss, D.; Topolsky, I.; Kull, A.; Ganesanandamoorthy, P.; Fernandez-Cassi, X.; Bänziger, C.; Stachler, E.; Fuhrmann, L.; Jablonski, K.P.; et al. Detection of SARS-CoV-2 variants in Switzerland by genomic analysis of wastewater samples. MedRxiv 2021. [Google Scholar] [CrossRef]
  28. Izquierdo-Lara, R.; Elsinga, G.; Heijnen, L.; Munnink, B.B.O.; Schapendonk, C.M.E.; Nieuwenhuijse, D.; Kon, M.; Lu, L.; Aarestrup, F.; Lycett, S.; et al. Monitoring SARS-CoV-2 Circulation and diversity through community wastewater sequencing, the Netherlands and Belgium. Emerg. Infect. Dis. J. 2021, 27, 1405. [Google Scholar] [CrossRef]
  29. Pérez-Cataluña, A.; Chiner-Oms, Á.; Cuevas-Ferrando, E.; Díaz-Reolid, A.; Falcó, I.; Randazzo, W.; Girón-Guzmán, I.; Allende, A.; Bracho, M.A.; Comas, I.; et al. Detection of genomic variants of SARS-CoV-2 circulating In wastewater by high-throughput sequencing. MedRxiv 2021. [Google Scholar] [CrossRef]
  30. Martin, J.; Klapsa, D.; Wilton, T.; Zambon, M.; Bentley, E.; Bujaki, E.; Fritzsche, M.; Mate, R.; Majumdar, M. Tracking SARS-CoV-2 in Sewage: Evidence of Changes in Virus Variant Predominance during COVID-19 Pandemic. Viruses 2020, 12, 1144. [Google Scholar] [CrossRef]
  31. Shu, Y.; McCauley, J. GISAID: Global initiative on sharing all influenza data—From vision to reality. Eur. Surveill. 2017, 22, 30494. [Google Scholar] [CrossRef] [Green Version]
  32. Hadfield, J.; Megill, C.; Bell, S.M.; Huddleston, J.; Potter, B.; Callender, C.; Sagulenko, P.; Bedford, T.; Neher, R.A. Nextstrain: Real-time tracking of pathogen evolution. Bioinformatics 2018, 34, 4121–4123. [Google Scholar] [CrossRef]
  33. Wang, K.; Li, M.; Hakonarson, H. ANNOVAR: Functional annotation of genetic variants from high-throughput sequencing data. Nucleic Acids Res. 2010, 38, e164. [Google Scholar] [CrossRef]
  34. Narayanasamy, S.; Jarosz, Y.; Muller, E.E.L.; Heintz-Buschart, A.; Herold, M.; Kaysen, A.; Laczny, C.C.; Pinel, N.; May, P.; Wilmes, P. IMP: A pipeline for reproducible reference-independent integrated metagenomic and metatranscriptomic analyses. Genome Biol. 2016, 17, 260. [Google Scholar] [CrossRef] [Green Version]
  35. Bolger, A.M.; Lohse, M.; Usadel, B. Trimmomatic: A flexible trimmer for Illumina sequence data. Bioinformatics 2014, 30, 2114–2120. [Google Scholar] [CrossRef] [Green Version]
  36. Popa, A.; Genger, J.-W.; Nicholson, M.D.; Penz, T.; Schmid, D.; Aberle, S.W.; Agerer, B.; Lercher, A.; Endler, L.; Colaço, H.; et al. Genomic epidemiology of superspreading events in Austria reveals mutational dynamics and transmission properties of SARS-CoV-2. Sci. Transl. Med. 2020, 12, eabe2555. [Google Scholar] [CrossRef]
  37. Li, H.; Durbin, R. Fast and accurate long-read alignment with Burrows–Wheeler transform. Bioinformatics 2010, 26, 589–595. [Google Scholar] [CrossRef] [Green Version]
  38. Danecek, P.; Bonfield, J.K.; Liddle, J.; Marshall, J.; Ohan, V.; Pollard, M.O.; Whitwham, A.; Keane, T.; McCarthy, S.A.; Davies, R.M.; et al. Twelve years of SAMtools and BCFtools. GigaScience 2021, 10. [Google Scholar] [CrossRef]
  39. Wilm, A.; Aw, P.P.K.; Bertrand, D.; Yeo, G.H.T.; Ong, S.H.; Wong, C.H.; Khor, C.C.; Petric, R.; Hibberd, M.L.; Nagarajan, N. LoFreq: A sequence-quality aware, ultra-sensitive variant caller for uncovering cell-population heterogeneity from high-throughput sequencing datasets. Nucleic Acids Res. 2012, 40, 11189–11201. [Google Scholar] [CrossRef] [Green Version]
  40. Cingolani, P.; Platts, A.; Wang, L.L.; Coon, M.; Nguyen, T.; Wang, L.; Land, S.J.; Lu, X.; Ruden, D.M. A program for annotating and predicting the effects of single nucleotide polymorphisms, Snp.Eff. Fly 2012, 6, 80–92. [Google Scholar] [CrossRef] [Green Version]
  41. Ruden, D.; Cingolani, P.; Patel, V.; Coon, M.; Nguyen, T.; Land, S.; Lu, X. Using Drosophila melanogaster as a Model for Genotoxic Chemical Mutational Studies with a New Program, SnpSift. Front. Genet. 2012, 3. [Google Scholar] [CrossRef] [Green Version]
  42. Nicholls, S.M.; Aubrey, W.; De Grave, K.; Schietgat, L.; Creevey, C.J.; Clare, A. On the complexity of haplotyping a microbial community. Bioinformatics 2021, 37, 1360–1366. [Google Scholar] [CrossRef] [PubMed]
  43. Fontenele, R.S.; Kraberger, S.; Hadfield, J.; Driver, E.M.; Bowes, D.; Holland, L.A.; Faleye, T.O.C.; Adhikari, S.; Kumar, R.; Inchausti, R.; et al. High-throughput sequencing of SARS-CoV-2 in wastewater provides insights into circulating variants. Water Res. 2021, 205, 117710. [Google Scholar] [CrossRef]
  44. Sapoval, N.; Lou, E.; Hopkins, L.; Ensor, K.B.; Schneider, R.; Treangen, T.J.; Stadler, L.B. Enhanced Detection of Recently Emerged SARS-CoV-2 Variants of Concern in Wastewater. medRxiv 2021. [Google Scholar] [CrossRef]
  45. Rios, G.; Lacoux, C.; Leclercq, V.; Diamant, A.; Lebrigand, K.; Lazuka, A.; Soyeux, E.; Lacroix, S.; Fassy, J.; Couesnon, A.; et al. Monitoring SARS-CoV-2 variants alterations in Nice neighborhoods by wastewater nanopore sequencing. Lancet Reg. Health Eur. 2021. [Google Scholar] [CrossRef] [PubMed]
Figure 1. Nucleotide mutations detected in more than five wastewater samples with respective allele frequencies. Columns are ordered according to sampling date, and rows are ordered according to genomic position. Column annotations provide sample specific information such as the date of sampling, average sequencing depth per sample, and sampling location. Row annotations highlight the respective genes and whether a mutation has been detected in any clinical samples.
Water 13 03018 g001
Figure 2. Comparison of median allele frequencies of signature mutations in wastewater samples (circles) to relative occurrence of lineages in clinical samples (squares) after 1 October 2020. Lineages with at least 3 signature mutations and at least 80 associated clinical samples are shown. Samples are grouped per calendar week, and each point represents at least 1 signature mutation detected in 1 sample.
Water 13 03018 g002
Figure 3. The number of detected unique characteristic mutations (outbreak.info) for B.1.1.7, samples with no detected mutations are shown in grey; otherwise, the coloring represents the mean allele frequency of all signature mutations (11 in total) per sample. Mutations shown here in November:ORF1A:T1001I meanAF:0.25, 2 samples; ORF1A:A1708D, AF: 0.05, 1 sample; ORF1A: I2230T, meanAF: 0.14, 4 samples; ORF8: Q27*, meanAF: 0.14, 4 samples, ORF8: R52I, meanAF: 0.06, 5 samples; ORF8:Y73C, meanAF: 0.06, 2 samples, S:A570D, AF: 0.02, 1 sample; S982A, meanAF: 0.15, 7 samples; SD1118H, meanAF: 0.20, 6 samples; N:S235F, meanAF: 0.14, 6 samples. In December; ORF1A:A1708D, AF:0.13, 1 sample; ORF8:Q27*, meanAF: 0.12, 2 samples; ORF8:R52I, meanAF: 0.04, 2 samples; S982A, meanAF: 0.14, 2 samples; N:235F, meanAF: 0.21, 8 samples.
Water 13 03018 g003
Figure 4. Characteristic mutations unique to specific lineages (B.1.1.420, B.1.1.7 and B.1.351 are shown) grouped according to location. Colored circles indicate presence of the mutation in a wastewater samples, and circle size reflects the allele frequency of the respective mutation(s). Vertical grey lines indicate the availability of wastewater samples. Red crosses indicate the presence of a mutation in a sequence derived from a clinical sample with the patient’s place of residence assignable to the catchment area of the respective wastewater treatment plant. Three locations were selected according to the number of available wastewater samples, and only samples between 1 October 2020 and 9 March 2021 are shown.
Water 13 03018 g004
Figure 5. Individual haplotypes (rows) for genomic regions between position 27,837 and 28,384 grouped by sample. Colors indicate the respective allele for each mutation present (columns) with reference alleles in green, alternative alleles in blue, and alternative alleles corresponding to B.1.1.7 signature mutations in red. The haplotype score of gretel is shown as a row annotation, as well as the month and location of sampling. Samples are arranged by date, and haplotypes within one sample are sorted by haplotype score. Column annotations highlight the B.1.1.7 signature mutations within the genomic region and the gene name. Signature mutations highlighted in this figure: Q27*, R52I and Y73C (all ORF8).
Water 13 03018 g005
Table 1. Number of nucleotide mutations per gene. The number of mutations in columns 2 and 3 is given as the number of mutations detected in any clinical sample divided by the total number of unique mutations seen in wastewater samples. Annotations of mutations (columns 4–7) are relative to the total number of mutations detected for each gene.
Gene NameDetected/Total MutationsFound in Multiple Samples (>5)Missense VariantSynonymous VariantFrameshift VariantInframe Deletion
ORF1ab660/297783/1071281 (43%)659 (22%)896 (30%)48 (2%)
S141/57821/55264 (46%)109 (19%)182 (31%)7 (1%)
ORF3a77/16511/11103 (62%)24 (15%)31 (19%)5 (3%)
E11/490/020 (41%)8 (16%)13 (27%)1 (2%)
M36/12610/1138 (30%)37 (29%)38 (30%)1 (1%)
ORF611/491/114 (29%)13 (27%)18 (37%)2 (4%)
ORF7a31/683/334 (50%)12 (18%)18 (27%)1 (2%)
ORF7b12/342/215 (44%)8 (24%)9 (27%)1 (3%)
ORF841/9710/1349 (51%)18 (19%)21 (22%)1 (1%)
N100/28723/28145 (51%)64 (22%)66 (23%)5 (2%)
ORF100/20/00 (0%)0 (0%)1 (50%)0 (0%)
Publisher’s Note: MDPI stays neutral with regard to jurisdictional claims in published maps and institutional affiliations.

