Article

Differences in the Proportional Contributions of Particulate Radiocesium Sources under Base- and High-Flow River Conditions: A Case Study in the Central Region of Fukushima

1
Fukushima Prefectural Centre for Environmental Creation, 10-2 Fukasaku, Miharu Town 963-7700, Fukushima, Japan
2
Institute of Technology, Tsuyama College, 624-1, Numa, Tsuyama City 708-8509, Okayama, Japan
*
Author to whom correspondence should be addressed.
Water 2021, 13(21), 3021; https://doi.org/10.3390/w13213021
Submission received: 17 September 2021 / Revised: 26 October 2021 / Accepted: 26 October 2021 / Published: 28 October 2021
(This article belongs to the Section Water Quality and Contamination)

Abstract

:
Due to the Fukushima Daiichi Nuclear Power Plant accident in 2011, large amounts of radiocesium were deposited over forest ecosystems in the headwater regions of rivers in Fukushima Prefecture, Japan. There is considerable concern about whether the runoff from these regions will result in recontamination of lower-lying areas further downstream after heavy rainfall events and typhoons. This study examined the sources and levels of cesium-137 (137Cs), the most abundant radioisotope in river sediments, in total suspended solids (TSS) in river water. In addition, changes in the predominant source of TSS associated with changes in river conditions were investigated. The properties of total organic carbon (TOC) in TSS (concentrations and isotopic compositions) were also measured to identify differences among sources. The results showed reductions in 137Cs and TOC properties in TSS when the river conditions changed from base flows to high flows, indicating the existence of a dilution effect through the addition of mineral particles from extraneous sources. Simulation results obtained using a mixing model suggested that forest soils are the primary source of TSS regardless of river conditions, but that the relative contribution of TSS from forest soils was decreased under high-flow conditions. Meanwhile, the relative contributions of both riverbank soil and river sediments were increased under high-flow conditions. Due to the low 137Cs concentrations in riverbank soils and river sediments, it is unlikely that heavy rainfall events will cause serious recontamination of areas downstream in the study area.

1. Introduction

After the Fukushima Daiichi Nuclear Power Plant (FDNPP) accident in March 2011, the fluvial transportation of radiocesium, especially cesium−137 (137Cs), through riverine systems in the contaminated areas of Fukushima Prefecture has been investigated extensively [1,2,3,4]. Total suspended solids (TSS) are known to play an important role in the transport of 137Cs, and particulate 137Cs has been shown to contribute significantly towards the total 137Cs flux [5]. The role of TSS in the transport of 137Cs has been demonstrated during high-flow events associated with large rainfall events, such as typhoons [1,6,7]. A previous study found that the relative contributions of particulate 137Cs in several Japanese rivers under high−flow river conditions ranged from 21% to almost 100% [1]. Another study concluded that more than 90% of radiocesium was associated with suspended particles during periods of precipitation and flooding [6]. This increase in radiocesium was also observed prior to the FDNPP accident in a Japanese river [7]. Thus, investigating the dynamics of TSS in rivers under high-flow conditions would facilitate an understanding of the mechanisms that affect 137Cs fluxes in riverine ecosystems. Generally, the concentration of TSS in rivers increases during high-flow events as additional materials enter the rivers in the runoff. In the context of the FDNPP accident, this additional TSS will transport much of the 137Cs that was deposited over terrestrial areas to the ocean. It is, therefore, important to clarify the dynamics and properties of these additional sources of TSS in order to gain a more comprehensive understanding of the fluvial transportation of 137Cs through rivers. Indeed, the identification of sources of TSS under high-flow river conditions is extremely important for implementing appropriate measures to reduce or manage the 137Cs fluxes in the rivers of Fukushima Prefecture.
Previous studies have illustrated the importance of riverbank erosion and resuspension of river sediments as mechanisms for the formation of particulate 137Cs during rainfall events [1,7]. On the other hand, the headwater regions of rivers in Japan are typically forested, and these areas are important sources of organic matter, nutrients, and minerals in rivers. However, extensive areas of forest in the central and coastal regions of Fukushima Prefecture were contaminated by radionuclides derived from the FDNPP accident [8]. The 137Cs that was deposited on forests, and which accumulated and became concentrated on the forest floor, has gradually migrated to the mineral phase [9,10]. Except for the evacuation and difficult-to-return zones, decontamination efforts involving the removal of surface soil were conducted in the lower-lying agricultural and residential areas of the catchments. However, because no decontamination was performed in forests, there is some concern that forests may act as a continuous source of 137Cs to downstream areas in the future [9]. Consequently, the potential role of severe rainfall events or typhoons in promoting the washout of 137Cs-contaminated materials from forests upstream has been a concern.
Several studies have, therefore, estimated the relative contributions of potential particulate 137Cs sources in river water [11,12,13,14]. Their findings showed that the contribution of forests to particulate 137Cs was relatively low, while that from subsoil in the coastal catchments in Fukushima was relatively high [11,12,13]. However, a recent study reported that the dominant sources of river sediments can change depending on rainfall intensity or disturbance scale, even within the same catchment [14]. This implies that the predominant sources of TSS may also change, not only in response to repeated rainfall events but also during a single rainfall event. To better clarify this point, river water samples should be collected during high-flow events; however, the aforementioned studies (i.e., [11,12,14]) used composited river sediments to measure particulate 137Cs. Using such a sampling protocol can minimize the spatiotemporal variations that exist among different sampling sites within the area being sampled, essentially averaging the obtained measurements [15]. As a result, the relative contributions of particulate 137Cs sources during high-flow events cannot yet be fully understood, and further research is needed to accurately estimate the short-term contributions of each source to SS under different river flow conditions.
Total suspended solids are composed of a mixture of both organic and mineral materials. One approach to clarifying the differences among SS sources is the use of stable carbon (C) isotopes (expressed in terms of the natural abundance of 13C as δ13C). The δ13C values of terrestrial C3-plants typically range from −30‰ to −22‰, while those of C4 -plants range from −15‰ to −9‰ [16]. On the other hand, the δ13C values of freshwater aquatic plants typically range from approximately −47‰ to −8‰, generally falling within the range of −30‰ to −20‰, which overlaps with the range for terrestrial plants [17]. In addition, isotopic fractionation during organic matter decomposition has the effect of increasing the δ13C values of residual soil organic matter (SOM) [18]. In situations where the extent of decomposition of organic matter (e.g., surface litter and SOM) is low, such as at the soil surface, the δ13C values are also low. Conversely, in situations where the extent of organic decomposition is high, such as deeper soil layers, the δ13C values are high [19,20]. Since considerable variation can be expected in the δ13C values of riverine TSS, the relative contributions are estimated using the differences in δ13C values among the sources [21,22,23,24,25,26]. This technique has been used previously to estimate the contributions of different sources to riverine SS in Fukushima Prefecture [11,12,13].
In this study, instead of using time-integrated samples, we collected TSS samples from flowing rivers to clarify the effects of different river conditions on TSS properties. In addition, this study assumed that the TSS under high-flow conditions was equivalent to TSS under base-flow conditions plus the SS that was added during high-flow events. Specifically, we investigated the differences in the properties of TSS (137Cs, TOC concentrations, and δ13C values) under both base- and high-flow conditions and characterized the properties of the additional TSS.
In addition, we identified forest soil, forest litter, riverbank soil, and river sediment as potential sources of TSS in this study and estimated the relative contribution of each of the sources to the TSS under both base- and high-flow conditions at the study site. Based on the results, we discussed the potential for recontamination of the downstream area due to future high-flow events.

2. Materials and Methods

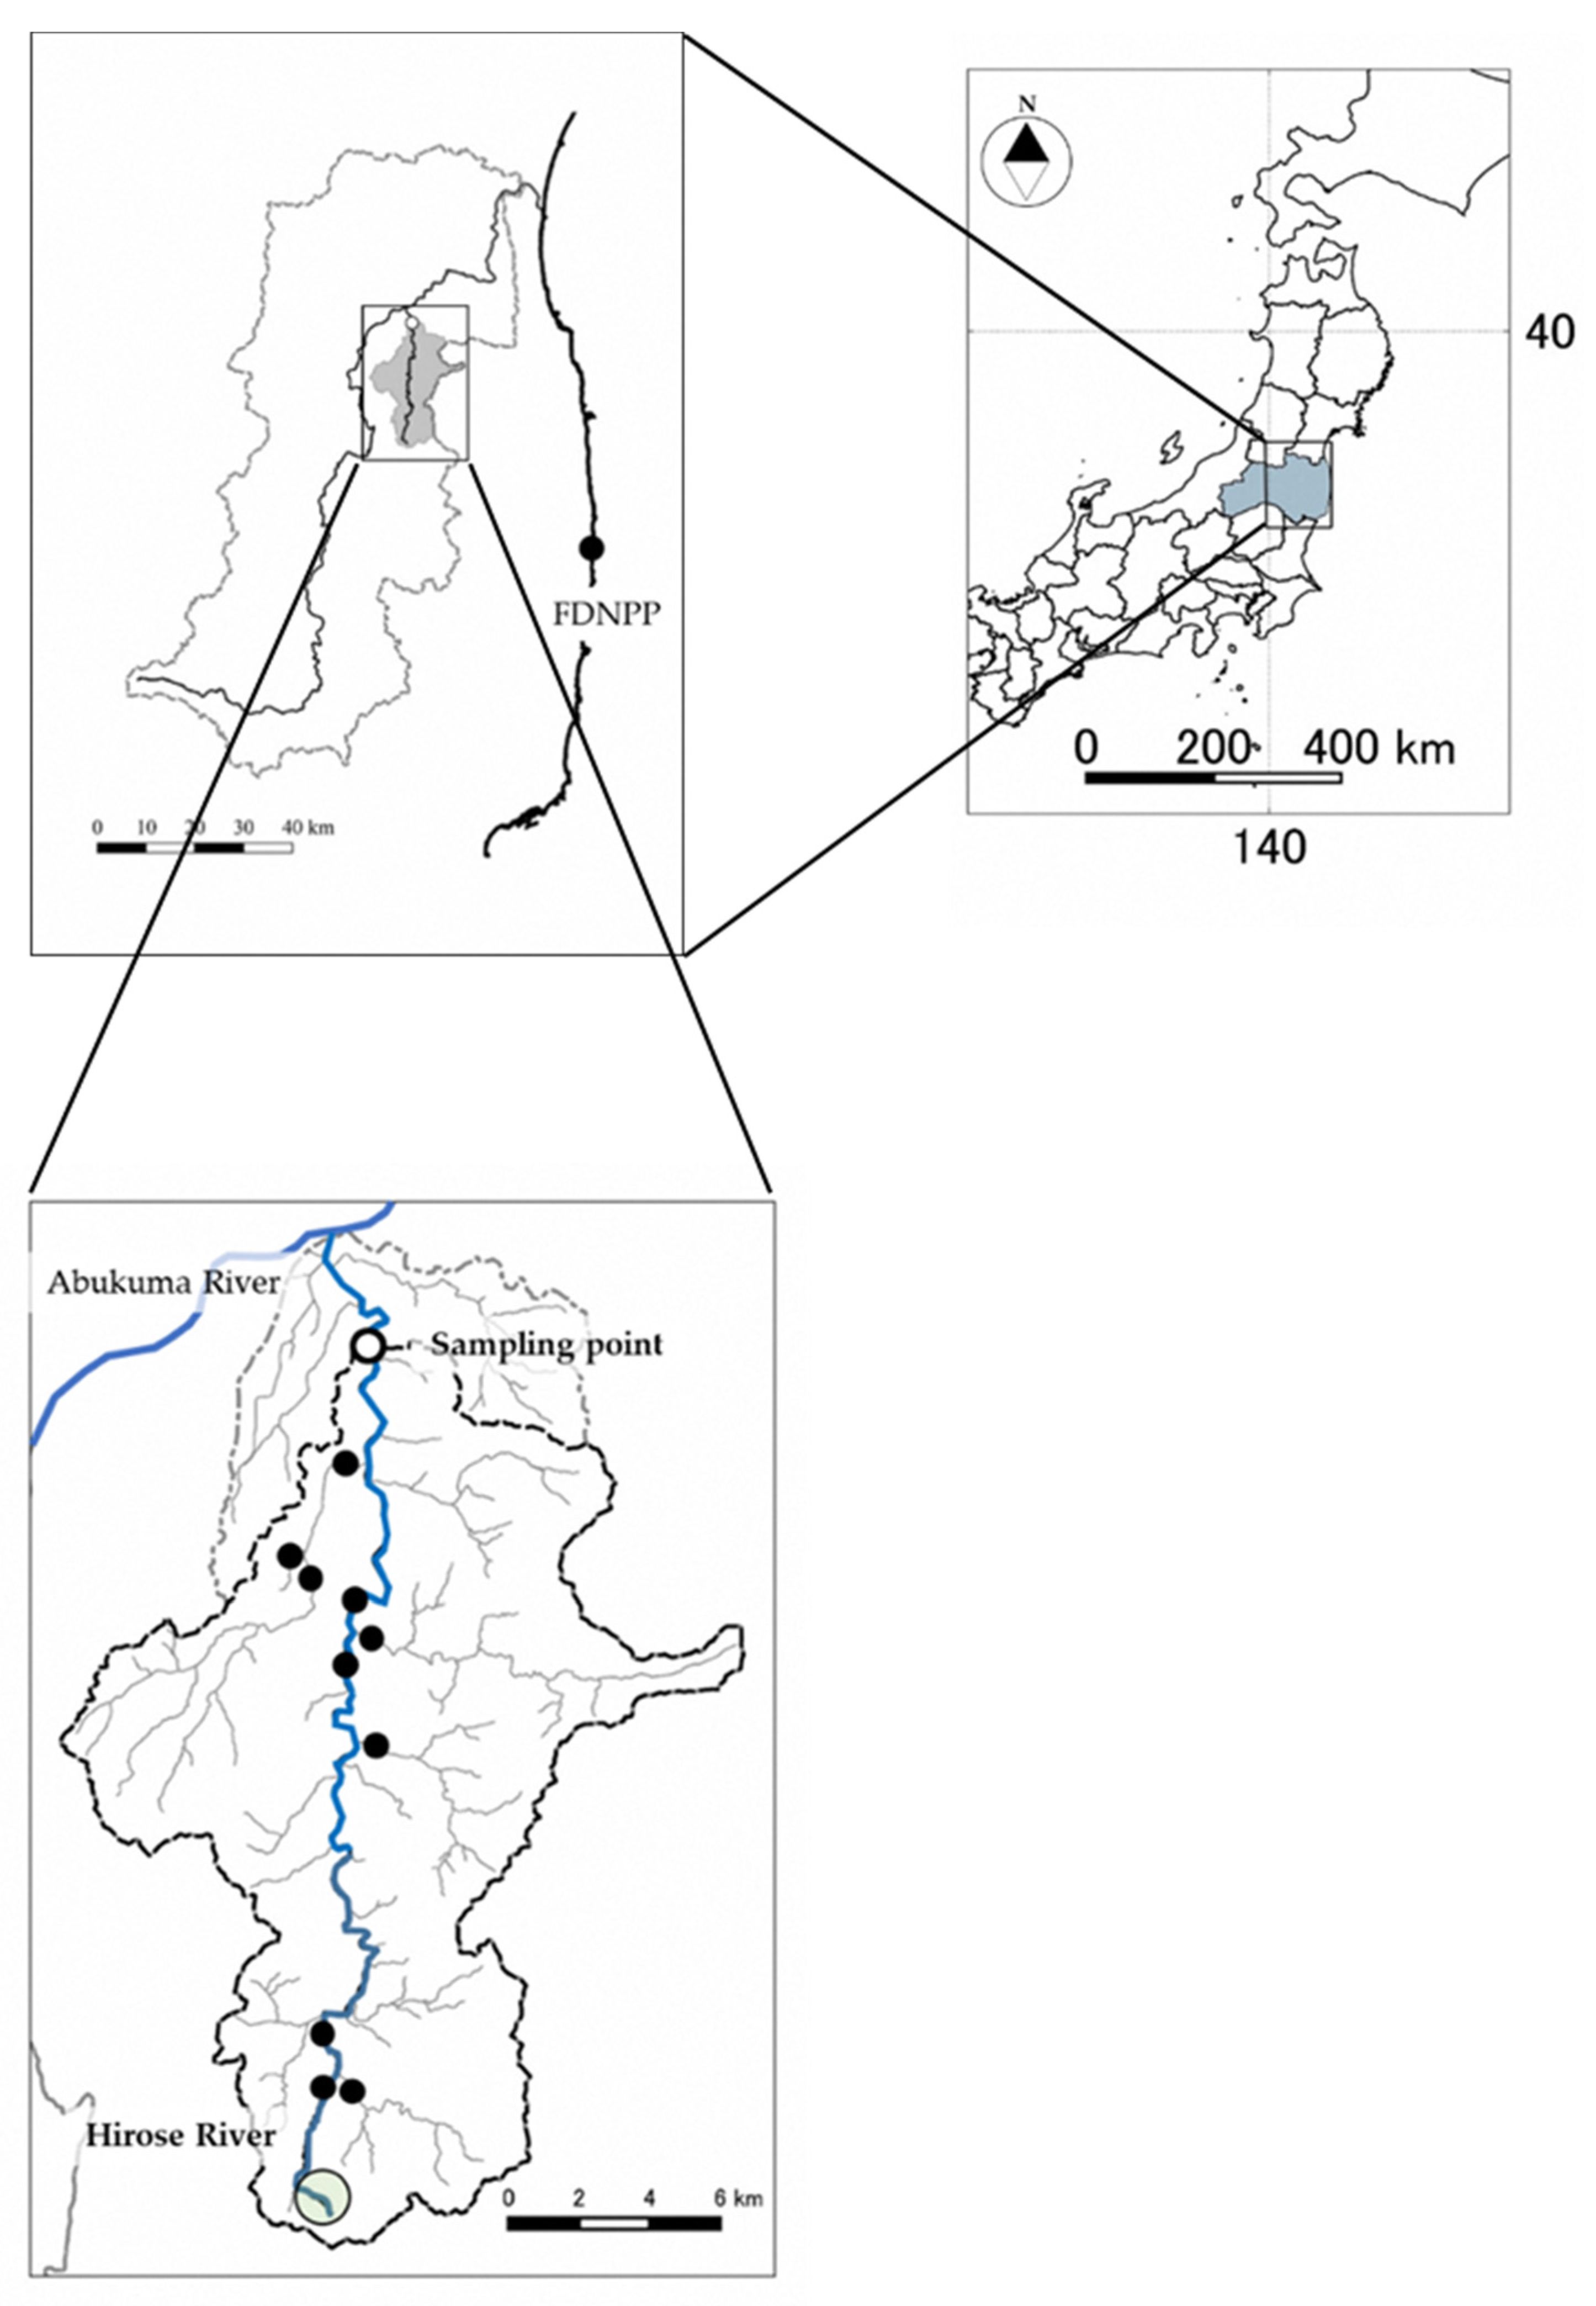
2.1. Site Description and Sampling Methods

This study was conducted in the Hirose River catchment, which is located approximately 40–60 km from the FDNPP in the northern part of Fukushima Prefecture, Japan (Figure 1).
The mean annual temperature and precipitation from 1991 to 2020 were 12.7 °C and 1095 mm, respectively. The catchment area is approximately 269 km2 and the mean 137Cs inventory of the target catchment was estimated to be about 227 kBq m−2, based on the third airborne monitoring survey [27]. We established a sampling point near the confluence of the Hirose River and the Abukuma River (37°50′22.0 N, 140°36′56.0 E, Figure 1) and collected river water samples under base-flow conditions approximately once every three months from May 2017 to October 2019. In addition, to collect river water samples with different TSS concentrations, in particular high concentrations, we structured the sampling schedule so that we could obtain data during and after a typhoon and collected samples six times during the survey period (Table 1).
For each sampling period, we collected five to six river water samples at approximately 4 h intervals, except for the last sampling period, for which only three samples could be collected due to the occurrence of serious flooding (Table 1). However, in some sampling periods, we could not collect the samples with high TSS concentrations because of changes in the path of the typhoon. River water samples (about 100 L) were collected to measure the particulate 137Cs content (mBq L−1), and 0.5 or 1.0 L samples were collected for the elemental and isotope analyses using a bucket and rope from a bridge.
As potential sources of the additional TSS at this study site, surface soil (ca. 0–2 cm intervals, n = 12) and litter (n = 17) samples were collected in adjacent forest areas in the headwater region in 2020 and 2021. In addition to riverbank soil samples, which were collected at the surface, forest soil and river sediments were also sampled along the mainstream and tributaries in 2019 and 2020 using a 100 cm−3 soil core sampler to reduce the loss of fine particles. Forest soil, riverbank soil (n = 15) and river sediments (n = 21) were sieved using a 2 mm mesh in the field. All samples were packed into plastic bags and brought back to the laboratory for analysis.

2.2. Analytical Procedures in the Laboratory

To measure the particulate 137Cs content, approximately 100 L of river water was passed through a polypropylene cartridge filter (RP13–011, Japan Vilene Co., Ltd., Tokyo, Japan) to collect the SS in the sample [28]. However, some water samples with high SS concentrations (e.g., samples collected under high-flow conditions), could not be filtered to completion as the cartridges became blocked. In such cases, filtering was stopped and the volume of river water that had been filtered was recorded. The other water samples (i.e., approximately 0.5 or 1 L) were filtered using a Whatman GF/F filter, which was pre-combusted at 450 °C for 4 h. After filtration, the filter was dried at 105 °C for 24 h. The concentration of TSS in river water samples (mg L−1) was determined by subtracting the dry weight of the filter before filtration from that after filtration. Dried GF/F filter samples were then ground using a mixer mill (MM400, Retsch, Germany) for the elemental and isotopic measurements. Forest litter samples were washed using distilled water to remove any surface contamination. Then, all potential source materials were oven-dried at 40 °C for more than 48 h. The dried samples were then ground using a mixer mill for further analysis.
The particulate 137Cs (662 keV) content in the river water samples (mBq L−1) was measured directly using the cartridge filters with a high-purity germanium detector (GC2018 and GC4020, Canberra Japan, Tokyo, Japan, GEM20–70, GEM30–70 and GMX30–70 Seiko EG&G Co., Ltd., Tokyo, Japan). Measurement times ranged from 86400 to 172800 s and the detection limit was defined as 3σ of the counted values (the limit of detection was less than 12 mBq L−1). Counts below 3σ, even after 172,800 s, were defined as not detected (N.D.). After the measurements, the cartridge filters were oven-dried at 95 °C for more than 48 h. The accumulated amounts of TSS were calculated by subtracting the weight of the filters after drying from that measured before filtration, and 137Cs concentrations in SS (Bq kg−1) were calculated by dividing the particulate 137Cs content by the amount of SS in the cartridges. For the 137Cs measurements performed on cartridge filters (n = 47), one sample was assigned as N.D. and another sample could not be used due to problems with measuring the initial weight of the cartridge filter. Ground litter and soil samples were placed into a U8 container and measurements were performed for 7200 s. All 137Cs concentrations were decay-corrected to the sampling date.
Measurements of TOC and δ13C in both the SS and potential sources were performed using an EA-IRMS system consisting of a Flash2000 elemental analyzer coupled to a Delta-V advantage isotope ratio mass spectrometer (Thermo Fisher Scientific, Waltham, MA, USA) using a Conflo IV interface at the Fukushima Prefectural Centre for Environmental Creation. The isotope composition is expressed in δ notation, representing the ‰ variation from the standard reference material:
δ13C = [(RsampleRstandard)/Rstandard] × 1000,
where, R is the 13C/12C ratio and Vienna PeeDee Belemnite (VPDB) is the standard. The δ13C values of samples were calibrated using commercially available three running standards (Glycine: Lot No. AZ300M9R2283, δ13C = −32.3 ± 0.2‰; L-Alanine: Lot. No. AZ101SS16, δ13C = −19.6 ± 0.2‰; L-Histidine: Lot No. AZ1Z0M5P8062, δ13C = −10.7 ± 0.2‰, Shoko Science Co., Ltd., Saitama, Japan). These standards were calibrated against VPDB using NBS 19 and IAEA Sucrose ANU. These running standards were measured once for approximately every ten river water samples during the measurements.
Firstly, we measured the total C (TC) concentration and the δ13C (δ13CTC) of all samples except plant materials to measure TOC concentrations and δ13C values using the EA−IRMS system. Then, each sample was packed with the required amount of ground filter, soil, and sediment into an Ag container and placed in 1 M HCl for about 12 h in our laboratory to remove inorganic C from the samples. The containers were then placed on a hotplate and dried at 80 °C before performing the subsequent measurements. The TOC concentration of river water samples (particulate organic carbon (POC), mgC L−1) was calculated by multiplying the TOC concentration in SS by the SS concentration in the river water samples. The analytical precision, which was calculated by repeated measurements of glycine, was ±0.2‰ (as the S.D.).

2.3. Statistical Analyses

Regression analyses were performed to verify the change in the particulate 137Cs and POC content in river water samples with increasing TSS concentration. In addition, the concentrations of 137Cs and TOC, as well as the δ13C values in TSS, were used for linear regression analyses with log-transformed TSS concentrations. The averages of the data points assigned to the base-TSS load and all of the data points assigned to the high-TSS loads were then used in these regression analyses. The differences in 137Cs, TOC, and δ13C in TSS between the river conditions were performed using Welch’s t-test. The significance level for all analyses was set at p ≤ 0.05.

2.4. Estimation of the Contributions of Potential Sources to TSS

The contributions of potential TSS sources were calculated based on 137Cs, TOC, and δ13C values in TSS using a Bayesian isotopic mixing model, Stable Isotope Analysis in R (SIAR ver. 4.2) [29]. The contributions of potential TSS sources were estimated in a simulation using 200,000 iterations, with the first 50,000 iterations discarded (burn-in) without the concentration dependency and the enrichment factor [30,31,32]. We used the siarmcmcdirichletv4 function implemented in the SIAR package. To estimate the data for the high-SS-loads, the modes of contributions were used for the subsequent analyses due to the vague prior distribution [31]. The uncertainty in the simulation results was evaluated by calculating the average relative mean error for 137Cs, TOC and δ13C. All statistical analyses were performed using R v3.6.2 [33].

3. Results

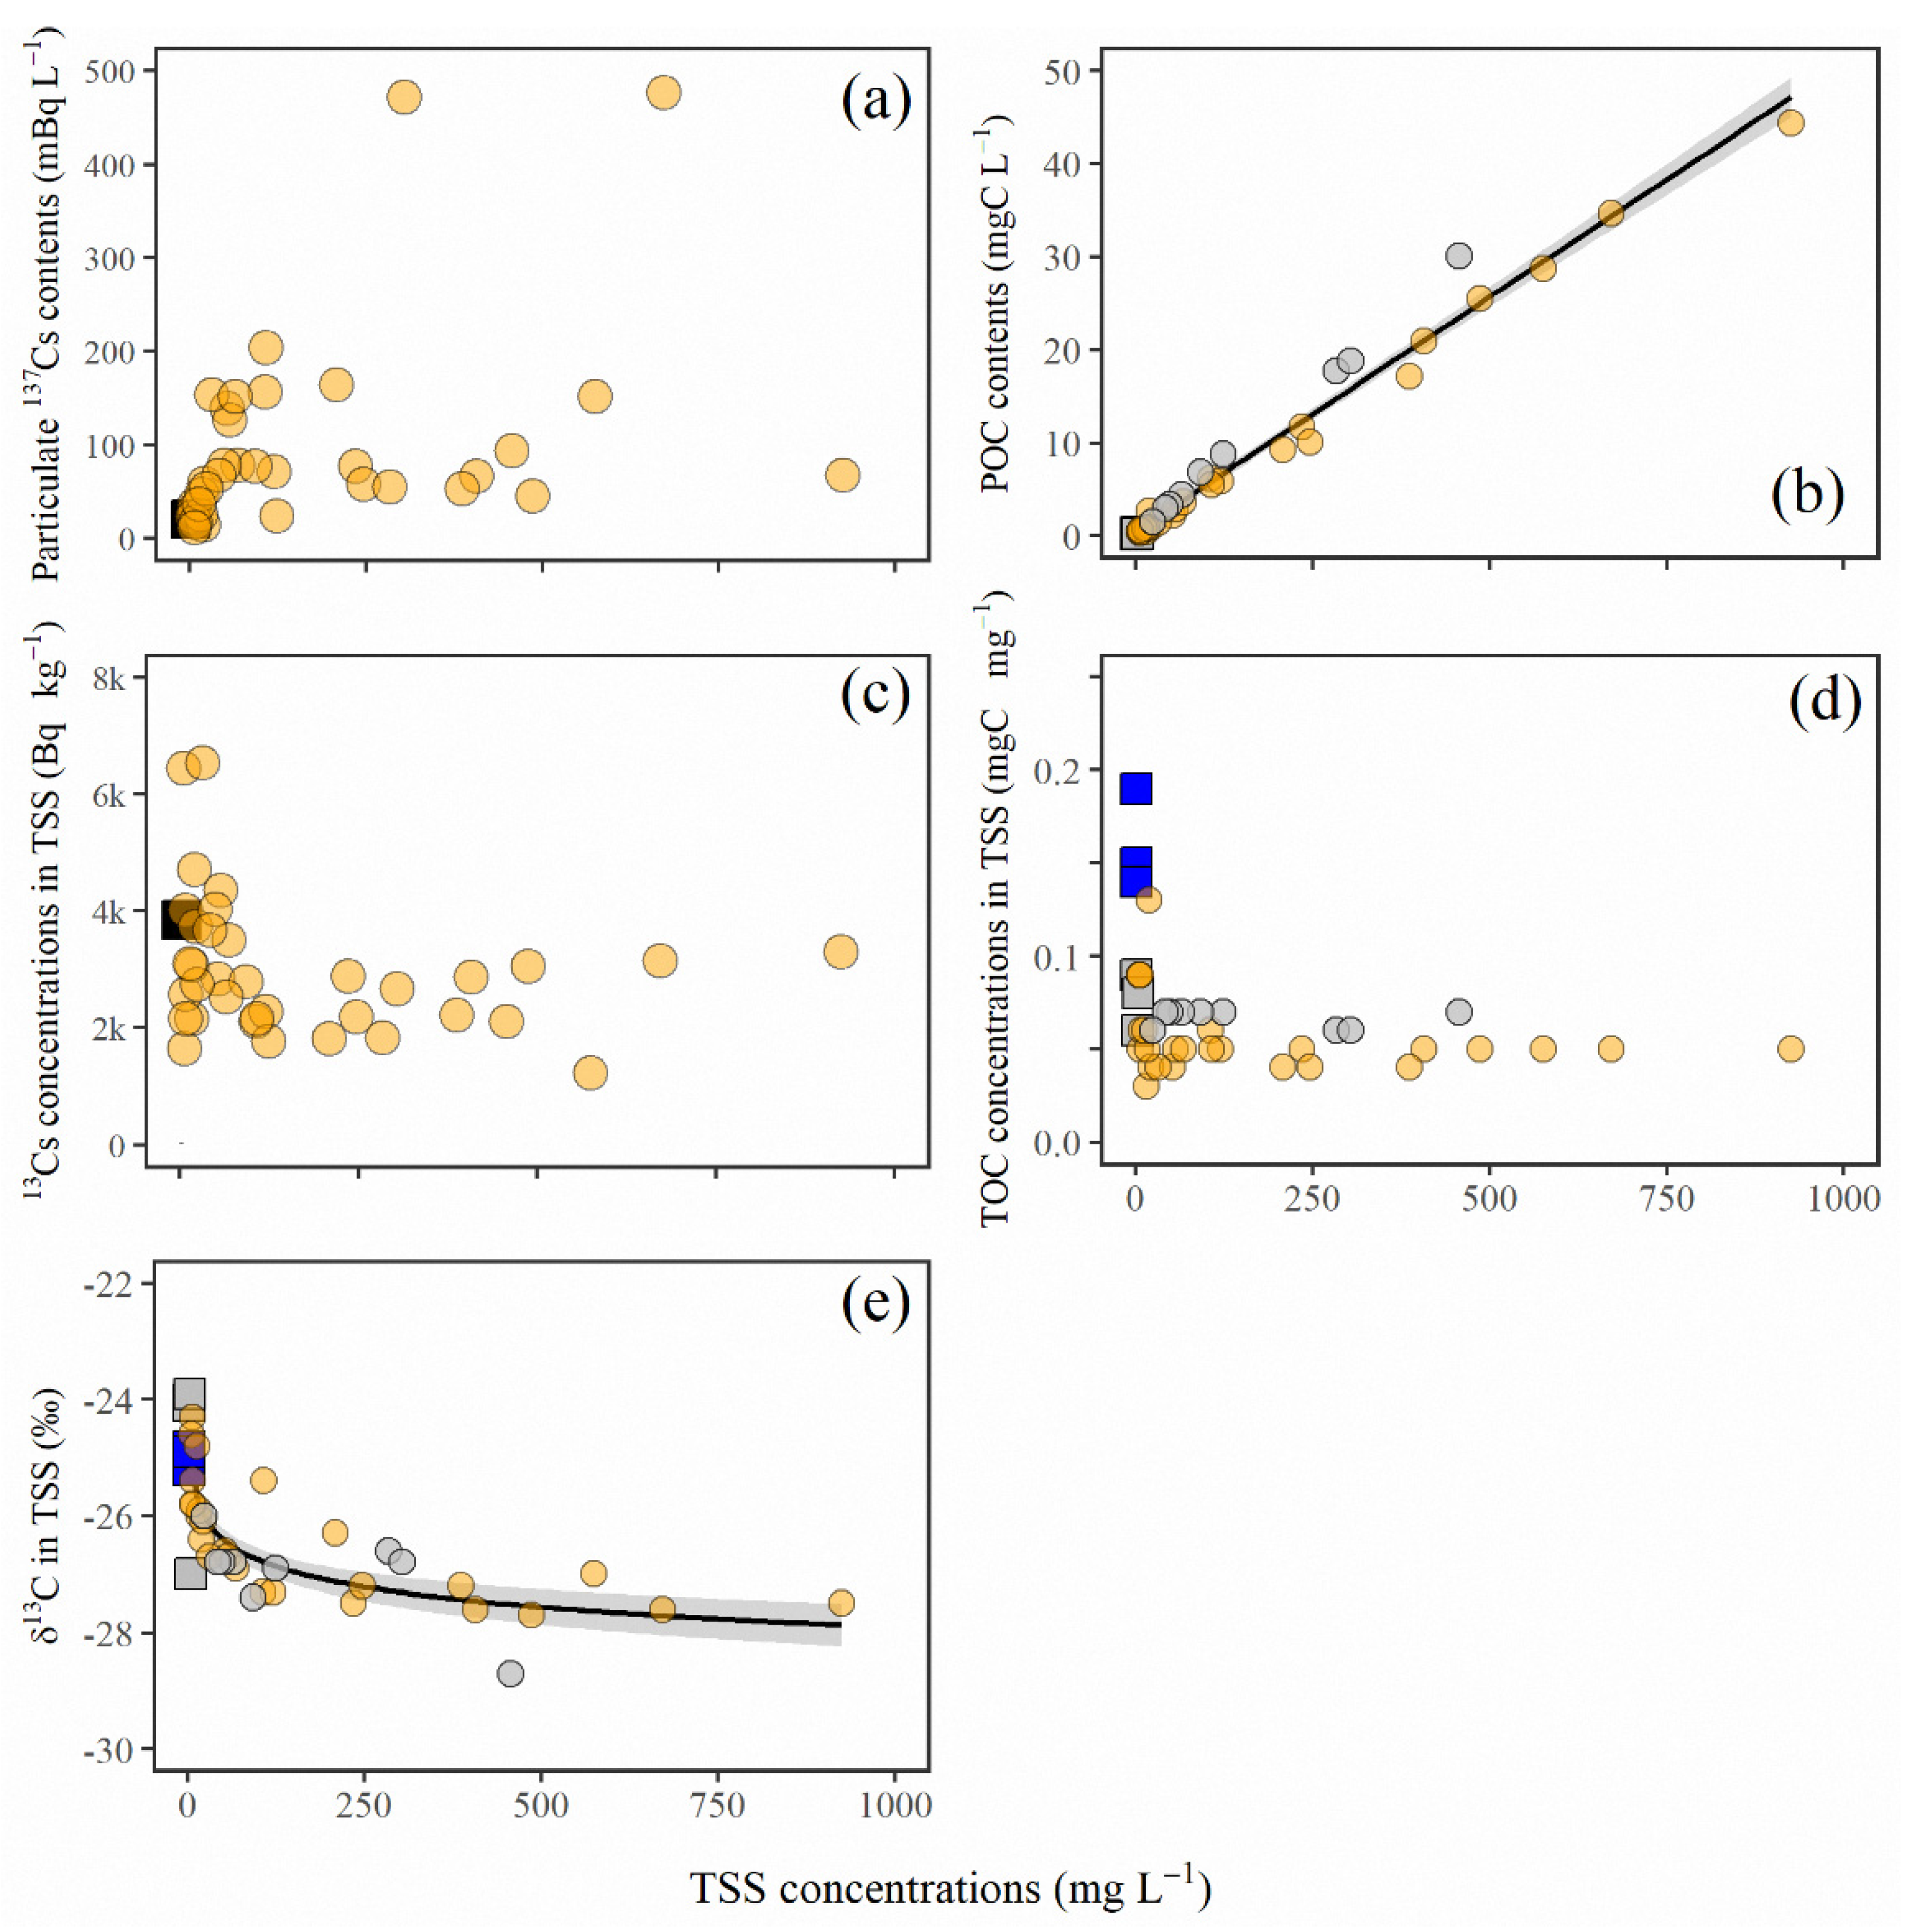
3.1. Average 137Cs (Bq kg−1), TOC (mgC mg−1) and δ13C (‰) of Potential SS Sources in the Study Area

Table 2 shows the average concentrations of 137Cs, TOC, and δ13C values with standard deviations (S.D.) for the four potential sources examined in this study.
Forest soil showed the highest 137Cs concentrations, followed by riverbank soil, forest litter and river sediment. On the other hand, forest litter had the most depleted δ13C values of typical C3 plants, while the other sources showed more enriched and processed δ13C values of C3 plant materials. Except for forest litter, the sources had low TOC concentrations and were mostly composed of mineral particles. The concentrations of 137Cs, TOC, and δ13C values differed significantly among the sources (Kruskal-Wallis H test, p < 0.001).

3.2. Data Processing and Management for the Subsequent Analyses

The data of TSS concentrations, particulate 137Cs, POC, 137Cs, TOC, and δ13C are shown in Table S1.
Due to equipment failure, the TOC concentrations of the 14 GF/F samples and their δ13C values could not be measured, and no more samples remained to perform the measurements again. We, therefore, estimated the missing TOC and δ13C data (as TOC* and δ13C*, respectively) based on obtained sample data. Firstly, to clarify the effect of inorganic C on TOC and δ13C data, the differences between TC and TOC, and δ13CTC and δ13C, were compared by paired t-tests. The results showed significant differences between each pair (i.e., p ≤ 0.05 for the C concentration, and p < 0.001 for δ13C). We then performed linear regression analyses for both pairs and detected significant relationships in both pairs (TOC = 0.664 × TC + 0.017. R2 = 0.85, p < 0.001; δ13C = 1.1 × δ13CTC, R2 = 0.80, p < 0.001). Based on these results, the TOC* and δ13C* data could be estimated and used in subsequent analyses. However, due to problems with equipment, neither TC nor TOC could be measured for two samples.
On the other hand, three samples were observed to have very high 137Cs concentrations with relatively low TSS concentrations (Table S1); the 137Cs concentrations of these samples were significantly higher than those of the potential TSS sources in this study (Table 2). These high 137Cs concentrations could be attributed to the accidental inclusion of highly 137Cs concentrated particles, such as radiocesium-bearing microparticles in bulk TSS [34]. These particles are composed mainly of SiO2 glass and contain various other elements, including radiocesium. It has been reported that such microparticles can be found in river waters with 137Cs concentrations as high as 0.1 to 0.4 Bq per particle, although the size of the particles in that study measured only a few micrometers [34]. The results suggest that even if a single radiocesium-bearing microparticle was included in a TSS sample, the total 137Cs concentration could increase significantly. If the three samples with very high 137Cs concentrations (Table S1) were included in the subsequent analyses, the particulate 137Cs and 137Cs concentrations in TSS could have been markedly elevated at low TSS concentrations. As the mechanisms affecting the presence of these radiocesium-bearing microparticles in these samples fall beyond the scope of this study, we excluded the three outliers from further analyses.
The subsequent analyses are, therefore, based only on samples for which both 137Cs and POC measurements were available (n = 42).

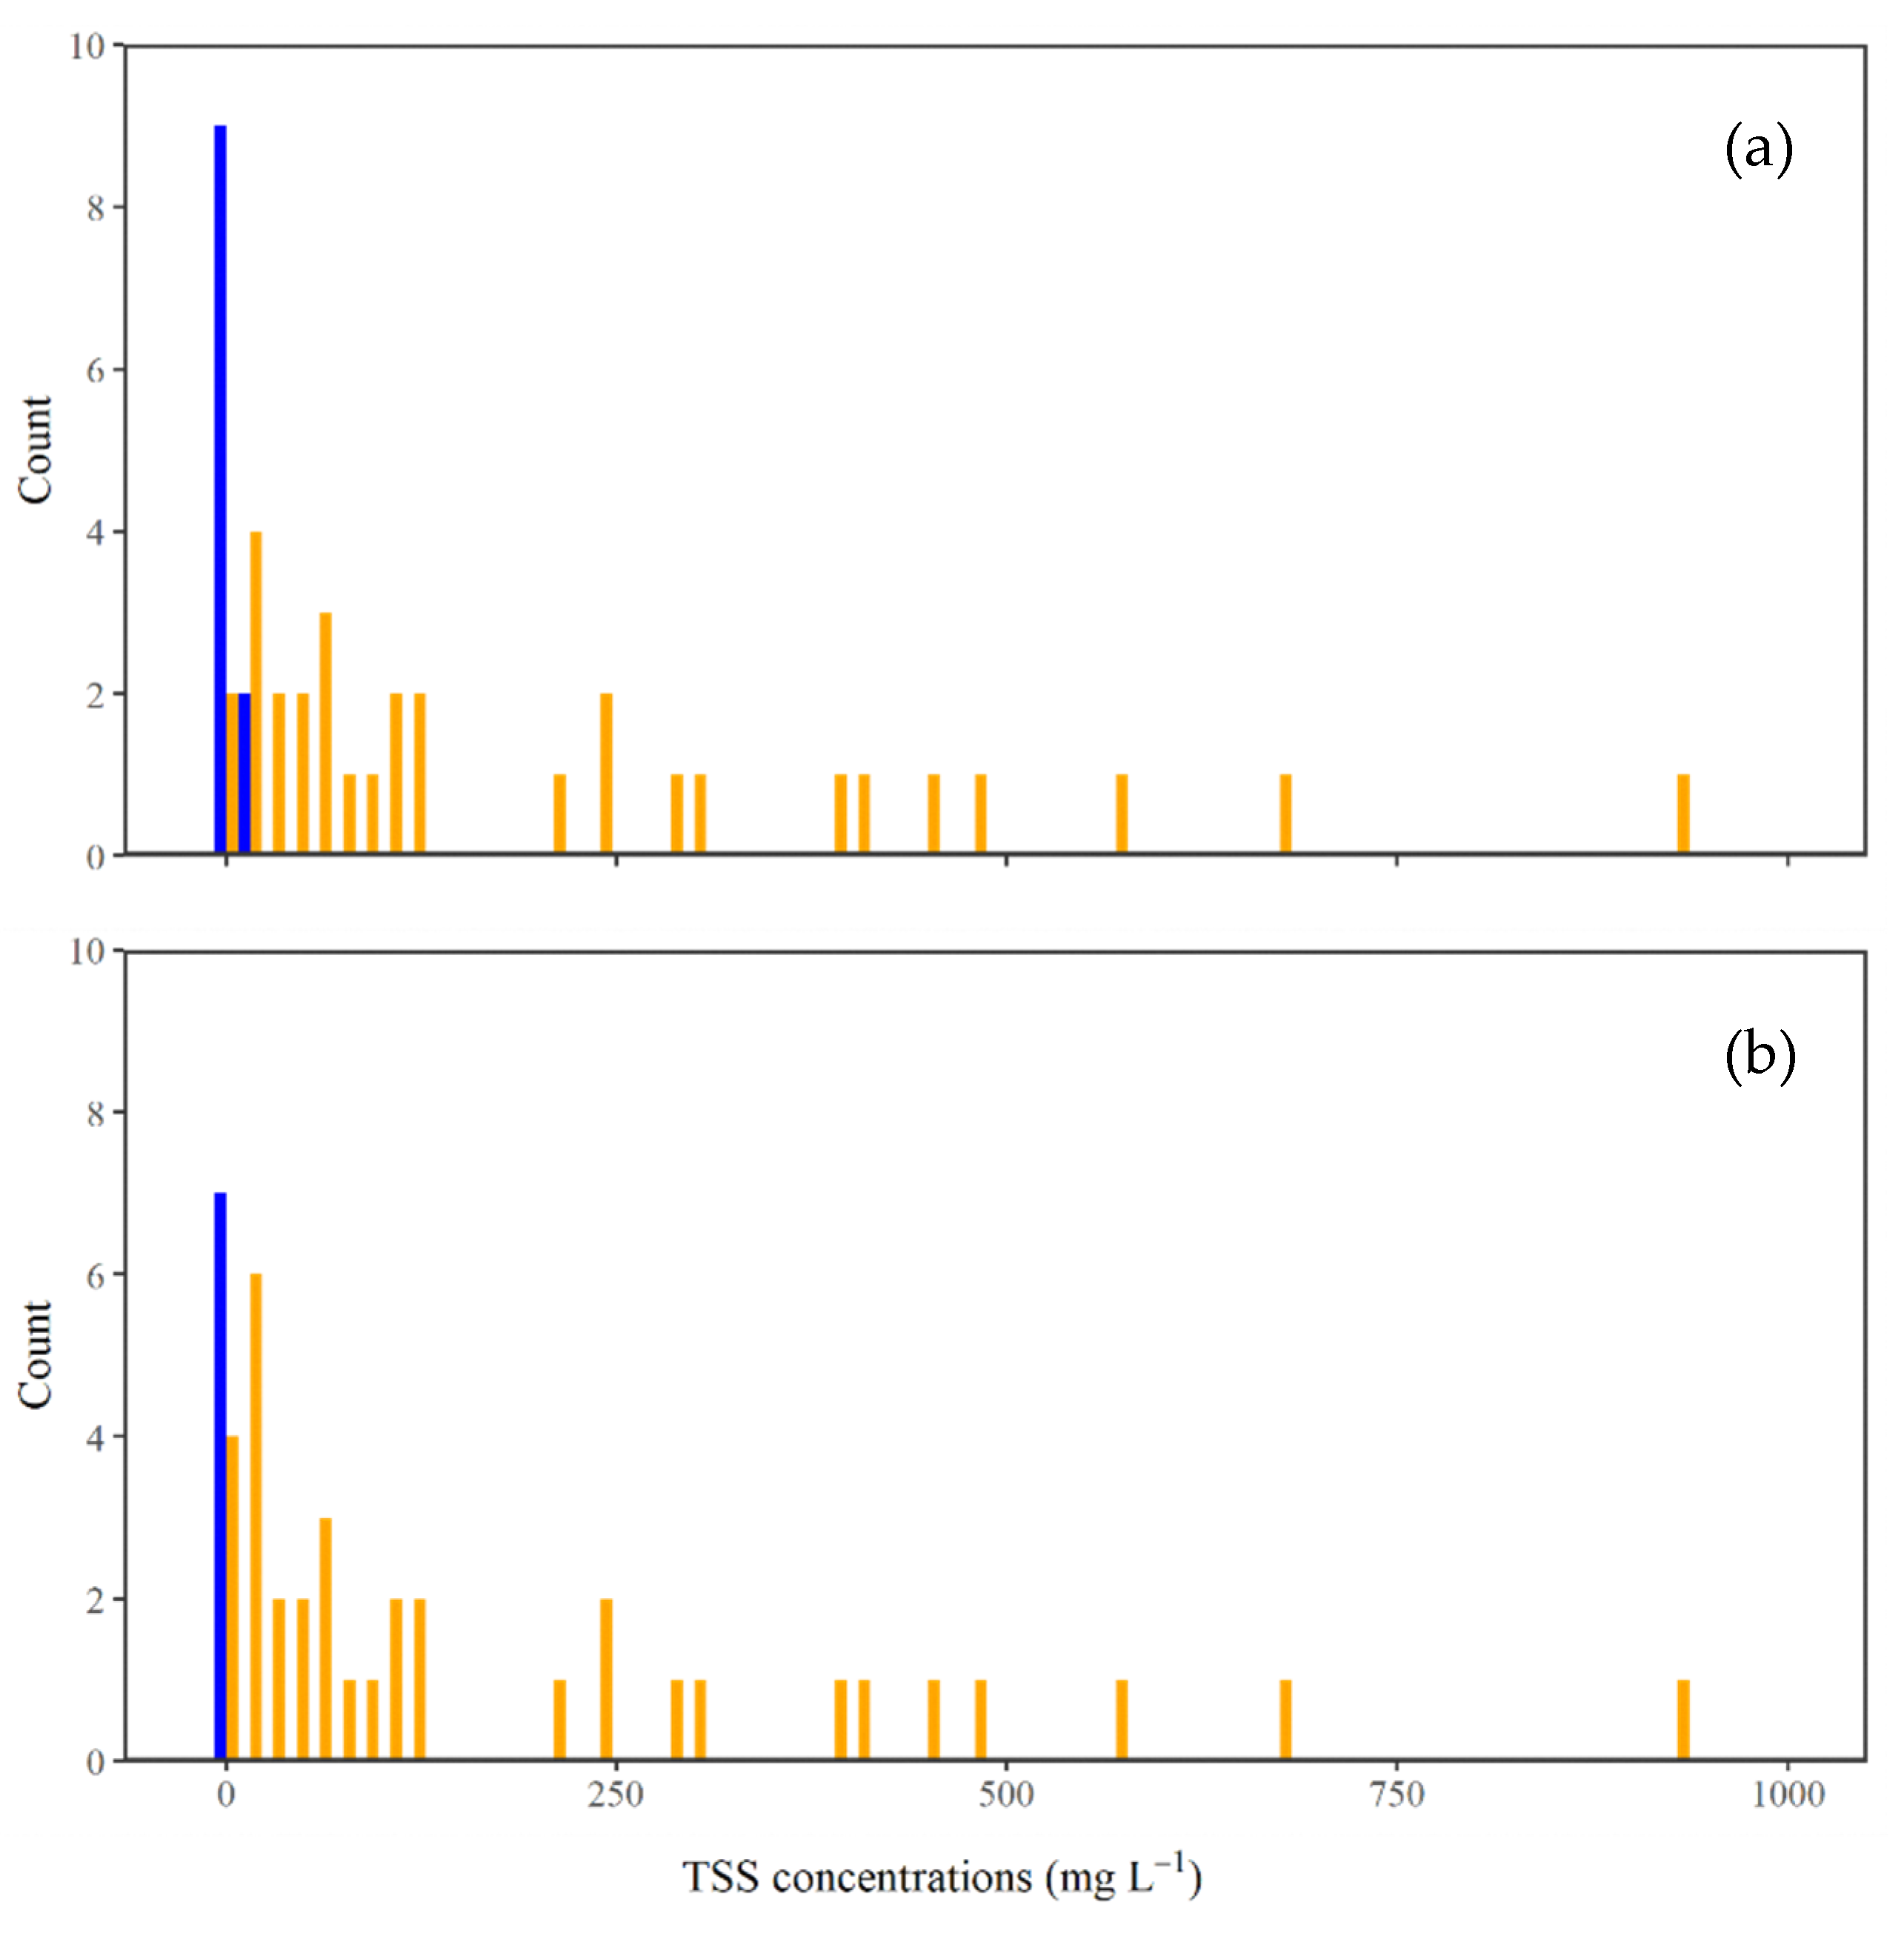
3.3. Redefinition of River Conditions Based on TSS Concentrations

Defining the representative TSS concentrations under base-flow conditions is important because it is assumed that high TSS concentrations under high-flow conditions were the result of additional TSS on top of the background TSS that was present under base-flow conditions. However, the variation observed in the TSS concentrations of samples collected under base-flow conditions was large (1.5 to 19.8 mg L−1, median = 4.5, average = 6.0, n = 12). Conversely, some samples obtained under high-flow conditions had TSS concentrations that were comparable to, or lower than, those observed under base-flow conditions (Figure 2a). These low TSS concentrations may have been because we collected samples during rainfall events (a simple periodical sampling schedule at 4 h intervals), or because of minor effects related to typhoons on river conditions. We, therefore, used the median values of the TSS concentrations that were measured under base-flow conditions as the threshold for determining the range in TSS concentrations under both the river conditions. All of the data points above this threshold were considered to be high-TSS loads, while the data points below this threshold were considered to be base-TSS loads. The concentration of TSS at the base-TSS-load level ranged from 1.5 to 4.2 mg L1 (average = 2.2, n = 7) and that at the high-TSS-load level ranged from 4.9 to 925.5 mg L1 (n = 35, Figure 2b).

3.4. Changes in Quantities in River Waters and Properties of TSS in River Water Samples

The changes in particulate 137Cs and POC content in river water samples are shown in Figure 3a,b. The average content of 137Cs and POC under base-SS-load conditions was 20.9 ± 11.0 mBq L−1 and 0.266 ± 0.070 mgC L−1, respectively (Mean ± S.D. Figure 3a,b). Linear regression analysis using the average data under the base-TSS-load conditions and all of the data under high-SS-load conditions revealed that the POC content in river water samples increased as the TSS concentration increased (POC = 0.050 × TSS, R2 = 0.98, p < 0.001. Figure 3b). However, due to large variations observed in Figure 3a, the particulate 137Cs content showed a very weak correlation with TSS concentrations (Pearson’s correlation coefficient R = 0.38, p ≤ 0.05).
Contrary to the results obtained for the 137Cs and POC contents, 137Cs, TOC, and δ13C were relatively high in SS under base-SS-load conditions (Figure 3c–e). The average values of 137Cs, TOC, and δ13C in TSS under the base-TSS-load conditions were 800 ± 2200 Bq kg−1, 0.141 ± 0.071 mgC mg−1, and −24.8 ± 1.1‰, respectively. Regression analysis showed a significant negative relationship between δ13C values of TSS and TSS concentration (δ13C = −0.5 × log (TSS) − 24.4, R2 = 0.70, p < 0.001). On the other hand, it is difficult to explain changes in both 137Cs and TOC in TSS with increasing TSS concentrations (137Cs = −285 × log (TSS) + 4200, R2 = 0.15, p = 0.02, TOC = −0.007 × log (TSS) + 0.091, R2 = 0.23, p = 0.003. Figure 3c,d). The values of 137Cs and TOC seemed to be relatively constant under the high-TSS-load conditions (137Cs: 3000 ± 1200 Bq kg−1, TOC: 0.059 ± 0.019 mgC mg−1). The average concentration of TOC under the high-TSS-load conditions was significantly lower than it was under the base-TSS-load condition (Welch’s t-test, p ≤ 0.05). The average 137Cs concentration under the high-TSS-load condition was also lower than it under the base-TSS-load conditions; however, due to its large variation, no significant difference was observed in 137Cs between the base- and high-TSS-load conditions (Welch’s t-test, p > 0.05).

3.5. Estimation of TSS Sources under Both Base- and High-TSS-Load Levels

The contributions of potential TSS sources to bulk TSS, both under the base- and high-TSS-load conditions were estimated by SIAR. The average relative mean errors obtained were 3.0% and 0.1% for the base- and high-TSS-load conditions, respectively. Since the reliability of the simulation can be estimated if the average relative error is less than 15% [30,35], it was confirmed that our simulation reliably estimated the relative contribution of each of the four potential sources of bulk SS.
Table 3 shows the relative contributions of TSS sources to bulk TSS under both base- and high-SS-load conditions based on the simulation by SIAR. Under the base-SS-load condition, forest soils showed the highest relative contribution among the potential TSS sources, whereas other sources hosed much lower, albeit similar, contributions. Although forest soils also showed the highest relative contribution under the high-TSS-load conditions, the contribution decreased to 48% from about 70% under base-TSS-load conditions. On the other hand, the relative contributions of the riverbank soils and river sediments were increased to about 30% and 20%, respectively.

4. Discussion

4.1. Characterization of Increases in TSS Concentration Due to High-Flow Events and Their Effect on TSS in the Study Area

It was clearly shown that both the particulate 137Cs and POC contents increased significantly with an increase in TSS concentration (Figure 3a,b), indicating that additional TSS materials also contained 137Cs and organic C. These additional contributions led to larger particulate 137Cs and POC fluxes under high-flow conditions compared to those under base−flow conditions [28,36]. On the other hand, 137Cs, TOC, and δ13C in SS were relatively high at low SS levels, including under base-SS-load levels, indicating that there were differences in the compositions of the materials forming the bulk TSS under different river conditions.
A reduction in TOC and δ13C values in SS from high-flow rivers has been reported in previous studies on the fluvial transportation of POC [22,26,37,38,39,40]. One possible reason for the higher TOC concentration in SS under base-flow conditions observed in this study may be the lower specific gravity of organic-rich materials compared to mineral materials, as the former would remain in suspension for a longer period of time [40]. In addition, Zhang et al. [38] observed a similar change in POC concentration and suggested that the predominant source changed from aquatic organic matter to mineral materials from terrestrial sources during high-flow seasons. Accelerated input of mineral-rich materials from terrestrial sources and resuspension of river sediments during high-flow events can lead to a reduction in POC concentrations [38]. Therefore, it appears that the concentration of organic matter in TSS was high under base-flow conditions and that was diluted by the addition of mineral-rich materials during high-flow events in this study.
Riverbank soil and river sediments in the study area showed slightly or markedly lower TOC concentrations than the TSS under base-TSS-load conditions, even though samples were collected from the surface layer at each point (c.a. 0–2 or 0–5 cm interval). The TOC concentration in forest soil was comparable with that under base-TSS-load conditions (Table 2). In general, SOM is concentrated near the surface if the stratigraphic structure of the profile has not been disrupted [19]. Thus, the TOC measurements obtained for the source in this study were likely to be at or near their maximum levels at each sampling point, although riverbank soils and river sediments showed lower TOC concentrations than the SS under base-TSS-load conditions. These low concentrations observed in TOC concentrations imply that the riverbank soils and river sediments can act as dilution materials for TOC concentrations in the TSS in this study. In other words, the contributions of forest soil and forest litter to additional TSS were minor during high-flow events in this study. These results suggest that rainfall events, at least those included in this study, did not significantly affect the inflow of TSS materials into rivers in the forested areas of the headwater regions. However, the input of TSS materials derived from riverbank soil and river sediments was promoted.
The δ13C values in the TSS showed a clear decreasing trend with increasing TSS concentration; the TSS concentration reached a minimum of approximately −29‰ (Figure 3e). These findings indicate that there was a gradual alteration in composition of the organic matter of the bulk TSS as the TSS concentration increased. The minimum δ13C values could be attributed to the direct input of terrestrial C3 plant debris. In a previous study, Bass et al. [39] observed a decrease in the δ13C values (approximately 1‰) of POC under high-flow river conditions compared to base-flow conditions in Australia. They suggested that there was a change in POC sources from deeper soil with enriched δ13C values to surface soil with depleted δ13C values. Conversely, Zhang et al. [38] observed a gradual increase in δ13C values in TSS, from about −26.62 to −23.44, with increasing TSS concentration, and they proposed that this was due to an increase in the contribution of C4 plants during flood events. Qiao et al. [26] also reported an increasing trend between δ13C and water discharge and concluded that this change was due to a shift in the predominant source of POC from aquatic plants to terrestrial SOM. Based on these findings, the trend observed in δ13C values in TSS under high-flow conditions was affected by the balance between the δ13C values of the predominant TSS source under base-flow conditions and those attributed to the TSS that was added during high-flow events. It is, therefore, suggested that decomposed and 13C-enriched organic matter was abundant in the POC under base-flow conditions, while relatively fresh organic matter was input with increasing TSS concentration during high-flow events in this study area. Based on the properties of the organic matter in TSS, it can be concluded that TSS materials added during high-flow events were primarily mineral particles, whereas the additional TSS contained relatively undecomposed organic matter compared to TSS under base-SS-load conditions.
The differences observed in 137Cs concentration of TSS observed under base- and high-TSS-load conditions would appear to support these findings (Figure 3c). The greater contributions of mineral-rich materials with low 137Cs concentration, such as riverbank soil and river sediments, compared to forest soil, could reduce the 137Cs concentration under high-TSS-load conditions. These findings appear to corroborate several previous studies on 137Cs concentrations in TSS [6,36,41]. Ueda et al. [6] reported that the 137Cs concentrations in TSS did not show a significant correlation with the TSS concentration or TSS mass load. Matsunaga et al. [41] also found no clear relationship between the 137Cs concentration in TSS and the average daily precipitation, water discharge, or TSS mass load. On the other hand, Takata et al. [42] observed higher 137Cs concentrations in TSS in the Tone River under a high-discharge regime compared to under low- and middle-discharge regimes. Possible factors for the differences observed in the direction of change in 137Cs concentrations in TSS with increasing TSS concentrations among studies include differences in 137Cs concentrations under base-flow conditions, 137Cs inventories in watersheds, survey period, and the range of TSS concentrations under high-flow conditions. Although further studies are required to better understand the principal mechanisms underlying TSS formation during high-flow events, it is suggested that the site examined in this study is in an environment where low 137Cs concentrations are likely to be input during high-flow events. It can, therefore, be concluded that the risk of increases in the inflow of materials with high 137Cs concentrations during high-flow events is low because the TSS input during high-flow events was dominated by materials with low levels of 137Cs, TOC, and δ13C.

4.2. Changes in the Relative Contributions of Potential SS Sources during Increases in SS Concentrations

As predicted above, forest soil showed the highest SS contributions (about 70%), whereas other sources showed only minor contributions under base-TSS-load conditions (Table 3). These findings indicate that forest soil was the predominant source of TSS under base-flow conditions at this study site. The relatively higher values of 137Cs, TOC and δ13C in TSS under base-SS-load conditions also support this finding. However, several studies have reported lower contributions of forest-derived-TSS materials to the deposited particulate matter, such as 6 ± 10% from Cambisols (as a representative for forest soil) [12], 17 ± 10% [11] in the coastal catchments in Fukushima, and 27 ± 6% in a dam reservoir located in the upstream area of the catchment [13]. One possible factor for the higher relative contribution of TSS from forest soils observed in the present study may be the use of not-time-integrated samples. We collected TSS samples from flowing river water; however, the estimates obtained in these previous studies were conducted based on data obtained from gravitationally deposited and time-integrated sediments. The contributions of forest soil to TSS may have been better highlighted if those studies focused on the collection of TSS from base-flows only, as in this study. Thus, it is suggested that the particulate 137Cs observed under base-flow conditions in this study was derived mainly from forest soils with high 137Cs concentrations. However, the total amount of particulate 137Cs transported was low due to the generally low TSS concentrations in the river waters.
On the other hand, the relative contribution of forest soils decreased to about 48% under high-TSS-load conditions, even though it remained the highest among the potential TSS sources (Table 3). In addition, the contribution of forest litter to TSS loads also decreased to approximately one-tenth of under base-TSS-load conditions. These results indicate that the rainfall events in this study did not have a marked effect on promoting the runoff of TSS materials in the headwaters of streams in forest ecosystems. Meanwhile, significant increases in the relative contributions of both riverbank soils and river sediments to TSS under high-TSS-load conditions were observed (Table 3). Despite the increases in TSS loads during high-flow events, the risk of 137Cs recontaminations of areas downstream is considered to be low because of the low 137Cs concentrations in the majority of the additional TSS materials.

5. Conclusions

Large amounts of radiocesium have been deposited over extensive areas of forest in the headwater regions of central and coastal Fukushima Prefecture, Japan. As a result, there is concern about it being transported downstream and re-contaminating lower-lying areas when high-flow events occur. This study investigated the changes in TSS properties as TSS concentrations increase in river water due to high−flow events. In addition, we also estimated changes in the relative contributions of SS from potential sources during such events. The results showed that 137Cs, TOC, and δ13C in TSS decreased during high-flow events in the study area. These reductions could be attributed to the input of large amounts of mineral particles with low 137Cs and TOC concentrations derived from riverbanks and river sediments under high-flow conditions instead of particles from forest soil with high 137Cs concentrations.
On the other hand, the forest soils were the predominant source of TSS in runoff in the study area, irrespective of river conditions. The relative contributions of forest soils to TSS were sufficiently reduced during high-flow events due to increases in riverbank erosion and resuspension of river sediments. These results show that even if large amounts of TSS are washed out during high-flow events, such events are unlikely to cause serious recontamination of the downstream areas because not all of the TSS will have high 137Cs concentrations. Further research is needed to better clarify the formation process of SS during high-flow events and to assess the simulation results. Further, additional organic tracers, such as δ15N and 14C, or fingerprinting properties (geochemical properties and fallout radionuclides) for TSS would facilitate a better understanding of the complex dynamics underlying the formation of riverine SS and particulate 137Cs during high-flow events.

Supplementary Materials

The following are available online at https://www.mdpi.com/article/10.3390/w13213021/s1, Table S1: The results of measurements for GF/F samples.

Author Contributions

Conceptualization, H.A.; validation, H.A. and K.T.; formal analysis, H.A.; investigation, H.A., K.F. and H.Y.; visualization, H.A. and K.T.; funding, K.T.; writing-original draft, H.A.; writing-review and editing, H.A. and K.T. All authors have read and agreed to the published version of the manuscript.

Funding

This research was partly supported by JSPS KAKENHI Grant-in-Aid for Scientific Research (C) Grant Number 21K12205.

Institutional Review Board Statement

Not applicable.

Informed Consent Statement

Not applicable.

Data Availability Statement

The data presented in this study are shown in the manuscript and supplementary materials.

Acknowledgments

The authors wish to express our appreciation to three anonymous reviewers who helped to improve the manuscript.

Conflicts of Interest

The authors declare no conflict of interest.

References

  1. Nagao, S.; Ochiai, S.; Tomihara, S.; Fukushi, K.; Yamamoto, M. Export of 134Cs and 137Cs in the Fukushima River systems at heavy rains by Typhoon Roke in September 2011. Biogeosciences 2011, 10, 6215–6223. [Google Scholar] [CrossRef] [Green Version]
  2. Nagao, S.; Kanamori, M.; Ochiai, S.; Inoue, M.; Yamamoto, M. Migration behavior of 134Cs and 137Cs in the Niida River water in Fukushima Prefecture, Japan during 2011–2012. J. Radioanal. Nucl. Chem. 2015, 303, 1617–1721. [Google Scholar] [CrossRef]
  3. Tsuji, H.; Ishii, Y.; Shin, M.; Taniguchi, K.; Arai, H.; Kurihara, M.; Yasutaka, T.; Kuramaoto, T.; Nakanishi, T.; Lee, S.; et al. Factors controlling dissolved 137Cs concentrations in east Japanese Rivers. Sci. Total Environ. 2019, 697, 134093. [Google Scholar] [CrossRef] [PubMed]
  4. Taniguchi, K.; Onda, Y.; Smith, H.G.; Blake, W.; Yoshimura, K.; Yamashiki, Y.; Kuramaoto, T.; Saito, K. Transport and Redistribution of Radiocesium in Fukushima Fallout through Rivers. Envrion. Sci. Technol. 2019, 53, 12339–12347. [Google Scholar] [CrossRef] [PubMed] [Green Version]
  5. Yamashiki, K.; Onda, Y.; Smith, H.G.; Blake, W.H.; Wakahara, T.; Igarashi, Y.; Matsuura, Y.; Yoshimura, K. Initial flux of sediment-associated radiocesium to the ocean from the largest river impacted by Fukushima Daiichi Nuclear Power Plant. Sci. Rep. 2014, 4, 3714. [Google Scholar] [CrossRef] [PubMed] [Green Version]
  6. Ueda, S.; Hasegawa, H.; Kikuchi, H.; Akata, N.; Ohtsuka, Y.; Hisamatsu, S. Fluvial discharges of radiocaesium from water sheds contaminated by the Fukushima Dai-ichi Nuclear Power Plant accident, Japan. J. Envrion. Radioact. 2013, 118, 96–104. [Google Scholar] [CrossRef]
  7. Matsunaga, T.; Amano, H.; Yanase, N. Discharge of dissolved and particulate 137Cs in the Kuji River, Japan. Appl. Geochem. 1991, 6, 159–167. [Google Scholar] [CrossRef]
  8. Hashimoto, S.; Ugawa, S.; Nanko, K.; Shichi, K. The total amounts of radioactively contaminated materials in forest in Fukushima, Japan. Sci. Rep. 2012, 2, 416. [Google Scholar] [CrossRef] [Green Version]
  9. Nakanishi, T.; Matsunaga, T.; Koarashi, J.; Atarashi-Andoh, M. 137Cs vertical migration in a deciduous forest soil following the Fukushima Dai-ichi Nuclear Power Plant accident. J. Envrion. Radioact. 2014, 128, 9–14. [Google Scholar] [CrossRef]
  10. Muto, K.; Atarashi-Andoh, M.; Matsunaga, T.; Koarashi, J. Characterizing vertical migration of 137Cs in organic layer and mineral soil in Japanese forests: Four-year observation and model analysis. J. Envrion. Radioact. 2019, 208–209, 106040. [Google Scholar] [CrossRef] [PubMed]
  11. Laceby, J.P.; Huon, S.; Onda, Y.; Vaury, V.; Evrard, O. Do forests represent a long-term source of contaminated particulate matter in the Fukushima Prefecture? J. Envrion. Radioact. 2016, 183, 742–753. [Google Scholar] [CrossRef] [Green Version]
  12. Lepage, H.; Laceby, J.P.; Bonté, P.; Joron, J.-L.; Onda, Y.; Lefèvre, I.; Ayrault, S.; Evrard, O. Investigating the source of radiocesium contaminated sediments in two Fukushima coastal catchments with sediment tracing techniques. Anthropocene 2016, 13, 57–68. [Google Scholar] [CrossRef]
  13. Huon, S.; Hayashi, S.; Laceby, J.P.; Tsuji, H.; Onda, Y.; Evrard, O. Source dynamics of radiocesium-contaminated particulate matter deposited in an agricultural water reservoir after the Fukushima nuclear accident. Sci. Total Environ. 2018, 612, 1079–1090. [Google Scholar] [CrossRef] [Green Version]
  14. Evrard, O.; Durand, R.; Nakao, A.; Laceby, J.P.; Lefèvre, I.; Wakiyama, Y.; Hayashi, S.; Asanuma-Brice, C.; Cerdan, O. Impact of the 2019 typhoons on sediment source contributions and radiocesium concentrations in rivers draining the Fukushima radioactive plume, Japan. C. R. Geosci. 2020, 352, 199–211. [Google Scholar] [CrossRef]
  15. Olley, J.; Brooks, A.; Spencer, J.; Pietsch, T.; Borombovits, D. Subsoil erosion dominates the supply of fine sediment to rivers draining into Princess Charlotte Bay, Australia. J. Envrion. Radioact. 2013, 124, 121–129. [Google Scholar] [CrossRef] [PubMed]
  16. O’Leary, M.H. Environmental effects on carbon isotope fractionation in terrestrial plants. In Stable Isotopes in the Biosphere; Wada, E., Yoneyama, T., Minagawa, M., Ando, T., Fry, B.D., Eds.; Kyoto University Press: Kyoto, Japan, 1995; pp. 78–91. [Google Scholar]
  17. Finlay, J.C.; Kendall, C. Stable isotope tracing of temporal and spatial variability in organic matter sources to freshwater ecosystems. In Stable Isotopes in Ecology and Environmental Science, 2nd ed.; Michener, R., Lajtha, K., Eds.; Blackwell Publishing Ltd.: Oxford, U.K, 2007; pp. 283–333. [Google Scholar]
  18. Nadelhoffer, K.J.; Fry, B. Controls on natural nitrogen-15 and carbon-13 abundances in forest soil organic matter. Soil Sci. Soc. Am. J. 1988, 52, 1633–1640. [Google Scholar] [CrossRef]
  19. Arai, H.; Tokuchi, N. Factors contributing to greater soil organic carbon accumulation after afforestation in a Japanese coniferous plantation as determined by stable and radioactive isotopes. Geoderma 2010, 157, 243–251. [Google Scholar] [CrossRef]
  20. Desjardins, T.; Filho, C.; Mariotti, A.; Chauvel, A.; Girardin, C. Changes of the forest-savanna boundary in Brazilian Amazonia during the Holocene revealed by stable isotope ratios of soil organic carbon. Oecologia 1996, 108, 749–756. [Google Scholar] [CrossRef] [PubMed]
  21. Bellanger, B.; Huon, S.; Velasquez, F.; Vallès, V.; Girardin, C.; Mariotti, A. Monitoring soil organic carbon erosion with δ13C and δ15N on experimental field plots in the Venezuelan Andes. Catena 2004, 58, 125–150. [Google Scholar] [CrossRef]
  22. Hoffman, J.C.; Bronk, D.A. Interannual variation in stable carbon and nitrogen isotope biogeochemistry of the Mattaponi River, Virginia. Limnol. Oceanogr. 2006, 51, 2319–2332. [Google Scholar] [CrossRef]
  23. Fox, J.F.; Papanicolaou, A.N. The Use of Carbon and Nitrogen Isotopes to Study Watershed Erosion Processes. J. Am. Water Resour. Assoc. 2007, 43, 1047–1064. [Google Scholar] [CrossRef]
  24. Liu, K.-K.; Kao, S.-J.; Wen, L.-S.; Chen, K.-L. Carbon and nitrogen isotopic compositions of particulate organic matter and biogeochemical processes in the eutrophic Danshuei Estuary in Northern Taiwan. Sci. Total Environ. 2007, 382, 103–120. [Google Scholar] [CrossRef]
  25. Garzon-Garcia, A.; Laceby, J.P.; Olley, J.M.; Bunn, S.E. Differentiating the sources of fine sediment, organic matter and nitrogen in a subtropical Australian catchment. Sci. Total Environ. 2017, 575, 1384–1394. [Google Scholar] [CrossRef] [Green Version]
  26. Qiao, J.; Bao, H.; Huang, D.; Li, D.-W.; Lee, T.-Y.; Huang, J.-C.; Kao, S.-J. Runoff-driven export of terrigenous particulate organic matter from a small mountainous river: Sources, fluxes and comparisons among different rivers. Biogeochemistry 2020, 147, 71–86. [Google Scholar] [CrossRef]
  27. Fukushima Prefecture; Summary Report (2013–2017) Cooperation between Fukushima Prefecture and the IAEA 2018 [Fukushima Prefecture Initiative Projects]; (Temporary Translation). Available online: https://www.pref.fukushima.lg.jp/uploaded/attachment/299148.pdf (accessed on 8 June 2020).
  28. Tsuji, H.; Kondo, Y.; Suzuki, Y.; Yasutaka, T. Development of a method for rapid and simultaneous monitoring of particulate and dissolved radiocesium in water with nonwoven fabric cartridge filters. J. Radioanal. Nucl. Chem. 2014, 299, 139–147. [Google Scholar] [CrossRef]
  29. Miura, H.; Kurihara, Y.; Sakaguchi, A.; Tanaka, K.; Yamaguchi, N.; Higaki, S.; Takahashi, Y. Discovery of radiocesium-bearing microparticles in river water and their influence on the solid-water distribution coefficient (Kd) of radiocesium in the Kuchibuto River in Fukushima. Geochem. J. 2018, 52, 145–154. [Google Scholar] [CrossRef] [Green Version]
  30. Parnell, A.C.; Inger, R.; Bearhop, S.; Jackson, A.L. Source Partitioning Using Stable Isotopes: Coping with Too Much Variation. PLoS ONE 2010, 5, e9672. [Google Scholar] [CrossRef] [PubMed]
  31. Dutton, C.; Anisfeld, S.C.; Ernstberger, H. A novel sediment fingerprinting method using filtration: Application to the Mara River, East Africa. J. Soils Sediments 2013, 13, 1708–1723. [Google Scholar] [CrossRef]
  32. Koiter, A.J.; Lobb, D.A.; Owens, P.N.; Petticrew, E.L.; Tiessen, K.H.D.; Li, S. Investigating the role of connectivity and scale in assessing the sources of sediment in an agricultural watershed in the Canadian prairies using sediment source fingerprinting. J. Soils Sediments 2013, 13, 1676–1691. [Google Scholar] [CrossRef]
  33. Bahadori, M.; Chen, C.; Lewis, S.; Rashti, M.R.; Cook, F.; Parnell, A.; Esfandbod, M.; Boyd, S. A novel approach of combining isotopic and geochemical signatures to differentiate the sources of sediments and particulate nutrients from different land uses. Sci. Total Environ. 2019, 655, 129–140. [Google Scholar] [CrossRef] [Green Version]
  34. R Core Team. R: A Language and Environment for Statistical Computing; R Foundation for Statistical Computing: Vienna, Austria, 2019; Available online: https://www.R-project.org/ (accessed on 16 September 2021).
  35. Collins, A.L.; Walling, D.E.; Sichingabula, H.M.; Leeks, G.J.L. Suspended sediment source fingerprinting in a small tropical catchment and some management implications. Appl. Geogr. 2001, 21, 387–412. [Google Scholar] [CrossRef]
  36. Sakaguchi, A.; Tanaka, K.; Iwatani, H.; Chiga, H.; Fan, Q.; Onda, Y.; Takahashi, Y. Size distribution studies of 137Cs in river water in the Abukuma Riverine system following the Fukushima Dai-ichi Nuclear Power Plant accident. J. Envrion. Radioact. 2015, 139, 379–389. [Google Scholar] [CrossRef] [PubMed]
  37. Gao, Q.; Tao, Z.; Shen, C.; Sun, Y.; Yi, W.; Xing, C. Riverine organic carbon in the Xijiang River (South China): Seasonal variation in the content and flux budget. Environ. Geol. 2002, 41, 826–832. [Google Scholar] [CrossRef]
  38. Zhang, S.; Lu, X.X.; Sun, H.; Han, J.; Higgitt, D.L. Geochemical characteristics and fluxes of organic carbon in a human-disturbed mountainous river (the Luodingjiang River) of the Zhujiang (Pearl River), China. Sci. Total Environ. 2009, 407, 815–825. [Google Scholar] [CrossRef] [PubMed]
  39. Bass, A.M.; Bird, M.I.; Liddell, M.J.; Nelson, P.N. Fluvial dynamics of dissolved and particulate organic carbon during periodic discharge events in a steep tropical rainforest catchment. Limnol. Oceanogr. 2011, 56, 2282–2292. [Google Scholar] [CrossRef]
  40. Schindler Wildhaber, Y.; Liechti, R.; Alewell, C. Organic matter dynamics and stable isotope signature as tracers of the sources of suspended sediment. Biogeosciences 2012, 9, 1985–1996. [Google Scholar] [CrossRef] [Green Version]
  41. Matsunaga, T.; Nakanishi, T.; Atarashi-Andoh, M.; Takeuchi, E.; Muto, K.; Tsuduki, K.; Nishimura, S.; Koarashi, J.; Otosaka, S.; Sato, T.; et al. Year-round variations in the fluvial transport load of particulate 137Cs in a forested catchment affected by the Fukushima Daiichi Nuclear Power Plant accident. J. Radioanal. Nucl. Chem. 2016, 310, 679–693. [Google Scholar] [CrossRef] [Green Version]
  42. Takata, H.; Inatomi, N.; Kudo, N. The contribution of 137Cs export flux from the Tone Rive Japan to the marine environment. Sci. Total Environ. 2020, 701, 134550. [Google Scholar] [CrossRef]
Figure 1. Location of the sampling points in the Hirose River catchment. The white circle indicates the sampling point for river water, sediments, and riverbank soil. The light-green circle indicates the sampling site for forest soil and litter, and the gray circles show the sampling sites for riverbank soil and river sediment.
Water 13 03021 g001
Figure 2. Distribution of TSS concentrations in river water samples under base- (blue) and high-flow (orange) conditions. (a) Raw data; (b) Redefined data based on the median of raw data collected under base-flow conditions.
Water 13 03021 g002
Figure 3. Changes in particulate 137Cs, POC, 137Cs, TOC, and δ13C with increasing TSS concentration. The average value and standard deviation under the base-TSS-load conditions (black squares) and all of the data measured under high-TSS-load conditions (orange circles) are shown. For POC, TOC, and δ13C, measured and estimated values are shown separately for each of the river conditions (gray for estimated and blue and orange for measured values, and squares for the base- and circles for the high-TSS-load conditions). (a) Particulate 137Cs content; (b) POC content; (c) 137Cs concentration; (d) TOC concentration; and (e) δ13C values in TSS. The shaded areas represent the 95% confidence intervals.
Water 13 03021 g003
Table 1. Details of sampling periods used to collect high-flow river samples with high-SS concentrations.
NoStart DateEnd DateTimesPrecipitation *Note
Day/Month/Year
Time
mm
11 September 2017
20:30
2 September 2017
16:30
610.5Typhoon No. 15
(Sanvu)
217 September 2017
11:05
18 September 2017
07:30
624.0Typhoon No. 18
(Talim)
322 October 2017
12:30
23 October 2017
12:30
783.5Typhoon No. 21
(Lan)
49 August 2018
08:45
10 August 2018
08:45
711.0Typhoon No. 13
(Shanshan)
530 September 2018
10:40
1 October 2018
10:40
732.5Typhoon No. 24
(Trami)
612 October 2019
10:30
12 October 2019
18:30
368.0Typhoon No. 19
(Hagibis)
* The sum of precipitation data from the start to end date. All data were obtained from the nearest monitoring station (Yanagawa) by Japan Meteorological Agency.
Table 2. 137Cs and δ13C values for four potential SS sources. Averages are shown with the standard deviations (S.D.) in parentheses.
Type137Csnδ13CnTOCn
Bq kg−1 mgC mg−1
Forest Soils5400 ± 160012−26.9 ± 0.6120.105 ± 0.02112
Forest litters240 ± 15016−30.0 ± 0.5160.468 ± 0.01116
Riverbank soils470 ± 53046−26.4 ± 0.8150.018 ± 0.01515
River sediments110 ± 110175−25.4 ± 0.8210.001 ± 0.00121
p value *<0.001 <0.001 <0.001
* Results of the Kruskal−Wallis H test.
Table 3. Relative contributions of TSS sources (%) to bulk TSS under both the base- and high-SS-load conditions estimated by SIAR. The range indicates the 95% credible interval (CI).
Source TypeBase−SS−LoadHigh−SS−Load
%
Forest soils68–6948–48
Forest Litters3.9–4.60.3–0.3
Riverbank soils2.3–3.131–33
River sediments3.5–4.517–19
Publisher’s Note: MDPI stays neutral with regard to jurisdictional claims in published maps and institutional affiliations.

