
Temperature Effect on Crack Evolution of Red Clay in Guilin

1
College of Civil Engineering and Architecture, Guilin University of Technology, Guilin 541000, China
2
Faculty of Engineering, China University of Geosciences, Wuhan 430000, China
3
Department of Civil Engineering, Lushan College of Guangxi University of Science and Technology, Liuzhou 545005, China
4
Nanning City Investment Group Modern Industrial Park Development Co., Ltd., Nanning 530219, China
*
Authors to whom correspondence should be addressed.
Water 2021, 13(21), 3025; https://doi.org/10.3390/w13213025
Submission received: 21 August 2021
/
Revised: 18 October 2021
/
Accepted: 22 October 2021
/
Published: 28 October 2021
(This article belongs to the Special Issue Water–Rock/Soil Interaction)
Abstract
:As temperature changes, red clay is prone to shrink and generate cracks, which weaken the structure and the stability of soil mass, leading to various engineering problems, such as damage and instability in engineering structures. To study the effect of environmental temperature on the crack evolution of red clay, Guilin Red Clay was taken as the research object, and the saturated mud samples were dried at 23, 40, and 60 °C respectively. During the drying process of the samples, the change of moisture content and the evolution process of surface cracks were monitored by high-definition automatic photographing and a weighing device, which were also improved. We used PCAS software to process the crack image, extract various geometric elements, observe, and analyze the change rule of the cracks during the drying process of red clay at different temperatures. The test results show that the cracking evolution of red clay at different temperatures is mainly divided into three stages: (i) the initiation of micro cracks; (ii) crack progress; and (iii) crack stability. With the increase of environmental temperature, stage (i) took less time. Meanwhile, the growth rate of the crack area increased. The number of final crack blocks of soil is significantly reduced. Moreover, the final crack rate is obviously increased. When the temperature is either 23 °C or 40 °C, the initial cracks almost happen at the same time in the samples with different diameters. While the temperature is higher than 60 °C, the cracking time will delay with the increase of the diameter. In addition, the decrease in water content leads to a decrease in the curvature radius of soil particles. Under the joint action of the surface tension and the matrix suction, the distance between red clay particles becomes shorter, so the time for red clay to start to generate cracks will be shorter, and the final crack rate will increase with the increase in temperature.
1. Introduction
Against the background of global climate change, a large number of scholars have paid attention to the problem of soil drying and cracking caused by an extreme arid climate [1,2]. In 2013, the severe drought in Yunnan Province of China caused the dam of 342 reservoirs to crack seriously, which threatened the safety of residents in the lower reaches of the reservoir during rainstorm and impoundment [3]. Water plays an important role in the three-phase composition of soil mass. The reduction of water would cause shrinkage deformation or cracks of soil mass, weaken the engineering properties, such as compressibility, permeability, and physical and mechanical strength of soil mass, greatly reduce the bearing capacity and the strength performance of soil mass, and cause various engineering geological problems, such as soil collapse, landslide disaster [4,5,6], dam instability [7], soil erosion [8], settlement of buildings [9,10], and impervious barrier function failure [11]. The generation and the evolution of rock and soil fissures make a serious impact on the human living environment, involving many subject areas, such as geology, geotechnical, water conservancy, civil engineering, and environmental engineering [12].
In China, red clay is widely distributed. A large amount of red clay is located in 14 provinces and regions in south of the Yangtze River, north of Hainan, west of Taiwan and Penghu Islands, the Yunnan Guizhou Plateau, and east of Hengduan Mountain [13,14]. The natural water content of red clay is comparatively high with a high void ratio and a high liquid plastic limit, which is easy to produce cracks in the process of water loss shrinkage of red clay, which resulted in serious decrease in soil strength [15]. In recent years, the occurrence of extreme rainfall and drought in South China has become more and more common. The temperature in South China is also high and the temperature during the day and night varies considerably. This makes it is easy to cause cracks in red clay and changes the pores structure in soil significantly. Therefore, the strength of soil is destroyed, which leads to a great increase of potential safety concerns for the project.
Currently, many studies have focused on rock and soil cracks. For example, Yao et al. [16] studied the slope stability by taking account of crack and water permeation in which scenarios with and without cracking were investigated. Song et al. [17] focused on the water exchange rate between crack and clay. The permeation coefficient was derived accordingly. Cai et al. [18] considered the crack as the high hypertonicity for simplification. To this end, the saturated and unsaturated seepage-flow model was established. The dominant seepage-flow was given. He et al. [19] conducted a laboratory test to understand the influence of cracking area rate, cracking length, and width on the water content. Therefore, the behavior of the seepage field distribution and stability was illustrated, which can provide a reference of the seepage field in a compacted clay layer with cracks. Though many researchers have been working on the mechanical performance of clay with cracks, most of methods used are based on manual measurement, which depends highly on the experimental design, leading to uncertainties. Therefore, it is very important to improve the methodology. Abedine et al. [20] measured a crack along a straight line to determine how the cracking frequency, volume, and width varied with the drying time, type of soil, and clay portion. Ringrose-Voase et al. [21] introduced a method for determining the cracks in the soil, which consisted of six half-circles with a diameter of 1 m. This method can be used to estimate the crack length in the unit area. Chen et al. [22] used an image processing technique to analyze the cracking behavior of red clay under the wetting–drying cycle. There was a relationship between the shear strength and fracture density. Tang et al. [23,24] used a similar method to illustrate the pattern of the desiccation fissure. With the development of image processing methods, many works [25,26,27] in literature reported investigations of the influence of soil sample thickness, interface of soils, micro-mechanics, and shrinkage. However, few works considered the light and its incident angle. Therefore, this paper presented an improved experimental configuration with light compensation. With the proposed setup, the error can be effectively reduced. Furthermore, as discussed previously, most of research focused on the mechanical behavior of fissures [23,24]. Moreover, the temperature effect was ignored. Water evaporation is the decisive factor of the fissure. However, the fissure is the result of both water evaporation and temperature. Consequently, in this paper, the influence of temperature was further discussed, which can provide great significance to understanding the mechanisms of fissures.
This paper proposed an improved design for an experimental setup for the fissure test with different temperatures. Image processing was implemented by PCAS software. The progress of a fissure of the red clay was quantified and analyzed. The change of the surface tension between soil grains can lead to the shrinkage-induced cracking. The initial water content was predicted by the polynomial regression, which can provide a guideline for the engineering practice.
2. Experimental Investigation
2.1. Test Materials
The red clay required for this test is taken from a construction site in Lingui District, Guilin city. The soil sample is brownish red and slightly wet, and the soil quality is relatively uniform. According to the codes in China (GB/T50123-1999), the basic physical properties are determined as follows: WL = 69.70%, WP = 44.60%, IP = 23.7, GS = 2.73, and basic property indices are listed in Table 1. Chemical composition of red clay are shown in Table 2.
2.2. Test Instrument
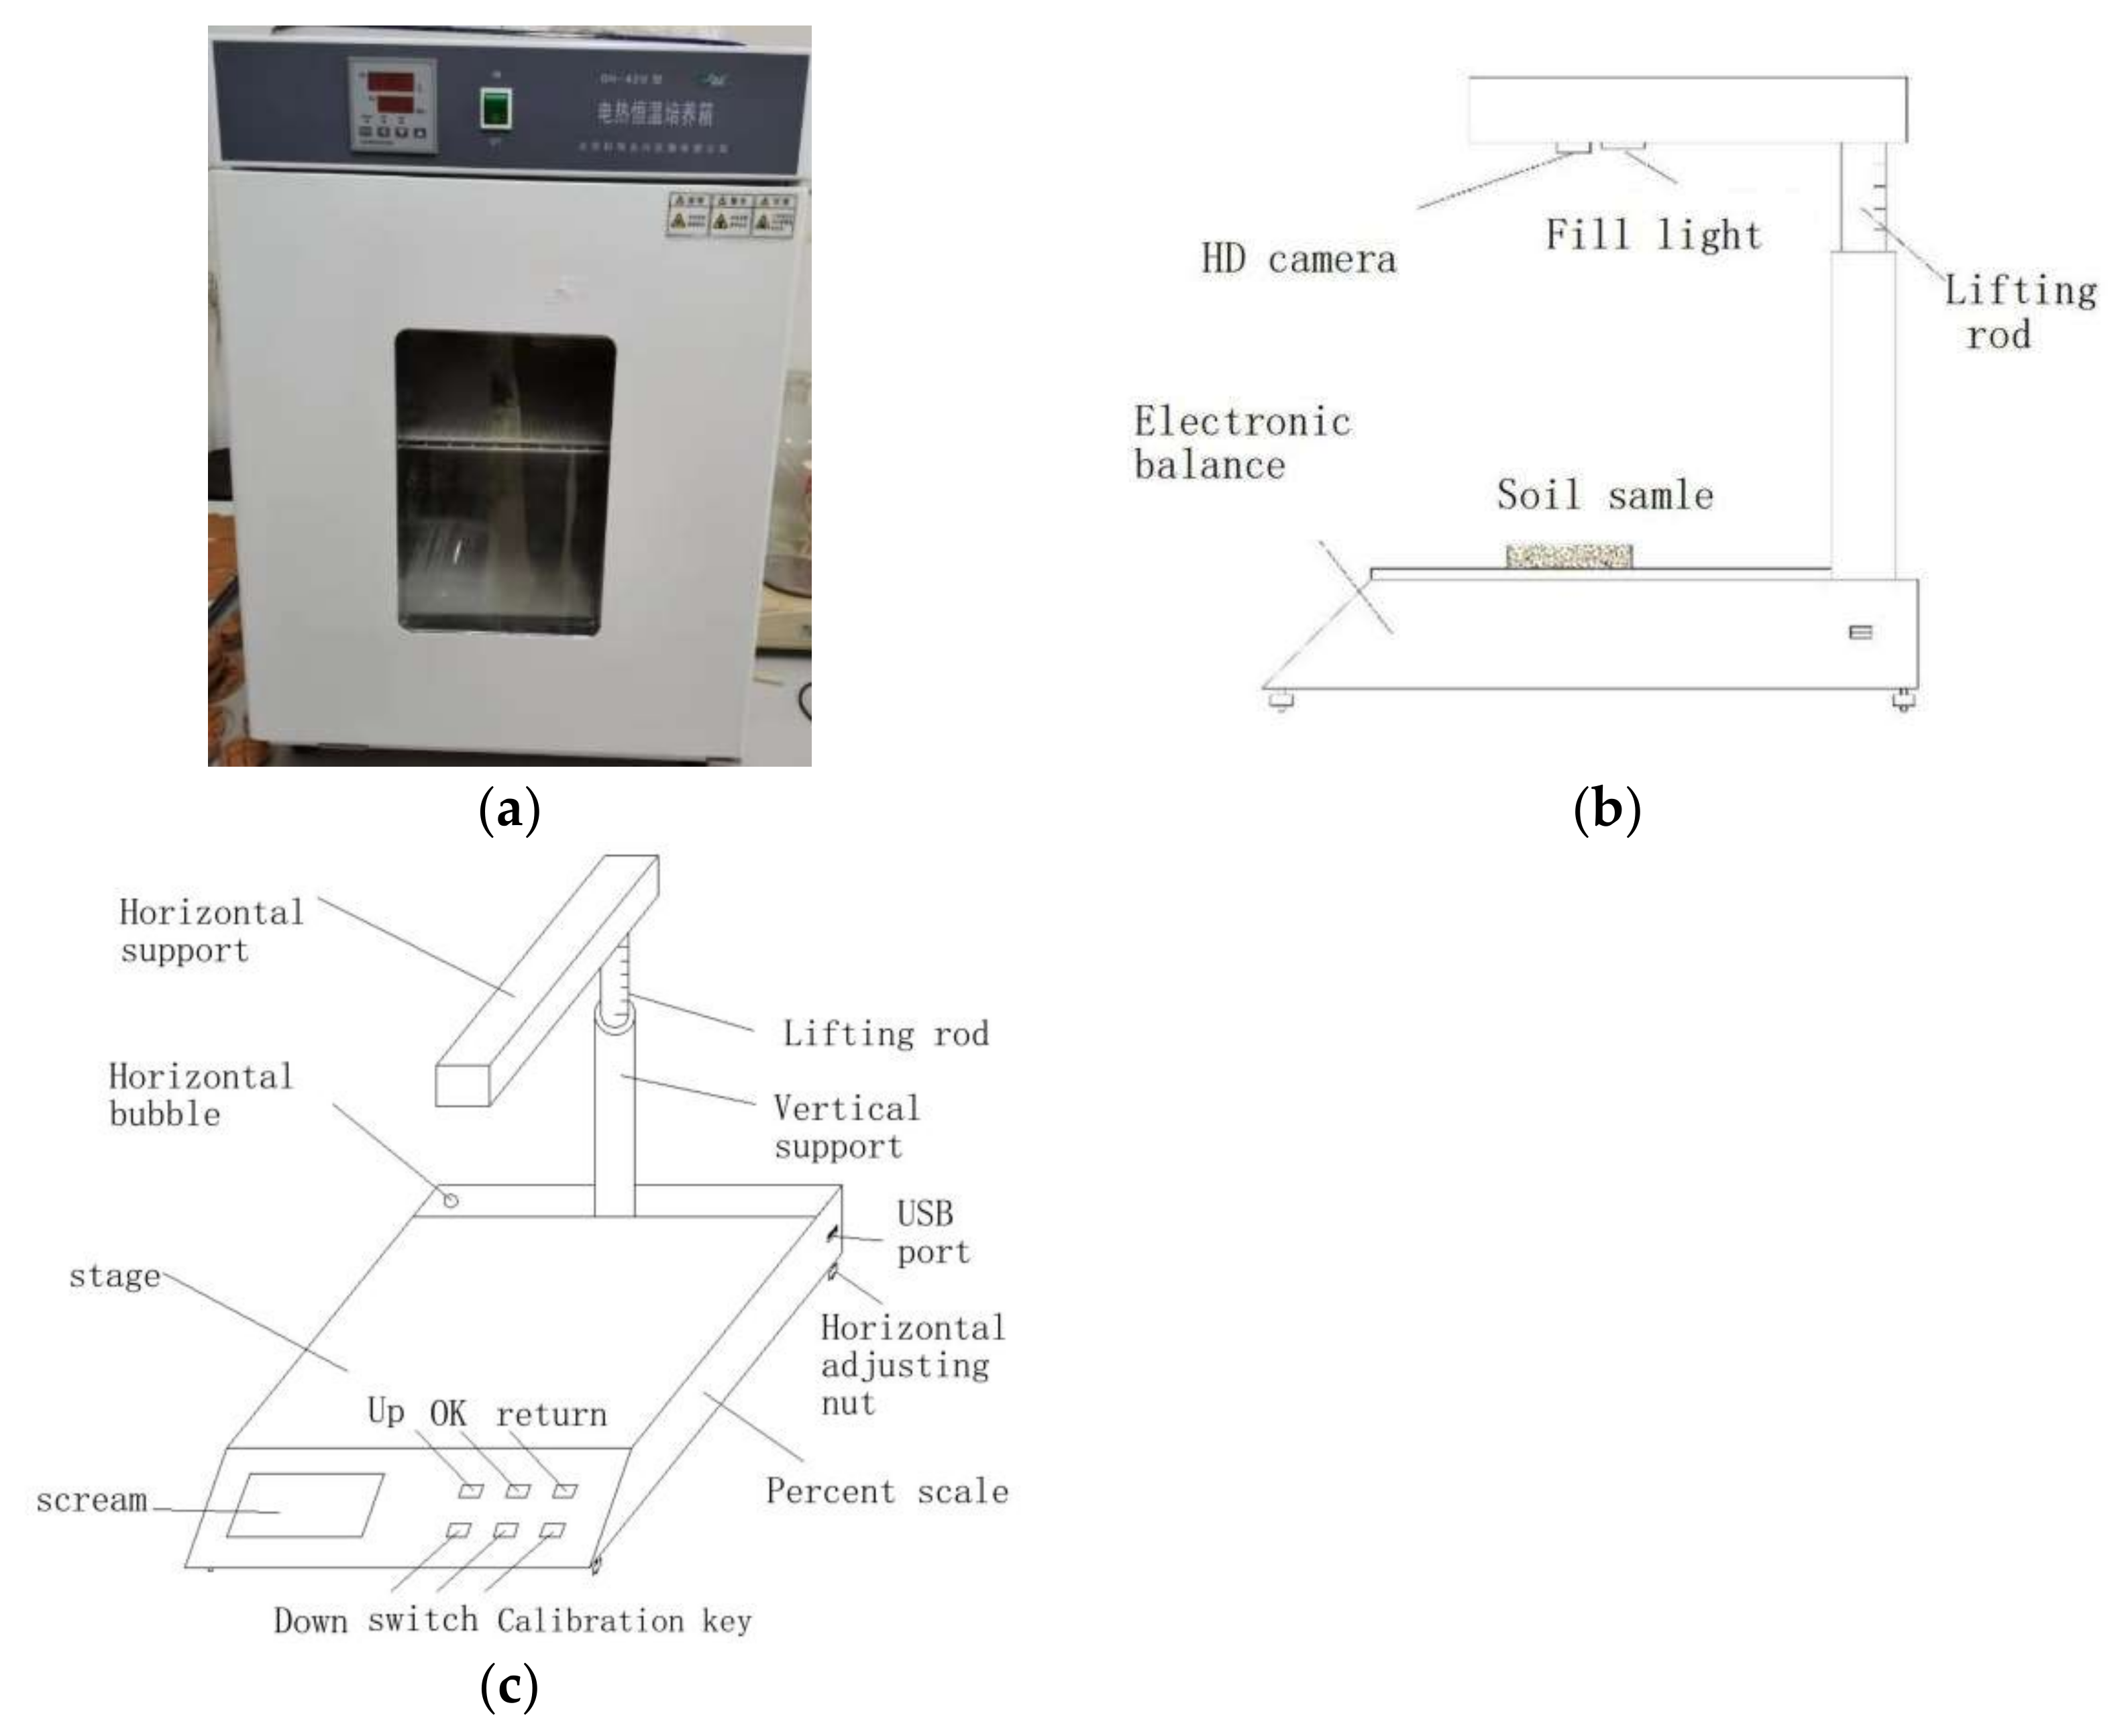
To accurately control the ambient temperature, we use the temperature control test equipment, DH-420 electric thermostatic box. The size of the thermostatic box is 450 mm × 420 mm × 420 mm, the temperature range is +5~+80 °C, the temperature control accuracy is ±0.5 °C, the temperature fluctuation value is ±0.1 °C, and the thermostatic box is shown in Figure 1a.
In this soil, the desiccation fissure plays a very important role in the determination of the strength and stability. Currently, the measurement of fissures is mainly based on the manual method, which is inefficient and susceptible to the environment. Therefore, the testing error is high. In order to improve the manual method, an automated fissure measurement device was designed, see in Figure 1b,c. As long as the sample was placed on the testing plate, the device can take interval photos and measure the fissure automatically.
2.3. Testing Procedure
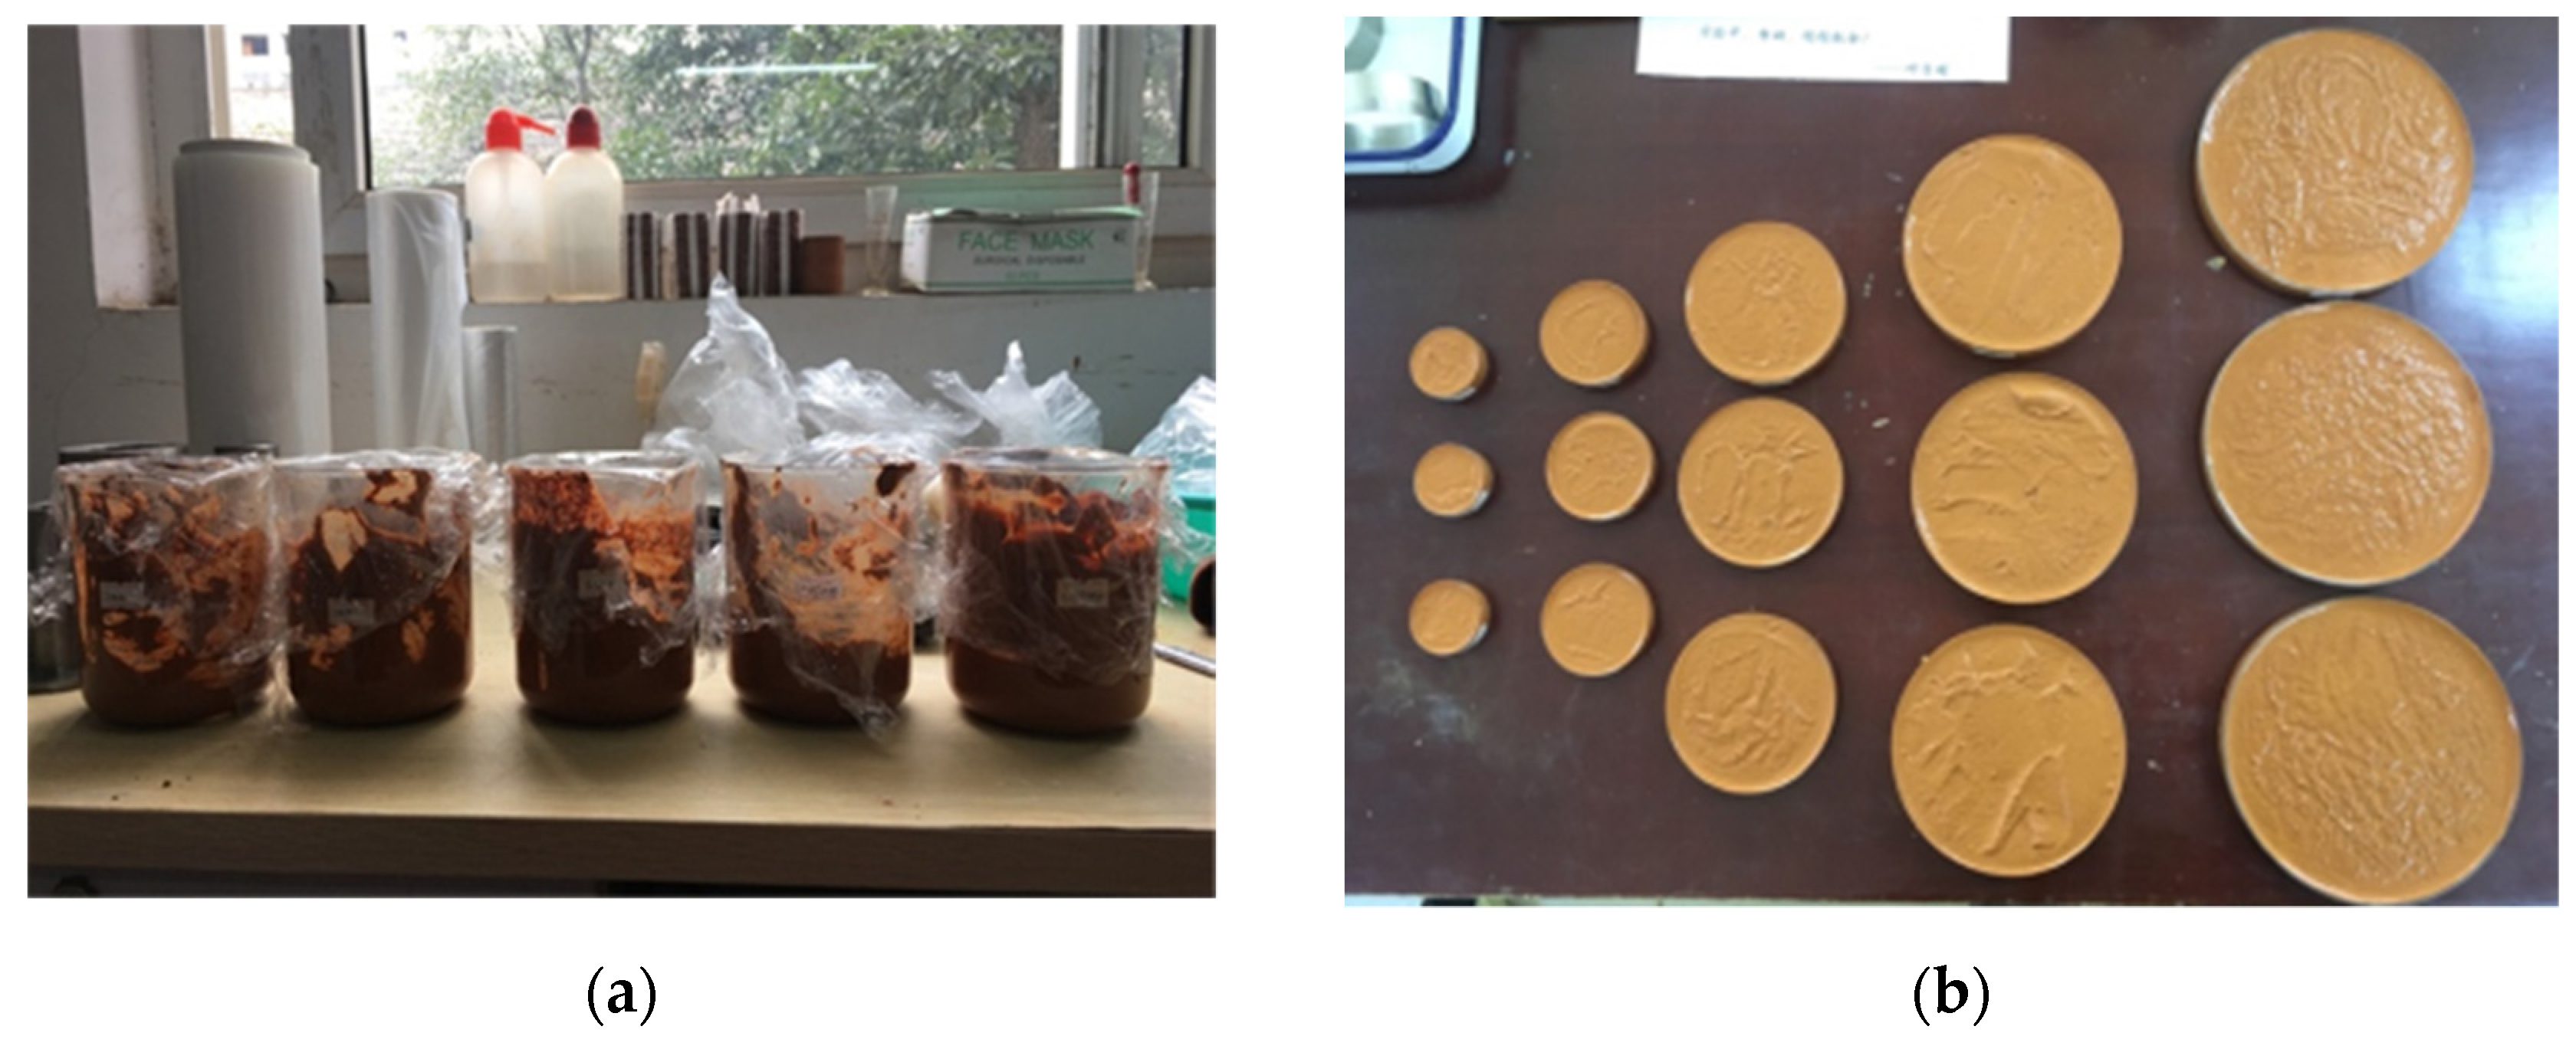
The soil sample under test is dried and crushed and passes through a 1-mm sieve. Distilled water is added and stirred evenly to saturate the red clay slurry sample. Then, the slurry is slowly poured into a circular vessel with a diameter of 90 mm and a height of 10 mm. Three parallel samples in each group (as shown in Figure 2) are put into the incubator for drying, and the samples are photographed and weighed regularly during the water loss period of soil samples. When the initial cracks appear in the soil sample, the frequency of taking photos and weighing the soil sample is increased. If the mass value of the cracked soil sample does not change within 2 h, we can consider that the drying and water loss process of the red clay soil sample has ended, and the development of the cracks in the soil is basically stable. Based on the monitoring of the ground temperature in the hot and humid area of Guilin in the summer, the maximum temperature of the outdoor soil surface is about 60 °C. Therefore, when studying the influence of temperature on the crack evolution of Guilin Red Clay, we set the temperature of the incubator as 23, 40, and 60 °C. Based on the PCAs digital image processing software, the quantitative analysis of crack development parameters of Guilin red clay is carried out to reveal the temperature effect of crack evolution of Guilin red clay. The Granulometric Composition of Red Clay are listed in Table 3. The experimental configuration is shown in Table 4.
3. Crack Image Processing Steps and Analysis
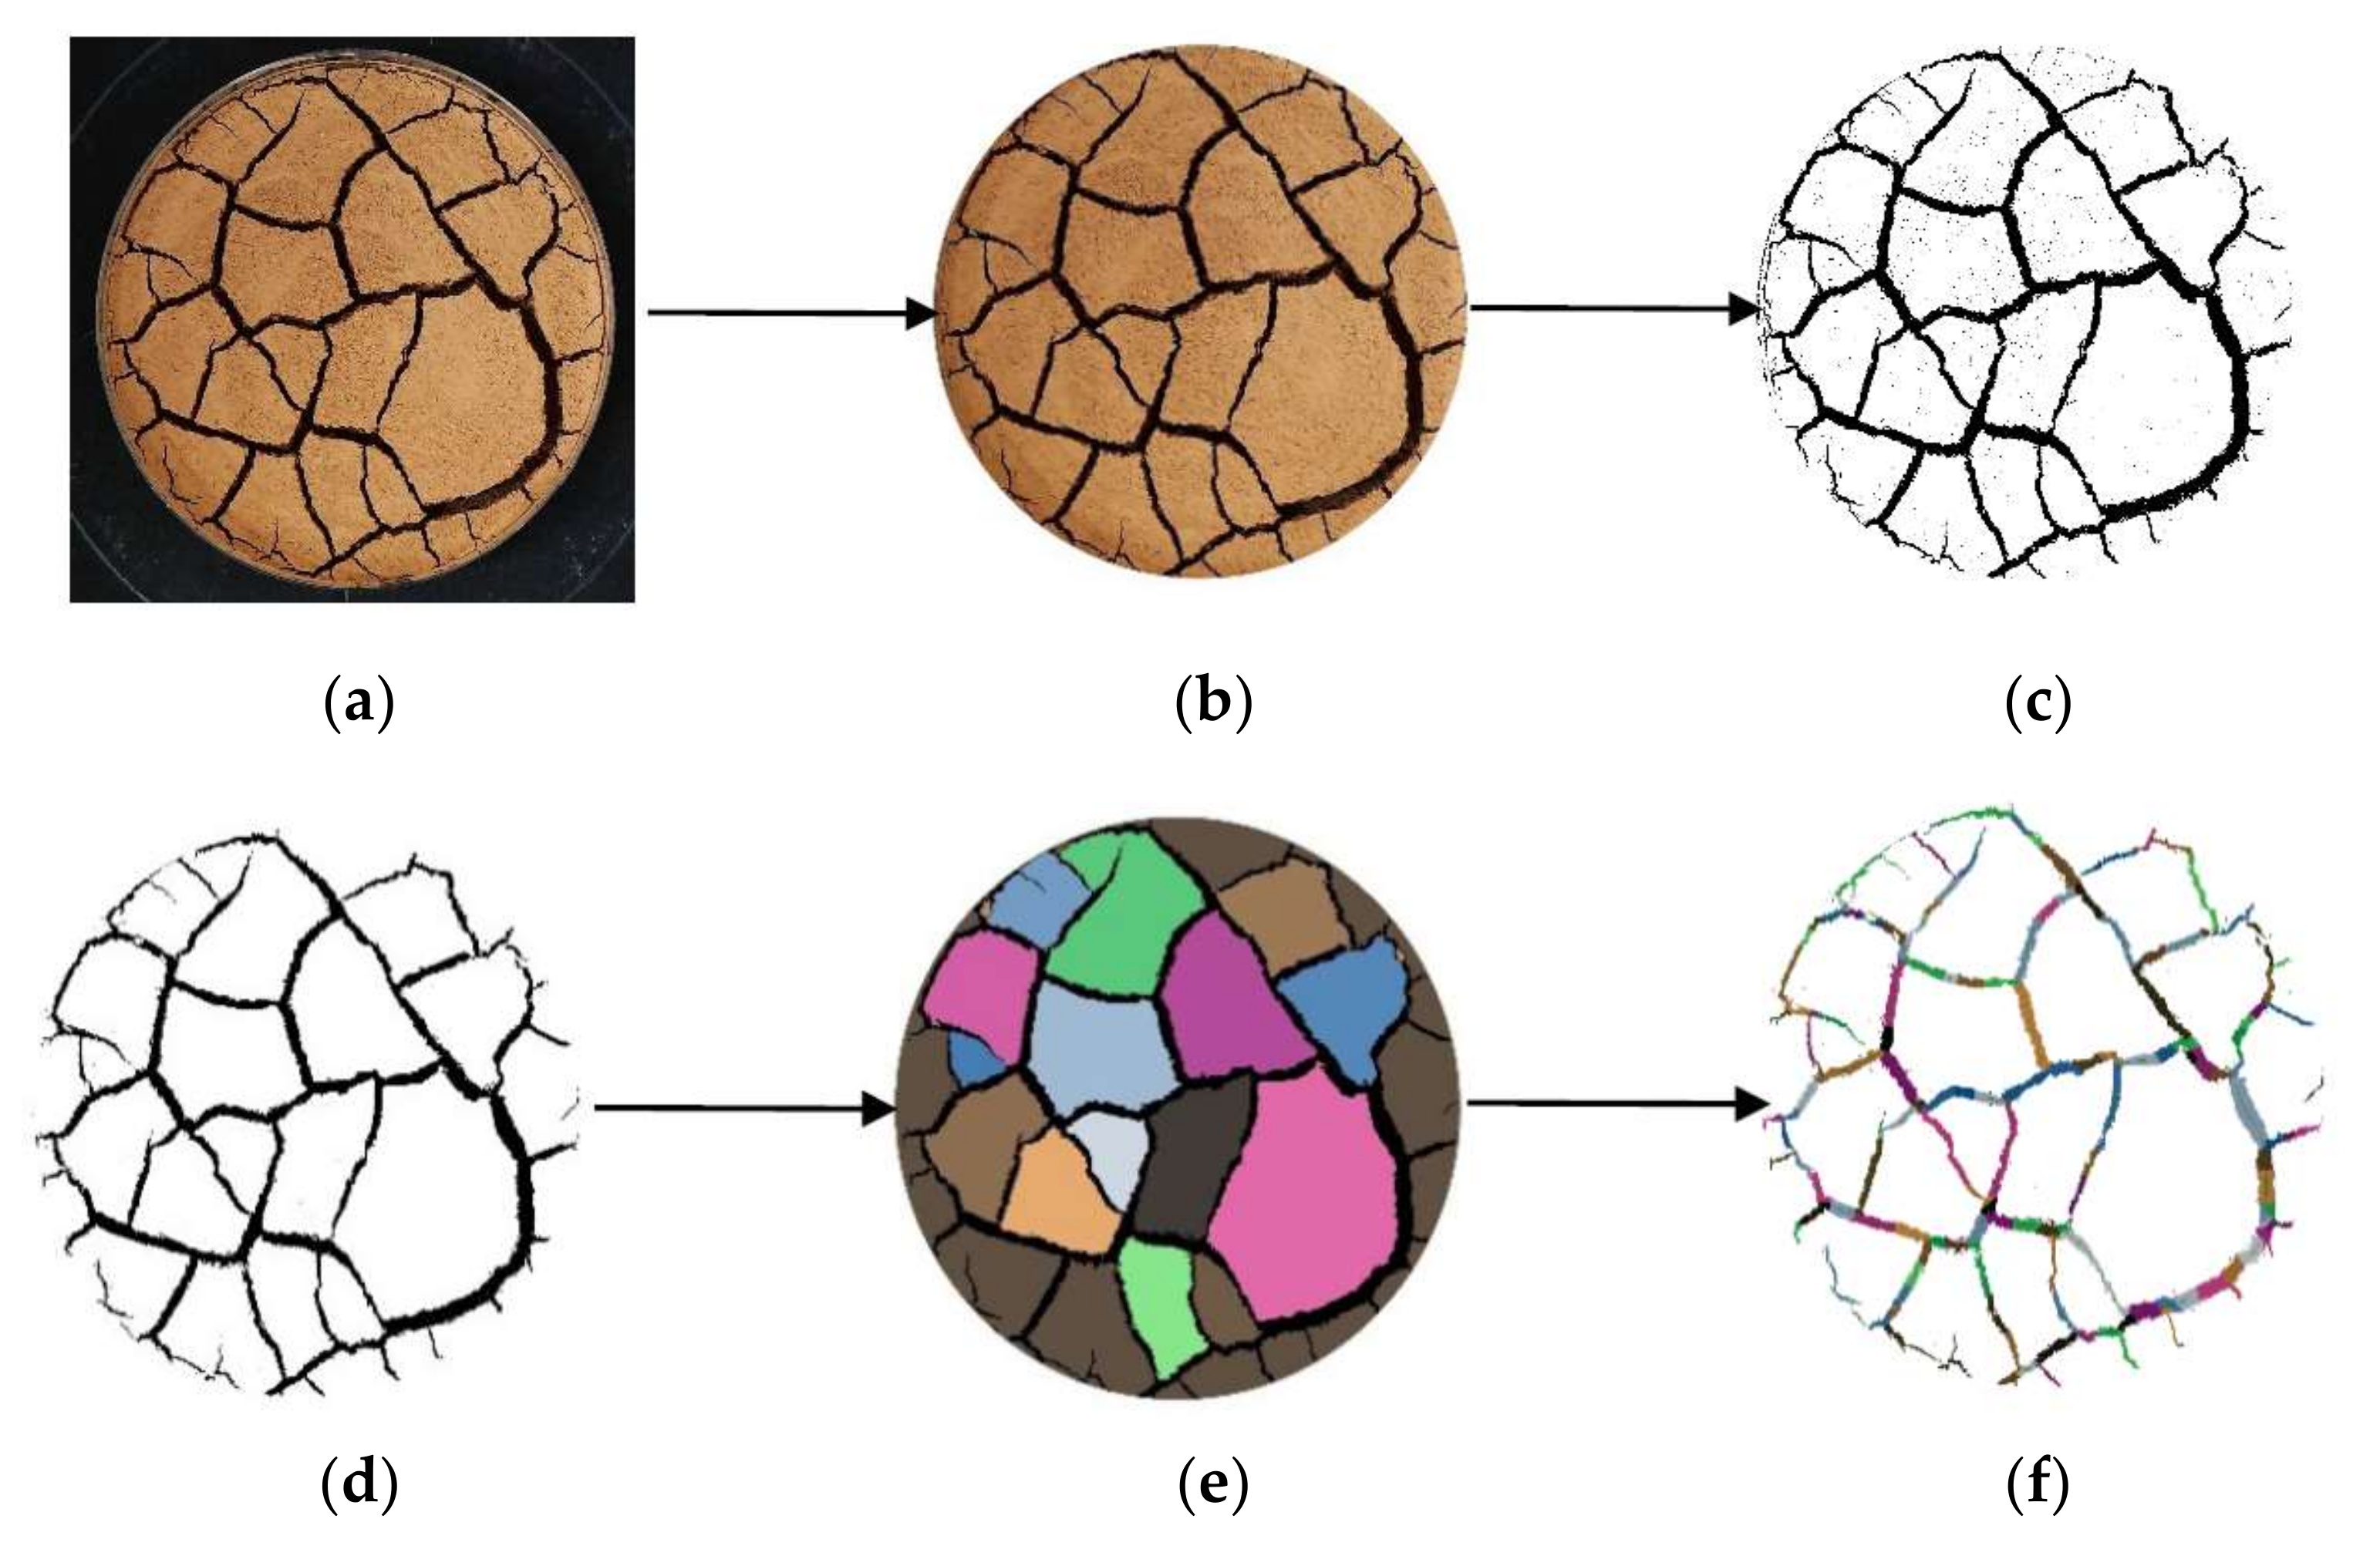
In this paper, PCAs software is used to process and analyze the surface crack image of Guilin red clay. The process of image processing mainly includes: background removal, equal radius, binarization, image clutter removal, crack repair, block recognition, and crack recognition.
After the above treatment of a crack image, the crack network of red clay soil and the geometric parameters of the surrounding block can be obtained quantitatively, such as crack area, block area, surface crack rate, etc (as shown in Figure 3).
4. Water Evaporation Process of Red Clay at Different Temperatures
The size of water content in soil is an important factor affecting the generation of cracks. The water content of the soil sample can be converted through the self-developed automatic weighing and photographing device to weigh the quality of the soil sample regularly, and the calculation method is as follows:
Among them, is the moisture content, is the dry mass of the soil, and is the real-time mass of the soil when weighing.
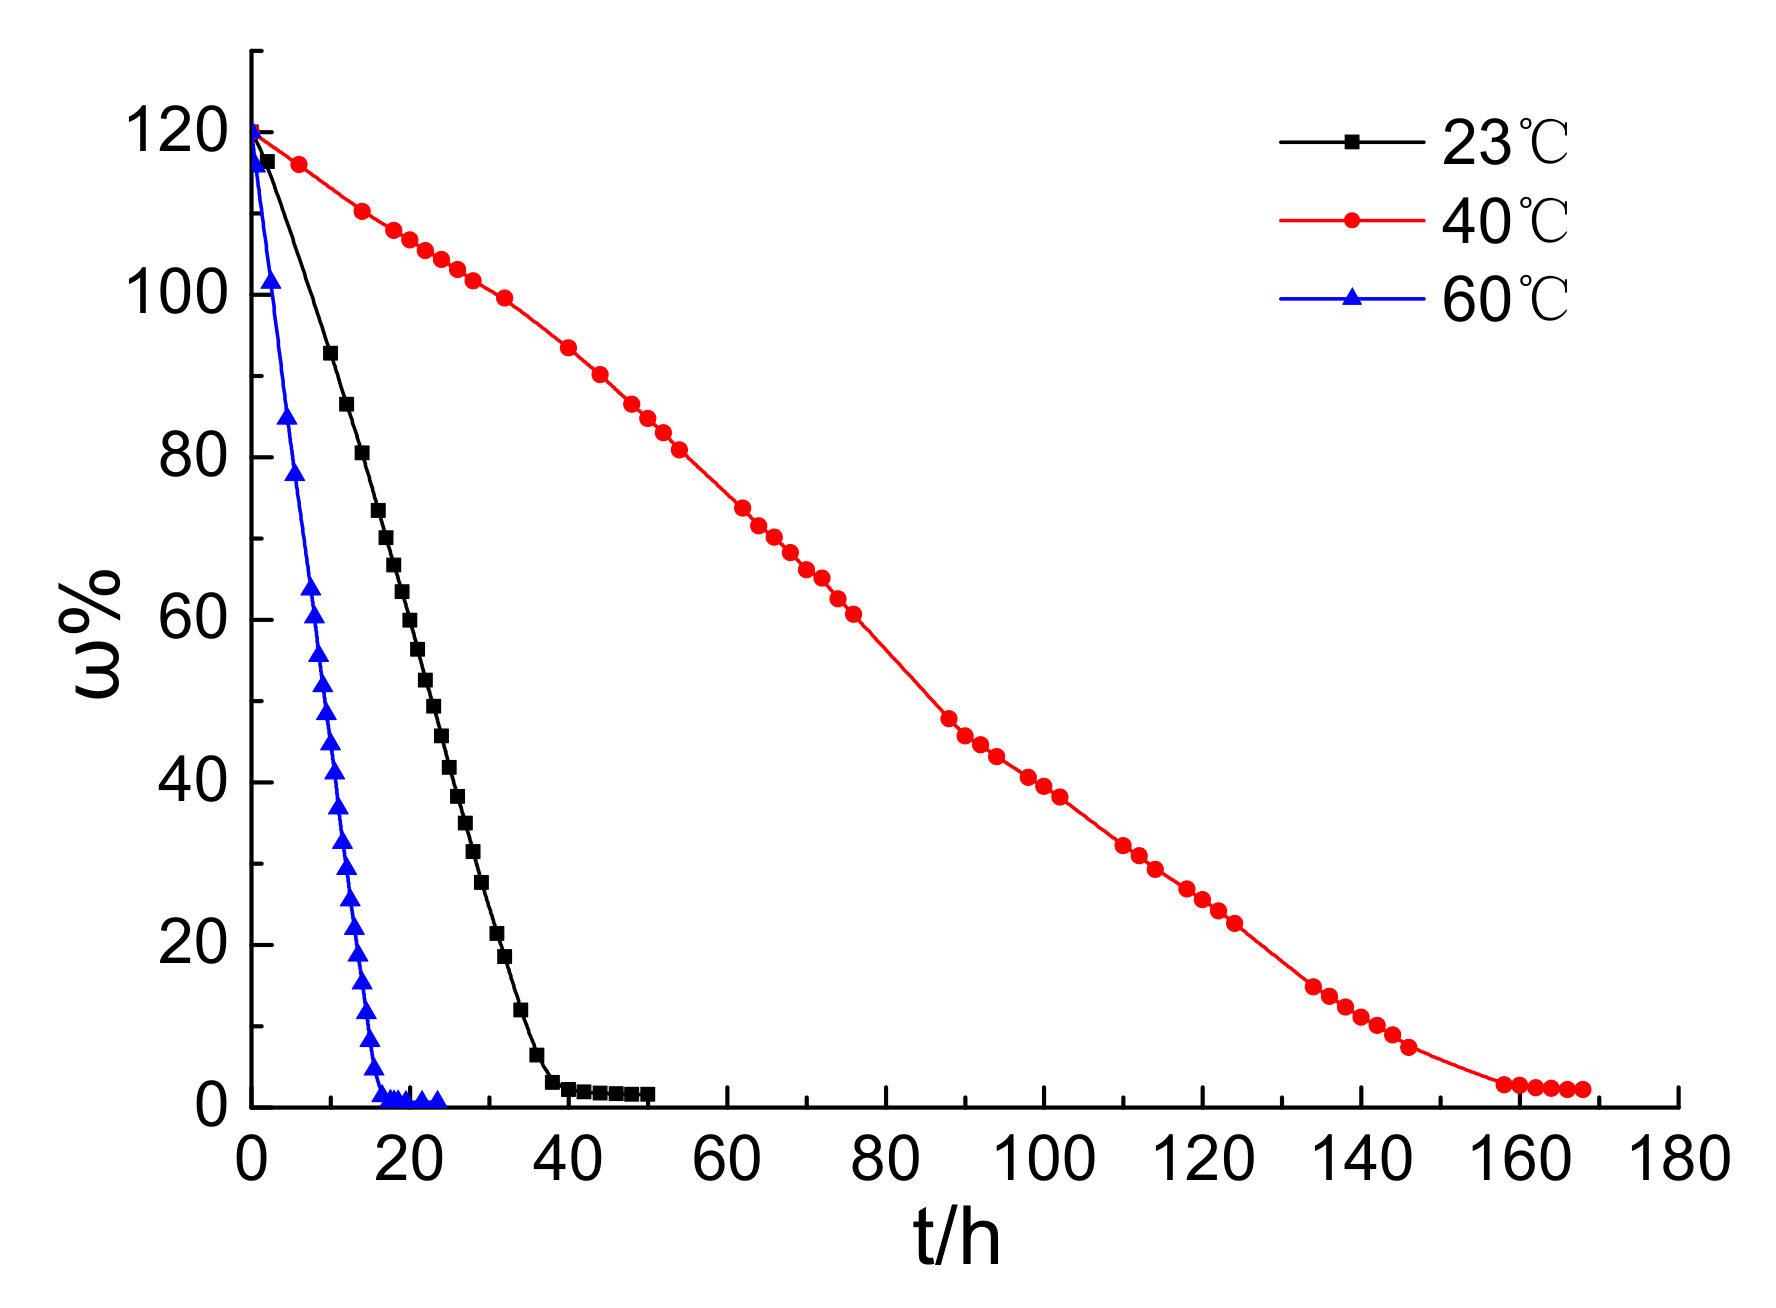
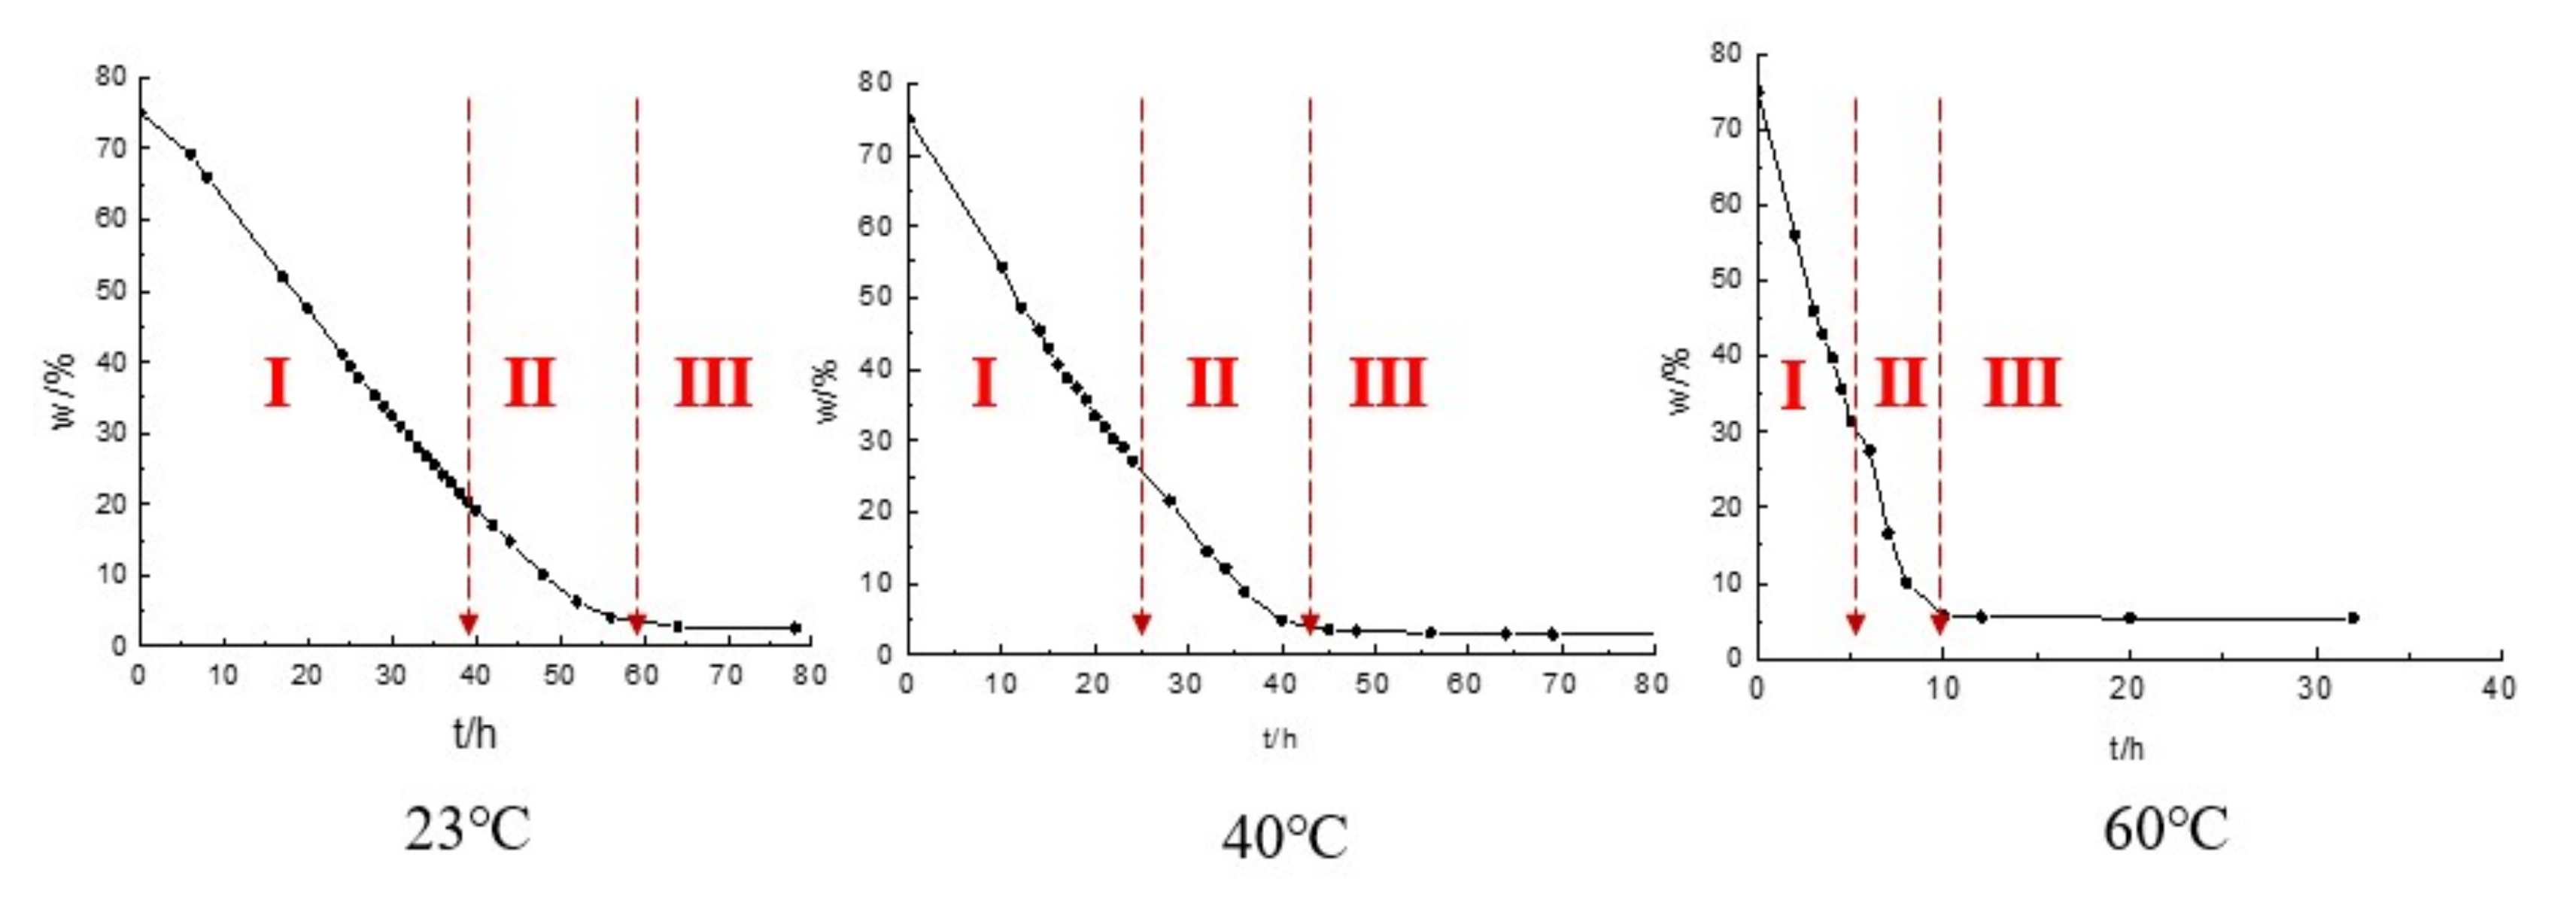
It can be seen from Figure 4 that the water content of red clay mud samples at different temperatures decreases continuously during the evaporation. However, the reduction rate of water content is different and mainly divided into three stages [28,29,30,31]: (I) constant rate stage, (II) variable deceleration rate stage, and (III) residual stability stage. At the constant rate stage, the soil is saturated and wet, and the soil surface is the main evaporation surface. The evaporation rate of water is basically the same as that of the soil surface. The water content of soil decreases linearly with time. In the stage of variable deceleration rate, the soil forms a dry surface layer, the soil cracks are produced, and the evaporation surface of the soil expands. At this stage, the main cause of cracks is the evaporation loss of water in the soil, and the water vapor formed in the evaporation area of the soil diffuses into the air through the dry surface layer. The path of soil moisture reaching to the surface increases, and the movement rate of the water vapor in soil slows down. The evaporation rate decreases with the increase in time. The stable residual stage usually lasts for a long time, but the actual evaporation is small. In the early drying process, the thickness of the dry hard soil layer formed on the upper part of the soil increases slowly, the pore diameter of the dry hard soil layer is small, and the connectivity of the pores is poor. The outward diffusion of water molecules hinders the evaporation of water. At this time, the development of cracks has been basically completed, the soil has reached the dry state, and the water content has basically remained stable. The three-stage diagram of soil moisture evaporation is shown in Figure 5.
The temperature effect of soil moisture evaporation is obvious by comparing the curves of water content and time at different temperatures (23 °C, 40 °C, 60 °C). With the increase in temperature, the constant rate stage (I), variable deceleration rate stage (II), and residual stability stage (III) of soil moisture evaporation are correspondingly shortened, and the evaporation rate of soil becomes larger. The time for the moisture content to reach the residual stability stage of the test is shortened, mainly because the water evaporation is greatly affected by the temperature. When the temperature increases, the water molecules in the soil move faster, the water holding capacity of the soil decreases, and the evaporation rate of the soil increases [32].
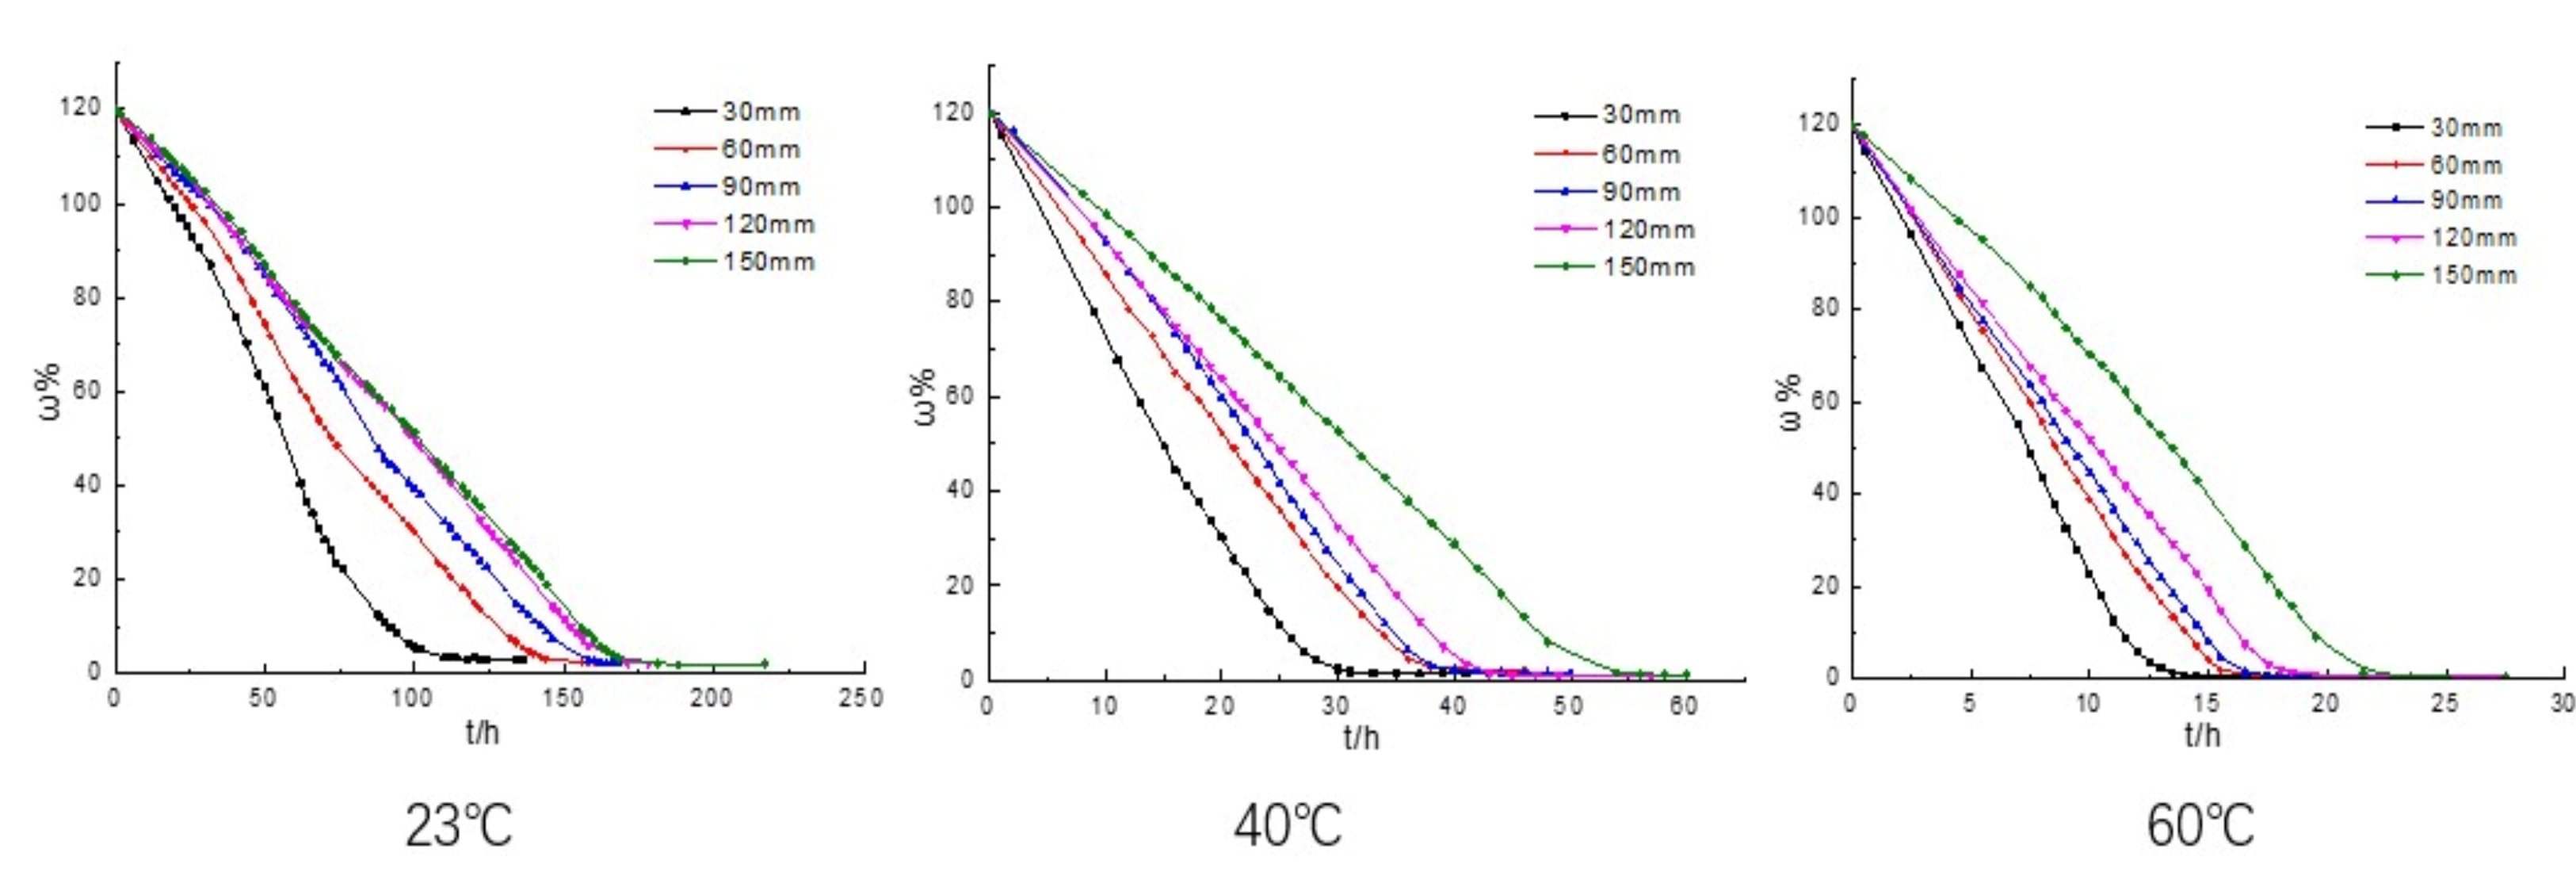
In Figure 6, the higher the temperature is, the shorter the time required for the moisture content to stabilize, while the sample diameter is larger at the same temperature, and the water loss rate is smaller. In addition, the increase in temperature has a certain effect on the water evaporation rate of large samples. When the temperature is small, the change of water content of large-diameter samples is not obvious. Meanwhile, with the increase of temperature, while the sample diameter is larger, and the change of water content is smaller.
5. Development Process and Quantitative Analysis of Cracks at Different Temperatures
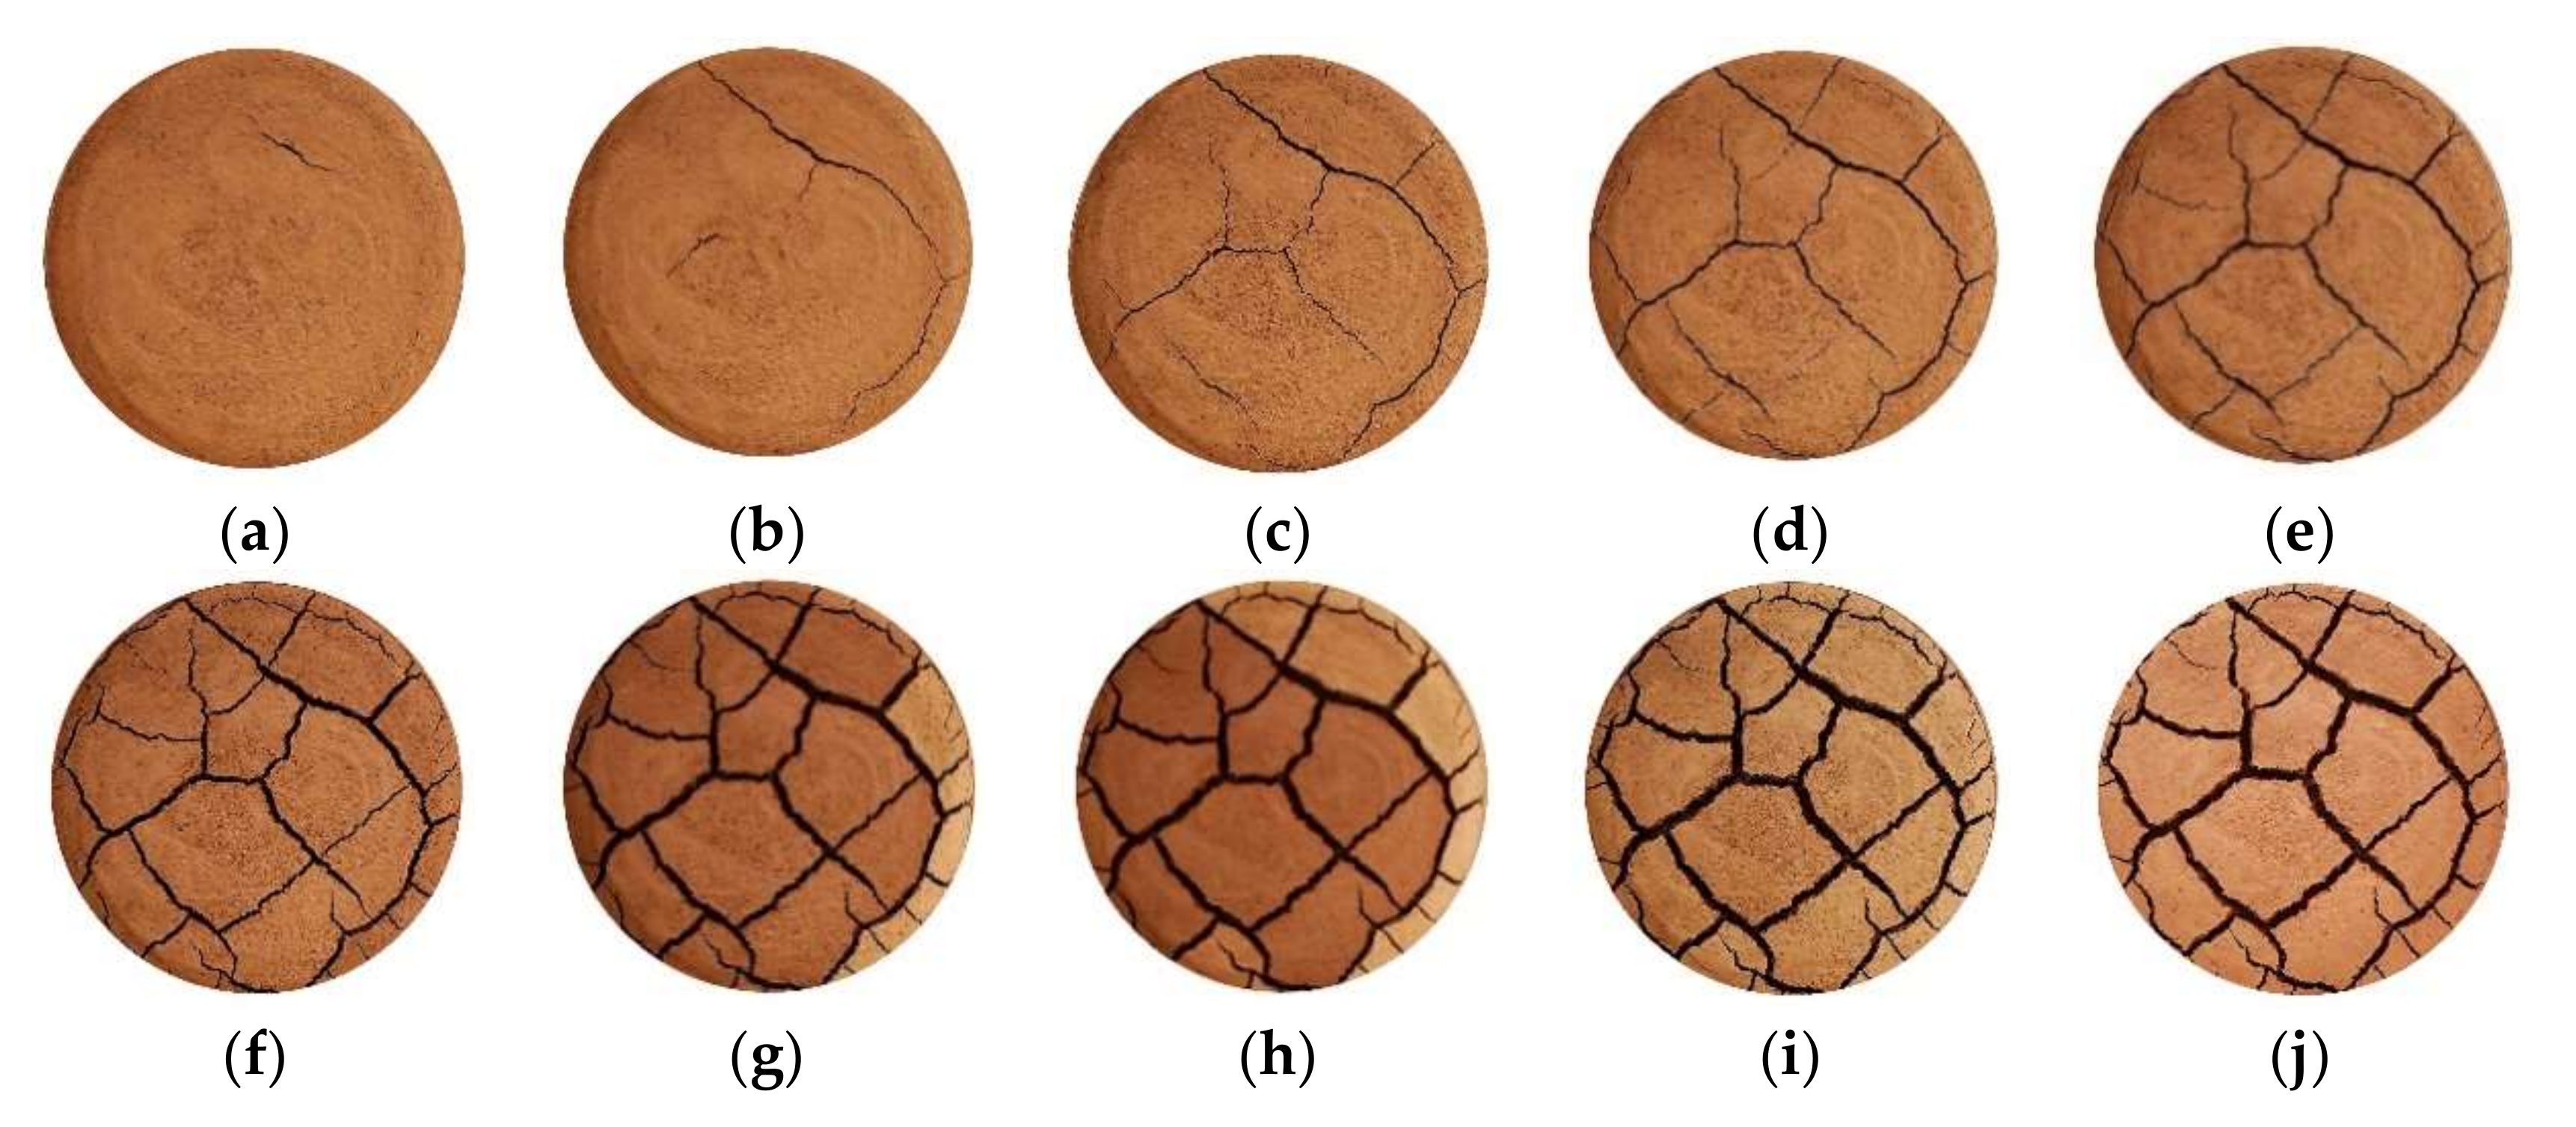
The generation and development of soil fissures will lead to the change of soil engineering properties, which is a very complex process, but generally presents a certain regularity. It is very important to understand the law of crack formation. With photos of red clay soil samples at different temperatures, the crack formation and development process of red clay in the process of water loss presents a certain regularity. Figure 7 shows the crack development diagram of red clay with a diameter of 90 mm and a temperature of 23 °C.
After water loss of 76 h, a micro fissure appears in the soil sample, as shown in Figure 7a. As time goes by, a circular main crack is formed, as shown in Figure 7b. Then, several microcracks extend from the circular crack, and the relative angle between them and the main crack is about 90°, as shown in Figure 7c. With the evaporation of water, due to the reduction of free water, the soil mass surrounded by the circular crack appears radial cracks and gradually penetrates the soil mass, forming a preliminary crack grid, as shown in Figure 7c–f.
With the increase in time, with the gradual stability of the main cracks and micro cracks, the crack network has basically formed, and the red clay soil sample has been cut into several small blocks by the cracks, and the area of each block is different. At the same temperature, the smaller the size of the block, the greater the relative evaporation rate, resulting in a sharp decrease in the moisture content of the small block at the edge. The small block experienced a transition from wet to dry, the color changed from dark to light, and the water loss time of the large block was longer, as shown in Figure 7g–h.
Figure 7f–i mainly indicates the expansion stage of crack width. In the process of drying and water loss of the cracked soil block, the macroscopic performance is that the soil block shrinks, the soil no longer produces new cracks, and the friction between the soil block and the bottom container is mainly rolling friction. The stage shown in Figure 7i–j is mainly the loss of water in the soil body, and the crack rate of the soil body is basically unchanged.
In the process of crack evolution of red clay, a grade I crack is formed first and is the main crack in the crack morphology. The development direction of the class II crack is at right angles to that of the class I crack. The class III cracks are narrow and slender and connect all levels of cracks to form the whole crack. Some of the class III cracks form the crack ends, which are an important feature to distinguish the class III cracks [33].
Based on the quantitative analysis of the crack image taken by PCAs, the surface crack rate of the sample at different times is obtained. The definition of the surface crack rate is as follows.
Among them, is the surface crack area, is the soil sample area.
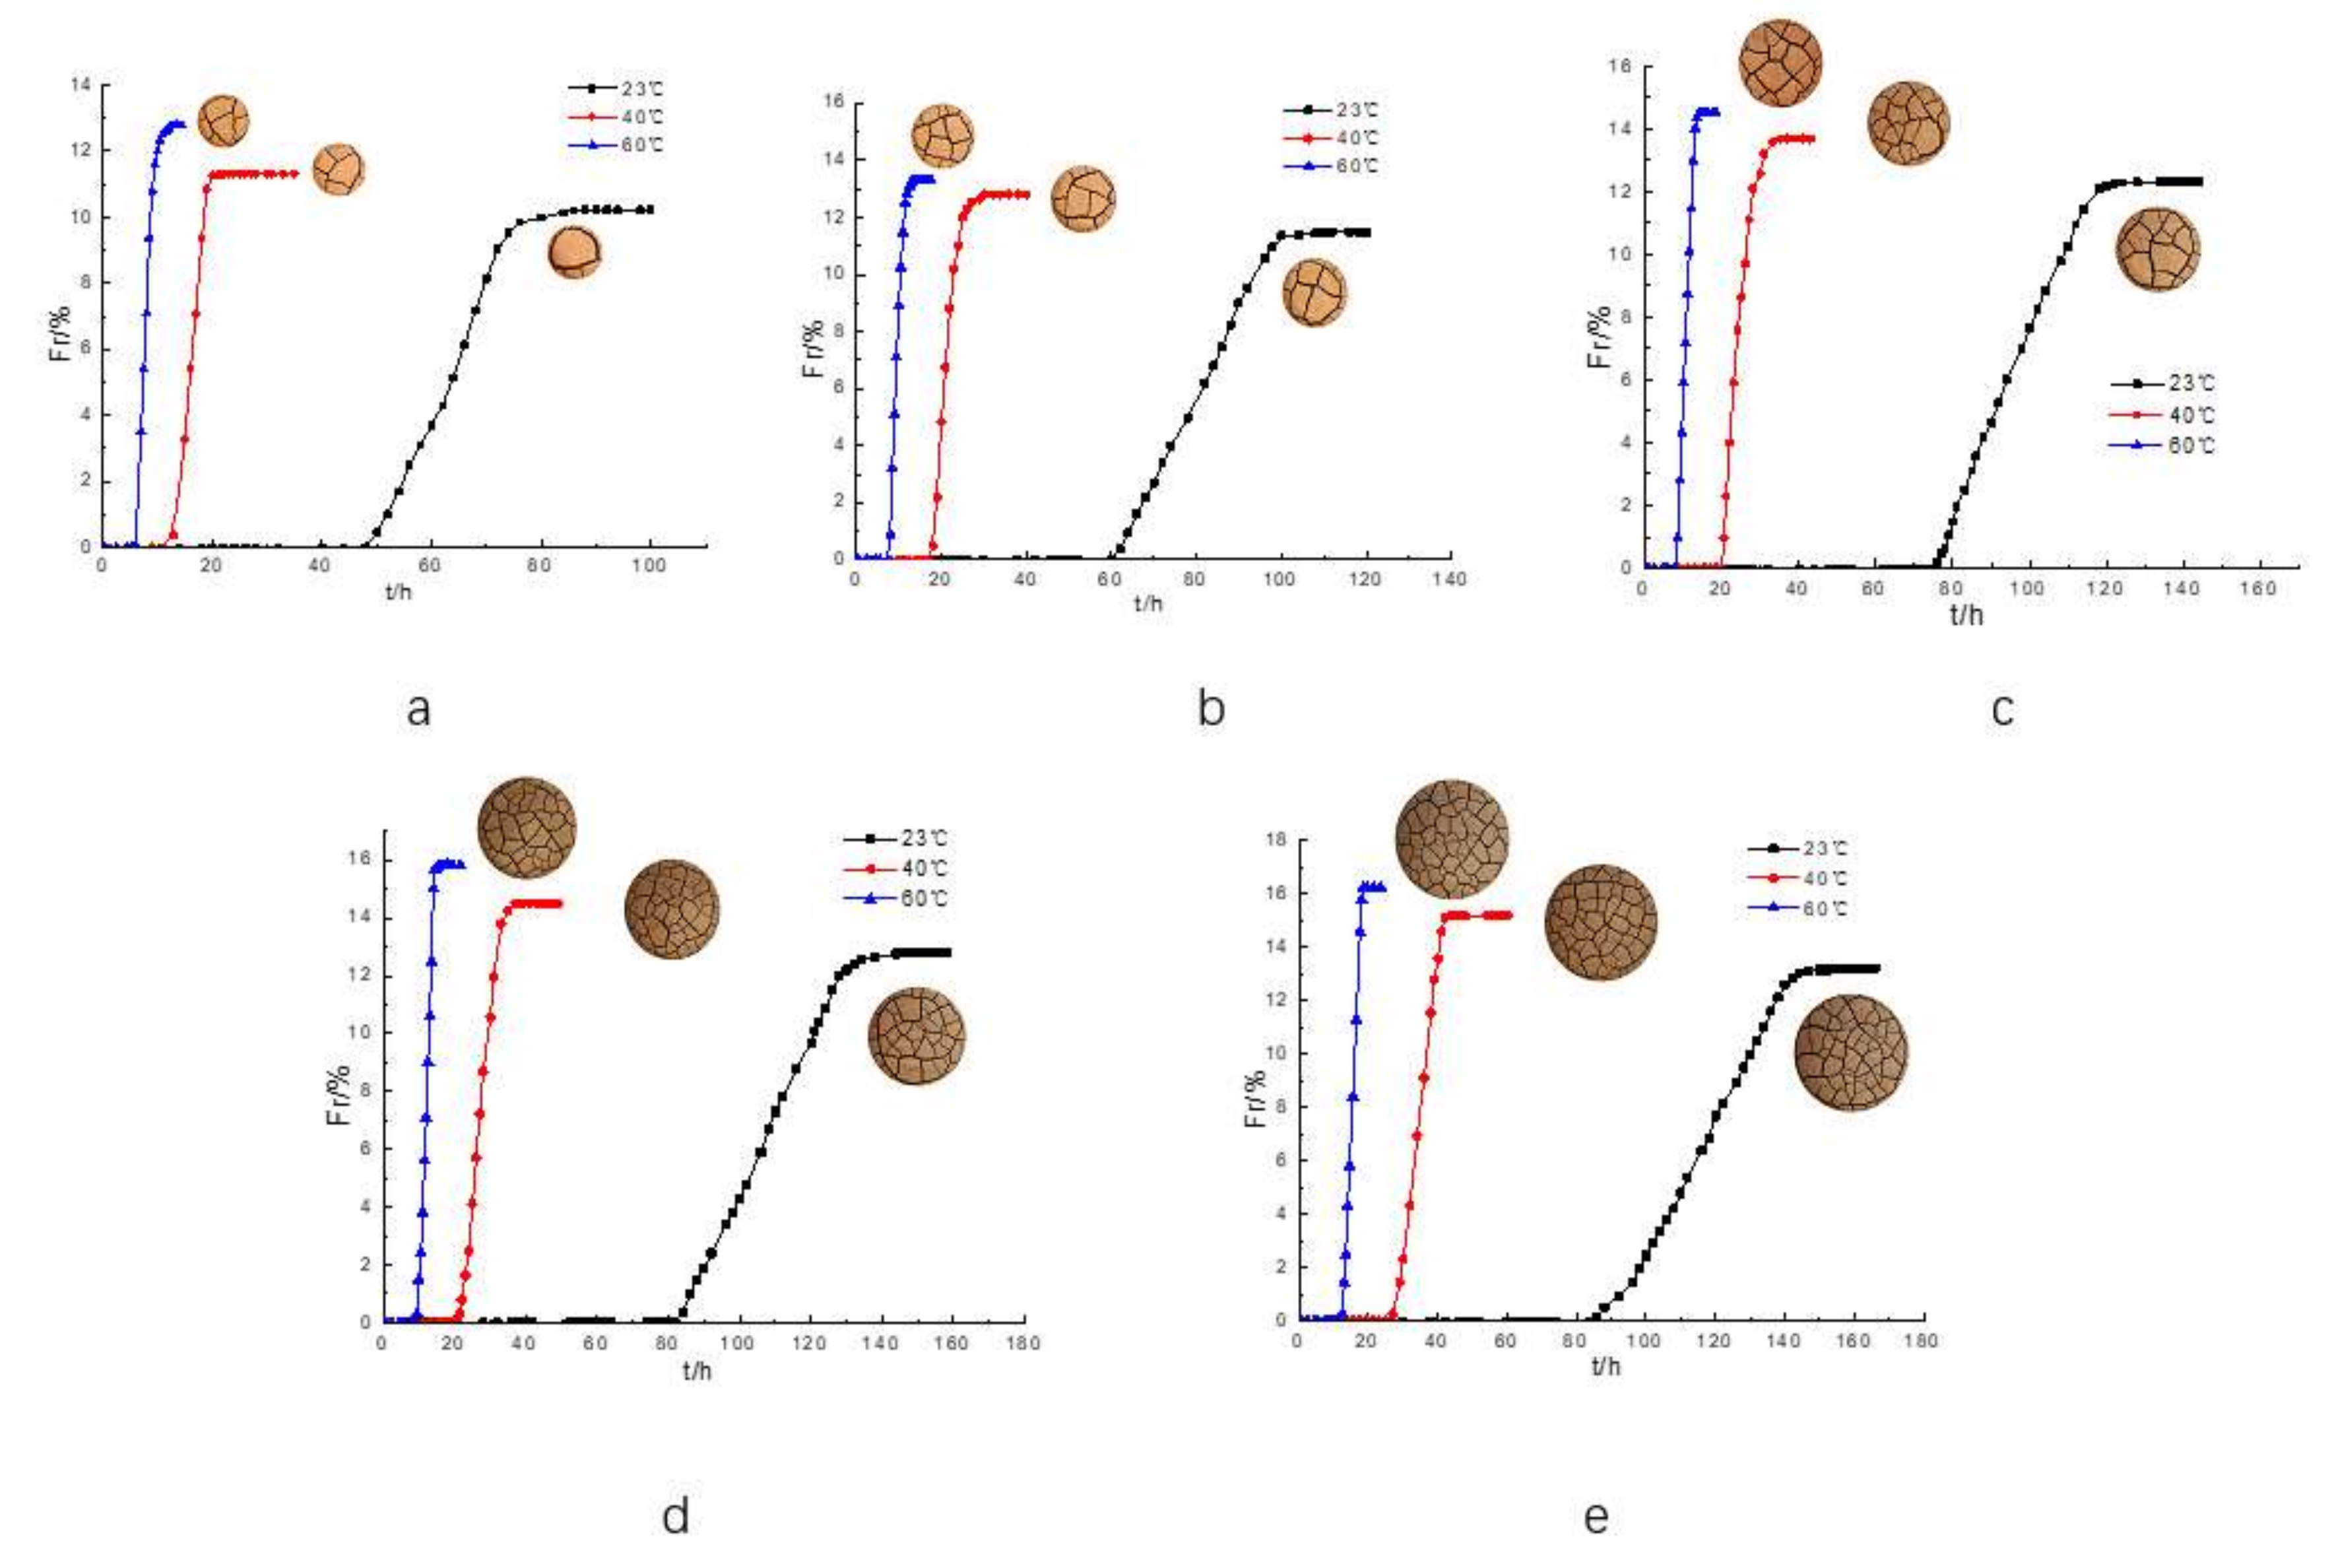
Figure 8a–e represents the diameter of 30 mm, 60 mm, 90 mm, 120 mm, and 150 mm respectively. With the increase of temperature, the time when the red clay soil sample begins to generate cracks is advanced, the growth rate of crack area is significantly increased, and the curve of the surface crack rate changes with time to the left, while the temperature is higher, and the crack rate is faster under the same sample diameter. Through comparative analysis, it can be seen that, at 60 °C, the time of crack appearance is delayed with the increase of sample diameter, while at 23 and 40 °C, the time of crack appearance of samples with different diameters shows little difference. It can be inferred that at high temperature, while the sample diameter is larger, the time to generate cracks is longer.
There are three stages of crack evolution at different temperatures. The first stage is the initial stage of micro crack generation, which is mainly from the soil drying process to the first crack generation stage. This stage is mainly the evaporation of water on the surface of the soil, the loss of free water inside the soil, and the continuous contraction of the soil until the first crack occurs. The second stage is the crack expansion stage. The stress distribution of the soil is extremely unstable. The main reason for this is that the I crack develops to the II crack. The cracks at all levels are generated rapidly, and the crack rate changes greatly, forming the main network of cracks. The third stage is the stage of crack stability. In this stage, the crack grid of red clay is basically unchanged, only a small amount of grade III crack ends are generated. The water content of soil in this stage decreases continuously with the increase of time until the water content of soil remains stable. From 23 °C to 60 °C, the time of the first stage, the second stage, and the third stage decreases correspondingly.
Table 2 shows the measurement results of relevant parameters of Guilin Red Clay at different temperatures. The higher the temperature, the shorter the total time for the soil sample to reach the crack stability stage, indicating that the higher the temperature is, the faster the water evaporation of the soil sample is. The critical moisture content of initial cracking of Guilin Red Clay at different temperatures is ( is the moisture content of soil sample when the first crack appears on the sample surface). The critical moisture content of initial cracking was 55.05% when with a diameter of 30 mm and a temperature of 23 °C were dehydrated at 60 °C. This shows that the temperature has a great influence on the critical moisture content of the initial crack. With the increase of temperature, the time of the initial crack is shorter, the time of the soil reaching the crack stability is longer, the number of the final block of the crack is significantly reduced, and the final crack rate is also increased with the increase of temperature.
From Table 5 and Table 6, we can see the influence of temperature on the moisture content of the sample. With the increase in temperature, the final moisture content of the sample gradually decreases. According to Figure 8, when the temperature is high, the number of fracture blocks is more similar to a low temperature case with more water evaporation channels, so the water loss rate is faster when the temperature is high, and the final water content of the sample is smaller.
6. Analysis of Crack Evolution Mechanism of Guilin Red Clay
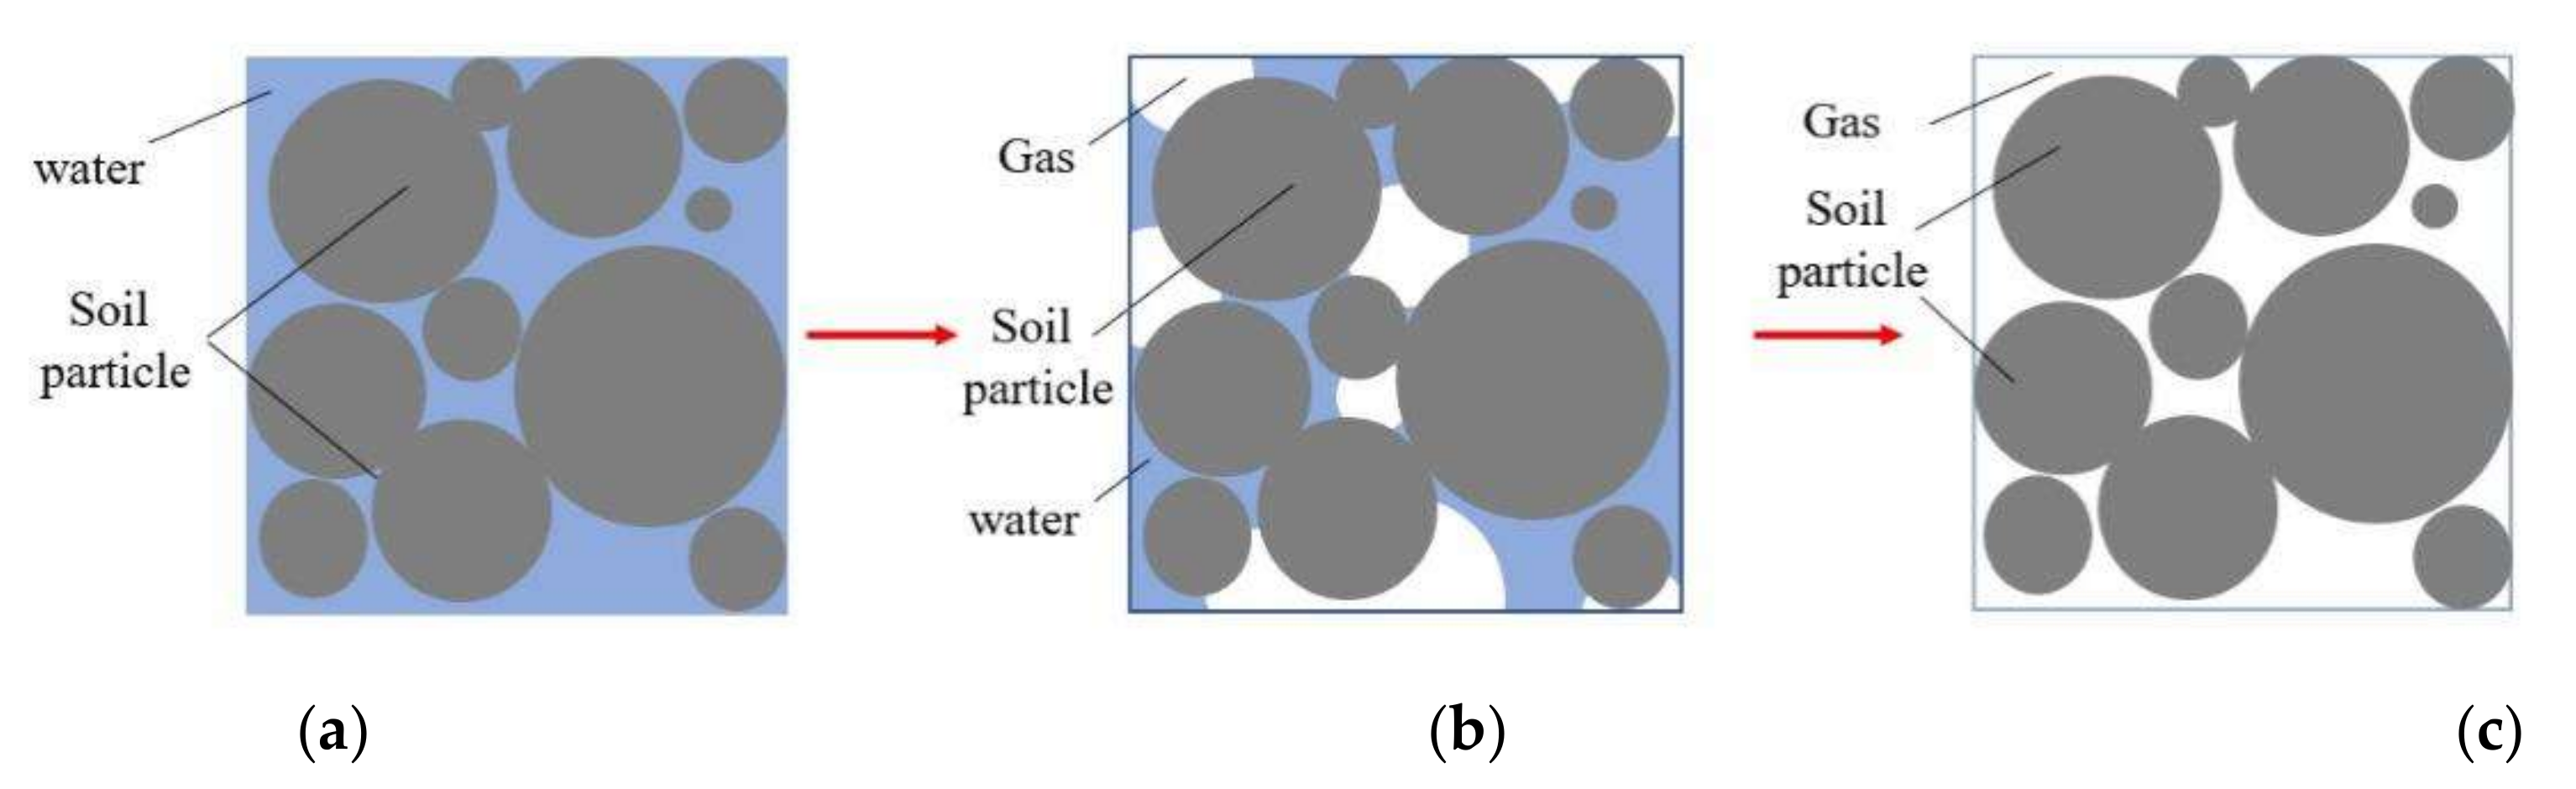
The change of air–liquid interfacial tension (surface tension) between soil particles is an important reason for the shrinkage cracking of red clay. In the early stage of drying, the red clay body is still saturated, so the internal pores of the red clay are full of water. When the temperature increases, the relative humidity in the environment is lower than one in the soil, and the average kinetic energy of water molecules is larger, which makes the binding force of soil particles on water molecules smaller, and the water holding capacity of the soil decreases, so that the water molecules in the pores of soil particles more easily escape, which intensifies the evaporation of water [32,33]. Due to the evaporation of water, the soil changes from a saturated state to an unsaturated state, and three interfaces of water air particles appear between particles, as shown in Figure 9.
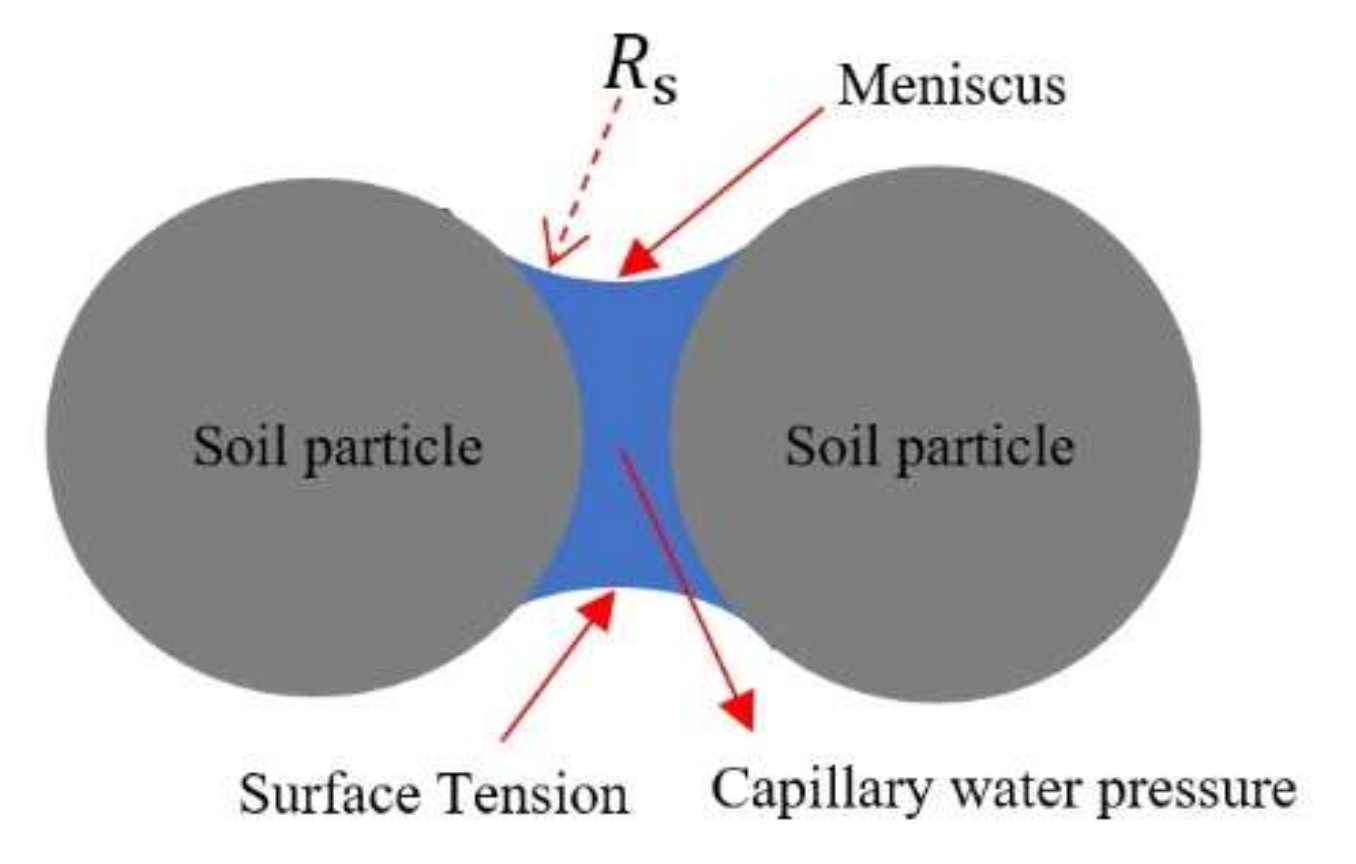
The liquid surface between clay particles becomes a curved liquid surface, resulting in the generation of matrix suction (capillary water pressure), as shown in Figure 10.
It can be seen from Formula 3 that the matrix suction (capillary pressure) is directly proportional to the surface tension and inversely proportional to the curvature radius of the meniscus.
Among them, is capillary water pressure, is air pressure of soil, is pore water pressure, is matrix suction of soil, is surface tension, and is the curvature radius of the capillary water shrinkage membrane.
In the process of water loss, the decrease of water content leads to the decrease of curvature radius of soil particles. Under the combination of surface tension and matrix suction, the space between red clay particles becomes shorter. When the tensile stress between soil particles is greater than the tensile strength between soil particles, cracks begin to appear in the soil. With the increase in temperature, the rapid evaporation of soil moisture makes the tensile stress between soil particles increase rapidly, and the time for the initial crack of red clay will be shortened. Therefore, the reason why the final crack rate increases with the increase in temperature is analyzed.
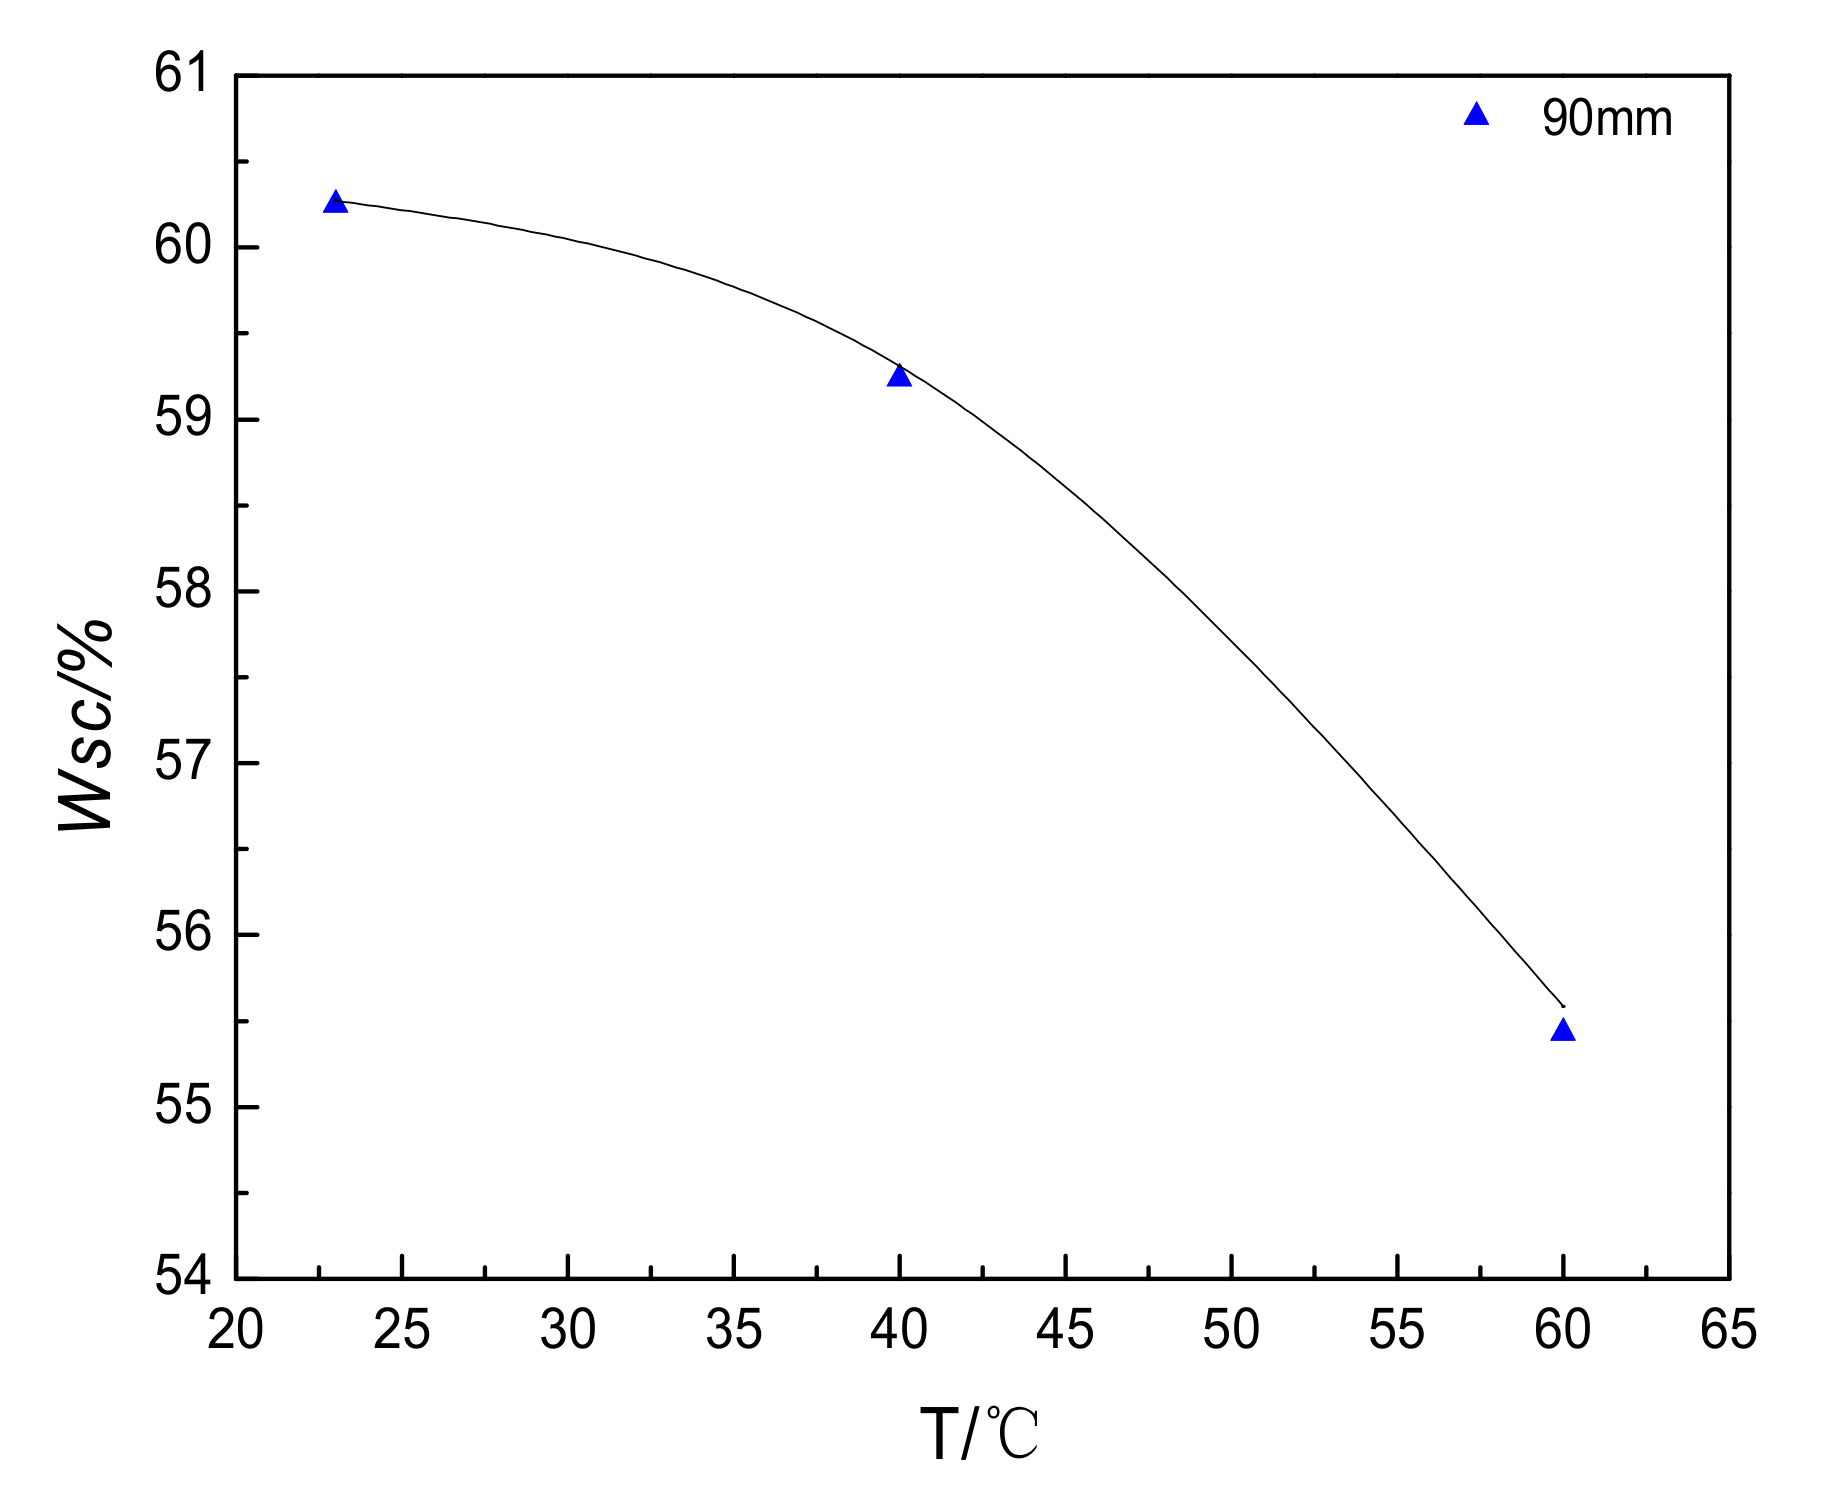
In order to further investigate the temperature effect of crack evolution during the drying of red clay, the initial cracking water content of Guilin Red Clay at different temperatures is summarized, as shown in Table 2 and Figure 11.
In Figure 11, the initial cracking water content of red clay decreases with the increase of temperature. By selecting the data of initial cracking water content of red clay at different temperatures, nonlinear fitting is carried out for discrete points, and the quadratic equation of one variable is . The fitting formula of the initial cracking water content of red clay at different temperatures is obtained as follows:
where A = −0.0035, B = 0.1638, C = 58.357, and R = 0.985, with a high degree of fitting. Through the fitting formula, we can preliminarily predict the initial cracking water content of the same type of red clay.
7. Conclusions
- (1)
- The water evaporation process of red clay is mainly divided into three stages: constant rate stage (I), variable deceleration rate stage (II), and residual stable stage (III).
- (2)
- The development and morphology of cracks in the drying process of red clay have a certain regularity. In the fissure network initially formed during the development of fissures, the small area of the fissure block more easily reaches a stable state of water content. Surface fissures are mainly divided into grade I, II, and III fissures.
- (3)
- The temperature effect of the fracture evolution of Guilin red clay is more obvious. With the increase of temperature, the time for the appearance of initial cracks in red clay becomes shorter, and the growth rate of cracks is significantly accelerated. The three stages of crack evolution in red clay are correspondingly shorter, and the number of final blocks of cracks is significantly reduced. The final surface crack rate of red clay increases with the increase of temperature.
- (4)
- With the increase of temperature, the total time required for the soil sample to lose water to the stability of the fissure gradually decreases. In addition, temperature has a greater influence on the critical moisture content of initial cracking. The higher the temperature, the lower the critical moisture content of initial cracking. The change in the air–liquid interfacial tension (surface tension) between soil particles is an important reason for the shrinkage and cracking of red clay. In the process of water loss and cracking of clay soil, the interior of the soil has experienced three states: saturated, unsaturated (water-air-grain interface), and dry states.
8. Suggestions
The results obtained through this test can reflect the cracking law of red clay under different temperature conditions. However, this test did not consider the influence of multiple factors, such as sample size and soil dry density, on its cracking law. In a future study, more sample related factors should be considered. Therefore, future research should analyze the direction of soil cracking under the action of multiple factors, fit a relatively complete empirical formula, make preliminary predictions for the cracking law of the same type of red clay, and provide corresponding references for construction projects.
Author Contributions
Conceptualization, G.X. (Guiyuan Xiao) and J.Z.; methodology, L.Z. and J.Z.; writing—original draft preparation, Z.Y. and G.X. (Guiyuan Xiao); writing—review and editing, J.Z. and L.Z.; project administration, G.X. (Guangli Xu); All authors have read and agreed to the published version of the manuscript.
Funding
This research was funded by National Natural Science Foundation of China (Grant No. 52169022), Guangxi Science and Technology Base and Special Fund for Talents Program (Grant No. Guike AD20159011).
Institutional Review Board Statement
The study did not involve humans or animals.
Informed Consent Statement
The study did not involve humans.
Data Availability Statement
The date presented in this study are available on request from the corresponding author.
Conflicts of Interest
The authors declare no conflict of interest.
References
- Abuhejleh, A.N.; Znidarcic, D. Desiccation Theory for Soft Cohesive Soils. J. Geotech. Eng. 1995, 121, 493–502. [Google Scholar] [CrossRef]
- Peron, H.; Hueckel, T.; Laloui, L.; Hu, L. Fundamentals of desiccation cracking of fine-grained soils: Experimental characterisation and mechanisms identification. Can. Geotech. J. 2009, 46, 1177–1201. [Google Scholar] [CrossRef]
- Yao, J. Drought survey in Yunnan: Weak Water Conservancy Foundation and Prominent Engineering Water Shortage. Available online: http://news.sina.com.cn/c/sd/2013-05-08/055927056174.shtml (accessed on 8 March 2013).
- Kong, L.W.; Chen, J.B.; Guo, A.G.; Zhao, Y.L.; Lü, H.B. Field response tests on expansive soil slopes under atmosphere. Chin. J. Geotech. Eng. 2007, 29, 1065–1073. (In Chinese) [Google Scholar]
- Yin, Z.Z.; Yuan, J.P.; Wei, J.; Cao, X.S.; Liu, H.Q.; Xu, B. Influences of fissures on slope stability of expansive soil. Chin. J. Geotech. Eng. 2012, 34, 2155–2161. (In Chinese) [Google Scholar]
- Wang, S.J.; Wang, X.Q.; Li, D.; Li, X.; Liang, G. Evolution of fissures and bivariate—bimodal soil—water characteristic curves of expansive soil under drying—wetting cycles. Chin. J. Geotech. Eng. 2021, 43, 58–63. (In Chinese) [Google Scholar]
- Wang, Y.G. Theoretical Analysis and Experimental Study on the Mechanism of Bank Collapse in Alluvial River; China Institute of Water Resources and Hydropower Research: Beijing, China, 2003. (In Chinese) [Google Scholar]
- Sun, P.; Peng, J.B.; Wu, S.R. An experimental study on mechanical properties of fractured loess. J. Cent. South Univ. (Sci. Technol.) 2015, 46, 2188–2195. (In Chinese) [Google Scholar]
- Lloyd-Hughes, B. The Long Range Predictability of European Drought; University of London: London, UK, 2002. [Google Scholar]
- Tong-Lu, L.; Hong, W.; Yu-Kai, F.; Yan, L. Test Simulation on the Forming Mechanism of Loess Vertical Joints. J. Earth Environ. 2014, 36, 127–134. (In Chinese) [Google Scholar]
- Rayhani, M.H.; Yanful, E.K.; Fakher, A. Desiccation-induced cracking and its effect on the hydraulic conductivity of clayey soils from Iran. Can. Geotech. J. 2007, 44, 276–283. [Google Scholar] [CrossRef]
- Chang, L.-C.; Wang, H.-Y.; Xue, K.-X. Study on the laws of changes of cracks and shear strength in unsaturated red clay under different drying temperature. J. Eng. Geol. 2020. (In Chinese) [Google Scholar] [CrossRef]
- Liao, Y.L.; Bi, Q.T.; Jiang, G.P.; Zhao, K. Karst and red clay on the surface of carbonate terrane. Earth Environ. 2005, 33, 13–19. (In Chinese) [Google Scholar]
- Liao, Y.L.; He, J.; Qing, G. The Changing Law of Engineering Characteristics of Red Clay in South China. Guizhou Sci. 2008, 26, 53–58. (In Chinese) [Google Scholar]
- Jiang, H.-T. The origin of red clay and its influence on engineering properties. Hydrogeol. Eng. Geol. 2000, 27, 33–37. (In Chinese) [Google Scholar]
- Yao, H.L.; Zheng, S.H.; Chen, S.Y. Analysis on the slope stability of expansive soils considering cracks and infiltration of rain. Chin. J. Geotech. Eng. 2001, 23, 606–609. (In Chinese) [Google Scholar]
- Song, L.; Li, J.; Garg, A.; Mei, G. Experimental study on water exchange between crack and clay. J. Harbin Inst. Technol. 2017, 49, 146–151. (In Chinese) [Google Scholar]
- Cai, W.; Ling, D.; Xu, Z.; Chen, Y. Influence of preferential flow induced by a single crack on anti-seepage performance of clay barrier. Rock Soil Mech. 2014, 35, 2838–2844. (In Chinese) [Google Scholar]
- Jun, H.; Juan, W.; Yu, W. Desiccation Cracks and Hydraulic Performance of Compacted Clay Liner via Laboratory Wet-Dry Cycling. J. Eng. Geol. 2012, 20, 397–402. (In Chinese) [Google Scholar]
- Abedine AZ, E.; Robinson, G.H. A study on cracking in some Vertisols of the Sudan. Geoderma 1971, 5, 241. [Google Scholar]
- Ringrose-Voase, A.J.; Sanidad, W.B. A method for measuring the development of surface cracks in soils: Application to crack development after lowland rice. Geofis. Int. 1996, 71, 261. [Google Scholar] [CrossRef]
- Chen, K.-S. Evolution of cracks in red clay under wetting-drying cycles and its influence on shear strength. Hydrogeol. Eng. Geol. 2018, 45, 89–95. (In Chinese) [Google Scholar]
- Tang, C.S.; Shi, B.; Liu, C.; Wang, B.J.; Gao, W. Developing law and morphological analysis of shrinkage cracks of clayey soil under different temperatures. Chin. J. Geotech. Eng. 2007, 29, 743–749. (In Chinese) [Google Scholar]
- Shen, K.; Zhu, X.-Y.; Zhang, Y.-Y. Study on Crack Evolution Law of Expansive Soil under Different Temperatures. Water Resour. Power 2017, 35, 116–118. [Google Scholar]
- Zhang, H.; He, L.L.; Liu, H.Y. Research on the shrinkage and cracking characteristics of compacted red clay in Hohhot. J. Eng. Geol. 2019, 27, 1311–1319. [Google Scholar]
- Sima, J.; Jiang, M.; Zhou, C. Numerical simulation of desiccation cracking in a thin clay layer using 3D discrete element modeling. Comput. Geotech. 2014, 56, 168–180. [Google Scholar] [CrossRef]
- Kodikara, J.; Costa, W. Desiccation cracking in clayey soils: Mechanisms and modelling. In Multiphysical Testing of Soils and Shales; Springer: Berlin/Heidelberg, Germany, 2012. [Google Scholar]
- Costa, W.D.S.M. Study of Desiccation Cracking and Fracture Properties of Clay Soils. Ph.D. Thesis, Monash University, Melbourne, Australia, 2010. [Google Scholar]
- Zhang, H.; He, L.L. Fracture characteristics of compacted red clay based on image processing. J. Jiang Su Univ. (Nat. Sci. Ed.) 2020, 41, 387–391. [Google Scholar]
- Tang, C.S.; Cui, Y.J.; Shi, B.; Tang, A.M.; Liu, C. Desiccation and cracking behavior of clay layer from slurry state under wetting–drying cycles. Geoderma 2011, 166, 111–118. [Google Scholar] [CrossRef] [Green Version]
- Liu, C.; Tang, C.; Sun, K.; Li, H.; Xu, S.; Leng, T. Review on the mechanism and theoretical model of desiccattion cracking in clay soil. J. Eng. Geol. 2018, 26, 296–308. [Google Scholar]
- DeCarlo, K.F.; Shokri, N. Effects of substrate on cracking patterns and dynamics in desiccating clay layers. Water Resour. Res. 2014, 50, 3039–3051. [Google Scholar] [CrossRef]
- Murray, R.S.; Quirk, J.P. Intrinsic Failure and Cracking of Clay. Soil Sci. Soc. Am. J. 1990, 54, 1179. [Google Scholar] [CrossRef]
Figure 1.
(a) DH-420 electric constant temperature incubator; (b) Automatic photographing and weighing device; (c) Automatic photographing and weighing device.
Figure 1.
(a) DH-420 electric constant temperature incubator; (b) Automatic photographing and weighing device; (c) Automatic photographing and weighing device.

Figure 2.
Preparation of soil samples (a) raw materials; (b) sample profiles.

Figure 3.
Crack image processing flow chart. (a) Background removal, (b) Radius equalization, (c) Thresholding, (d) Impurity removal, (e) Block recognition, (f) Crack recognition.
Figure 3.
Crack image processing flow chart. (a) Background removal, (b) Radius equalization, (c) Thresholding, (d) Impurity removal, (e) Block recognition, (f) Crack recognition.

Figure 4.
Change curve of water content and time of red clay with diameter of 60 mm.

Figure 5.
Three stage diagram of soil moisture evaporation.

Figure 6.
The relationship between the diameter and moisture content of different samples at different temperatures.
Figure 6.
The relationship between the diameter and moisture content of different samples at different temperatures.

Figure 7.
Crack development diagram of red clay at different times. (a) 76 h, (b) 80 h, (c) 84 h, (d) 86 h, (e) 88 h, (f) 96 h, (g) 112 h, (h) 115 h, (i) 130 h, (j) 136 h.
Figure 7.
Crack development diagram of red clay at different times. (a) 76 h, (b) 80 h, (c) 84 h, (d) 86 h, (e) 88 h, (f) 96 h, (g) 112 h, (h) 115 h, (i) 130 h, (j) 136 h.

Figure 8.
Time dependent curve of surface crack rate of red clay at different temperatures. (a) sample with the diameter of 30 mm, (b) 60 mm, (c) 90 mm, (d) 120 mm, and (e) 150 mm.
Figure 8.
Time dependent curve of surface crack rate of red clay at different temperatures. (a) sample with the diameter of 30 mm, (b) 60 mm, (c) 90 mm, (d) 120 mm, and (e) 150 mm.

Figure 9.
Diagram of water evaporation between soil particles. (a) Saturation state, (b) Unsaturated state (water-gas-particle interface), (c) Drying state.
Figure 9.
Diagram of water evaporation between soil particles. (a) Saturation state, (b) Unsaturated state (water-gas-particle interface), (c) Drying state.

Figure 10.
Schematic diagram of soil particle interaction in unsaturated state.

Figure 11.
Initial cracking water content curve of red clay at different temperatures.


Table 1.
The basic physical property indexes of red clay in Lingui area, Guilin.
| Physical Properties | Value |
|---|---|
| Specific gravity | 2.73 |
| Liquid limit | 69.7% |
| Plastic limit | 44.6% |
| Natural moisture content | 34.91% |
| Optimum moisture content | 26.5% |
| Void ratio | 1.070 |
| Compression elastic modulus | 8.50 |
| Plasticity index | 23.7 |
| Maximum dry density | 1.56 ρd/g·cm−3 |
Note: the water content corresponding to the cone depth of 17 mm is the liquid limit.
Table 2.
Chemical Composition of Red Clay.
| Chemical Composition (%) | ||||||
|---|---|---|---|---|---|---|
| Material | SiO2 | Al2O3 | Fe2O3 | TiO2 | MgO | K2O |
| Red Clay | 34.5 | 41.32 | 16.72 | 2.48 | 1.2 | 1.9 |
Table 3.
The Granulometric Composition of Red Clay.
| Particle Fraction | Clay | Silt | Gravel |
|---|---|---|---|
| grain size | <0.005 mm | 0.005–0.075 mm | 0.075–2 mm |
| Content | 32.0% | 66.40% | 1.60% |
Table 4.
The experimental configuration.
| Temperature/°C | Diameter/mm | Number of Parallel Groups |
|---|---|---|
| 23 | 90 | 3 |
| 40 | 90 | 3 |
| 60 | 90 | 3 |
Table 5.
Measurement results of relevant crack geometric parameters of Guilin Red Clay at different temperatures.
Table 5.
Measurement results of relevant crack geometric parameters of Guilin Red Clay at different temperatures.
| Temperature/°C | Diameters/mm | Total Duration/h | Initial Cracking Time/h | Cracking Stability Time/h | Critical Humidity of Initial Cracking WSC/% | Number of Sample | Fissure Ratio/% |
|---|---|---|---|---|---|---|---|
| 23 | 90 | 168 | 76 | 136 | 60.25 | 32 | 12.32 |
| 40 | 90 | 47 | 20 | 35 | 59.24 | 31 | 13.69 |
| 60 | 90 | 21.5 | 8.5 | 16.5 | 55.43 | 29 | 14.53 |
Table 6.
Measurement results of water content of Guilin Red Clay at different temperatures.
| Temperature/°C | Diameter/mm | Initial Moisture Rate/% | Final Moisture Rate% |
|---|---|---|---|
| 23 | 90 | 60.25 | 2.23 |
| 40 | 90 | 59.24 | 1.64 |
| 60 | 90 | 55.43 | 0.63 |
Publisher’s Note: MDPI stays neutral with regard to jurisdictional claims in published maps and institutional affiliations. |
© 2021 by the authors. Licensee MDPI, Basel, Switzerland. This article is an open access article distributed under the terms and conditions of the Creative Commons Attribution (CC BY) license (https://creativecommons.org/licenses/by/4.0/).
Share and Cite
MDPI and ACS Style
Xiao, G.; Ye, Z.; Xu, G.; Zeng, J.; Zhang, L. Temperature Effect on Crack Evolution of Red Clay in Guilin. Water 2021, 13, 3025. https://doi.org/10.3390/w13213025
AMA Style
Xiao G, Ye Z, Xu G, Zeng J, Zhang L. Temperature Effect on Crack Evolution of Red Clay in Guilin. Water. 2021; 13(21):3025. https://doi.org/10.3390/w13213025
Chicago/Turabian StyleXiao, Guiyuan, Ziming Ye, Guangli Xu, Jian Zeng, and Lu Zhang. 2021. "Temperature Effect on Crack Evolution of Red Clay in Guilin" Water 13, no. 21: 3025. https://doi.org/10.3390/w13213025
Note that from the first issue of 2016, this journal uses article numbers instead of page numbers. See further details here.