
HPLC-DAD Purification and Characterization of Meta-Cresol-Purple for Spectrophotometric Seawater pH Measurements


1
Department of Chemistry and Industrial Chemistry, University of Genova, Via Dodecaneso 31, 16146 Genova, Italy
2
Department of Life and Environmental Sciences, Univesità Politecnica delle Marche, Via Brecce Bianche, 60131 Ancona, Italy
*
Author to whom correspondence should be addressed.
Water 2021, 13(21), 3030; https://doi.org/10.3390/w13213030
Submission received: 23 September 2021
/
Revised: 18 October 2021
/
Accepted: 26 October 2021
/
Published: 28 October 2021
(This article belongs to the Section Oceans and Coastal Zones)
Abstract
:High-quality pH measurements are essential for observing ocean acidification and interpreting its chemical and ecological effects. Spectrophotometric measure is the preferred method for pH analysis of seawater because of its high reproducibility and excellent precision. Meta-cresol purple (mCP) is one of the most used indicator dyes for spectrophotometric pH determination. Impurities in indicator salts can significantly bias spectrophotometric pH determinations, and therefore the use of purified mCP is recommended. This work describes the use of a fast, simple, and green-friendly High-Performance-Liquid Chromatography (HPLC) procedure for purification of mCP dye solution. A C18 reversed phase column was used, and different compositions of the mobile phase were considered. The selected mobile phase was 85% Milli-Q water and 15% CH3CN pH 8.0 that allowed reasonable run time and a suitable purified mCP retention time (4.65 ± 0.005 min). Aliquots of purified mCP were mixed and evaporated by rotary evaporator that resulted in the fastest preconcentration procedure among those considered in this study. Purified mCP was used for measuring the pH in seawater samples collected in the Ross Sea (Antarctica) and the values ranged between 8.202 and 7.983, with the highest values at the surface.
1. Introduction
High-quality pH measurements are essential for observing ocean acidification and interpreting its chemical and ecological effects [1].
pH is used to evaluate effects produced by the increase of atmospheric carbon dioxide (CO2) on the seawater carbonate buffer system and to evaluate the consequences that a variation in the concentration of H3O+ ions would have on the biological processes in the marine ecosystem [2]. From the preindustrial age to the present, the average pH of the ocean surface decreased from 8.21 to 8.10 [3]. The consequences mainly concern calcifying organisms in which physiological alterations can be observed. In addition to the decrease in pH, the reactions caused by the increase of CO2 in the oceans also led to a decrease in the availability of carbonate ions (CO32−) and to a decrease both in the compensation depth and in the saturation grade (Ω) of calcite and aragonite. This phenomenon makes calcification by marine organisms increasingly difficult [4]. Several chemical, biological, and ecological consequences of oceanic acidification are also observed in the Southern Ocean, where surface waters have low total alkalinity (AT) values compared to other oceans, due to biogeochemical processes [5,6]. The Ross Sea is an important region of the Southern Ocean in the global carbon budget acting, as it does, as an atmospheric CO2 sink. Therefore, a better knowledge of inorganic carbon properties is required. Both spectrophotometric and potentiometric methods are reported for the pH determination in seawater samples [7,8].
Spectrophotometric measure was long the preferred method for pH analysis of seawater because of its excellent reproducibility [9,10]. The values of pH are determined by adding an indicator dye to sea water. One of the most used indicators for seawater analyses is meta-cresol purple (mCP). For the sulfonephthalein indicators such as mCP, the reaction of interest at seawater pH is the second dissociation:
where HI− is the protonated (acid) form and I2− is the deprotonated (base) form. The total hydrogen ion concentration of the sample can then be determined:
where K is the second dissociation constant:
R is the ratio of indicator absorbance:
and λ1 and λ2 are the wavelengths for the absorbance maxima of HI− (434 nm) and I2− (578 nm), respectively; e1, e2, and e3 are the molar absorbance ratios of the indicator [8,11]. The different forms of the mCP have substantially different absorption spectra.
HI−(aq) ↔ H+(aq) + I2−(aq)
The accuracy of spectrophotometric pH measurements can be adversely affected by impurities in the mCP indicator that absorb significantly at the same wavelength of maximum absorption for both the acid and the base species [11,12]. The use of purified mCP is therefore recommended if extremely accurate pH measurements in seawaters are required. The purification of the indicator can be carried out by precipitation of the acid form in acid solutions. In this way, however, only the major impurities are eliminated. Alternatively, chromatographic techniques such as High-Performance Liquid Chromatography (HPLC) and Flash Chromatography (FC) are used. However, FC methods imply a high consumption of solvents [12,13].
This paper reports the development of a High-Performance Liquid Chromatography-Diode Array Detector (HPLC-DAD) method for quantitatively removing the impurities contained in a commercial mCP batch to obtain a refined solid. The Green Analytical Chemistry (GAC) principles provide essential guidelines for making analytical laboratories greener [14]. In this context, efforts were made to enable implementation of a more chromatographic sustainable method. Purified mCP was used in spectrophotometric pH measurements in seawater samples collected in the Ross Sea (Antarctica) during the 2020 austral summer. To our knowledge, this is the first data set of spectrophotometric pH measurement for that region.
2. Materials and Methods
2.1. Reagents
Deionized water from a Milli-Q system (Millipore, Watford, Hertfordshire, UK) was used throughout. m-Cresol Purple sodium salt (Lot # MKBR3556V, CAS: 62625-31-4) was purchased from Sigma–Aldrich.
0.01 M stock solution was obtained by dissolving mCP sodium salt in Milli-Q water; hydrochloric acid (HCl, Merck, Darmstadt, Germany) was added to adjust the indicator solution pH to ~8.0. Working standard solutions (0.1–0.25–0.3–0.4–0.5–1–2–5–7 mM) were obtained by diluting the stock solution and were filtered through a 0.45 μm cellulose filter. The standard stock solution and working solutions were stored at 4 °C.
0.5 M ammonium acetate (CH3COONH4), 0.5 M ammonium formate (H2CO2NH4), and acetonitrile (CH3CN), (HPLC grade, VWR Chemicals, Radnor, PA, USA) were used for the chromatographic separation. Methanol (MeOH, HPLC grade, VWR Chemicals, Radnor, PA, USA) was used as eluent in the solid phase extraction (SPE) purification procedure.
2.2. HPLC Analysis
An HPLC-DAD 1260 series from Agilent Technologies (Santa Clara, CA, USA) equipped with an autosampler was used. An Agilent Poroshell EC-C18 120 4 μm 4.6 mm column was used for the chromatographic separation. All experiments were performed with an injection volume of 10 μL and a flow rate of 1 mL/min under isocratic conditions. The chromatographic system was thermostated at 30 ± 1 °C to avoid variation in the retention time.
Three compositions of the mobile phase were considered: (A) 70% H2CO2NH4 0.5 M pH 8.0 and 30% CH3CN; (B) 70% CH3COONH4 0.5 M pH 8.0 and 30% CH3CN; (C) 85% H2O pH 8.0 and 15% CH3CN. Moreover, as regards mobile phase B, different percentage of CH3COONH4 (50%, 60% and 80%) and different pH of the eluent (7.0, 7.5 and 8.0) were tested. Spectra were acquired in the wavelength range between 250 and 650 nm, while chromatograms were acquired at both 434 and 578 nm. mCP working standard solutions were used to draw up a calibration curve.
2.3. Preconcentration Procedures
Repeated injections of the 7 mM mCP standard solution were performed and the fractions corresponding to the purified compound were collected. Three different techniques were investigated to remove the solvent from the purified mCP: freeze-drying, evaporation, and SPE.
For freeze-drying, purified mCP aliquots were frozen at −80 °C overnight and then freeze-dried for 5 h using a lyophilizer (A. De Mori S.p.a., Milano, Italy).
For evaporation, five aliquots of purified mCP were mixed and evaporated for 30 min using a rotary evaporator (Laborota 4000 efficient, Heidolph Instruments GmbH & CO, Schwabach, Germany). The evaporation flask was submerged in a 45 °C water bath, with the contents of the flask under partial vacuum.
For SPE, C18 SPE cartridges 500 mg, 3 mL (Supelclean™ ENVI™-18, Supelco®) were used. Five aliquots of purified mCP were mixed and loaded onto the SPE cartridge. For the conditioning step, 3 mL of MeOH and 3 mL of Milli-Q water pH 8.0 were used. The solid phase was washed by loading 5 mL of basified Milli-Q water, which was then dried using a N2 flow for 30 min. The mCP was eluted with 3 mL of MeOH, and then was dried by N2 flow.
2.4. Sampling
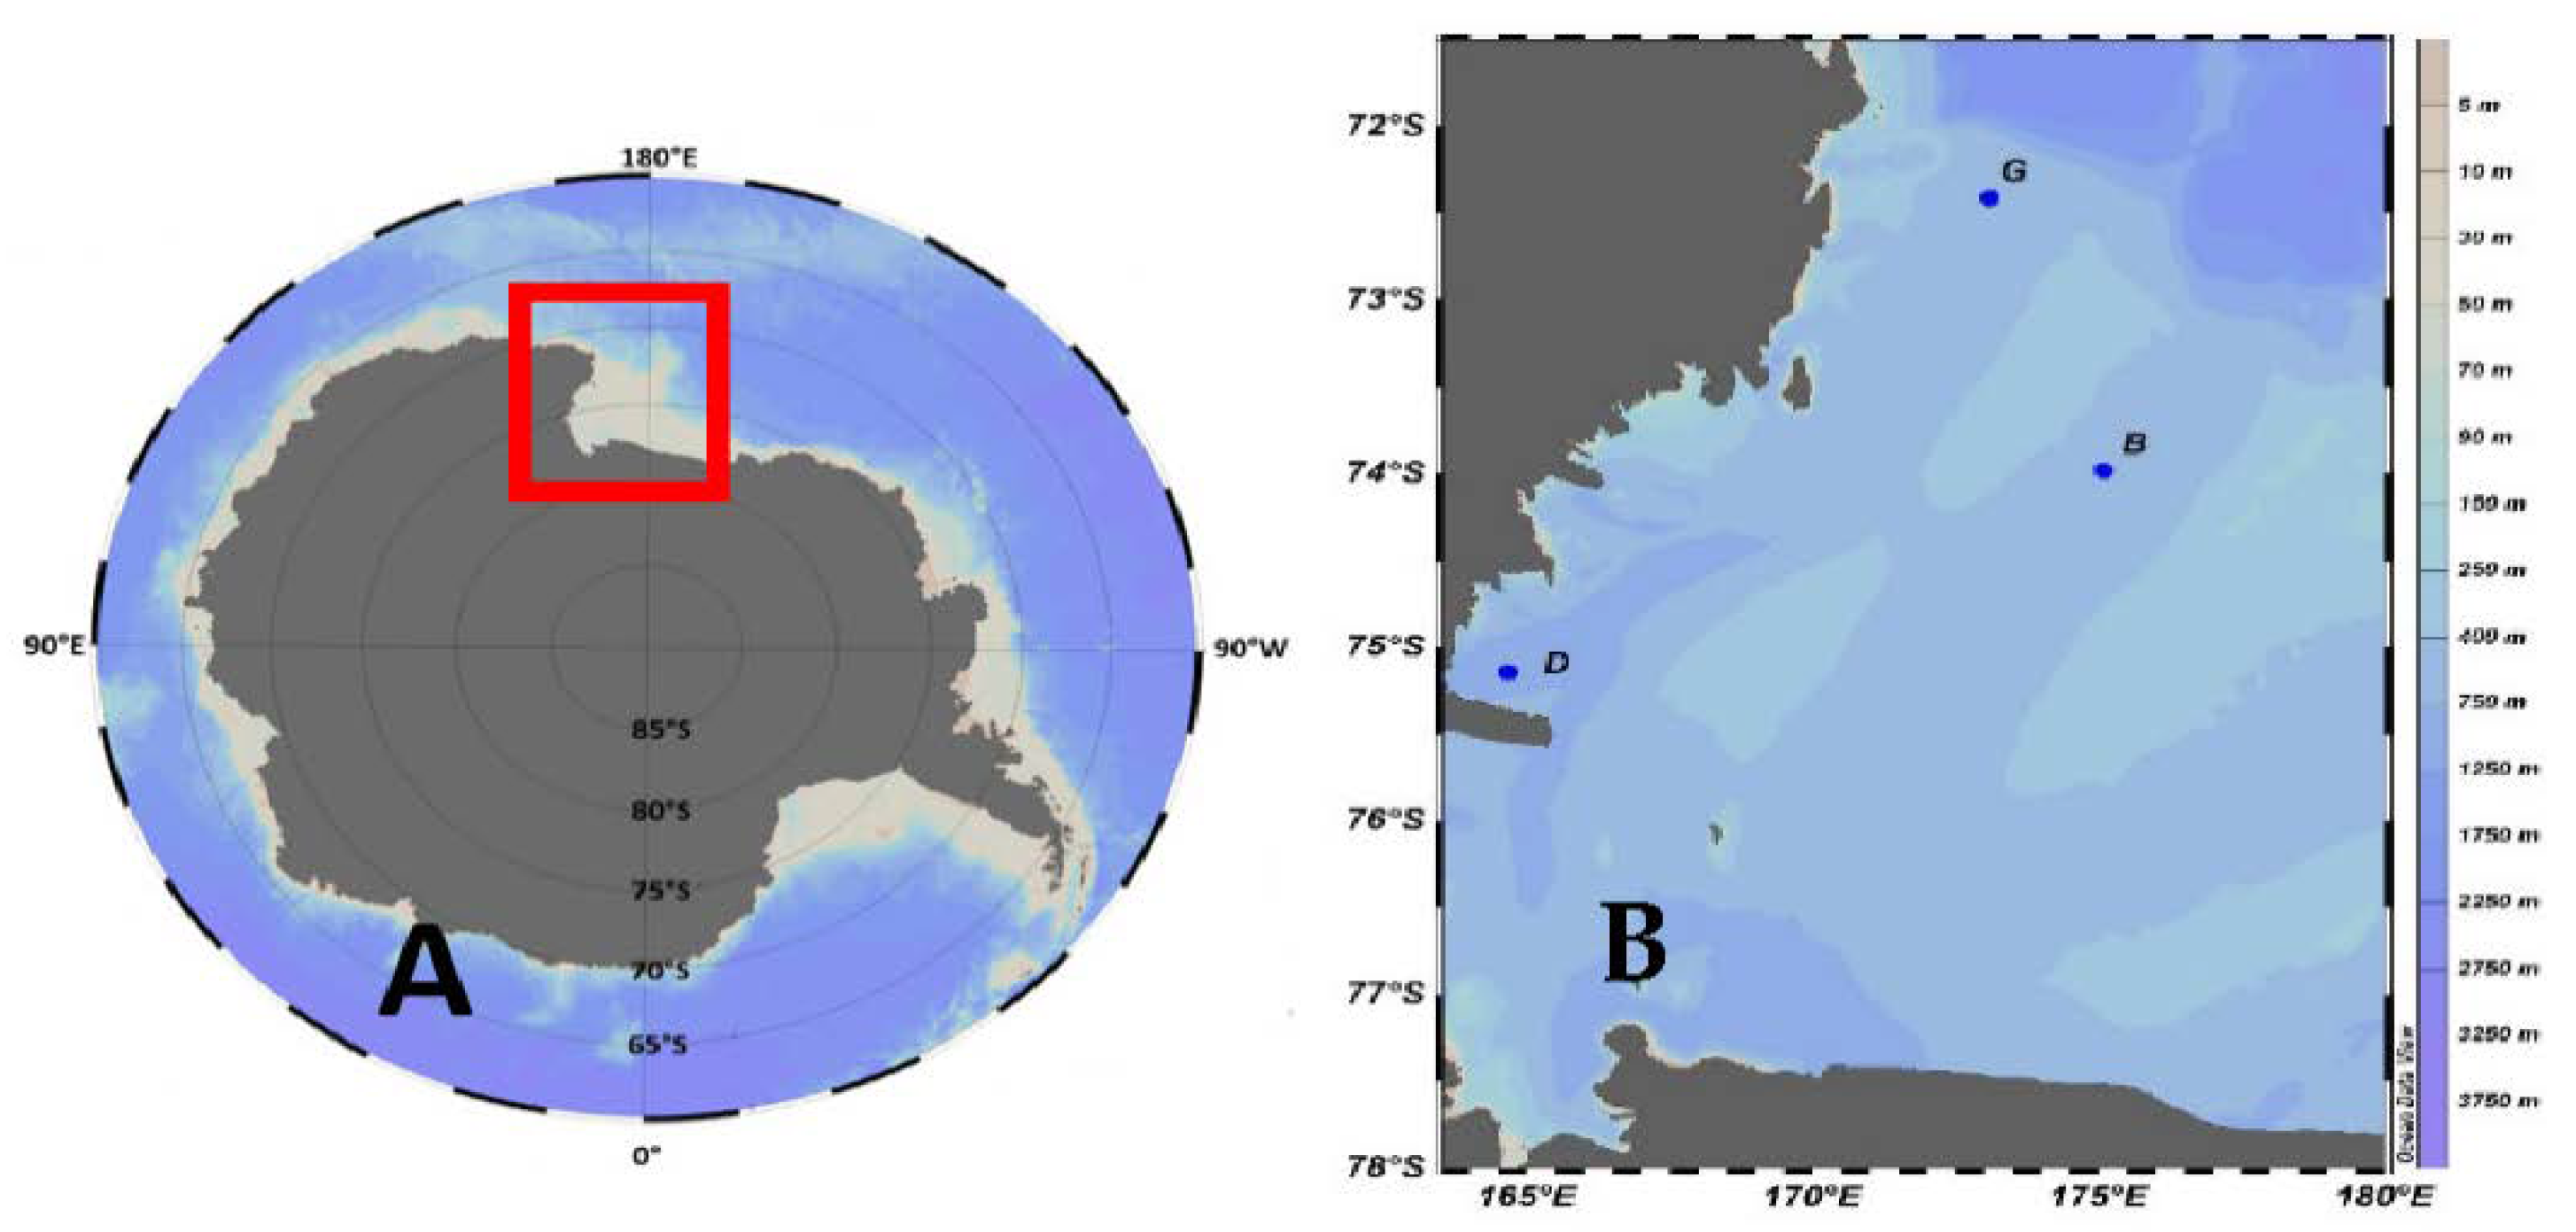
Sea water samples were collected on board the R.V. Laura Bassi in the Ross Sea (Antarctica) during the 2020 austral summer, as part of the “Effect of the eaSTern inflow of water on the Ross Sea salinity field variability” (ESTRO) project of the Italian National Program of Research in Antarctica (PNRA) from 30 January to 5 of February 2020. The samples were collected where moorings of the Marine Observatory in the Ross Sea (MORSea) project are located (Figure 1). Conductivity, temperature, and depth were acquired using a CTD profiler, Sea Bird Electronics SBE 9/11 plus. The CTD was equipped with two pairs of temperature-conductivity sensors, a SBE 23 O2 sensor and a Chelsea Aquatrack III fluorometer for oxygen concentration and fluorescence data, respectively. A SBE 32 plastic coated carousel sampler was used to collect water samples from 24 12-L Niskin bottles. At selected depths (Table 1), seawater samples for carbonate system analyses were collected and stored in 500 mL borosilicate glass bottles following standard operating procedures [8]. The samples were poisoned in the container with saturated HgCl2 to stop biological activity. Samples were then stored in dark, cold (+4 °C) conditions.
2.5. Spectrophotometric Measurement of pH of the TRIS Buffer and of Seawater Samples
The spectrophotometric measurement of pH of the tris(hydroxymethyl)aminomethane (TRIS) buffer and of seawater samples was carried out following the indications provided by the Global Ocean Acidification Observing Network (GOA-ON) [15]. Before the analysis, the purified mCP was redissolved in 0.5 M NaCl pH 8.0 to obtain a 1.3 mM solution. The sample bottles were placed in a thermostatic water bath and left for a few hours to reach the temperature of 25.0 ± 0.1 °C. Once the temperature was reached, 1 mL of sample was quickly and carefully transferred into the glass cuvette using a micropipette. Absorbance was measured and recorded at three wavelengths (730–578–434 nm) by using a Varian Cary® 50 UV-VIS spectrophotometer. Subsequently the cuvette was removed from the spectrophotometer, and 60 μL of 1.3 mM mCP dye solution were added. The cap was replaced, and the cuvette was gently shaken to mix the sea water and the dye. The cuvette was returned to the spectrophotometer and the absorbance at the three wavelengths was measured again. This amount of dye produces absorbance values ranging from 0.4 to 1.0 at each of the two absorbance peaks. The pH determination of the sea water samples and the correction of the absorbances by the background absorbance (without dye) and for any baseline shift (absorbance at 730 nm) were evaluated using the SOP pH spreadsheet of the Manual for pH Determination Version 1.0 of the GOA-ON [15]. The uncertainty of the pH measurements was determined by analyzing five aliquots of the TRIS buffer, provided by A.G. Dickson (Scripps Institution of Oceanography) (batch #T33).
2.6. Total Alkalinity Measurement
2.7. Recalculation of pH in Seawater Samples at In Situ Conditions
The CO2SYS program was used to recalculate at in situ conditions pH and AT together with total inorganic carbon (CT) and Ω data from the pH and AT data measured at 25 °C [17]. Equilibrium constants of CO2 (K1 and K2) of Millero, 2006 and total hydrogen ion scale (mol kgSW−1) for pH were used for the calculations [18] together with CTD data (temperature, salinity and pressure).
3. Results and Discussion
3.1. Development of the HPLC Purification of mCP
The use of nonpurified indicators, such as mCP, is one of the main sources of error in pH spectrophotometric measurements [11,12]. In fact, uncharacterized impurities can cause absorption of light at the same wavelength as the acid or basic species of the indicator [1]. This is of relevance in the seawater pH spectrophotometric measurement because it modifies the value of the isosbestic point R and compromises the validity of pK (see Equation (2). Thus, the presence of impurities can significantly affect the accuracy of the result. Commercially purified mCP is only available in limited quantities, and it is only provided upon specific request.
An analytical HPLC-DAD procedure that characterizes the relative absorbance contributions of components and establishes effective separation conditions was developed in this study to purify commercial mCP.
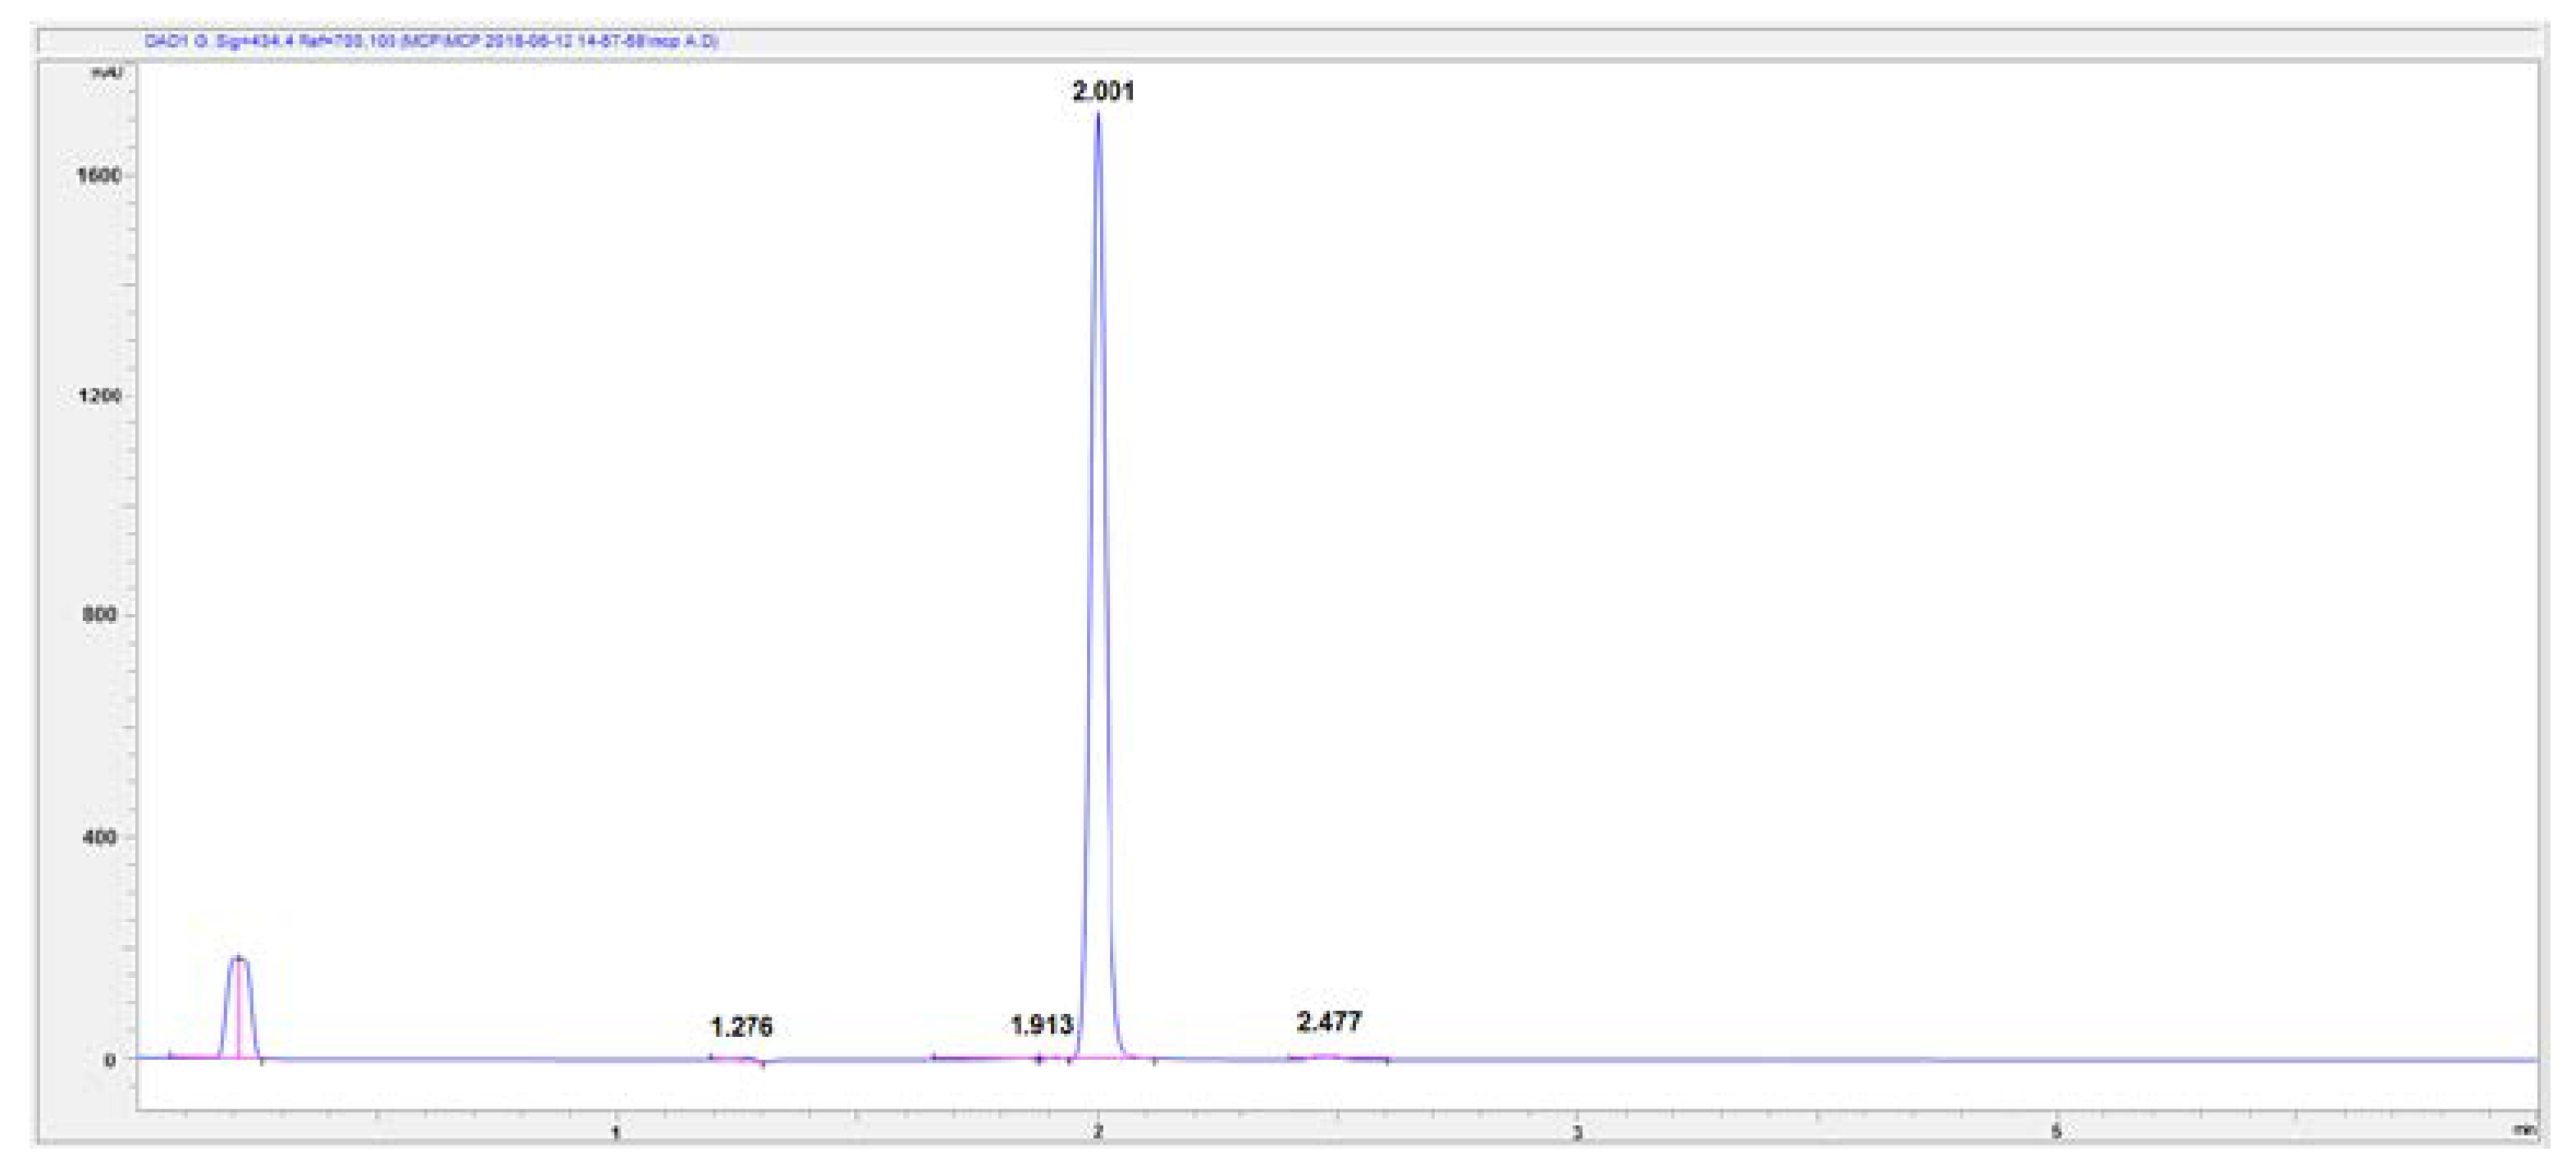
At the beginning of the method setting up, the eluent composition was based on the composition reported by Yao et al. [11] consisting of 70% H2CO2NH4 0.5 M pH 8.0 and 30% CH3CN. Figure 2 shows the chromatogram of the 2.5 mM pH 8.0 mCP standard solution recorded at 434 nm. Two peaks appeared before and after the pure mCP peak, which had a retention time of 2.00 min. The two peaks had a retention time of 1.91 (herein-after referred to impurity 1) and of 2.47 min (herein-after referred to as impurity 2), respectively and a lower area than mCP. The area of the two peaks made up almost 2% of the total signal, thus being able to influence the accuracy of the measure.
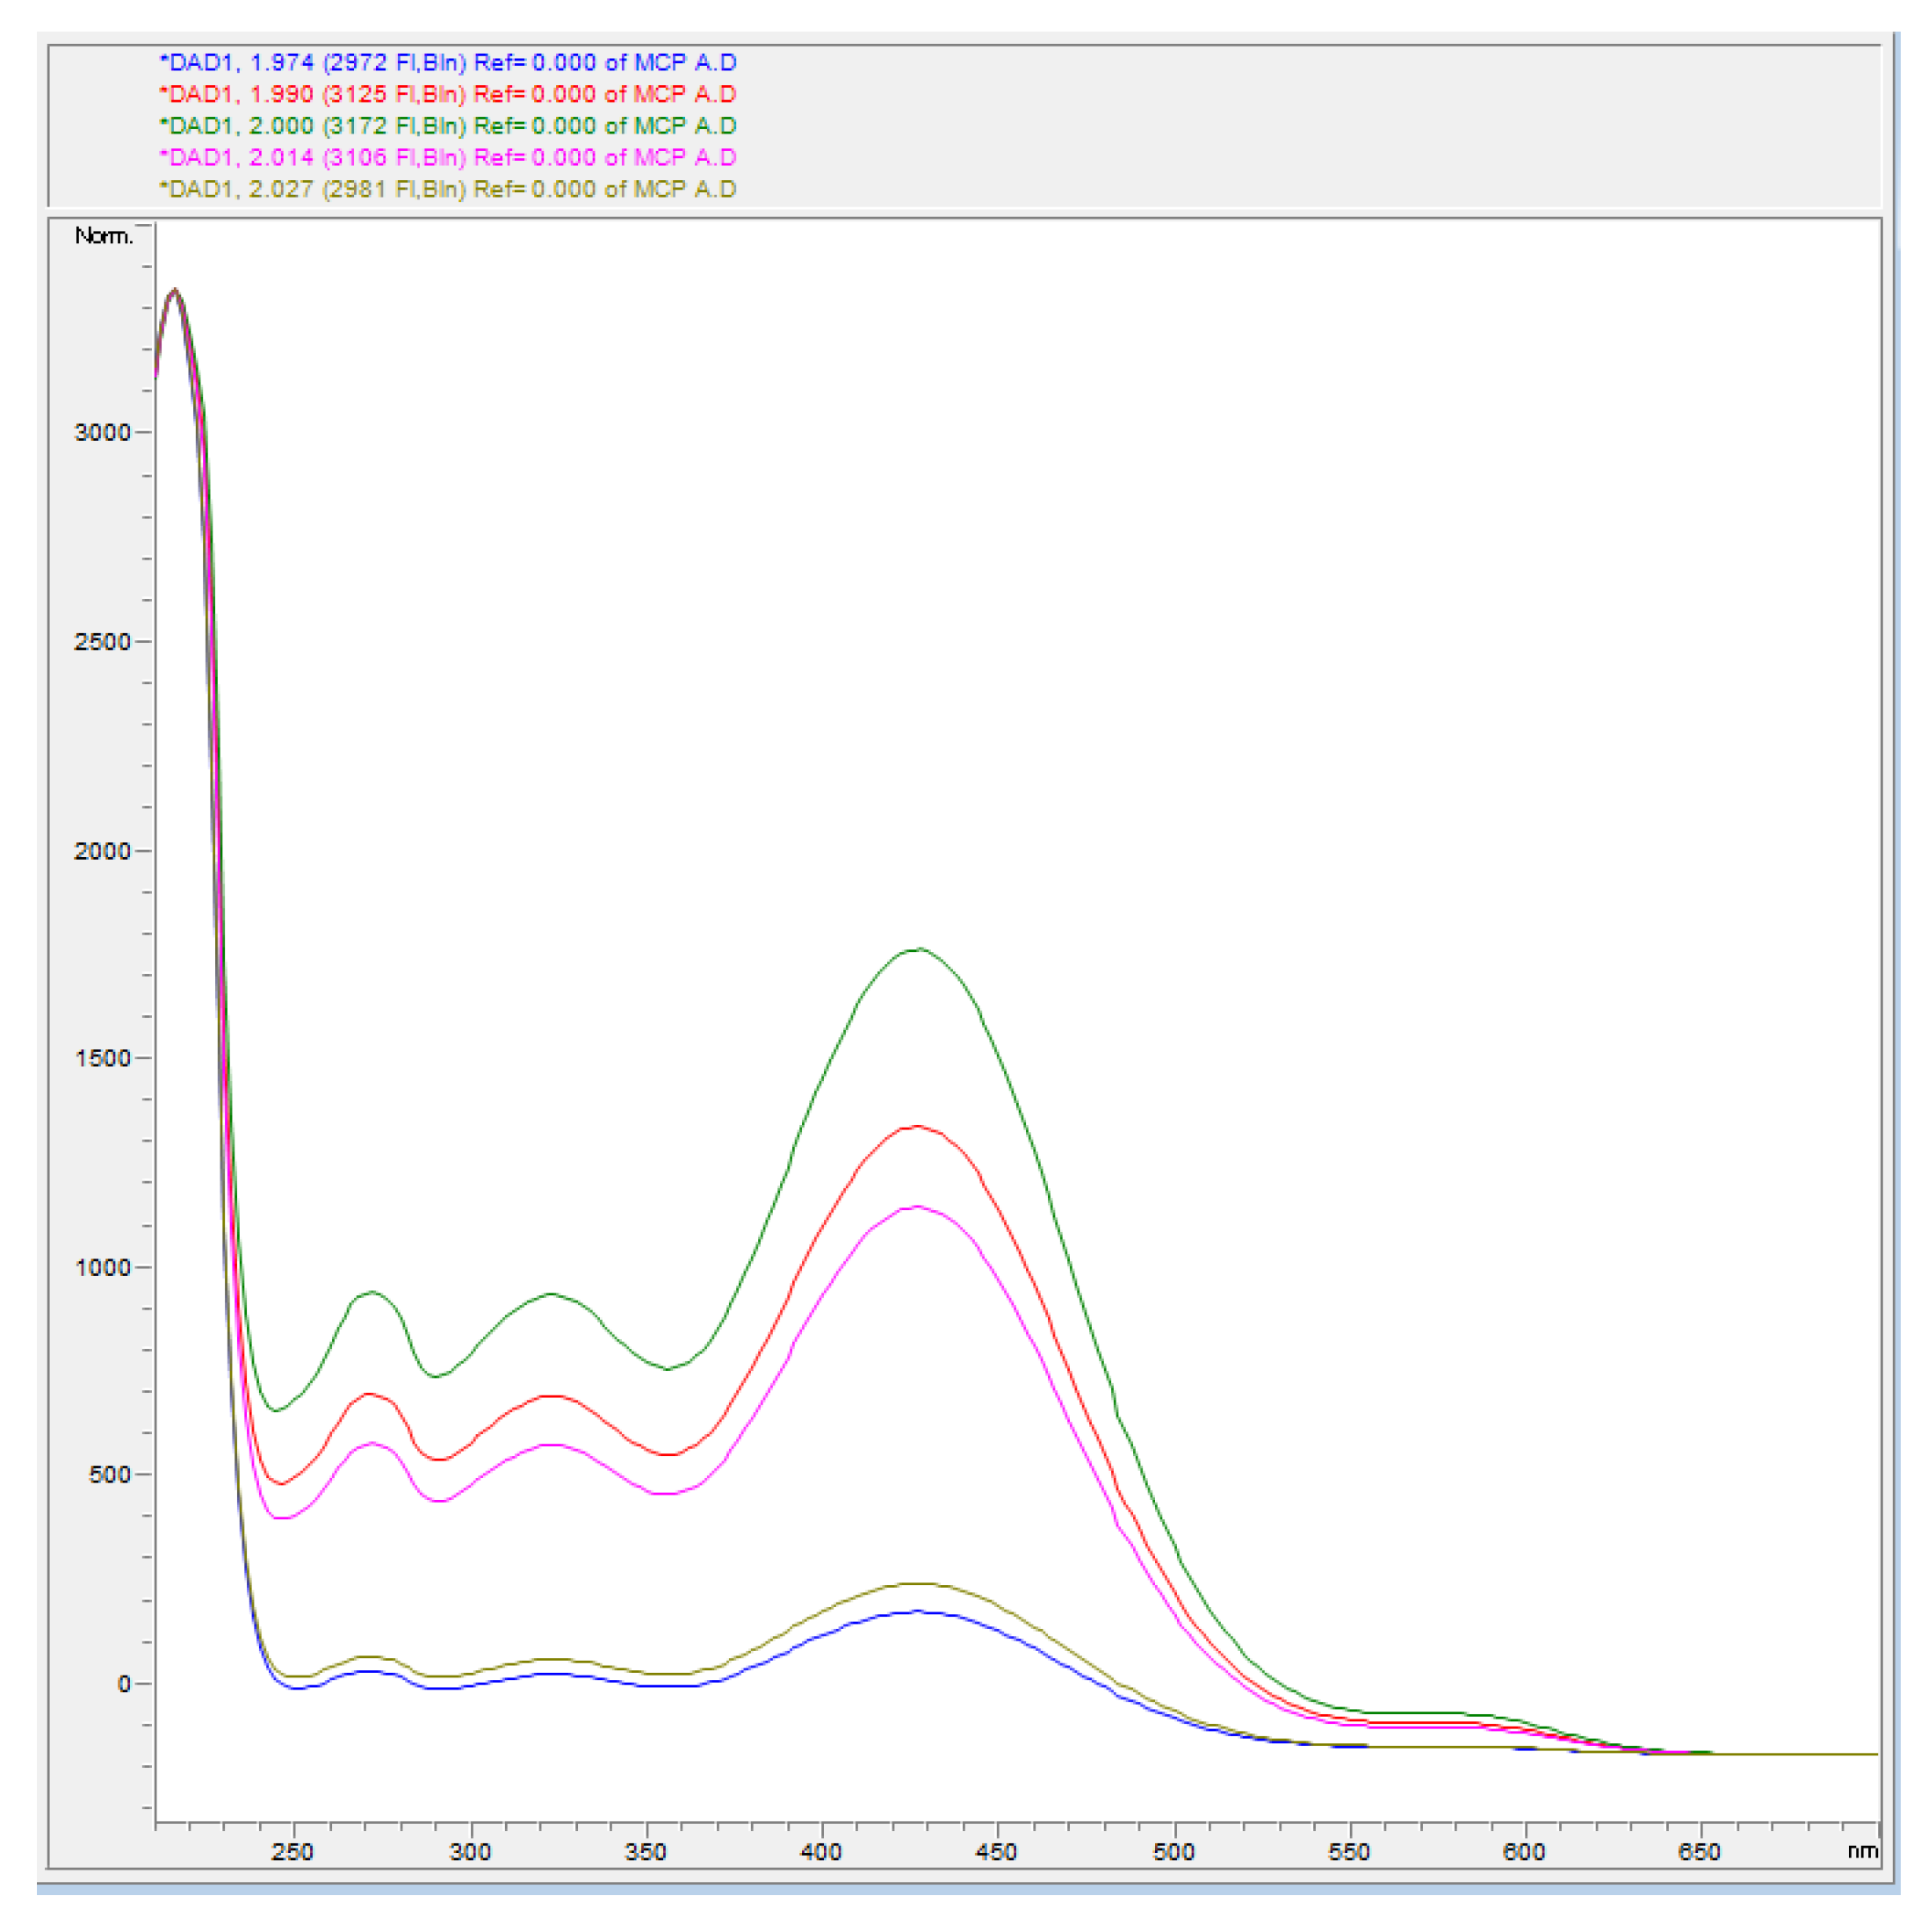
A UV–Vis spectrum (λ range = 250–650 nm) of each peak was recorded, and absorbance spectra were used to establish the occurrence of any spectral interference on mCP signal generated by the impurities. Figure 3 shows the absorbance spectra obtained in different points of the mCP peak. The absorbance spectra were the same, suggesting that the peak represented the pure mCP. Absorption maxima at 270, 320, 420, and 580 nm (lower absorption intensity) were recorded.
Impurity 1 exhibited a small absorption at 270 nm and a maximum at 420 nm, which partially overlaps the mCP signal in the HI- form. Similarly, impurity 2 shows absorptions at 230, 270, 370, and 460 nm, which could affect the spectrophotometric measurement. Both impurities did not absorb at 578 nm, which is the λ at which the absorbance of the I2− species of the mCP is quantified for the determination of R. The results agree with those of Yao et al. [11], who highlighted the presence of impurities both at λ lower and higher than 434 nm, causing a lower calculated R value, and an error in the calculation of the pH of the sea water samples [11].
With our analytical and instrumental conditions, the retention times of both the mCP and the impurities were lower than in Yao et al., who report a retention time of about 6–7 min.
Later, ammonium formate was replaced by ammonium acetate, which has the advantage of a lower cost and a greater availability in laboratories. Figure 4 shows the chromatogram obtained from the injection of a 2.5 mM mCP solution using 70% CH3COONH4 pH 8.0 and 30% CH3CN as mobile phase. The retention times and the absorption spectra of mCP and impurities were comparable to those obtained using ammonium formate. Therefore, the two solvents are interchangeable and CH3COONH4 was used in the following chromatographic runs. However, although the peaks of mCP and impurities were resolved, their retention times were very similar and did not allow the collection of the purified mCP fraction.
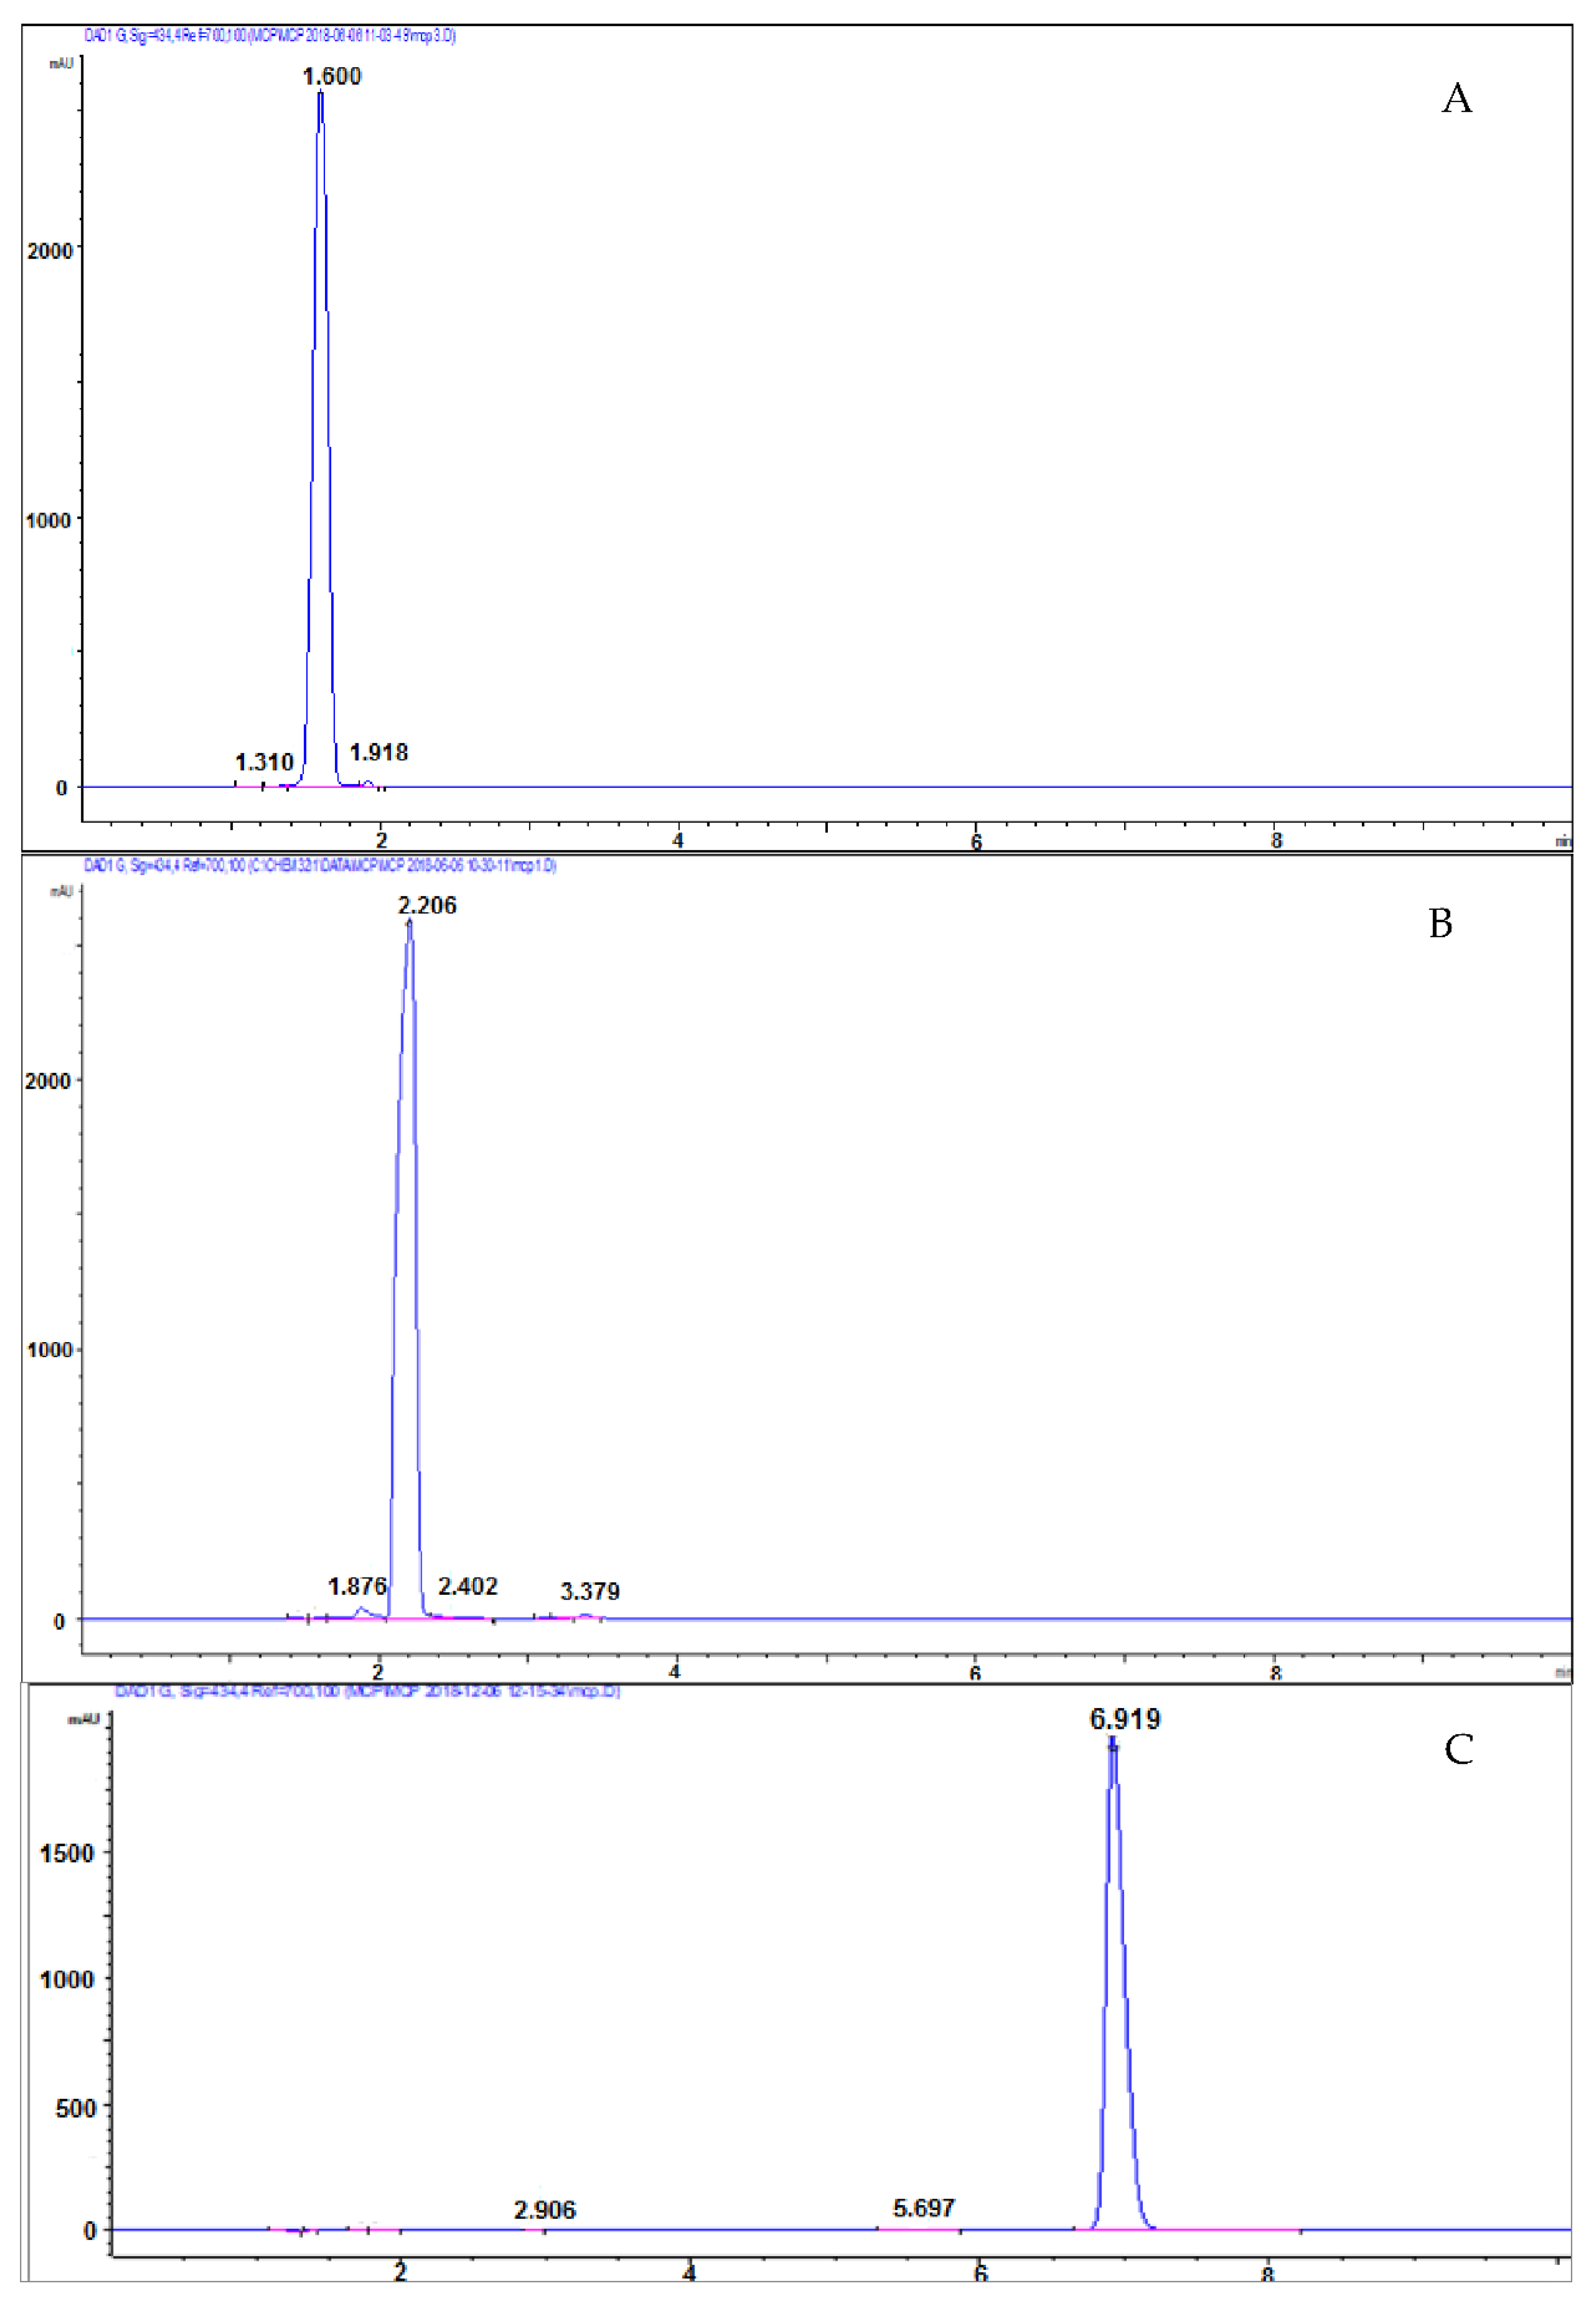
The mobile-phase composition and pH can be a powerful tool to control retention and selectivity; therefore, the CH3COONH4 was varied from 50% to 60% to 80%, while maintaining the pH at 8.0 in the first tests (Figure 5). No significant improvements in peak resolution were observed at either 50 or 60% conditions, but separation improved when 80% CH3COONH4 was used. Under these conditions, the retention time of the mCP and of the impurity 1 changed significantly (6.92 min and 5.59 min, respectively). The mCP peak is well shaped, spaced and efficiently separated from impurity 1, allowing the collection of the purified mCP. Impurity 1 represents the 0.26% of the total area of the chromatogram, whereas. the impurity 2 is not present. From spectral analyses, we can exclude that impurity 2 is coeluted with mCP because the spectrum corresponds to that of pure indicator.
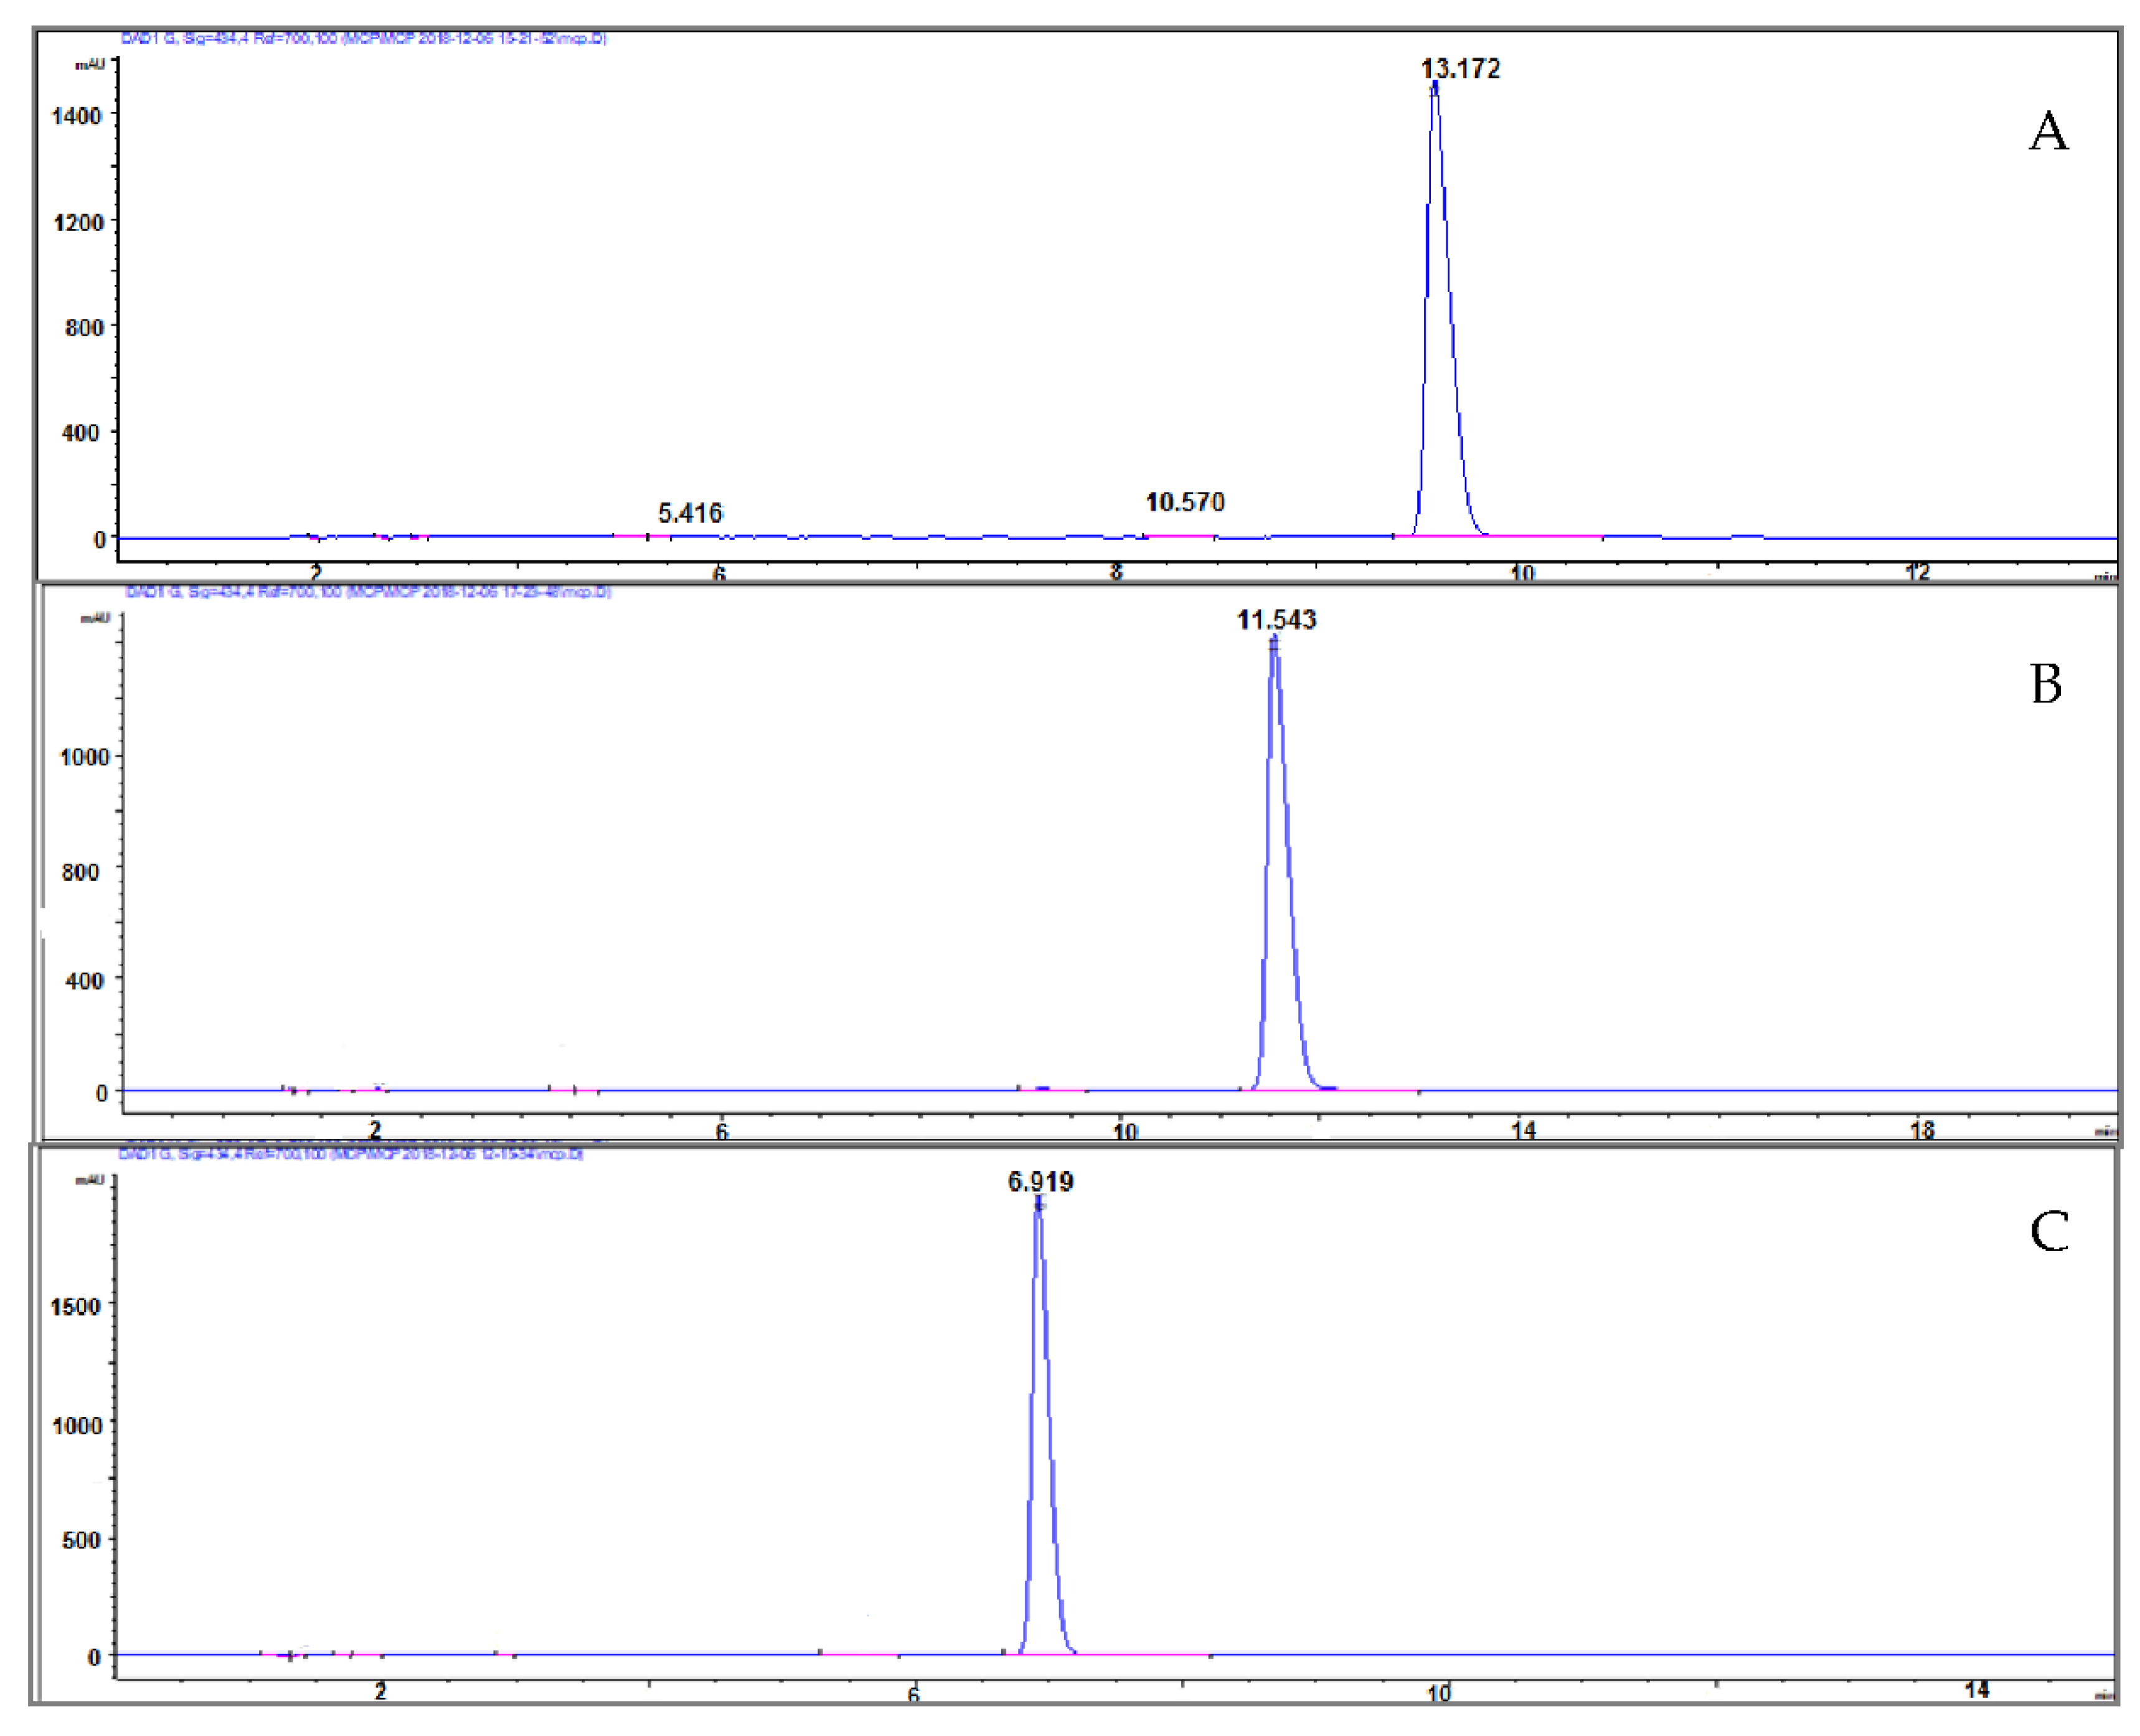
The pH of the mobile phase can be an extremely powerful tool to move peaks around in the chromatogram during method development. As expected, (Figure 6) the mCP retention time varied significantly, and the pH of the mobile phase 8.0 was the best because of the lower analyses time required than at pH 7 (13.17 min) and at pH 7.5 (11.54 min).
Traditional HPLC methods consume large amounts of organic solvents. The high ecological impact of using these solvents, from their production and to their waste disposal, encouraged the analytical community to search for solutions to replace these polluting methods with clean ones. Therefore, minimizing the amount of organic solvents used without reducing in chromatographic performance was an important step during the development of our method towards greening analytical methodologies.
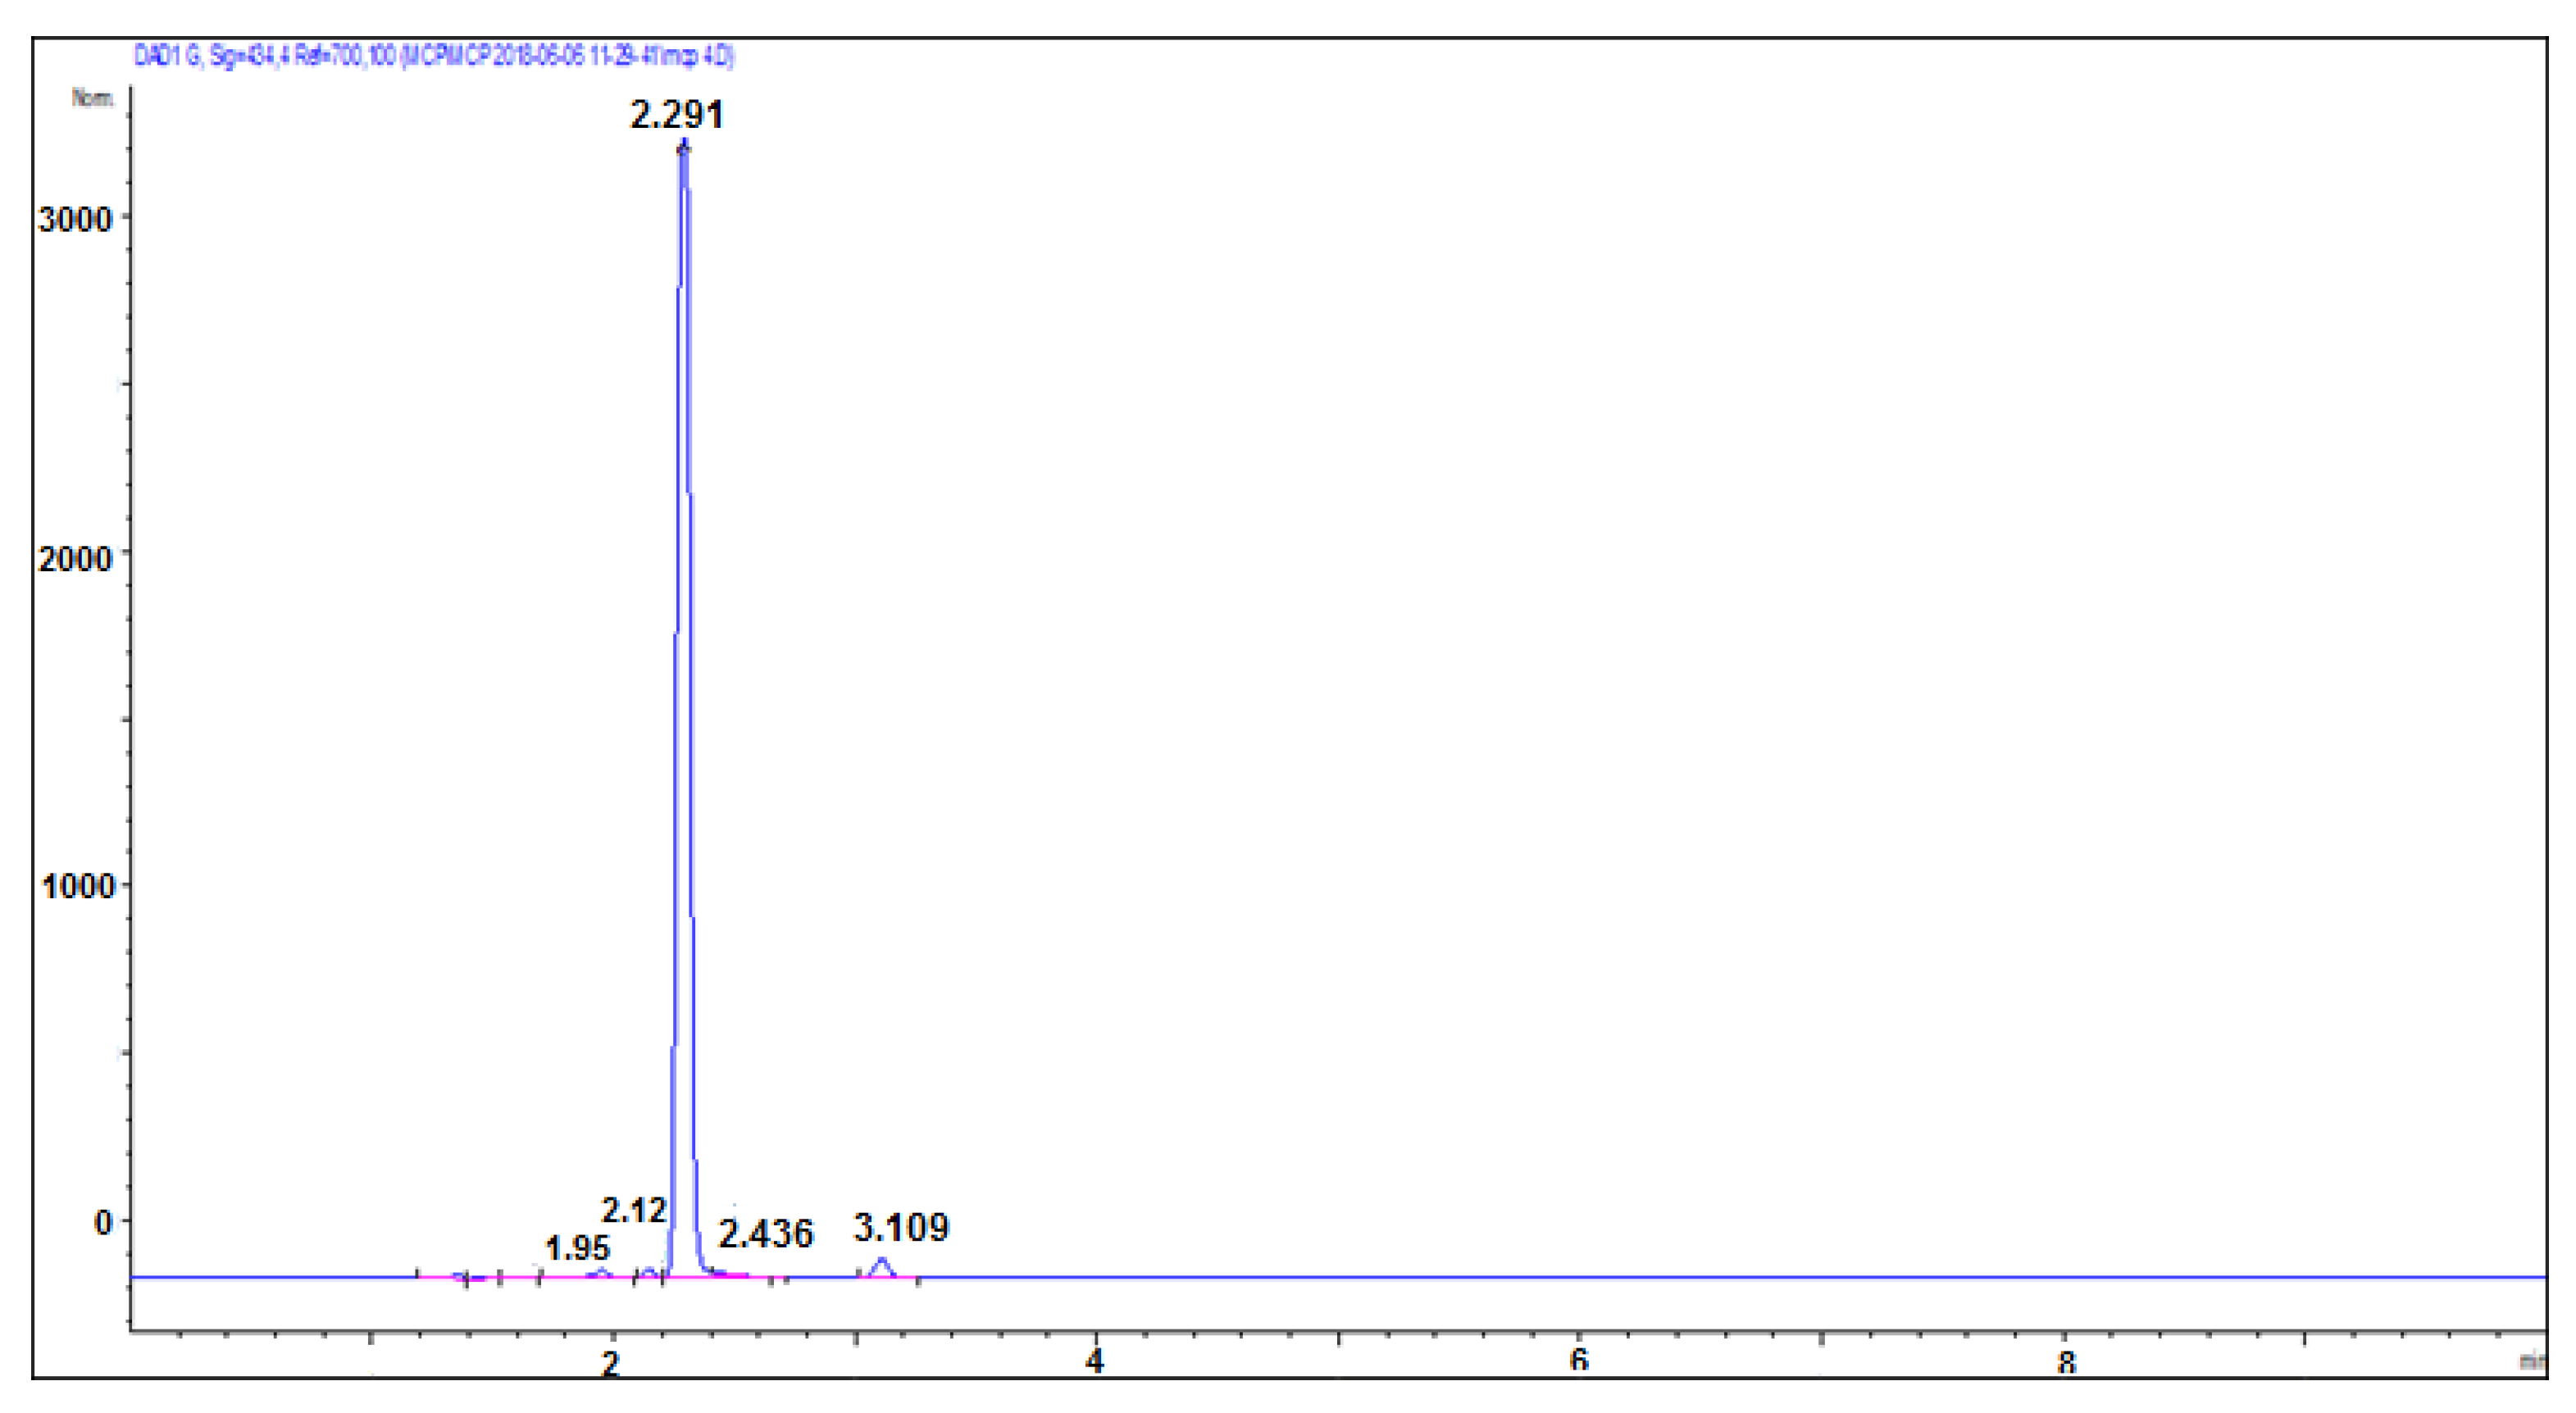
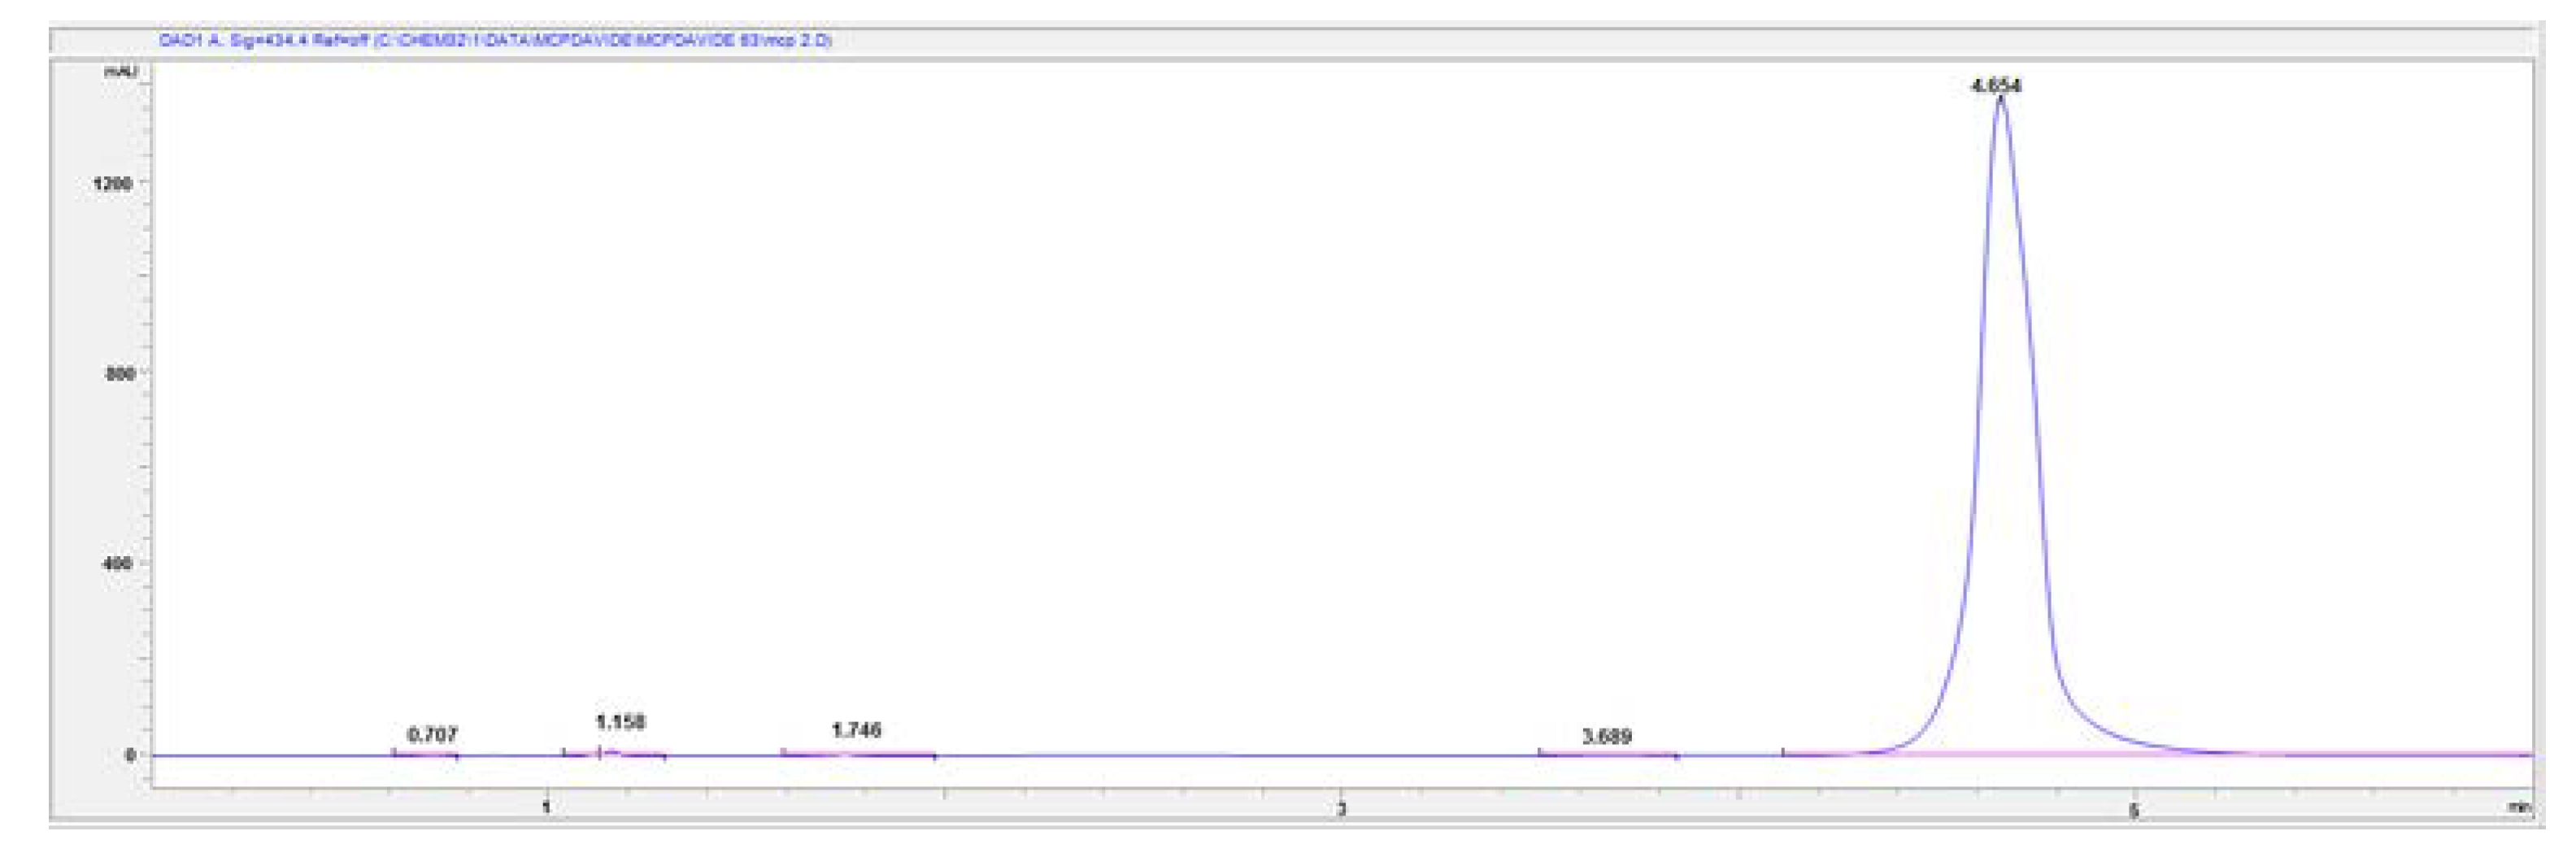
For these reasons and to solve problems encountered during the preconcentration procedure of the purified mCP (cfr. Section 3.2), a mobile phase consisting of 85% Milli-Q water and 15% CH3CN was employed. The pH of the mobile phase was adjusted to 8.0 and the chromatogram reveals good selectivity and sensitivity: mCP peak is well resolved from Impurity 1 and its retention time is shorter than when the previous mobile phase was used. Nevertheless, the composition of the mobile phase affects column efficiency, which in turn affects the symmetry and peak shape. However, we must compromise between run time and peck shape and for the goal of this research the obtained results were satisfying. This combination was selected as the final mobile phase to obtain a rapid and simple assay method for mCP with a reasonable run time (10 min) and suitable retention time (4.65 ± 0.005 min) (Figure 7). This makes it possible to overcome the problem that commercially purified mCP is only available in limited quantities and it is only provided upon specific request.
Finally, our mCP purification method when compared with those already reported in literature [11] has the advantage of being faster and allowing a lower consumption of organic solvents.
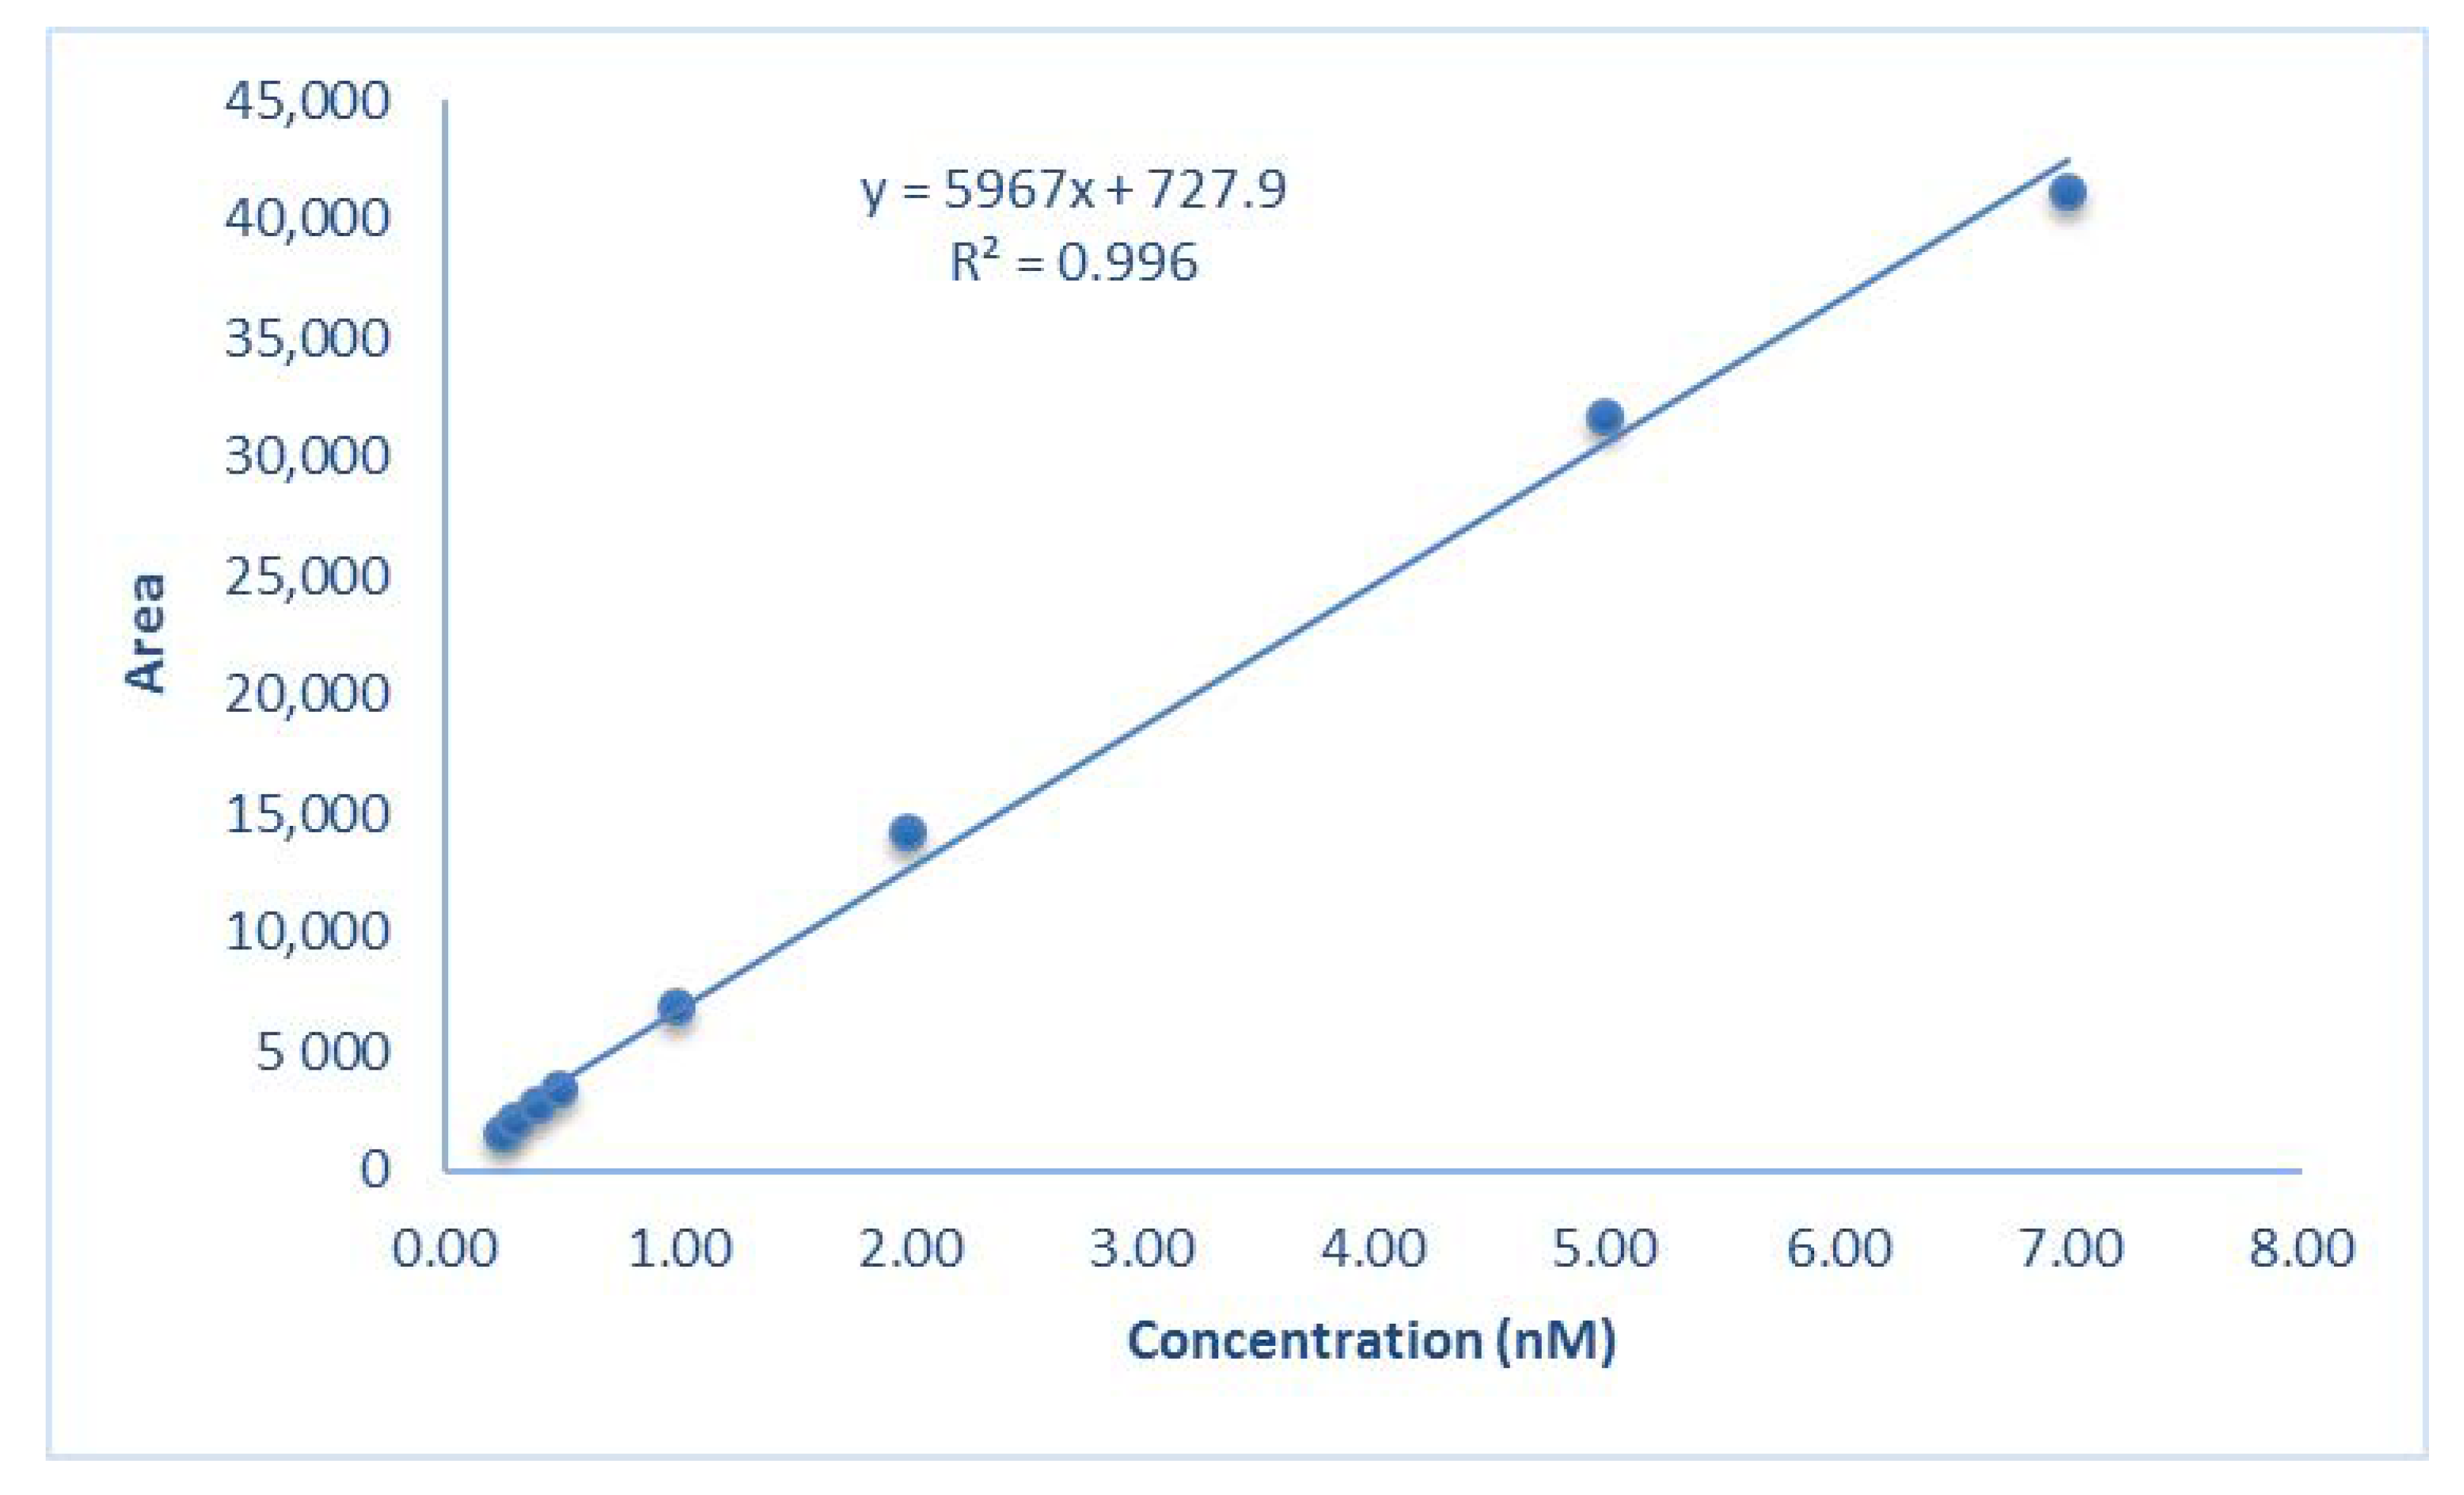
The final HPLC conditions are reported in Table 2. In the validation of the purification method the following parameters were determined: linearity, resolution, and precision. The linearity between peak area and concentration was determined using calibration curves obtained with mCP standard solutions at nine different concentrations from 0.1 to 7 mM. The high correlation coefficient R2 = 0.996 showed that responses in the examined concentration range were linear at both λ 434 (Figure 8) and 578 nm. The resolution (R) was calculated as the difference in the retention time between the impurity 1 and mCP peak divided by the combined widths of the peaks. The calculated R (5.1) exceeds the R threshold value of 1.5 that represents the complete separation of two neighboring solutes. The precision of the method was investigated using two repeatability and interday variations. To assess the repeatability, the sample was injected five times within a day. The interday precision was determined with the mCP assayed on different days. The repeatability displays a coefficient of variation less than 5% (2.5%), and there was no significant difference between interday results, suggesting that the precision was satisfactory.
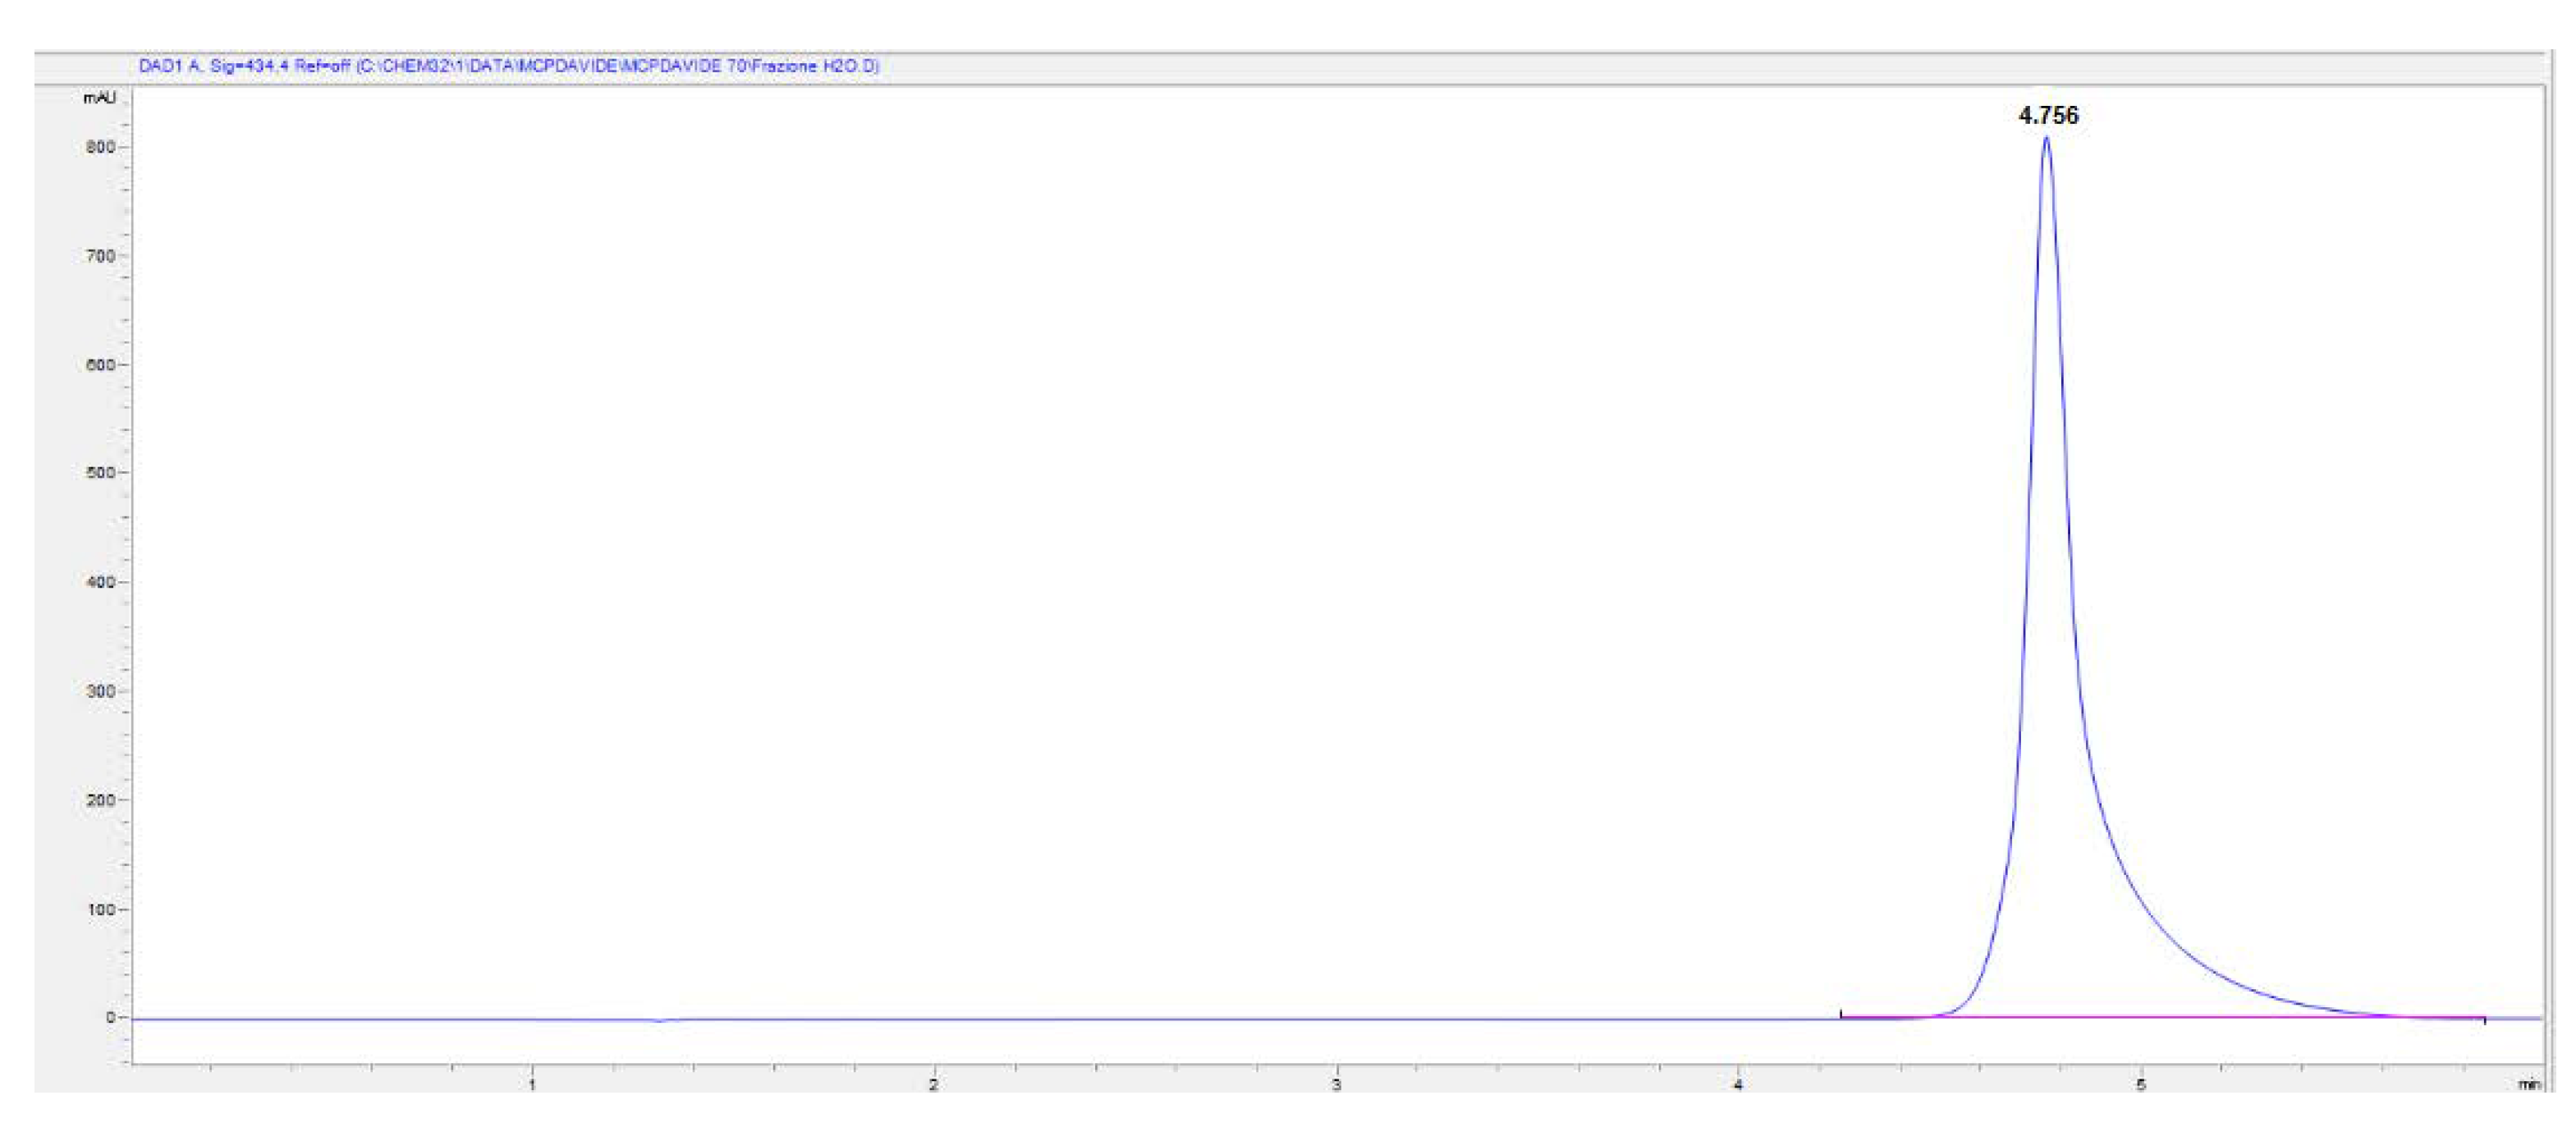
Figure 9 shows the chromatogram of a purified mCP. Only the mCP peak is present, indicating that the contamination components were successfully separated out.
Douglas and Byrne [1] suggest using the standard solutions within a few weeks of preparation to avoid microbial contamination. Thus, the stability over the time of the mCP was evaluated. The same working solution was analyzed immediately after preparation and after 7 and 30 days, keeping it at room temperature and in the dark. The results showed a high stability of mCP over time since the presence of new impurities was not detected.
3.2. mCP Preconcentration Procedure
First tests were carried out using purified mCP obtained with 80% CH3COONH4 0.5 M pH 8.0 and 20% CH3CN as HPLC mobile phase. Lyophilized mCP was redissolved in 100 µL of NaCl 0.5 M, then 90 µL were added to the seawater sample. Unfortunately, the addition of the indicator did not lead to the expected color variation. The sample assumed a light orange color instead of a red/purple one, thus not leading to the correct variation of the absorbance at the three wavelengths. The same problem was encountered for the redissolved mCP aliquots after preconcentration by rotary evaporation. The mCP solutions showed a slightly acidic pH (~5), suggesting that both techniques caused an alteration of the dye solutions. In fact, if dehydrated CH3COONH4 (component of the mobile phase) leads to the formation of acetamide [19], resulting in a lowering of the pH that compromises the resulting spectrophotometric pH evaluation. Conversely, the SPE procedure was effective in the removal of CH3COONH4 salts and in preconcentrating the mCP. However, this greatly lengthens the preparation time of the purified mCP solutions and, furthermore, the extraction yields were rather low (~12%), due to the solubility of the mCP in water.
The pH of the dye solution was preserved when the composition of the HPLC mobile phase was changed to water and CH3CN. The aliquots of purified mCP were mixed and evaporated by rotary evaporator, which was the fastest preconcentration procedure among those considered in this study. The use of these conditions was therefore efficient to obtain purified mCP for the spectrophotometric determination of pH in seawater samples.
The purified mCP was dissolved in 0.7 M NaCl solution adjusting the pH to approximately 8.0 to reduce the perturbation effect once it was added to sea water samples. A 1.3 mM solution was prepared, and this allowed a small volume addition of the dye indicator to the samples.
3.3. Spectrophotometric Measurements of TRIS Buffer and Sea Water Samples
pH was measured in five aliquots of TRIS buffer using both purified and unpurified mCP. The average pH values were 8.058 ± 0.006 and 8.031 ± 0.006, respectively. They were significantly different (t-test, 95% confidence level), confirming that the impurities present in the used commercial mCP influenced the final pH result and highlighting the importance of a purification procedure to obtain accurate results in the spectrophotometric pH analysis. Because a sample’s calculated pH is directly related to the ratio of λ 578 and 434 nm, these impurities lower the apparent sample pH. According to Yao et al., 2007 [11] this effect is most pronounced at pH higher than 8.0. Moreover, the average standard deviation showed that the spectrophotometric pH method had a very high level of precision. Furthermore, the spectrophotometric pH determination has a higher sensitivity than the potentiometric method. This figure of merit is very important when pH measurements are employed for the evaluation of the ocean acidification.
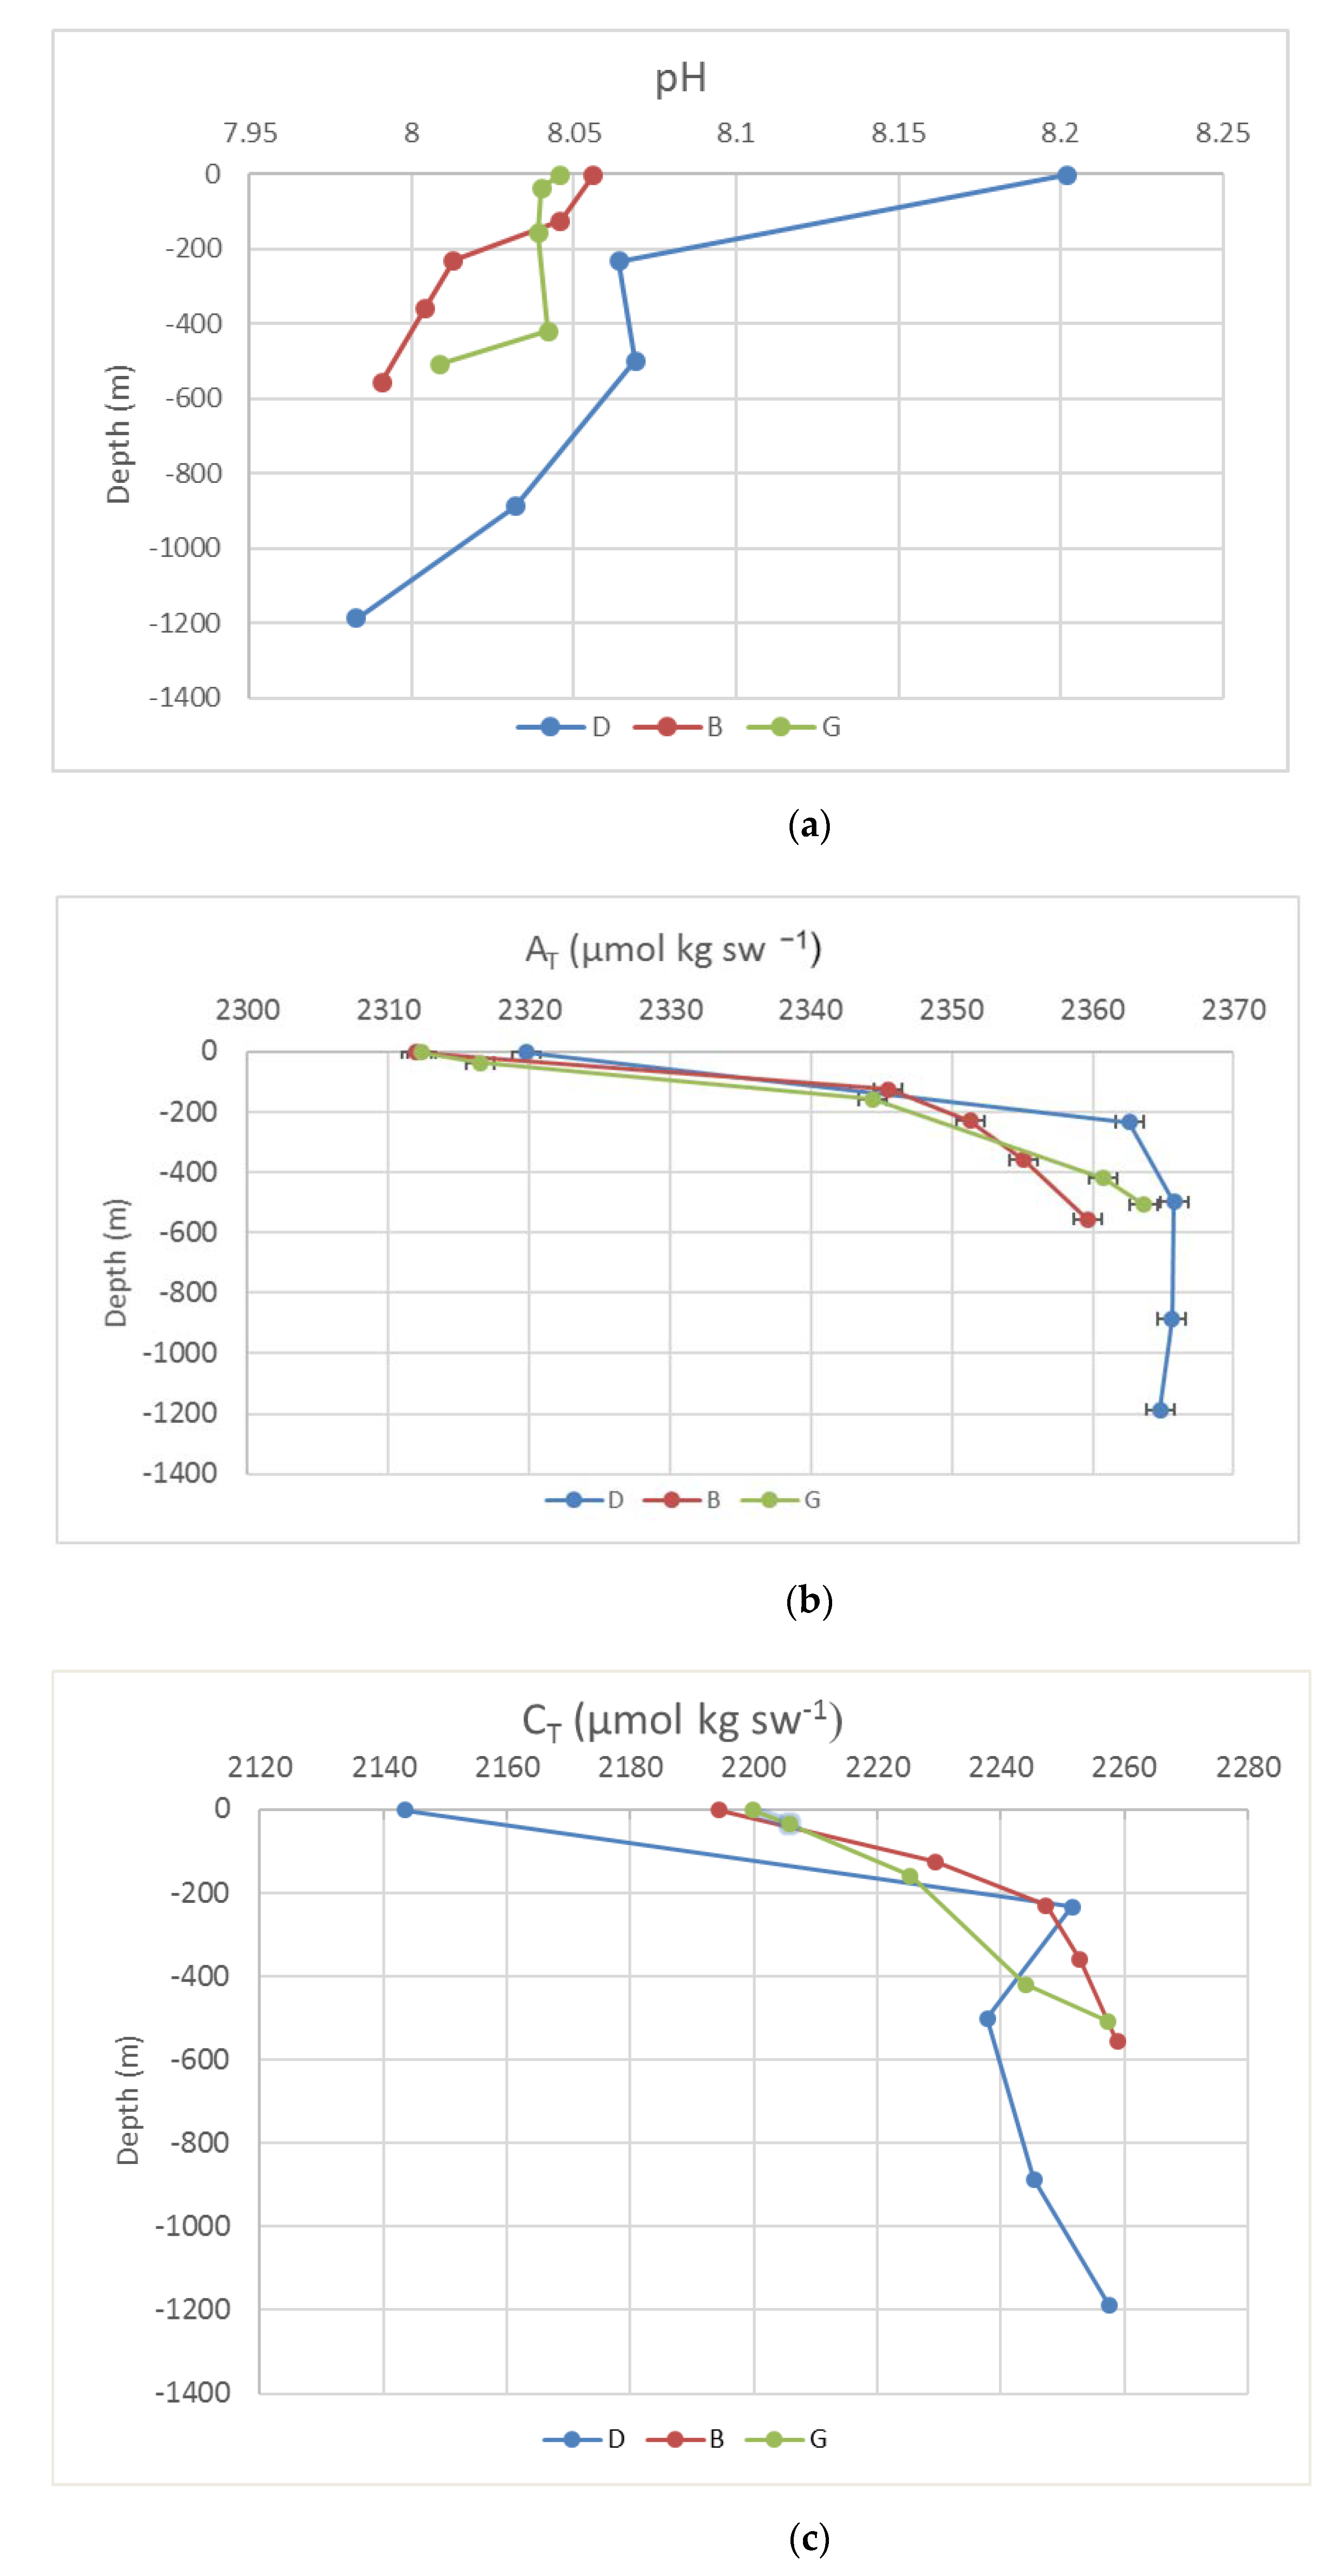
Our HPLC and preconcentration procedures are suitable for obtaining sufficient amounts of purified mCP to analyze a fair number of samples in a relatively short time. In this regard, sea water samples collected in the Ross Sea (Antarctica) were analyzed. To our knowledge this is the first data set of spectrophotometric pH measurement for that region. A general increase in depth was observed for AT and CT, and a decrease for pH was also detected (Figure 10). At mid-depths (300–500 m), a decreasing pH gradient was observed from the shelf area to offshore, in correspondence with the Circumpolar Deep Water (CDW) intrusion. All samples were oversaturated with respect to both the calcite and the aragonite. These patterns are largely in keeping with other measurements collected during the summer season in the Ross Sea [20]. pH ranged between 8.202 and 7.983. The highest values referred to the sample collected at the surface in station D, where a rather low concentration of CT (2145.3 μmol kgSW−1) and high values of O2 and fluorescence (data not reported in this paper) were also measured. All these observations suggest that photosynthetic activity acts as a driver of carbonate system parameters. This is consistent with the fact that D is moored in Terra Nova Bay polynya, a neighboring coastal system that supports high primary productivity with implications for regional and basin scale Ross Sea biogeochemistry [21,22,23].
4. Conclusions
In this study, a High-Performance Liquid Chromatography-Diode Array Detector (HPLC-DAD) method for rapid and simple purification of small batches of mCP for use in high-precision sea water pH measurements was established. The reduction of the percentage of organic solvent in the composition of the mobile phase compared to that of other procedures improves the environmental friendliness of the analytical method.
Due to the potential pH inaccuracies introduced by dye impurities, it is necessary to use a purified indicator for oceanic CO2 system characterizations. In our study, we verified that the impurities contributed to pH offsets as large as 0.027 pH units in TRIS buffer. Therefore, the application of our method substantially improves the quality of pH analyses obtained using unpurified mCP. Our data evidenced a high stability of mCP over one month; for this reason, there is no need to prepare fresh solutions of mCP for each application. Although the spectrophotometric method may be more time-consuming and less portable than the potentiometric method, it is more sensitive, allowing a better evaluation of the ocean acidification, particularly in those fragile areas such as the Southern Ocean. The scale-up of the chromatographic method will be the development of this work to obtain a large amount of purified mCP for wide measurements of Antarctic seawater samples, combining the pH with CT or AT measurements to accurately predict the inorganic carbon speciation dependent on the increase of the atmospheric CO2.
Author Contributions
Conceptualization, P.R. and C.I.; methodology, P.R. and D.V.; validation, P.R. and D.V.; formal analysis, D.V.; investigation, P.R., D.V., C.I. and P.F.; resources, P.R., D.V. and P.F.; data curation, P.R. and D.V.; writing—original draft preparation P.R. and D.V.; writing—review and editing, P.R., D.V., C.I. and P.F.; visualization, P.R., D.V., C.I. and P.F.; supervision, P.R. and P.F.; project administration, P.R. and P.F.; funding acquisition, P.R. and P.F. All authors have read and agreed to the published version of the manuscript.
Funding
This research was funded by the Italian “Programma Nazionale di Ricerche in Antartide” (PNRA), grant number PNRA_18_00258.
Institutional Review Board Statement
Not applicable.
Informed Consent Statement
Not applicable.
Data Availability Statement
The data access is restricted until the end of the project, but they are available upon request made to the PI or to the co-PIs (Enrico Zambianchi [email protected]; Pierpaolo Falco [email protected]; Paola Rivaro [email protected]).
Acknowledgments
The authors are most grateful to Captain Franco Sedmak, the officers, and the crew of R/V Laura Bassi. Thanks to the MORSea (Marine Observatory in the Ross Sea) project for providing us with the CTD data. Thanks to Diana Zerilli and Tony Costante for English revision. The comments and the suggestions of the two anonymous referees were greatly appreciated and improved this paper.
Conflicts of Interest
The authors declare no conflict of interest.
References
- Douglas, N.K.; Byrne, R.H. Achieving accurate spectrophotometric pH measurements using unpuri fi ed meta-cresol purple. Mar. Chem. 2017, 190, 66–72. [Google Scholar] [CrossRef]
- Bockmon, E.E.; Dickson, A.G. An inter-laboratory comparison assessing the quality of seawater carbon dioxide measurements. Mar. Chem. 2015, 171, 36–43. [Google Scholar] [CrossRef]
- The Royal Society. Ocean Acidification Due to Increasing Atmospheric Carbon Dioxide; The Royal Society: London, UK, 2005. [Google Scholar]
- Sabine, C.L.; Feely, R.A.; Gruber, N.; Key, R.M.; Lee, K.; Bullister, J.L.; Wanninkhof, R.; Wong, C.S.; Wallace, D.W.R.; Tilbrook, B.; et al. The Oceanic Sink for Anthropogenic CO2. Science 2004, 305, 367–371. [Google Scholar] [CrossRef] [PubMed] [Green Version]
- Orr, J.C.; Fabry, V.J.; Aumont, O.; Bopp, L.; Doney, S.C.; Feely, R.A.; Gnanadesikan, A.; Gruber, N.; Ishida, A.; Joos, F.; et al. Anthropogenic ocean acidification over the twenty-first century and its impact on calcifying organisms. Nature 2005, 437, 681–686. [Google Scholar] [CrossRef]
- McNeil, B.I.; Matear, R. Southern Ocean acidification: A tipping point at 450 ppm atmospheric CO2. Proc. Natl. Acad. Sci. USA 2008, 105, 18860–18864. [Google Scholar] [CrossRef] [PubMed] [Green Version]
- Byrne, R.; Robert-Baldo, G.; Thompson, S.; Chen, C. Seawater pH measurements: An at-sea comparison of spectrophotometric and potentiometric methods. Deep Sea Res. Part A. Oceanogr. Res. Pap. 1988, 35, 1405–1410. [Google Scholar] [CrossRef]
- Dickson, A.G.; Sabine, C.L.; Christian, J.R. Guide to Best Practices for Ocean CO2 Measurements; North Pacific Marine Science Organization: Sidney, BC, Canada, 2007. [Google Scholar]
- Clayton, T.D.; Byrne, R.H. Spectrophotometric seawater pH measurements: Total hydrogen ion concentration scale calibration of m-cresol purple and at-sea results. Deep Sea Res. Part I Oceanogr. Res. Pap. 1993, 40, 2115–2129. [Google Scholar] [CrossRef]
- Lai, C.; DeGrandpre, M.D.; Wasser, B.D.; Brandon, T.A.; Clucas, D.S.; Jaqueth, E.J.; Benson, Z.D.; Beatty, C.M.; Spaulding, R.S. Spectrophotometric measurement of freshwater pH with purified meta-cresol purple and phenol red. Limnol. Oceanogr. Methods 2016, 14, 864–873. [Google Scholar] [CrossRef]
- Yao, W.; Liu, X.; Byrne, R.H. Impurities in indicators used for spectrophotometric seawater pH measurements: Assessment and remedies. Mar. Chem. 2007, 107, 167–172. [Google Scholar] [CrossRef]
- Liu, X.; Patsavas, M.C.; Byrne, R.H. Purification and Characterization of meta-Cresol Purple for Spectrophotometric Seawater pH Measurements. Environ. Sci. Technol. 2011, 45, 4862–4868. [Google Scholar] [CrossRef] [PubMed]
- Patsavas, M.C.; Byrne, R.H.; Liu, X. Purification of meta-cresol purple and cresol red by flash chromatography: Procedures for ensuring accurate spectrophotometric seawater pH measurements. Mar. Chem. 2013, 150, 19–24. [Google Scholar] [CrossRef]
- Gałuszka, A.; Migaszewski, Z.; Namiesnik, J. The 12 principles of green analytical chemistry and the significance mnemonic of green analytical practices. Trends Anal. Chem. 2013, 50, 78–84. [Google Scholar] [CrossRef]
- 2007, p. 16. Available online: http://www.goa-on.org/documents/kits/ph_determination_manual.pdf (accessed on 25 September 2021).
- Rivaro, P.; Messa, R.; Massolo, S.; Frache, R. Distributions of carbonate properties along the water column in the Mediterranean Sea: Spatial and temporal variations. Mar. Chem. 2010, 121, 236–245. [Google Scholar] [CrossRef]
- Pierrot, D.; Lewis, E.; Wallace, D.W.R. MS Excel Program Developed for CO2 System Calculations, ORNL/CDIAC-105; Carbon Dioxide Information Analysis Center, Oak Ridge National Laboratory, U.S. Department of Energy: Oak Ridge, TN, USA, 2006.
- Millero, F. The Marine Inorganic Carbon Cycle. Chem. Rev. 2007, 107, 308–341. [Google Scholar] [CrossRef]
- Coleman, G.; Alvarado, A. Acetamide. In Organic Syntheses; Wiley: Hoboken, NJ, USA, 2003; p. 3. [Google Scholar]
- Rivaro, P.; Ianni, C.; Raimondi, L.; Manno, C.; Sandrini, S.; Castagno, P.; Cotroneo, Y.; Falco, P. Analysis of Physical and Biogeochemical Control Mechanisms on Summertime Surface Carbonate System Variability in the Western Ross Sea (Antarctica) Using In Situ and Satellite Data. Remote Sens. 2019, 11, 238. [Google Scholar] [CrossRef] [Green Version]
- Rivaro, P.; Abelmoschi, M.L.; Grotti, M.; Ianni, C.; Magi, E.; Margiotta, F.; Massolo, S.; Saggiomo, V. Combined effects of hydrographic structure and iron and copper availability on the phytoplankton growth in Terra Nova Bay Polynya (Ross Sea, Antarctica). Deep. Res. I 2012, 62, 97–110. [Google Scholar] [CrossRef]
- Rivaro, P.; Ianni, C.; Langone, L.; Ori, C.; Aulicino, G.; Cotroneo, Y.; Saggiomo, M.; Mangoni, O. Physical and biological forcing of mesoscale variability in the carbonate system of the Ross Sea (Antarctica) during summer 2014. J. Mar. Syst. 2017, 166, 144–158. [Google Scholar] [CrossRef]
- Bolinesi, F.; Saggiomo, M.; Ardini, F.; Castagno, P.; Cordone, A.; Fusco, G.; Rivaro, P.; Saggiomo, V.; Mangoni, O. Spatial-Related Community Structure and Dynamics in Phytoplankton of The Ross Sea, Antarctica. Front. Mar. Sci. Sect. Mar. Ecosyst. Ecol. 2020, 7, 1092. [Google Scholar]
Figure 1.
(A): Map of Ross Sea; (B): position of sampled stations in Ross Sea area.

Figure 2.
High-Performance Liquid Chromatography-Diode Array Detector (HPLC-DAD) chromatogram of 2.5 mM mCP standard solution detected at 434 nm wavelength. Eluent composition: 70% H2CO2NH4 0.5 M pH 8.0 and 30% CH3CN.
Figure 2.
High-Performance Liquid Chromatography-Diode Array Detector (HPLC-DAD) chromatogram of 2.5 mM mCP standard solution detected at 434 nm wavelength. Eluent composition: 70% H2CO2NH4 0.5 M pH 8.0 and 30% CH3CN.

Figure 3.
mCP absorption spectra recorded in range of λ = 250–650 nm.

Figure 4.
HPLC-DAD chromatogram of 2.5 mM mCP standard solution detected at 434 nm wavelength. Eluent composition: 70% CH3COONH4pH 8.0 and 30% CH3CN.
Figure 4.
HPLC-DAD chromatogram of 2.5 mM mCP standard solution detected at 434 nm wavelength. Eluent composition: 70% CH3COONH4pH 8.0 and 30% CH3CN.

Figure 5.
HPLC-DAD chromatogram of 2.5 mM mCP standard solution detected at 434 nm wavelength. Eluent composition: (A): 50% CH3COONH4; (B): 60% CH3COONH4; (C): 80% CH3COONH4.
Figure 5.
HPLC-DAD chromatogram of 2.5 mM mCP standard solution detected at 434 nm wavelength. Eluent composition: (A): 50% CH3COONH4; (B): 60% CH3COONH4; (C): 80% CH3COONH4.

Figure 6.
HPLC-DAD chromatogram of 2.5 mM mCP standard solution detected at 434 nm wavelength. Eluent composition: 80% CH3COONH4 and 20% CH3CN; pH: (A): 7.0, (B): 7.5 and (C): 8.0.
Figure 6.
HPLC-DAD chromatogram of 2.5 mM mCP standard solution detected at 434 nm wavelength. Eluent composition: 80% CH3COONH4 and 20% CH3CN; pH: (A): 7.0, (B): 7.5 and (C): 8.0.

Figure 7.
HPLC-DAD chromatogram of 2.5 mM mCP standard solution detected at 434 nm wavelength. Eluent composition: 15% CH3CN and 85% H2O adjusted at pH 8.0.
Figure 7.
HPLC-DAD chromatogram of 2.5 mM mCP standard solution detected at 434 nm wavelength. Eluent composition: 15% CH3CN and 85% H2O adjusted at pH 8.0.

Figure 8.
Calibration curve for mCP at λ 434 nm.

Figure 9.
Chromatogram of 1.3 mM purified mCP.

Figure 10.
Vertical profile of pH, AT, and CT for the stations D, B, and G. (a) pH; (b) AT; (c) CT.


Table 1.
Sampling stations and depths for pH analysis.
| Station | Sampling Date | Latitude (Degrees North) | Longitude (Degrees East) | Depths (m) |
|---|---|---|---|---|
| G | 30 January 2020 | −75.1437 | 164.6573 | 2–234–500–887–1187 |
| B | 5 February 2020 | −73.9832 | 175.0805 | 2–126–231–360–556 |
| D | 5 February 2020 | −72.4105 | 173.0857 | 2–38–159–420–508 |
Table 2.
HPLC-DAD settled conditions.
| Parameter | Settled Condition |
|---|---|
| HPLC column | C18 Agilent Poroshell EC-C18 120 4 μm 4.6 mm |
| Column temperature | 30 ± 1 °C |
| Flow rate | 1 mL/min |
| Injection volume | 10 μL |
| Mobile phase composition | 85% H2O 15% CH3CN pH 8.0 |
| DAD wavelengths | From 250 to 650 nm |
Publisher’s Note: MDPI stays neutral with regard to jurisdictional claims in published maps and institutional affiliations. |
© 2021 by the authors. Licensee MDPI, Basel, Switzerland. This article is an open access article distributed under the terms and conditions of the Creative Commons Attribution (CC BY) license (https://creativecommons.org/licenses/by/4.0/).
Share and Cite
MDPI and ACS Style
Rivaro, P.; Vivado, D.; Falco, P.; Ianni, C. HPLC-DAD Purification and Characterization of Meta-Cresol-Purple for Spectrophotometric Seawater pH Measurements. Water 2021, 13, 3030. https://doi.org/10.3390/w13213030
AMA Style
Rivaro P, Vivado D, Falco P, Ianni C. HPLC-DAD Purification and Characterization of Meta-Cresol-Purple for Spectrophotometric Seawater pH Measurements. Water. 2021; 13(21):3030. https://doi.org/10.3390/w13213030
Chicago/Turabian StyleRivaro, Paola, Davide Vivado, Pierpaolo Falco, and Carmela Ianni. 2021. "HPLC-DAD Purification and Characterization of Meta-Cresol-Purple for Spectrophotometric Seawater pH Measurements" Water 13, no. 21: 3030. https://doi.org/10.3390/w13213030
Note that from the first issue of 2016, this journal uses article numbers instead of page numbers. See further details here.