Effects of Biochar Addition on Rill Flow Resistance


Department of Agricultural, Food and Forestry Sciences, University of Palermo, Viale delle Scienze, Building 4, Palermo 90128, Italy
*
Author to whom correspondence should be addressed.
Water 2021, 13(21), 3036; https://doi.org/10.3390/w13213036
Submission received: 17 September 2021
/
Revised: 25 October 2021
/
Accepted: 27 October 2021
/
Published: 29 October 2021
(This article belongs to the Section Hydraulics and Hydrodynamics)
Abstract
:The development of rills on a hillslope whose soil is amended by biochar remains a topic to be developed. A theoretical rill flow resistance equation, obtained by the integration of a power velocity distribution, was assessed using available measurements at plot scale with a biochar added soil. The biochar was incorporated and mixed with the arable soil using a biochar content BC of 6 and 12 kg m−2. The developed analysis demonstrated that an accurate estimate of the velocity profile parameter Γv can be obtained by the proposed power equation using an exponent e of the Reynolds number which decreases for increasing BC values. This result pointed out that the increase of biochar content dumps flow turbulence. The agreement between the measured friction factor values and those calculated by the proposed flow resistance equation, with Γv values estimated by the power equation calibrated on the available measurements, is characterized by errors which are always less than or equal to ±10% and less than or equal to ±3% for 75.0% of cases. In conclusion, the available measurements and the developed analysis allowed for (i) the calibration of the relationship between Γv, the bed slope, the flow Froude number, and the Reynolds number, (ii) the assessment of the influence of biochar content on flow resistance and, (iii) stating that the theoretical flow resistance equation gives an accurate estimate of the Darcy–Weisbach friction factor for rill flows on biochar added soils.
1. Introduction
Soil erosion is one of the most underrated environmental problems which affect our society, and its importance has been highlighted by many field investigations [1]. The soil formation is a long-lasting process which requires hundreds of years to be ended. The rate of soil erosion in farmland is 10–40 times faster than the rate of soil formation. In addition, landscape protection is often inadequate and interventions to prevent damages due to hydrogeological instability are scarce. About 80% of agricultural land degradation is caused by soil erosion. The Joint Research Centre (JRC) estimated that, in Europe soil, erosion affects over 12 million hectares of land and leads to a €1.25 billion loss in crop productivity [2].
Soil water erosion has both on-site (reduction of soil fertility and productivity) and off-site (river over-sedimentation, reservoir sedimentation and degradation of water quality) impacts [3]. Soil erosion determines nutrient losses, as nitrogen, phosphorus, and potassium, and the decrease of total organic carbon [4]. In areas characterized by a limited or no use of pesticides, as those characterized by organic farming, water pollution or quality degradation is mainly due to soil erosion and leaching of plant nutrients. The capacity of transported sediments to carry chemicals is closely related to their specific surface area, which is in turn largely dependent on organic matter and clay content of the transported particles and aggregates [5]. Soil erosion could contribute to global warming, because CO2 is released to the atmosphere due to the oxidation of enormous amounts of biomass carbon in the soil [6]. Therefore, an incautious and opportunist use of soils results in a declining provision of the soil’s ecosystem services.
Rill erosion is caused by soil particle detachment and transport by channelized flows. As compared to overland flows, rills are characterized by higher flow shear stresses and velocities which lead to an increased sediment yield. Rills are eroded channels, which rapidly change their own morphology, representing a considerable sediment source and determining the majority of sediment transport on hillslopes [7,8]. The transport of soil particles detached by rill flow and delivered from the interrill areas to rills is generally favored by the formation of a rill network [9,10,11,12,13,14,15,16].
Biochar is a solid black and porous material obtained as residue of biomass thermal degradation carried out in partial or total absence of oxygen [17]. When plant residues are thermally degraded in oxygen-starved conditions, up to 60% of the original plant carbon (C) is transformed into biochar. Considering that mineralization of biochar back to CO2 is a long process, its use for improving soil quality also represents a method for temporary CO2 subtraction from the global C cycle and decreases the concentration of CO2 in the atmosphere [18,19]. Lehmann and Joseph [20] have defined biochar as the carbonaceous material, obtained by biomass pyrolysis, which is knowingly used as soil amendment. The European Biochar Foundation [21] reformulated this definition with the following formulation: ”Biochar is a porous, carbonaceous material that is produced by pyrolysis of plant biomasses and is applied in such a way that the contained carbon remains stored as a long-term C sink or replaces fossil carbon in industrial manufacturing. It is not made to be burnt for energy generation”. As biochar is characterized by a very low degradation rate, the prospective effects on the chemical, physical, and biological soil characteristics can last for a long period [22,23].
Many available researches studied the biochemical effects of biochar on amended soil and its impact on crop growth and yield, and its potential ability to C sequestration [22,24]. The incorporation of biochar into the soil determines a modification of its physical and hydraulic properties as bulk density, water retention, hydraulic conductivity, porosity, and penetration resistance [23]. This modification is mainly due to both the highly porous structure and the exposed surface area of the biochar [20]. Castellini et al. [23] tested if biochar is a soil conditioner able to modify the physical and hydraulic properties of a clay soil using five levels of amendments (0–5–10–20–30 g biochar per kg−1 soil) and soil columns which remained in the field for about 30 months until undisturbed soil conditions were reached. Similar hydraulic conductivity values were detected for unamended and amended soils for both saturated and unsaturated hydraulic conductivity at the same pressure head. An appreciable increase of soil water retention was observed only close to water saturation for the highest biochar concentration (30 g kg−1 soil). The highest biochar concentration meaningfully increased the macroporosity and air capacity, and also caused a significant decrease of available water and relative field capacity. The main conclusion of this study was that the biochar addition has the potential to improve the physical properties of soils having low levels of macroporosity.
Jien and Wang [25] tested the influences of different biochar concentrations (0, 2.5 and 5% in weight (g biochar/g total soil × 100)) on the physicochemical and biological properties of long-term cultivated, acidic Ultisol (clay of 43.6%, silt of 40.2% and sand equal to 16.2%). A simulated rainfall event (80 mm h−1) was applied to measure soil loss for all treatments. The authors detected an appreciable reduction of soil loss (50% and 64% at 2.5% and 5% application rates, respectively) in comparison with the non-amended soil. This study demonstrated that the incorporation of biochar into highly weathered soil clearly improved the physical properties of the soil. The formation of macro-aggregates in the biochar-amended soils resulted in the factor to be considered for improving soil conservation strategies.
The effects of biochar application rates and particle sizes on soil erosion processes have yet to be fully identified. Li et al. [26] studied the influence of biochar with different application rates (1%, 3%, 5%, and 7% in weight) and three different biochar particle sizes (2–1, 1–0.25, and <0.25 mm) on soil erosion. The experiments were carried out with a plot (1m length, 0.8m width, 0.4m depth), a silt loam soil (30.2% sand, 60.87% silt and 8.93% clay), a single slope of 27%, and a rainfall intensity of 90 mm h−1. Li et al. [26] detected that lower (1% and 3%) and higher (5% and 7%) biochar application rates were generally able to inhibit and promote soil loss, respectively. The combined application rate of 1% and < 0.25 mm biochar treatment resulted in the optimal combination for reducing runoff and soil loss.
Li et al. [27] used the same experimental layout as Li et al. [26] to investigate the same silt loam soil and applied an apple branch-based biochar. This investigation demonstrated that coarse biochar (1–2 mm size) is retained in the soil better than biochar with smaller particles. Furthermore, the biochar applied at lower rates (less than or equal to 3%) can be a promising amendment to improve degraded loess soils and reduce rapid soil degradation due to soil erosion.
Sadeghi et al. [28] carried out a small plot (0.25 m2) experiment to determine the effects of addition of vinasse-produced biochar on protection against soil erosion on a sandy clay loam soil. The experimental laboratory runs were carried out using an 8 t ha−1 biochar application rate distributed on the surface 24 h or 48 h before the rainfall simulation. A single rainfall intensity of 50 mm h−1 and a constant slope of 20% were used to estimate the effects on soil erosion. The simulation experiments demonstrated that vinasse-produced biochar reduces the runoff volume, soil loss, and sediment concentration rates.
Zhang et al. [29] pointed out that inconsistent results were obtained on the influence of the biochar addition on soil erosion. Recent researches concluded that the addition of biochar to soil may promote [26,30,31] or inhibit [25,28,32,33,34,35] soil erosion. These inconsistences can be explained considering the differences due to the biochar type and its particle size, soil type, biochar addition method (incorporated into the soil or spread over the soil surface), plant growth, and soil physicochemical property changes due to biochar additions.
In particular, the biochar addition method directly affected runoff and sediment production. When the biochar was distributed on the soil surface [28,36] a biochar layer was formed and safeguarded the surficial soil structure, inhibited seal formation, increased infiltration, and avoided soil particle detachment, thus decreasing the total runoff and soil loss. However, distribution of biochar on soil surface as an additive to improve soil quality is impractical due to the high transportability by water of the low-density biochar particles [28]. Biochar distribution on soil surface causes an increased erosion of low-density biochar particles by water and determines less soil loss. Biochar is usually added into the arable soil horizon and thoroughly mixed to improve its properties.
Zhang et al. [29] suggested that biochar addition alters the soil erodibility, which is a variable determined by intrinsic soil properties and describing the resistance of soil to erosive phenomena. The soil properties affecting interrill erodibility might change in dependence of biochar application and, consequently, a variation of soil erodibility could exhaustively describe the role of biochar addition against erosive phenomena. Zhang et al. [29] carried out some experiments by using small perforated metal boxes (0.45 m long, 0.3 m wide, and 0.10 m deep) having a slope gradient of 17%. Simulated rainfall events, characterized by four intensities (25, 50, 75, and 100 mm h−1), were sequentially applied in each run to detect the effect of biochar application at different rainfall intensities and determine interrill erodibility. The experimental setup envisaged three biochar application rates (2%, 5%, and 8% by weight) and two incubation periods of biochar-added soil (no incubation and a 140-day incubation).
The addition of biochar to the investigated clay loam soil reduced the soil bulk density and soil strength, delayed the formation of a seal, and reduced the soil compactness [33,37,38], suggesting that the protection of biochar-added soil against the erosive action becomes lower as compared to soil without biochar.
The interrill erodibility of the soil with no biochar was appreciably lower as compared to the biochar-added soil. Biochar addition increased interrill erodibility by 20–30%. No substantial differences in interrill erodibility were detected among the biochar-added treatments [29].
Since rill erosion depends on rill flow characteristics [39], a key to model rill erosion processes is to determine hydraulic variables as flow discharge Q, water depth h, mean flow velocity V, and roughness coefficient [40,41]. Rill morphology is determined by the modification of width, depth, and bed roughness caused by the interaction between the flow and the mobile bed rill surface.
All examined experimental investigations used small plots in which interrill erosion occurs and rill erosion is prevented. The development of rills on a hillslope whose soil is amended by biochar is still a topic to be deepened. Recently, Li et al. [42] performed an experimental investigation at plot scale and using a rainfall simulation system able to generate rainfall intensity in the range of 50–100 mm h−1. The surface soil layer (0–30 cm) was amended by a corn straw biochar. This study showed that the biochar application modifies the rill development, and increases the soil surface roughness affecting the runoff velocity. This analysis supported the idea that to establish the influence of biochar on rill erosion mechanism, the hydraulic variables of rill flows after applying biochar have to be studied.
In previous studies, a theoretical relationship obtained by the integration of a power–velocity profile deduced by the dimensional analysis and self-similarity theory was presented to calculate the Darcy–Weisbach friction factor f = (8 g R s)/V2 [43,44], in which g is the acceleration due to gravity, R is the hydraulic radius, and s is the plot slope, and its applicability was tested for rill flows [41,45,46,47,48,49,50,51,52]. In this study, the theoretical approach by Ferro [43,44] was assessed by measurements (flow depth h, plot slope s, mean flow velocity V, flow Reynolds number Re = V h/νk, in which νk is the kinematic viscosity, flow Froude number F = V/√(g h) and Darcy–Weisbach friction factor f) carried out by Li et al. [42] in plots where rills developed on a soil amended by biochar addition.
2. Materials and Methods
2.1. Experiments by Li et al. (2021)
Li et al. [42] developed an experimental investigation using twelve plots (5 m long and 2 m wide) in which the 0–30 cm soil layer was amended by a corn straw biochar. Four values of plot slope angle (1.8°, 3.6°, 5.4° and 7.2°) were used.
The surface soil layer (0–30 cm) was loam (40.85% sand, 20.41% silt and 38.74% clay) and the corn straw biochar was applied to the surface of the experimental plot. The biochar was incorporated and mixed with the arable soil using the traditional agricultural manual mixing method. Two biochar treatments were carried out with a biochar content BC of 6 and 12 kg m−2, corresponding to 1.4 and 3% of the soil mass in the surface (0–30 cm) soil layer.
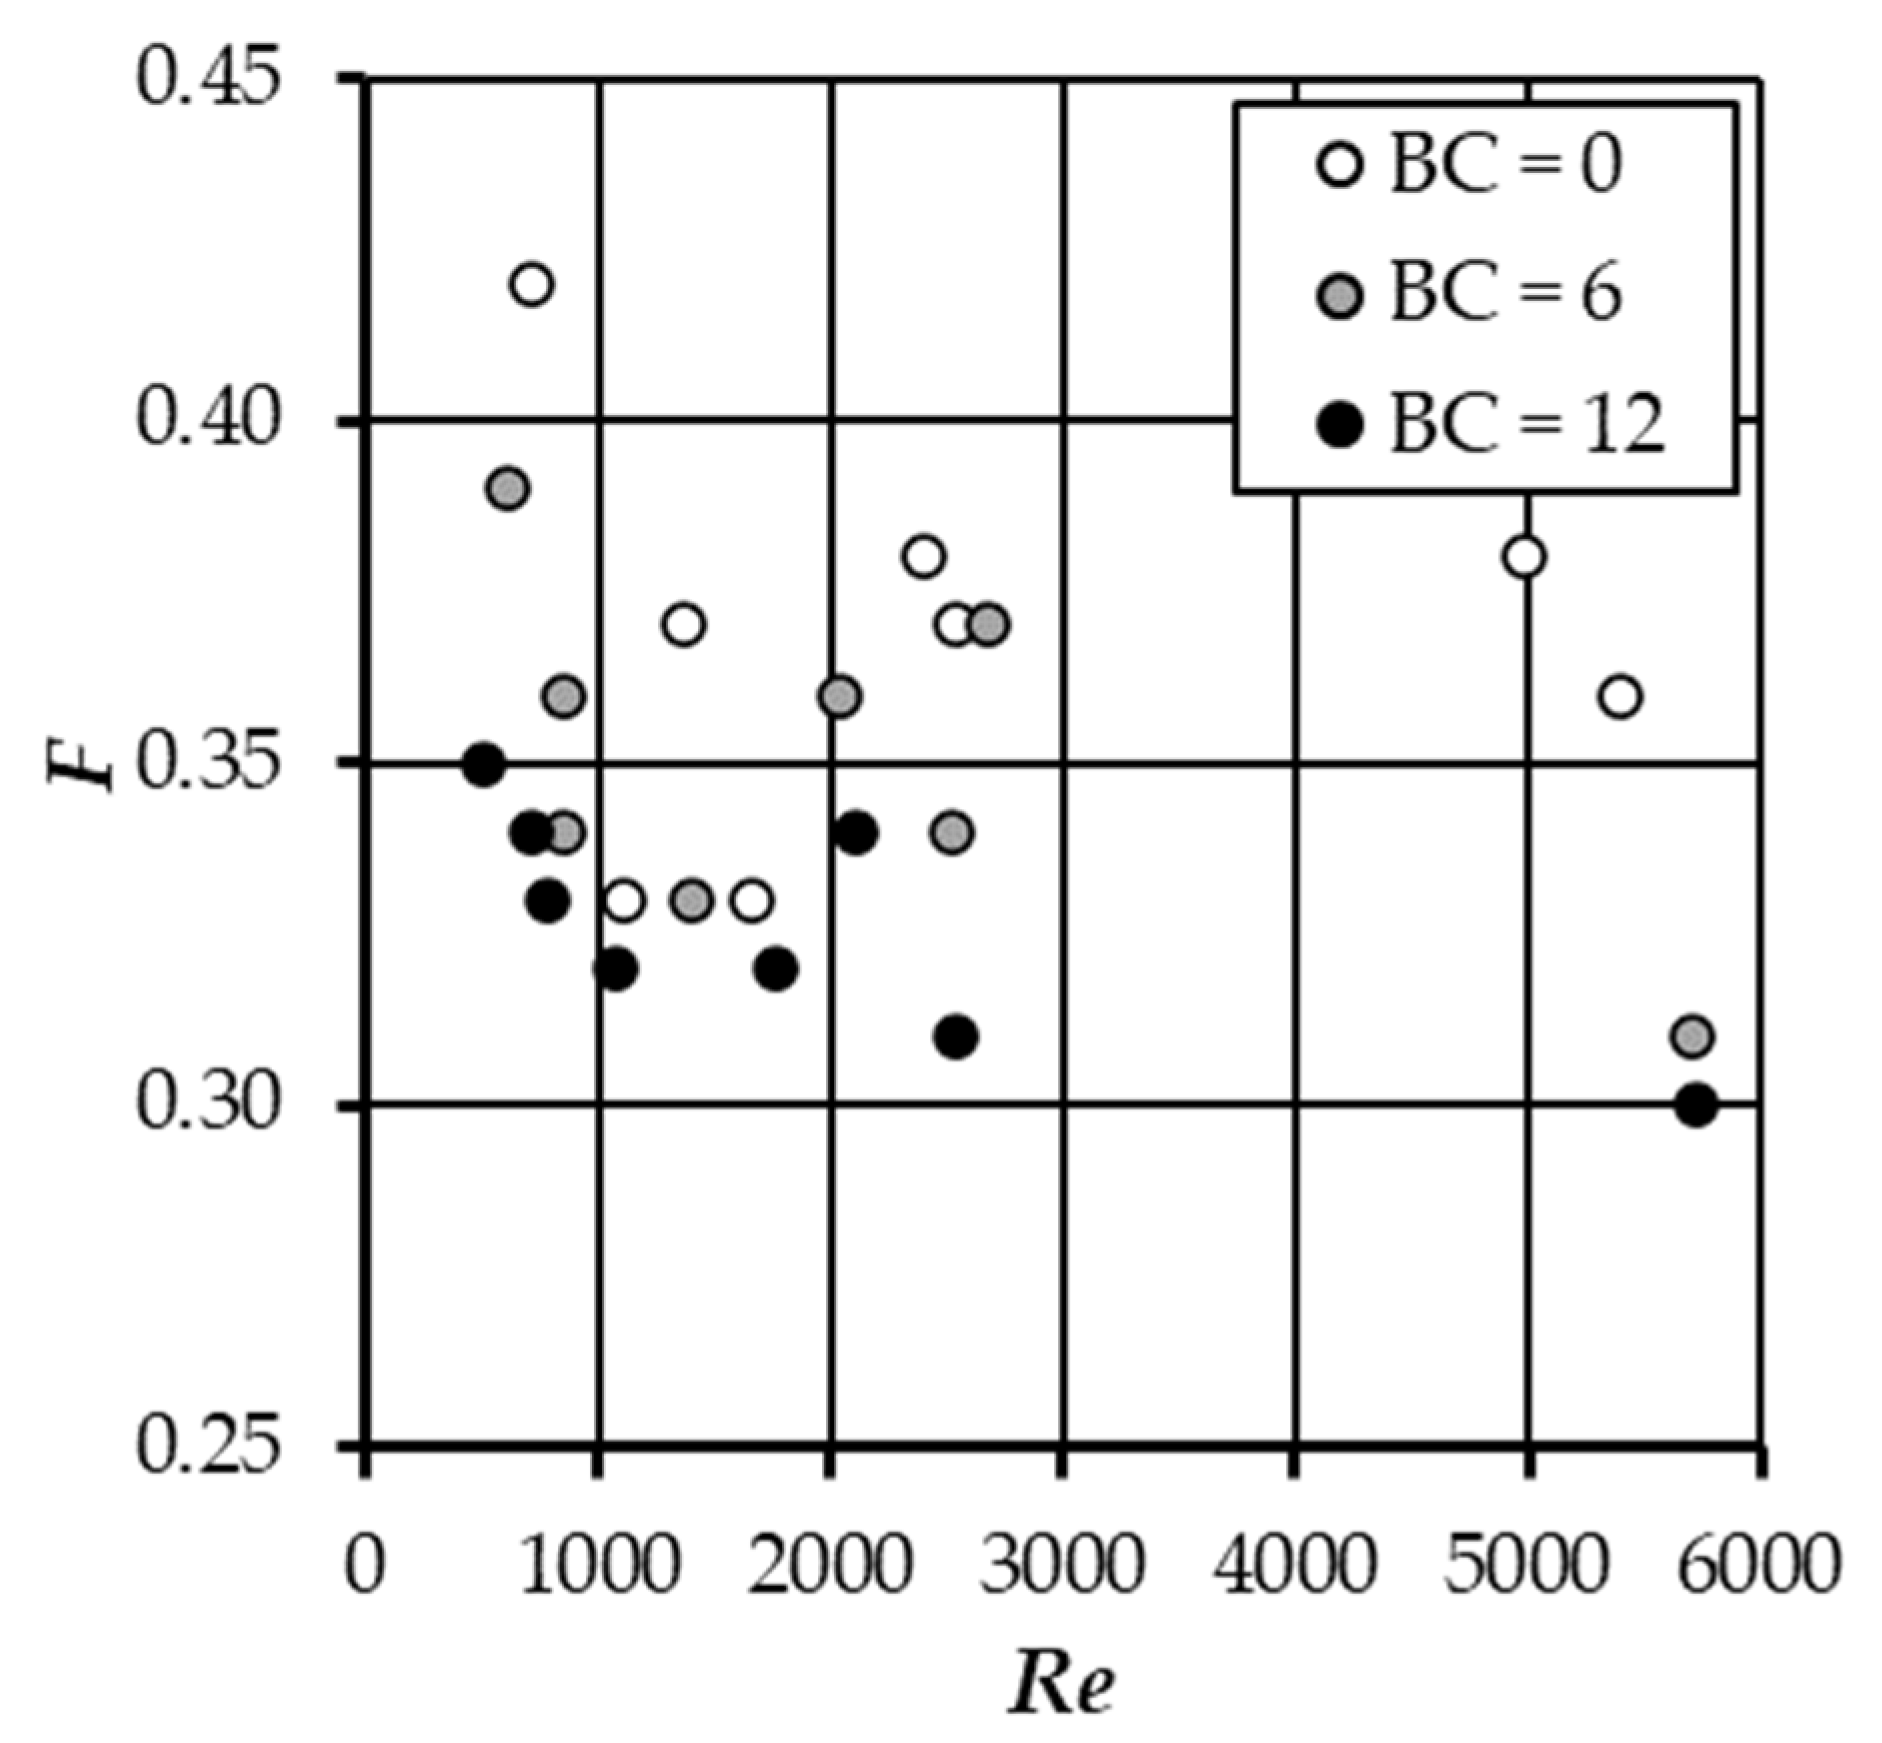
The rainfall events were applied by a simulator which is able to set rainfall intensity values ranging from 50 to 100 mm h−1. At the beginning of October 2017, biochar was applied to the plot surface while the first simulated rainfall experiment was carried out in early May of 2018 and the second rainfall test in May of 2019. A total number of 24 experimental runs (4 slope angles × 3 biochar contents × 2 years) were performed. The rill flow velocity was measured by the dye–tracer technique using a potassium permanganate solution. The investigated hydraulic conditions were characterized by transitional and turbulent flows (508 ≤ Re ≤ 5718) and subcritical flows (0.30 ≤ F ≤ 0.42) (Figure 1). More details on the experimental apparatus and measurement techniques are reported in Li et al. [42].
2.2. The Rill Flow Resistance Equation
For an open channel flow, the local velocity profile v(y) along a given vertical is expressed as follows [41,53,54,55]:
in which φ is a functional symbol, v is the local velocity, y is the distance from the bed, h is water depth, d is a characteristic bed particle diameter, u*= √(g R s) is the shear velocity, R is the hydraulic radius, s is bed slope, ρ is the water density, and μ is the dynamic water viscosity.
Applying the Π-Theorem of the dimensional analysis and using as dimensional independent variables y, u* and μ, Equation (1) can be expressed by the following dimensionless functional relationship [48]:
where φ1 is a functional symbol.
Assuming the Incomplete Self-Similarity in u* y/νk [43,56,57,58,59] and taking into account that the Froude number also accounts for the ratio h/d [44], the integration of Equation (2) leads to the following velocity profile:
where Γ(s, Re, F) is a function to be determined by velocity measurements and the exponent δ is calculated by this theoretical equation [60,61]:
The following expression of the Darcy–Weisbach friction factor f is deduced [43,54,62] by integrating Equation (3):
By the velocity profile Equation (3), the following estimate Γv of Γ function [43,62] is attained by establishing as α h the distance y where the local velocity equals the cross-section average velocity V:
The coefficient α, which is less than 1, considers that both V is located under the water surface and the mean velocity profile in the cross-section is referred to. The coefficient α has to be calculated by the following theoretical relationship deduced by Ferro [43]:
3. Results
The database used in this investigation (24 experimental runs) is characterized by a soil having specific texture characteristics (clay loam).
Figure 1 supports the idea that the biochar content BC (0, 6 and 12 kg m−2) does not affect the flow regime while an appreciable decrease of F is obtained for increasing BC values.
At first, applying the hypothesis of previous studies carried out with rills developed on soils having a different texture [51,52] and for overland flow under simulated rainfall with different types of vegetation [64], the coefficients b, c, and e of the hydraulic variables were assumed independent of other effects such as those of soil texture and vegetation. Thereby, the coefficient a can be used to express a specific effect (soil texture, vegetation) on the flow resistance. According to this hypothesis, Equation (8) was firstly calibrated using the measurements carried out for the original soil (BC = 0 kg m−2), obtaining:
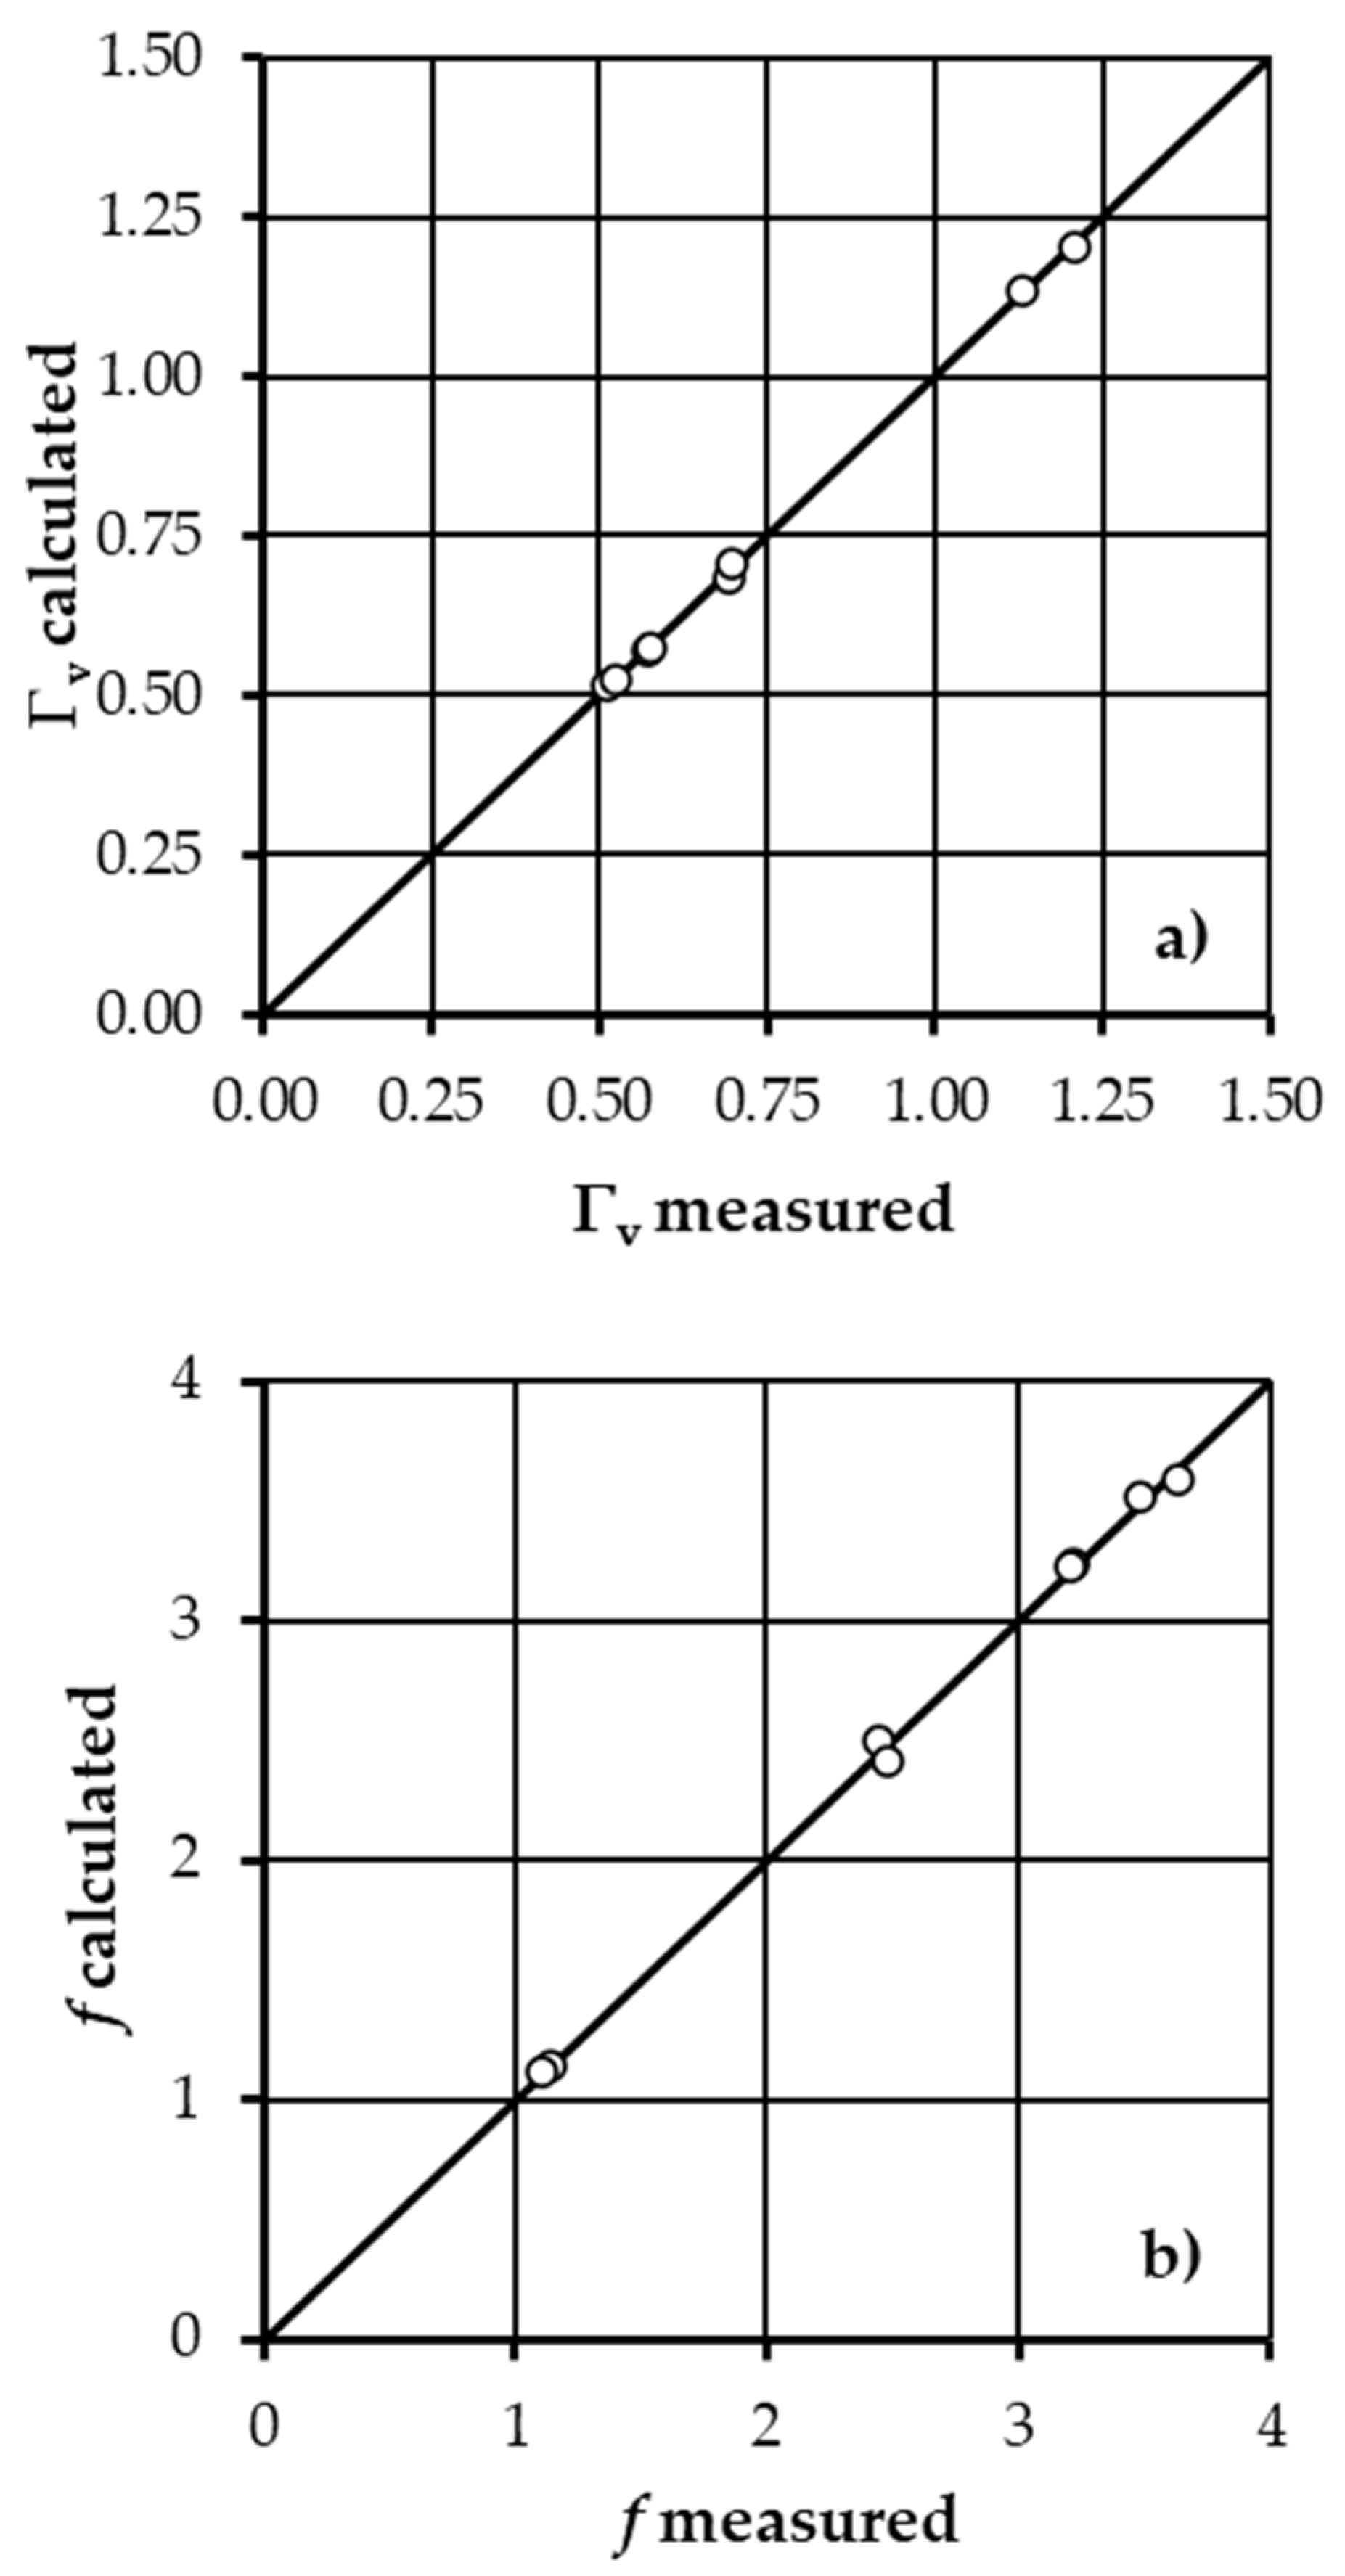
The comparison between the measured Γv values, obtained by Equation (6), and those calculated by Equation (9) is plotted in Figure 2a and, being the pairs very close to the 1:1 line, demonstrates a good agreement of Equation (9) with the measurements for BC = 0 kg m−2. Figure 2b shows the good agreement between the measured friction factor values, and the ones, f, calculated by Equation (5) with Γv values estimated by Equation (9). The friction factor values calculated by Equations (5) and (9) are characterized by errors that are always less than ±3%.
For testing the effect of the biochar content BC on the rill flow resistance equation, the following equation was applied:
in which X = F0.6397 Re0.2118 s−0.849 and the coefficient a varies with biochar content and is equal to 0.0276 when BC = 0.
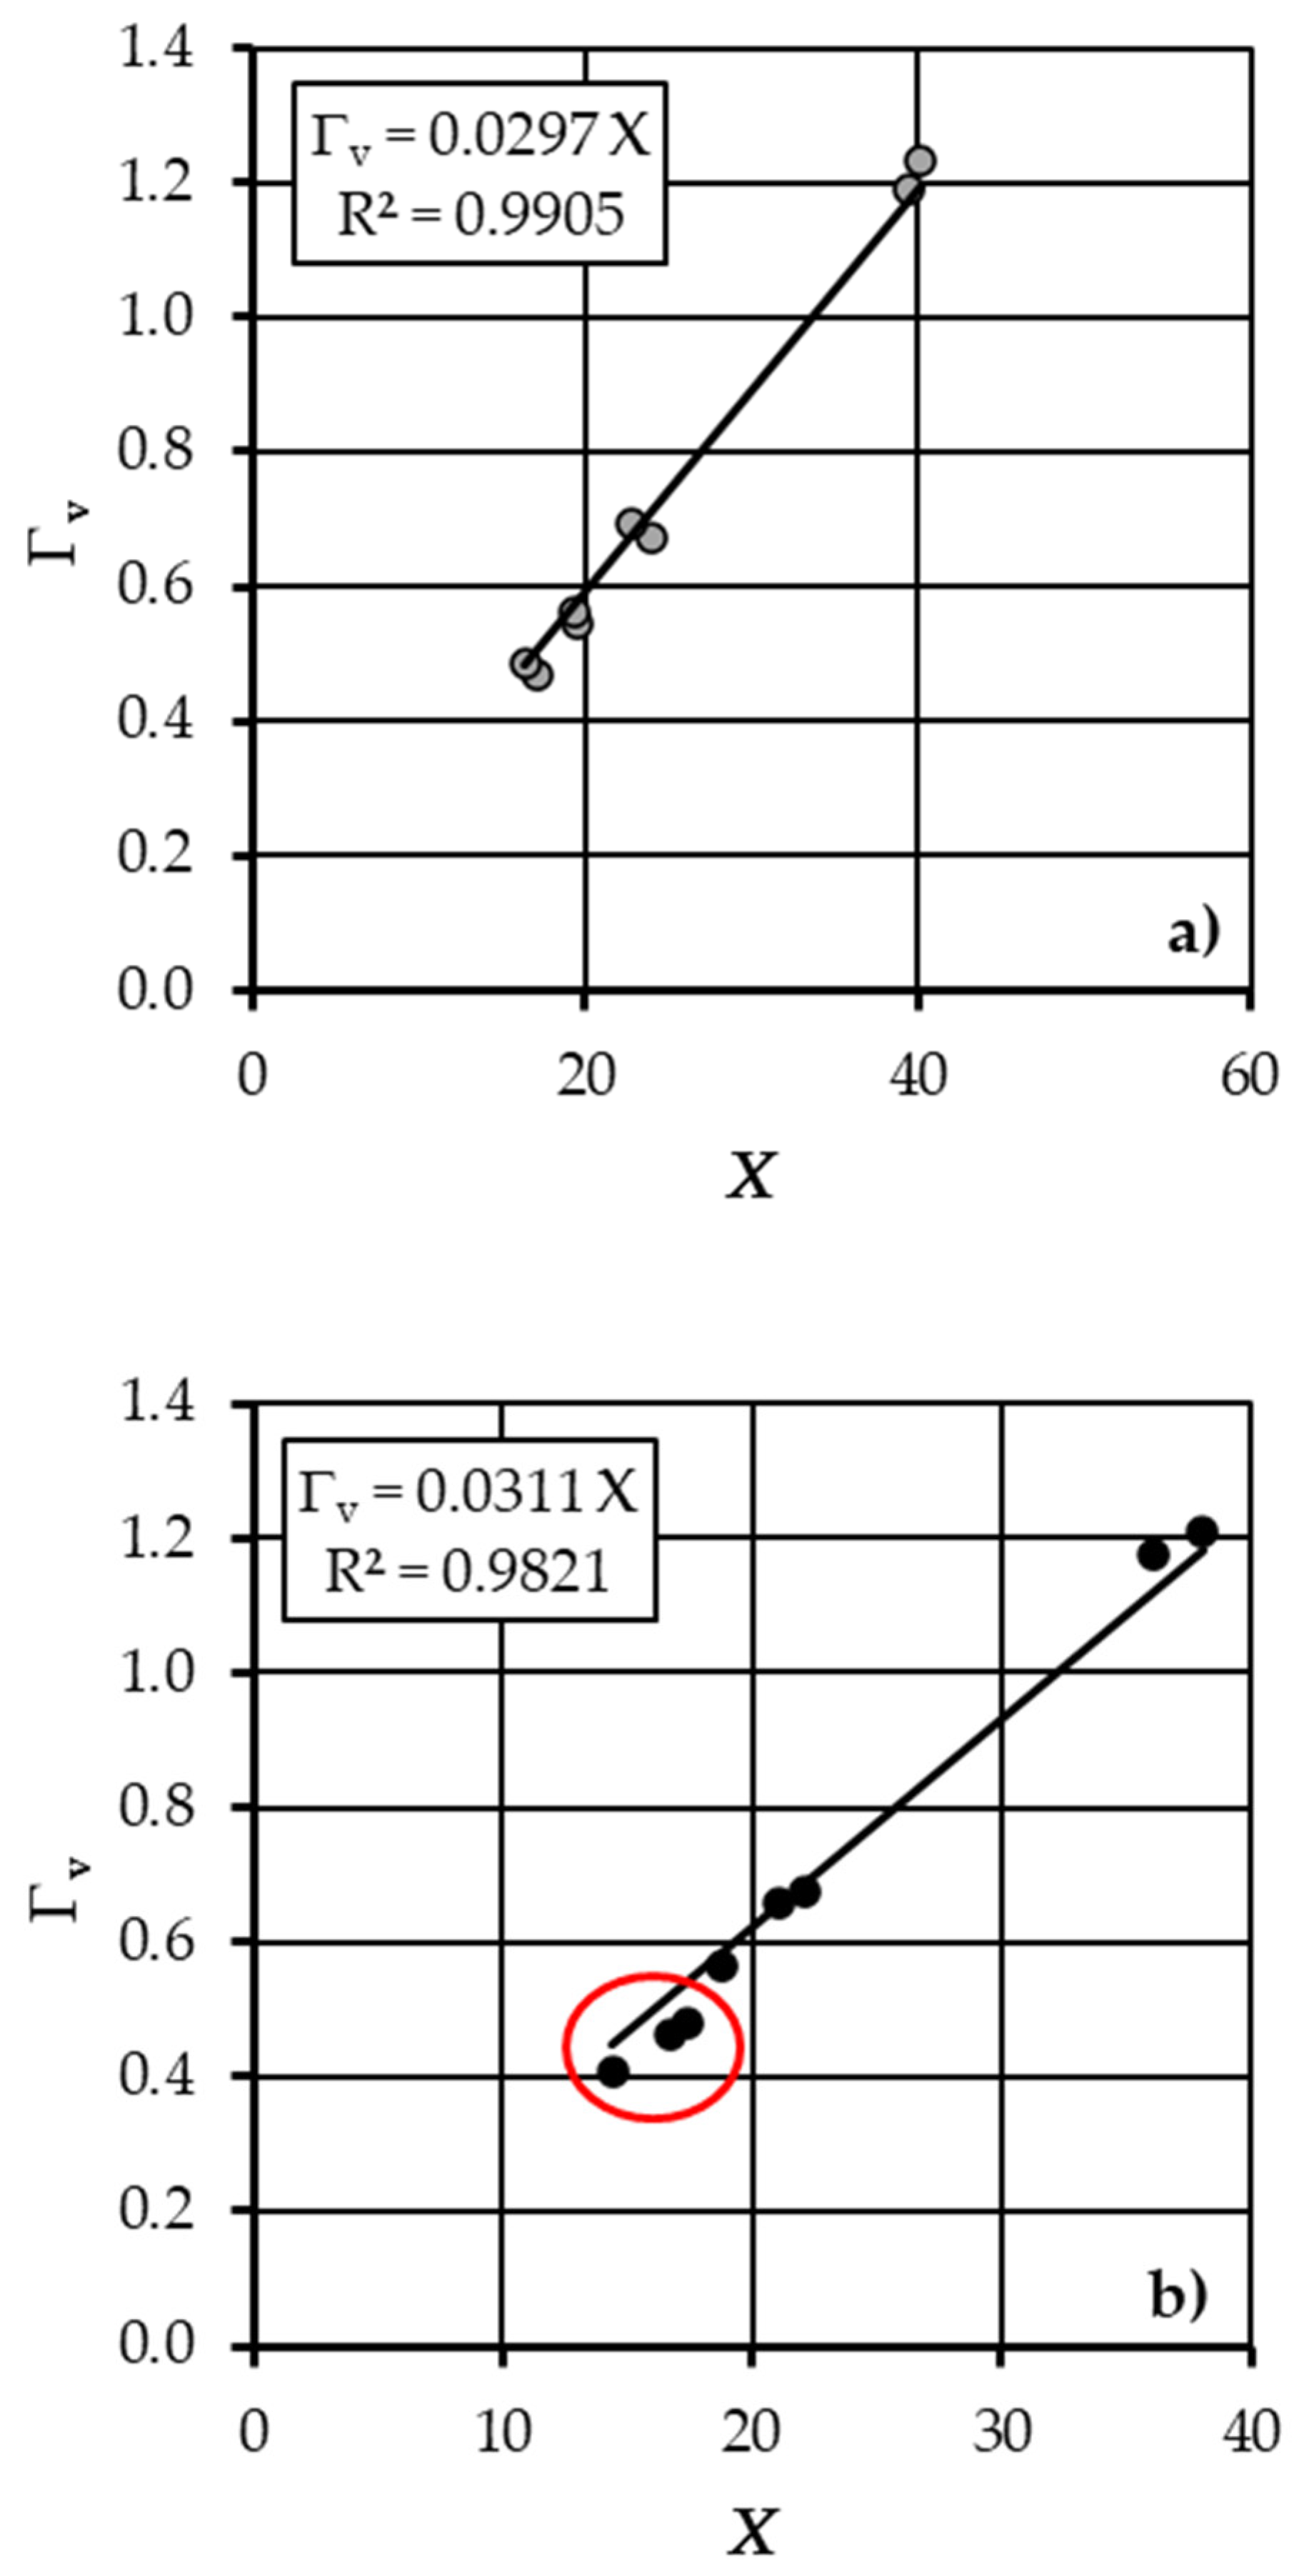
For each dataset (BC = 6 and 12 kg m−2), the behavior of the pairs (X, Γv) was investigated and the value of the a coefficient, equal to the slope coefficient of the best-fit straight line passing through the origin of the axes, was estimated. For BC = 6 and 12 kg m−2, Figure 3 shows the comparison between the experimental pairs (X, Γv) and Equation (10) with a = 0.0297 for BC = 6 kg m−2 (Figure 3a) and a = 0.0311 for BC = 12 kg m−2 (Figure 3b). For the highest BC value and the lowest X values (14.4 ≤ X ≤ 17.4), Equation (10) with a = 0.0311 tends to overestimate Γ and, as a consequence, to underestimate f (Figure 4).
Introducing Equation (10) into Equation (5), the following equation to estimate the Darcy–Weisbach friction factor was obtained:
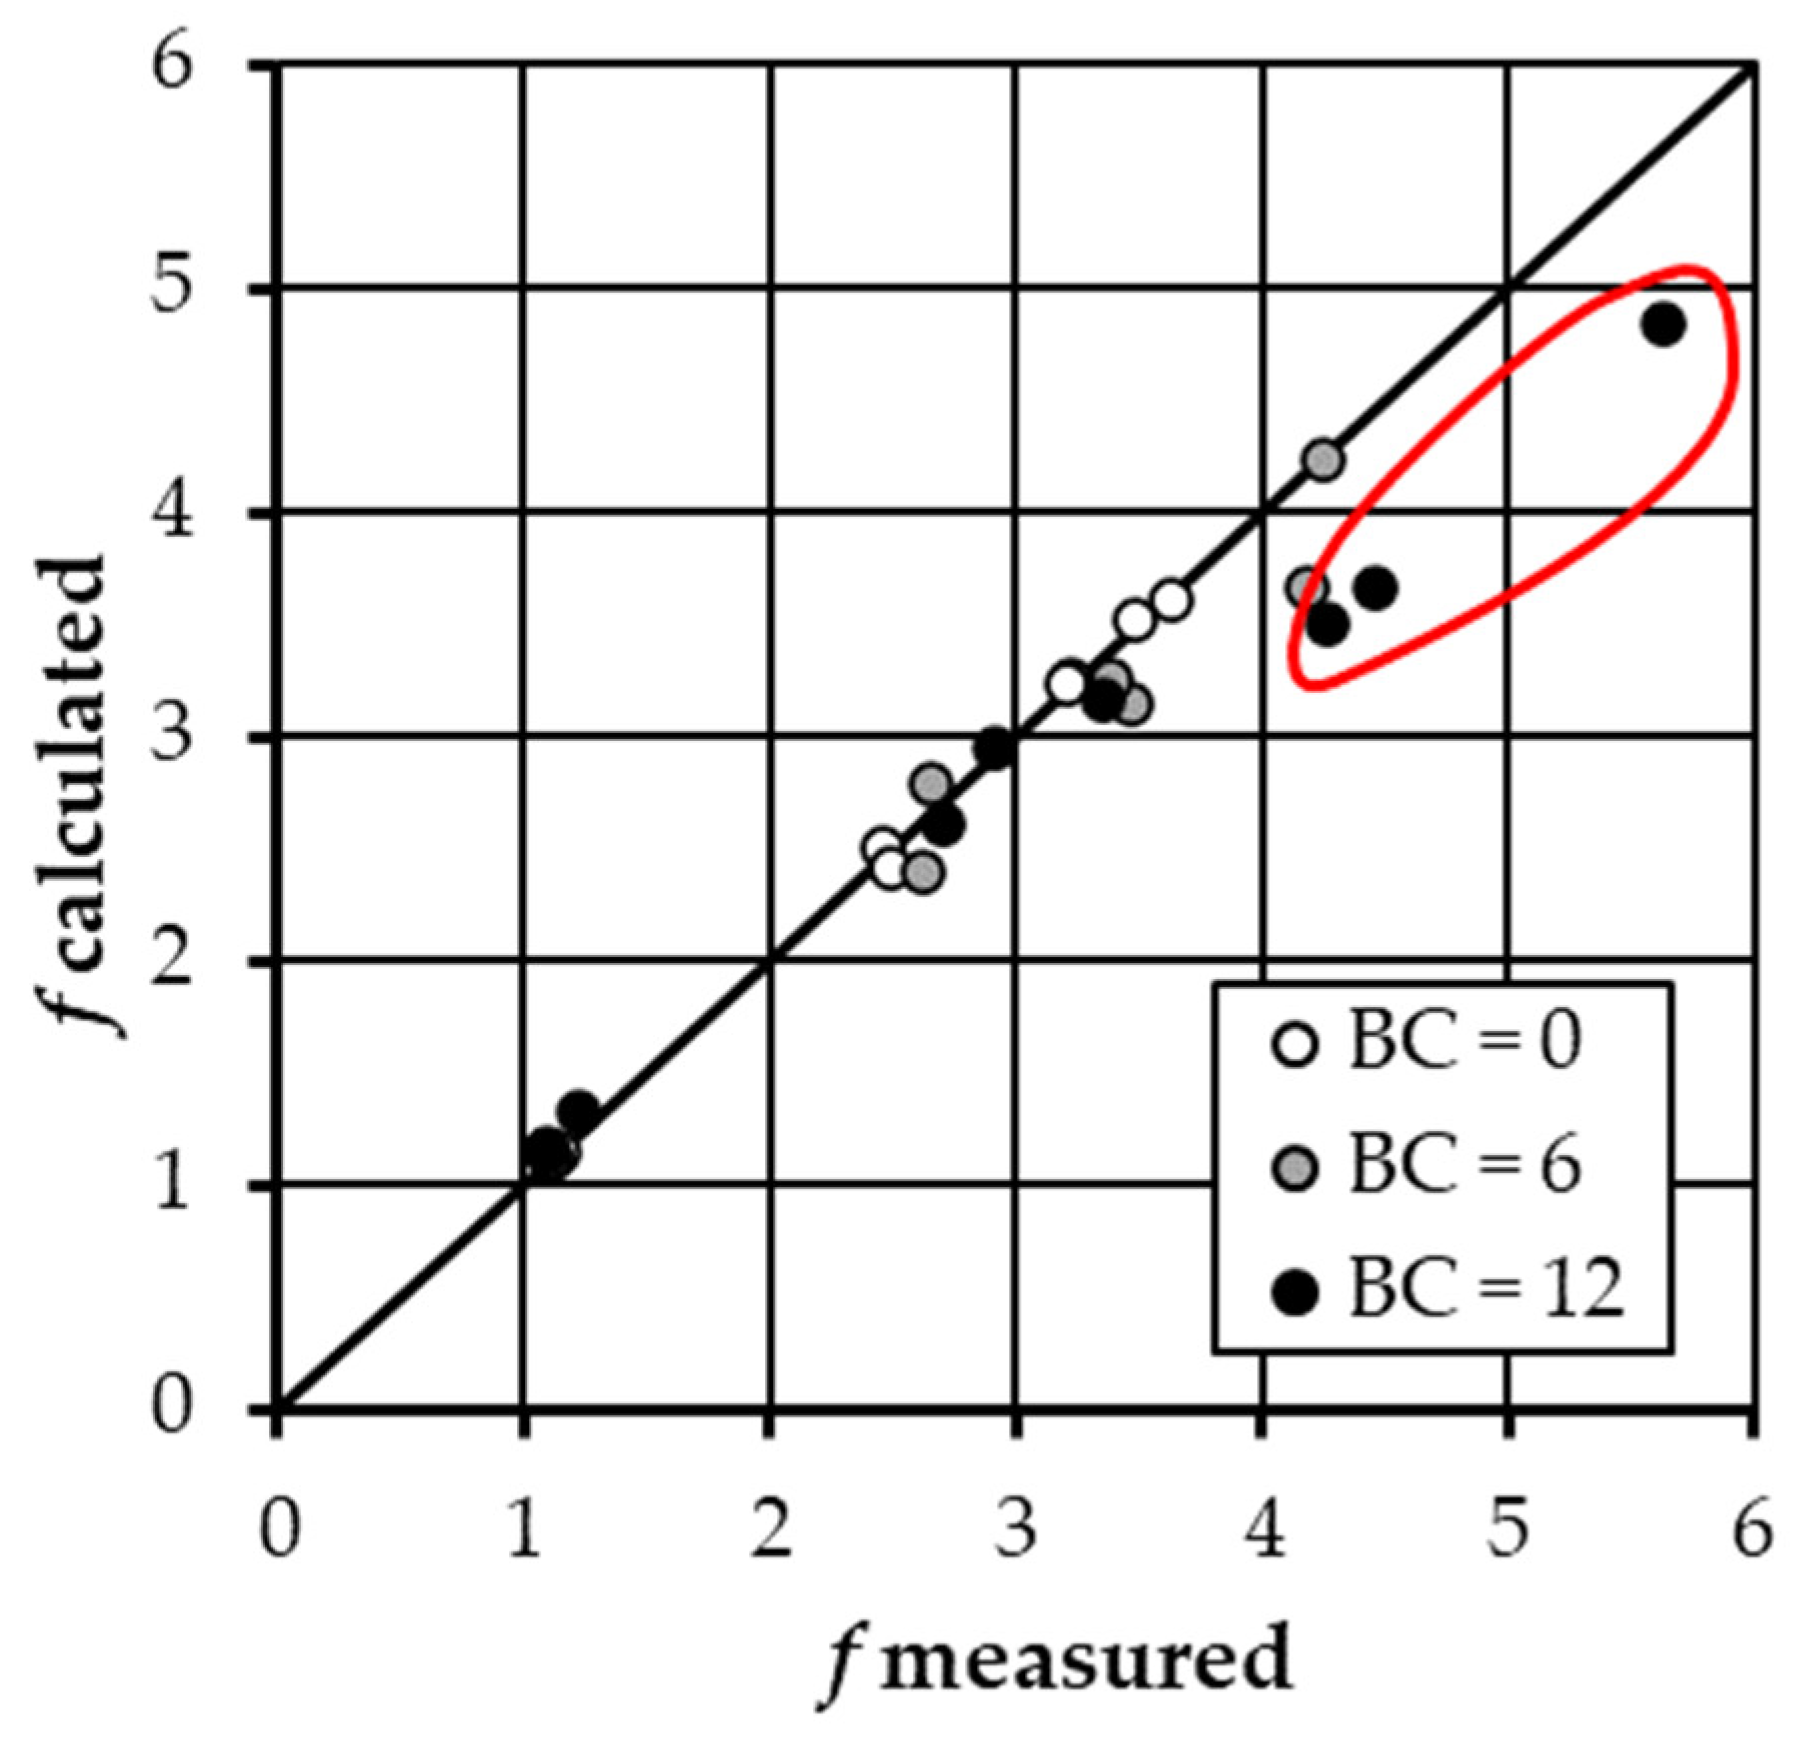
Figure 4 shows the comparison between the measured friction factor values, and the ones, f, calculated by Equation (11) with Γv values estimated by Equation (10) with a = 0.0276, 0.0297, and 0.0311 for BC = 0, 6, and 12 kg m−2, respectively. The agreement between the measured and calculated friction factor values is characterized by errors less than or equal to ±10% for 83.3% of cases and ±3% for 45.8% of cases.
The performance of Equation (11) with the above a values is negatively affected by the highest f values calculated for the condition BC = 12 kg m−2 which yield a systematic underestimation.
For considering the effect of biochar content on flow turbulence, the following equation to estimate Γv was applied:
in which Y = F0.6397 s−0.849 and the coefficients a and e vary with biochar content and are equal to 0.0276 and 0.2118 when BC = 0, respectively.
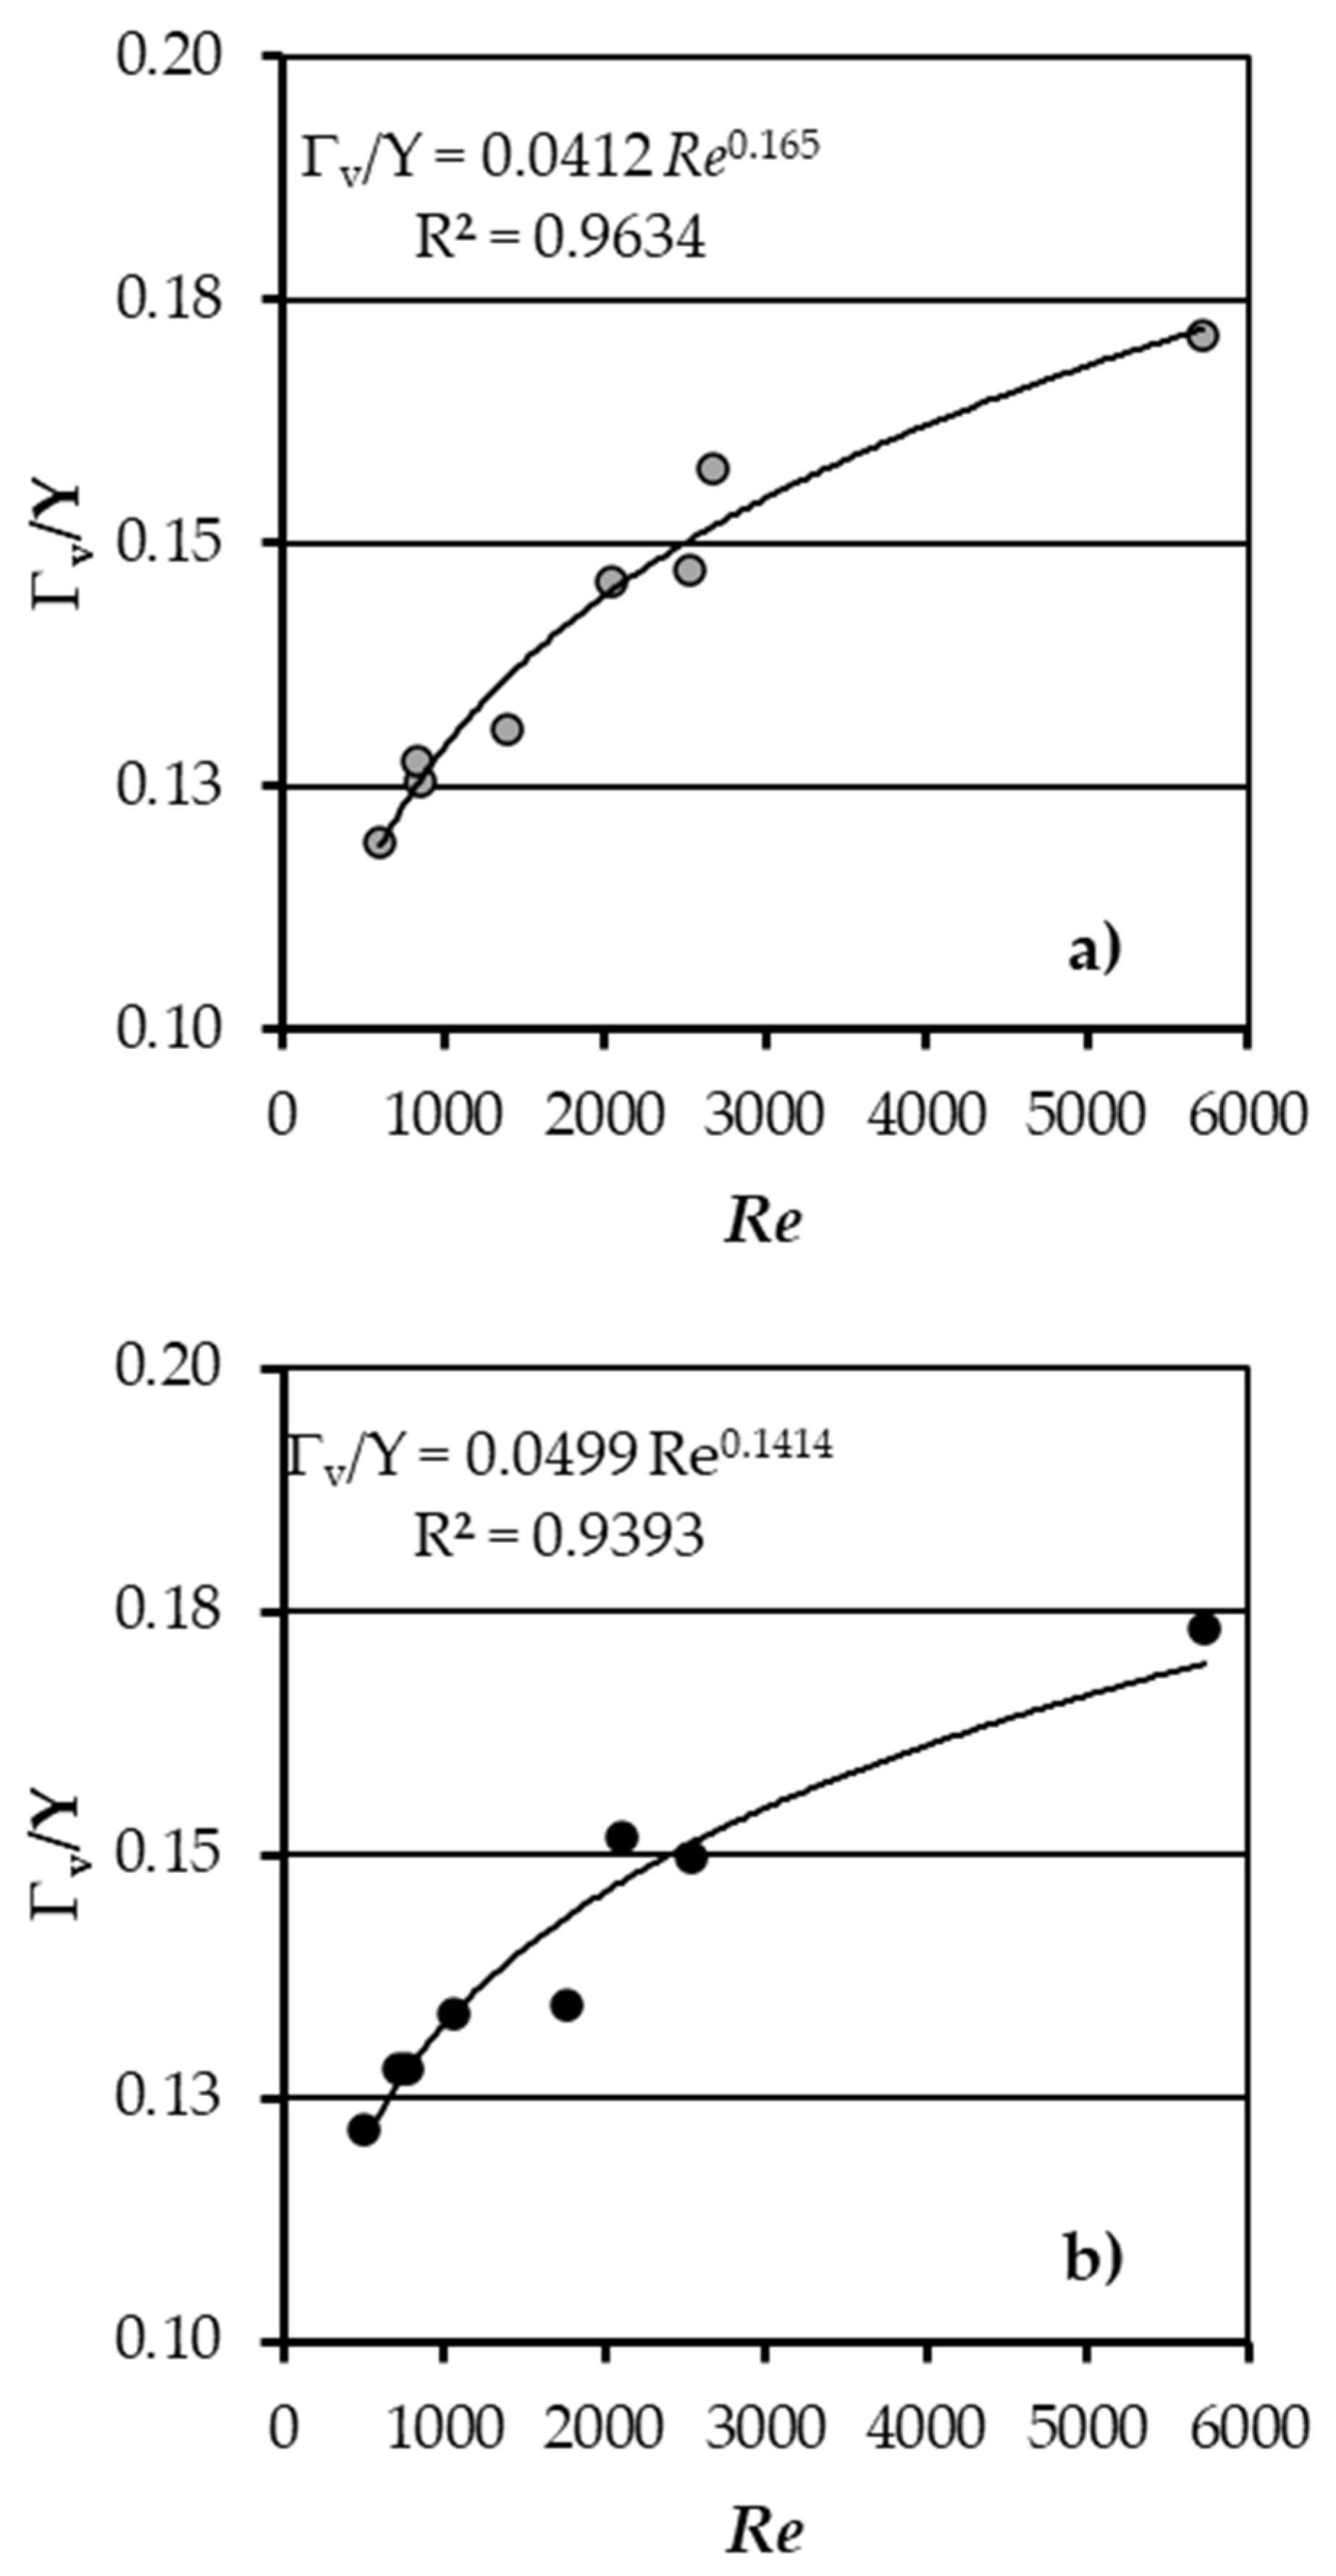
For each dataset (BC = 6 and 12 kg m−2), the behaviour of the pairs (Re, Γv/Y) was investigated, and the values of the coefficients a and e of Equation (12) were estimated by a least-square technique. Figure 5 shows the comparison between the experimental pairs (Re, Γv/Y) and Equation (12), with a = 0.0412 and e = 0.165 for BC = 6 kg m−2 (Figure 5a) and a = 0.0499 and e = 0.1414 for BC = 12 kg m−2 (Figure 5b).
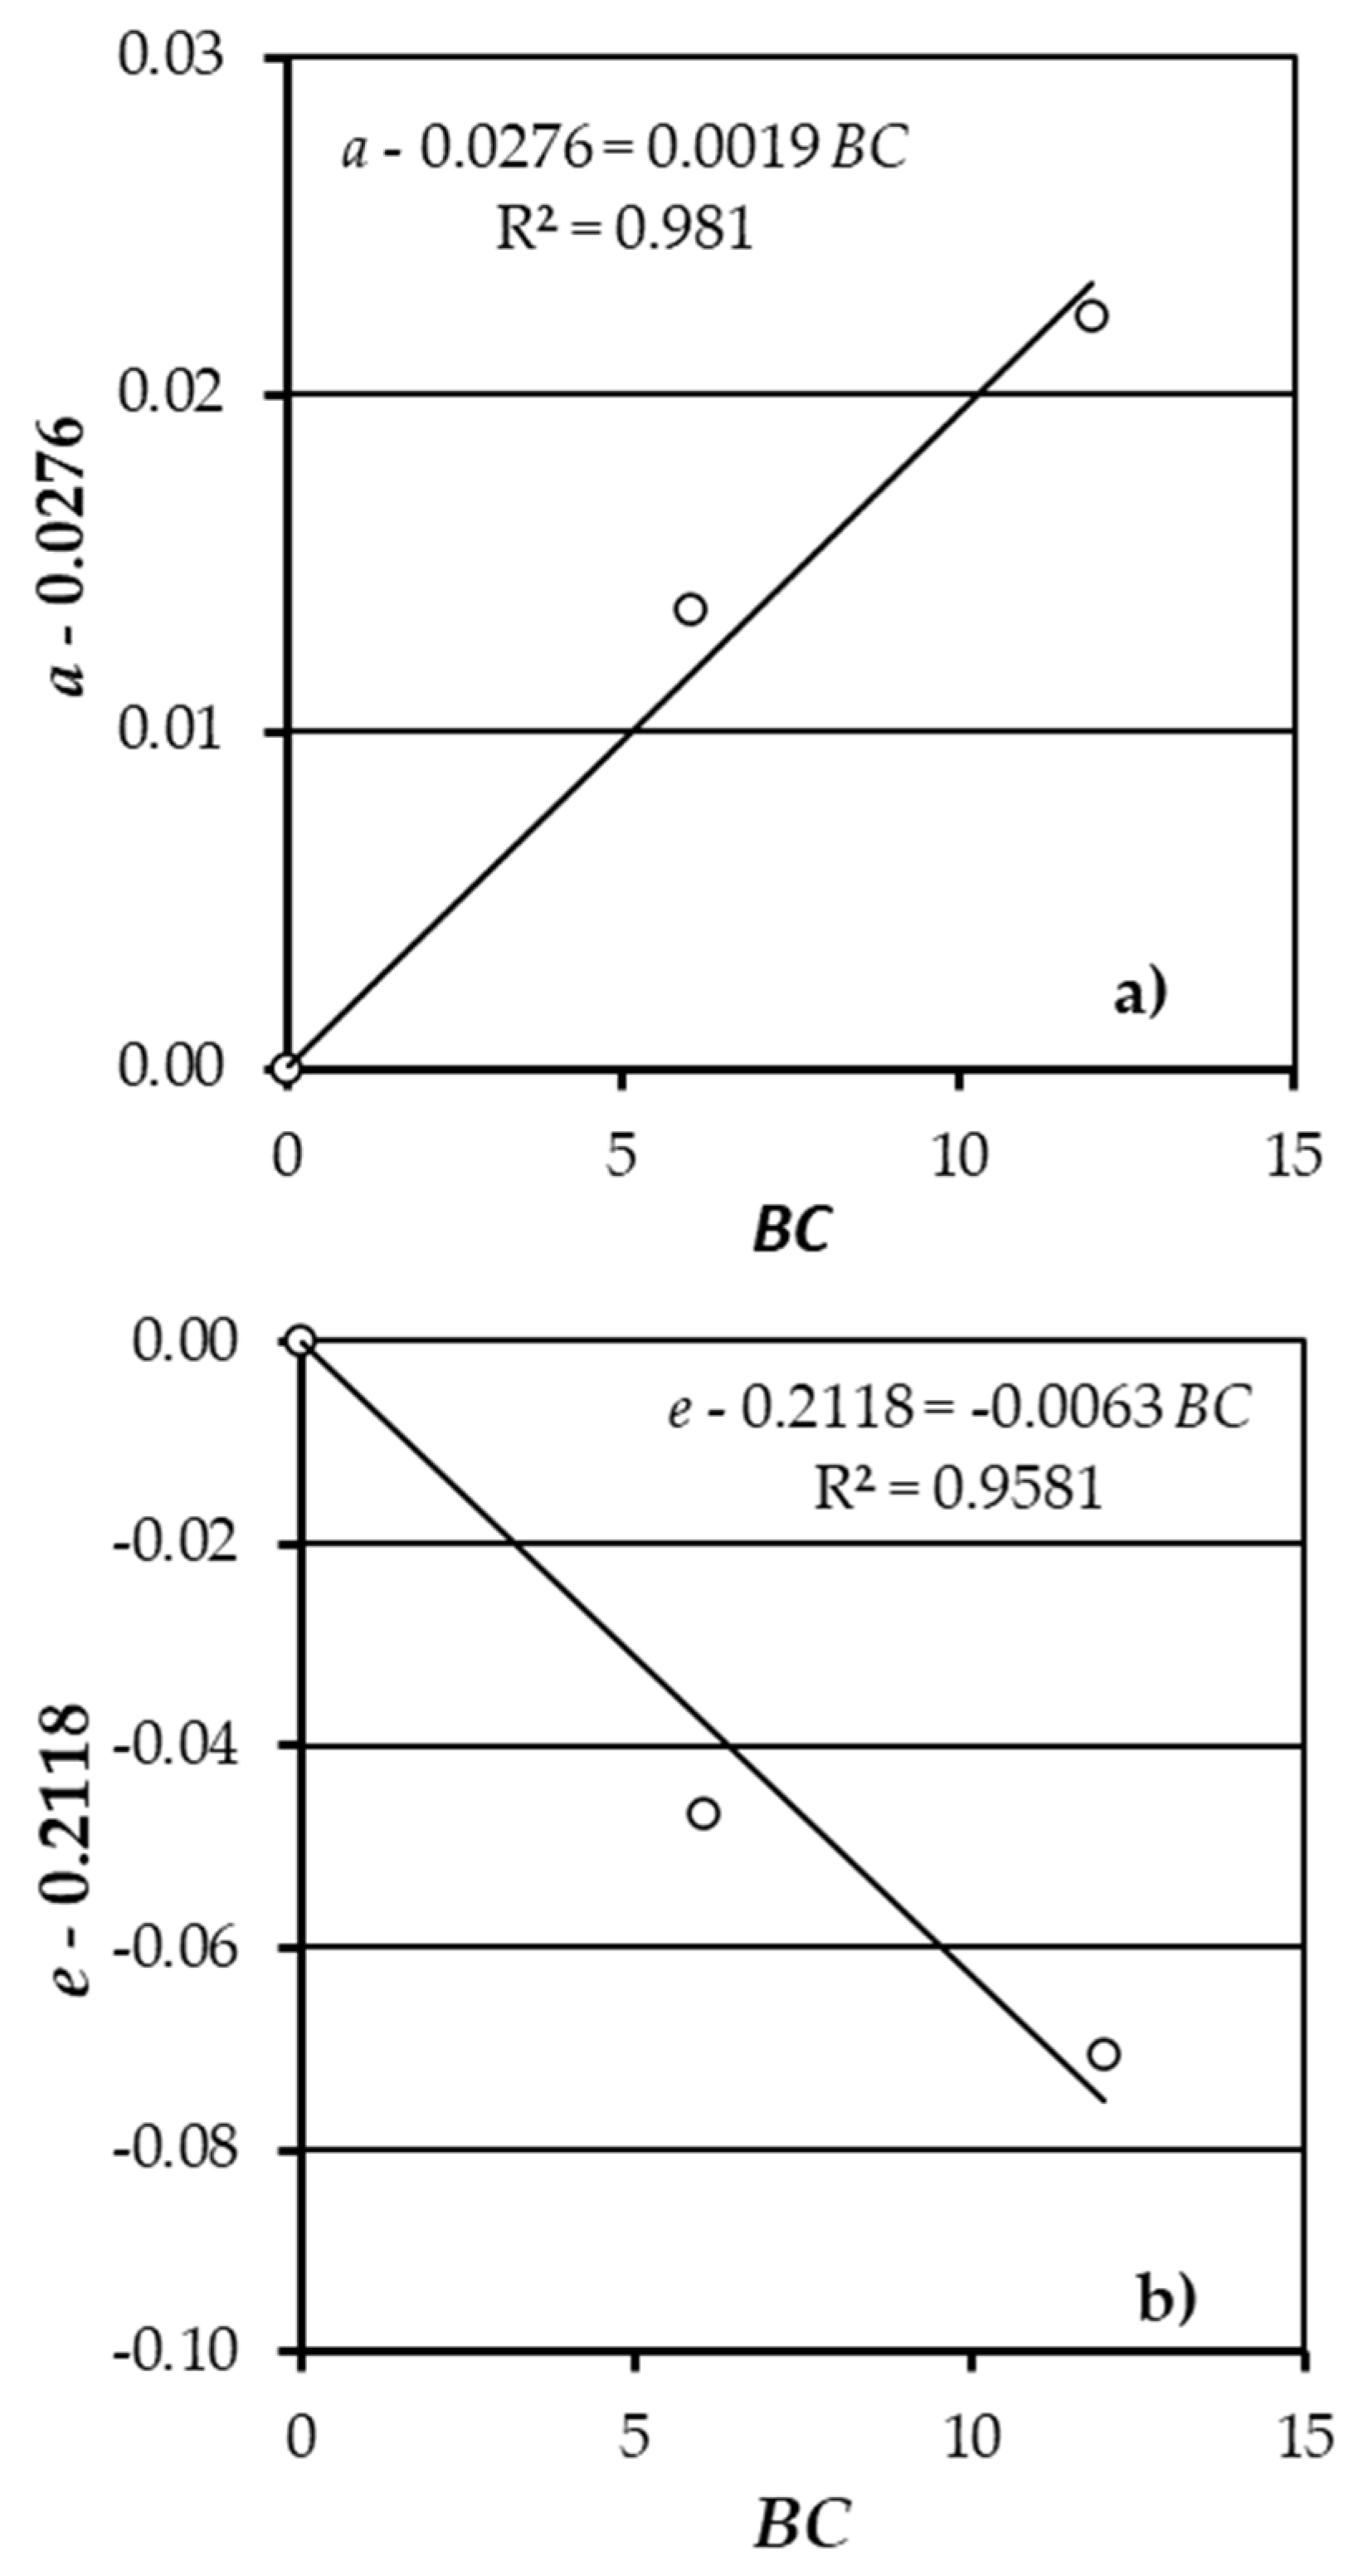
Even if only two BC values were investigated, Figure 6 shows that the coefficients a (Figure 6a) and e (Figure 6b) depend on the biochar content according to the following relationships:
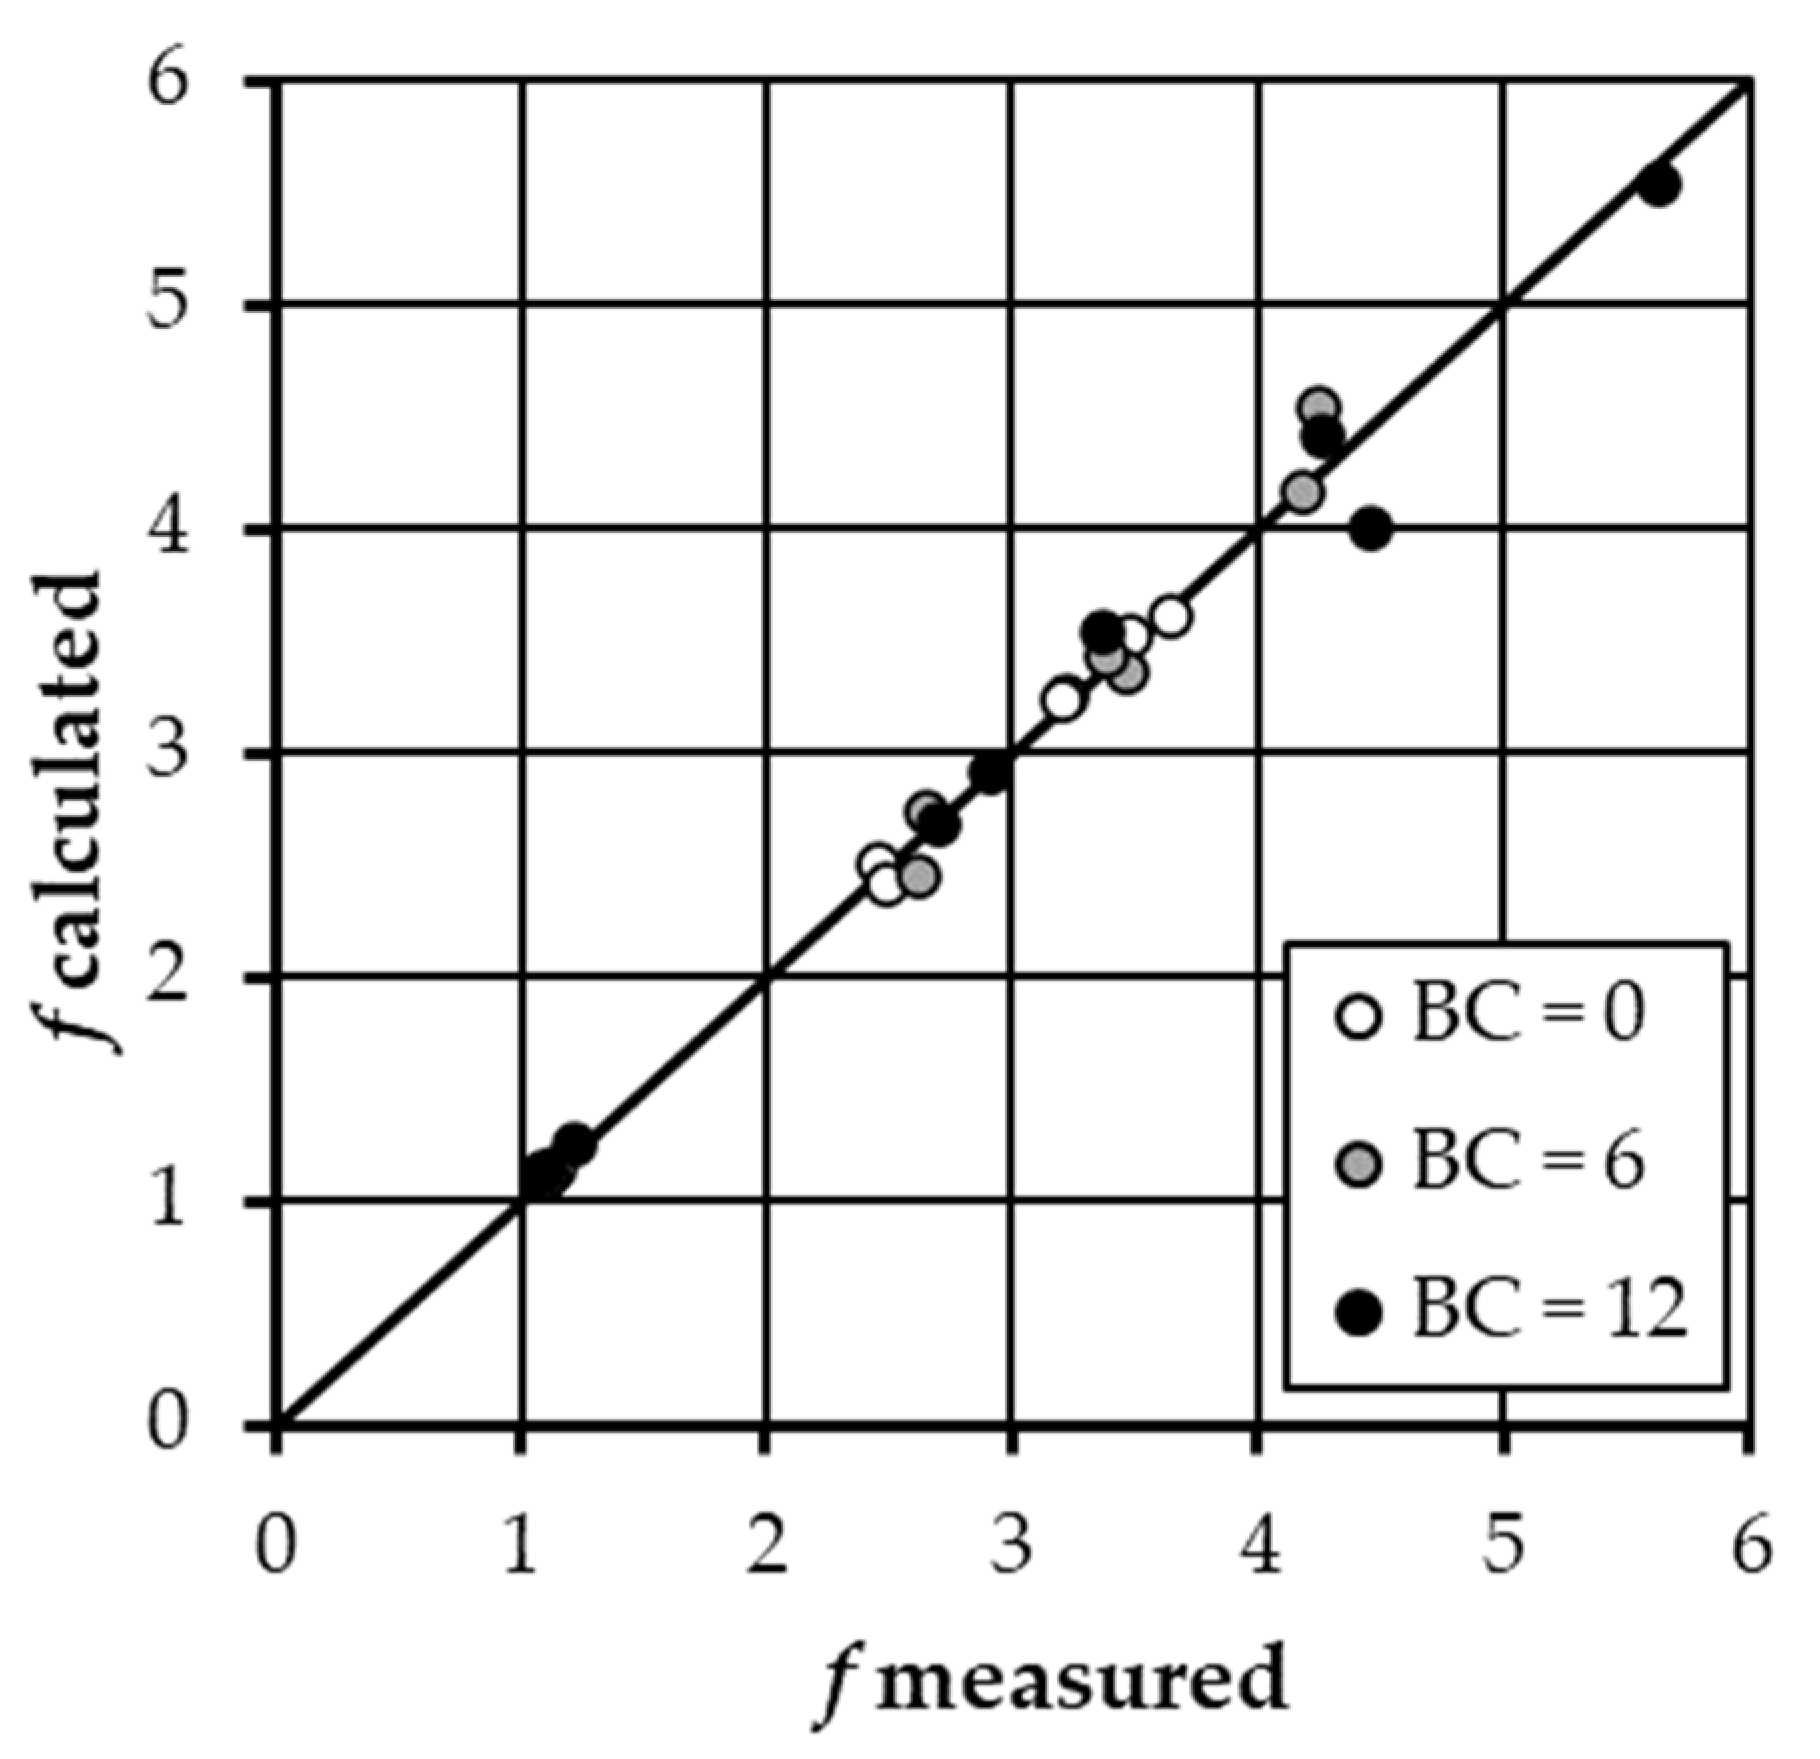
Figure 7 shows the comparison between the measured friction factor values, and the ones, f, calculated by Equations (5), (12)–(14). The agreement between the measured and calculated friction factor values is characterized by errors which are always less than or equal to ±10% and less than or equal to ±3% for 75.0% of cases.
4. Discussion
Figure 1 demonstrates that the increase of biochar content BC produces a reduction of the flow Froude number, which is due to a reduction of flow velocity and an increase of flow depth. In other words, these measurements carried out for slope values ranging from 3.1 to 12.6% demonstrate that the effect of biochar is an increase of soil roughness, which produces a reduction of rill flow velocity and an increase of water depth. Adding a biochar content less than or equal to 12 kg m−2 (BC < 3% of the soil mass in the surface soil layer) determined a reduction of flow velocity, as compared to the original soil condition (BC = 0), which is joined to a decrease of rill flow transport capacity [65] and sediment transport.
Figure 2b demonstrates that an accurate estimate of the friction factor can be obtained for the investigated soil surface by the proposed flow resistance equation (Equations (5) and (9)).
For BC = 12 kg m−2 in the range 14.4 ≤ X ≤ 17.4, which corresponds to the highest slope (9.4 and 12.6%) and Darcy–Weisbach friction factor (4.26 ≤ f ≤ 5.63) values, the flow resistance equation (Equation (11)), with Γv values calculated by Equation (10) and a = 0.0311, is less accurate (Figure 3b and Figure 4). The experimental results by Li et al. [42] showed that the flow velocity decreased with increasing biochar content and for BC = 12 kg m−2 the corresponding increase of the friction factor is not properly described by Equation (11) for the highest f values. In other words, the use of a different a coefficient is not sufficient to obtain an adequate estimate of Γv. However, a good estimate of the friction factor (Figure 4) can be obtained for the investigated soil surface by the proposed flow resistance equation (Equations (10) and (11)).
According to Li et al. [42], the biochar can reduce rill flow turbulence. This effect can be considered changing the exponent e of the Reynolds number in comparison with that (e = 0.2118) estimated for BC = 0.
Figure 5 demonstrates that an accurate estimate of Γv can be obtained by Equation (12) and that the exponent e decreases for increasing BC values (Figure 6b). This result demonstrates that the increase of biochar content dumps flow turbulence since decreasing e values reduce the effect of Reynolds number on flow resistance.
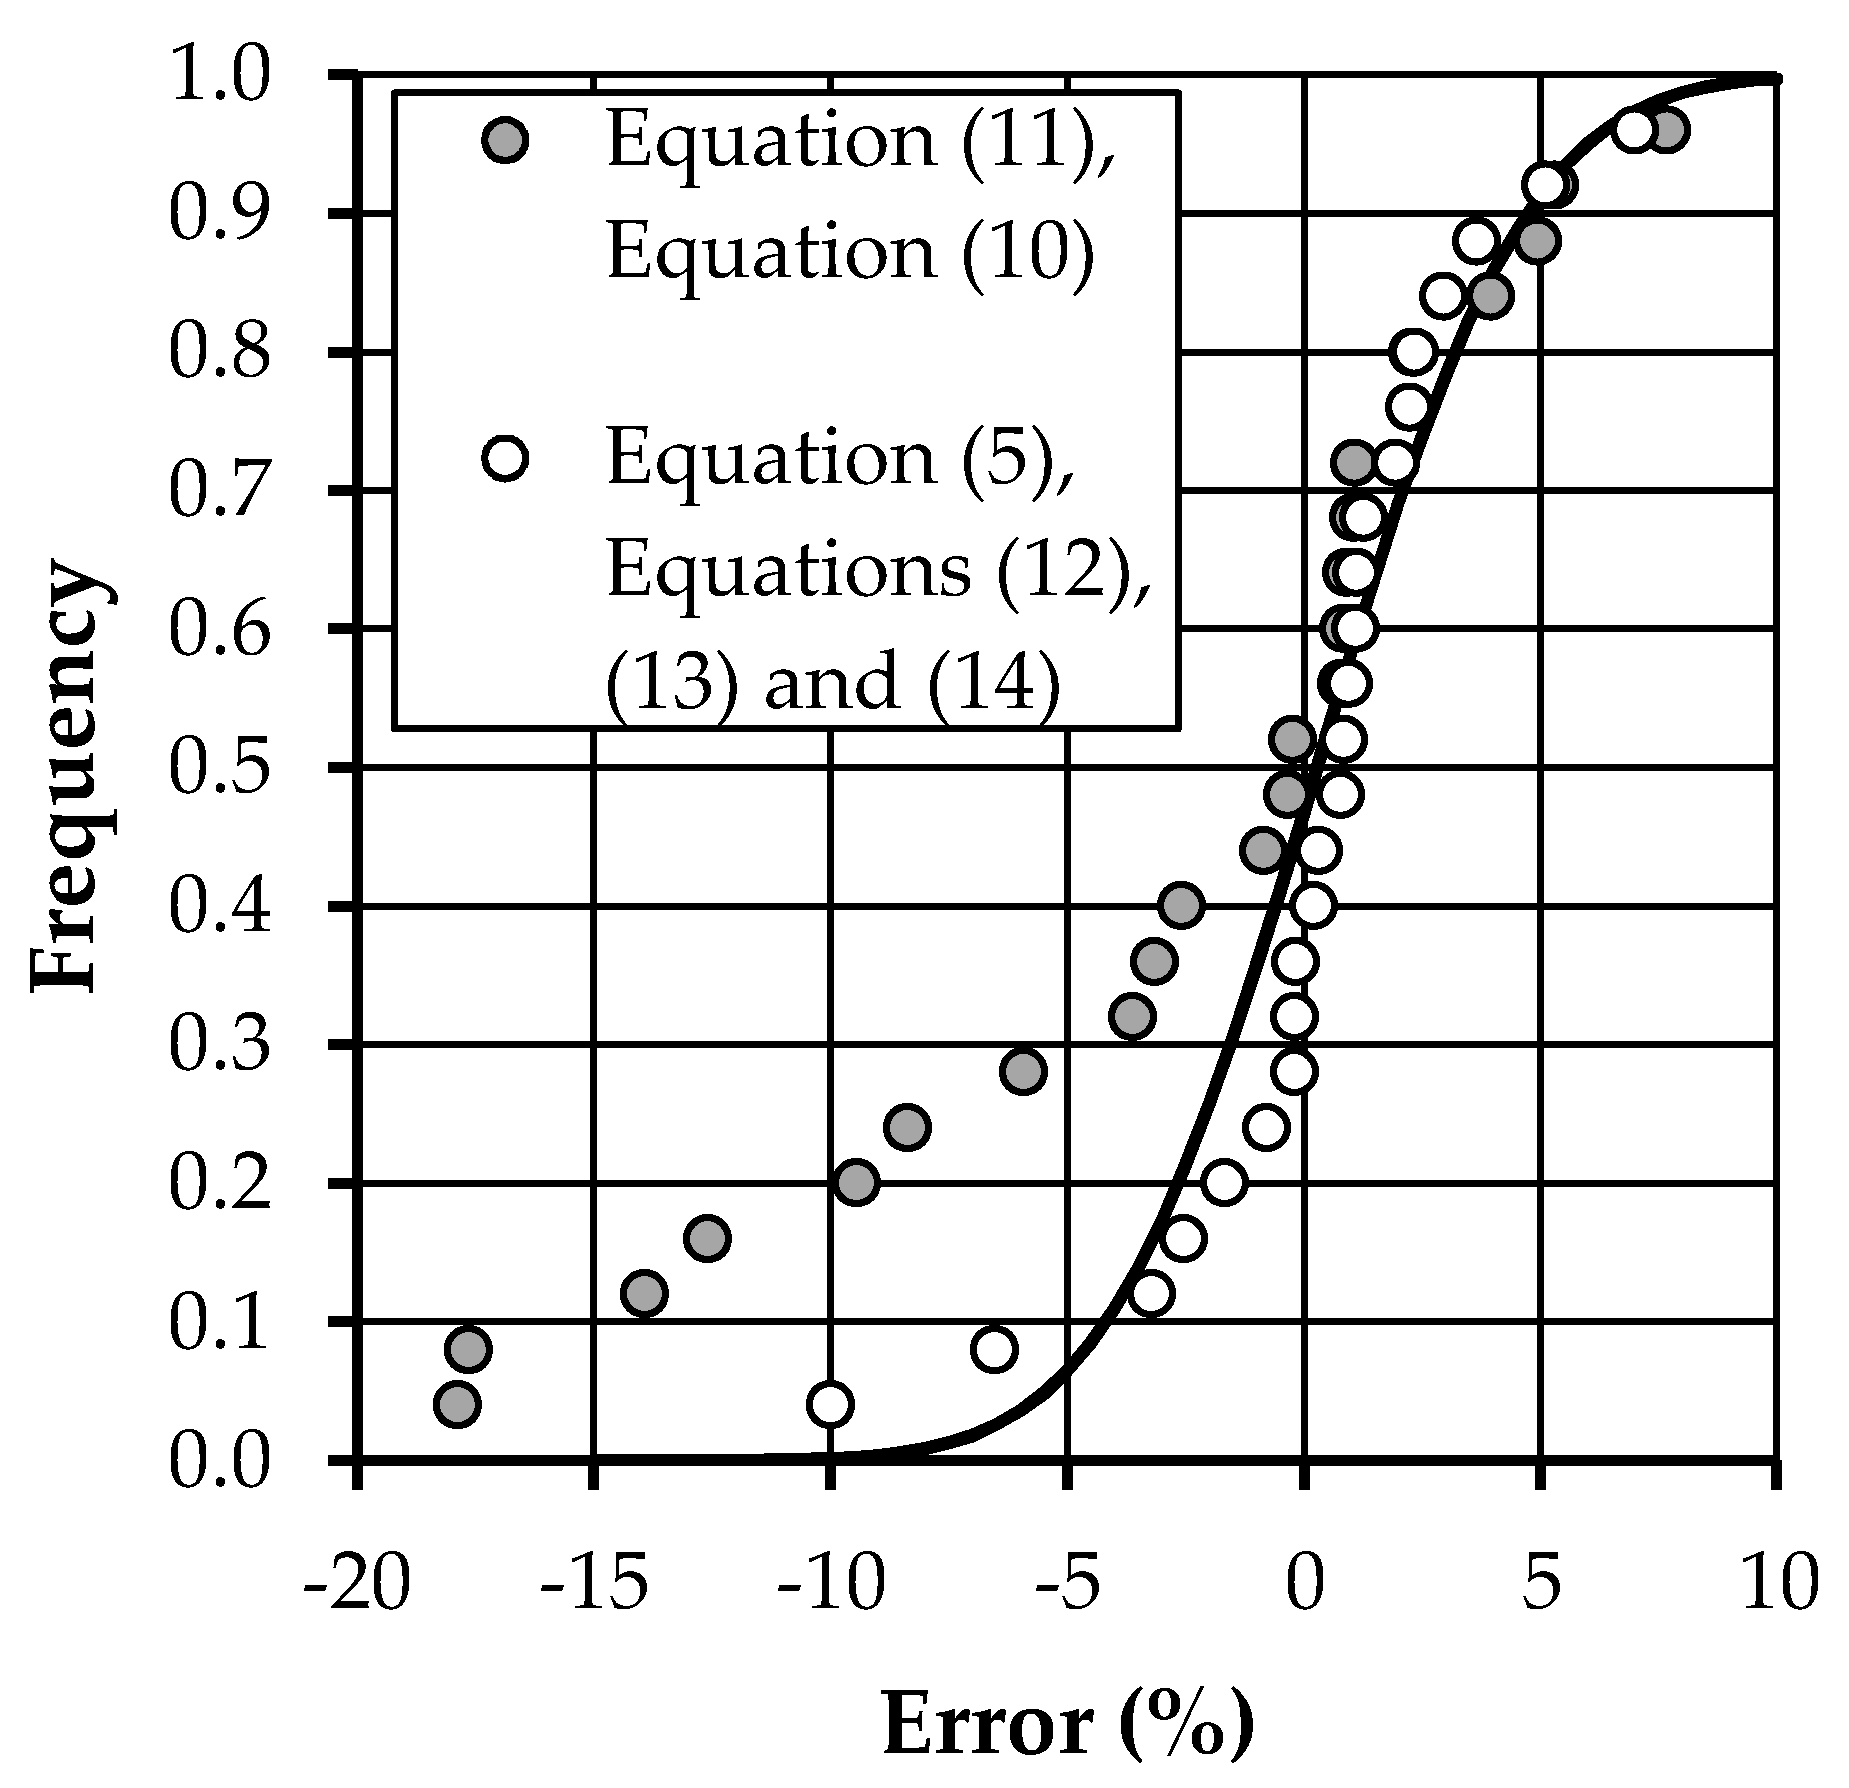
The results plotted in Figure 7 demonstrated that taking into account the influence of the flow turbulence, using the flow Reynolds number and Equation (5) coupled with Equations (12)–(14), improves considerably the estimate accuracy of the Darcy–Weisbach friction factor. The better accuracy of Equation (5) coupled with Equations (12)–(14) as compared to Equation (11) coupled with Equation (10) is also shown in Figure 8 in which the corresponding error distributions are plotted. The errors associated with the former are also normally distributed with a mean value of 0.272% and a standard deviation of 3.48%.
5. Conclusions
The development of rills on a hillslope whose soil is amended by biochar is still a topic to be developed. A theoretical rill flow resistance equation, obtained by the integration of a power velocity distribution, was assessed using measurements performed by Li et al. [42]. These measurements were carried out at plot scale using a single soil in which the biochar was incorporated and mixed with the arable soil using two biochar contents (BC = 6 and 12 kg m−2).
The developed analysis demonstrated that an accurate estimate of the velocity profile parameter Γv can be obtained by the proposed Equation (12) using an exponent e of Re which decreases for increasing BC values. This last result highlights that the increase of biochar contents dumps the effect of flow turbulence. In conclusion, the available measurements and the developed analysis allowed (i) the calibration of the relationship between Γv, the bed slope, the flow Froude number, and the Reynolds number, (ii) the assessment of the influence of biochar content on flow resistance, and (iii) to state that the theoretical flow resistance equation gives an accurate estimate of the Darcy–Weisbach friction factor for rill flows on biochar added soils.
The measurements by Li et al. [42] were carried out by a single loam soil, a corn straw biochar, and five plot slope angles less than or equal to 7.2°. The relationship between the soil grain-size and the biochar particle size, affecting the particle transport, and their influence on rill flow resistance should be investigated. The formation of macro-aggregates in the biochar-amended soils could limit rill erosion and affect rill flow resistance.
Since some researchers believed that biochar is more suitable on hillslopes with slope angles of less than 15°, the influence of slope gradient on rill flow resistance in biochar-added soils should be tested. The slope limit for which the biochar addition represents a soil conservation strategy to limit soil erosion has to be established. Taking into account that the measurements by Li et al. [42] were carried out only for two biochar contents, the effect of biochar content on the rill flow resistance law should be more extensively studied. The optimal application of a biochar amount to reduce runoff and soil loss also has to be determined.
Author Contributions
Conceptualization, A.N., V.P., V.F, formal analysis, A.N., V.P., V.F., investigation, A.N., V.P., V.F., methodology, A.N., V.P., V.F., writing-review & editing, A.N., V.P., V.F. All authors have read and agreed to the published version of the manuscript.
Funding
This research received no external funding.
Institutional Review Board Statement
Not applicable.
Informed Consent Statement
Not applicable.
Data Availability Statement
The data presented in this study are available on the paper by Li et al. [42].
Conflicts of Interest
The authors declare no conflict of interest.
References
- Borrelli, P.; Robinson, D.A.; Fleischer, L.R.; Lugato, E.; Ballabio, C.; Alewell, C.; Meusburger, K.; Modugno, S.; Schutt, B.; Ferro, V.; et al. An assessment of the global impact of the 21st century land use change on soil erosion. Nat. Commun. 2017, 8, 1–13. [Google Scholar]
- Panagos, P.; Standardi, G.; Borrelli, P.; Lugato, E.; Montanarella, L.; Bosello, F. Cost of agricultural productivity loss due to soil erosion in the European Union: From direct cost evaluation approaches to the use of macroeconomic models. Land Degrad. Dev. 2018, 29, 471–484. [Google Scholar] [CrossRef]
- Di Stefano, C.; Ferro, V. Establishing soil loss tolerance: An overview. J. Agric. Eng. 2016, 47, 127–133. [Google Scholar] [CrossRef] [Green Version]
- Munodawafa, A. Assessing nutrient losses with soil erosion under different tillage systems and their implications on water quality. Phys. Chem. Earth 2007, 32 Pt A/B/C, 1135–1140. [Google Scholar] [CrossRef]
- Di Stefano, C.; Ferro, V.; Palazzolo, E.; Panno, M. Sediment Delivery Processes and Agricultural Non-point Pollution in a Sicilian Basin. J. Agric. Eng. Res. 2000, 77, 103–112. [Google Scholar] [CrossRef]
- Pimentel, D. Soil erosion: A food and environmental threat. Environ. Dev. Sustain. 2006, 8, 119–137. [Google Scholar] [CrossRef]
- Mutchler, C.K.; Young, R.A. Soil detachment by raindrops. In Present and Prospective Technology for Predicting Sediment Yields and Sources; USDA Sedimentation Laboratory: Oxford, MS, USA, 1975; ARS-S-40; pp. 113–117. [Google Scholar]
- Zhang, P.; Tang, H.; Yao, W.; Zhang, N.; Xizhi, L.V. Experimental investigation of morphological characteristics of rill evolution on loess slope. Catena 2016, 137, 536–544. [Google Scholar] [CrossRef]
- Bagarello, V.; Ferro, V. Plot-scale measurements of soil erosion at the experimental area of Sparacia (southern Italy). Hydrol. Process. 2004, 18, 141–157. [Google Scholar] [CrossRef]
- Bagarello, V.; Ferro, V. Analysis of soil loss data from plots of different length for the Sparacia experimental area, Sicily, Italy. Byosyst. Eng. 2010, 105, 411–422. [Google Scholar] [CrossRef]
- Govers, G.; Giménez, R.; Van Oost, K. Rill erosion: Exploring the relationship between experiments, modeling and field observations. Earth Sci. Rev. 2007, 8, 87–102. [Google Scholar] [CrossRef]
- Bruno, C.; Di Stefano, C.; Ferro, V. Field investigation on rilling in the experimental Sparacia area, South Italy. Earth Surf. Process. Landf. 2008, 33, 263–279. [Google Scholar] [CrossRef]
- Bagarello, V.; Di Stefano, C.; Ferro, V.; Pampalone, V. Establishing a soil loss threshold for limiting rilling. J. Hydrol. Eng. 2015, 20, C6014001. [Google Scholar] [CrossRef]
- Di Stefano, C.; Ferro, V.; Pampalone, V.; Sanzone, F. Field investigation of rill and ephemeral gully erosion in the Sparacia experimental area, South Italy. Catena 2013, 101, 226–234. [Google Scholar] [CrossRef]
- Di Stefano, C.; Ferro, V.; Pampalone, V. Modeling rill erosion at the Sparacia experimental area. J. Hydrol. Eng. 2015, 20, C5014001. [Google Scholar] [CrossRef]
- Peng, W.; Zhang, Z.; Zhang, K. Hydrodynamic characteristics of rill flow on steep slopes. Hydrol. Process. 2015, 29, 3677–3686. [Google Scholar] [CrossRef]
- Sohi, S.P.; Krull, E.; Lopezcapel, E.; Bol, R. A review of biochar and its use and function in soil. Adv. Agron. 2010, 105, 47–82. [Google Scholar]
- Woolf, D.; Amonette, J.E.; Street-Perrott, F.A.; Lehmann, J.; Joseph, S. Sustainable biochar to mitigate global climate change. Nat. Commun. 2010, 1, 1–9. [Google Scholar] [CrossRef] [Green Version]
- Conte, P.; Bertani, R.; Sgarbossa, P.; Bambina, P.; Schmidt, H.P.; Raga, R.; Lo Papa, G.; Chillura Martino, D.F.; Lo Meo, P. Recent developments in understanding biochar’s physical–chemistry. Agronomy 2021, 11, 615. [Google Scholar] [CrossRef]
- Lehmann, J.; Joseph, S. Biochar for Environmental Management: Science and Technology; Earthscan: London, UK, 2009. [Google Scholar]
- European Biochar Foundation. European Biochar Foundation Guidelines for a Sustainable Production of Biochar. 2020. Available online: https://www.european-biochar.org/biochar/media/doc/ebc-guidelines.pdf (accessed on 28 October 2021).
- Atkinson, C.J.; Fitzgerald, J.D.; Hipps, N.A. Potential mechanisms for achieving agricultural benefits from biochar application to temperate soils: A review. Plant Soil 2010, 337, 1–18. [Google Scholar] [CrossRef]
- Castellini, M.; Giglio, L.; Niedda, M.; Palumbo, A.D.; Ventrella, D. Impact of biochar addition on the physical and hydraulic properties of a clay soil. Soil Tillage Res. 2015, 154, 1–13. [Google Scholar] [CrossRef]
- Mukherjee, A.; Lal, R. Biochar impacts on soil physical properties and greenhouse gas emissions. Agronomy 2013, 3, 313–339. [Google Scholar] [CrossRef] [Green Version]
- Jien, S.H.; Wang, C.S. Effects of biochar on soil properties and erosion potential in a highly weathered soil. Catena 2013, 110, 225–233. [Google Scholar] [CrossRef] [Green Version]
- Li, Y.Y.; Zhang, F.B.; Yang, M.Y.; Zhang, J.Q.; Xie, Y.G. Impacts of biochar application rates and particle sizes on runoff and soil loss in small cultivated loess plots under simulated rainfall. Sci. Total Environ. 2019, 649, 1403–1413. [Google Scholar] [CrossRef]
- Li, Y.; Feng, G.; Tewoldec, H.; Yang, M.; Zhang, F. Soil, biochar, and nitrogen loss to runoff from loess soil amended with biochar under simulated rainfall. J. Hydrol. 2020, 591, 125318. [Google Scholar] [CrossRef]
- Sadeghi, S.H.R.; Hazbavi, Z.; Harchegani, M.K. Controllability of runoff and soil loss from small plots treated by vinasse-produced biochar. Sci. Total Environ. 2016, 541, 483–490. [Google Scholar] [CrossRef]
- Zhang, F.; Huang, C.; Yang, M.; Zhang, J.; Shi, W. Rainfall simulation experiments indicate that biochar addition enhances erosion of loess-derived soils. Land Degrad. Dev. 2019, 30, 2272–2286. [Google Scholar] [CrossRef]
- Li, Q.X.; Jin, Z.W.; Chen, X.M.; Jing, Y.; Huang, Q.R.; Zhang, J.B. Effects of biochar on aggregate characteristics of upland red soil in subtropical China. Environ. Earth Sci. 2017, 76, 372. [Google Scholar] [CrossRef]
- Lee, C.H.; Wang, C.C.; Lin, H.H.; Lee, S.S.; Tsang, D.C.W.; Jien, S.H.; Ok, Y.S. In-situ biochar application conserves nutrients while simultaneously mitigating runoff and erosion of an Fe-oxide-enriched tropical soil. Sci. Total Environ. 2018, 619–620, 665–671. [Google Scholar] [CrossRef]
- Abrol, V.; Ben-Hur, M.; Verheijen, F.G.A.; Keizer, J.J.; Martins, M.A.S.; Tenaw, H.; Tchehansky, L.; Graber, E.R. Biochar effects on soil water infiltration and erosion under seal formation conditions: Rainfall simulation experiment. J. Soils Sediments 2016, 16, 2709–2719. [Google Scholar] [CrossRef]
- Doan, T.T.; Henry-des-Tureaux, T.; Rumpel, C.; Janeau, J.L.; Jouquet, P. Impact of compost, vermicompost and biochar on soil fertility, maize yield and soil erosion in Northern Vietnam: A three year mesocosm experiment. Sci. Total Environ. 2015, 514, 147–154. [Google Scholar] [CrossRef]
- Hseu, Z.Y.; Jien, S.H.; Chien, W.H.; Liou, R.C. Impacts of biochar on physical properties and erosion potential of a mudstone slopeland soil. Sci. World J. 2014, 2014, 602197. [Google Scholar] [CrossRef]
- Lee, S.S.; Shah, H.S.; Awad, Y.M.; Kumar, S.; Ok, Y.S. Synergy effects of biochar and polyacrylamide on plants growth and soil erosion control. Environ. Earth Sci. 2015, 74, 2463–2473. [Google Scholar] [CrossRef]
- Smetanová, A.; Dotterweich, M.; Diehl, D.; Ulrich, U.; Fohrer, N. Influence of biochar and terra preta substrates on wettability and erodibility of soils. Z. Geomorphol. 2013, 57, 111–134. [Google Scholar] [CrossRef]
- Herath, H.; Camps-Arbestain, M.; Hedley, M. Effect of biochar on soil physical properties in two contrasting soils: An Alfisol and an Andisol. Geoderma 2013, 209, 188–197. [Google Scholar] [CrossRef]
- Busscher, W.J.; Novak, J.M.; Evans, D.E.; Watts, D.W.; Niandou, M.A.S.; Ahmedna, M. Influence of pecan biochar on physical properties of a norfolk loamy sand. Soil Sci. 2010, 175, 10–14. [Google Scholar] [CrossRef] [Green Version]
- Foster, G.R.; Huggins, L.F.; Meyer, L.D. A laboratory study of rill hydraulics: I. Velocity relationships. Trans. ASAE 1984, 27, 790–796. [Google Scholar] [CrossRef]
- Gilley, J.E.; Kottwitz, E.R.; Simanton, J.R. Hydraulics characteristics of rills. Trans. ASAE 1990, 27, 797–804. [Google Scholar]
- Di Stefano, C.; Ferro, V.; Palmeri, V.; Pampalone, V. Flow resistance equation for rills. Hydrol. Process. 2017, 31, 2793–2801. [Google Scholar] [CrossRef]
- Li, T.; Yu, P.; Liu, D.; Fu, Q.; Hou, R.; Zhao, H.; Xu, S.; Zuo, Y.; Xue, P. Effects of biochar on sediment transport and rill erosion after two consecutive years of seasonal freezing and thawing. Sustainability 2021, 13, 6984. [Google Scholar] [CrossRef]
- Ferro, V. New flow resistance law for steep mountain streams based on velocity profile. J. Irrig. Drain. Eng. 2017, 143, 1–6. [Google Scholar] [CrossRef]
- Ferro, V. Assessing flow resistance in gravel bed channels by dimensional analysis and self-similarity. Catena 2018, 169, 119–127. [Google Scholar] [CrossRef]
- Di Stefano, C.; Ferro, V.; Palmeri, V.; Pampalone, V. Testing slope effect on flow resistance equation for mobile bed rills. Hydrol. Process. 2018, 32, 664–671. [Google Scholar] [CrossRef]
- Di Stefano, C.; Nicosia, A.; Palmeri, V.; Pampalone, V.; Ferro, V. Comparing flow resistance law for fixed and mobile bed rills. Hydrol. Process. 2019, 33, 3330–3348. [Google Scholar] [CrossRef]
- Di Stefano, C.; Nicosia, A.; Palmeri, V.; Pampalone, V.; Ferro, V. Rill flow resistance law under equilibrium bed-load transport conditions. Hydrol. Process. 2019, 33, 1317–1323. [Google Scholar] [CrossRef]
- Di Stefano, C.; Nicosia, A.; Palmeri, V.; Pampalone, V.; Ferro, V. Estimating flow resistance in steep slope rills. Hydrol. Process. 2021, 35, e14296. [Google Scholar] [CrossRef]
- Ferro, V.; Nicosia, A. Comment on “Rill erosion processes on steep colluvial deposit slope under heavy rainfall in flume experiments with artificial rain by F. Jiang et al.”. Catena 2020, 185, 103–793. [Google Scholar] [CrossRef]
- Nicosia, A.; Di Stefano, C.; Pampalone, V.; Palmeri, V.; Ferro, V.; Nearing, M.A. Testing a new rill flow resistance approach using the water erosion prediction project experimental database. Hydrol. Process. 2019, 33, 616–626. [Google Scholar] [CrossRef]
- Palmeri, V.; Pampalone, V.; Di Stefano, C.; Nicosia, A.; Ferro, V. Experiments for testing soil texture effects on flow resistance in mobile bed rills. Catena 2018, 171, 176–184. [Google Scholar] [CrossRef]
- Carollo, F.G.; Di Stefano, C.; Nicosia, A.; Palmeri, V.; Pampalone, V.; Ferro, V. Flow resistance in mobile bed rills shaped in soils with different texture. Eur. J. Soil Sci. 2021, 72, 1–14. [Google Scholar] [CrossRef]
- Barenblatt, G.I. Dimensional Analysis; Gordon & Breach, Science Publishers Inc.: Amsterdam, The Netherlands, 1987. [Google Scholar]
- Barenblatt, G.I. Scaling laws for fully developed turbulent shear flows, part 1, Basic hypothesis and analysis. J. Fluid Mech. 1993, 248, 513–520. [Google Scholar] [CrossRef]
- Ferro, V. Applying hypothesis of self-similarity for flow-resistance law of small-diameter plastic pipes. J. Irrig. Drain. Eng. 1997, 123, 175–179. [Google Scholar] [CrossRef]
- Barenblatt, G.I.; Monin, A.S. Similarity laws for turbulent stratified flows. Arch. Ration. Mech. Anal. 1979, 70, 307–317. [Google Scholar] [CrossRef]
- Barenblatt, G.I.; Prostokishin, V.M. Scaling laws for fully developed turbulent shear flows, part 2. Processing of experimental data. J. Fluid Mech. 1993, 248, 521–529. [Google Scholar] [CrossRef]
- Butera, L.; Ridolfi, L.; Sordo, S. On the hypothesis of self-similarity for the velocity distribution in turbulent flows. Excerpta 1993, 8, 63–94. [Google Scholar]
- Ferro, V.; Pecoraro, R. Incomplete self-similarity and flow velocity in gravel bed channels. Water Resour. Res. 2000, 36, 2761–2770. [Google Scholar] [CrossRef] [Green Version]
- Castaing, B.; Gagne, Y.; Hopfinger, E.J. Velocity probability density functions of high Reynolds number turbulence. Phys. D 1990, 46, 177–200. [Google Scholar] [CrossRef]
- Barenblatt, G.I. On the scaling laws (incomplete self-similarity with respect to Reynolds numbers) for the developed turbulent flows in tubes. C. R. Acad. Sci. Ser. II 1991, 313, 307–312. [Google Scholar]
- Ferro, V.; Porto, P. Applying hypothesis of self-similarity for flow resistance law in Calabrian gravel bed rivers (Fiumare). J. Hydraul. Eng. 2018, 144, 1–11. [Google Scholar] [CrossRef]
- Ferro, V. Assessing flow resistance law in vegetated channels by dimensional analysis and self-similarity. Flow Meas. Instrum. 2019, 69, 101610. [Google Scholar] [CrossRef]
- Nicosia, A.; Di Stefano, C.; Pampalone, V.; Palmeri, V.; Ferro, V.; Polyakov, V.; Nearing, M.A. Testing a theoretical resistance law for overland flow under simulated rainfall with different types of vegetation. Catena 2020, 189, 104482. [Google Scholar] [CrossRef]
- Ferro, V. Evaluating overland flow sediment transport capacity. Hydrol. Process. 1998, 12, 1895–1910. [Google Scholar] [CrossRef]
Figure 1.
Plot of the experimental pairs Reynolds number Re- Froude number F for the examined experimental runs by Li et al. [42].
Figure 1.
Plot of the experimental pairs Reynolds number Re- Froude number F for the examined experimental runs by Li et al. [42].

Figure 2.
Comparison, for BC = 0 kg m−2, between the measured Γv values, obtained by Equation (6), and those calculated by Equation (9) (a) and between the measured friction factor values, and the ones, f, calculated by Equation (5) with Γv values estimated by Equation (9) (b).
Figure 2.
Comparison, for BC = 0 kg m−2, between the measured Γv values, obtained by Equation (6), and those calculated by Equation (9) (a) and between the measured friction factor values, and the ones, f, calculated by Equation (5) with Γv values estimated by Equation (9) (b).

Figure 3.
Comparison between the experimental pairs (X, Γv) and Equation (10) with a = 0.0297 for BC = 6 kg m−2 (a) and a = 0.0311 for BC = 12 kg m−2 (b). The red box includes experimental pairs with the highest BC value and the lowest X values.
Figure 3.
Comparison between the experimental pairs (X, Γv) and Equation (10) with a = 0.0297 for BC = 6 kg m−2 (a) and a = 0.0311 for BC = 12 kg m−2 (b). The red box includes experimental pairs with the highest BC value and the lowest X values.

Figure 4.
Comparison between the measured friction factor values, and the ones, f, calculated by Equation (11) with Γv values estimated by Equation (10) with a = 0.0276, 0.0297, and 0.0311 for BC = 0, 6, and 12 kg m−2, respectively. The red box includes experimental pairs with the highest BC value and the lowest X values.

Figure 5.
Comparison between the experimental pairs (Re, Γv/Y) and Equation (12), with a = 0.0412 and e = 0.165 for BC = 6 kg m−2 (a) and a = 0.0499 and e = 0.1414 for BC = 12 kg m−2 (b).
Figure 5.
Comparison between the experimental pairs (Re, Γv/Y) and Equation (12), with a = 0.0412 and e = 0.165 for BC = 6 kg m−2 (a) and a = 0.0499 and e = 0.1414 for BC = 12 kg m−2 (b).

Figure 6.
Relationships between the coefficients a (a) and e (b) and the biochar content BC.

Figure 7.
Comparison between the measured friction factor values, and the ones, f, calculated by Equations (5), (12)–(14).
Figure 7.
Comparison between the measured friction factor values, and the ones, f, calculated by Equations (5), (12)–(14).

Figure 8.
Frequency distribution of the errors obtained applying Equation (5) coupled with Equations (12)–(14), and Equation (11) coupled with Equation (10).
Figure 8.
Frequency distribution of the errors obtained applying Equation (5) coupled with Equations (12)–(14), and Equation (11) coupled with Equation (10).

Publisher’s Note: MDPI stays neutral with regard to jurisdictional claims in published maps and institutional affiliations. |
© 2021 by the authors. Licensee MDPI, Basel, Switzerland. This article is an open access article distributed under the terms and conditions of the Creative Commons Attribution (CC BY) license (https://creativecommons.org/licenses/by/4.0/).
Share and Cite
MDPI and ACS Style
Nicosia, A.; Pampalone, V.; Ferro, V. Effects of Biochar Addition on Rill Flow Resistance. Water 2021, 13, 3036. https://doi.org/10.3390/w13213036
AMA Style
Nicosia A, Pampalone V, Ferro V. Effects of Biochar Addition on Rill Flow Resistance. Water. 2021; 13(21):3036. https://doi.org/10.3390/w13213036
Chicago/Turabian StyleNicosia, Alessio, Vincenzo Pampalone, and Vito Ferro. 2021. "Effects of Biochar Addition on Rill Flow Resistance" Water 13, no. 21: 3036. https://doi.org/10.3390/w13213036
Note that from the first issue of 2016, this journal uses article numbers instead of page numbers. See further details here.