Article

Ascomycetes versus Spent Mushroom Substrate in Mycoremediation of Dredged Sediments Contaminated by Total Petroleum Hydrocarbons: The Involvement of the Bacterial Metabolism

1
Department of Biology, University of Pisa, 56126 Pisa, Italy
2
BD Biodigressioni srl, 56127 Pisa, Italy
*
Author to whom correspondence should be addressed.
Water 2021, 13(21), 3040; https://doi.org/10.3390/w13213040
Submission received: 11 October 2021 / Revised: 22 October 2021 / Accepted: 22 October 2021 / Published: 1 November 2021

Abstract

:
Two mycoremediation approaches for the depletion of the total petroleum hydrocarbons in dredged sediments were compared: co-composting with spent mushroom substrate (SMS) from Pleurotus ostreatus and bioaugmentation with Lambertella sp. MUT 5852, an ascomycetes autochthonous to the sediment, capable of utilizing diesel oil its sole carbon source. After 28 days of incubation, 99% depletion was observed in presence of Lambertella sp. MUT 5852. No total petroleum hydrocarbon depletion was observed in sediment co-composting with the SMS after 60 days of incubation. 16S rDNA metabarcoding of the bacterial community was performed to evaluate the potential synergism between fungi and bacteria in the bioremediation process. The functional metagenomic prediction approach indicated that the biodiversity of the bacterial genera potentially involved in the degradation of TPH was higher in sediment bioaugmented with Lambertella sp. MUT 5852, which resulted in being mandatory for TPH depletion. Mechanisms of co-substrate inhibition of the hydrocarburoclastic bacterial species, due to the bioavailable organic matter of the SMS, are suggested to be involved in the observed kinetics of TPH depletion, failing in the case of SMS and successful in the case of Lambertella sp. MUT 5852.

1. Introduction

Shipyard navigation and logistics generate costs for society because of the dredging activity of waterways produces sediments contaminated mainly by spillage of fuels [1]. Much of interest is focused on the total petroleum hydrocarbon (TPH) fraction of the contamination, because of its ubiquitous distribution and high recalcitrance to biodegradation [2,3]. Due to the huge quantities of dredged sediments to be treated at each single intervention for waterway maintenance, sustainable technologies for their recovery and/or decontamination are mandatory. Currently, the management of dredged sediments mostly consists of landfilling or natural attenuation that, with time, leads to contaminant leakages and environmental risks. Among sustainable technologies, the co-composting of soil and sediments with lignocellulosic substrates results in a valuable approach [4,5,6]. In this context it is worth mentioning co-composting with spent mushroom substrate (SMS), a lignocellulosic residue from edible fungi production, whose exploitation in the circular economy is encouraged [7]. SMS contains several nutrients, including nitrogen, phosphorus, and potassium, consisting in a source of soil/sediment fertilization and consequently microbial biostimulation [8]. At the same time, SMS is a source of fungal oxidative enzymes such as laccases and peroxidases [9,10,11,12,13]. The exploitation of SMS as an oxidising matrix in the treatment of dredged sediments produces encouraging results [12]. However, the limit of the availability of SMS in a quantity transferrable to the scale of the real intervention should be considered in the design of the process. On the other hand, bioaugmentation with fungi autochthonous to the matrix to be treated has been described as efficient in determining the depletion of the contamination in dredged sediments. In a previous experiment, the bioaugmentation of total petroleum hydrocarbon (TPH)-contaminated dredged sediments with the indigenous ascomycetes Lambertella sp. MUT 5852 showed encouraging results [6]. The scope of this manuscript was to compare the effect of two promising treatments for the decontamination of TPH-contaminated dredged sediments (2964 ± 99 mg/kg on a dry weight base ratio): the co-composting of the sediments with SMS deriving from the industrial production of P. ostreatus, and bioaugmentation with Lambertella sp. MUT 5852, indigenous to the sediments in treatment. The study aimed to evaluate the kinetics of TPH degradation and the response of the bacterial community to the different treatments. To this end, a predictive functional metagenomic approach to the study of the bacterial ecology was adopted to envisage the bacterial genera involved in the degradation of the contamination. As a marker of the active fungal metabolisms [14,15] the ergosterol content in the two different experimental conditions was measured, in parallel to the quantification of the humic and fulvic acid content.

2. Materials and Methods

2.1. TPH Contaminated Dredged Sediment: Sediment, Fungal Strain, Diesel Oil and Chemicals

The contaminated sediments were dredged in the Navicelli Channel, Pisa, Italy (43°41′55.90″ N; 10°22′50.80″ E). The characteristics of the dredged sediment are reported in Table 1. The fungal strain, Lambertella sp. MUT 5852, had been previously isolated from the same site [6]. The SMS was recovered from a local industrial producer of P. osteatus. All the chemicals used were of analytical grade and purchased from Merck (Milan, Italy).

2.2. Mesocosms-Scale Experimentation

A total of 36 experimental replicates (mesocosm glass pots), each containing 1 kg of dredged sediments, were prepared and maintained in a temperature-controlled (21 ± 1 °C) dark chamber at 60% soil maximum water-holding capacity (WHCmax = 9.6% dry mass). A total of 18 mesocosms were co-composted with SMS deriving from the industrial production of P. ostreatus—more precisely, a total of 9 with 20% on a weight-based ratio of SMS, the remaining 9 mesocosms with 20% autoclaved SMS (121 ± 1 °C, 1 Atm, for 1 h). A total of 18 mesocosms were co-composted with 20% on a weight-based ratio of lignocellulosic matrices (wood chip) utilised to grow the P. ostreatus. A total of 9 of these latter were bioaugmented with fresh biomass of Lambertella sp. MUT 5852 grown in ME medium (malt broth, 20 g; yeast extract, 5 g in 1 L H2O) at 10% on a fresh-weight-based ratio; 9 mesocosms were inoculated with the same biomass after autoclavation (121 ± 1 °C, 1 Atm, for 20 min). All pots were routinely manually mixed every 3 days of incubation and checked for water content. At the time of mesocosm assemblage, after 30 and 60 days of incubation, 3 mesocosms amended with SMS and 3 mesocosms amended with autoclaved SMS were sacrificed and analysed for TPH. The mesocosms showing TPH depletion were measured for ergosterol and humic and fulvic acid content. At the time the mesocosms were set up, after 18 and 28 days of incubation, 3 mesocosms bioaugmented with Lambertella sp. MUT 5852 and 3 mesocosms bioaugmented with autoclaved Lambertella sp. MUT 5852 were analysed as described for mesocosms co-composting with SMS.

2.3. Metabarcoding Analysis

The total DNA from the dredged sediment was extracted using a FastPrep 24™ homogenizer and FAST DNA spin kit for soil (MP Biomedicals), starting from 500 mg of sample, according to the manufacturer’s protocol. The quantity of DNA was measured using a Qubit 3.0 fluorometer (ThermoFisher Scientific, Milan, Italy). The DNA purity and quality was determined spectrophotometrically (Biotek Powerwave Xs Microplate spectrophotometer, Milan, Italy) by measuring absorbance at 260/280 and 260/230 nm. A total of 200 ng of DNA was used to produce paired-end libraries and for sequencing the V4–V5 hypervariable regions of the bacterial 16S rRNA gene by using the 515F forward primer (5′-GTGCCAGCMGCCG CGGTAA-3′) and 907R reverse primer (5′-CCGTCAATTCCTTTGAGTTT-3′) as primers. The libraries for Illumina sequencing were prepared by Novogene using NEBNext Ultra DNA Library Prep Kit, following the manufacturer’s recommendations, and index codes were added. The library was sequenced on an Illumina platform by Novogene (Novogene Company Limited Rm.19C, Lockhart Ctr., 301–307, Lockhart Rd. Wan Chai, Hong Kong), and 250 bp paired-end reads were generated. The sequences have been deposited at the Sequence Read Archive (SRA) database, National Center for Biotechnology Information (NCBI) with the projects ID numbers PRJNA770268.

2.4. Data Analysis

Paired-end reads were demultiplexed and trimmed by Cutadapt plugin for Qiime2. Forward and reverse reads were assembled, quality filtered, chimera filtered and assigned to amplicon sequence variants (ASVs) following Qiime2 v.2021.2 standard pipeline. Amplicon sequence variants (ASVs) clustering was performed using DADA2 workflow implemented in Qiime2, with two classifiers trained on the V4–V5 hypervariable region extracted from the Silva 138 99% 16S sequences database. To allow comparison between different samples, ASV abundance per sample data were normalized by rarefaction to the same coverage (99.5% of observed species). Subsequent analyses of α-diversity indexes (Chao1, Hill–Shannon and Hill–Simpson diversity indexes, and rarefaction curves of observed species of non-rarefied samples) and β-diversity by principal coordinate analysis (PCoA) based on UniFrac distance, canonical correspondence analysis (CCA), and related statistical tests were performed on R 4.1.1 using Phyloseq, Vegan, and Pheatmap packages (versions 1.37.0, 2.5-7 and 1.0.12), respectively. Parametric statistics (Kruskal–Wallis test and related post-hoc tests) on chemical data were performed by ggpubr (version 0.4.0.999). The functional metagenomic prediction for the bacterial community was inferred using PICRUSt2 v. 2.4.1 for unstratified and stratified metagenome contribution based on EC numbers. The KEGG pathway and EC contributions were filtered from the output data of PICRUSt2 v. 2.4.1 and processed by R v. 4.1.1. The graphical output was produced by ggplot2 package v. 3.3.5 and Pheatmap v. 1.0.12.

2.5. Quantification of Total Petroleum Hydrocarbons, Humic Acid, Fulvic Acid, and Ergosterol in Soil Samples

Quantification of TPH in soil samples was performed following a modified ISO16703:2004 method for total hydrocarbons C10–C40. Soil samples were dried for 5 days at room temperature, manually ground and sieved at 2 mm, and weighted. 20 g of sieved soil were solvent-extracted by 60 mL acetone: n-heptane 2:1 v/v and mechanical shaking at 120 rpm for 1 h. The extraction solvent contained dodecane (10 μL/L) and tetracontane (10 mg/L) as internal standards. Recovered solvent was washed twice with H2O (100 mL each). The purification of the solid phase (Florisil®) was skipped. The quantification of extracted organic compounds was performed by gas chromatography with a flame ionization detector (GC-FID, 890B Agilent Technologies, Milan, Italy), previously calibrated by dilutions of a 1:1 w/w mixing of mineral oil A and mineral oil B commercial standards (Merck, Milan, Italy) in the range of 50–8000 ppm. Integration was performed with an x-axis baseline, after blank subtraction, between the internal standard peaks. For humic and fulvic acid quantification, 10 g of soil, prepared as described before, was extracted with 100 mL of 0.1 M sodium pyrophosphate and sodium hydroxide, and deaerated by N2 bubbling for a minute. The mechanical extraction was performed in a Dubnoff water-bath for 24 h at 65 °C and 80 rpm. The cooled down supernatant was centrifuged at 2700 rpm for 20 min and filtered at 0.45 mm on a cellulose–acetate membrane. The humic fraction was precipitated at a pH below 2, obtained by dropwise addition of H2SO4 50% v/v, separated, and dissolved again in 50 mL of NaOH 0.5 M. Residual supernatant (containing fulvic acids and other organic compounds) was cleaned up by solid phase extraction (SPE) partition on polyvinylpyrrolidone resin slurry, previously conditioned to pH 1.5. The loaded solution was washed by 25 mL of H2SO4 0.005 M, and then eluted by NaOH 0.5 M: the flowthrough was discarded until the first brown drops and then collected until colourless. The final volume was adjusted at 50 mL. A total of 10 mL of each the extracted phases was digested separately by 20 mL of potassium bichromate 0.3334 M, 26 mL of H2SO4 96%, and AgSO4 at 160 °C. The reaction was stopped after 10 min by dilution to 200 mL with cold water. A quantity of 20 mL of the resulting solution was added to 100 mL of water, 8 mL of H3PO4 85%, and 0.5 mL of redox indicator (4-diphenylamino sulfonate sodium salt in concentrated sulfuric acid) and titrated with a solution of FeSO4 0.2 M. For ergosterol quantification, 10 g of soil prepared as described before was sonicated in a methanolic solution of KOH (10%, w/v) and maintained at 70 °C for 90 min. The digestate was extracted 3 times with cyclohexane, and the solvent collected was pooled and exchanged to methanol (final volume 1 mL). Quantification was performed by RP-HPLC UV-DAD equipped with a LiChroCART® 250 LiChrospher®100 RP-18 (5 μm) isocratically with 100% methanol at a flow rate of 1 mL/min at 282 nm. The D’Agostino and Pearson omnibus normality test was adopted for the quantification of the residuals of TPH, ergosterol, and HFA.

3. Results

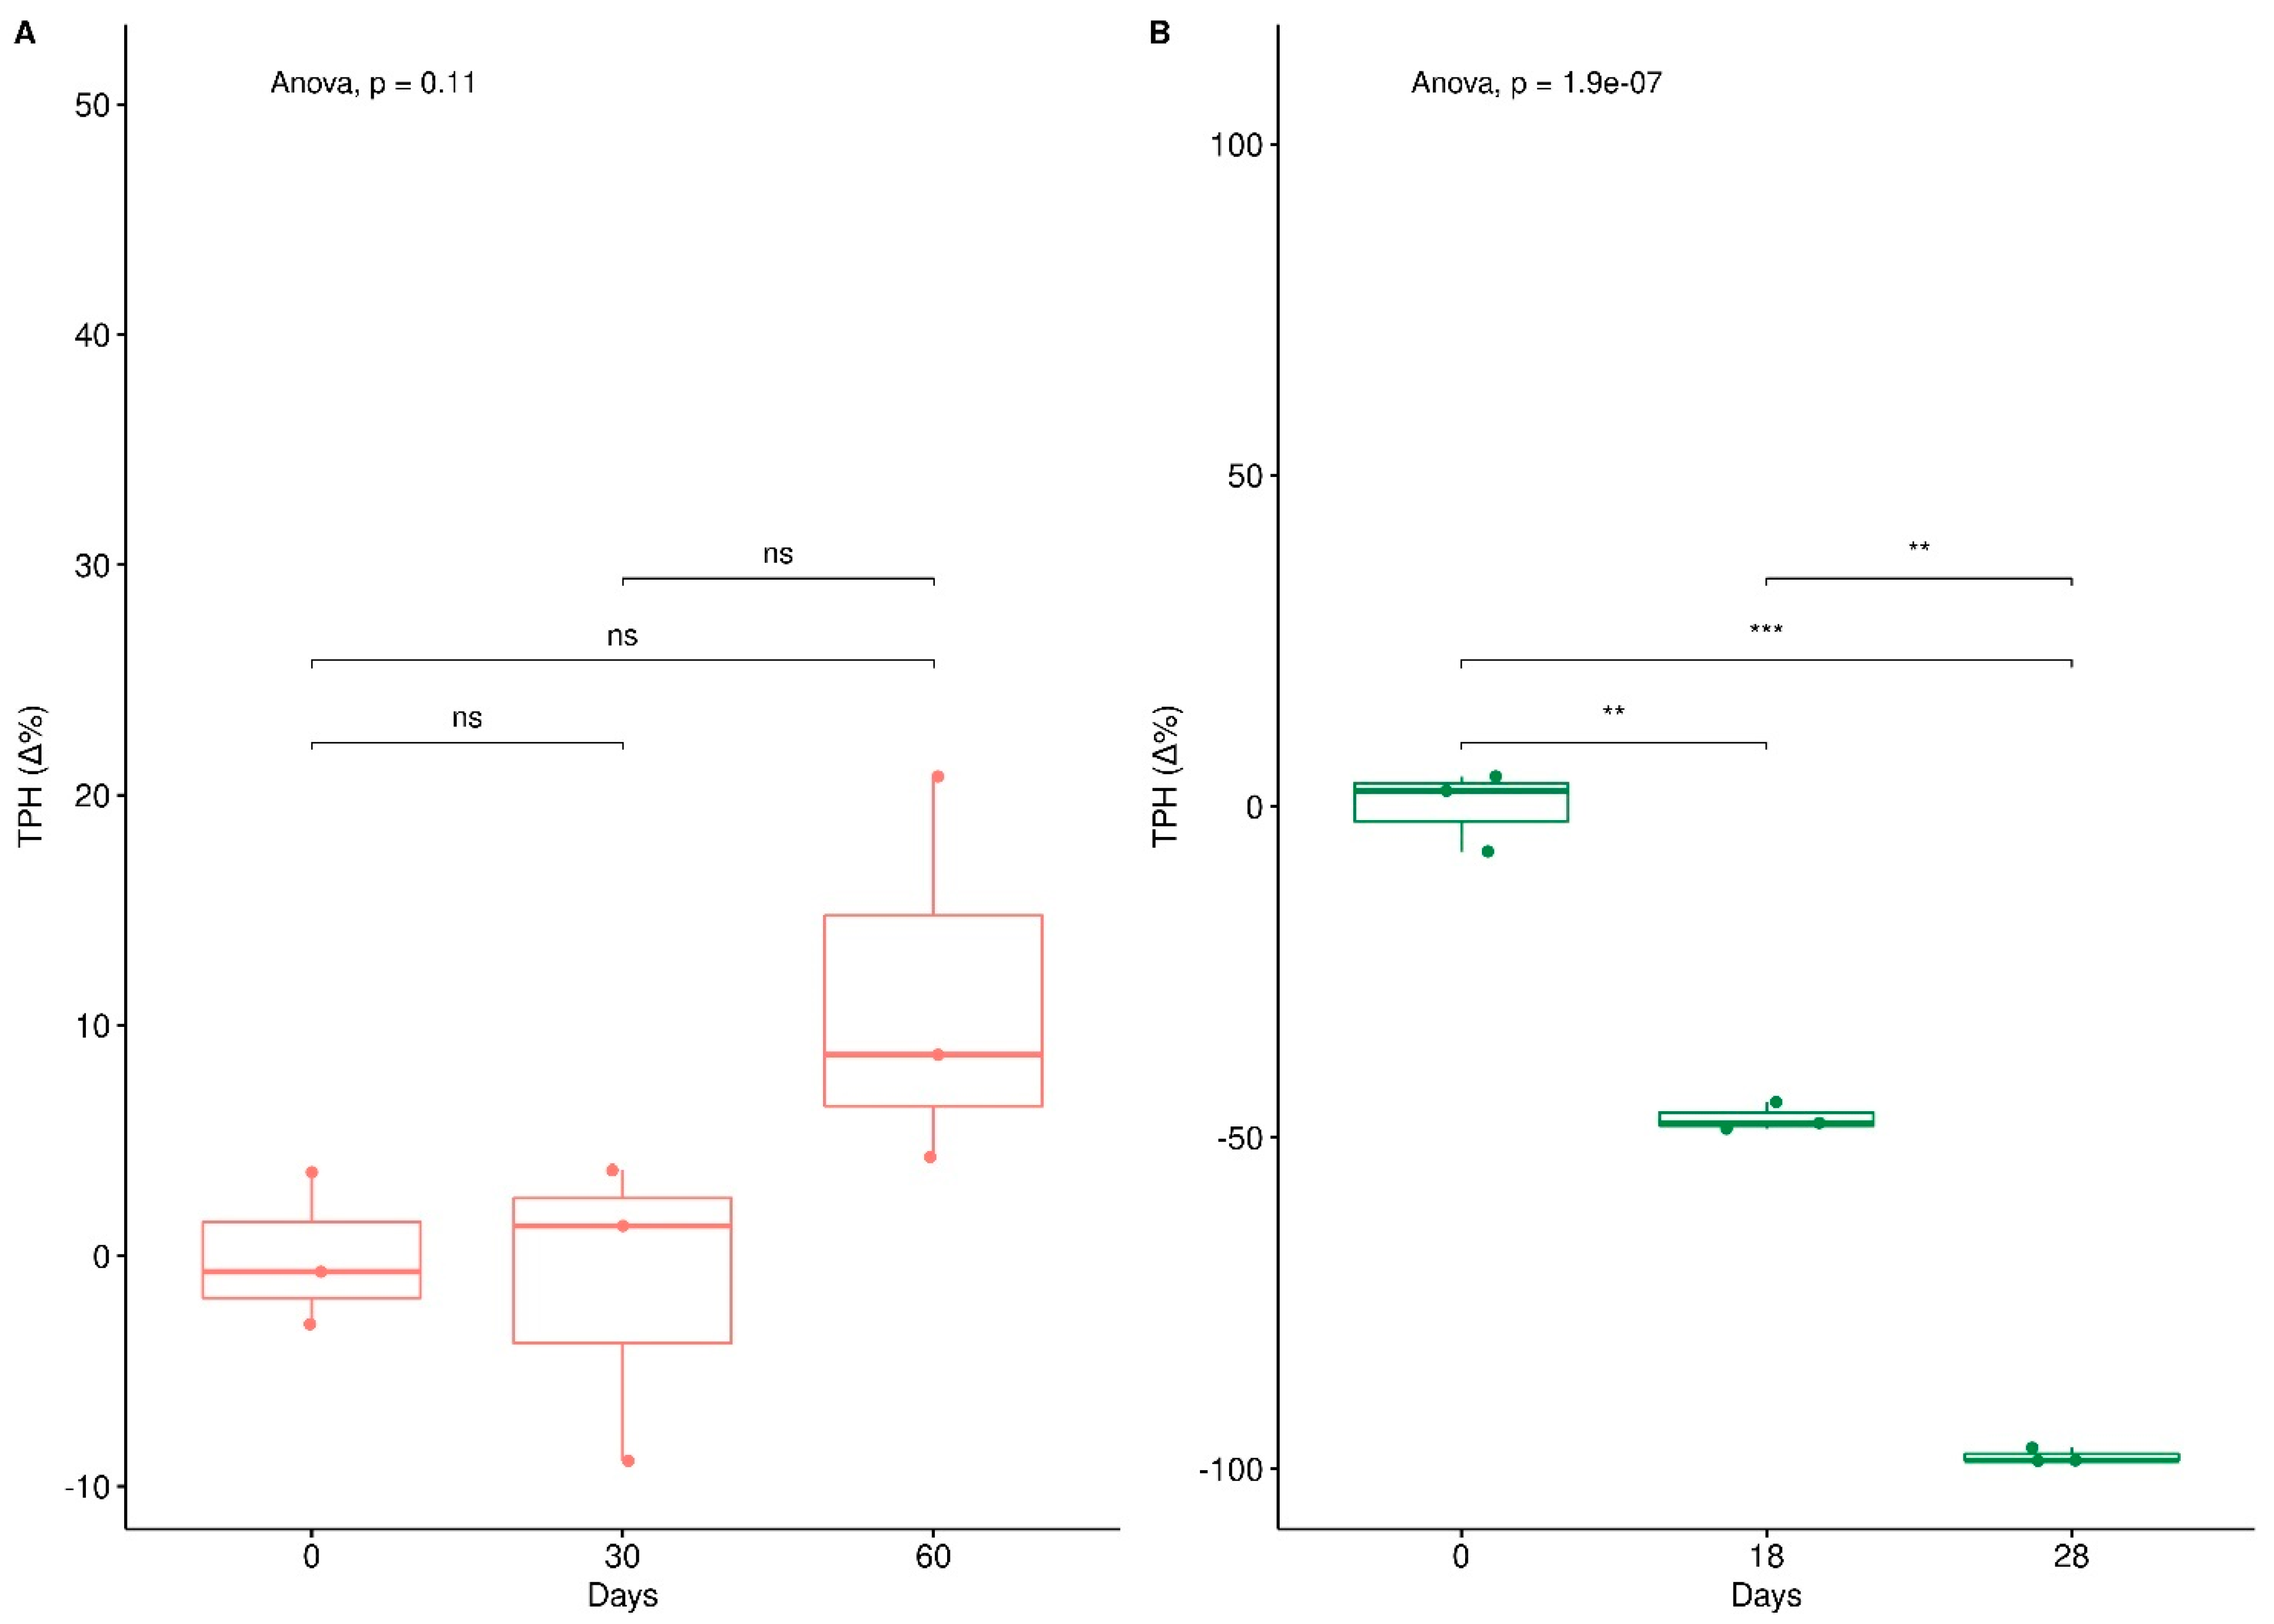
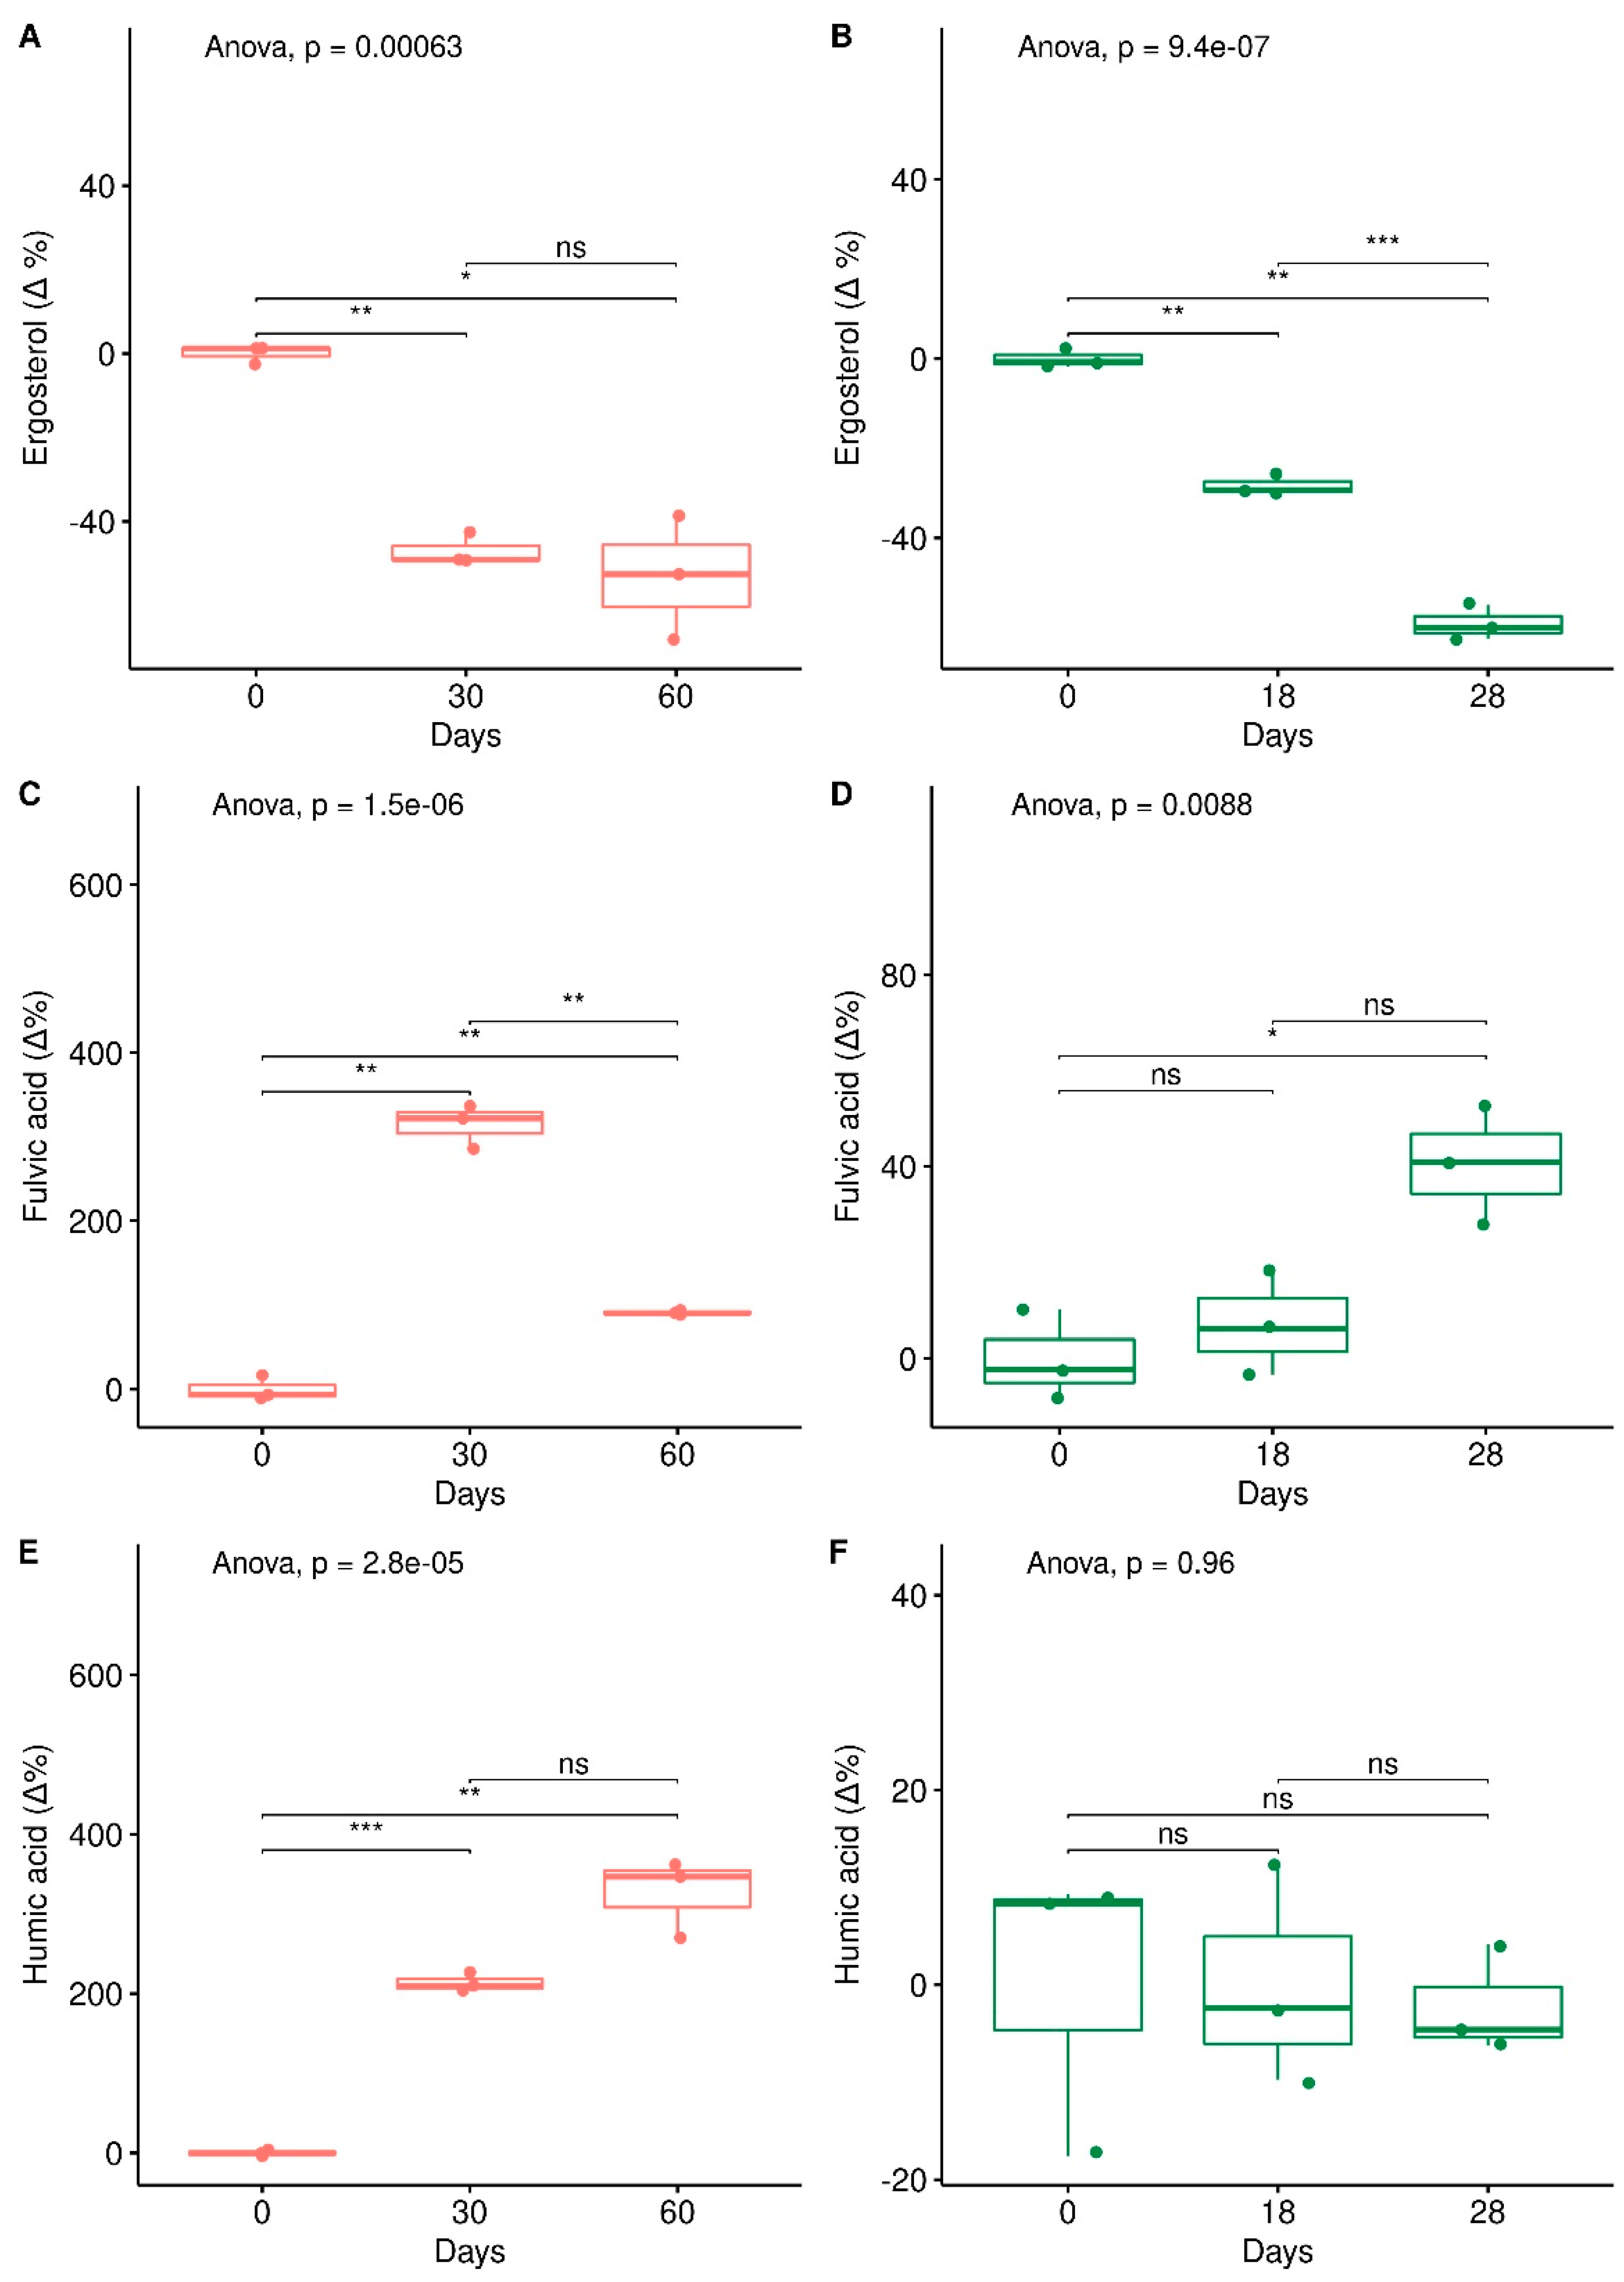
3.1. Depletion of Total Petroleum Hydrocarbons and Humic and Fulvic Acid and Ergosterol Content in Mesocosms

The mixing of SMS and wood chips as bulking agents to clayey matrices is indeed routinely exploited to improve the granulometry of the matrices to be treated by aerobic processes. The presence of a bulking agent is mandatory for eliciting gas exchanges and oxidative processes in the matrix in treatment. The co-composting of dredged sediments with the SMS was not accompanied by a significant decrease in TPH content after 60 days of incubation (Figure 1A). Similar results were obtained in the presence of the autoclaved SMS and autoclaved Lambertella sp. MUT 5852 (data not shown). On the other hand, bioaugmentation with metabolically active Lambertella sp. MUT 5852 was accompanied by a nearly complete depletion of TPH content at 28 days of incubation (Figure 1B). The content of ergosterol showed a constant decrease with time of incubation in both experimental conditions (Figure 2A,B). A slight increase in fulvic acid was observed in mesocosms bioaugmented with Lambertella sp. MUT 5852 (Figure 2D). An increase in the humic acid fraction was observed only in the mesocosms co-composting with the SMS (Figure 2E). In the same mesocosms, a peak in the fulvic fraction after 30 days of incubation followed by a decrease in content with the time of incubation was observed (Figure 2C).

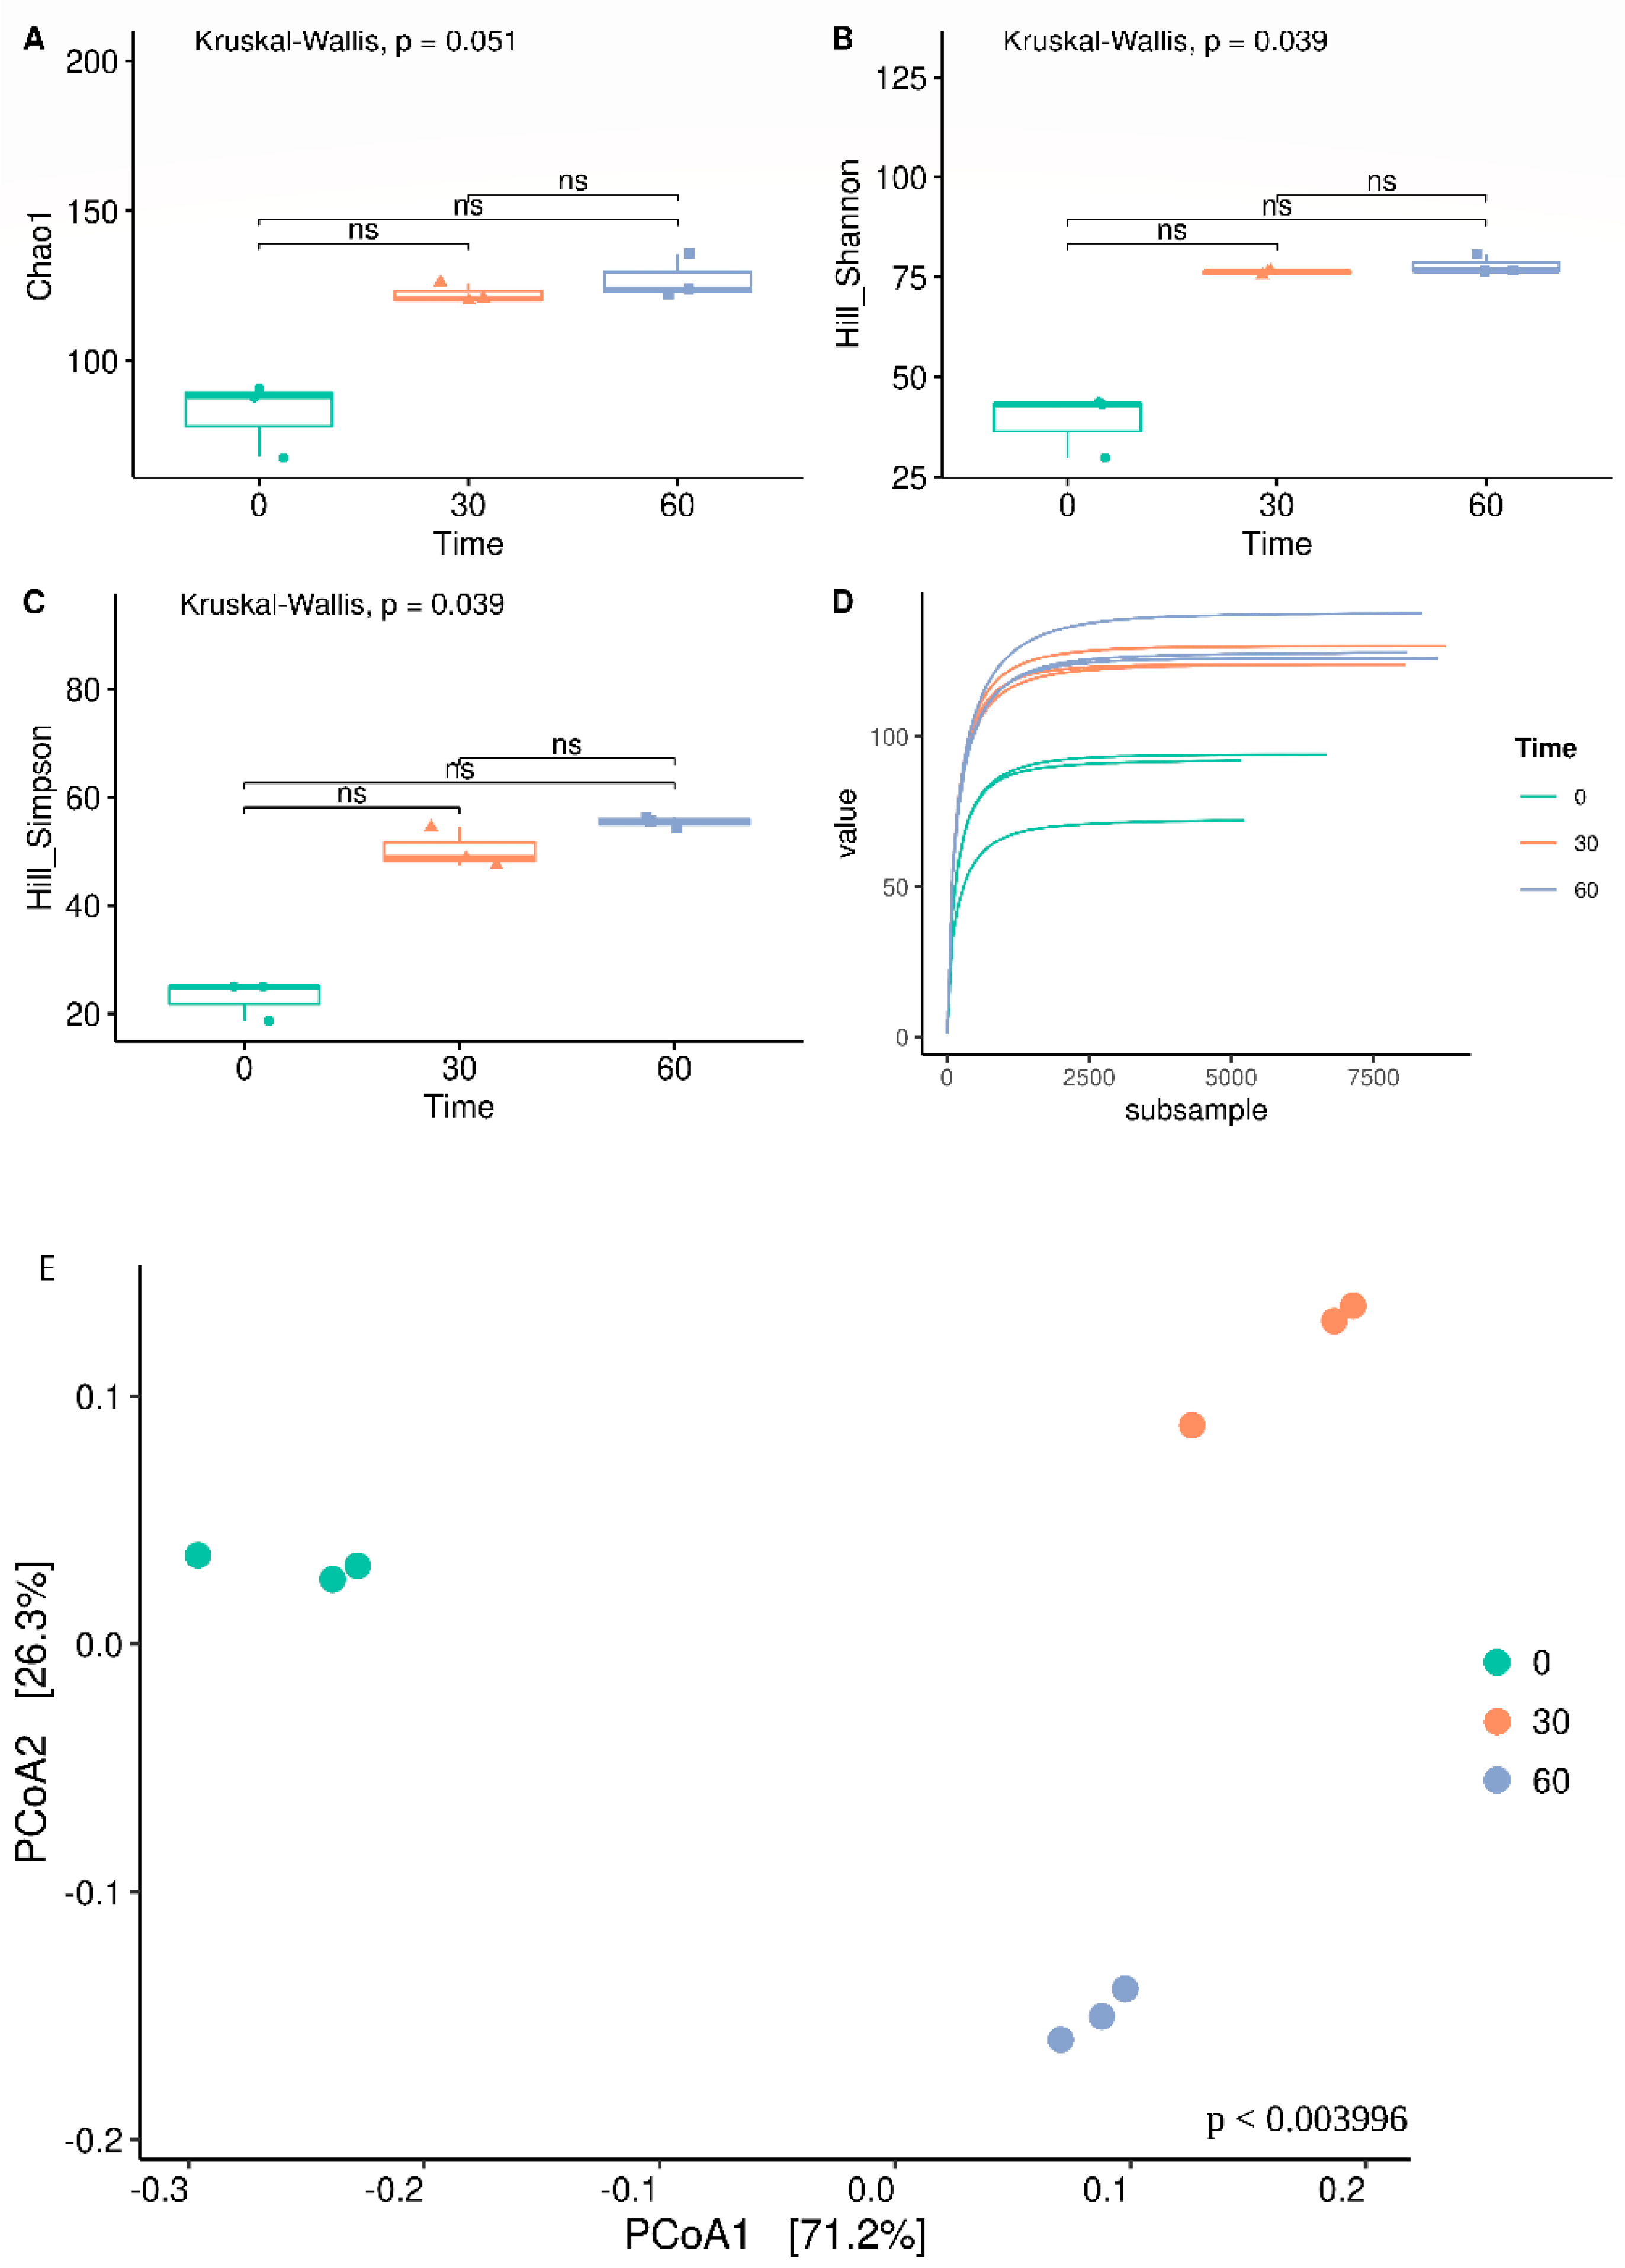
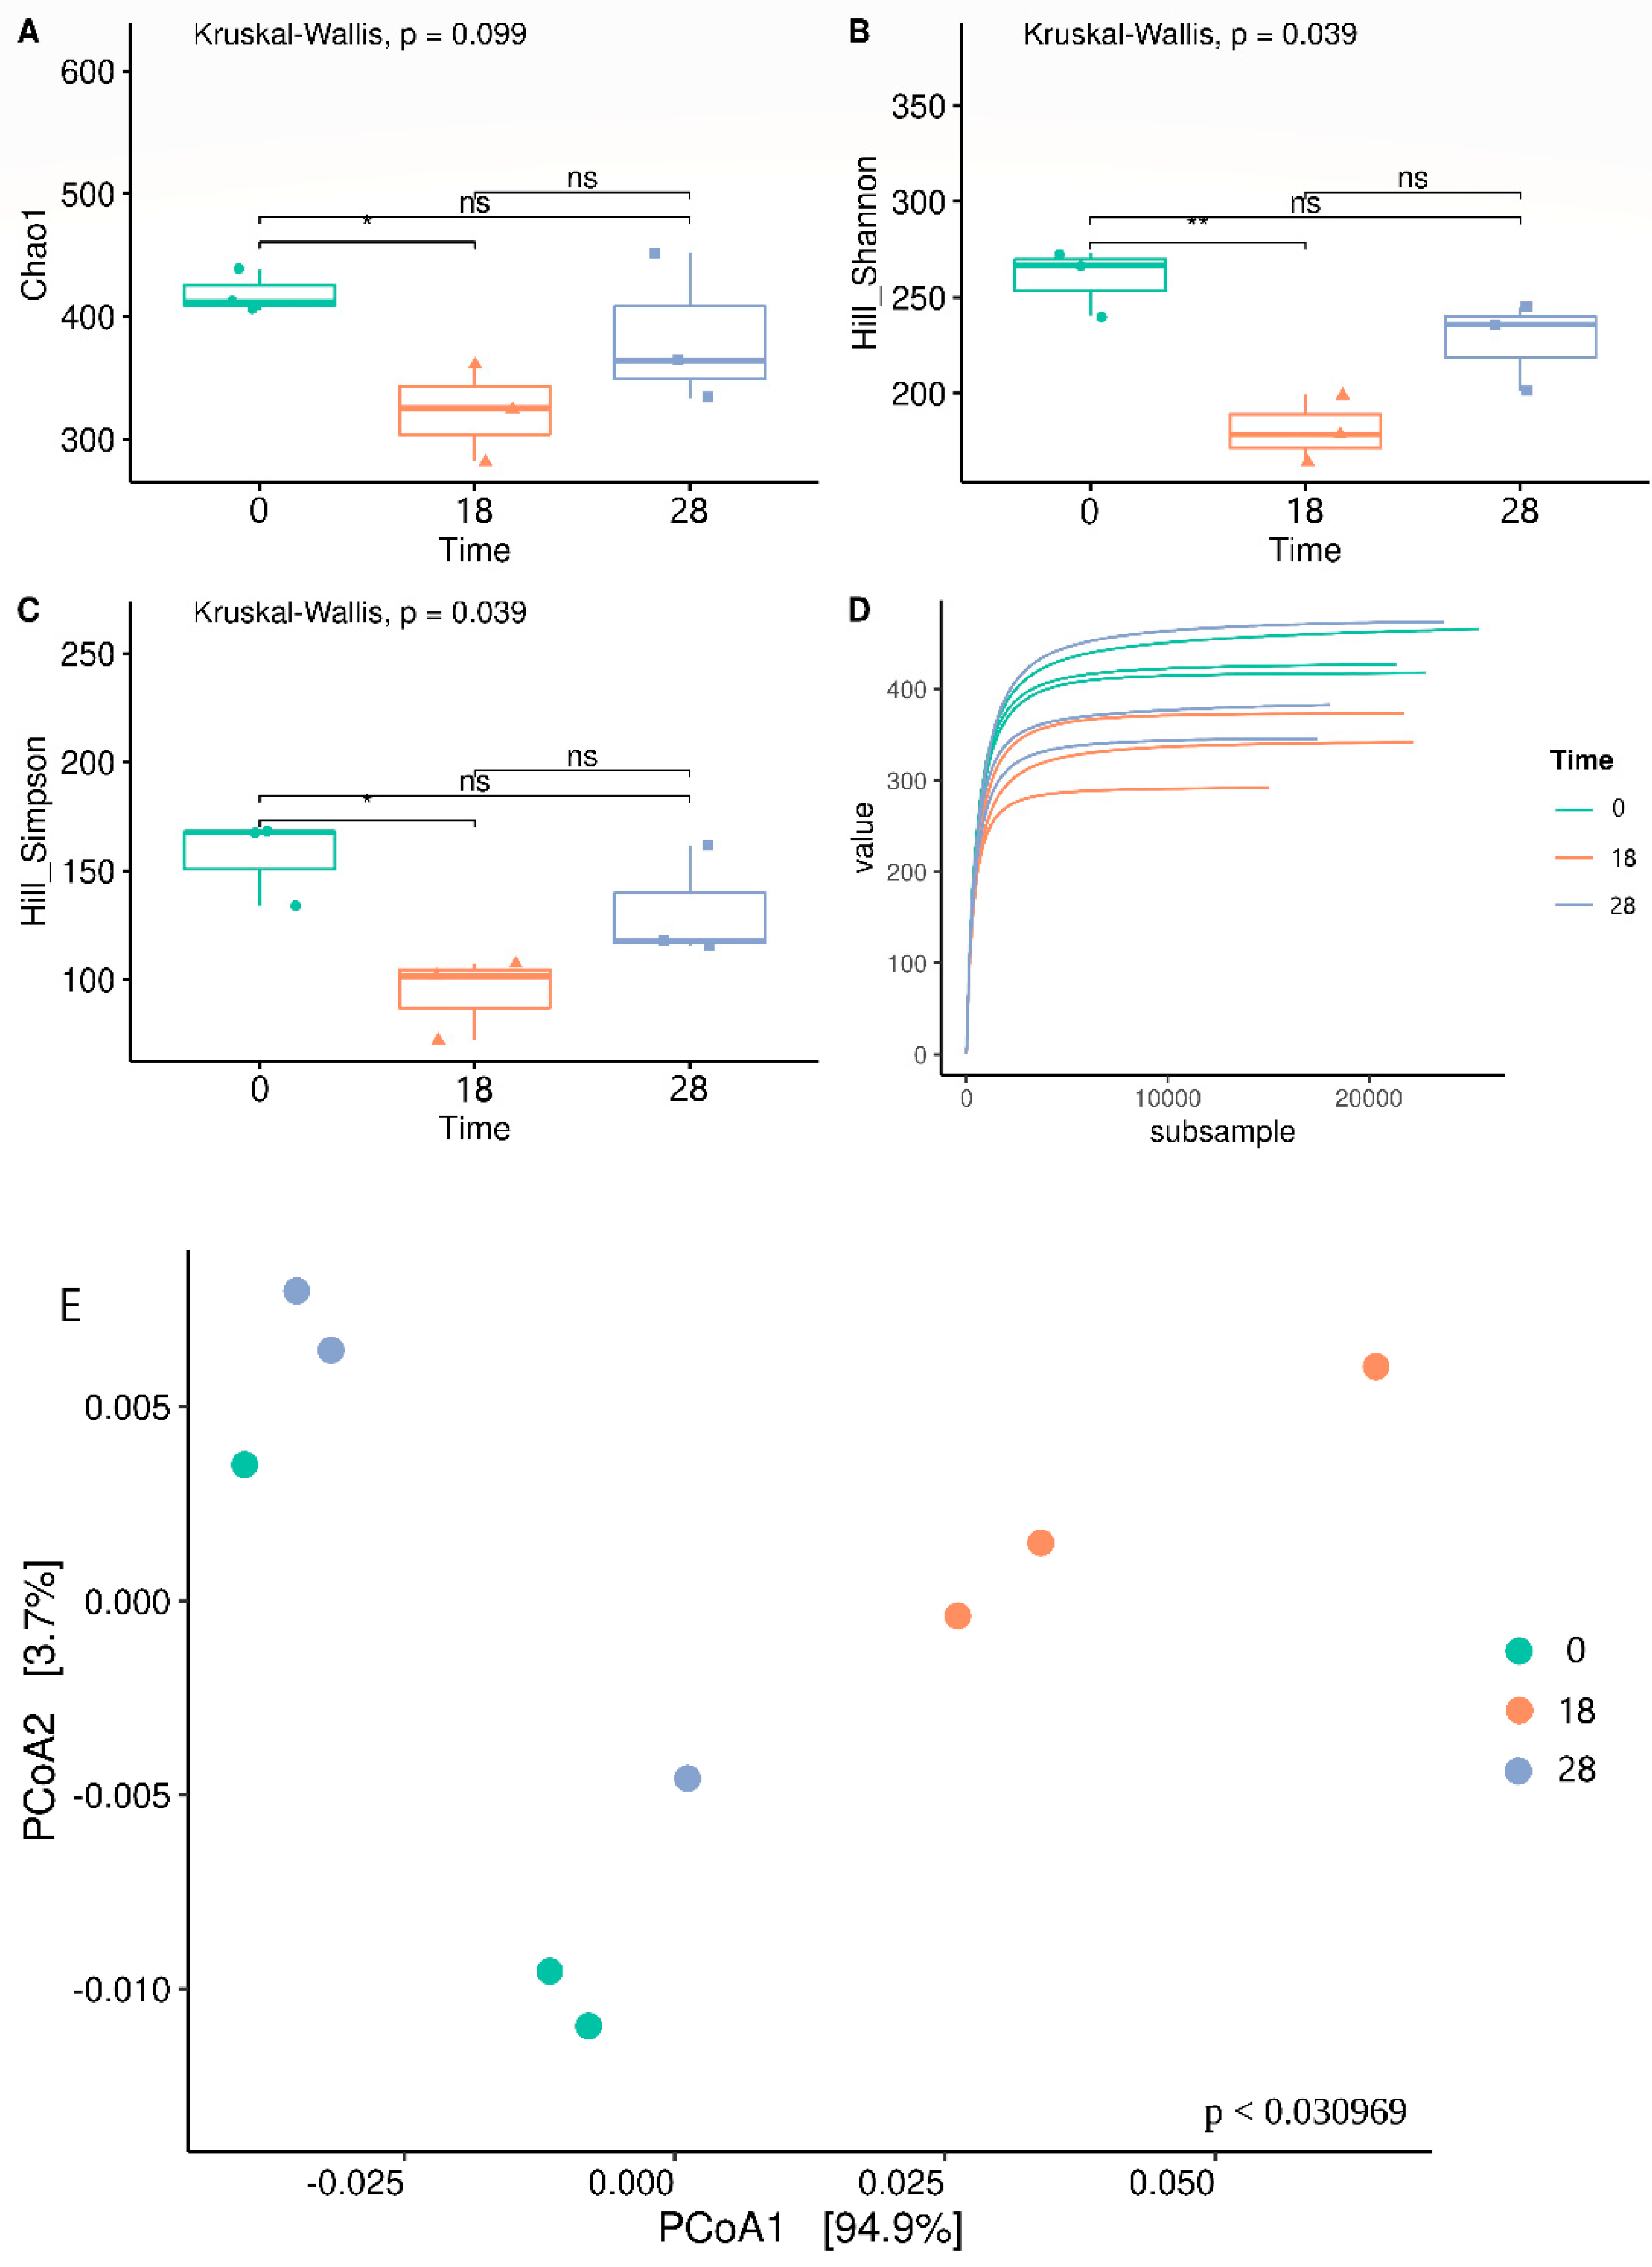
3.2. Bacterial Biodiversity

The diversity indexes of the bacterial community in the mesocosms co-composting with SMS, calculated at a coverage of 99.5% of represented taxa per sample, are reported with reference to the time of incubation in Figure 3A–C. No significant change was observed. The total variance of the bacterial community is shown in Figure 3E. The two axes of the PCoA explain the 97.5% of total variance. The results obtained show a significant separation of the bacterial ecology at different times of incubation. The correlation between the bacterial ecology at the successive time points of analysis and all the chemical parameters quantified is reported in Figure 4. The results obtained show a correlation between the increasing time of incubation and the increment of concentration in TPH and humic and fulvic acids. At the same time, the increasing time of incubation correlated with a decrease in ergosterol content.
In relation to mesocosms bioaugmented with Lambertella sp. MUT 5852, the diversity indexes, calculated at a coverage of 99.5% of represented taxa per sample, are reported with reference to the time of incubation (Figure 5). At 18 days of incubation, a decrease in richness (Chao1 index, Figure 5A), together with a decrease in both reported equal-distribution indexes (Hill–Shannon and Hill–Simpson, Figure 5B,C) was observed. At 28 days of incubation an increase in the three indexes was recorded (Figure 5A–C). The total variance of the bacterial community in the mesocosms bioaugmented with Lambertella sp. MUT 5852 is shown in Figure 5E by the two axes of the PCoA explaining 98.6% of the total variance. The results obtained show that the microbial community at 18 days of incubation was clustering separately from the one at the setup of the experimentation and after 28 days of incubation. In Figure 6 the correlation between the bacterial ecology at the successive time points of analysis and all the quantified chemical parameters is reported. The humic acid content is not reported here since, to be representative of the analysed data, the CCA analysis must contain the lowest number of highly correlated variables to avoid multicollinearity issues. In this case fulvic and humic acids correlated strongly and in Figure 6B, only fulvic acids are reported. The results obtained show that the microbial ecology at 18 and 28 days of incubation correlated with the progressive depletion (decreasing concentration) of TPHs. The correlation was evident also with the decrease in concentration of the ergosterol.

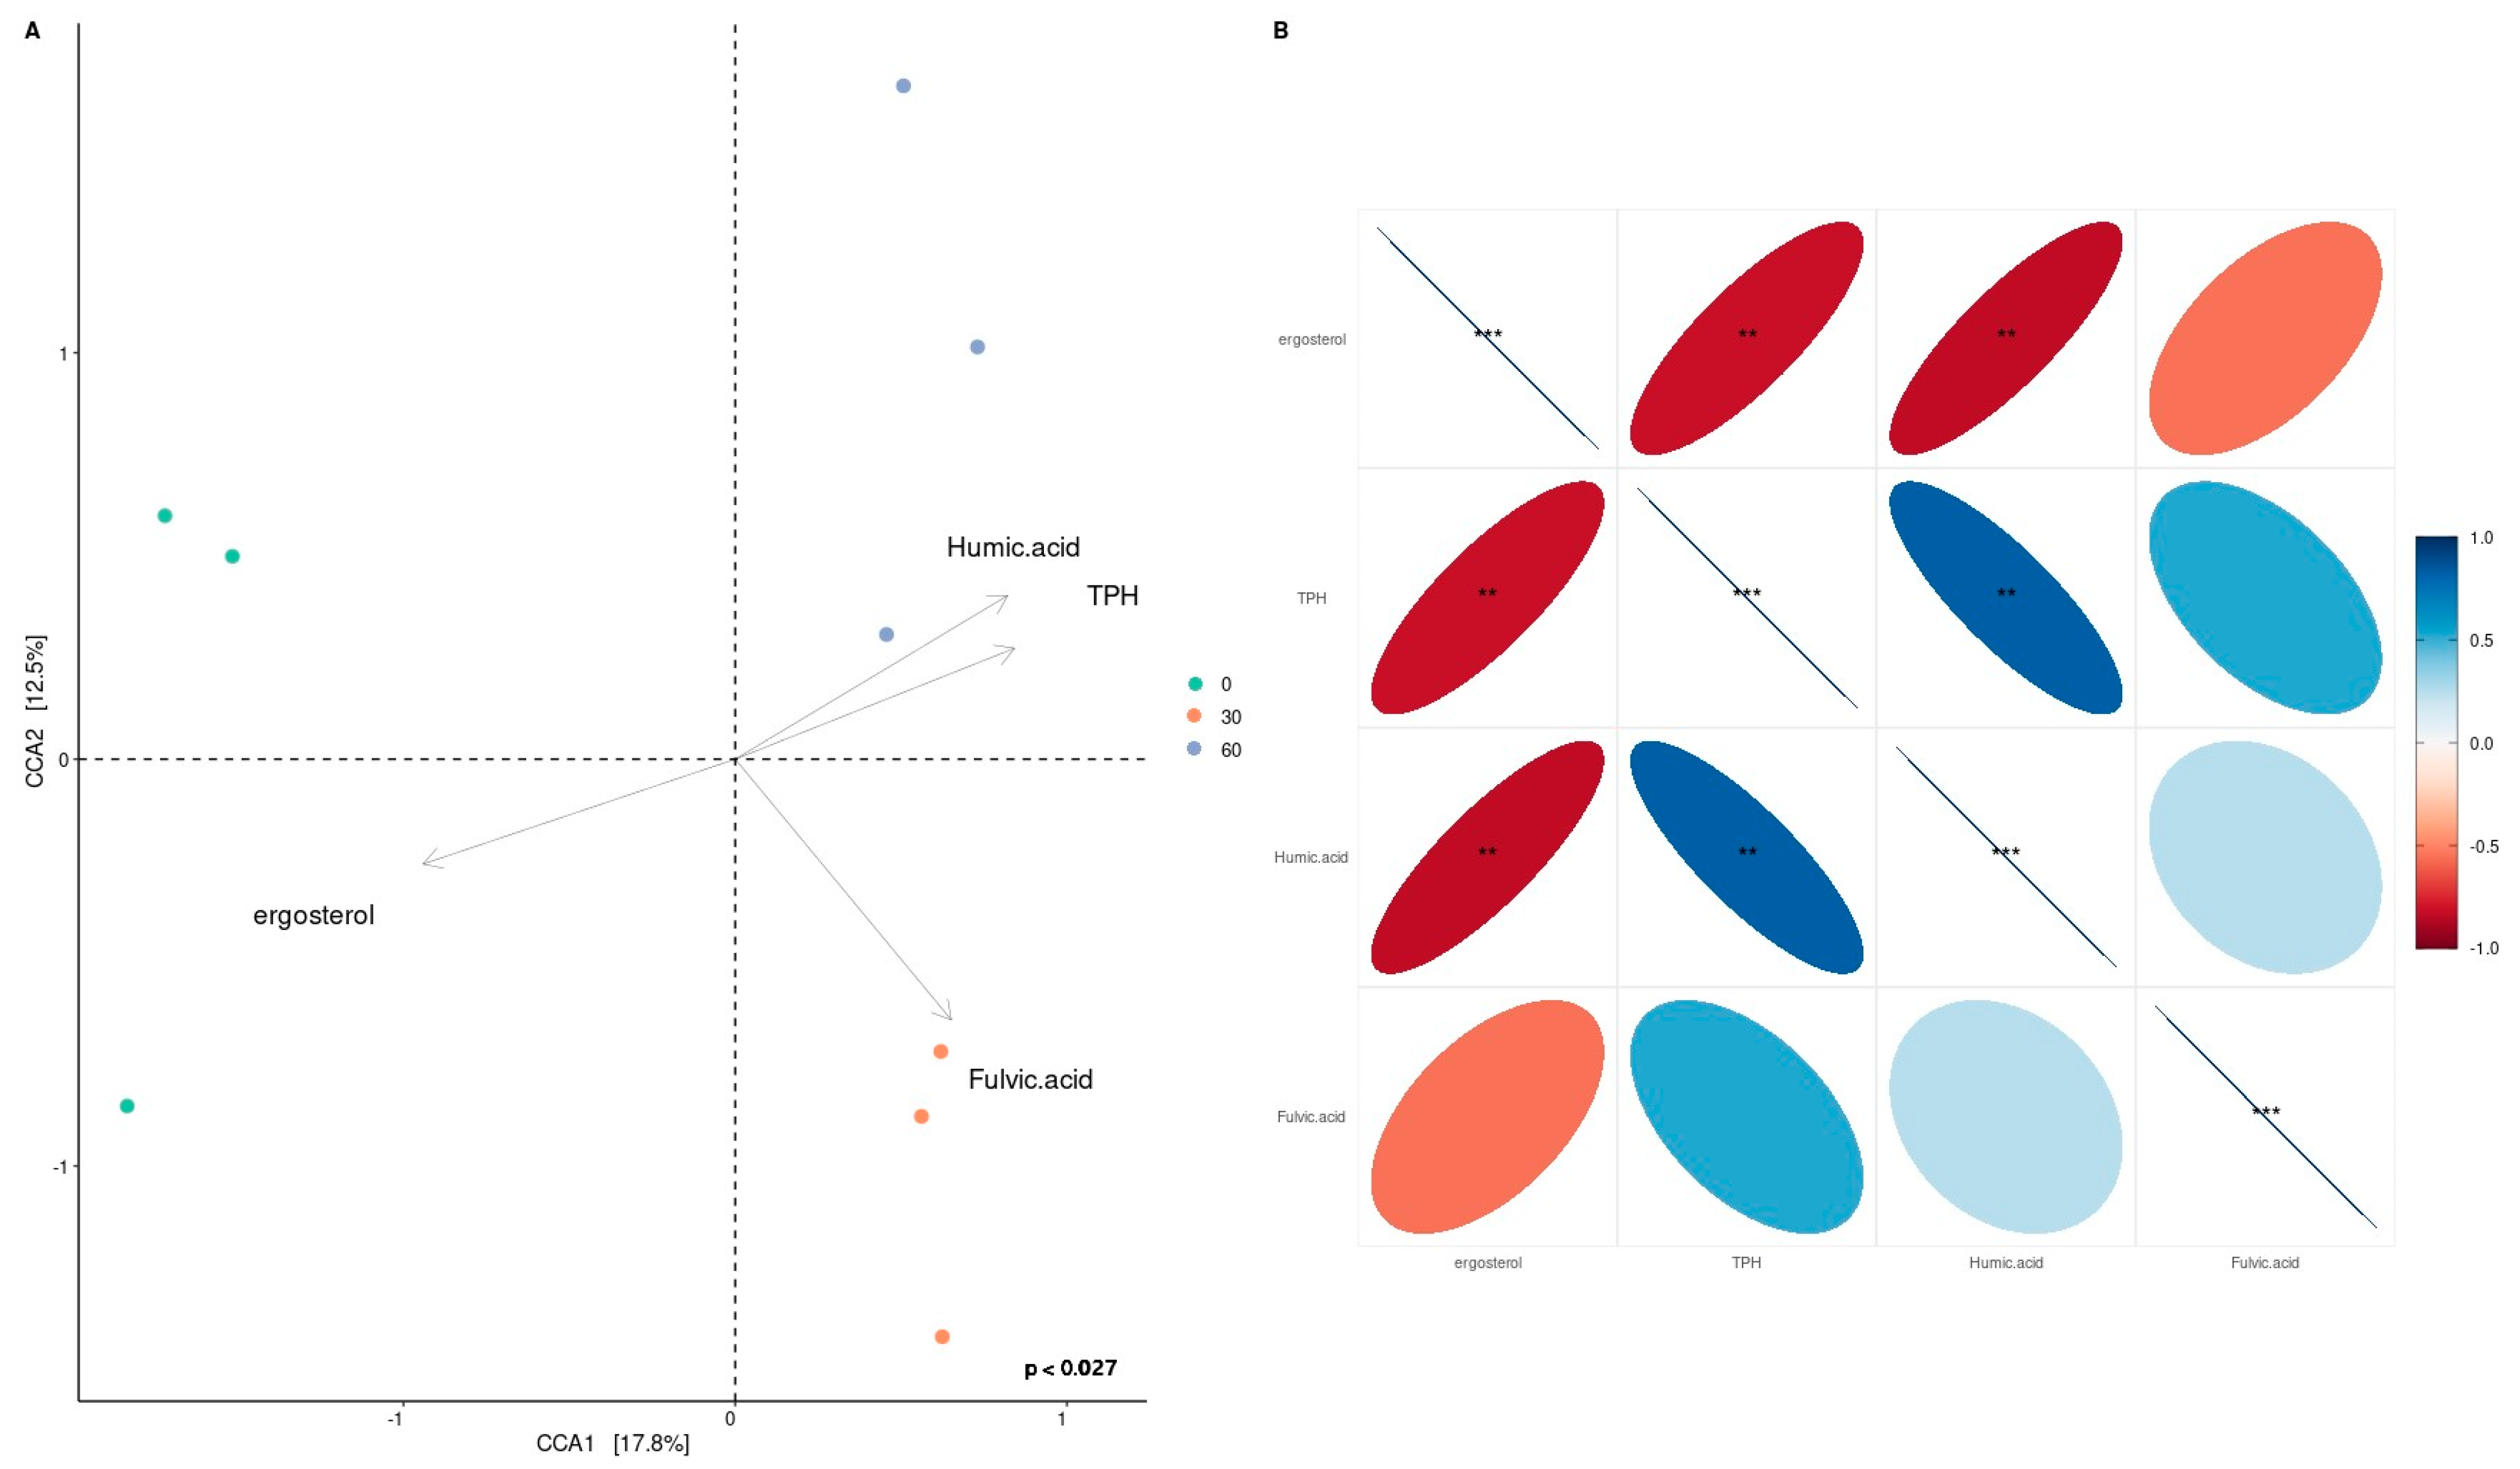
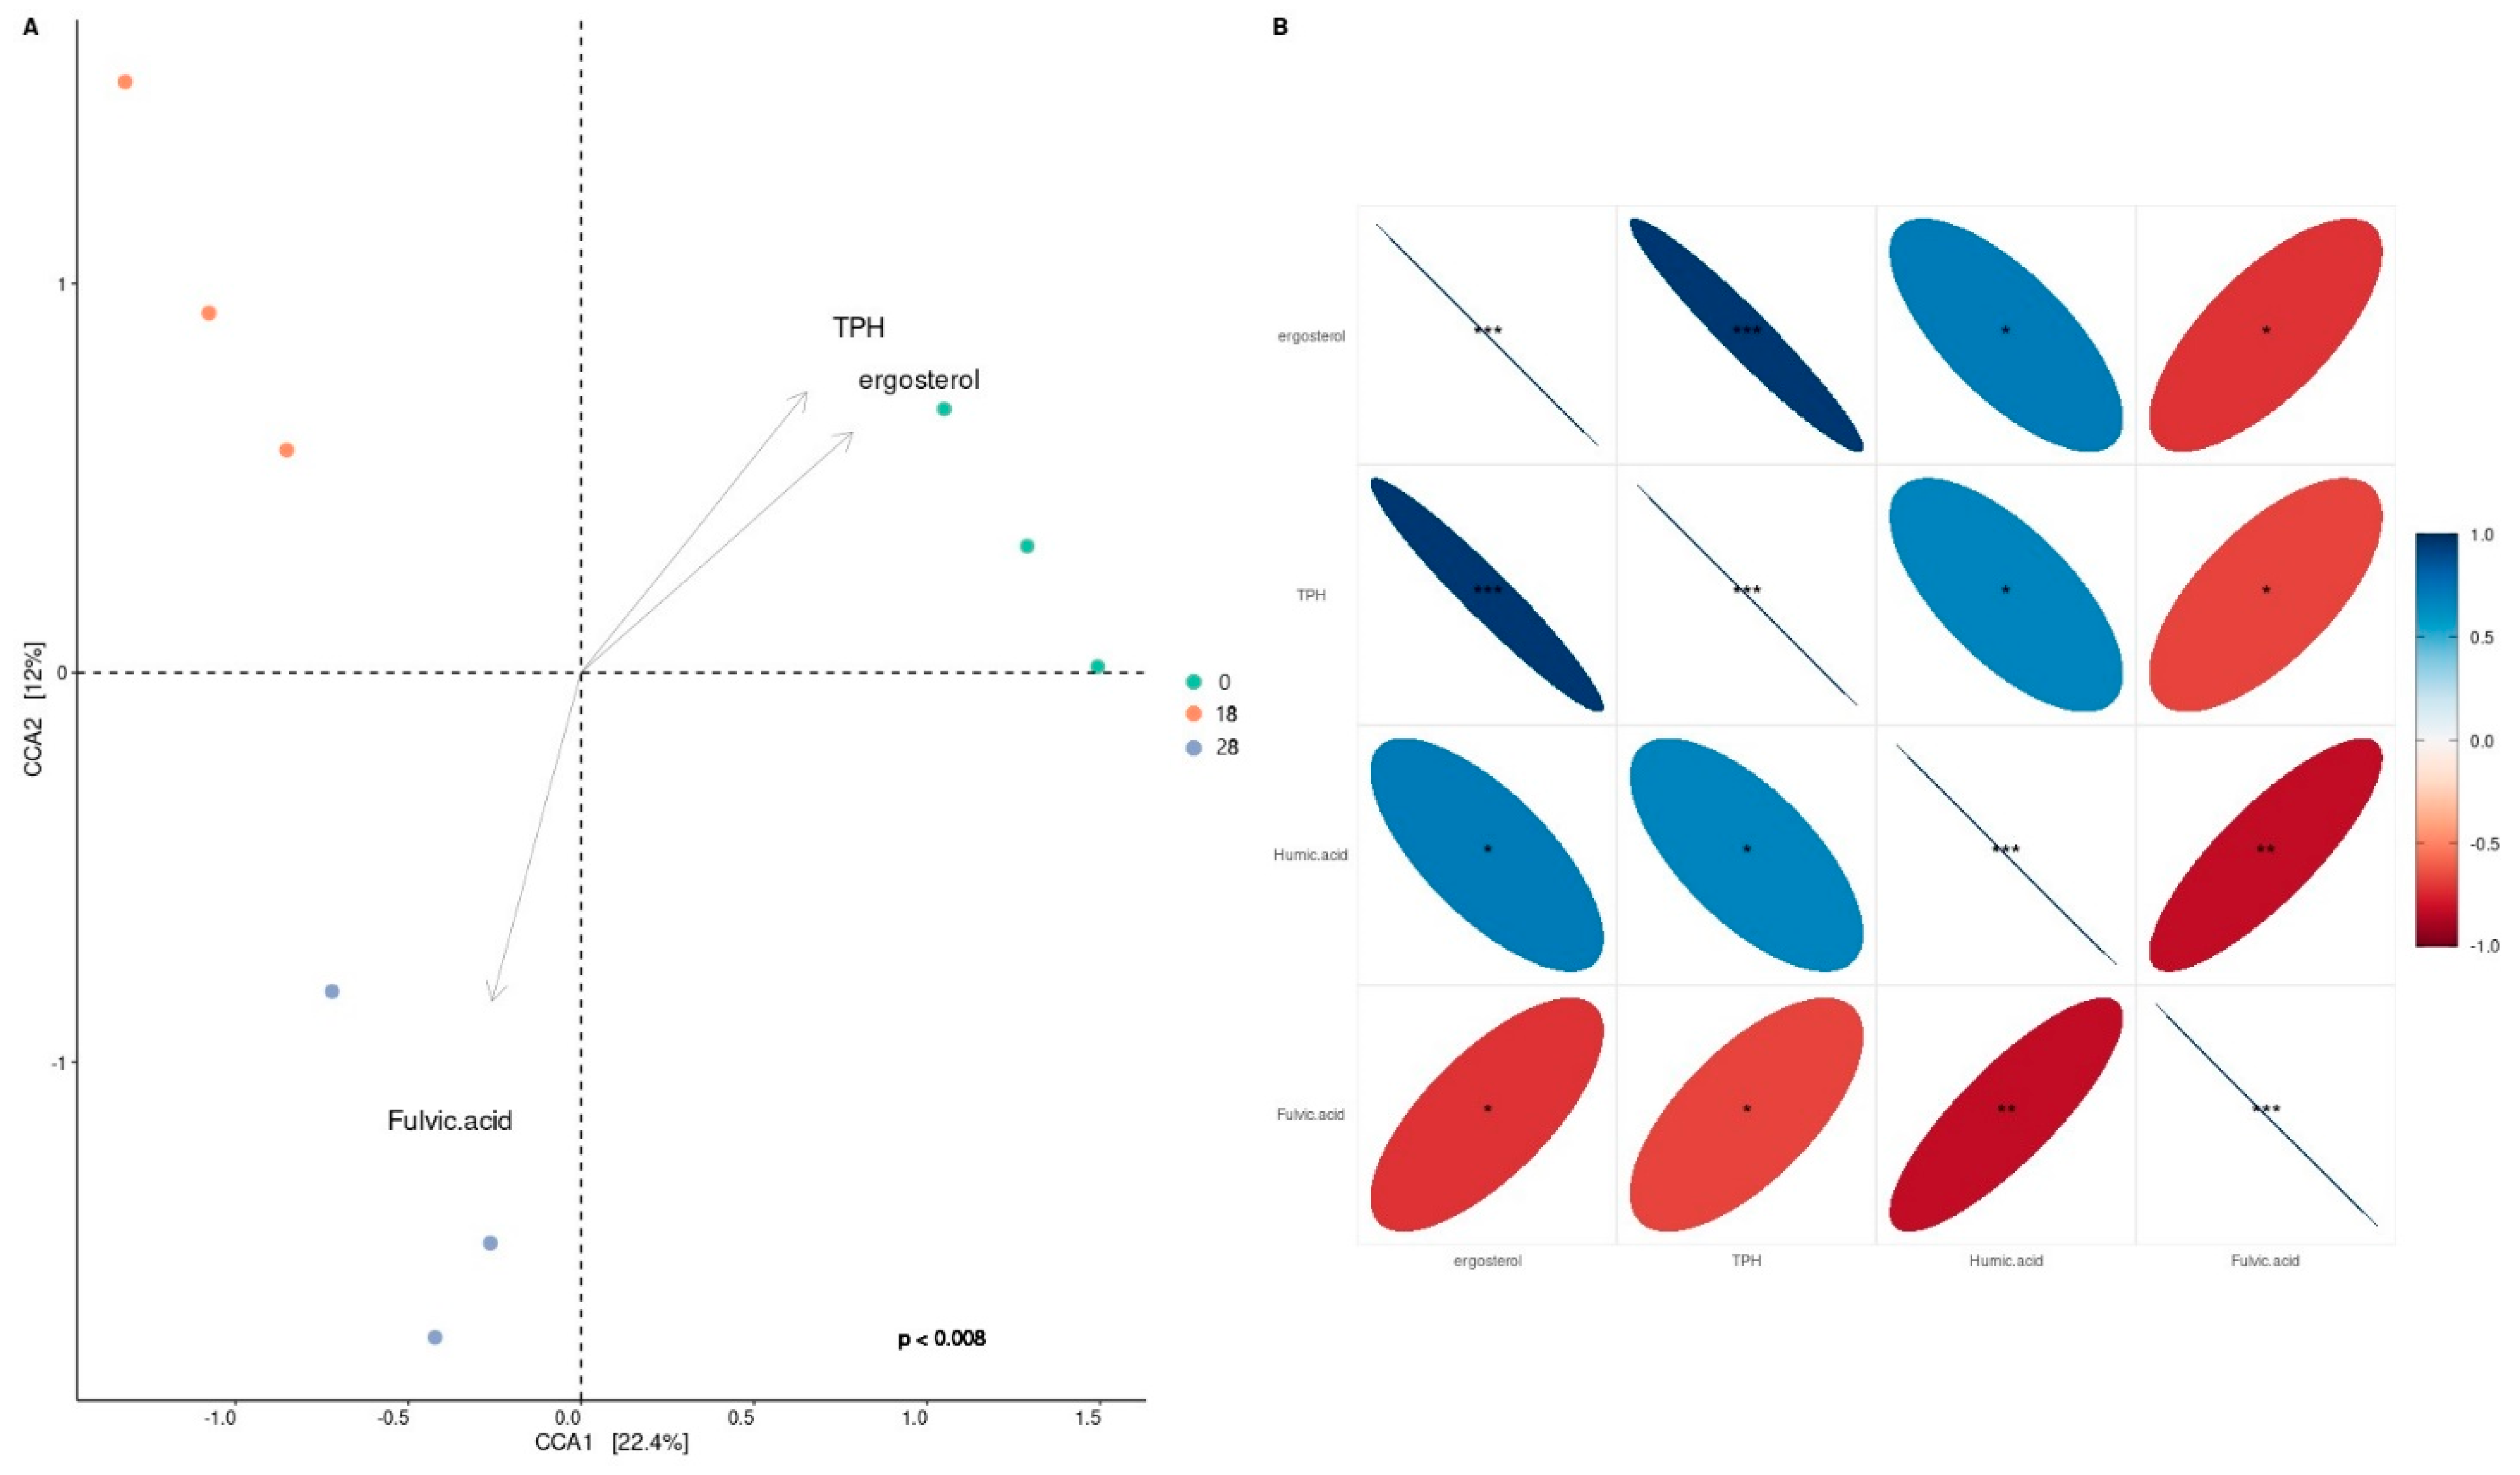
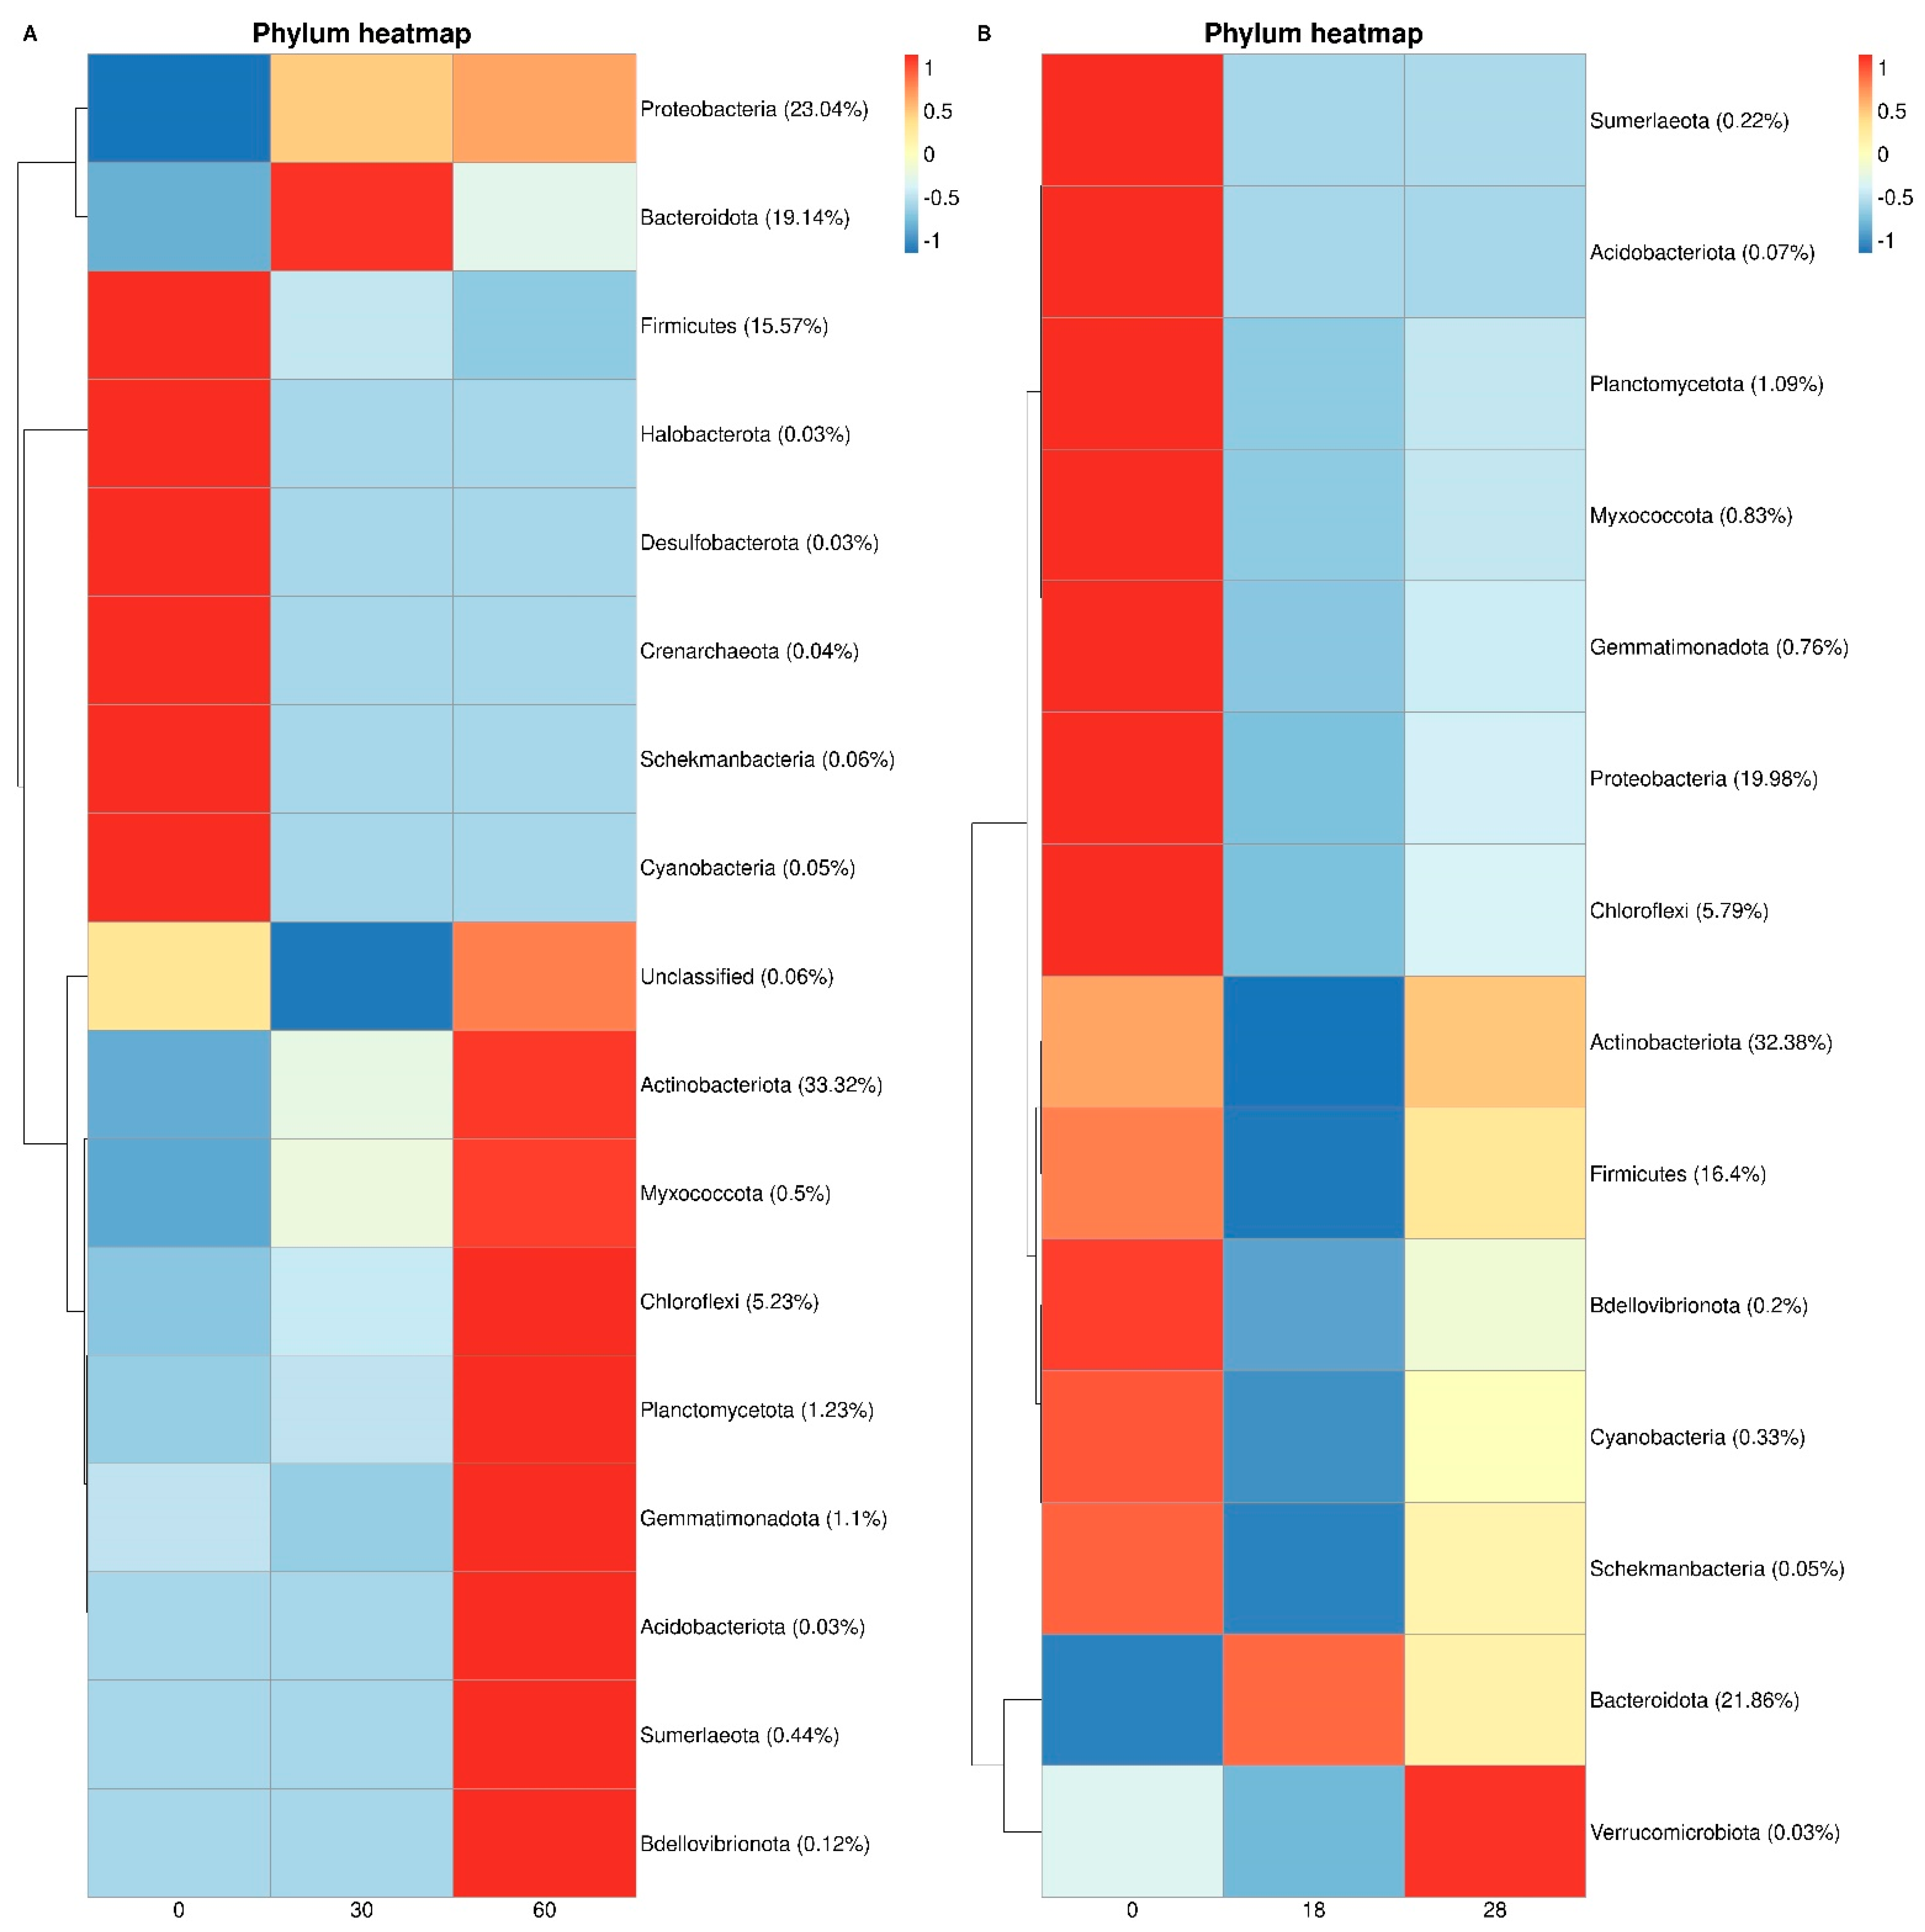
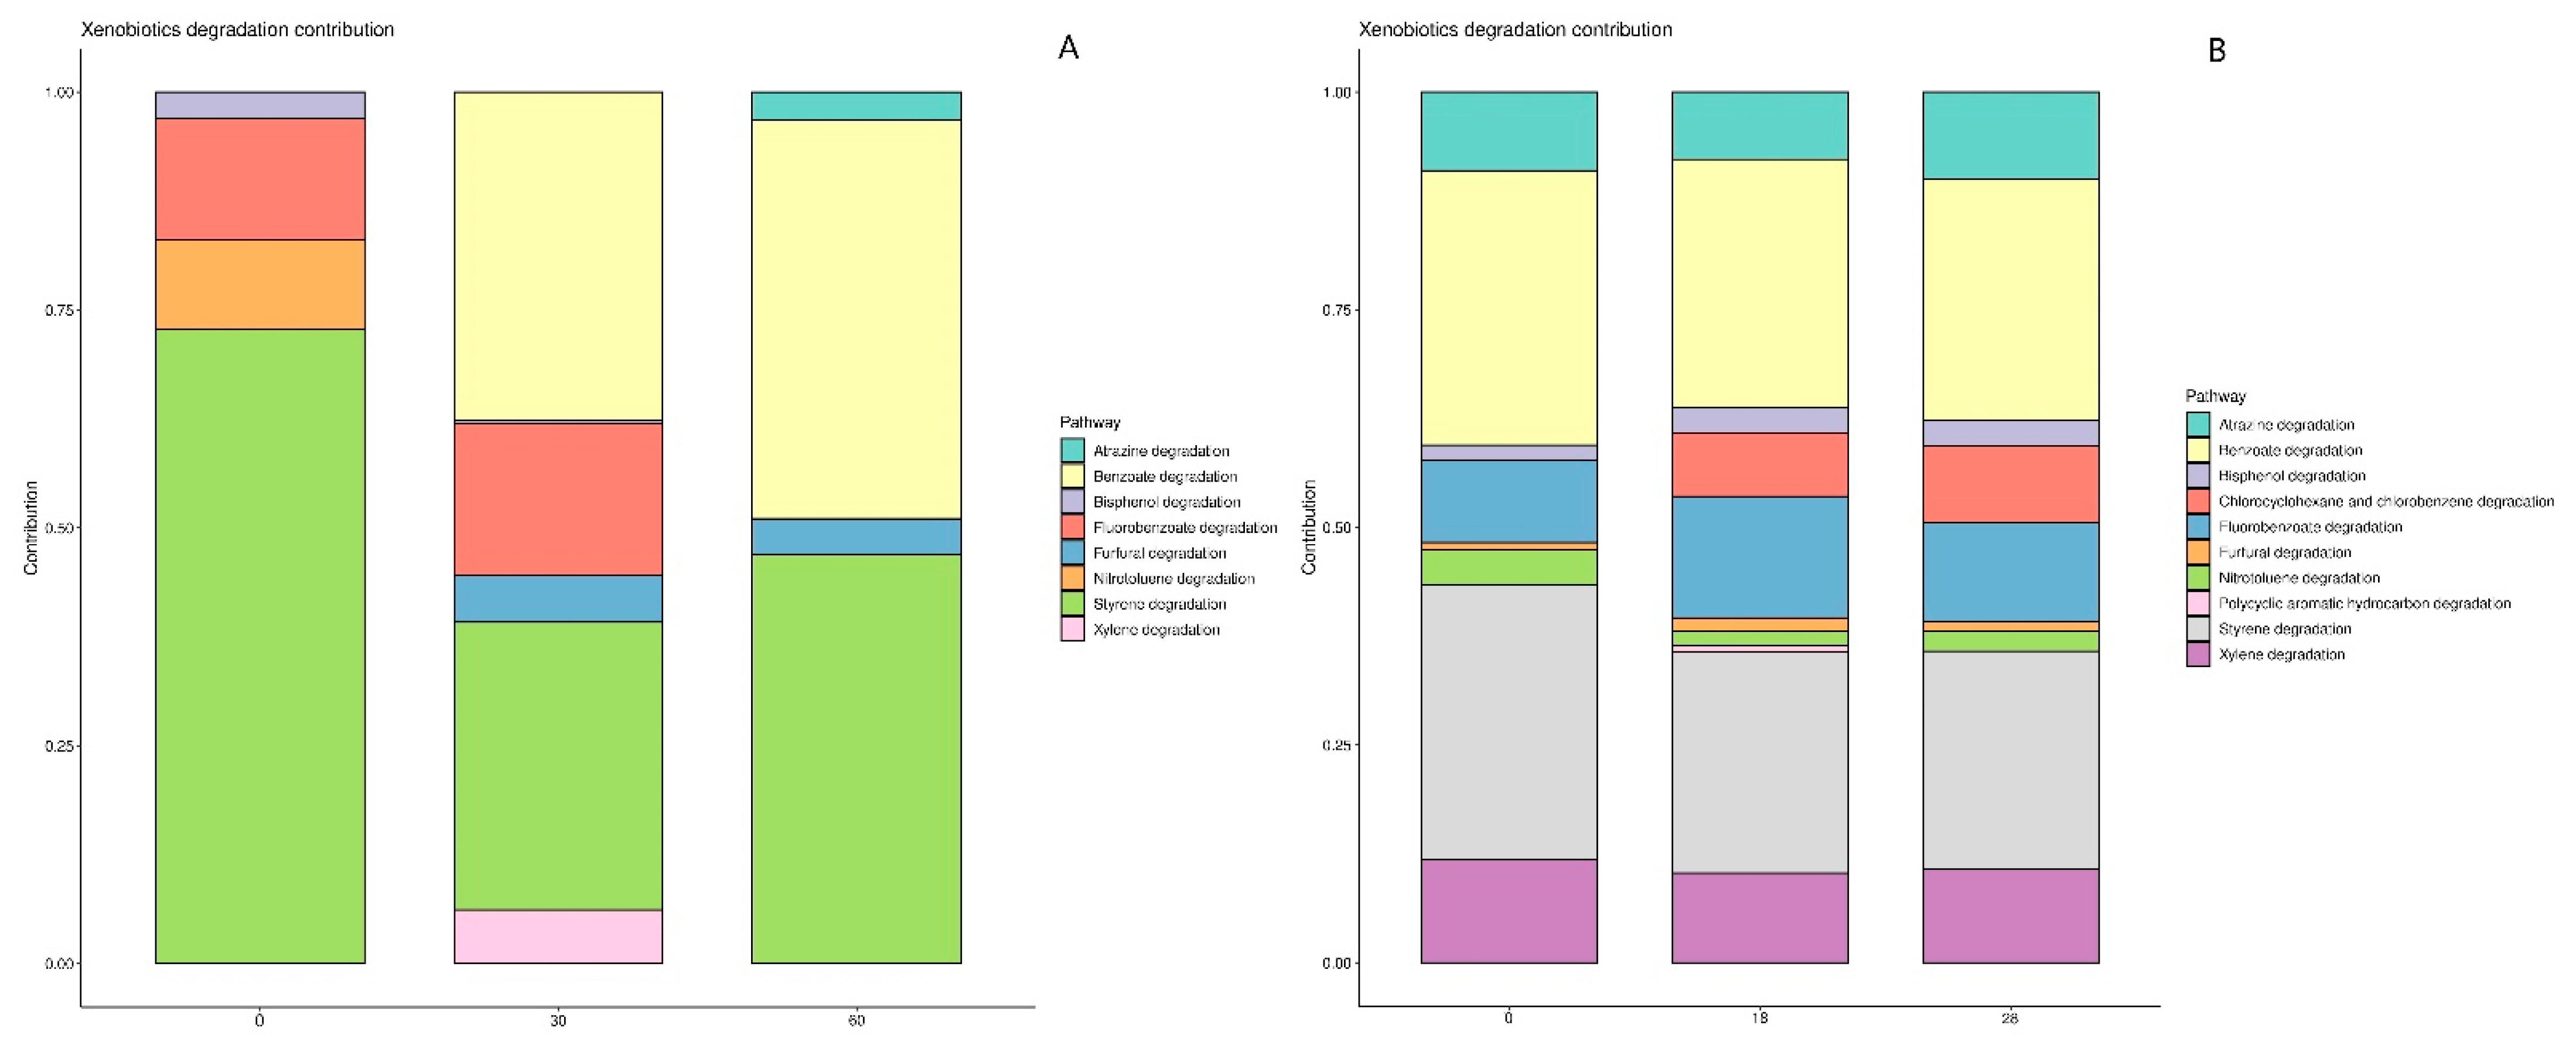
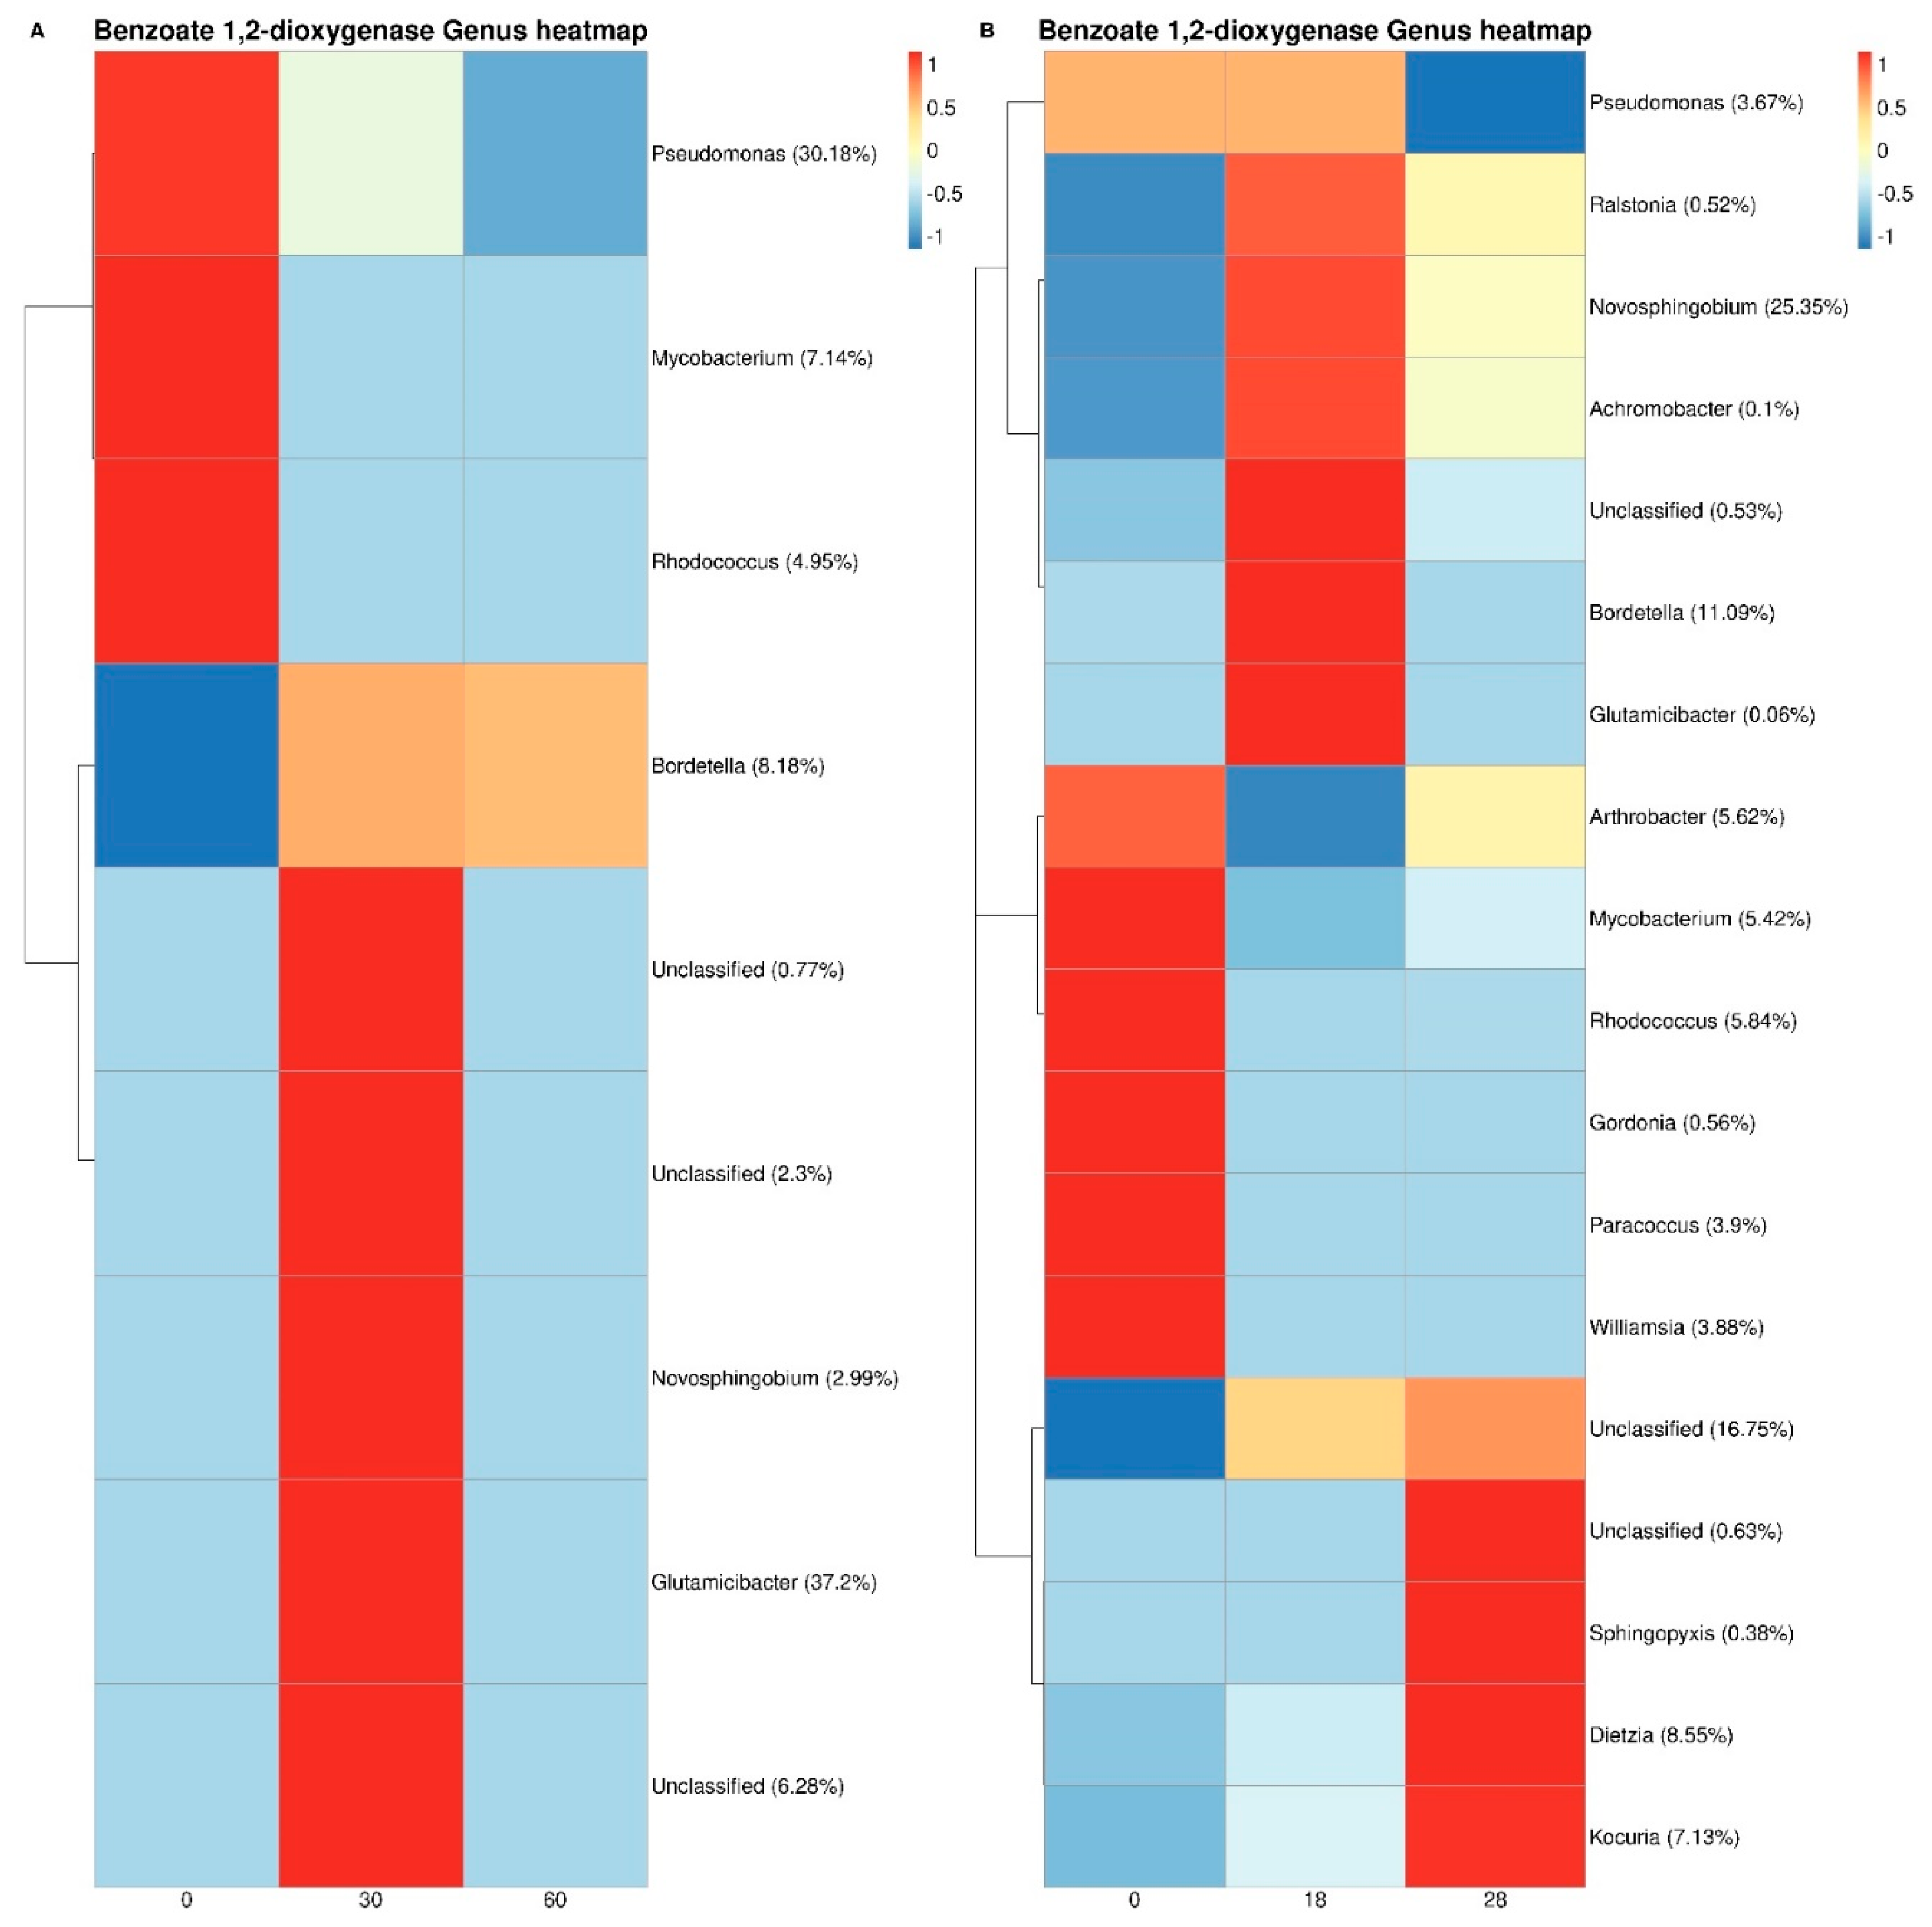
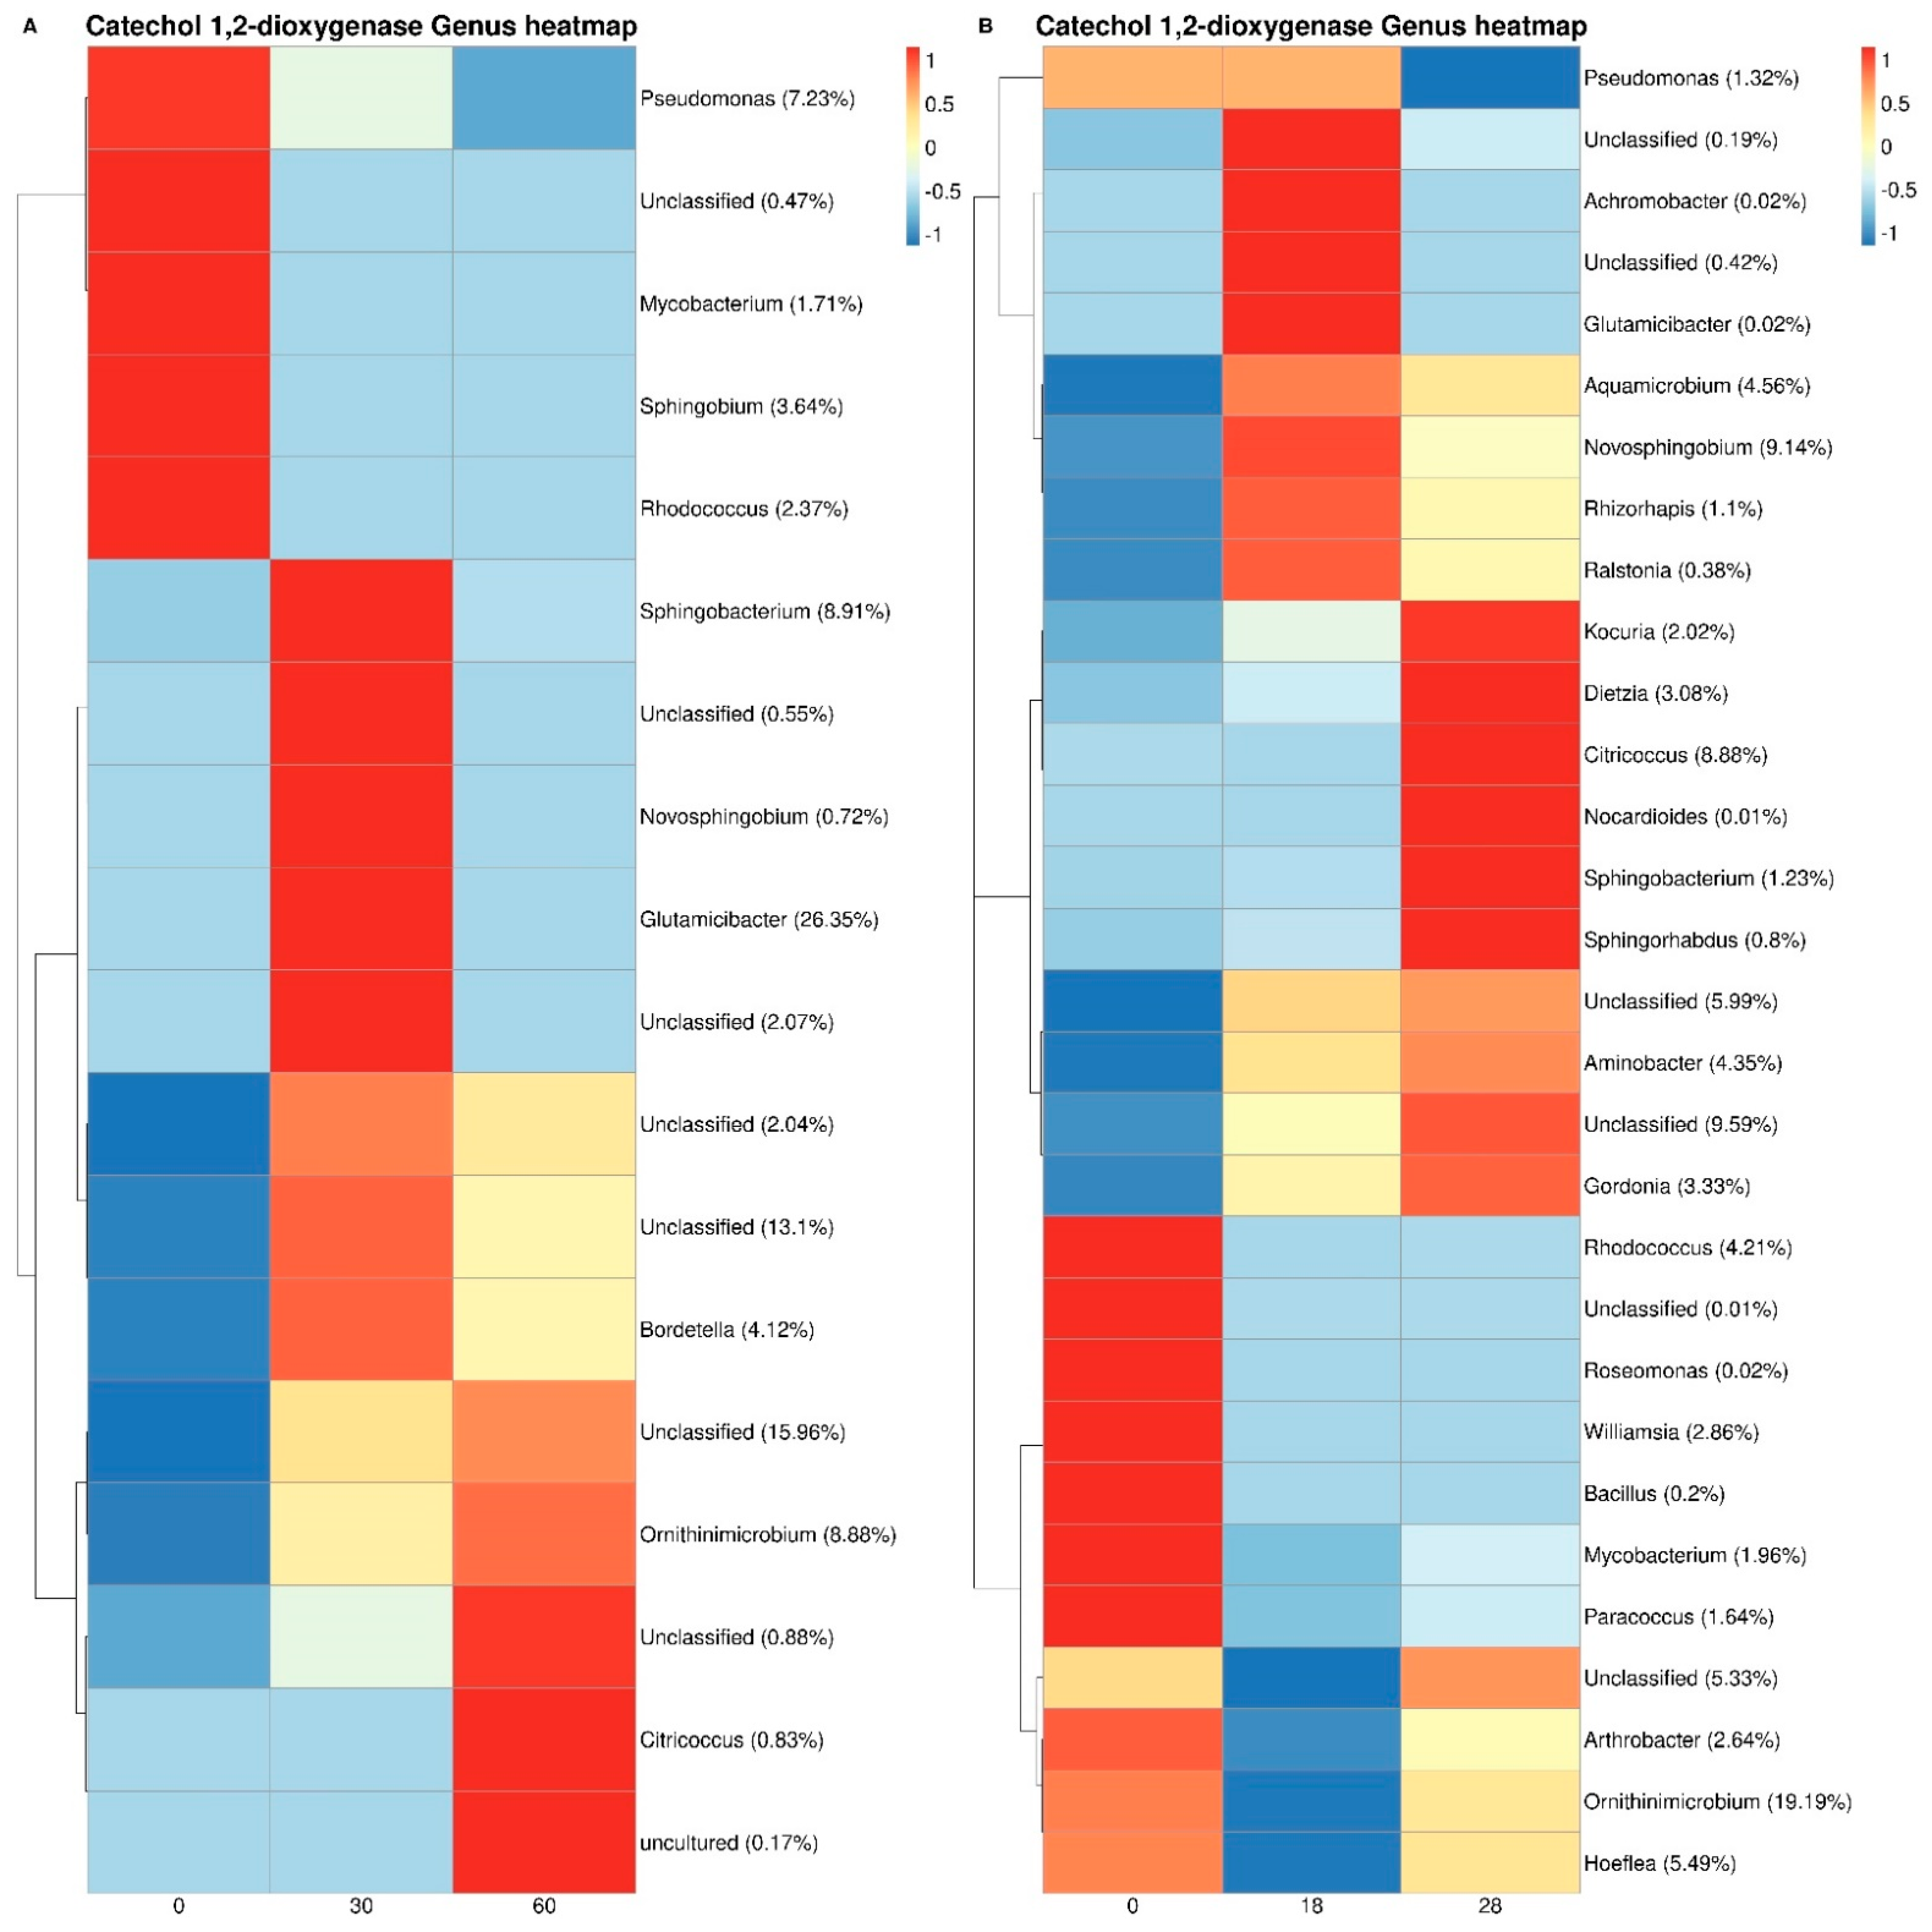
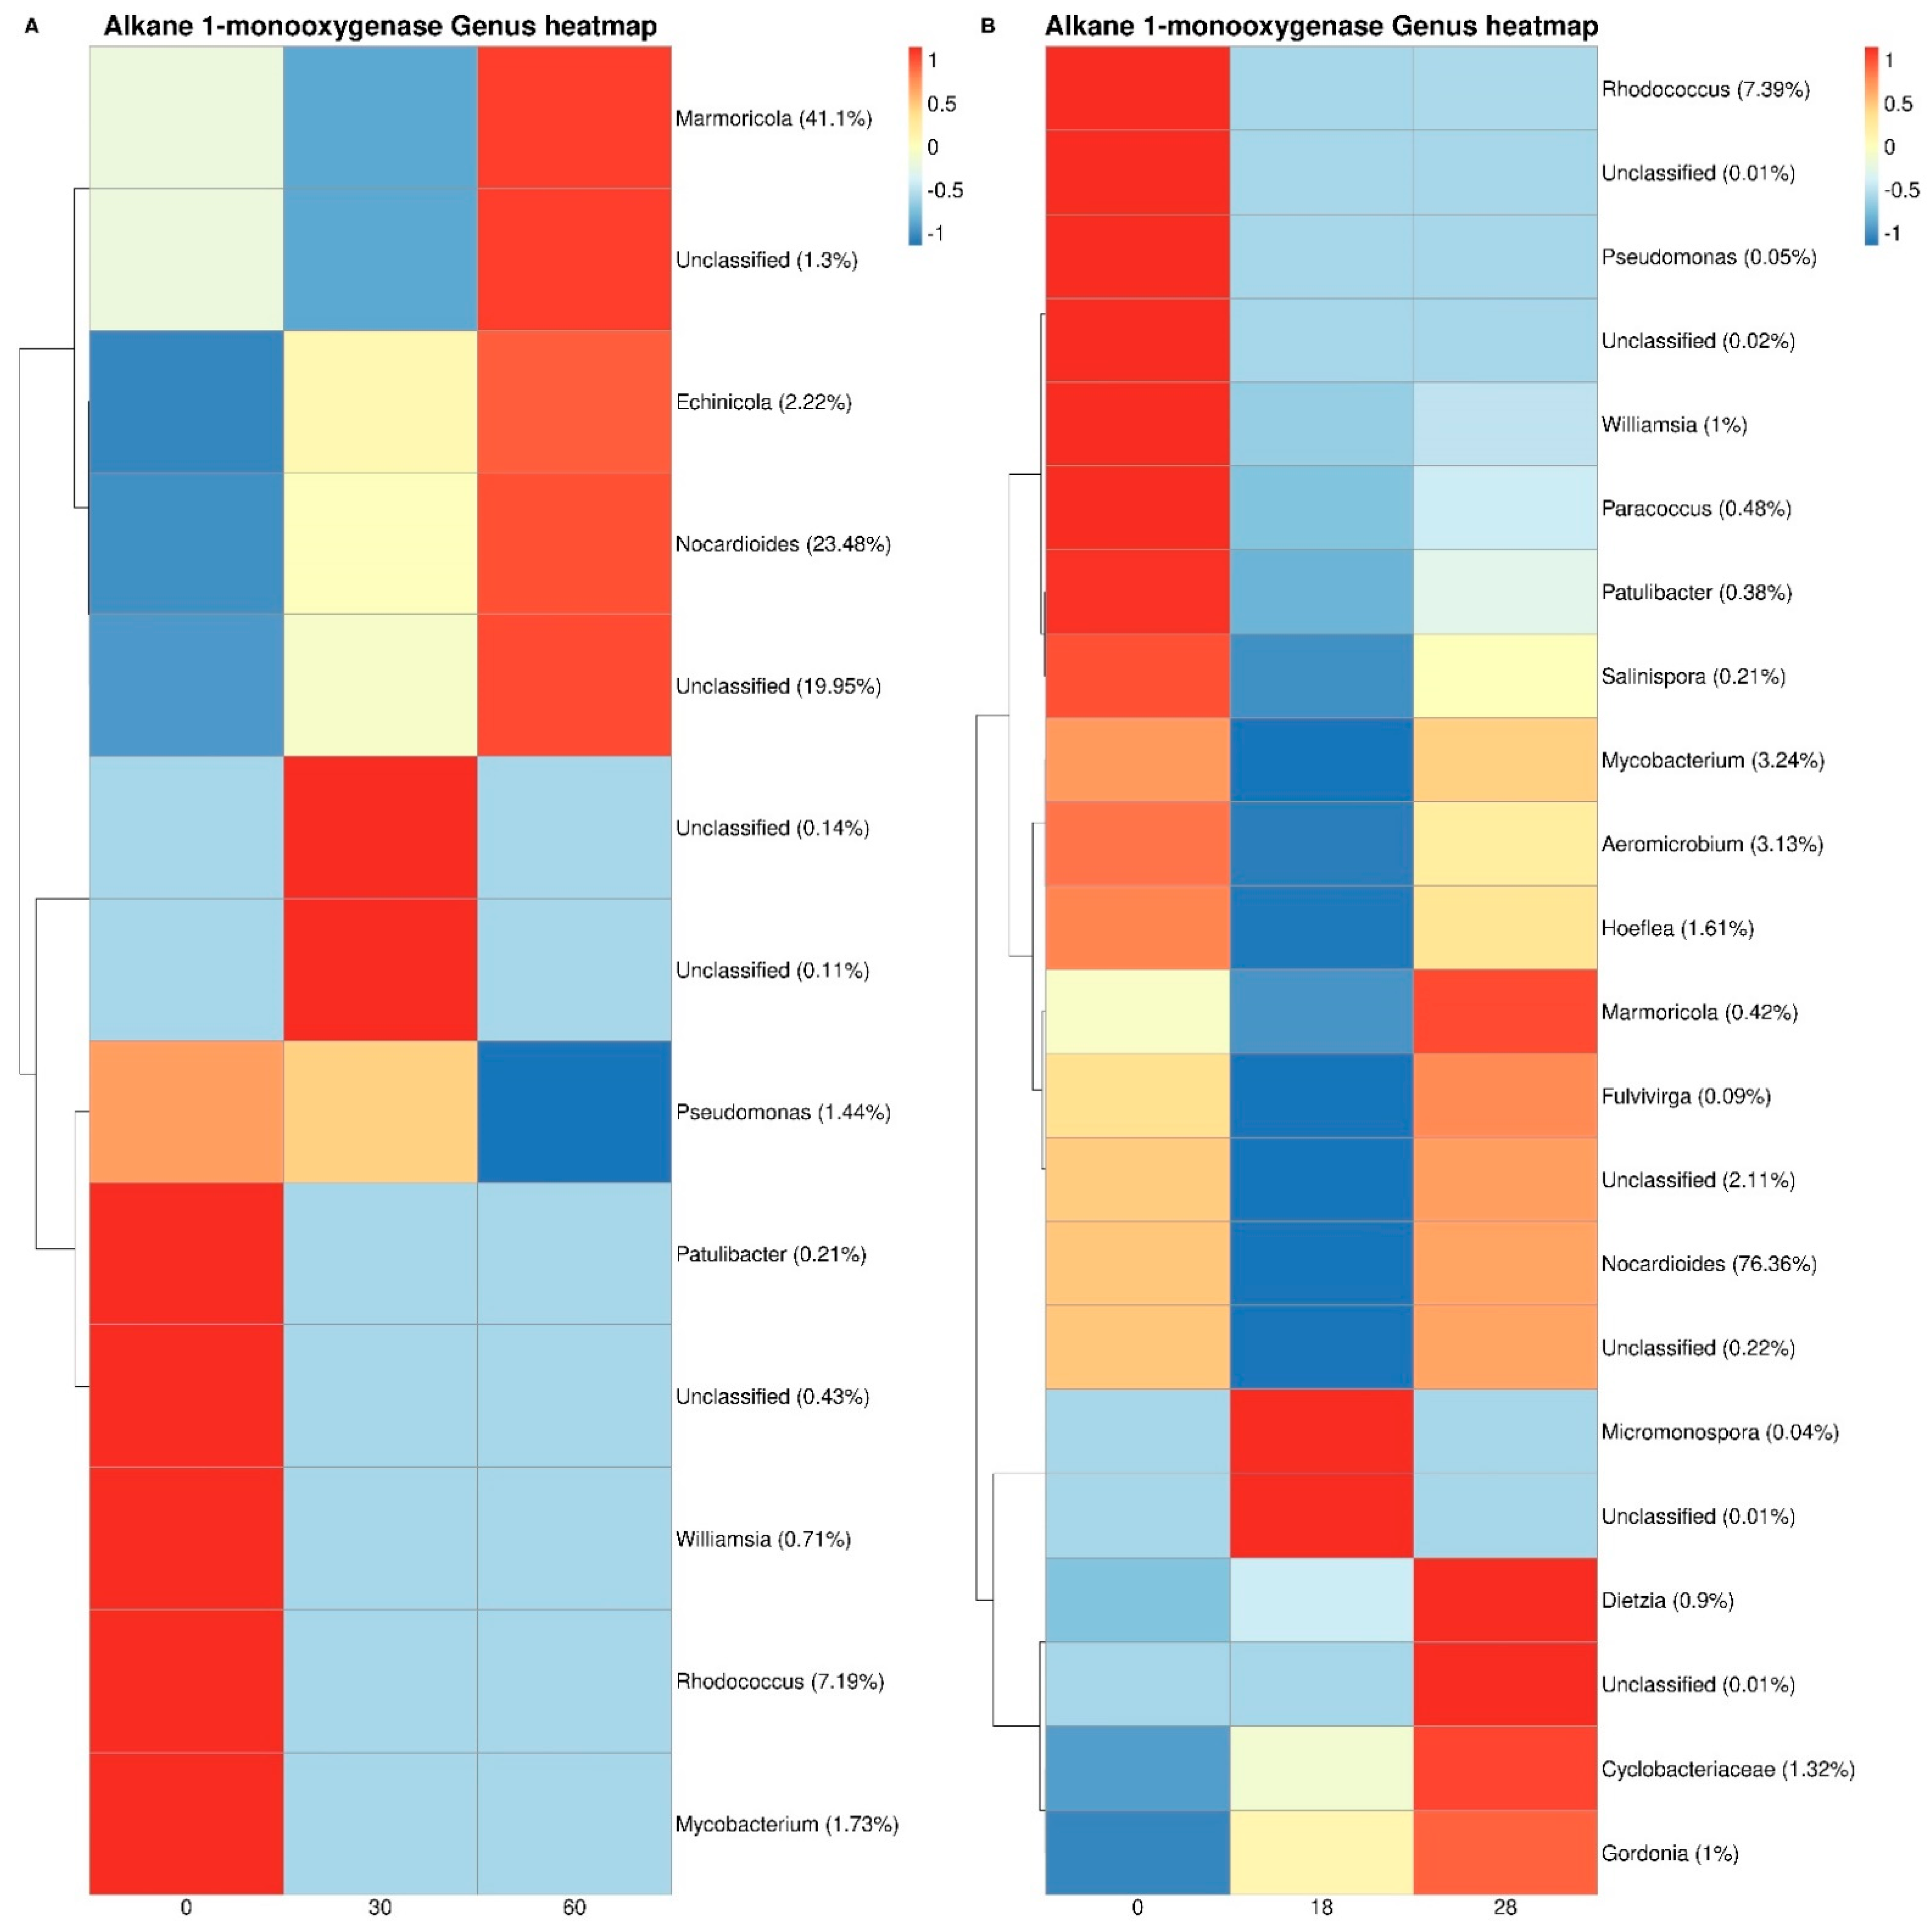
3.3. Bacterial Taxonomy and Predictive Functional Metagenomics

Results related to the taxonomic profiles of the bacterial communities across the mesocosms at phylum level are reported in Figure 7. Figure 7A shows the relative abundances of the different bacterial in the mesocosms co-composting with SMS and Figure 7B the mesocosms bioaugmented with Lambertella sp. MUT 5852. In both experimental conditions, the most abundant phyla were proteobacteria with 23% in the SMS co-composting mesocosms and 20% in the Lambertella sp. MUT 5852 bioaugmented mesocosms; firmicutes with 16% in both experimental conditions; and bacteroidota with 19% and 22% and actinobacteria with 33% and 32%, respectively. The reported percentages are medium values associated with zeta scores indicating the deviation of the sample value from the medium one, among different samples. An increment or a decrement from the median value was interpreted as an increase or a decrease in the relative abundances of the corresponding taxa in the sample. In relation to the mesocosms co-composting with the SMS, proteobacteria increased in relative abundance during the time of incubation, bacteroidota observed a peak after 30 days of incubation and a successive decrease, firmicutes decreased during the incubation time, and actinobacteriota showed an initial decrease and a successive increment in relative abundance after 60 days of incubation.
In the mesocosms bioaugmented with Lambertella sp. MUT 5852, proteobacteria and firmicutes decreased in relative abundance with time of incubation, while actinobacteriota showed similar behaviour with reference to the mesocosms co-composting with SMS, showing an initial decrease and a successive increment in relative abundance after 28 days of incubation. Bacteroidota showed similar behaviour with reference to the mesocosms co-composting with SMS with an increase in relative abundance after 18 days of incubation, followed by a successive decrease.
To better evaluate the metabolic potential of the different bacterial taxa in the two experimental conditions, the contribution of the different bacterial taxa to the abundance of functional features of interest, such as the xenobiotic degradation, metabolism module (KEGG Pathway 1.11), and composing maps was predicted. Metabolic reconstruction of pathways was carried out with a pathway exclusion cut-off (PEC) of 100% (i.e., only contributions that contain 100% of genes/enzymes that constitute the pathway were retrieved). The xenobiotic degradation and metabolism module results are shown in Figure 8, showing that the number of composing maps of the module was higher in mesocosms bioaugmented with Lambertella sp. MUT 5852 than in those co-composted with the SMS. The higher diversity of the maps shown in Lambertella sp. MUT 5852 bioaugmented mesocosms was maintained with time of incubation. On the other hand, the diversity decreased in the case of mesocosms co-composting with the SMS.To better analyse the putative involvement of the different maps in the frame of the xenobiotic module, the harboured enzymatic activities were classified by their enzymatic commission (EC) numbers. Results obtained in relation to ECs of interest in TPH transformation, such as the benzoate 1,2-dioxygenase, cathecol 1,2-dioxygenase and alkane 1-monooxygenase are reported in Figure 9, Figure 10 and Figure 11. benzoate 1,2-dioxygenase, cathecol 1,2-dioxygenase and alkane 1-monooxygenase are, respectively, involved in the oxidation of aromatic structure [16] and the initial oxidation of inactivated alkanes [17]. It is reasonable to consider these functional genes as functional markers to assess the catabolic potential of bacteria in bioremediation.
The bacterial genera contributing to the three functions belonged mostly to proteobacteria and actinobacteriota both in the presence of Lambertella sp. MUT 5852 and of SMS. Bacteroidota and firmicutes were also involved; see Supplementary results Figures S1–S3. The number of different bacterial genera, harbouring the function of interest and increasing in relative abundance with the time of incubation, was higher in the mesocosms bioaugmented with Lambertella sp. MUT 5852 than in the one co-composting with SMS (Figure 9, Figure 10 and Figure 11). In the case of benzoate 1-2 dioxygenase and the mesocosms co-composting with the SMS (Figure 9A), the genera showing a significant increment in the contribution of the function with time of incubation were for actinobacteriota mainly Glutamicibacter sp., accounting for 37.2% of the bacterial genera involved in the function; for proteobacteria this was mainly Novosphingobium and Bordetella sps., accounting for 3% and 8%, respectively. All the above genera improved their contribution after 60 days of incubation. In the presence of Lambertella sp. MUT 5852 (Figure 9B) the bacterial genera showing an increase in contribution after 18 days of incubation were for proteobacteria mainly Novosphingobium and Bordetella sps. for the 25.3% and 11%, respectively. The genera showing an increase in contribution after 28 days of incubation were for actinobacteriota mainly Dietzia and Kocuria sps. for 8.5% and 7.1%. In relation to catechol 1,2-dioxygenase and mesocosms co-composting with SMS (Figure 10A), the genera showing a significant increase in contribution of the function after 30 days of incubation were for actinobacteriota mainly Glutamicibacter sp. for 26.3%; and for bacteroidota Sphingobacterium sp. with 8,8%; at 60 days of incubation for actinobacteriota Ornhitinimicrobium sp. with 8.9%. In the presence of Lambertella sp. MUT 5852 (Figure 10B) the bacterial genera showing an increase in contribution were for proteobacteria mainly Aquamicrobium, Novosphingobium, Rizorhapis sps. for 4,6%, 9.1%, and 1.1% after 18 days of incubation; after 28 days of incubation for actinobacteia Kocuria sp. for 2%, Dietzia sp. for 3%, Citrococcus sp. for 8.8%, Gordonia sp. for 3.3%; for proteobacteia Aminobacter sp. for 4.3%; for bacteroidota Sphingobacterium sp. for 1.2%.
In the case of alkane 1-monooxygenase and the mesocosms co-composting with the SMS (Figure 11A), the genera showing a significant increase in contribution of the function with time of incubation were for actinobacteriota Marmoricola sp. for 41% and Nocardioides sp. for 23,5%. All the above genera improved their contribution after 60 days of incubation. In the presence of Lambertella sp. MUT 5852 (Figure 11B) the bacterial genus showing a significant increase in contribution with time of incubation and more precisely after 28 days of incubation was mainly among the actinobacteriota, with Nocardioides sp. for 76.3%.

4. Discussion

It is generally accepted that bio-based processes might be a sustainable solution for the treatment of huge quantities of dredged sediments. Among bio-based interventions the possibility of recovering and converting the decontaminated sediments in techno-soils has been proposed [18,19]. In this context, co-composting with SMS is appropriate, since it embraces the rationale of the circular economy with the recovery of an organic waste [20,21] described as a source of nutrients and organic matter, increasing soil fertility [22,23,24]. These peculiarities, combined with the oxidising properties of the SMS, might be exploited for the conversion of dredged sediment to techno-soils. In accordance with this assumption, the results here obtained showed an increase in organic matter content, both in terms of fulvic and humic acids, in the sediments co-composting with the SMS. At present, there is still a relative paucity of scientific data on the quality of the organic matter characterising the SMS; however, the fulvic fraction was described as an important one, providing organic compounds that are easily mineralised by the receiving microbial community [8]. On the other hand, the humic fraction of SMS was described as composed by aliphatic structures, typically occurring in bioavailable and relatively easily degradable organic materials at the initial decomposition stage [8]. In mesocosms co-composting with the SMS, even though the TPH depletion was absent, the bacterial community evolved during the time of incubation in diverse clusters, as indicated by the PCoA analysis. These changes did not affect the biodiversity indexes of the bacterial community, but a positive correlation between the bacterial ecology evolution and the increment of the fulvic and humic fractions was observed. Considering the structure of the organic matter amended to the soil with the SMS, it is reasonable to suggest that the bacterial community in the co-composting sediments was involved in the transformation of fulvic and humic acids amended with the SMS. In fact, after 30 days of co-composting, the increase in the relative contribution of bacterial genera, expressing enzymes for the oxidation of aromatic structure such as the catechol 1,2-dioxygenases and the benzoate 1,3-dioxygenases, correlated with the depletion of fulvic acids from the co-composting sediments [25]. At the same time the increase in relative contribution of the bacterial genera expressing the alkane 1-monoxygenase after 60 days of incubation correlated with the presence of the aliphatic portion of the humic fraction of the SMS [8].
On the other hand, the bacterial community of the SMS co-composting sediments was found to be competent for the transformation of the TPH contamination, harbouring the xenobiotic degradation module and the composing pathways. In this context, it is reasonable to assume that the bacterial community, even though competent for the transformation of recalcitrant TPHs, was diverted to the transformation of the more biodegradable SMS organic matter. The same can be assessed for the oxidising activity of the SMS associated with the metabolism of the fungal mycelium of P. ostreatus, colonising the matrix. In previous experimentation, the co-composting of contaminated matrices and the SMS from the industrial production of P. ostreatus provided favourable kinetics of contaminant abatement, compatible with the time interval here analysed [10,12]. In the present experiment, the time interval of the treatment was imposed by comparing two biotechnologies for the treatment of dredged sediments. The more favourable results obtained with the bioaugmentation of Lambertella sp. MUT 5852 restricted the time interval of the treatment with SMS to 60 days, a time period comparable to the 28 days of incubation in the presence of the ascomycetes, corresponding to a nearly complete depletion of the contamination. However, results obtained evidenced that, during the above mentioned time period, the fungal contribution to the depletion of the contamination was negligible in the SMS co-composting sediments, since a progressive decrease in ergosterol, a marker of fungal activity [14,15], was recorded. The same decrease in ergosterol was observed also in the sediment bioaugmented with Lambertella sp. MUT 5852, even though the bioaugmentation of the fungal strain was found to be mandatory for TPH depletion. The Lambertella sp. MUT 5852 is capable of utilising diesel oil as its sole carbon source [6]. The diesel oil, the main fuel for shipyards, is the principal source of contamination of the sediments. Thus, it is reasonable to assess that a progressive depletion of the contamination is accompanied by an ergosterol decrease, because of the depletion of the carbon source for the bioaugmented fungal strain. This assumption is favourable to the application of the bioaugmentation approach to bioremediation, since the massive inoculation of a microbial strains creates a potential disequilibrium in the microbial community of the receiving environmental matrices, with the dominance of a microbial population specialised for the biodegradation of the contamination. However, if the dominance is dependent on the concentration of the contaminant, the recovery of an equilibrium in the microbial community occurs with the depletion of the latter.
A positive correlation between the TPH depletion and the bacterial ecology and its evolution with time of incubation in sediments bioaugmented with Lambertella sp. MUT 5852 was also observed, suggesting the participation of the bacterial community to the depletion of the contamination. A decrease in bacterial biodiversity indexes after 18 days of incubation was observed, suggesting a process of speciation of the bacterial population, reasonably specialised for the degradation of the contamination. With the depletion of the contamination a recovery in bacterial biodiversity was observed. Moreover, the pathways of the xenobiotic degradation module and the bacterial genera contributing to the different enzymatic activity here analysed were present in higher numbers in sediments bioaugmented with Lambertella sp. MUT 5852 in comparison to the SMS co-composting mesocosms. All the bacterial genera described as contributing to TPH depletion were already described as having the capacity to transform organic compounds deriving from the contamination by petroleum hydrocarbons. The most represented (more than the 1%) actinobacteriota were in higher number in sediments bioaugmented with Lambertella sp. MUT 5852 than in the SMS co-composting ones (Dietzia, Kocuria, Citrococcus, Gordonia sps. in Lambertella sp. MUT 5852 bioaugmented sediments versus Glutamicibacter and Ornithinimicrobium sps. in SMS co-composting sediments). The most represented proteobacteria showed the same trend (Novosphiungobium, Bordetella, Aminobacter, Aquamicrobium, Rizoraphis sps. versus Novosphiungobium and Bordetella sps.), followed by the bacteroidota, represented by the Sphingobacterium sp. in both experimental conditions. However, at taxonomic level, actinobacteriota and proteobacteria increased in relative abundance with time of incubation only in the sediments co-composting with the SMS. The result is unexpected with reference to the evidence that in these latter no TPH depletion was observed. Previous experimentation suggested the establishment of a metabolic network between ascomycetes and bacterial communities in a TPH-contaminated soil [6,26]. The network is based on the capacity of a saprotrophic fungal strain to increase the bioavailability of the contamination, producing a vast range of extracellular enzymes for the degradation of any carbon source present in the environment, even if recalcitrant to biodegradation and present at limiting concentrations for growth. These metabolic capacities, involved in a general mobilization of carbon, lead to the blooming of microbial commensal species [26]. In the case of contaminated environments, where the carbon source is mainly the contamination, the commensal species are hydrocarburoclastics, competent for the utilisation of the contamination as carbon source. Results here obtained confirm this hypothesis, since a high biodiversity of bacterial genera, competent for TPH depletion, was observed in the mesocosms bioaugmented with the saprotrophic Lambertella sp. MUT 5852. On the other hand, the blooming of hydrocarburoclastic bacterial genera was less important in SMS co-composting mesocosms where the process was restricted to the commensal bacteria capable to utilise primarily the easily biodegradable organic matter associated to the SMS. In this context, mechanisms of competitive substrate inhibition in co-metabolism of organic contaminants, described for hydrocarburoclastic bacterial species [27,28], might be involved. In SMS co-composting mesocosms, all the oxidising activities were diverted onto the transformation of the bioavailable SMS organic matter, leading also to the stabilisation of this fraction, with the consequent increase in humic acid content, not observed in the sediments bioaugmented with Lambertella sp. MUT 5852.
As previously assessed, all the bacterial genera described as contributing to TPH depletion were already described for their capacity to transform organic compounds deriving from contamination by petroleum hydrocarbons. Among actinobacteriota, Glutamicibacter sp. has been described as colonising soils biostimulated to enhance the degradation of TPH [29] and responsible for polycyclic aromatic hydrocarbon degradation in co-composting industrial and municipal sludges [30]. Orninthinimicrobium sp. has been isolated from active sludge [31]; however, as far as we know, this is the first report describing the presence of Orninthinimicrobium sp. in TPH-contaminated soil and the potentiality for their transformation. On the other hand, Dietzia [30] and Kocuria [32] sps. have been described as efficient in the degradation of petroleum derivatives, and Citrococcus and Gordonia sp. as involved in TPH depletion in soils [26]. Among proteobacteria, Novosphingobium [33] and Bordetella sps. [34], have been described as capable of degrading petroleum hydrocarbons, as well as Aquamicrobium [35] and Aminobacter [36] sps. Rizoraphis sp. has been described as colonising diesel-oil-contaminated soils [37]. Competitive substrate inhibition in the co-metabolism of organic contaminants might be involved in the observed response of the bacterial community to the two mycoremediation approaches.

5. Conclusions

Lambertella sp. MUT 5852 bioaugmentation is confirmed as mandatory to deplete TPH from contaminated sediments. The bioaugmentation of a saprotrophic fungal strain elicits the hydrocarburoclastic capacity of the bacterial community autochthonous to the sediments, confirming the hypothesis that a positive correlation between microbial saprotrophic organisms, mobilising the contamination, and commensal specialist species utilising the contamination as carbon source, is mandatory in the framework of TPH depletion in soils and sediments. The same effect was not observed in the co-composting process with SMS from the industrial production of P. ostreatus, where the easily biodegradable organic matter amended with the SMS inhibited the rapid blooming of the hydrocarburoclastic bacterial community, autochthonous to the sediment in treatment. It is reasonable to conclude that the oxidising activity associated to the SMS was initially focused on the stabilisation of the harboured biodegradable organic matter.

Supplementary Materials

The following are available online at https://www.mdpi.com/article/10.3390/w13213040/s1, Figure S1. Functional Heatmap for Benzoate 1,2-dioxygenase at Genus level. Functional Heatmap showing SMS community (panel A) and Lambertella sp. MUT 5852 community (panel B), phylum contribution to Benzoate 1,2- dioxygenase (EC:1.14.12.10). Percentages reported near genus names represent the relative abundance of the sum of contribution of that genus per sample, against total sum of contributions: a cut-off value of 0.005% was chosen. Hierarchical clustering was performed on rows by Pearson correlation, based on Euclidean distance. In order to evidence variation, a colour scheme that represents row-wise Z-scores of per genus contributions per sample, was chosen. For this colour scheme, a Z value of 0 matches the reported percentage near the genus contributor. Figure S2. Functional Heatmap for Catechol 1,2-dioxygenase at Genus level. Functional Heatmap showing SMS community (panel A) and Lambertella sp. MUT 5852 community (panel B), phylum contribution to Catechol 1,2-dioxygenase (EC:1.13.11.1). Percentages reported near genus names represent the relative abundance of the sum of contribution of that genus per sample, against total sum of contributions: a cut-off value of 0.005% was chosen. Hierarchical clustering was performed on rows by Pearson correlation, based on Euclidean distance. In order to evidence variation, a colour scheme that represents row-wise Z-scores of per genus contributions per sample, was chosen. For this colour scheme, a Z value of 0 matches the reported percentage near the genus contributor. Figure S3. Functional Heatmap for Alkane 1-monooxygenase at Genus level. Functional Heatmap showing SMS community (panel A) and Lambertella sp. MUT 5852 community (panel B), phylum contribution to Alkane 1-monooxygenase (EC:1.14.15.3). Percentages reported near genus names represent the relative abundance of the sum of contribution of that genus per sample, against total sum of contributions: a cut-off value of 0.005% was chosen. Hierarchical clustering was performed on rows by Pearson correlation, based on Euclidean distance. In order to evidence variation, a colour scheme that represents row-wise Z-scores of per genus contributions per sample, was chosen. For this colour scheme, a Z value of 0 matches the reported percentage near the genus contributor.

Author Contributions

S.B., I.C., G.S.: Conceptualization, investigation, validation, data curation, writing—original draft; G.B.: Data curation, formal analysis; methodology, software; S.D.G.: Conceptualization, validation, data curation, writing—reviewing and editing, supervision, project administration. All authors have read and agreed to the published version of the manuscript.

Funding

This work was funded by the Bioresnova project 135/11 co-financed by Fondazione Pisa and the Department of Biology, University of Pisa; and by Recycle project ID 872053 H2020-MSCA-RISE-2019.

Conflicts of Interest

The authors declare no conflict of interest.

References

  1. European Sediment Network. In Proceedings of the 9th International SedNet Conference, Kraków, Poland, 23–26 September 2015.
  2. Wang, M.; Wang, C.; Hu, X.; Zhang, H.; He, S.; Lv, S. Distributions and sources of petroleum, aliphatic hydrocarbons and polycyclic aromatic hydrocarbons (PAHs) in surface sediments from Bohai Bay and its adjacent river, China. Mar. Pollut. Bull. 2015, 90, 88–94. [Google Scholar] [CrossRef] [PubMed]
  3. Booth, A.M.; Scarlett, A.G.; Lewis, C.A.; Belt, S.T.; Rowland, S.J. Unresolved complex mixtures (UCMs) of aromatic hydrocarbons: Branched alkyl indanes and branched alkyl tetralins are present in UCMs and accumulated by and toxic to the mussel Mytilus edulis. Environ. Sci. Technol. 2008, 42, 8122–8126. [Google Scholar] [CrossRef] [PubMed]
  4. Federici, E.; Giubilei, M.A.; Covino, S.; Zanaroli, G.; Fava, F.; D’Annibale, A.; Petruccioli, M. Addition of maize stalks and soybean oil to a historically PCB-contaminated soil: Effect on degradation performance and indigenous microbiota. New Biotechnol. 2012, 30, 69–79. [Google Scholar] [CrossRef]
  5. Maila, M.P.; Cloete, T.E. Bioremediation of petroleum hydrocarbons through landfarming: Are simplicity and cost-effectiveness the only advantages? Rev. Environ. Sci. Biotechnol. 2004, 3, 349–360. [Google Scholar] [CrossRef] [Green Version]
  6. Becarelli, S.; Chicca, I.; Siracusa, G.; La China, S.; Gentini, A.; Lorenzi, R.; Munz, G.; Petroni, G.; Levin, D.B.; Di Gregorio, S. Hydrocarbonoclastic Ascomycetes to enhance co-composting of total petroleum hydrocarbon (TPH) contaminated dredged sediments and lignocellulosic matrices. New Biotechnol. 2019, 50, 27–36. [Google Scholar] [CrossRef]
  7. Grard, B.J.; Manouchehri, N.; Aubry, C.; Frascaria-Lacoste, N.; Chenu, C. Potential of Technosols Created with Urban By-Products for Rooftop Edible Production. Int. J. Environ. Res. Public Health. 2020, 17, 3210. [Google Scholar] [CrossRef] [PubMed]
  8. Becher, M.; Banach-Szott, M.; Godlewska, A. Organic Matter Properties of Spent Button Mushroom Substrate in the Context of Soil Organic Matter Reproduction. Agronomy 2021, 11, 204. [Google Scholar] [CrossRef]
  9. Chiu, S.W.; Law, S.C.; Ching, M.L.; Cheung, K.W.; Chen, M.J. Themes for mushroom exploitation in the 21st century: Sustainability, waste management and conservation. J. Gen. Appl. Microbiol. 2000, 46, 269–282. [Google Scholar] [CrossRef] [Green Version]
  10. Di Gregorio, S.; Becarelli, S.; Siracusa, G.; Riffini Castiglione, M.; Petroni, G.; Masini, G.; Gentini, A.; Rubia de Lima e Silva, M.; Lorenzi, R. Pleurotus ostreatus spent mushroom substrate for the degradation of polycyclic aromatic hydrocarbons: The case study of a pilot dynamic biopile for the decontamination of a historically contaminated soil. J. Chem. Technol. Biotechnol. 2016, 91, 1654–1664. [Google Scholar] [CrossRef]
  11. Garcia-Delgado, C.; D’Annibale, A.; Pesciaroli, L.; Yunta, F.; Crognale, S.; Petruccioli, M.; Eymar, E. Implications of polluted soil biostimulation and bioaugmentation with spent mushroom substrate (Agaricus bisporus) on the microbial community and polycyclic aromatic hydrocarbons biodegradation. Sci. Total Environ. 2015, 508, 20–28. [Google Scholar] [CrossRef]
  12. Siracusa, G.; Becarelli, S.; Lorenzi, R.; Gentini, A.; Di Gregorio, S. PCB in the environment: Bio-based processes for soil decontamination and management of waste from the industrial production of Pleurotus ostreatus. New Biotechnol. 2017, 25 Pt B, 232–239. [Google Scholar] [CrossRef]
  13. Marín-Benito, J.M.; Sánchez-Martín, M.J.; Rodríguez-Cruz, M.S. Impact of Spent Mushroom Substrates on the Fate of Pesticides in Soil, and Their Use for Preventing and/or Controlling Soil and Water Contamination: A Review. Toxics 2016, 4, 17. [Google Scholar] [CrossRef] [PubMed] [Green Version]
  14. Buiarelli, F.; Canepari, S.; Di Filippo, P.; Perrino, C.; Pomata, D.; Riccardi, C.; Speziale, R. Extraction and analysis of fungal spore biomarkers in atmospheric bioaerosol by HPLC-MS-MS and GC-MS. Talanta 2013, 105, 142–151. [Google Scholar] [CrossRef] [PubMed]
  15. Olsson, P.A.; Larsson, L.; Bago, B.; Wallander, H.; Van Aarle, I.M. Ergosterol and fatty acids for biomass estimation of mycorrhizal fungi. New Phytol. 2003, 159, 7–10. [Google Scholar] [CrossRef] [Green Version]
  16. Ferraro, D.J.; Gakhar, L.; Ramaswamy, S. Rieske business: Structure-function of Rieske non-heme oxygenases. Biochem. Biophys. Res. Commun. 2005, 338, 175–190. [Google Scholar] [CrossRef]
  17. Shen, F.T.; Young, L.S.; Hsieh, M.F.; Lin, S.Y.; Young, C.C. Molecular detection and phylogenetic analysis of the alkane 1-monooxygenase gene from Gordonia spp. Syst. Appl. Microbiol. 2010, 33, 53–59. [Google Scholar] [CrossRef] [PubMed]
  18. Doni, S.; Macci, C.; Peruzzi, E.; Iannelli, R.; Ceccanti, B.; Masciandaro, G. Decontamination and functional reclamation of dredged brackish sediments. Biodegradation 2013, 24, 499–512. [Google Scholar] [CrossRef] [Green Version]
  19. Ugolini, F.; Mariotti, B.; Maltoni, A.; Tani, A.; Salbitano, F.; Izquierdo, C.G.; Macci, C.; Masciandaro, G.; Tognetti, R. A tree from waste: Decontaminated dredged sediments for growing forest tree seedlings. J. Environ. Manag. 2018, 211, 269–277. [Google Scholar] [CrossRef]
  20. Becher, M. Properties of organic matter of soil fertilised with spent mushroom (Agaricus, L.) Substrate. Acta Agroph. 2013, 20, 241–252. [Google Scholar]
  21. Zied, D.C.; Sánchez, J.E.; Noble, R.; Pardo-Giménez, A. Use of Spent Mushroom Substrate in New Mushroom Crops to Promote the Transition towards A Circular Economy. Agronomy 2020, 10, 1239. [Google Scholar] [CrossRef]
  22. Paredes, C.; Medina, E.; Bustamante, M.A.; Moral, R. Effects of spent mushroom substrates and inorganic fertilizer on the characteristics of a calcareous clayey-loam soil and lettuce production. Soil Use Manag. 2016, 32, 487–494. [Google Scholar] [CrossRef]
  23. Medina, E.; Paredes, C.; Bustamante, M.A.; Moral, R.; Moreno-Caselles, J. Relationships between soil physico-chemical, chemical and biological properties in a soil amended with spent mushroom substrate. Geoderma 2012, 173, 152–161. [Google Scholar] [CrossRef]
  24. Hanafi, F.H.; Rezania, S.; Taib, S.M.; Din, M.F.; Yamauchi, M.; Sakamoto, M.; Hara, H.; Park, J.; Ebrahimi, S.S. Environmentally sustainable applications of agro-based spent mushroom substrate (SMS): An overview. J. Mater. Cycles Waste Manag. 2018, 20, 1383–1396. [Google Scholar] [CrossRef]
  25. Shi, M.; Liu, C.; Wang, Y.; Zhao, Y.; Wei, Z.; Zhao, M.; Song, C.; Liu, Y. Nitrate shifted microenvironment: Driven aromatic-ring cleavage microbes and aromatic compounds precursor biodegradation during sludge composting. Bioresour. Technol. 2021, 342, 125907. [Google Scholar] [CrossRef] [PubMed]
  26. Becarelli, S.; Chicca, I.; La China, S.; Siracusa, G.; Bardi, A.; Gullo, M.; Petroni, G.; Levin, D.B.; Di Gregorio, S. A New Ciboria sp. for Soil Mycoremediation and the Bacterial Contribution to the Depletion of Total Petroleum Hydrocarbons. Front. Microbiol. 2021, 12, 647373. [Google Scholar] [CrossRef]
  27. Hammershøj, R.; Birch, H.; Redman, A.D.; Mayer, P. Mixture Effects on Biodegradation Kinetics of Hydrocarbons in Surface Water: Increasing Concentrations Inhibited Degradation whereas Multiple Substrates Did Not. Environ. Sci. Technol. 2019, 53, 3087–3094. [Google Scholar] [CrossRef] [PubMed]
  28. Knightes, C.D.; Peters, C.A. Multisubstrate biodegradation kinetics for binary and complex mixtures of polycyclic aromatic hydrocarbons. Environ. Toxicol. Chem. 2006, 25, 1746–1756. [Google Scholar] [CrossRef]
  29. Wang, M.; Garrido-Sanz, D.; Sansegundo-Lobato, P.; Redondo-Nieto, M.; Conlon, R.; Martin, M.; Mali, R.; Liu, X.; Dowling, D.N.; Rivilla, R.; et al. Soil Microbiome Structure and Function in Ecopiles Used to Remediate Petroleum-Contaminated Soil. Front. Environ. Sci. 2021, 9, 624070. [Google Scholar] [CrossRef]
  30. Lu, Y.; Zheng, G.; Zhou, W.; Wang, J.; Zhou, L. Bioleaching conditioning increased the bioavailability of polycyclic aromatic hydrocarbons to promote their removal during co-composting of industrial and municipal sewage sludges. Sci. Total Environ. 2019, 665, 1073–1082. [Google Scholar] [CrossRef]
  31. Liu, X.Y.; Wang, B.J.; Jiang, C.Y.; Liu, S.J. Ornithinimicrobium pekingense sp. nov., isolated from activated sludge. Int. J. Syst. Evol. Microbiol. 2008, 58 Pt 1, 116–119. [Google Scholar] [CrossRef] [Green Version]
  32. Li, F.; Guo, S.; Hartog, N.; Yuan, Y.; Yang, X. Isolation and characterization of heavy polycyclic aromatic hydrocarbon-degrading bacteria adapted to electrokinetic conditions. Biodegradation 2016, 27, 1–13. [Google Scholar] [CrossRef]
  33. Chettri, B.; Singh, A.K. Kinetics of hydrocarbon degradation by a newly isolated heavy metal tolerant bacterium Novosphingobium panipatense P5:ABC. Bioresour. Technol. 2019, 294, 122190. [Google Scholar] [CrossRef] [PubMed]
  34. Kaplan, C.W.; Kitts, C.L. Bacterial succession in a petroleum land treatment unit. Appl. Environ. Microbiol. 2004, 70, 1777–1786. [Google Scholar] [CrossRef] [PubMed] [Green Version]
  35. Brzeszcz, J.; Kapusta, P.; Steliga, T.; Turkiewicz, A. Hydrocarbon Removal by Two Differently Developed Microbial Inoculants and Comparing Their Actions with Biostimulation Treatment. Molecules 2020, 25, 661. [Google Scholar] [CrossRef] [PubMed] [Green Version]
  36. Patel, A.B.; Singh, S.; Patel, A.; Jain, K.; Amin, S.; Madamwar, D. Synergistic biodegradation of phenanthrene and fluoranthene by mixed bacterial cultures. Bioresour. Technol. 2019, 284, 115–120. [Google Scholar] [CrossRef] [PubMed]
  37. Gran-Scheuch, A.; Ramos-Zuñiga, J.; Fuentes, E.; Bravo, D.; Pérez-Donoso, J.M. Effect of Co-contamination by PAHs and Heavy Metals on Bacterial Communities of Diesel Contaminated Soils of South Shetland Islands, Antarctica. Microorganisms 2020, 8, 1749. [Google Scholar] [CrossRef]
Figure 1. Percentage of variation in TPH content. Reported boxplots represent the mean variation of TPH concentration from the start of the bioaugmentation tests in presence of panel (A) Spent mushroom substrate (SMS), panel (B) Lambertella sp. MUT 5852, expressed as percentage. Three biological replicates per group are reported. Box and whiskers represent the minimum (Q0), 1st quartile (Q1), median (Q2), 3rd quartile(Q3), and maximum (Q4) of each group. Global statistical significance was tested by one-way ANOVA. Horizontal bars indicate statistical significance of multiple comparisons, calculated by post hoc paired t-tests between group means. Notation for p-value: ns for p > 5 ×10⁻²; ** for p ≤ 1 × 10⁻²; *** for p ≤ 1 × 10⁻³.
Water 13 03040 g001
Figure 2. Percentage of variation in other chemical parameters. Reported boxplots represent ergosterol and fulvic and humic acid variations from the start of the bioaugmentation tests in the presence of spent mushroom substrate (A,C,E) and Lambertella sp. MUT 5852 (B,D,F), expressed as a percentage. Three biological replicates per group are reported. Box and whiskers represent the minimum (Q0), 1st quartile (Q1), median (Q2), 3rd quartile (Q3), and maximum (Q4) of each group. Global statistical significance was tested by one-way ANOVA. Horizontal bars indicate statistical significance of multiple comparisons, calculated by post hoc paired t-tests between group means. Notation for p-value: ns for p > 5 × 10⁻²; * for p ≤ 5 × 10⁻²; ** for p ≤ 1 × 10⁻²; *** for p ≤ 1 × 10⁻³.
Water 13 03040 g002
Figure 3. α and β diversity of SMS incubation. Chao1 index (A) Hill–Shannon (B) Hill–Simpson index (C), each calculated after rarefaction to a coverage of 99.5%, and rarefaction curves of observed species of bacterial community composition (D). Box and whiskers represent the minimum (Q0), 1st quartile (Q1), median (Q2), 3rd quartile (Q3), and maximum (Q4) of each group. Reported p-value is calculated by the Kruskal–Wallis test (α = 0.05). Post hoc statistical test is based on the Dunn test with Benjamini–Hochberg correction for multiple comparisons. Notation for p-value: ns for p > 0.05. Principal component analysis (PCoA) (E) represents bacterial community in the presence of SMS, based on weighted UniFrac distance for each sample replicate. Colours indicate time category for each datapoint. The percentage reported on axes represents the amount of total variance depicted by each. The p-value was calculated by the ADONIS function (Vegan R package v 2.5-7) between weighted UniFrac distances and sample groups using the Bray–Curtis method with 1000 repetitions.
Water 13 03040 g003
Figure 4. Canonical correspondence analysis (CCA) of SMS incubation. Canonical correspondence analysis (CCA) biplot (A) that shows correlation between ASV composition of each sample replicate and the environmental parameters: fulvic and humic acids, TPH, and ergosterol. Colours indicate time category for each datapoint. Black arrows are the eigen-vectors representing constraining variables. Reported p-value is calculated by PERMANOVA test performed on a full model with 999 permutations. (B): correlogram that reports correlation between environmental parameters, biomarker, and toxicological parameters. Heat colours and ellipse shapes represent degree of correlation, based on Pearson coefficient. Notation for p-value: ns for p > 0.05; ** for p ≤ 1 × 10⁻²; *** for p ≤ 1 × 10⁻³, based on Fisher’s Z transformation of the aforementioned coefficients.
Water 13 03040 g004
Figure 5. α diversity and β diversity of Lambertella sp. MUT 5852 incubation. Chao1 index (A) Hill–Shannon (B) Hill–Simpson index (C), each calculated after rarefaction to a coverage of 99.5%, and rarefaction curves of observed species of bacterial community composition (D). Box and whiskers represent the minimum (Q0), 1st quartile (Q1), median (Q2), 3rd quartile(Q3), and maximum (Q4) of each group. Reported p-value is calculated by Kruskal–Wallis test (α = 0.05). Post hoc statistical test is based on the Dunn test, with Benjamini–Hochberg correction for multiple comparisons: Notation for p-value: ns for p > 0.05. Principal component analysis (PCoA) (E) represents the bacterial community in presence of Lambertella sp. MUT 5852, based on weighted UniFrac distance for each sample replicate. Colours indicate time category for each datapoint. The percentage reported on axes represents the amount of total variance depicted by each. The p-value was calculated by the ADONIS function (Vegan R package v 2.5-7) between weighted UniFrac distances and sample groups, using the Bray–Curtis method with 1000 repetitions.
Water 13 03040 g005
Figure 6. Canonical correspondence analysis (CCA) of Lambertella sp. MUT 5852 incubation. Canonical correspondence analysis (CCA) biplot (A) that shows correlation between ASV composition of each sample replicate and the environmental parameters: fulvic and humic acids, TPH, and ergosterol. Colours indicate time category for each datapoint. Black arrows are the eigenvectors representing constraining variables. Reported p-value is calculated by PermANOVA test performed on a full model with 999 permutations. (B): correlogram that reports correlation between environmental parameters, and biomarker and toxicological parameters. Heat colours and ellipse shapes represent the degree of correlation, based on Pearson coefficient. Notation for p-value: ns for p > 0.05; * for p ≤ 0.05; ** for p ≤ 0.01; *** for p ≤ 0.001, based on Fisher’s Z transformation of the aforementioned coefficients.
Water 13 03040 g006
Figure 7. Taxonomic heatmaps at phylum level. Taxonomic heatmaps showing the most abundant ASVs per sample for SMS community (A) and Lambertella sp. MUT 5852 community (B), agglomerated at phylum level. Percentages reported near ASV names represent the relative abundance of the sum of ASV counts per sample against total sum: a cut-off value of 0.005% was chosen. Hierarchical clustering was performed on rows by Pearson correlation, based on Euclidean distance. In order to evidence variation, a colour scheme that represents row-wise Z-scores of ASV counts per sample was chosen. For this colour scheme, a Z value of 0 matches the reported percentage near ASV name.
Water 13 03040 g007
Figure 8. Barplot of xenobiotic contributions. Barplots showing the relative distribution of KEGG pathways under xenobiotic degradation family for panel (A) SMS and panel (B) Lambertella sp. MUT 5852, calculated by PICRUSt2.
Water 13 03040 g008
Figure 9. Functional heatmap for benzoate 1,2- dioxygenase at genus level. Functional heatmap showing SMS community (A) and Lambertella sp. MUT 5852 community (B), genus contribution to benzoate 1,2-dioxygenase (EC:1.14.12.10). Percentages reported near genus names represent the relative abundance of the sum of contribution of that genus per sample, against the total sum of contributions: a cut-off value of 0.005% was chosen. Hierarchical clustering was performed on rows by Pearson correlation, based on Euclidean distance. In order to show variation, a colour scheme that represents row-wise Z-scores of per genus contributions per sample was chosen. For this colour scheme, a Z value of 0 matches the reported percentage near the genus contributor.
Water 13 03040 g009
Figure 10. Functional heatmap for catechol 1,2- dioxygenase at genus level. Functional heatmap showing SMS community (A) and Lambertella sp. MUT 5852 community (B), genus contribution to catechol 1,2- dioxygenase (EC:1.13.11.1). Percentages reported near genus names represent the relative abundance of the sum of the contribution of that genus per sample, against the total sum of contributions: a cut-off value of 0.005% was chosen. Hierarchical clustering was performed on rows by Pearson correlation, based on Euclidean distance. In order to evidence variation, a colour scheme that represents row-wise Z-scores of per genus contributions per sample, was chosen. For this colour scheme, a Z value of 0 matches the reported percentage near the genus contributor.
Water 13 03040 g010
Figure 11. Functional heatmap for alkane 1-monooxygenase at genus level. Functional heatmap showing SMS community (A) and Lambertella sp. MUT 5852 community (B), genus contribution to alkane 1-monooxygenase (EC:1.14.15.3). Percentages reported near genus names represent the relative abundance of the sum of contribution of that genus per sample, against the total sum of contributions: a cut-off value of 0.005% was chosen. Hierarchical clustering was performed on rows by Pearson correlation, based on Euclidean distance. In order to evidence variation, a colour scheme that represents row-wise Z-scores of per genus contributions per sample was chosen. For this colour scheme, a Z value of 0 matches the reported percentage near the genus contributor.
Water 13 03040 g011
Table 1. Chemical/physical characteristics of the dredged sediment.
ComponentsDredged Sediment
Total Phosphate12 ± 0.1 mg/Kg
Total Nitrogen0.29 ± 0.03 mg/Kg
Chloride39 ± 0.3 g/L
TPH C > 122864 ± 99 mg/Kg
pH8.2
Granulometric fraction<2 mm
Publisher’s Note: MDPI stays neutral with regard to jurisdictional claims in published maps and institutional affiliations.

