
Combined Treatments of Underground Coal Slurry: Laboratory Testing and Field Application


1
College of Energy and Mining Engineering, Shandong University of Science and Technology, Qingdao 266590, China
2
Key Laboratory of Mining Disaster Prevention and Control, Shandong University of Science and Technology, Qingdao 266590, China
3
College of Geodesy and Geomatics, Shandong University of Science and Technology, Qingdao 266590, China
4
School of Civil, Mining and Environmental Engineering, University of Wollongong, Wollongong 2500, Australia
*
Authors to whom correspondence should be addressed.
Water 2021, 13(21), 3047; https://doi.org/10.3390/w13213047
Submission received: 22 September 2021
/
Revised: 20 October 2021
/
Accepted: 30 October 2021
/
Published: 1 November 2021
(This article belongs to the Section Wastewater Treatment and Reuse)
Abstract
:During the coal mining process, underground water is generated from the longwall face. In the meantime, the coal cutting process would produce coal particles. Coal slurry is generated in the underground working site, especially for water abundant coal mines. The generated coal slurry is treated to prevent water pollution. Due to the extensively existing of the suspended solid, the traditional process method would often introduce new problems. In this study, laboratory testing was conducted to investigate the characteristics, including the particle size distribution of the coal sludge, coal slurry compositions, slurry viscosity and coal mine water quality. In order to improve the coal slurry treatment efficiency, based on the laboratory results, a novel combined treatment of underground coal slurry is proposed. First, the coarse grained coal slurry is process by a vibrating screening machine. Then, the coal slurry containing fine coal powders is processed through a settling pond. The sedimentation results of the coal solid materials are analyzed. The polymer flocculant is also added into the coal slurry to improve the sedimentation. These combined treats of the coal slurry significantly remove the suspended solid and improve the quality of the coal mine water. Based on the laboratory testing, the specific details of the field applications are designed. The key novelty of this paper is the underground background. All of these treatments are based on the underground environment and are capable of being applied in underground workings. From field applications and observations, these novel combined treatments of coal slurry in the underground site are effective. This study provides a novel method to treat the coal slurry, which has innovations from engineering aspect. These procedures are useful for the underground coal slurry treatment, especially for water-abundant coal mines. The normal coal production is guaranteed and less affected by the coal slurry discharge process. Meanwhile, the water pollution problem is much addressed and the damage of coal slurry to the environment is reduced.
1. Introduction
In the coal mining industry, large volumes of coal mine water are pumped onto the surface. It has been reported that water pollution is introduced by mining activities [1,2,3], including acid mine drainage (AMD) and chemical elements elevation (such as heavy metals) [4,5]. Additionally, on the ground surface, the precipitation of the suspended solid (SS) can cause damage to the surrounding environment and soil sealing [6,7,8].
From the underground mining aspect, the coal mine water can be treated once coal mine water is generated during the coal cutting process [9,10]. At the working face, coal fines and powders are produced [11] and the ground water can be disturbed, so that the coal slurry is formed by mixing broken coals and water, especially for some water-abundant coal mines [10]. Many factors can affect the solid concentrations of the coal slurry. Much more coal powders can be generated for soft coal seams. When the working face approaches the structures, such as with faults, slower retreating speed is adopted. Tectonic coals with low strength are often encountered [12]. More coal slurry is produced with much more water. Usually, the coal slurry is stored in the underground water bins near the long wall panel. Coarse grain sized coals are precipitated in the water bins and the suspended solid materials are still in the liquid solutions. Coal mine water with less powder concentrations is pumped out of the underground sites [13]. In this process, the sediments of the coal powders accumulate in the underground water bins. The storage capacity of water bins decreases with the increase of coal sludge. Much work is required to remove the coal sludge precipitated at the bottom of the water bins, so that the normal production is affected. Meanwhile, in the course of pumping, the solid materials negatively affect the working efficiency, with blocking the mine water pipelines.
Minerals are widely existing in the coal mine water [14,15]. It is reported that mine water is mildly acidic to alkaline due to the existence of different minerals [16,17,18,19]. The major positive ions (Ca2+, Na+, Mg2+, K+) and the major negative ions (F−, Cl−, NO3−, HCO3−, SO42−) are detected in the coal mine water [20,21]. Water hardness is an index to evaluate the alkaline elements in the water solutions [13,19,22]. In order to avoid any water pollution, essential methods should be adopted to remove these ions. To solve the acid mine drainage problem, Portland cement with different slurry viscosity is used to neutralize the acid mine water [23,24]. The long term effectiveness is satisfactory and the total cost is better than lime neutralization. During the coal washing process, coagulant and flocculent are often added into the coal slime to increase the precipitation of solid materials suspending in the mine slime water, due to the high separation efficiency of these polymer flocculent [25,26]. The mineral waste tailings are effectively disposed. Inspired by this technology, the flocculent can be added into the coal slurry in the underground sites, so that the clean water can be pumped out. Coal slurry water is treated at the original source. However, the effectiveness of the flocculent depends not only the chemical characteristics but also on the mineral ions [22,27]. Laboratory experiments are carried out to investigate the influencing factors on the performance, such as flocculent dosage, pH values, ion types, stirring frequency. Even though the flocculation and polymers are used for the treatments of waste water, there are few studies based on the underground background. In other words, there is no detailed studies regarding coal slurry treatment.
This study investigates the combined treatment of underground coal slurry that is produced during the coal cutting process. From the literature review, we find there is few studies focusing on the mine water treatments in underground workings. Coal mine water treatments methods are proposed based on the underground working environment. Most of the previous studies are carried out in the surface water treatment plants or laboratories. For the coal slurry in the underground coal mines, there is few studies. It should also be noted that the mineral compositions may be quite different from the surface waste water. The coal slurry is generated by mixing water and coal fines. The proposed treatments are based on the underground environment and are more practical for field applications. Coal slurry was collected from the underground working face. The coal slurry was characterized through laboratory testing. Based on the testing results, three steps of coal slurry process technique were put forward and applied into the underground. Specifically, coal slurry first is processed by a vibrating sieving machine, so that the large sized powders are separated from water. Then, coal water is discharged into the settling pond and the flocculent is added into the slurry and flocculation happens. Last, it is pumped out of the underground workings. From the observations of the field application, the solid particle in the coal mine water is significantly dropped and the quality of the mine water is improved.
2. Coal Mine Geological Settings
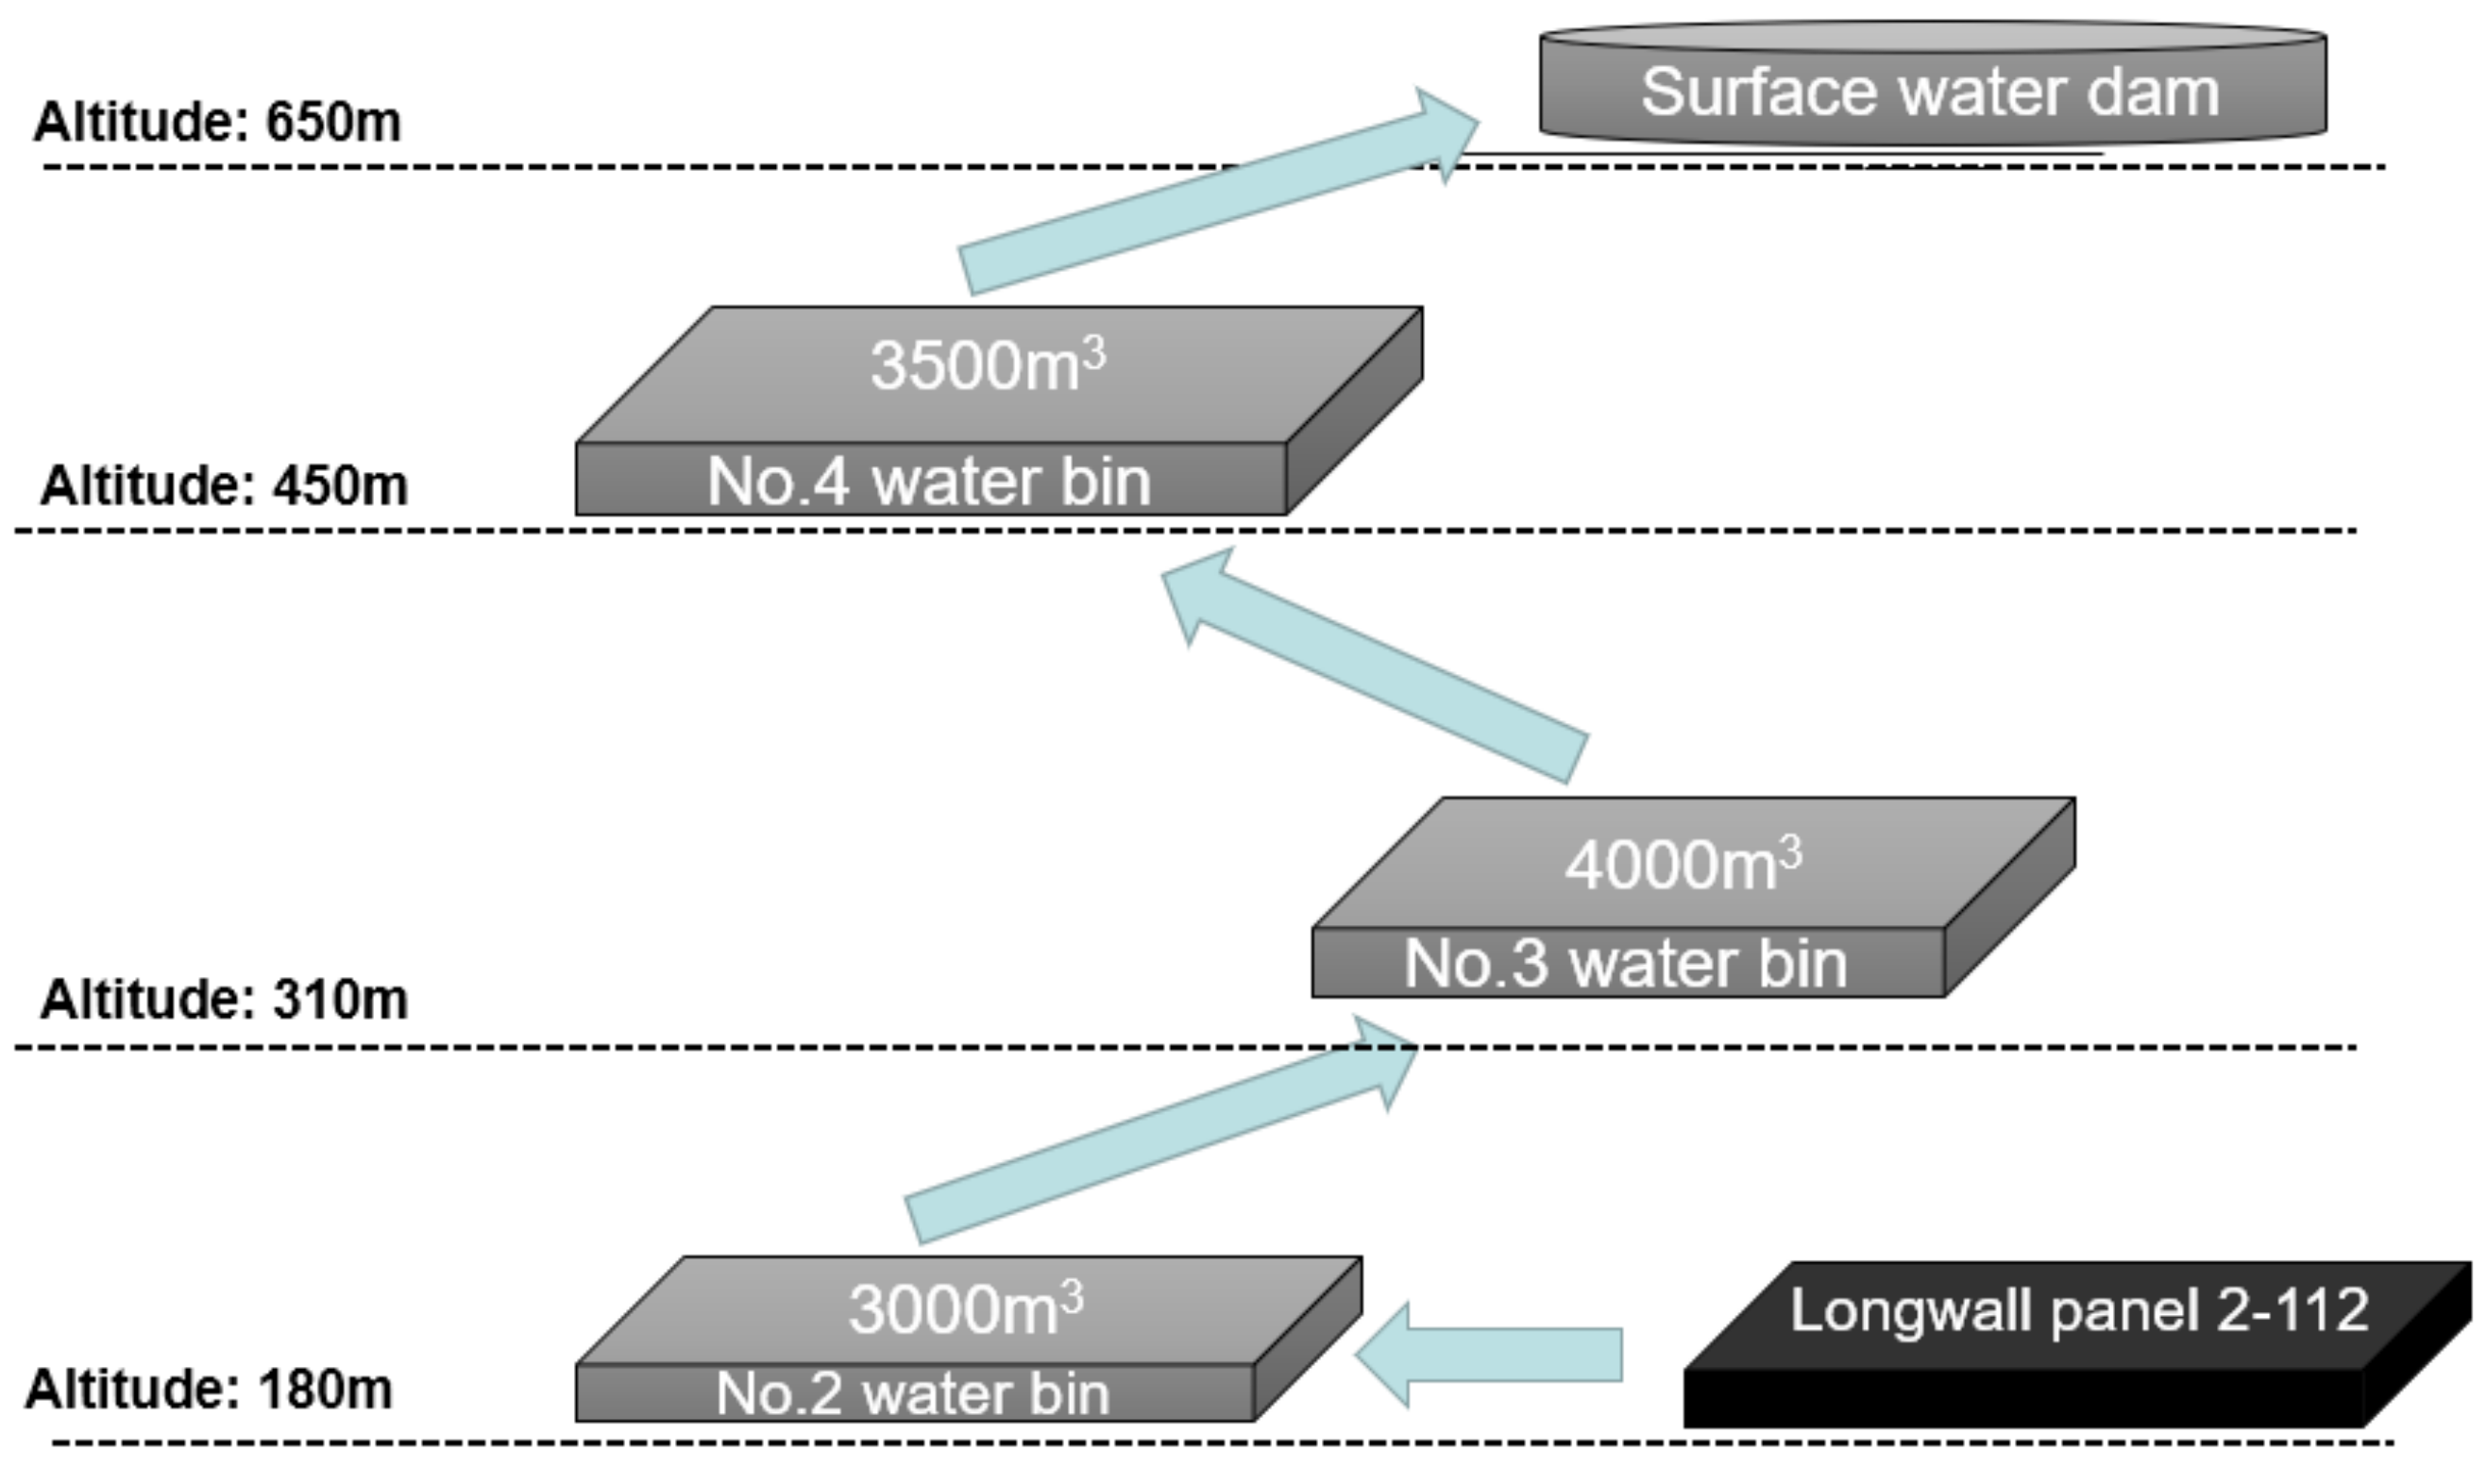
This study is based on the longwall panel 2-112 of Xinzhi coal mine, Huozhou Coal Electricity Group Co., Ltd. The water production rate at the working face is approximately 50 m3/h. Large volume of coal fines are produced during the coal cutting process and coal slurry is generated. Multi-level lifting system is used for the water drainage system. The produced coal mine water is first stored in the No. 2 water bin in the mining area. Then, water is pumped into the No. 3 water bins located at the 310 m level and the No. 4 water bins at the 450 m level, respectively. Lastly, water is pumped from the No. 4 water bins at the 450 m level to the water disposal plant on the surface. Due to the existence of coal fines and particles in the coal mine water, the water lifting cost increases. Meanwhile, it is required to clean the coal sludge at the bottom of the water bins, which would disturb the coal normal production.
In the mining area, there are 33 faults in total cutting the coal seam. Four faults are in the longwall panel 2-112, which significantly affect the mining activities. According to the geological data, the inflow of water is from sandstone roof, above the No. 2 coal seam. There are mainly three water-bearing stratum, marked as K8, K9 and K10. The K8 layer is grayish medium fine grained sandstone, with the thickness of 4.5 m. The K9 layer is grayish medium coarse grained sandstone, with the thickness of 8.45 m. The K10 layer is celadon coarse grained sandstone, with the thickness of 7 m. During the longwall panel retreat process, these sandstone layers are directly touched with the coal seam. Especially, in the fault zone, the aquifer will impact the normal production of coal.
In the 2-112 longwall working face, two water pipelines with the diameter of six inches, are installed at the main gate. In the tailgate, three water pipelines (six inches) were installed. The layout of the water bins is shown in Figure 1. All of these pipelines are connected to the No. 2 water bin located in the mining area. In the No. 2 water bin, there are four centrifugal pumps (MD280-43 × 7 series). Between the No. 2 water bin and the No. 3 water bin, two pairs of water pipeline (diameter 290 mm) are installed and the distance is 3300 m. The total vertical height is 240 m and the maximum water flow rate is 500 m3/h. The total storage capacity of the No. 2 water bin is 3000 m3. At the No. 3 water bin, there are four centrifugal pumps (MD450-60 × 4 series). Between the No. 3 water bin and the No. 4 water bin, two pairs of water pipeline (diameter 325 mm) are installed and the distance is 5600 m. The total vertical height is 145 m and the maximum water flow rate is 1157 m3/h. The total storage capacity of the No. 3 water bin is 4000 m3. At the No. 4 water bin, five centrifugal pumps (D280-43 × 7 series) are installed. From the No. 4 water bin, there are three series of water pipelines, connecting to the surface. The total vertical height is 220 m and the maximum water flow rate is 850 m3/h. The total storage capacity of the No. 4 water bin is 3500 m3. it can be concluded that the water lifting system is complicated. Due to the existence of coal powders in the water, the sedimentation of coal sludge would block the water pipelines and the water bins, if the coal sludge is not timely cleaned. After the combined treatments, the discharged water is stored in the water dam on the surface. This water is recycled, mainly for two purposes: water spray for dust suppression and coal handling preparation plant.
3. Materials and Methods
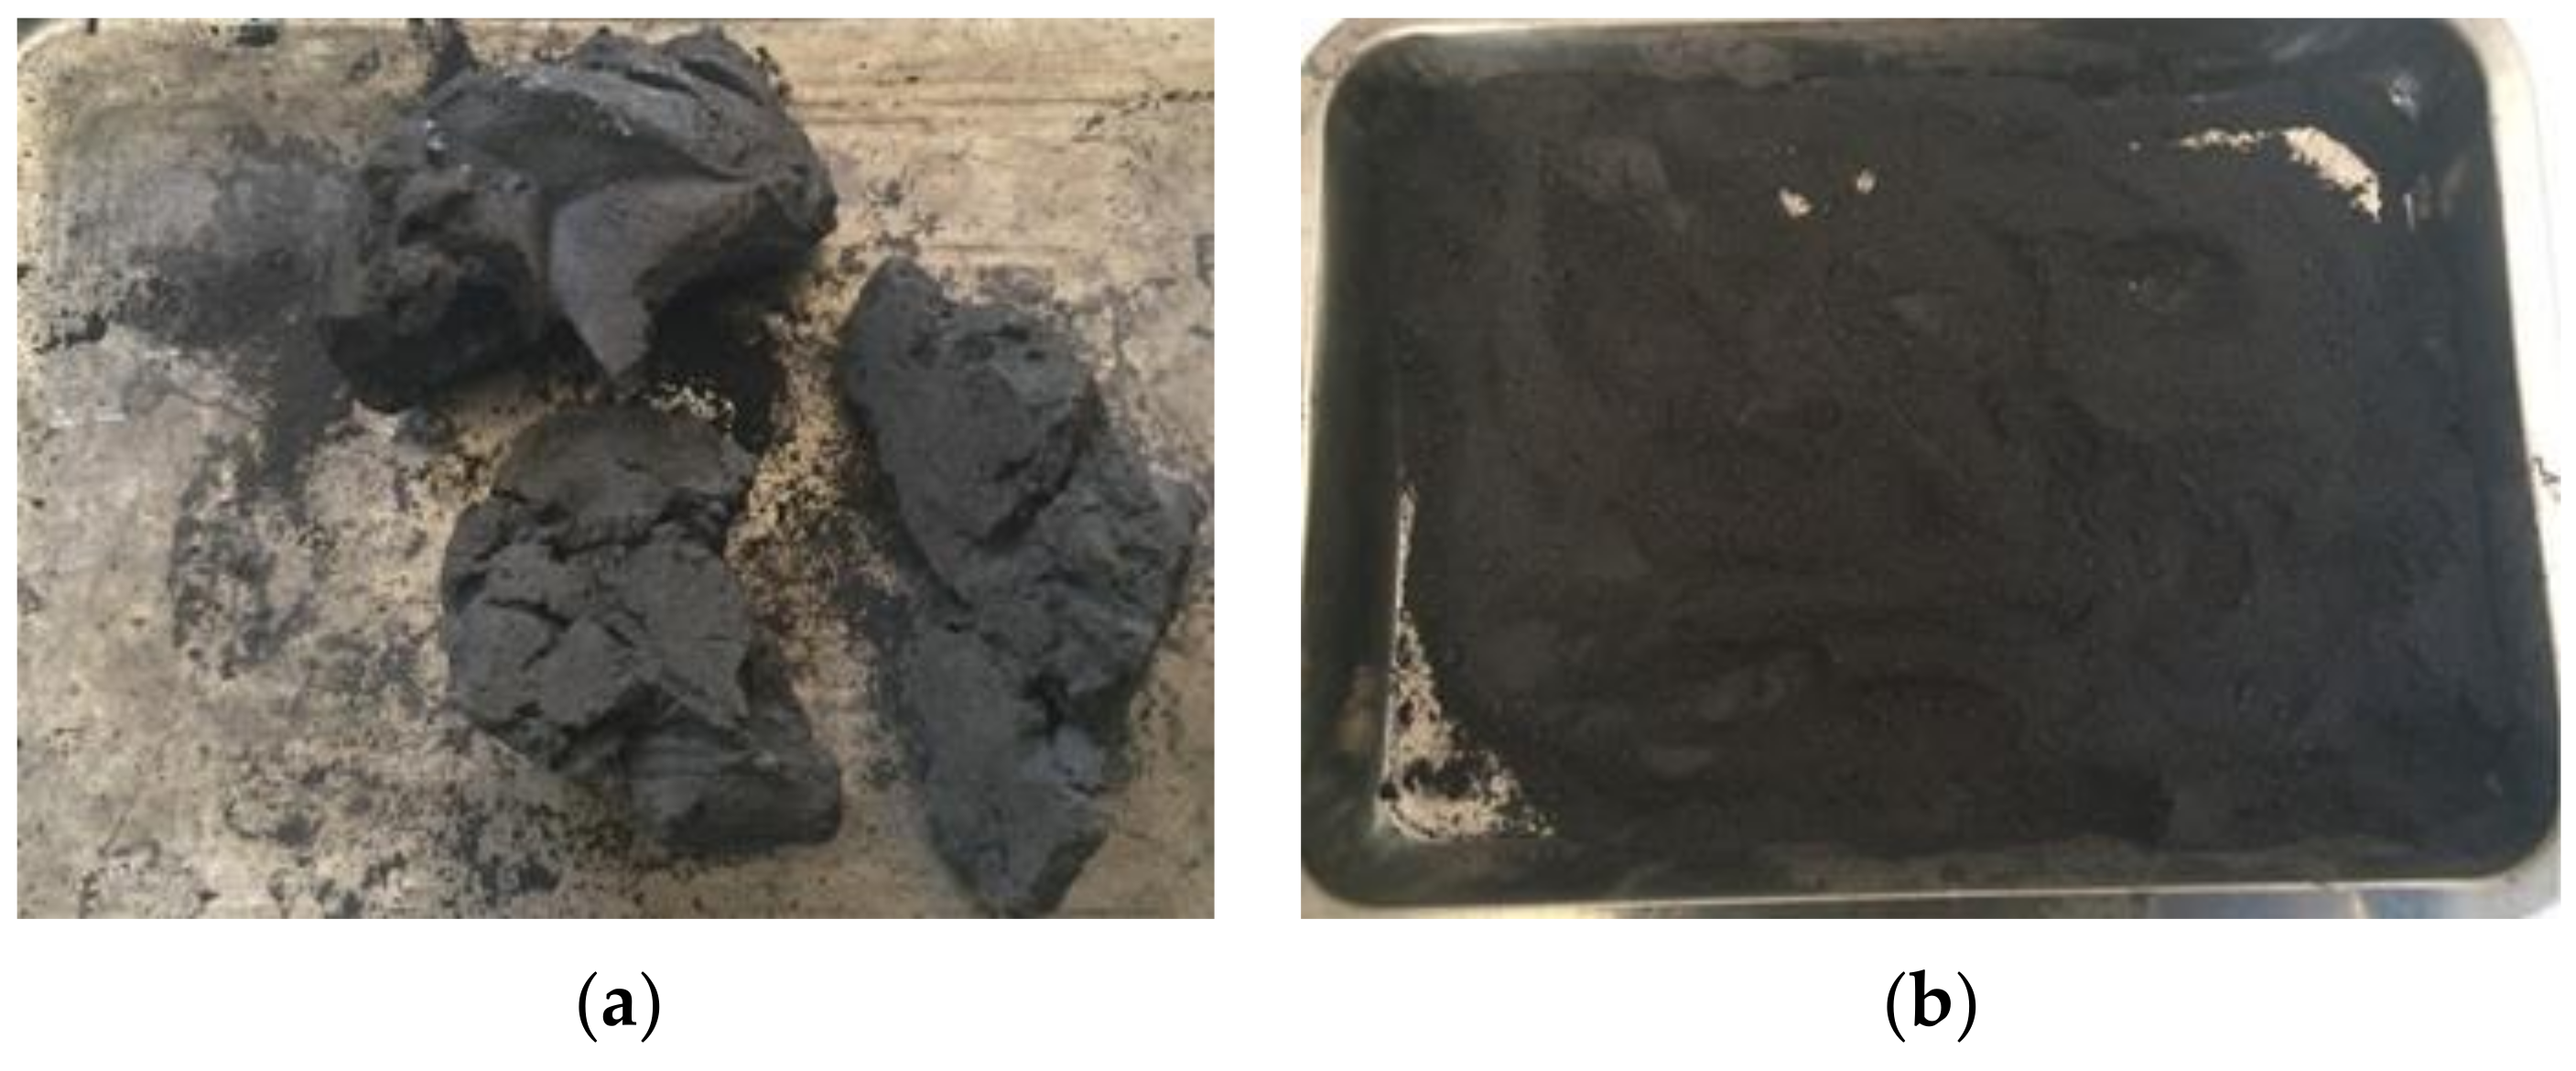
The selection of the vibrating sieving machine is highly related to the grain size, so the solid grain size distributions are measured in laboratory. Coal slime water and sludge were collected from the Longwall 2-112 working face and transported to the laboratory. The sludge was baked in an oven through a tray. The temperature was set as 60 Celsius degrees. If the temperature is higher than 70 degrees Celsius, the oxidation process is sharply increasing [28] and the compositions of the coal powder change. In order to minimize the oxidation, we chose 60 degrees Celsius as the testing temperature. The weight of the tray and the sludge was measured every three hours, until there was no weight loss. After that, the hardened sludge was broken by a hammer. The powders were wrapped by plastic wrap, as shown in Figure 2.
3.1. Particle Size Distribution Test
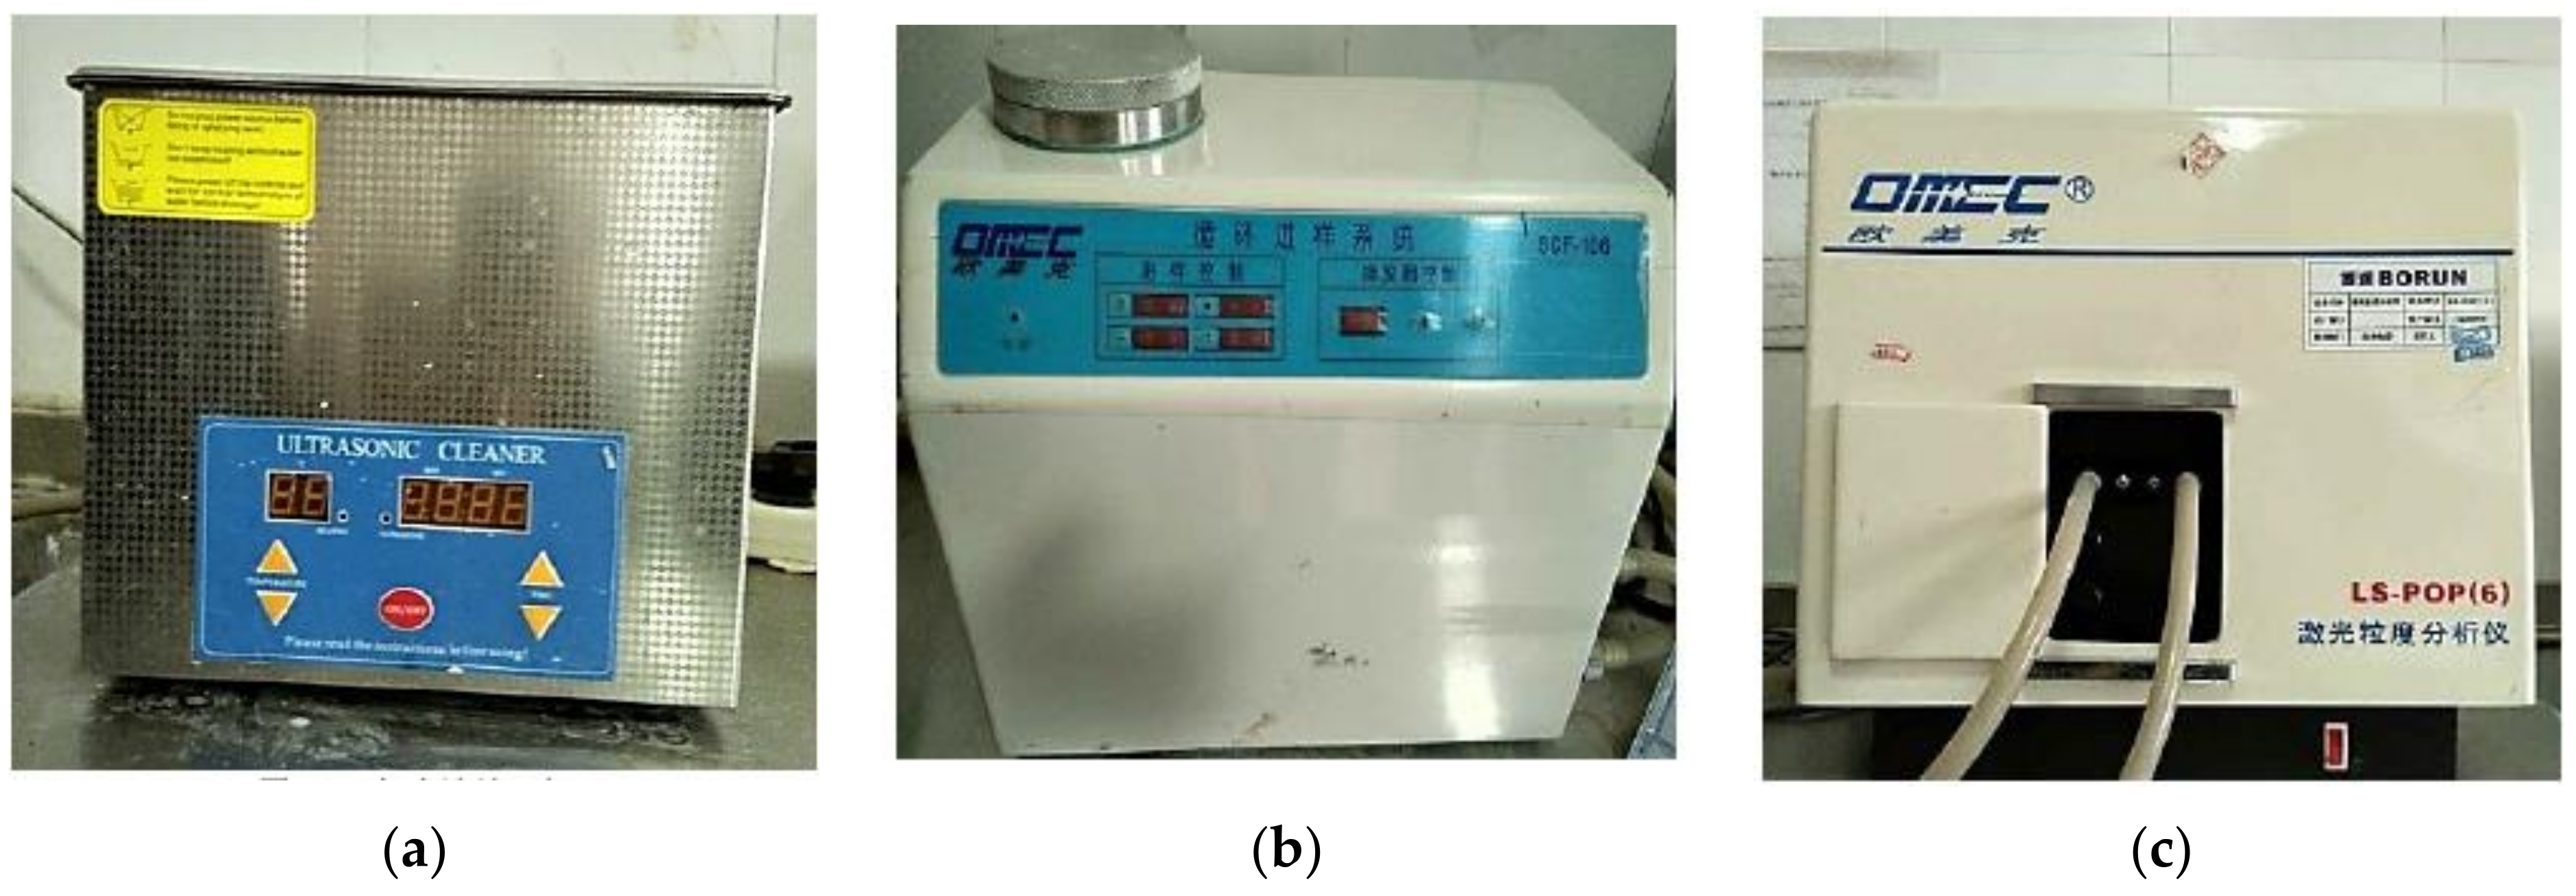
The particle size distribution was measured by a laser particle analyzer (LS-POP6), manufactured by OMEC. Three key parts were used during the testing, including ultrasonic washing unit, sample loading unit and the testing unit, as shown in Figure 3.
The laser particle analyzer employs the principles of scattering of light. As the light is a kind of electromagnetic wave, it interacts with the particles in the process of propagation and deviates from its original direction. In this study, five samples are tested and here are the testing procedures of particle size distributions.
- Before the testing, it would require half an hour for preheating. Then, the process time and the number of tests is set;
- Put 0.5 g of the coal powders into a beaker, and add 40–50 mL of distilled water. Six to seven drops of sodium hexametaphosphate solution are added into the mixture, by a rubber head dropper. Put the beaker into the water basin of the ultrasonic washing unit and wash the samples for three minutes;
- The powders are transported into the sample loading unit and testing unit successively. The measuring process are conducted automatically and the testing results are saved in the computer.
3.2. Composition Analysis and Slurry Viscosity Test
For underground coal slurry, the physical properties change significantly from one mine site to another [22]. It is essential to understand the coal slurry’s chemical compositions for the chosen of flocculent. Five coal powder samples were collected and the chemical compositions were tested by the XRF spectrum analyzer (XRF-1800 series).
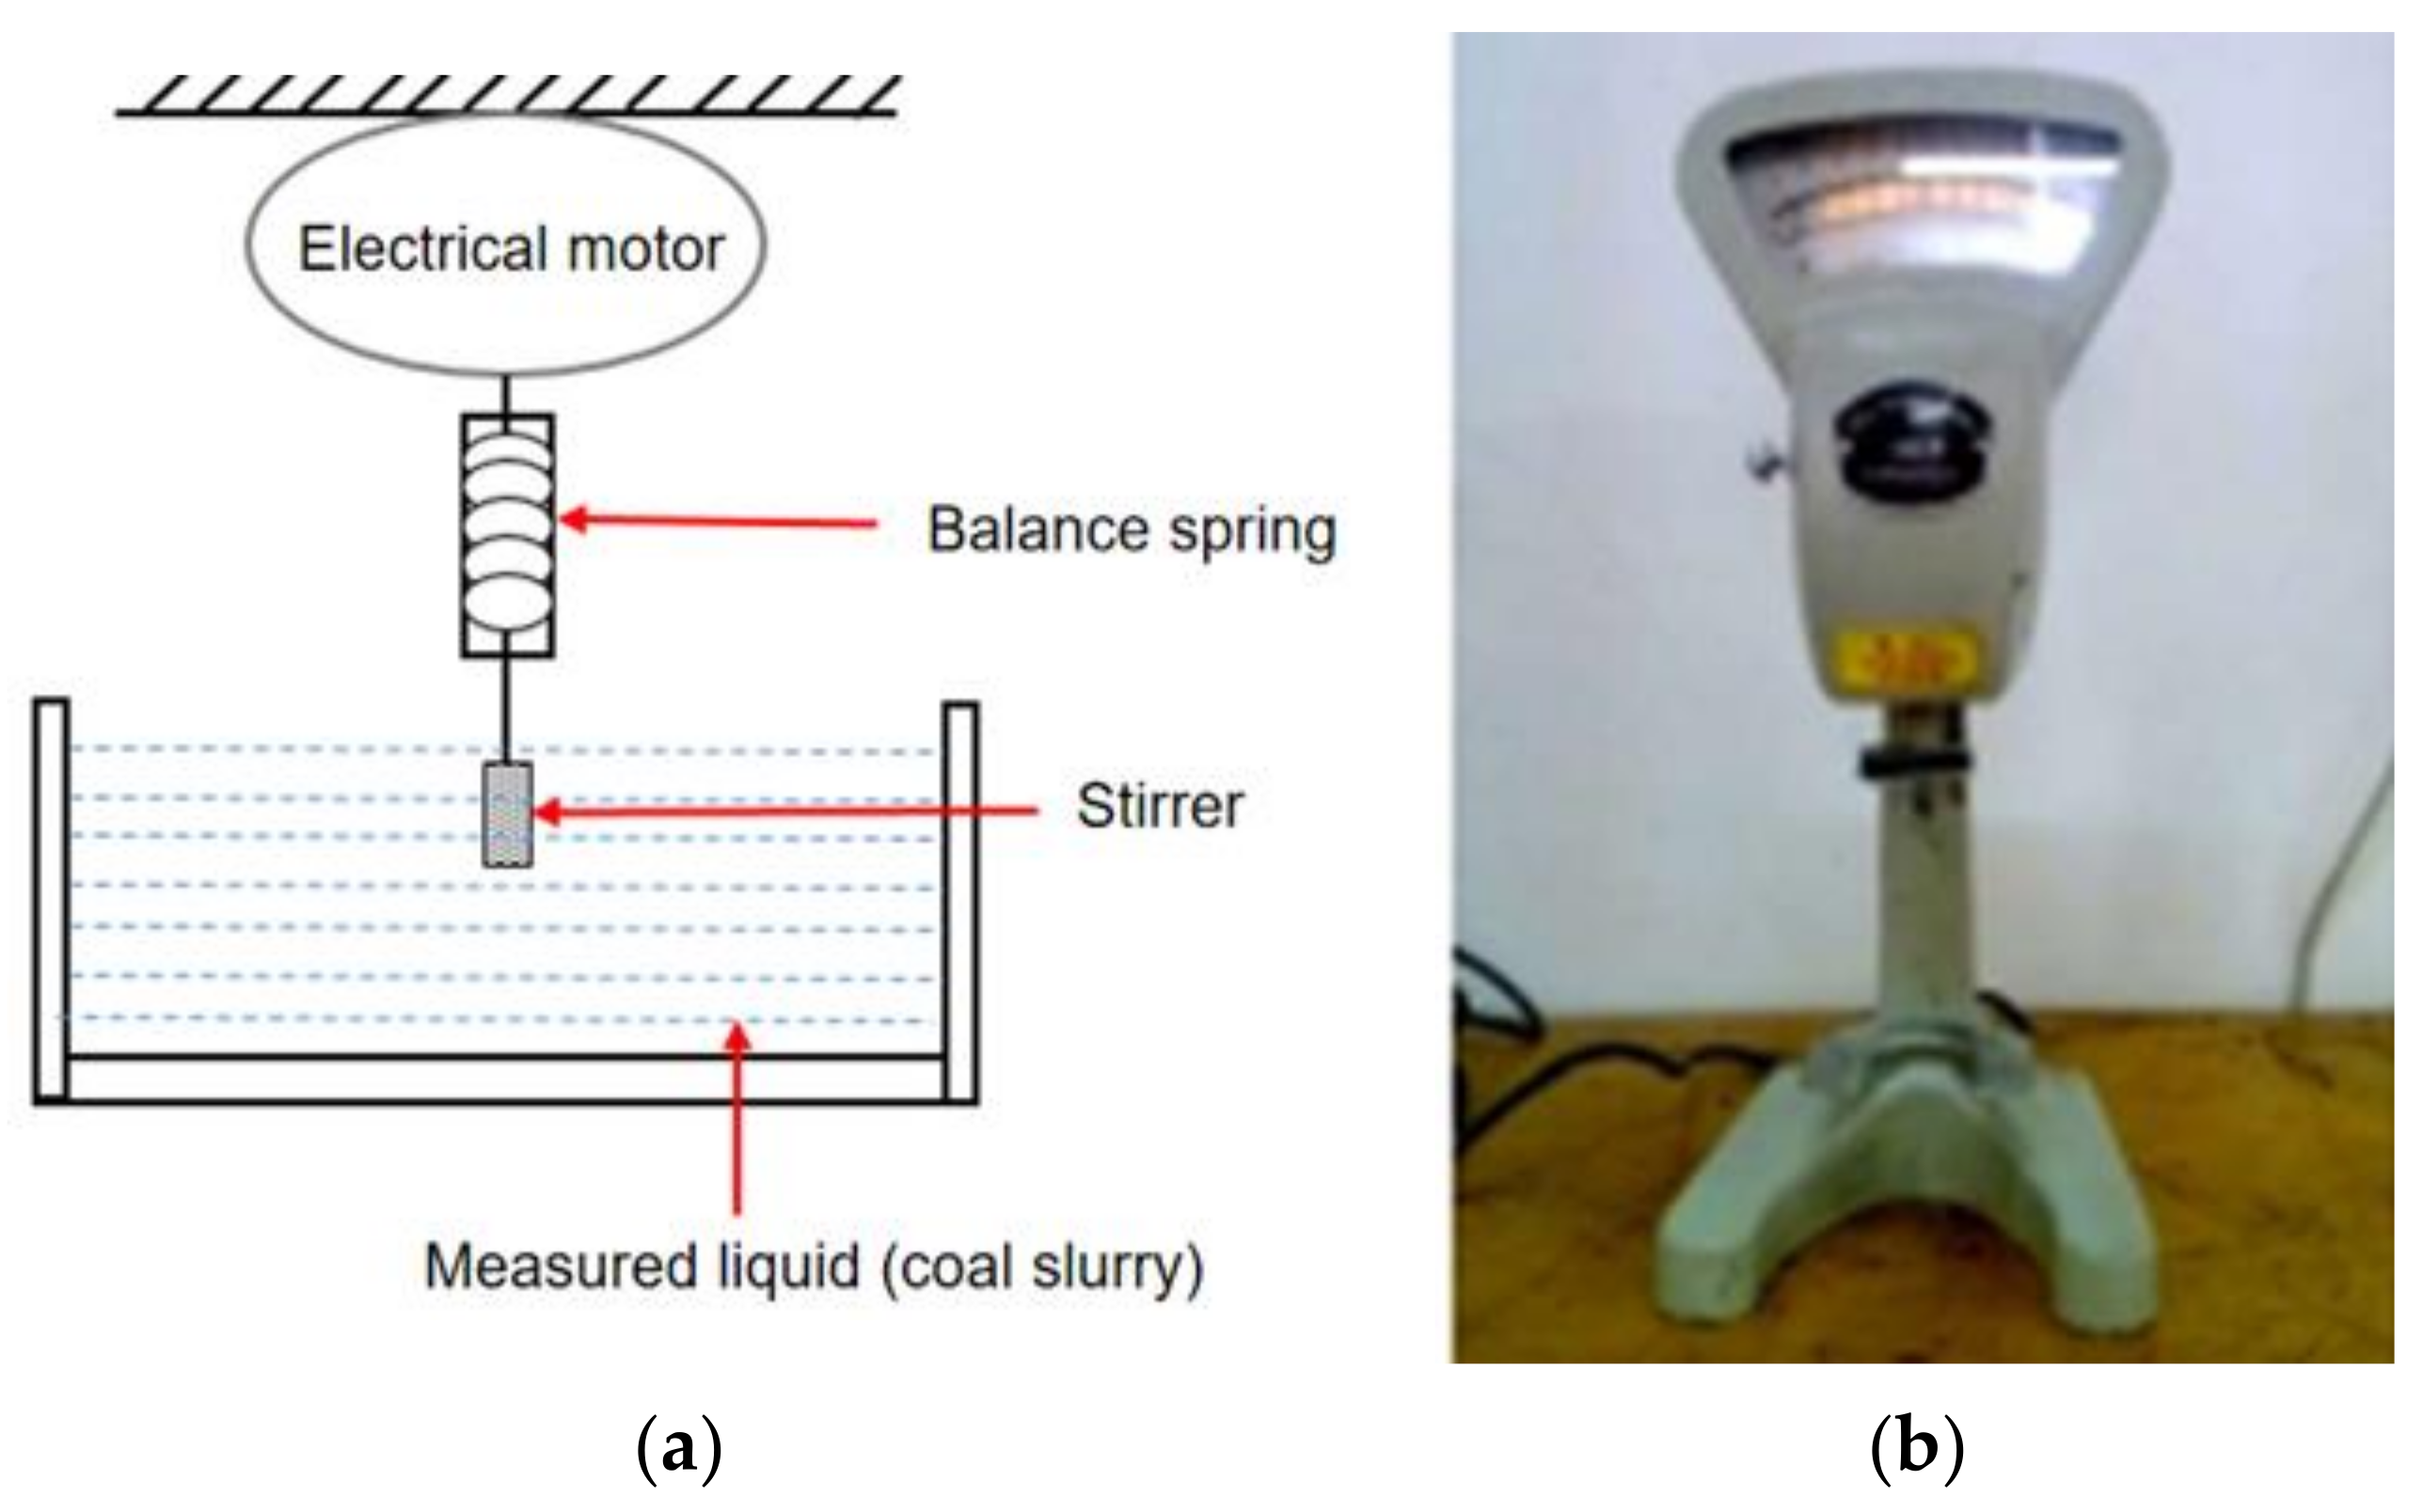
For the slurry viscosity test, the rotation method was adopted. Specifically, a stirrer was placed into the coal slurry and the rotate speed was recorded. Due to the viscous action of the measured liquid, the rotor speed lags behind the initial speed. The relationship between the torque and the viscosity is established. The torque can be measured through the testing rig, so that the viscosity can be calculated. The relationship between the torqued generated by the balance spring and the liquid viscosity can be written as [29,30]:
where is the liquid viscosity, is the height of the stirrer in the liquid, is the diameter of the stirrer, is the diameter of the container of the liquid, is the torque generated by the balance spring due to the rotate, is the angular speed of the stirrer.
Figure 4 shows the schematic diagram of the viscosity test and the photo of the testing rig (NDJ-79 series). This rig can be used for measuring the viscosities of both Newtonian fluids and non-Newtonian fluids. The main purpose of the viscosity testing is to obtain the viscosity, so that we can understand its fluid characteristics, compared with water. The settling pond is built based on this property. The testing procedure is simple and easy to be operated. In this study, four samples of coal slurry collected from the longwall 2-112 were test.
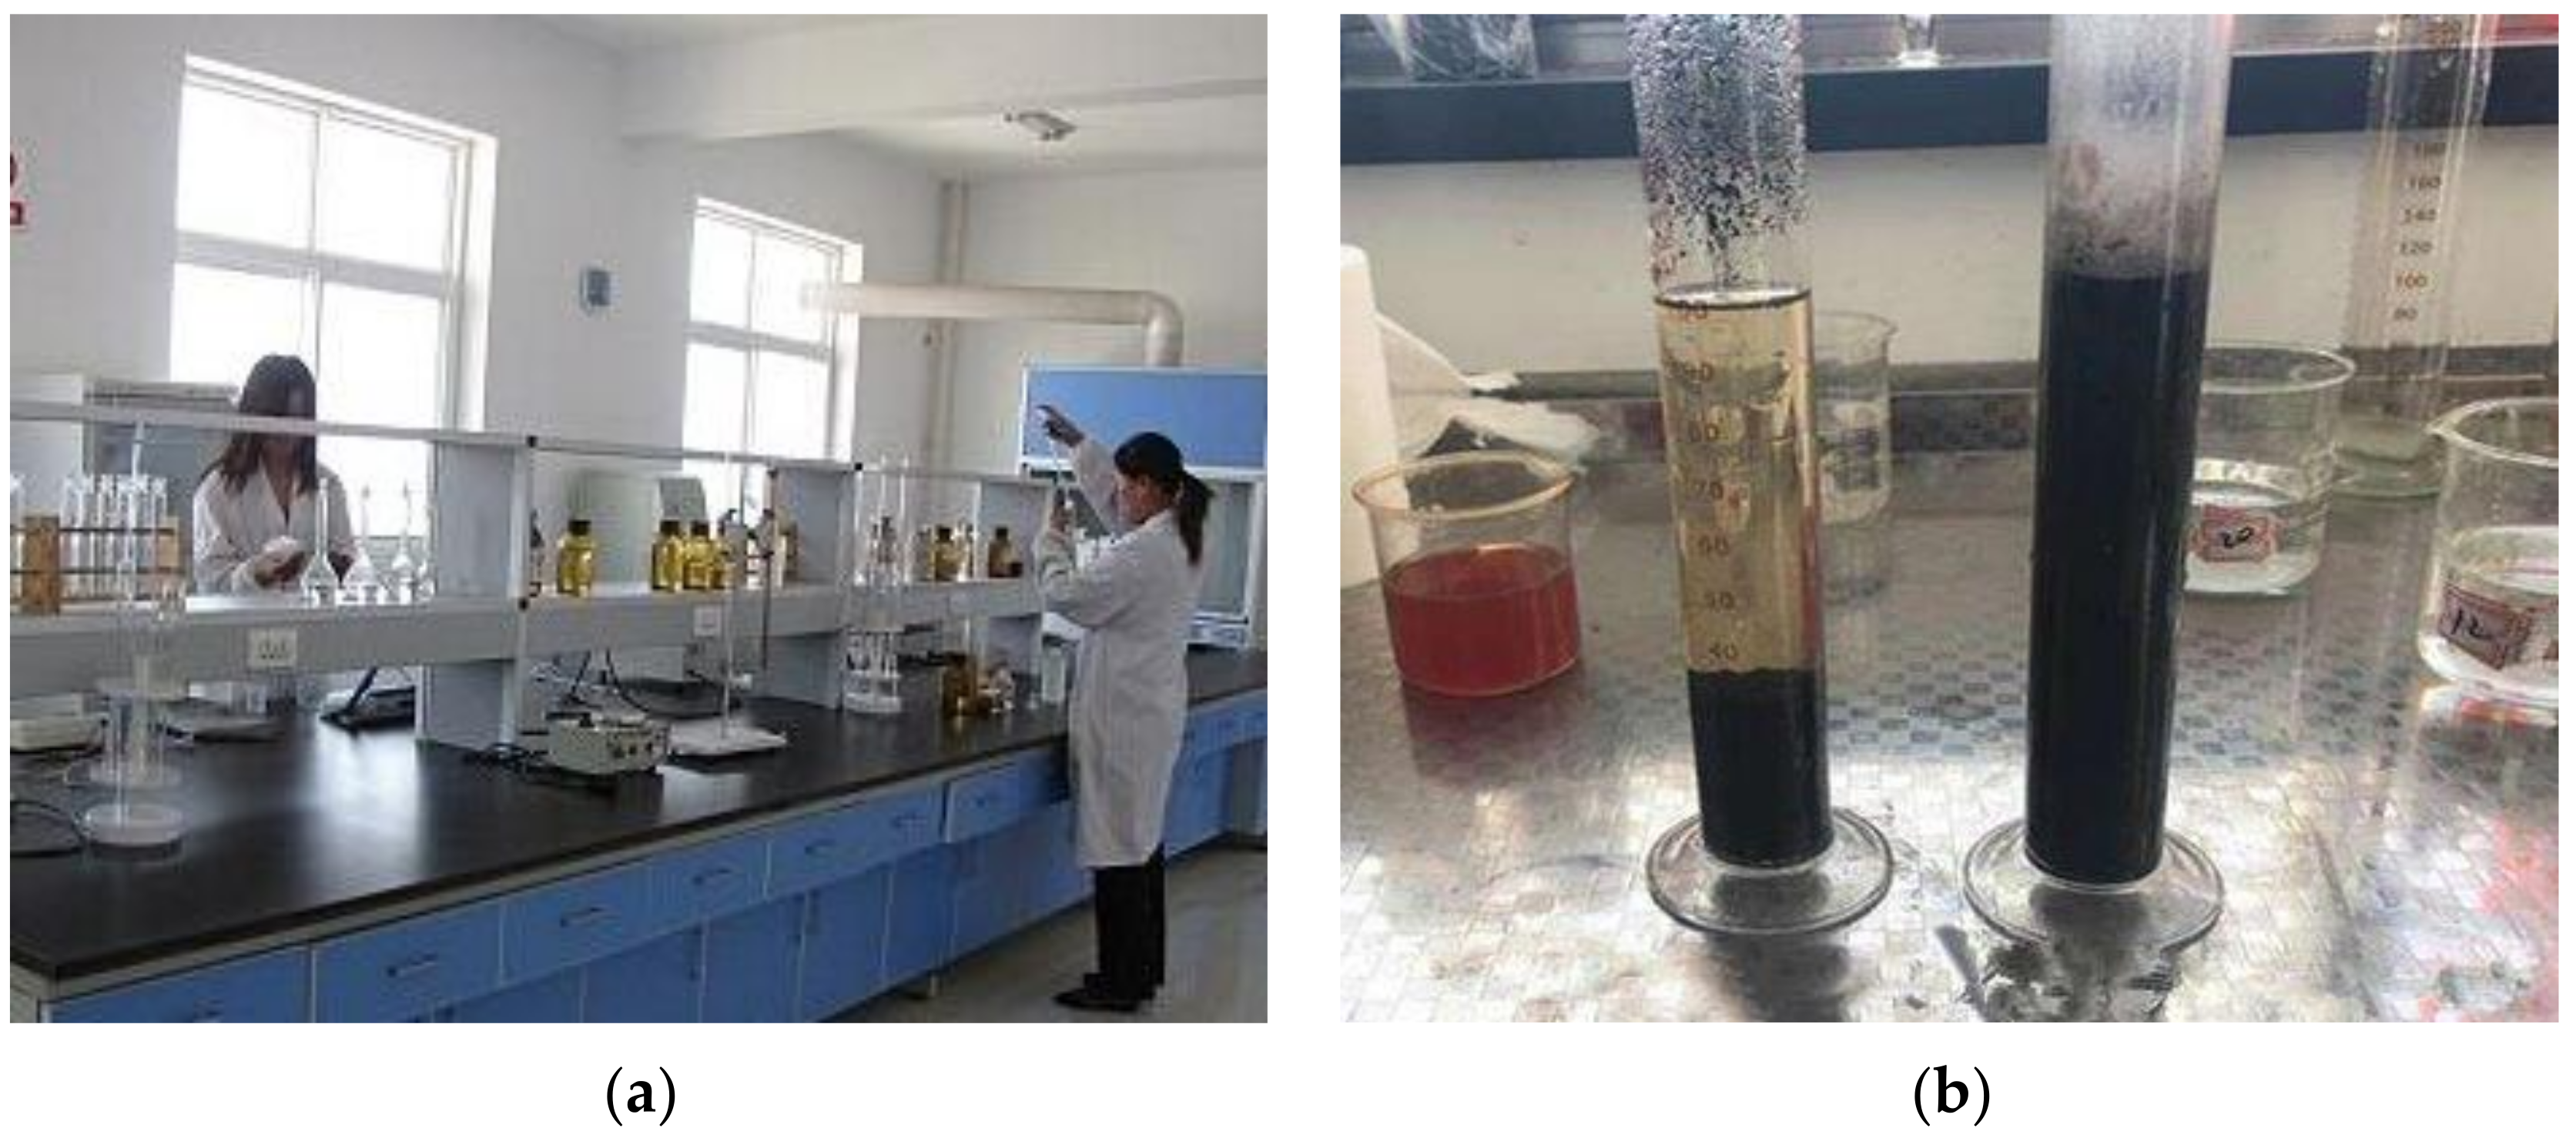
The quality of the coal mine water was also tested in the laboratory, as shown in Figure 5. Ten samples (500 mL for each sample) were collected from the longwall face and the details were carefully recorded (including time, location).
4. Laboratory Testing Results
The laboratory testing results are summarized in this section. The testing results are including particle size distribution, coal slurry element composition and viscosity, and coal mine water quality.
4.1. Particle Size Distribution
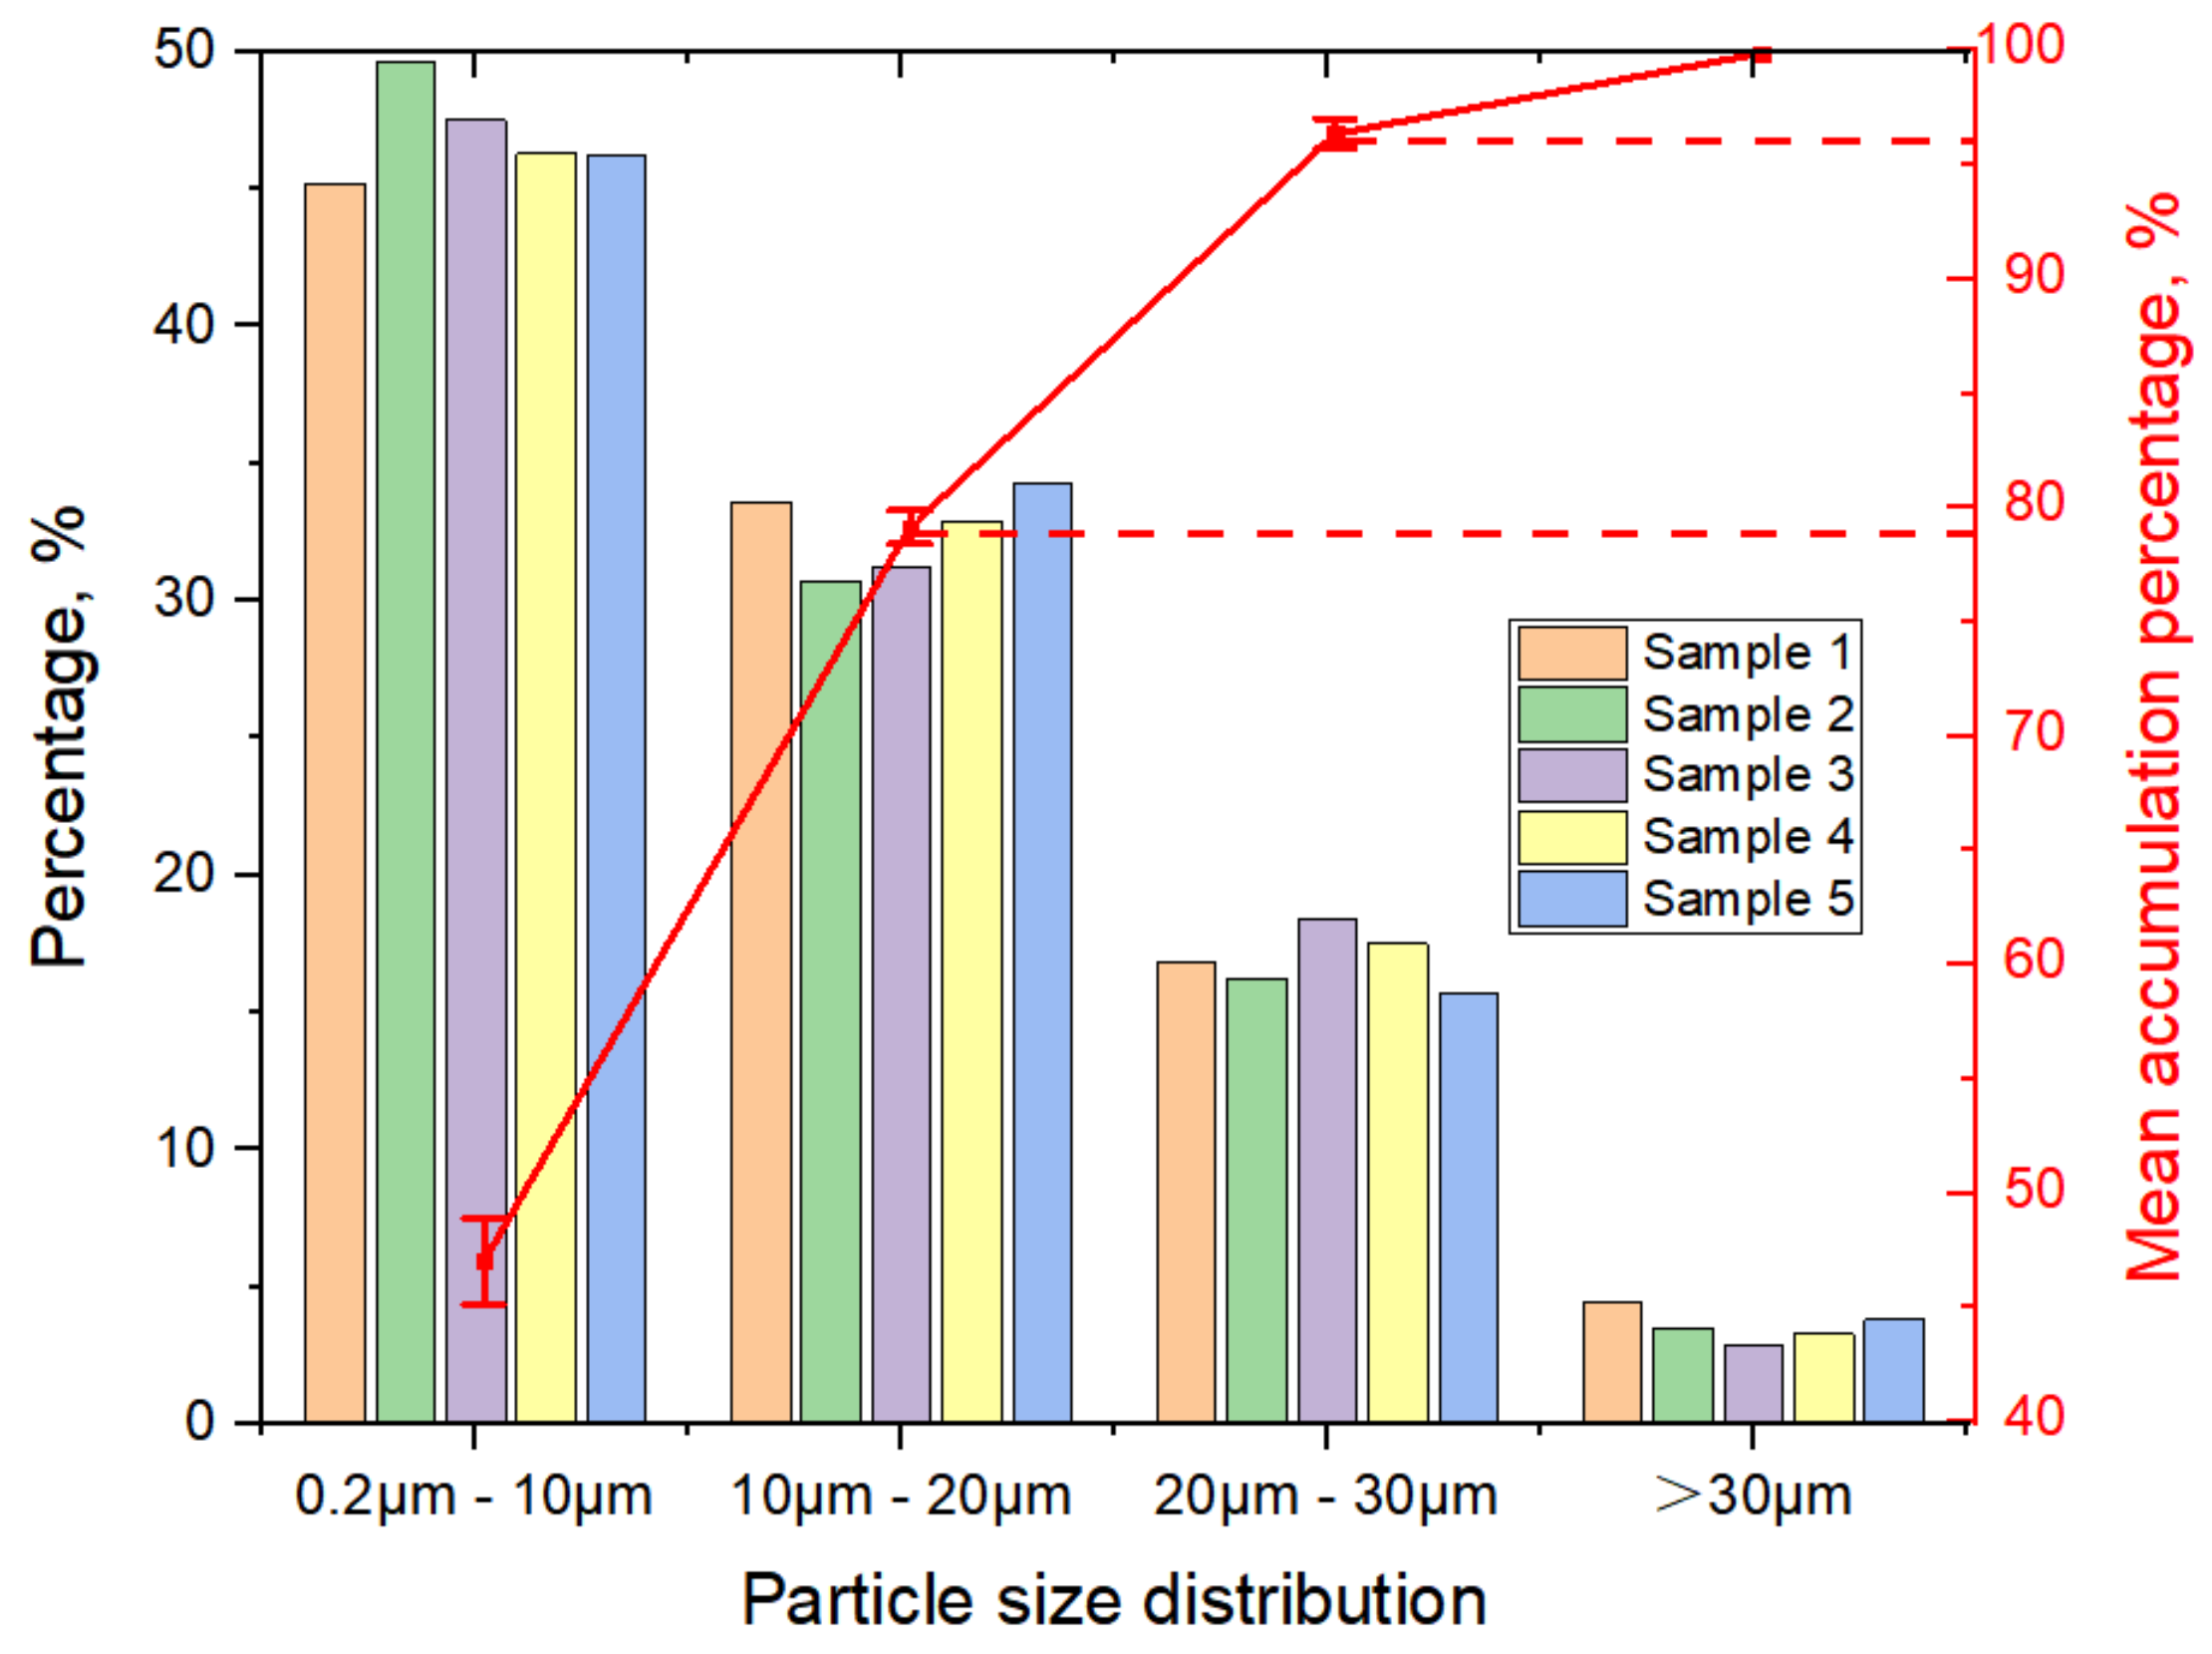
Figure 6 shows the coal powders size distribution. A total of five samples were tested and the particles are divided into four groups: 0.2–10 μm, 10–20 μm, 20–30 μm and >30 μm. It can be seen that more than 40% of the coal powders are smaller than 10 μm. The percentage of >30 μm is less than 5%. From the accumulation perspective, almost 80% of the powders are smaller than 20 μm. It can be concluded that the coal powders are very fine, compared with the coal powders of coal wash plant. Based on the size distribution, the vibrating sieving machine can be selected.
4.2. Coal Slurry Element Compositions and Slurry Viscosity
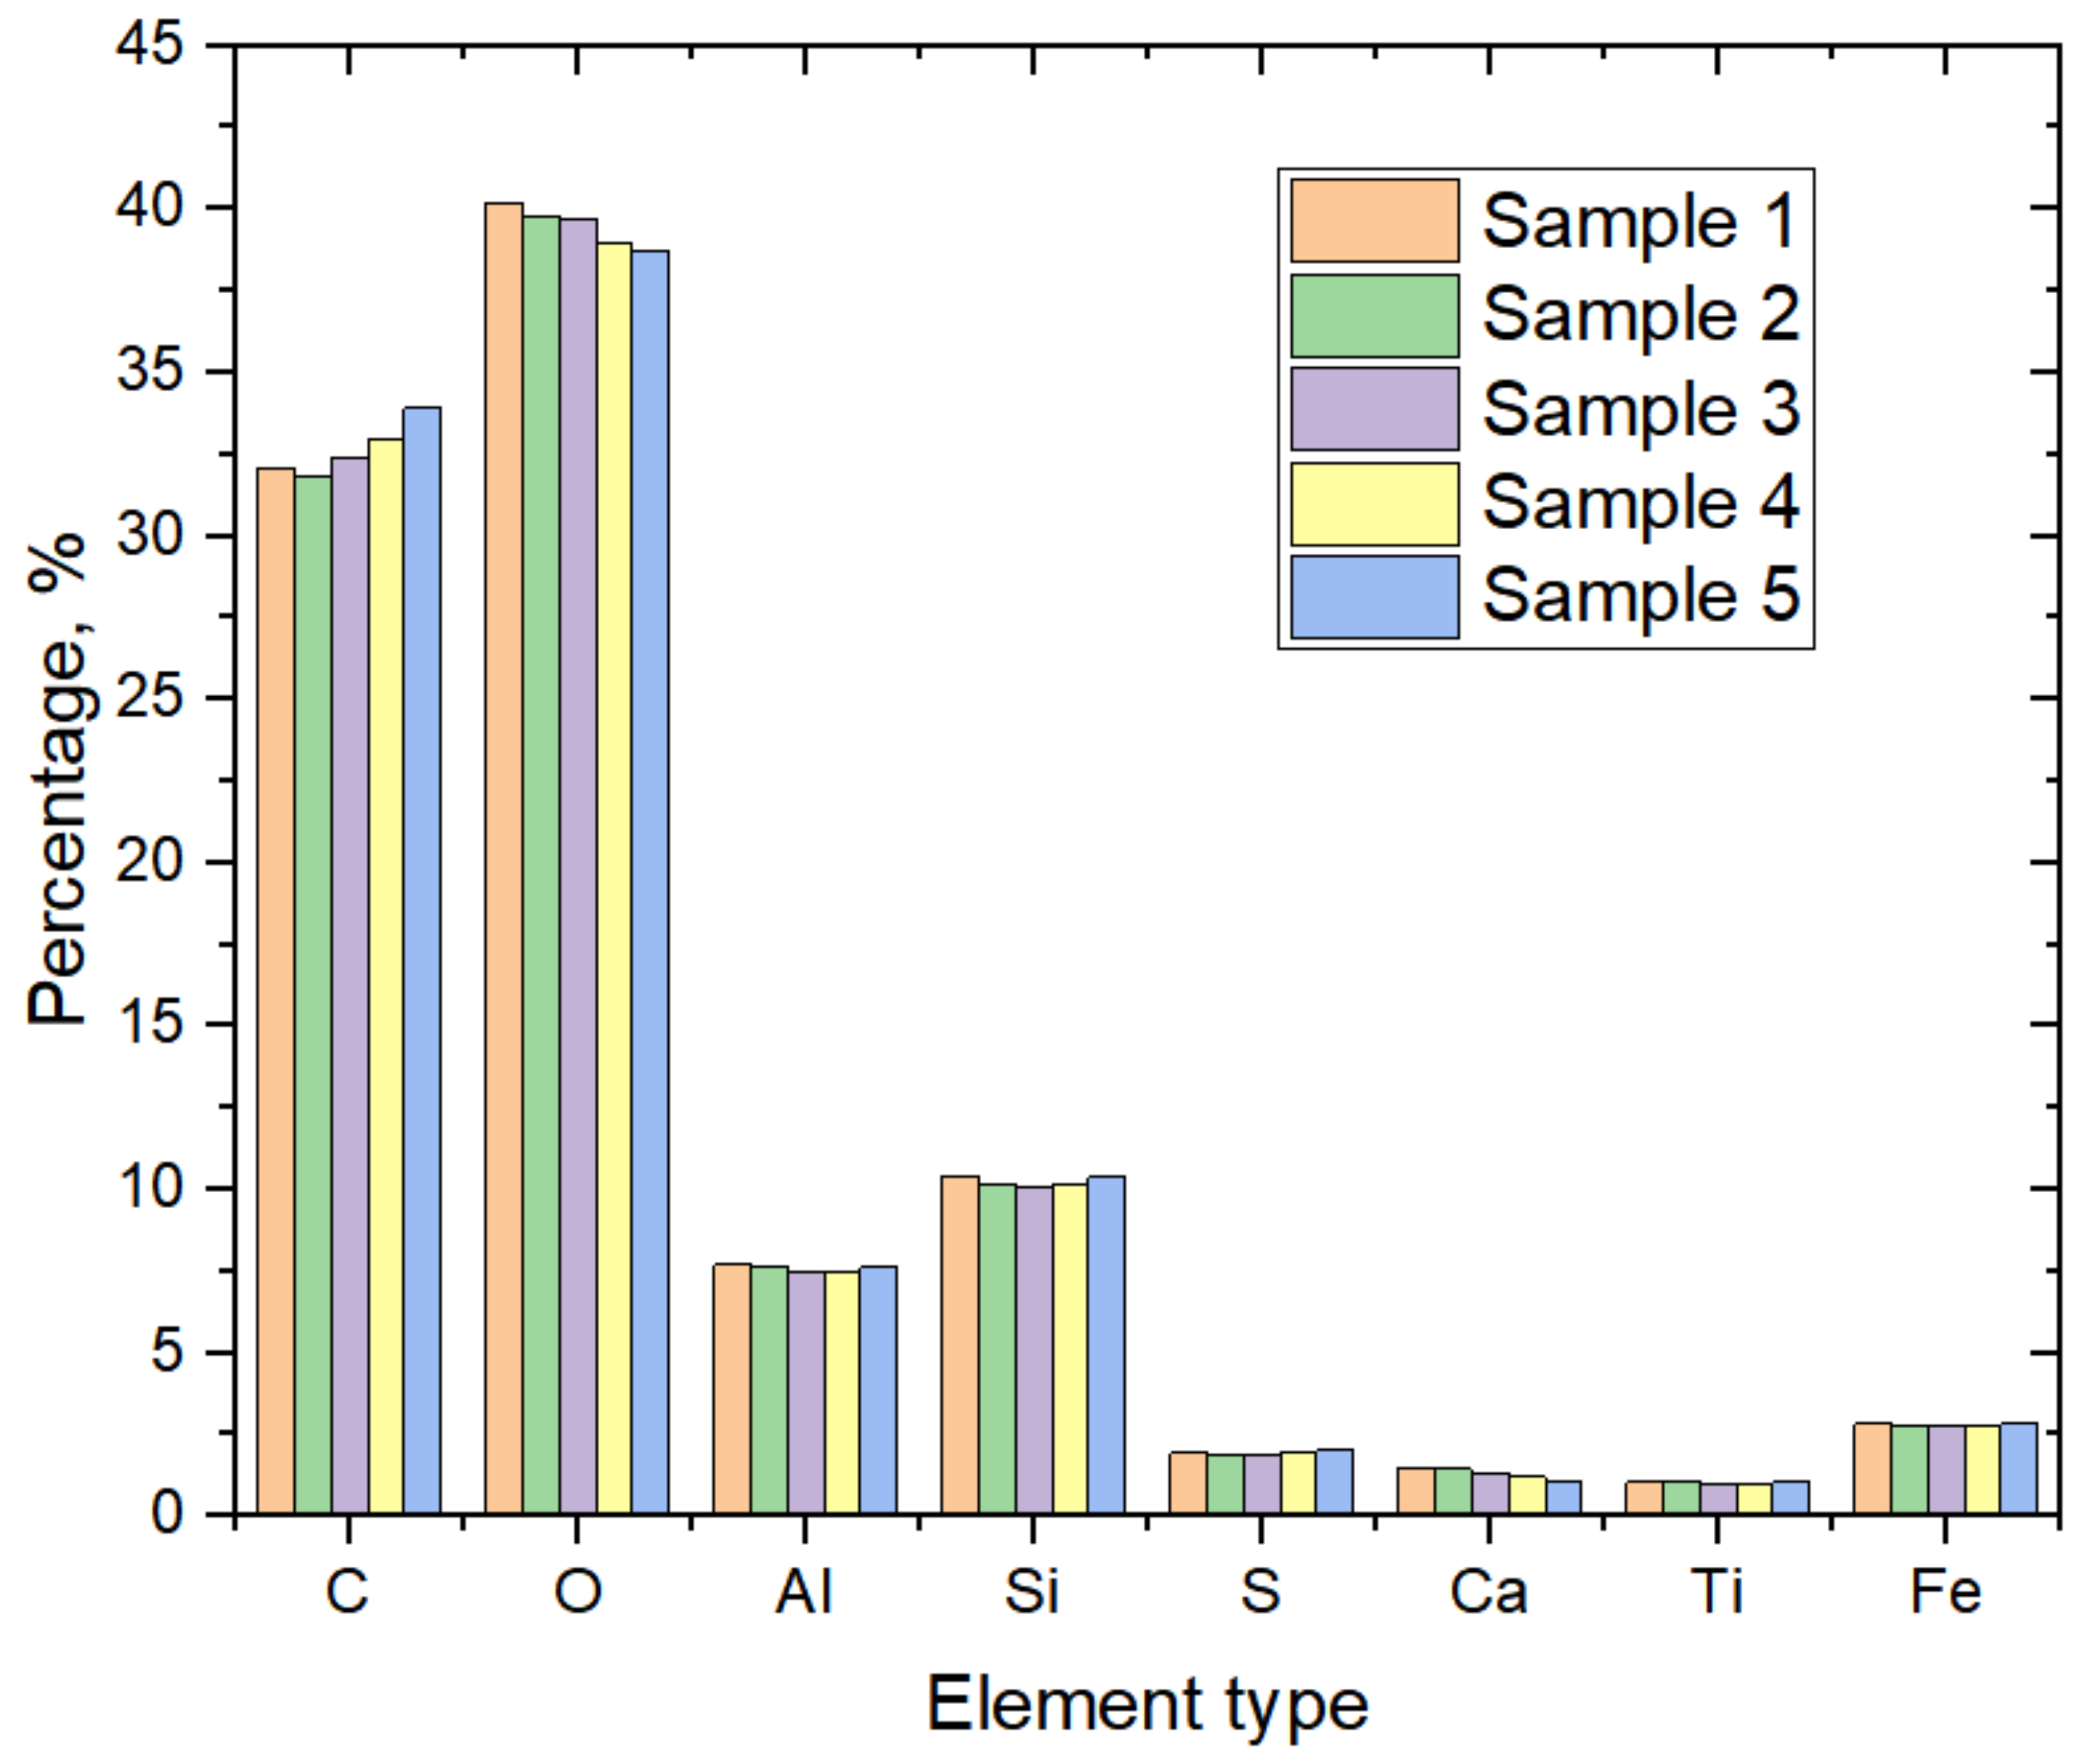
The compositions of coal slurry are complex and various. The element types and mass ratios change significantly. It is essential to understand the element compositions. Figure 7 shows the element types and mass ratios. Besides C and O, the percentages of Al, Si, Fe, S and Ca are relatively high. It can be concluded that the clay materials and inorganic materials are extensively exist in the coal. It can also be predicted that the viscosity of the coal slurry would be high.
Four tests were conducted for the coal slurry viscosity and the results are summarized in Table 1. The mean value is 17.05 cP and it can be concluded that the coal slurry has high viscosity.
4.3. Coal Mine Water Quality
The coal mine water is mainly from the K8, K9 and K10 strata. Many factors affect the water quality, such as the coal mineral composition, water flow channels in the rock and coal seams. Table 2 summaries the pH values, water hardness and the negative ions. From the pH values aspect, it is higher than 7 and is alkaline. It has been pointed out that the coal mine water can be acidic or alkaline [24,31]. For the alkaline coal mine water, the treatment method is different from that of the acid water. From Table 2, it can be seen the hardness values are high and the coal mine water belongs to very hard category.
5. Field Applications and Discussions
The field applications are carried out in the Xinzhi coal mine. Based on the laboratory experiments, a series of detailed procedures are designed. Specifically, it includes the selection of vibrating sieving machine, design of settling pond and chosen of polymer flocculant. Here are the detailed applications.
5.1. Selection of Vibrating Sieving Machine
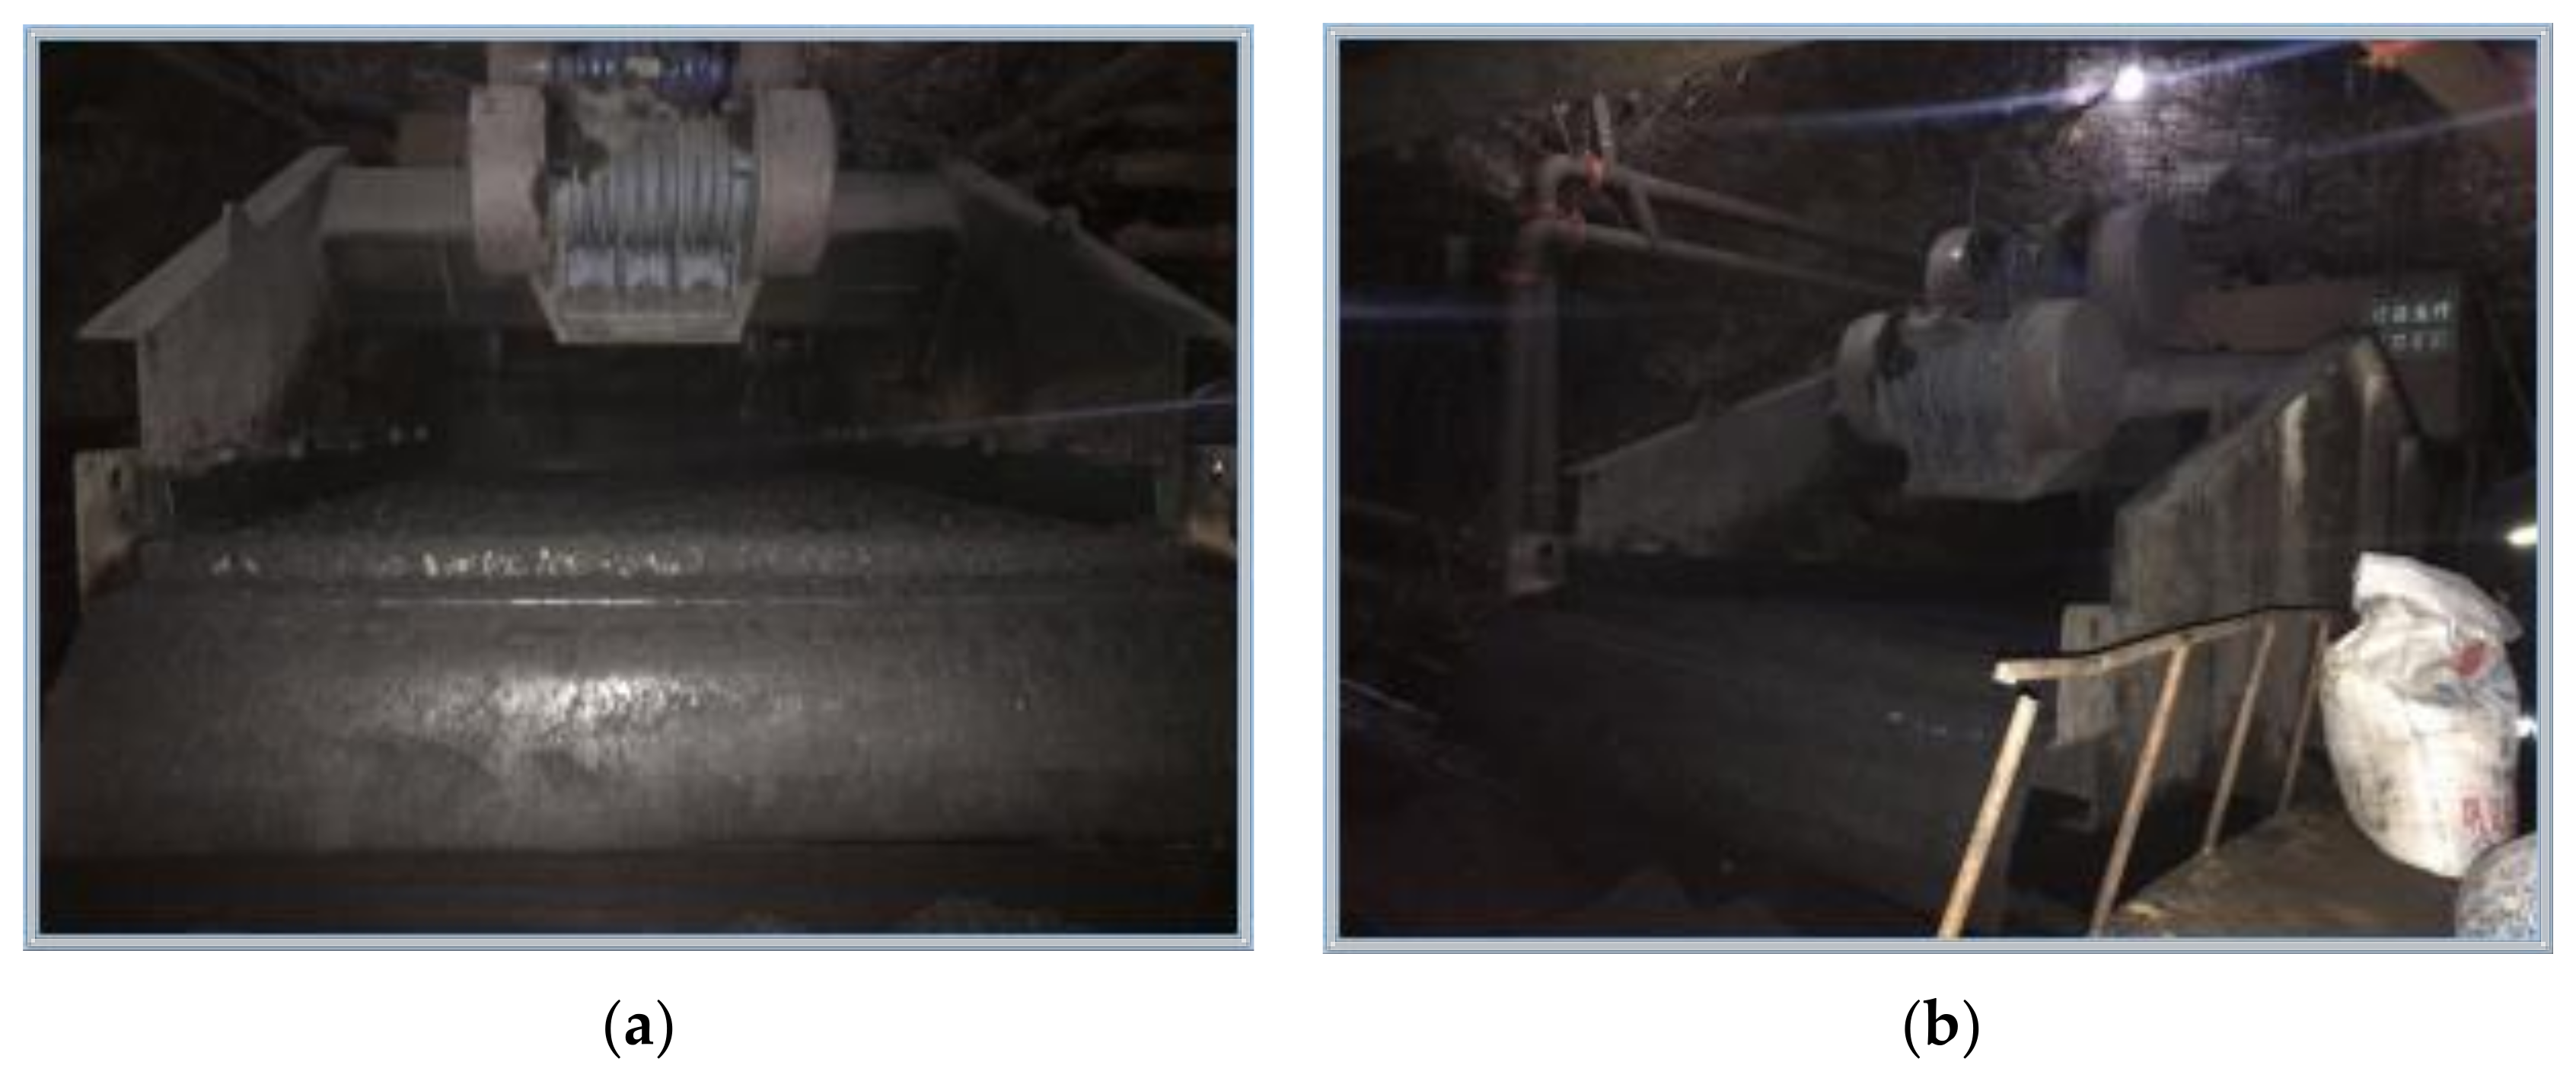
The vibrating sieving machine can be used to select the powders of different sizes. If the vibrating sieving machine is installed tailgate of the longwall panel. The large coal particles can be selected. The solid content in the coal slurry would be decreased. Based on the field observations and the laboratory characterizations of the coal sludge. The GPS1837 series vibrating sieve is chosen for field application. The dimension of this machine is 3891 mm × 2540 mm × 1621 mm (length × width × height), which is suitable to be installed at the tailgate of the longwall panel. The underground mobile boom machine is used to transport the vibrating sieve to the designed location. Figure 8 shows the vibrating sieve in the tailgate of the longwall panel.
In the field trials, the vibrating sieve is adjusted into the medium frequency channel. Then, the coal slurry discharged from the longwall face goes through the vibrating sieve. In this process, the solid and water separation performance is monitored. The frequency of the vibrating is adjusted gradually, to reach the optimum frequency. The water goes into the No. 2 bin through the pipelines. From field observation, the coal slurry process capacity of the vibrating sieve is 2.6 t/h. A total of 47 t of coal sludge is produced. After the vibrating sieve, the large particles in the pipeline and the No. 2 bin are significantly decreased. In the No. 2 water bin, it takes 15 days to fill up the bin with coal sludge. Without the vibrating sieve, it takes 10 days. The vibrating sieve mainly affects on the large size of coal solid. From Figure 5, it can be seen that almost 80% of the total sludge has the powders smaller than 20 µm. The vibrating sieve has minor impacts on this range of coal powders.
5.2. Design of Settling Pond
In order to further process the coal slurry, a new settling pond is built in the tailgate of the longwall panel. The sedimentation of fined coal powders is checked. In this section, the theory of the powders settling
For the calculation, the ideal settling pond was used to analyses the powders moving state. Here are the three assumptions:
- The particles suspended in the coal slurry are in the free precipitation state. The particles do not interfere with each other. No collisions happen between the coal powders. During the precipitation process, the size, shape and the density of the coal powders are constant. The particles sink at a constant rate, which means the vertical speed does not change. The horizontal component of the particle speed is equal to the water flow speed;
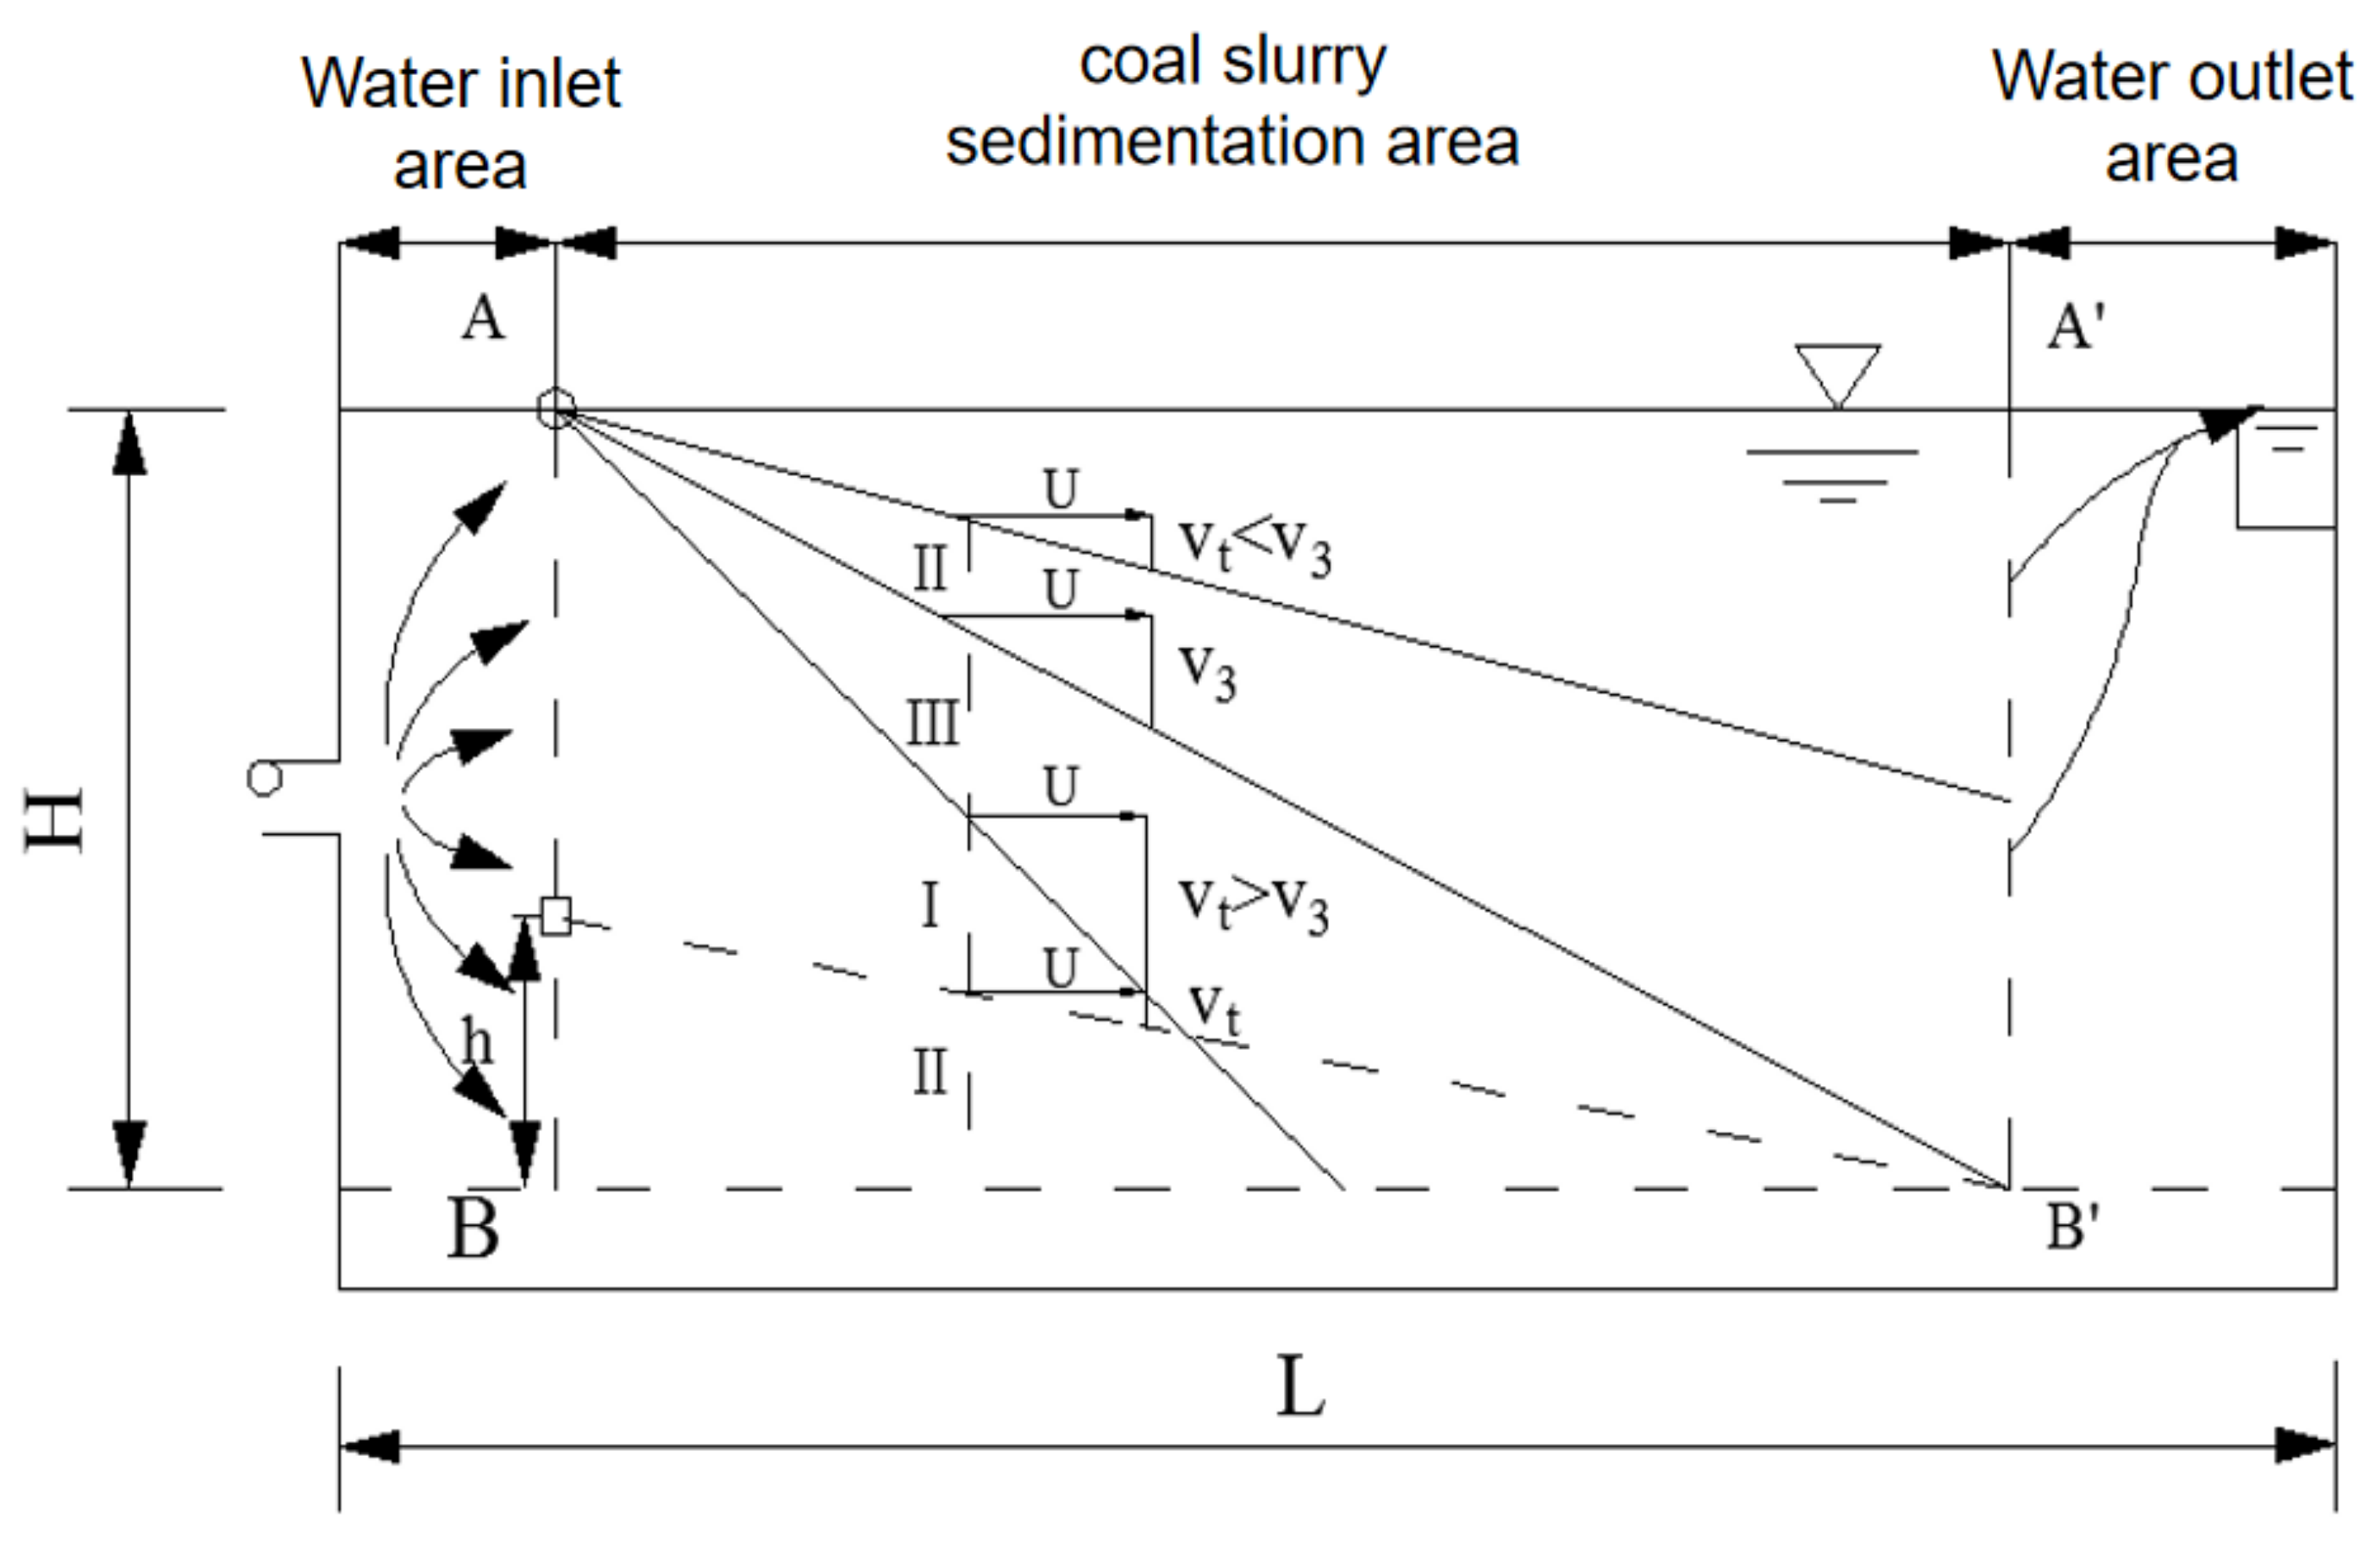
- Water flow is in the horizontal direction. The water is evenly distributed throughout the cross section (AB line, A’B’ line in Figure 9). The water flow rates at the cross-section lines are equal. Between these two lines, the water flow rate is constant all the time;
- The particles sink to the bottom of the pool and it is regarded that these particles are removed from the coal slurry (not return to the stream).
As shown in Figure 9, coal slurry is feed into the settling pond in the water inlet area. The water stream is evenly distributed on the line AB. The water flow rate at point A is the sum of the horizontal velocity U and the vertical velocity V. The Line I represents the particle motion trail. For Line I, before the particle flows out of the sedimentation area, the coal particle has already touched at the bottom of the settling pond, which means the solid particles are sedimented in the settling pond. The Line II represents that the coal particles are not effectively sedimented in the settling pond and they flow out of the sedimentation area. For the critical point, the coal particles move along the Line III. If the vertical velocity is larger than the critical velocity Vs, the coal particle can definitely reach to the bottom of the pond. Otherwise, if the vertical velocity is smaller than the critical velocity Vs, only partial of the coal particles can reach to the bottom of the pond. Here is the calculation of the critical vertical velocity.
where is the water horizontal velocity, is the depth of the settling pond, is the length of the coal slurry sedimentation area, is the width of the settling pond, is the water flow volume through the section face, is the surface area of the settling pond, is the surface loading and its value equals to the critical vertical velocity.
If the mass volume of the coal powders that have the velocity smaller than the critical vertical velocity () is , the mass volume that can be removed in the sedimentation area is . For the vertical velocity range , the integral is . The total mass ratio that can be removed in the settling pond is:
where is the percentage of the mass volume, is the mass ratio of the coal powders that have smaller vertical velocity than the critical velocity. From Equation (3), it can be seen that the solid removal ratio is controlled by two parameters: and . The mass ratio percentage is inherent of the coal powders. The can be designed to improve the performance. The smaller , the better performance is. So, we can decrease the water flow volume , or increase the surface area to improve the performance. If the water flow volume is too small, the coal production in the working face would be affected. The should be balanced for the design of the settling pond. Based on the field conditions, there are several parameters which should be carefully considered. The concertation of the solid suspension at the outlet area should be smaller than 10 mg/L. The slurry process time in the settling pond should between 1–3 h. Extra time should be given for low temperature water or high concentration slurry. The horizontal water flow velocity should be less than 3 mm/s for normal sedimentation scenario. The effective depth of the settling pond should be in the range of 3–3.5 m. The ratio of length to depth should be over 10 and the ratio of length to width should be over 4. Based on the analysis and field design requirements, the size of the settling pond is 50 × 4 × 1.5 (length by width by depth). The performance of the settling pond is monitored. In the No. 2 water bin, the production rate of coal sludge is significantly decreased. It takes 30 days to fill up the bin with the coal sludge.
5.3. Chosen of Polymer Flocculant
The polymer flocculant can be adsorbed on the surface of the coal solid powders because of the polar function groups structure. The adsorb forces between the coal powders and the polymer flocculant are mainly three categories: electrostatic bonding force, hydrogen bonding force and covalent bonding force [32,33]. Electrostatic bonding is the main bonding between the polymer flocculant and the opposite particles. Hydrogen bonding is the main bonding between the non-ionic polymers and the coal particles. The distribution of electron of the polymer is close to that of the highly electronegative oxygen atom. The polymer loses the electrons and these electrons form amino bonding with the oxygen atom. These chemical bonding makes the polymers tightly attached with the coal particles, so that the polymer flocculant have better selectivity.
The synthetized organic polymer flocculants can be divided into three categories: anionic flocculant (APAM), cationic flocculant (CAPAM) and non-ionic flocculant (NPAM), according to the types of functional groups and the charge properties of the functional groups after dissociation in water.
From laboratory testing, we know that the coal slurry contains C, O, Al, Si, Ca, Ti, Fe and S. It is also alkaline environment. The anionic flocculant is more suitable than the others. In this study, the mixtures of polyacrylamide and white polyaluminum chloride are used as the flocculant. Polyacrylamide is a water-soluble polymer initiated by free radical polymerization of acrylamide monomer and it is widely used as the polymer flocculant. It contains different function groups: anionic function groups (-COOH, -SO3H, -NHR) and cationic function groups (-NHR2, -N+R3, CONH2). The white polyaluminum chloride is a kind of inorganic polymer flocculant.
In this section, the performances of acid-base environment, molecular mass of the polymer flocculant and dosage of the polymer flocculant are investigated to find out the optimal choice for field application.
5.3.1. Impacts of Acid-Base Environment
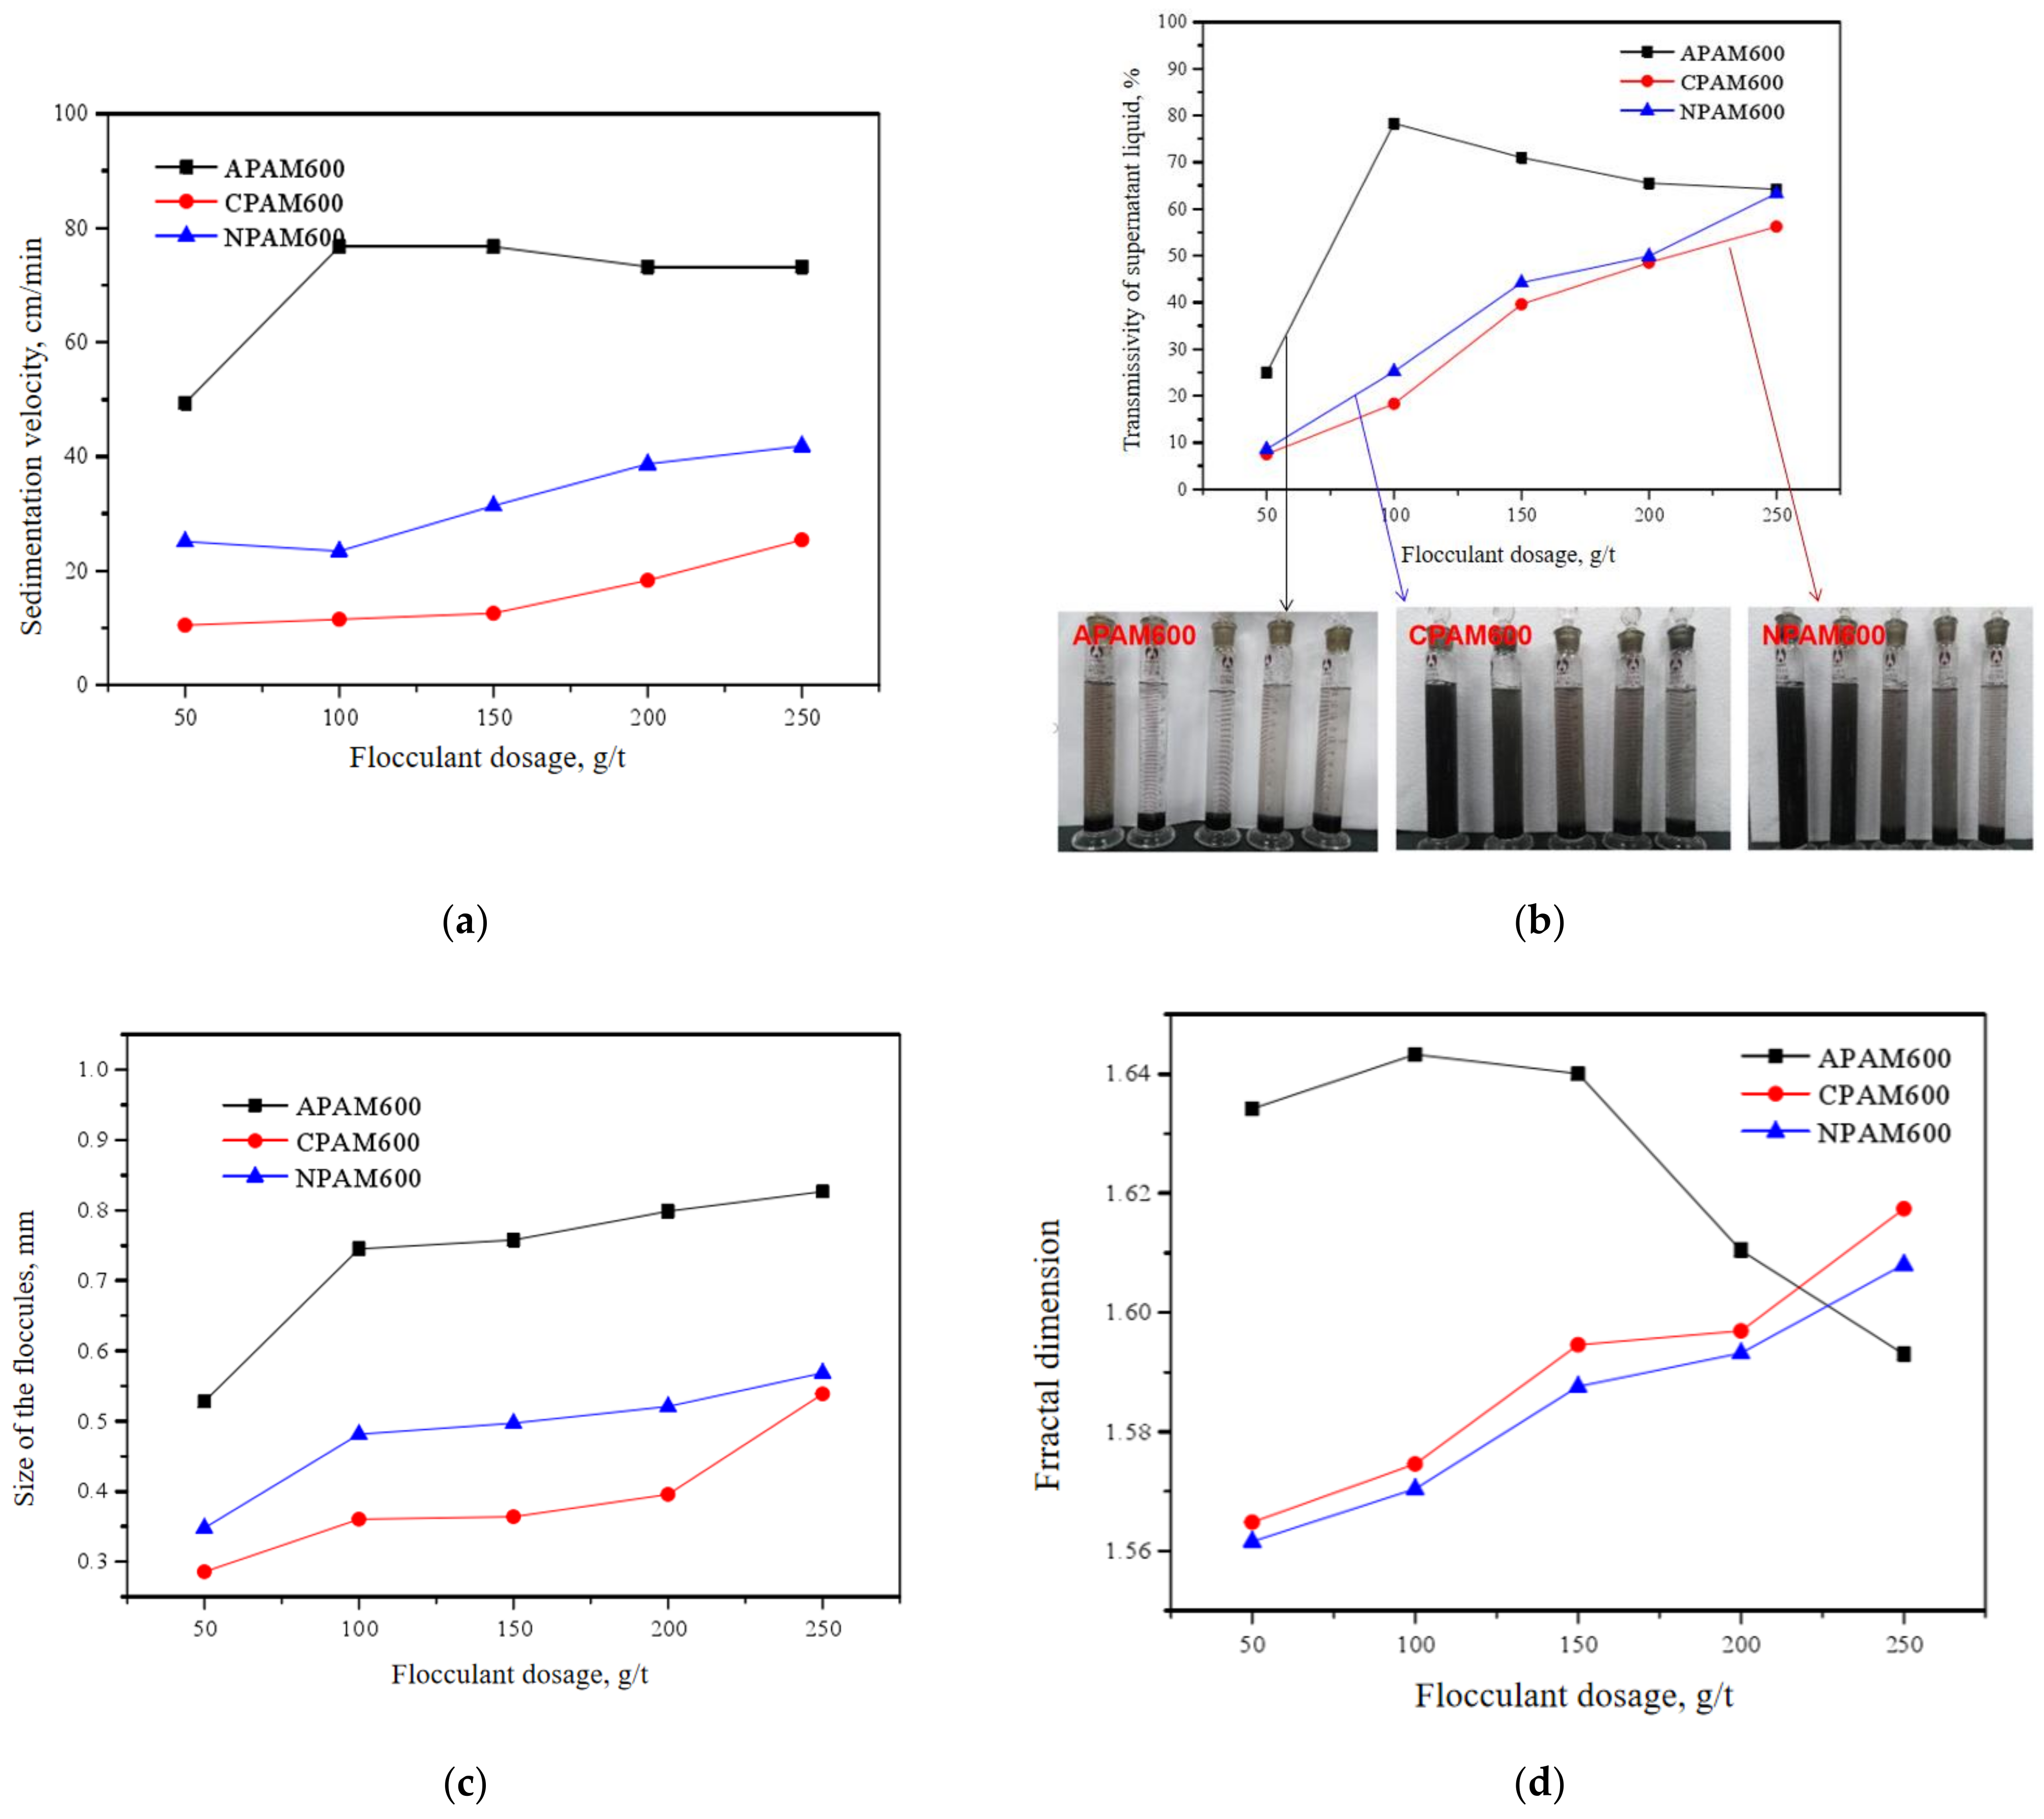
The molecular weight of the polymer flocculant is chosen as six million and different types of flocculant is used: anionic polyacrylamide (APAM600), cationic polyacrylamide (CPAM600) and non-ionic polyacrylamide (NPAN600). In order to make the coal slurry, the coal powder’s size is smaller than 0.074 mm. The concentration of the solid materials is 20 g/mL. The performance of these three different types are compared, with respect to the flocculant dosage. The unit of the flocculant dosage is g/t (flocculant mass/solid coal powder mass). Figure 10a shows the testing results of these three flocculants.
The sedimentation performance of the flocculants is represented from sedimentation velocity and transmissivity of supernatant liquid aspects, as shown in Figure 10b. From the sedimentation velocity aspect, the maximum sedimentation velocity is 76.74 cm/min, for the APAM600 test, and the flocculant dosage is 100 g/t. A sharp increase is observed when the dosage increases from 50 to 100 g/t. After that the line is flat. For the CPAM600 test and the NPAM600 test, there is a gentle increase with the increase of flocculant dosage. The overall performance is better for APAM600 test. The transmissivity of the supernatant liquid can be used to evaluate the total removal of the solid powders. The higher of the transmissivity of the supernatant liquid, the more solid powders are removed from the liquid. The highest transmissivity of the supernatant liquid is 80%, for the APAM600 test, dosage of 100 g/t. That means the liquid is exactly neutralized by the acid flocculant when the dosage of the APAM600 is 100 g/t. With the increase of the flocculant, the liquid may change from alkaline to acid. However, for the CPAM600 test and the NPAM600 test, the transmissivity of the supernatant liquid increases with the increase of the dosage, and it is not economic for these two tests compared with the APAM600 test.
From the size of the floccule aspect, as shown in Figure 10c, the APAM600 has the largest size of the floccule, ranging from 0.5 to 0.8 mm, when the dosage increases from 50 to 250 g/t. The total trends are similar to that of the sedimentation velocity. Fractural dimension is one index to evaluate the compaction of the floccule. The floccules would be attached with each other. More floccules are attached with each other, the higher value of the fractural dimension is. That means the performance of the flocculant is good. From Figure 10d, it can be seen that the highest fractural dimension is 1.65 when the flocculant is APAM600 and the dosage is 100 g/t.
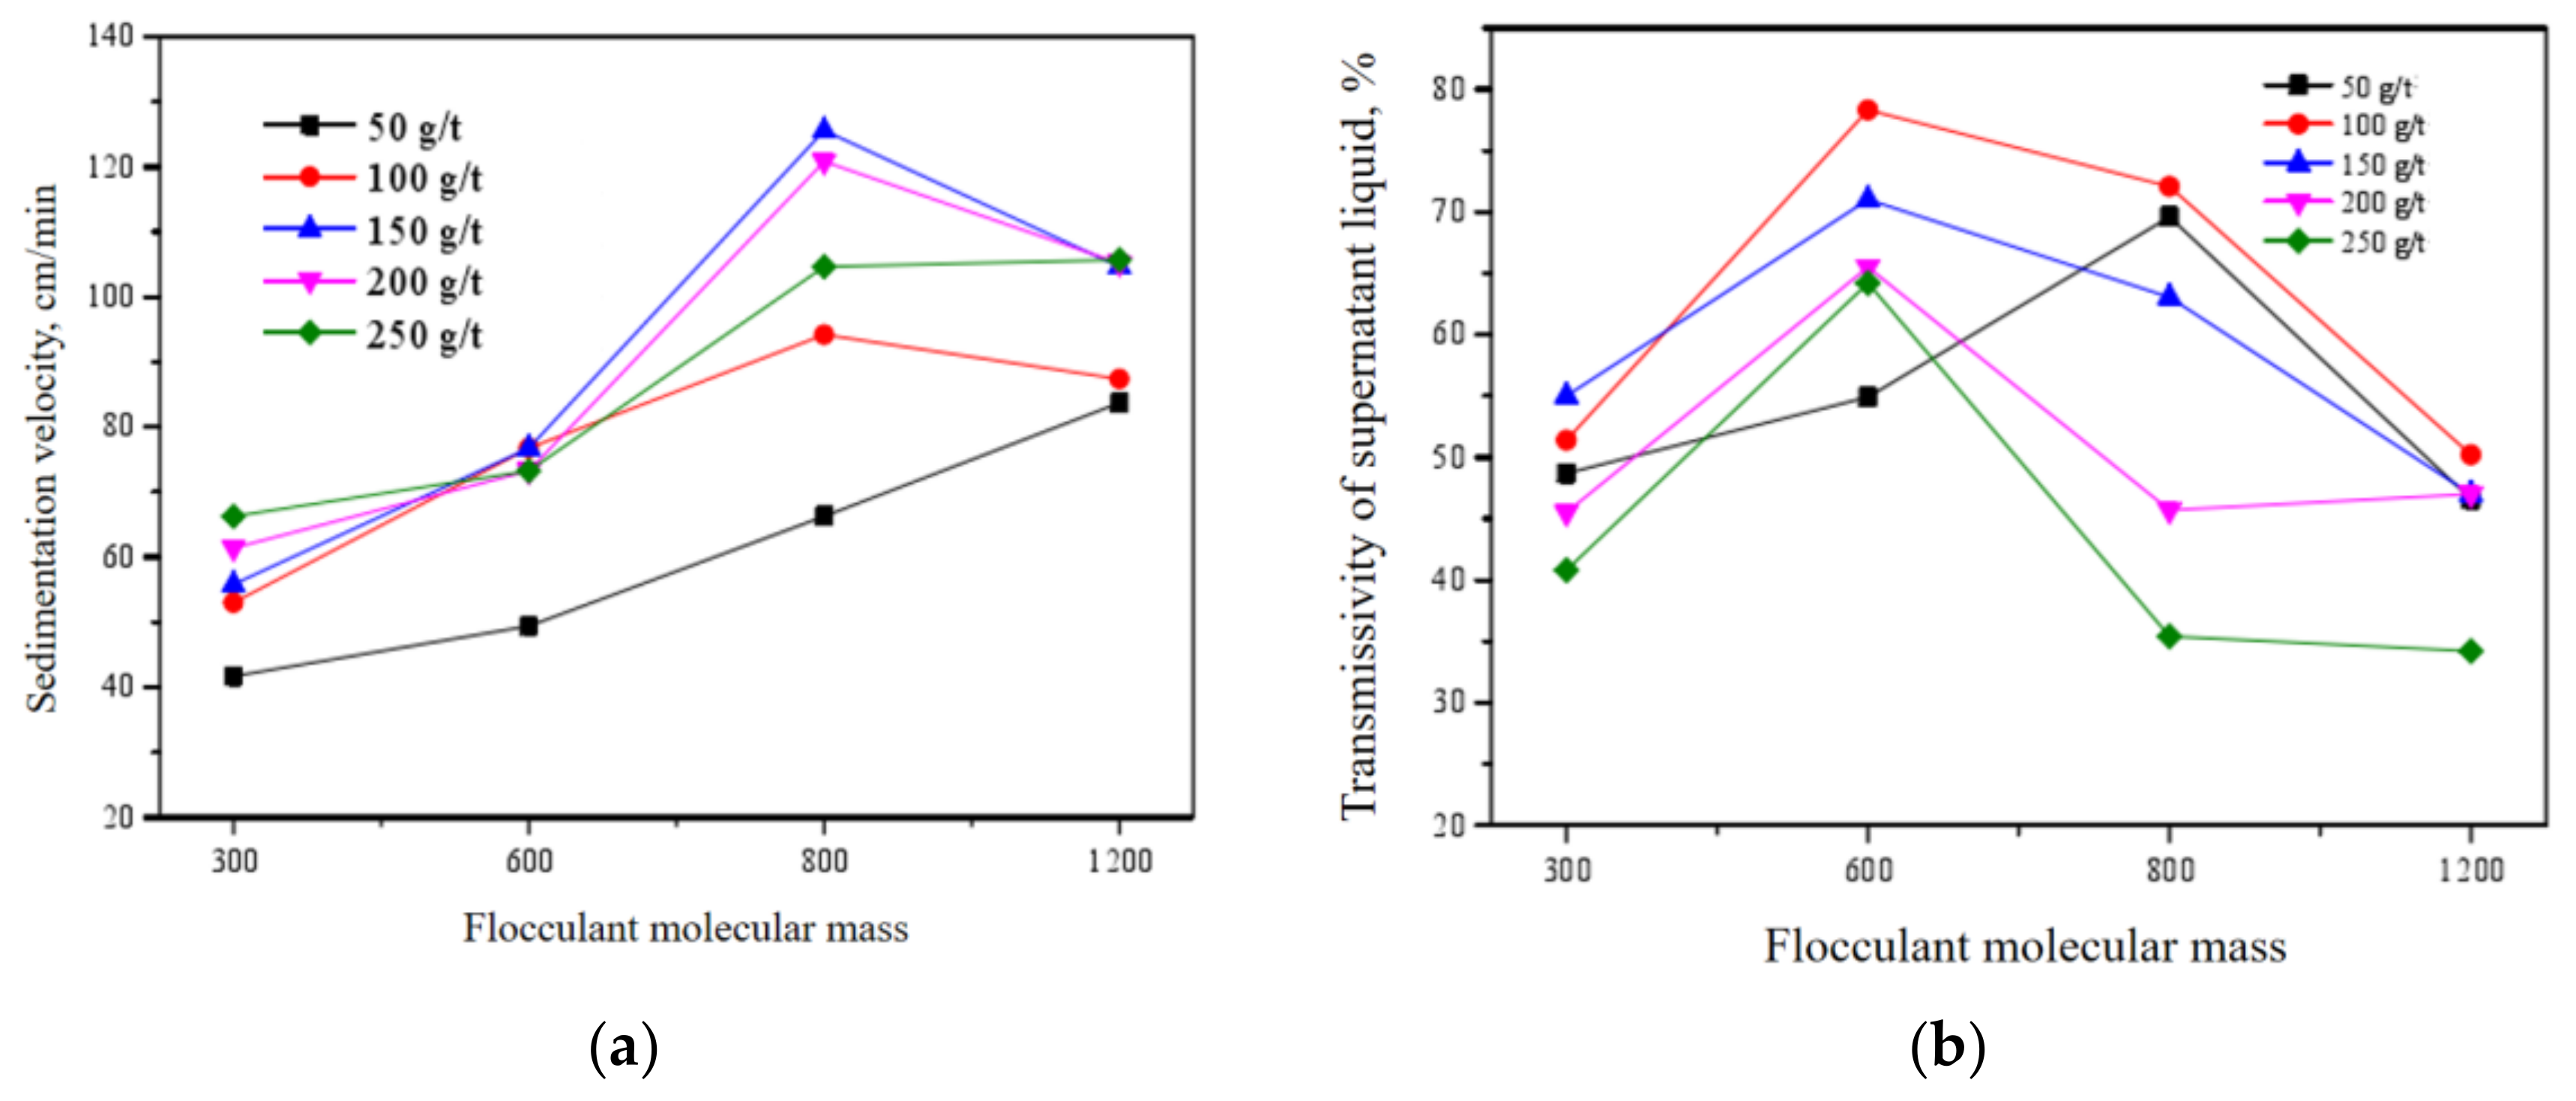
5.3.2. Impacts of Molecular Mass of the Polymer Flocculant
In Figure 11, different flocculant dosages were tested, from 50 to 250 g/t. With the increase of the flocculant molecular mass, both of the sedimentation velocity and the transmissivity of supernatant liquid show increase trend first, reaching the maximum value, and then show decrease trend. When the flocculant molecular mass is larger than the critical value, the flocculant is not easy to be fully dissolved into the coal slurry. The flocculant is over thickness, so that the flocculation is not fully reacted between the flocculant and the coal powders. From the testing results, the molecular mass of 8 million has the highest sedimentation velocity, except for the 50 g/t testing. The molecular mass of 6 million has the highest transmissivity, except for the 50 g/t testing.
5.3.3. Impacts of Flocculant Dosage
During the process of coal slurry, the flocculant dosage has an obvious impact on the sedimentation results. With the increase of the flocculant dosage, the reactions between flocculant molecules and the solid powders increases. If the flocculant dosage over than the critical dosage, the excess molecules would hinder the reactions. The critical dosage can be obtained through the testing. In this section, the same coal slurry was used for the testing.
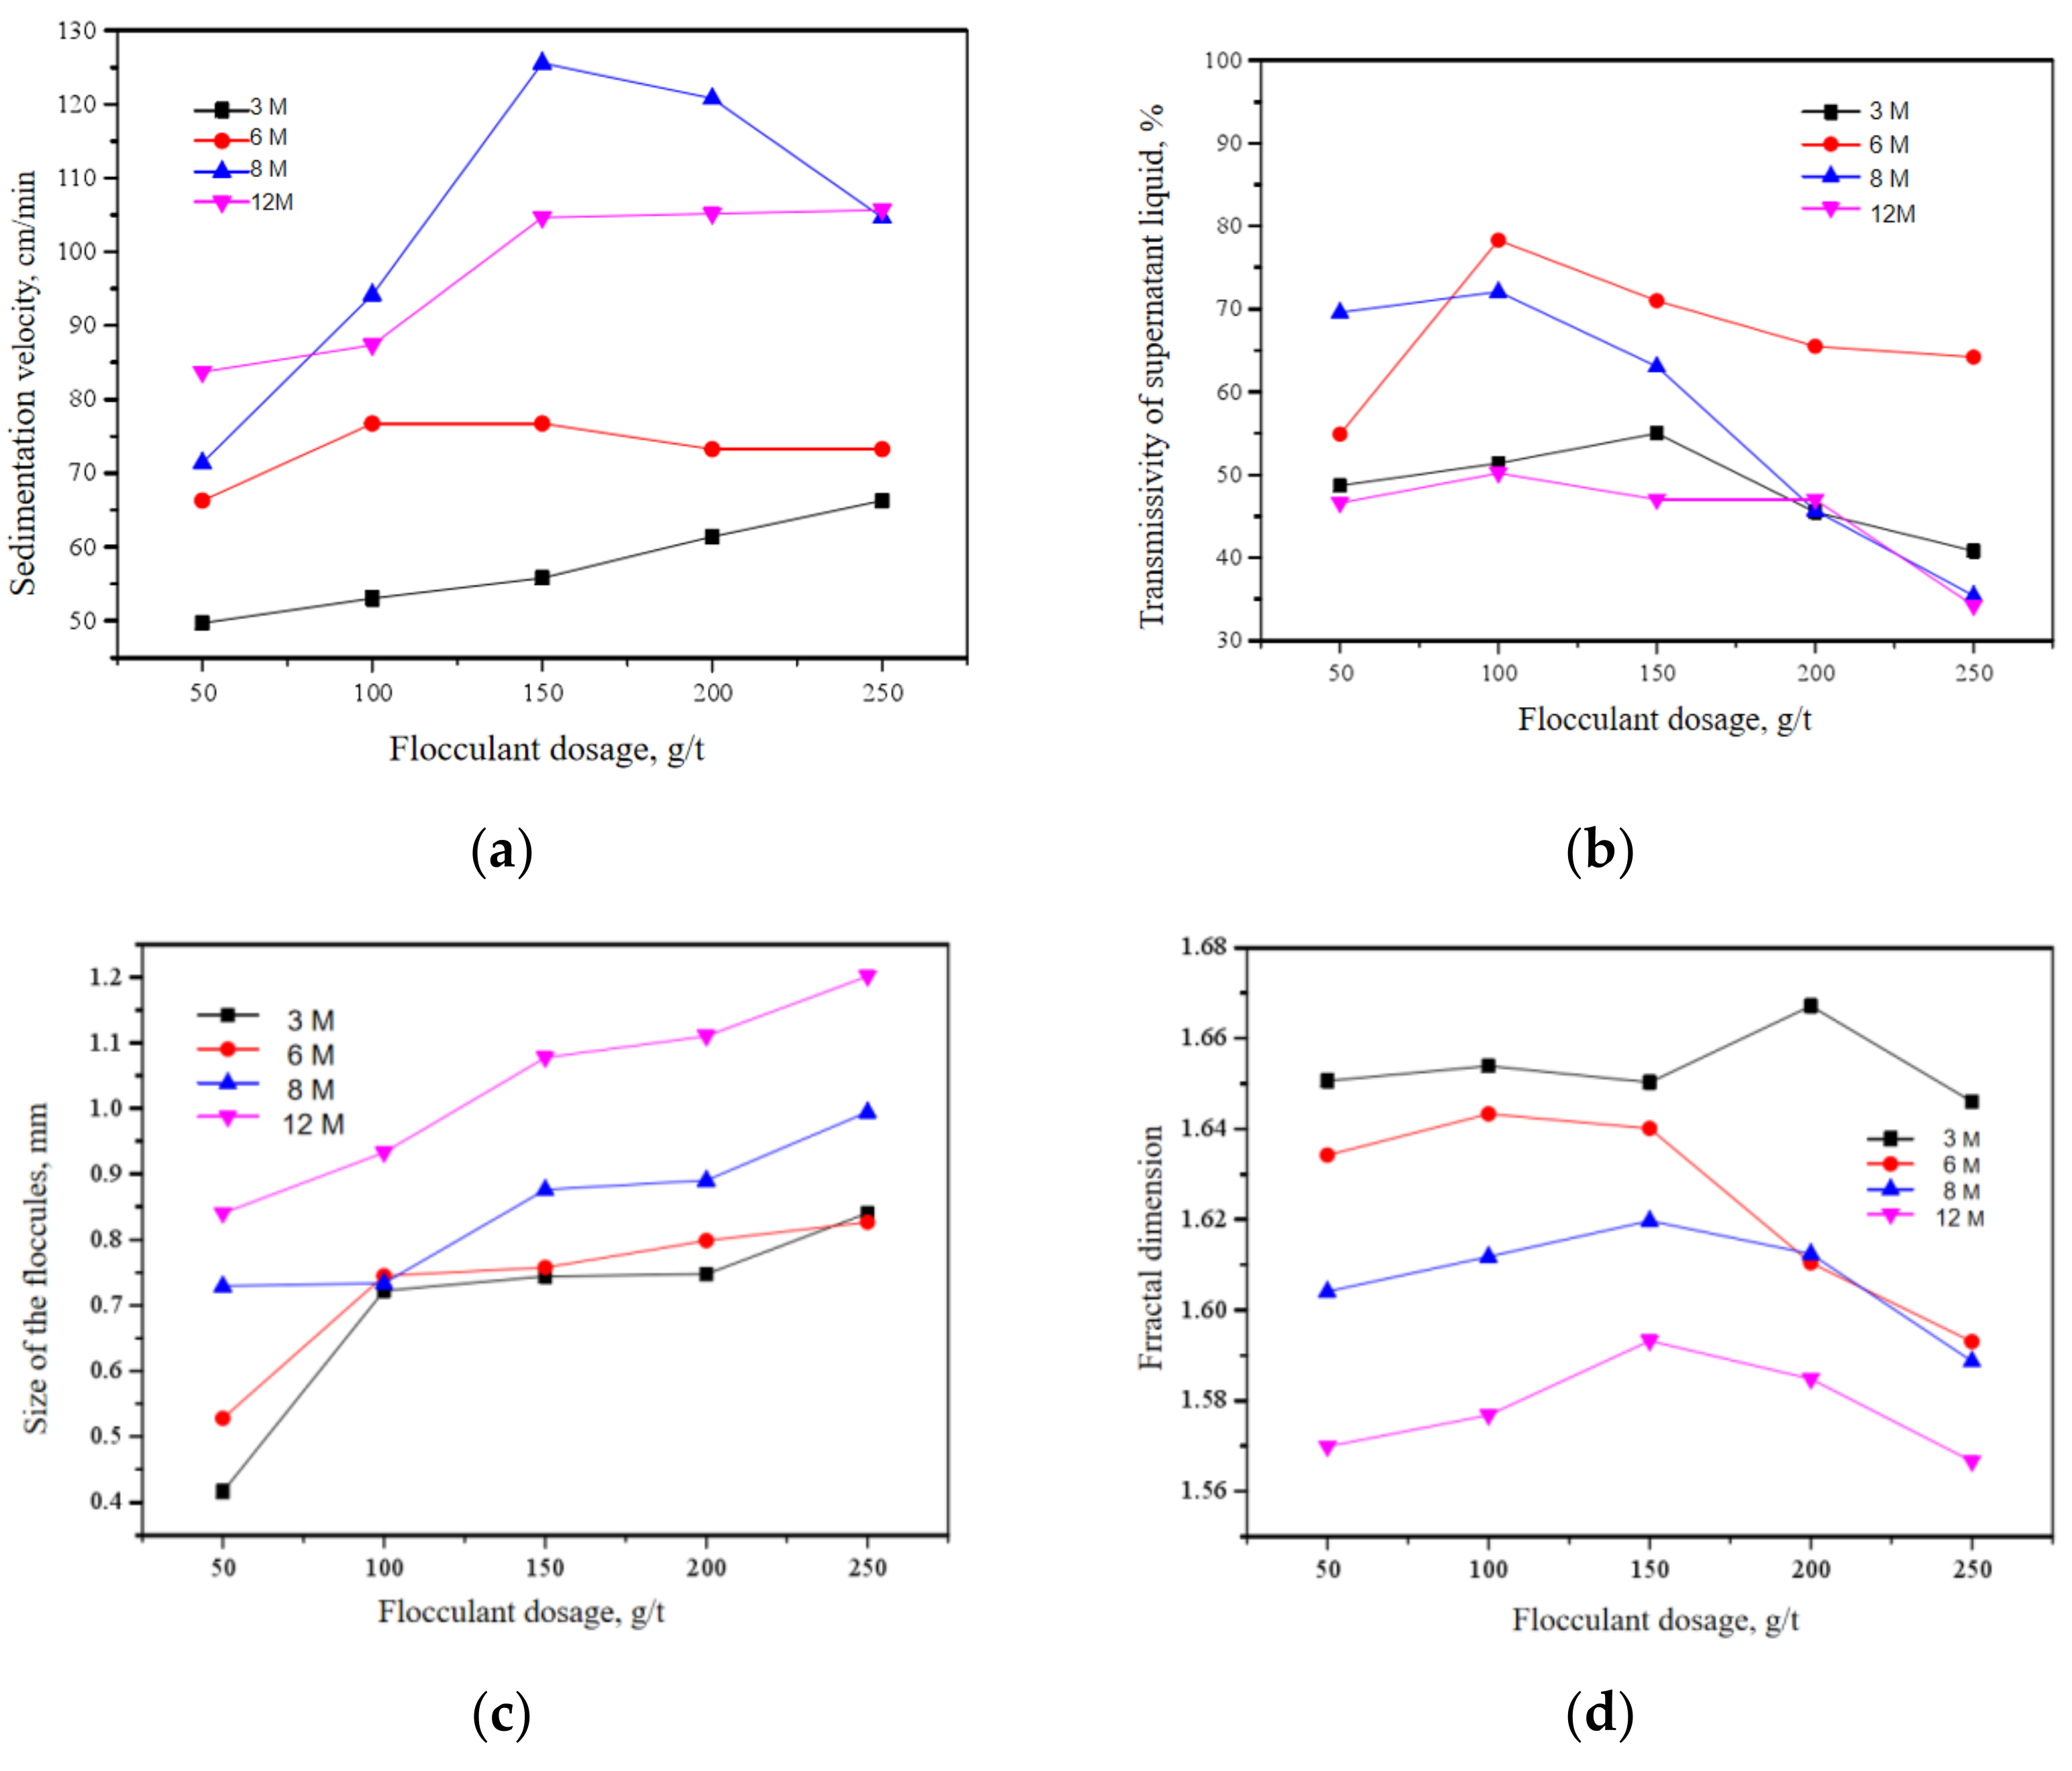
In this section, we tested the sedimentation results of different molecule mass, with respect to different dosage. The sedimentation velocity, transmissivity of the supernatant liquid, size of the flocculate and fractural dimension are compared and shown in Figure 12. When the molecular weight was small, the settling velocity increased gradually with the increase of dosage. When the molecular weight was large, the settling velocity and showed a trend of first increasing and then decreasing. The transmission ratio of supernatant reached the maximum when the dosage was small, and continued addition of dosage would lead to a significant decrease in the transmission ratio of supernatant. When the molecule mass of the anionic flocculant was 3 million, with the dosage of flocculant increased from 50 to 250 g/t, the sedimentation velocity increased from 49.70 cm/min to 66.27 cm/min, and the transmission ratio of supernatant reached the maximum 55.0% at 150 g/t dosage. The sedimentation effect of 8 million showed the most obvious trend with the increase of dosage. When the dosage of flocculant changed from 50 to 150 g/t, the sedimentation velocity increased from 71.39 cm/min to 125.57 cm/min and then decreased to 104.64 cm/min. The transmission ratio of supernatant reached the maximum value of 72.1% at a small dosage of 150 g/t. For anionic flocculants with different molecular masses, the fractal dimension first increases to a maximum value and then decreases gradually with the increase of dosage of flocculant. This reflects a process of floc change with the increase of drug dosage. With the increase of dosage, the particle size of flocs becomes larger and the sedimentation velocity increases gradually. However, particle size is not only the main factor affecting the settlement velocity after reaching a certain extent. The internal compactness of flocs also affects the sedimentation process, and the fractal dimension changes from increasing to decreasing. At this time, the density of flocs decreases, which is macroscopically manifested as a slight decrease in sedimentation velocity and a decrease in the transmission ratio of supernatant.
From the above analysis, it can be seen that the molecular weight of flocculant and the dosage of flocculant have highly significant effects on the particle size of flocs. We can improve the particle size of flocs by increasing the molecular weight of flocculant and the dosage of flocculant. The molecular weight of flocculant has a highly significant effect on the fractal dimension of flocs, that is, on the density of flocs, while the dosage of flocculant has no significant effect on the fractal dimension of flocs. Considering the influence of molecular weight of flocculant and dosage of flocculant on particle size and fractal dimension of flocculant, the influence of dosage of flocculant on sedimentation rate of coal slurry and transmission ratio of supernatant is not as significant as that of molecular weight of flocculant. Based on the previous experimental study on the effect of flocculant on coal slurry precipitation, the molecular weight of the flocculant used in the underground is 8 million, and the dosage of the flocculant is 150 g/t. According to the volume of the settling pond, the flocculant was weighed and put into the settling pond. The sedimentation of coal slurry and the change of water clarity in the sedimentation tank were observed regularly. After two months of observation, a large amount of coal slime was deposited in the bottom of the settling pond. The addition of flocculant greatly reduces the amount of coal slime entering the water bins and improves the decontamination effect. The coal sludge accumulation in the water bins has been extended to about 50 days, realizing the normal circulation of clearance.
6. Conclusions
Coal slurry samples were collected from the underground working face. A series of laboratory testing was conducted. The particle sized distribution of the coal powders, coal slurry element composition and coal mine water quality were characterized. Based on the laboratory testing, the detailed measures of coal slurry process were proposed and applied in the underground working site. From field observation, the coal mine water quality is significantly improved and the sludge is effectively removed from the water. Here are the main conclusions.
- The coal particle size is very fine. The percentage of >30 um is less than 5% and almost 80% of the powders are smaller than 20 um. Based on the size distribution, a proper vibrating screening machine (the GPS1837 series) is chosen and installed in the underground working site. Large coal grains are removed from the coal slurry and the volume of the solid materials is obviously decreased.
- The compositions of coal slurry are complex and various. The main elements in the coal slurry are C, O, Al, Si, Fe, S and Ca. The mean viscosity value is 17.05 cP and the coal slurry have high viscosity. Based on the analysis and field design requirements, a settling pond with the size of 50 × 4 × 1.5 (length by width by depth) is built in the tailgate of the longwall panel. The performance of the settling pond is monitored. In the No. 2 water bin, the production rate of coal sludge is significantly decreased. It extends 30 days to fill up the bin with the coal sludge.
- Coal mine water was collected from the underground. The pH value is higher than 7 and is alkaline. The hardness values are high and the coal mine water belongs to very hard category. Ions are extensively existing in the coal mine water. A proper polymer flocculant is chosen to further remove the coal solid powders. The performances of acid-base environment, molecular mass of the polymer flocculant and dosage of the polymer flocculant are investigated. Based on the previous experimental study on the effect of flocculant on coal slurry precipitation, the molecular weight of the flocculant used in the underground is 8 million, and the dosage of the flocculant is 150 g/t.
- These combined treatments of coal slurry in underground working transfer the traditional “coal mine working face-underground water storage bins” process methods. This novel method avoids the low-quality repetitive work, greatly reduces the labor forces. All these procedures are practical and are based on the underground environment. These methods can be used for coal slurry treatment for similar coal mines, especially for water-abundant mines. The normal coal production would not be affected by the coal mine water discharge process.
Author Contributions
Conceptualization, X.Z. and Y.D.; methodology, J.Z.; validation, X.Z., J.L. and Z.M.; formal analysis, J.L.; investigation, B.G.; resources, Y.D.; writing—original draft preparation, J.L. and Y.D.; writing—review and editing, J.L. and X.Z.; supervision, X.Z. and J.Z.; project administration, X.Z.; funding acquisition, X.Z. and J.L. All authors have read and agreed to the published version of the manuscript.
Funding
This research was funded by the SDUST Research Fund (grant No. MDPC201922) and the National Natural Science Foundation of China (grant No. 51574159). The APC was funded by SDUST research Fund.
Institutional Review Board Statement
Not applicable.
Informed Consent Statement
Not applicable.
Data Availability Statement
Copies of the following contracts and other reports can be requested from the author.
Acknowledgments
Supports from the Xinzhi coal mine are acknowledged.
Conflicts of Interest
The authors declare no conflict of interest.
References
- Bud, I.; Duma, S.; Denuţ, I.; Taşcu, I. Water pollution due to mining activity. Causes and consequences. BHM Berg-Hüttenmännische Mon. 2007, 152, 326–328. [Google Scholar] [CrossRef]
- Wright, I.A.; Paciuszkiewicz, K.; Belmer, N. Increased Water Pollution After Closure of Australia’s Longest Operating Underground Coal Mine: A 13-Month Study of Mine Drainage, Water Chemistry and River Ecology. Water Air Soil Pollut. 2018, 229, 55. [Google Scholar] [CrossRef]
- Younger, P. Mine water pollution in Scotland: Nature, extent and preventative strategies. Sci. Total Environ. 2001, 265, 309–326. [Google Scholar] [CrossRef]
- Akcil, A.; Koldas, S. Acid Mine Drainage (AMD): Causes, treatment and case studies. J. Clean. Prod. 2006, 14, 1139–1145. [Google Scholar] [CrossRef]
- Wang, Z.; Xu, Y.; Zhang, Z.; Zhang, Y. Review: Acid Mine Drainage (AMD) in Abandoned Coal Mines of Shanxi, China. Water 2020, 13, 8. [Google Scholar] [CrossRef]
- Van Aken, B.; Quaranta, J.D.; Mack, B.; Yu, H.; Ducatman, A.; Ziemkiewicz, P.F. Environmental Contaminants in Coal Slurry Intended for Underground Injection in the State of West Virginia. J. Environ. Eng. 2015, 141, 05014004. [Google Scholar] [CrossRef]
- Wright, I.A.; Belmer, N.; Davies, P.J. Coal Mine Water Pollution and Ecological Impairment of One of Australia’s Most ‘Protected’ High Conservation-Value Rivers. Water Air Soil Pollut. 2017, 228, 90. [Google Scholar] [CrossRef]
- Wright, I.A.; McCarthy, B.; Belmer, N.; Price, P. Subsidence from an Underground Coal Mine and Mine Wastewater Discharge Causing Water Pollution and Degradation of Aquatic Ecosystems. Water Air Soil Pollut. 2015, 226, 1–14. [Google Scholar] [CrossRef]
- Cao, W.; Shi, J.-Q.; Durucan, S.; Si, G.; Korre, A. Gas-driven rapid fracture propagation under unloading conditions in coal and gas outbursts. Int. J. Rock Mech. Min. Sci. 2020, 130, 104325. [Google Scholar] [CrossRef]
- Yang, W.; Lu, C.; Si, G.; Lin, B.; Jiao, X. Coal and gas outburst control using uniform hydraulic fracturing by destress blasting and water-driven gas release. J. Nat. Gas Sci. Eng. 2020, 79, 103360. [Google Scholar] [CrossRef]
- Bai, T.; Chen, Z.; Aminossadati, S.M.; Pan, Z.; Liu, J.; Li, L. Characterization of coal fines generation: A micro-scale investigation. J. Nat. Gas Sci. Eng. 2015, 27, 862–875. [Google Scholar] [CrossRef] [Green Version]
- Tu, Q.; Cheng, Y.; Ren, T.; Wang, Z.; Lin, J.; Lei, Y. Role of Tectonic Coal in Coal and Gas Outburst Behavior During Coal Mining. Rock Mech. Rock Eng. 2019, 52, 4619–4635. [Google Scholar] [CrossRef]
- Wang, Q.; Li, W.; Li, T.; Li, X.; Liu, S. Goaf water storage and utilization in arid regions of northwest China: A case study of Shennan coal mine district. J. Clean. Prod. 2018, 202, 33–44. [Google Scholar] [CrossRef]
- Thiruvenkatachari, R.; Su, S.; Cunnington, M. FO-RO for mining wastewater treatment. Curr. Trends Future Dev. (Bio-) Membr. 2020, 325–336. [Google Scholar] [CrossRef]
- Huisamen, A.; Wolkersdorfer, C. Modelling the hydrogeochemical evolution of mine water in a decommissioned opencast coal mine. Int. J. Coal Geol. 2016, 164, 3–12. [Google Scholar] [CrossRef] [Green Version]
- Li, P.; Wu, J.; Tian, R.; He, S.; He, X.; Xue, C.; Zhang, K. Geochemistry, Hydraulic Connectivity and Quality Appraisal of Multilayered Groundwater in the Hongdunzi Coal Mine, Northwest China. Mine Water Environ. 2018, 37, 222–237. [Google Scholar] [CrossRef]
- Singh, A.K.; Mahato, M.K.; Neogi, B.; Tewary, B.K.; Sinha, A. Environmental geochemistry and quality assessment of mine water of Jharia coalfield, India. Environ. Earth Sci. 2011, 65, 49–65. [Google Scholar] [CrossRef]
- Neogi, B.; Singh, A.K.; Pathak, D.D.; Chaturvedi, A. Hydrogeochemistry of coal mine water of North Karanpura coalfields, India: Implication for solute acquisition processes, dissolved fluxes and water quality assessment. Environ. Earth Sci. 2017, 76, 1–17. [Google Scholar] [CrossRef]
- Skousen, J.; Zipper, C.; Rose, A.; Ziemkiewicz, P.F.; Nairn, R.; McDonald, L.M.; Kleinmann, R.L. Review of Passive Systems for Acid Mine Drainage Treatment. Mine Water Environ. 2017, 36, 133–153. [Google Scholar] [CrossRef] [Green Version]
- Zhao, L.; Sun, C.; Yan, P.; Zhang, Q.; Wang, S.; Luo, S.; Mao, Y. Dynamic changes of nitrogen and dissolved organic matter during the transport of mine water in a coal mine underground reservoir: Column experiments. J. Contam. Hydrol. 2019, 223, 103473. [Google Scholar] [CrossRef]
- Fernando, W.A.M.; Ilankoon, S.; Syed, T.H.; Yellishetty, M. Challenges and opportunities in the removal of sulphate ions in contaminated mine water: A review. Miner. Eng. 2018, 117, 74–90. [Google Scholar] [CrossRef]
- Pyrgaki, K.; Gemeni, V.; Karkalis, C.; Koukouzas, N.; Koutsovitis, P.; Petrounias, P. Geochemical Occurrence of Rare Earth Elements in Mining Waste and Mine Water: A Review. Minerals 2021, 11, 860. [Google Scholar] [CrossRef]
- Sephton, M.G.; Webb, J.; McKnight, S. Applications of Portland cement blended with fly ash and acid mine drainage treatment sludge to control acid mine drainage generation from waste rocks. Appl. Geochem. 2019, 103, 1–14. [Google Scholar] [CrossRef]
- Keller, V.; Stopic, S.; Xakalashe, B.; Ma, Y.; Ndlovu, S.; Mwewa, B.; Simate, G.; Friedrich, B. Effectiveness of Fly Ash and Red Mud as Strategies for Sustainable Acid Mine Drainage Management. Minerals 2020, 10, 707. [Google Scholar] [CrossRef]
- Akryloamidowych, Z.P.; Koagulacji, J. Application of acrylamide polymers as flocculants in sewages coagulation process. Proc. ECOpole 2008, 2, 291–297. [Google Scholar]
- Pimpalkar, S.N.; Suresh, N.; Singh, G. Flocculation studies on high-ash coal slurry for improved clarification of water. Int. J. Environ. Sci. Technol. 2021, 2021, 1–22. [Google Scholar] [CrossRef]
- Samanta, B.K.; Samaddar, A.B. Underground mining slurry transportation viability. Int. J. Coal Sci. Technol. 2019, 6, 430–437. [Google Scholar] [CrossRef] [Green Version]
- Li, J.; Li, Z.; Yang, Y.; Zhang, X. Study on the generation of active sites during low-temperature pyrolysis of coal and its influence on coal spontaneous combustion. Fuel 2019, 241, 283–296. [Google Scholar] [CrossRef]
- Bakhtiyarov, S.; Overfelt, R. Measurement of liquid metal viscosity by rotational technique. Acta Mater. 1999, 47, 4311–4319. [Google Scholar] [CrossRef]
- Cheng, J.; Gröbner, J.; Hort, N.; Kainer, K.U.; Schmid-Fetzer, R. Measurement and calculation of the viscosity of metals—A review of the current status and developing trends. Meas. Sci. Technol. 2014, 25, 062001. [Google Scholar] [CrossRef]
- Fidalgo Valverde, G.; Duda, A.; Iglesias Rodríguez, F.J.; Frejowski, A.; Todorov, I. Groundwater Risk Assessment in the Context of an Underground Coal Mine Closure and an Economic Evaluation of Proposed Treatments: A Case Study. Energies 2021, 14, 1671. [Google Scholar] [CrossRef]
- Mpofu, P.; Addai-Mensah, J.; Ralston, J. Investigation of the effect of polymer structure type on flocculation, rheology and dewatering behaviour of kaolinite dispersions. Int. J. Miner. Process. 2003, 71, 247–268. [Google Scholar] [CrossRef]
- Zhu, J.; Zhang, G.; Liu, G.; Qu, Q.; Li, Y. Investigation on the rheological and stability characteristics of coal–water slurry with long side-chain polycarboxylate dispersant. Fuel Process. Technol. 2014, 118, 187–191. [Google Scholar] [CrossRef]
Figure 1.
Layout of the multi-level water bins.

Figure 2.
(a) Hardened sludge; (b) coal powders after crushing.

Figure 3.
Laser particle analyzer (LS-POP6). (a) Ultrasonic washing unit; (b) sample loading unit; (c) testing unit.
Figure 3.
Laser particle analyzer (LS-POP6). (a) Ultrasonic washing unit; (b) sample loading unit; (c) testing unit.

Figure 4.
(a) Schematic diagram of the viscosity test; (b) the photo of the testing rig.

Figure 5.
Laboratory testing of coal mine water quality. (a) Sample preparation; (b) after testing.

Figure 6.
Particle size distribution of the coal powders.

Figure 7.
Coal slurry element compositions.

Figure 8.
The GPS1837 vibrating sieve in the tailgate of the longwall panel. (a) Front view; (b) side view.
Figure 8.
The GPS1837 vibrating sieve in the tailgate of the longwall panel. (a) Front view; (b) side view.

Figure 9.
Schematic diagram of the ideal settling pond (vertical cross-section of the settling pond).
Figure 9.
Schematic diagram of the ideal settling pond (vertical cross-section of the settling pond).

Figure 10.
Testing results of different flocculant. (a) Sedimentation velocity; (b) transmissivity of supernatant liquid; (c) size of the floccules; (d) fractal dimension.
Figure 10.
Testing results of different flocculant. (a) Sedimentation velocity; (b) transmissivity of supernatant liquid; (c) size of the floccules; (d) fractal dimension.

Figure 11.
Testing results of different flocculant molecular mass. (a) Sedimentation velocity; (b) transmissivity of supernatant liquid.
Figure 11.
Testing results of different flocculant molecular mass. (a) Sedimentation velocity; (b) transmissivity of supernatant liquid.

Figure 12.
Testing results for different molecule mass with respect to flocculant dosage (a) Sedimentation velocity; (b) transmissivity of supernatant liquid; (c) size of the floccules; (d) fractal dimension.
Figure 12.
Testing results for different molecule mass with respect to flocculant dosage (a) Sedimentation velocity; (b) transmissivity of supernatant liquid; (c) size of the floccules; (d) fractal dimension.


Table 1.
Viscosity of the coal slurry.
| Group No. | Viscosity, cP |
|---|---|
| 1 | 17.2 |
| 2 | 16.9 |
| 3 | 16.6 |
| 4 | 17.5 |
Table 2.
Coal mine water quality analysis.
| Group No. | 1 | 2 | 3 | 4 | 5 | 6 | 7 | 8 | 9 | 10 |
|---|---|---|---|---|---|---|---|---|---|---|
| pH | 7.32 | 8.43 | 7.47 | 8.26 | 7.97 | 7.65 | 8.43 | 8.79 | 8.33 | 7.91 |
| Total hardness, (mg/L) | 585.3 | 639.2 | 605.2 | 571.1 | 614.0 | 604.4 | 621.7 | 577.8 | 243.6 | 577.5 |
| SO42− (mg/L) | 368 | 309 | 440 | 544 | 203 | 804 | 584 | 1127 | 144 | 575 |
| Cl (mg/L) | 50.3 | 30.6 | 72 | 98 | 82.5 | 50.1 | 119 | 212 | 141 | 176 |
| NO3 (mg/L) | 8 | 0 | 0 | 0 | 1.57 | 0 | 0 | 0 | 1.33 | 1.83 |
| F (ppm) | 0.601 | 1.55 | 3.26 | 2.9 | 17.5 | 4.7 | 44.3 | 17.6 | 28.5 | 7.69 |
Publisher’s Note: MDPI stays neutral with regard to jurisdictional claims in published maps and institutional affiliations. |
© 2021 by the authors. Licensee MDPI, Basel, Switzerland. This article is an open access article distributed under the terms and conditions of the Creative Commons Attribution (CC BY) license (https://creativecommons.org/licenses/by/4.0/).
Share and Cite
MDPI and ACS Style
Zhang, X.; Dong, Y.; Zhao, J.; Gong, B.; Meng, Z.; Lin, J. Combined Treatments of Underground Coal Slurry: Laboratory Testing and Field Application. Water 2021, 13, 3047. https://doi.org/10.3390/w13213047
AMA Style
Zhang X, Dong Y, Zhao J, Gong B, Meng Z, Lin J. Combined Treatments of Underground Coal Slurry: Laboratory Testing and Field Application. Water. 2021; 13(21):3047. https://doi.org/10.3390/w13213047
Chicago/Turabian StyleZhang, Xinguo, Yue Dong, Jinhai Zhao, Bin Gong, Zixuan Meng, and Jia Lin. 2021. "Combined Treatments of Underground Coal Slurry: Laboratory Testing and Field Application" Water 13, no. 21: 3047. https://doi.org/10.3390/w13213047
Note that from the first issue of 2016, this journal uses article numbers instead of page numbers. See further details here.