
The Role of Forests in Climate Change Regarding Carbon, Nitrogen, and Water: A Case Study of Pinus densiflora


Department of Civil Engineering, Keimyung University, 1095 Dalgubeoldaero, Dalseo-gu, Daegu 42601, Korea
*
Author to whom correspondence should be addressed.
Water 2021, 13(21), 3050; https://doi.org/10.3390/w13213050
Submission received: 22 August 2021
/
Revised: 22 October 2021
/
Accepted: 29 October 2021
/
Published: 1 November 2021
(This article belongs to the Special Issue Impacts of Climate Change on Plant Water Use, Carbon Balance, Nutrient Economy, and Their Interactions)
Abstract
:We examined the influence of climate change on the dynamics of Pinus densiflora, the most dominant tree species in South Korea, to explore its potential for climate change mitigation. We considered changes in precipitation, temperature, and CO under four representative concentration pathway (RCP) scenarios separately and in combination to evaluate the responses of Pinus densiflora to climate change. A well-tested ecohydrological and biogeochemical model, ecosys, was used to study the Gwangneung Experimental Forest in South Korea. Results showed that the positive effects of CO fertilizer on gross primary productivity (GPP) and net primary productivity (NPP) outweighed the negative effects caused by changes in precipitation and temperature. In particular, NPP improvements of 3.79%, 13.44%, 18.26%, and 28.91% were modeled under RCP values of 2.6, 4.5, 6.5, and 8.5, respectively, compared to the baseline. We found that nitrogen leaching and NO flux reduced as climate change become severe due to increases in nutrient uptake, leading to reduced soil nitrogen losses. Although evapotranspiration increased as the intensity of climate change increased, reductions in the stomatal opening improved the water use efficiency of Pinus densiflora. These results indicated that Pinus densiflora could serve as an environmentally friendly option to minimize climate change consequences.
1. Introduction
Global climate is changing at faster rates than any change documented in historical records [1]. Ecohydrological processes such as gross primary productivity (GPP), net primary productivity (NPP), and evapotranspiration have become non-stationary and highly variable due to global warming [2,3]. Changes in precipitation intensity and seasonal variability have been observed across time and space [4]. In particular, these changes are important to maintain the ecological balance in the Korean peninsula, because more than 50% of the annual precipitation occurs between April and September (the summer monsoon season) [5]. That is, a perturbation in precipitation patterns may have great potential to degrade ecosystem health. With the acceleration in global warming, South Korea experienced an unprecedented rise in summer temperature in 2018 [6]. The maximum temperature in Hongcheon in South Korea reached 40.3 C during the summer, which was the highest temperature ever recorded since 1907 [7].
In recent years, a number of studies have addressed various aspects of climate change on forest ecosystem dynamics [8,9,10]. One of the most imperative characteristics regarding the influences of climate change on forest ecosystems is their regional response to climate change [10,11]. In South Korea, Pinus densiflora, a focus of this study, is the most widely grown tree (∼27% of forest areas). This tree has been restored under a forest development plan since the 1970s [12,13]. Previous studies found that under representative concentration pathway (RCP) 8.5 scenarios, the Pinus densiflora growth rate would decrease by the 2050 s in South Korea [14,15,16,17]. However, mechanistic explanations were limited in these studies, since they were primarily based on statistical trend analysis using age, density, stand growth, and topography wetness index. A causal assessment of how climate change affects forest productivity and ecosystem carbon balance needs exploring to understand the complex relationship between climate stresses and their effects on the growth of Pinus densiflora.
Several studies have found that planting trees could slow global warming by absorbing atmospheric CO through photosynthesis [18,19,20]. Forest ecosystems account for ∼45% of global terrestrial carbon storage [21] and have the ability to offset ∼33% of carbon emissions from anthropogenic activities, such as fossil fuels and land-use changes [22]. However, the beneficial carbon sequestration capacity of forest ecosystems was primarily estimated focusing on CO fertilization benefits. Elevated temperature and changes in precipitation patterns also influenced forest carbon storage. Warmer temperatures increase soil respiration through its positive effects on microbial growth and activity, which could reverse forests from a net carbon sink into a source [23]. Changes in precipitation alter forest growth and primary productivity dependent on water availability [24]. That is, the ability of forest ecosystems to help absorb atmospheric carbon is likely to be affected by a combination of climate change, tree phenology, and soil, water and nutrient dynamics.
The effects of these complex dynamics on the growth of Pinus densiflora must be considered together to assess the potential of Pinus densiflora to mitigate climate change in the long term. Addressing these intertwined dynamics discussed above is the focus of this study. In particular, we explored the following questions to evaluate the sustainability of Pinus densiflora under climate change: (1) How do changes in precipitation, temperature, and CO separately and in combination affect the GPP and NPP of Pinus densiflora?; (2) Are soil NO flux and nitrogen leaching sensitive to climate change since they are emerging environmental issues?; (3) Does water availability become a limiting factor to sustain the growth of Pinus densiflora under climate change? To answer these questions, we used a coupled ecohydrological and biogeochemical model, ecosys, to investigate the potential of Pinus densiflora to minimize climate change consequences.
2. Materials and Methods
2.1. Study Site
We studied the growth and physiology of Pinus densiflora under climate change for the case of the Gwangneung Experimental Forest near Seoul, South Korea (374701 N, 1271037 E, ∼420 m above sea level). Pinus densiflora was chosen since it was one of the most dominant tree species in this study site [25]. This experimental forest has been protected from human activities since 1913 and thus is home to plants and animals designated as endangered [14]. Even during the period of Japanese colonialism (1910–1945) and the Korean War (1950–1953), these forest regions were not greatly affected by physical disturbances, such as clear cuttings and winter heating [25,26]. In 1998, a long-term ecological research (LTER) site was established in this region to monitor the sustainability of forest ecosystems.
The long-term annual mean precipitation and temperature of the study site are 1468 mm and 12.70 C, respectively, based on weather data from the Korea Meteorological Administration (https://data.kma.go.kr). The most precipitation falls in July, with an average of 436 mm, while the lowest precipitation occurs in January, with an average of 19 mm. In terms of temperature, the hottest month is August (average temperature of 25.78 C) while the coolest month is January (average temperature of −2.11 C). That is, the study site experiences high seasonal variations in monthly precipitation and temperature. For soil conditions, we used silt loam with a bulk density of 1.05 g cm obtained from [25] and the vertical profile of soil organic carbon and pH obtained from Soil Grid [27]. Based on the soil type, we estimated the hydraulic conductivity and field capacity to be 28 mm hr and 0.28, respectively [28]. All these soil characteristics were used for soil parameters.
Hourly weather forcings, such as precipitation, air temperature, specific humidity, wind speed, and solar radiation, were obtained at an adjacent site (∼30 km away) to the Korea Meteorological Administration for the 30 years from 1986 to 2015 (https://data.kma.go.kr). We performed simulations for 2006 to 2015 to evaluate the model performance. During the period, the observations of GPP, net ecosystem exchange (NEE), and soil temperature were available at the study site [29]. These observed variables were used for model validation to establish confidence in using the model to explore Pinus densiflora dynamics under climate change.
2.2. Model Description
In this study, we used ecosys to estimate Pinus densiflora growth and response to climate change. Multiple canopies and soil layers were used to estimate interactions between water, carbon, nitrogen, and phosphorus dynamics in the soil and plants. This model has been used in more than 100 studies across space and time to explore ecohydrological and biogeochemical processes in terrestrial ecosystems, including in agriculture [30,31], tundra [32,33], and forests [34,35,36]. This model was considered to be one of the most accurate models among 26 land surface models exploring GPP at 39 flux tower sites in North America [37]. In this paper, we briefly describe key processes associated with GPP and NPP dynamics modeled in ecosys, but do not list their detailed implementations. A detailed description of ecosys, including parameters, is available in supplementary materials in a previous study [38].
2.2.1. Gross Primary Productivity
In ecosys, the C3 and C4 carbon fixation pathways are considered to capture physiological and morphological differences in response to environmental conditions, such as atmospheric CO, precipitation, and temperature. GPP is modeled as a sum of the CO fixation rate of each leaf surface for each branch, node, azimuth, and sun exposure [38] and is estimated through an iterative procedure until leaf CO fixation rate (, [mol m s]) is equal to leaf diffusion rate ( [mol m s]). This equilibrium is achieved by adjusting using a convergence solution for CO in canopy leaf ( [mol mol]) and CO in canopy chloroplasts ( [mol mol]):
where
where A is the leaf area [m m]; is the CO-limited leaf carboxylation rate [mol m s]; is the irradiance-limited leaf carboxylation rate [mol m s]; is CO in canopy air [mol mol]; is leaf stomatal resistance [s m]. and are modeled as:
and
where is the leaf carboxylation rate at non-limiting CO, water, temperature, nitrogen and phorspous [mol m s]; is the CO in canopy chloroplasts [M]; is the CO compensation point in a C mesophyll [M]; is the Michaelis-Menten constant for carboxylation at ambient O; is the non-stomatal water effect on carboxylation [-]; J is the electron transport rate in a C3 mesophyll [mol m s]; and Y is the carboxylation yield from electron transport in a C3 mesophyll [mol COmol e].
2.2.2. Net Primary Productivity
Net primary productivity (NPP) is modeled as GPP minus total autotrophic respiration ( [g C m h]) from a nonstructural carbon product of CO fixation ( [g C g C]), the remobilization of leaf carbon ( [g C g C]), and nutrient uptake ( [g C g C]):
where
is estimated by the multiplication of the specific autotrophic respiration of a nonstructural carbon product of CO fixation, a nonstructural carbon product of CO fixation, and the temperature effect. is modeled as the difference between the autotrophic respiration of a nonstructural carbon product of CO fixation and maintenance respiration. is modeled as:
where is the energy cost of nutrient uptake [g C g N or P]; , , and are root or mycorrhizae ammonium uptake [g N m], nitrate uptake [g N m, and dihydrogen phosphate uptake [g P m], respectively. That is, NPP is strongly controlled by climate, CO, and nutrient availability in plants directly through photosynthesis and respiration and indirectly through nutrient remobilization from storage roots to leaves and vice versa.
2.3. Climate Scenarios
In this study, we used four representative concentration pathway (RCP) scenarios (RCP2.6, RCP4.5, RCP6.5, and RCP8.5) to determine whether Pinus densiflora would help curb climate change through the process of capturing atmospheric CO. To investigate its potential effects on climate change mitigation, seasonal changes in CO, precipitation, and maximum and minimum temperature were considered (Table 1). We explored the growth and climate sensitivity of Pinus densiflora under baseline (1986 to 2015) and climate change conditions (the 2050s: 2036 to 2065). These 30-year periods were chosen to minimize seasonal and interannual weather variability. The seasonal climate change scenarios were estimated from the average values of 48 general circulation model (GCM) ensembles using KNMI Climate Explorer (https://climexp.knmi.nl). More details can be found in KNMI Climate Explorer. Four different atmospheric CO concentrations were used for RCP2.6, RCP4.5, RCP6.5, and RCP8.5, which were 440, 480, 485, and 550 ppm, respectively. The baseline was evaluated at the present concentration of CO (400 ppm).
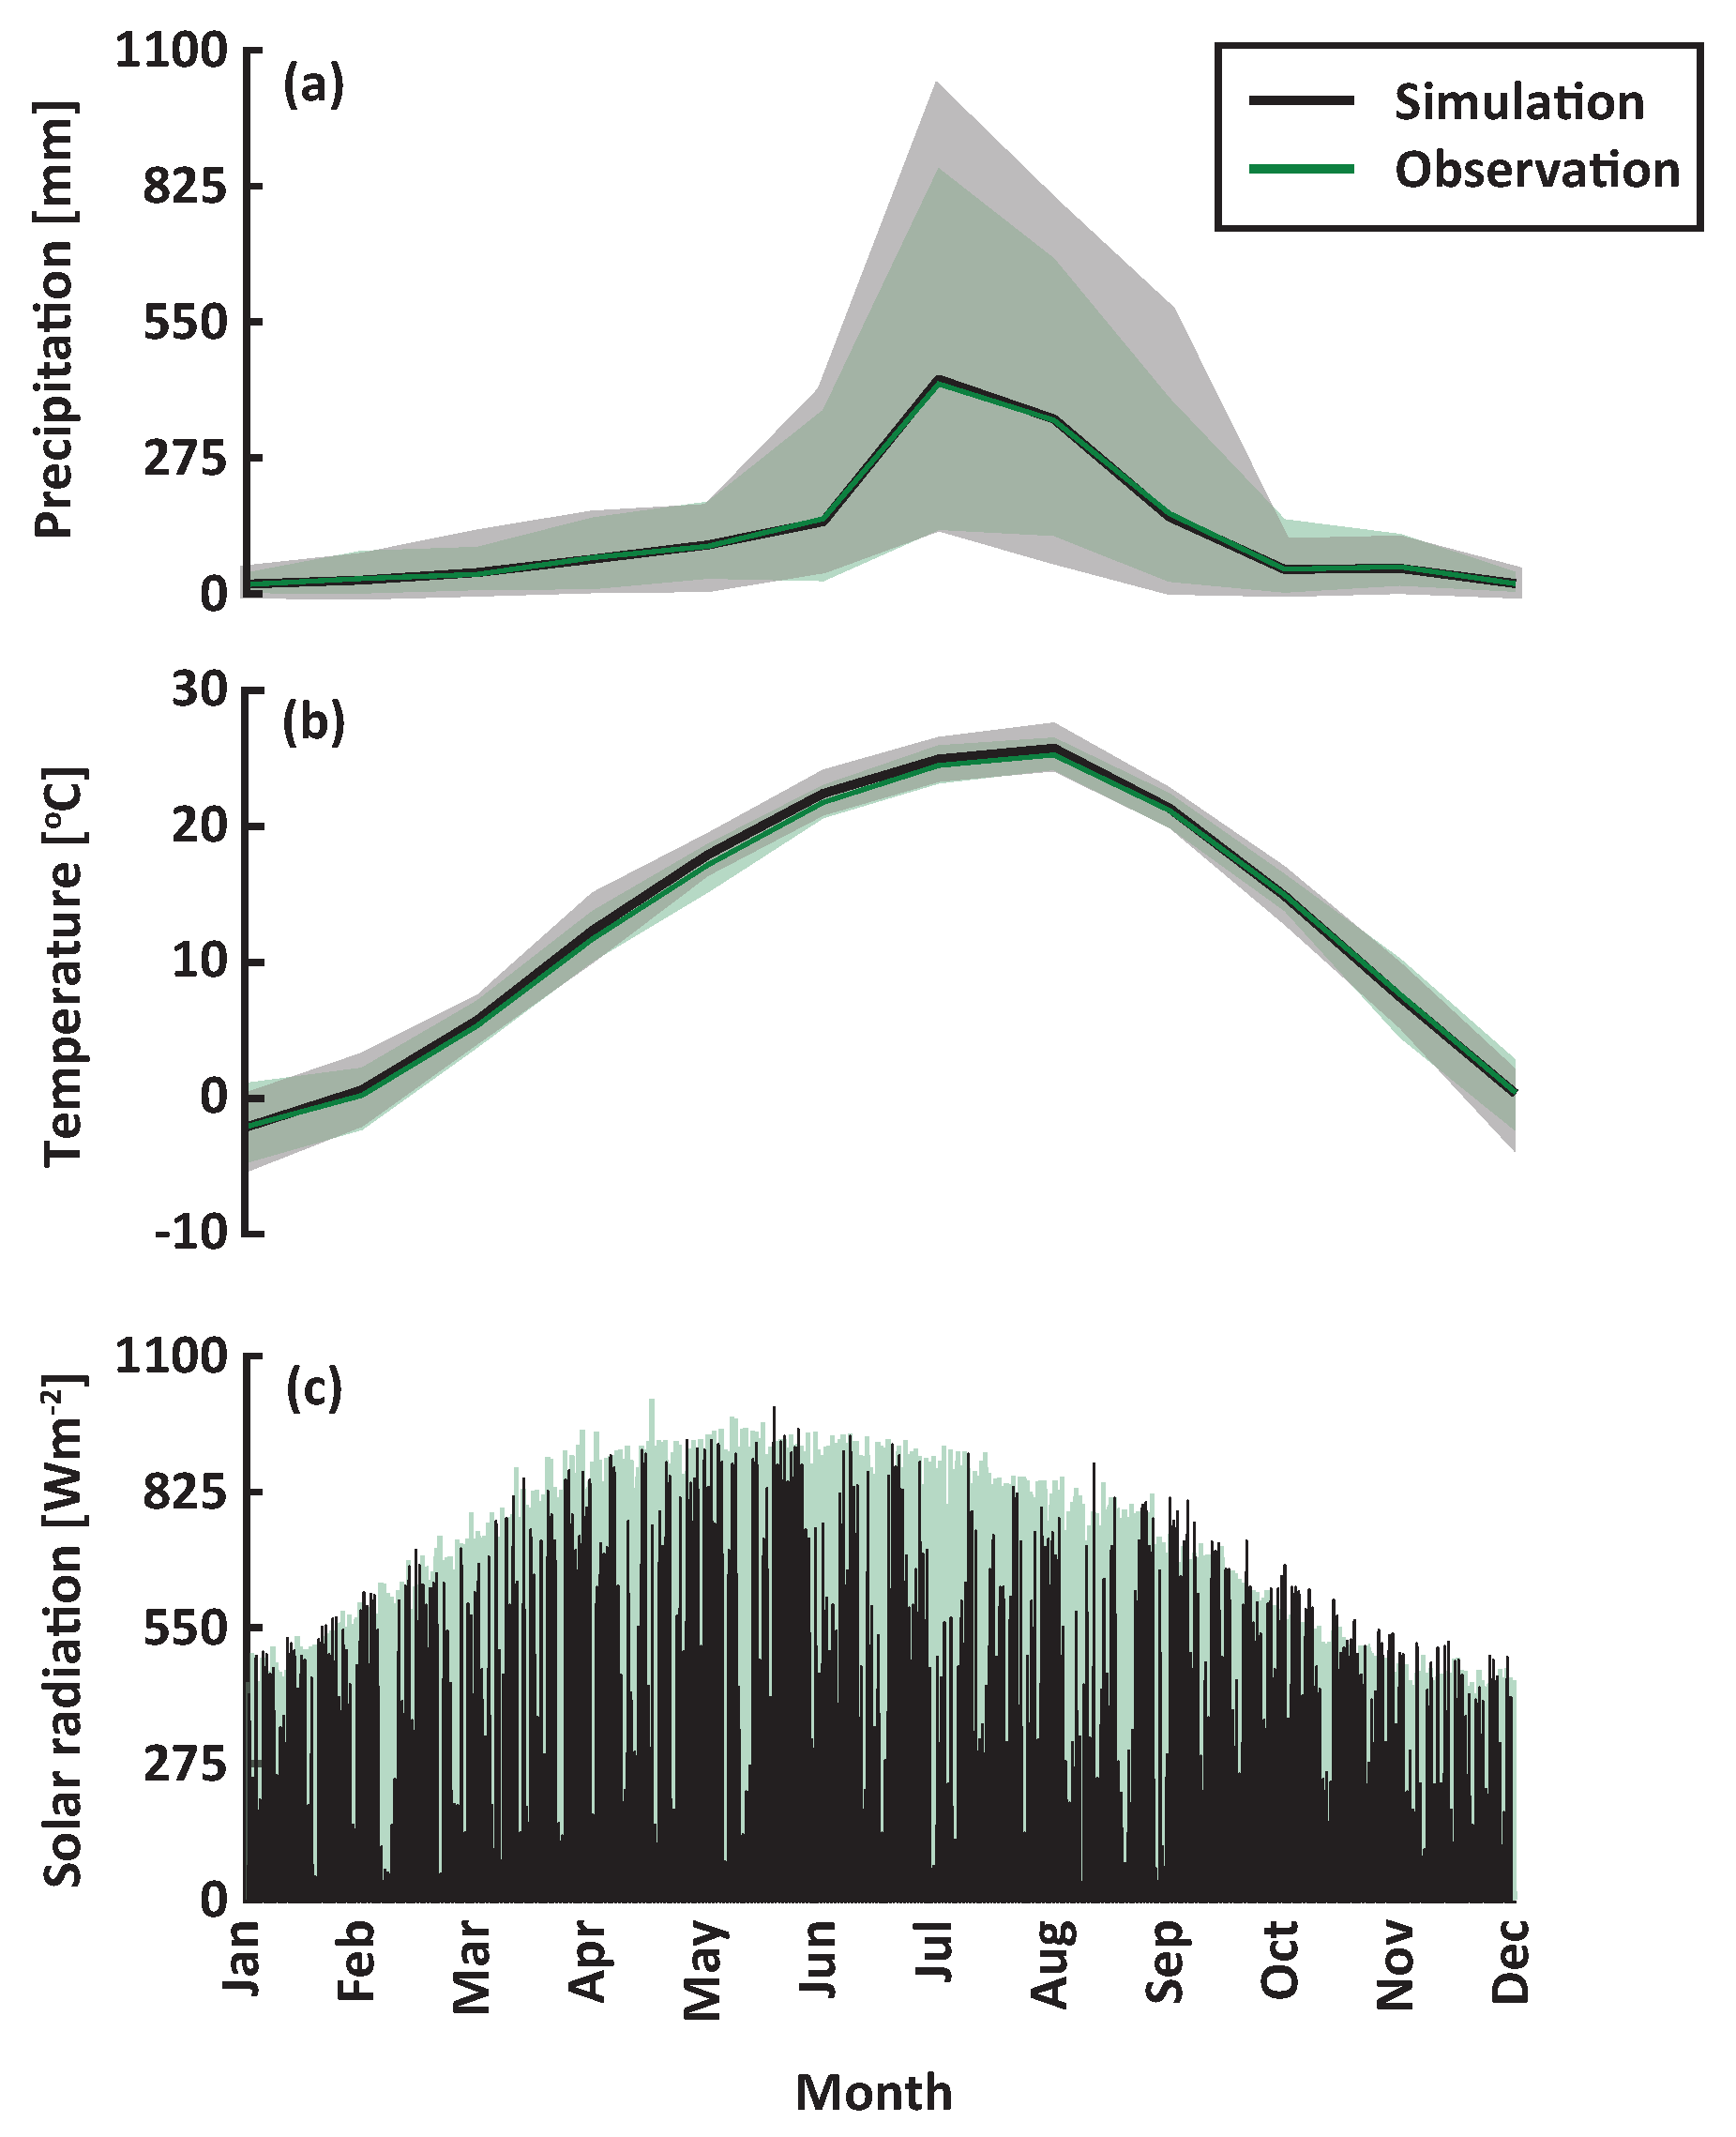
To achieve statistical confidence in the results of Pinus densiflora growth projections under climate change, we simulated ecosys for 50 years using a weather generator [39], which was used to reproduce a set of hourly meteorological variables including precipitation, temperature, solar radiation, relative humidity, wind speed, atmospheric pressure, and cloud cover (Figure 1). The inputs of the weather generator, except for the listed weather variables, included latitude, longitude, hours of difference from Greenwich Mean Time, and elevation. We used observed weather data from 1986 to 2015 to estimate the parameters of the weather generator. For the baseline scenario, the reproduced weather data were implemented to determine the effect of interannual weather variations in Pinus densiflora growth projections. For the climate change scenario, changes in CO, precipitation, and minimum and maximum temperature were applied to the baseline scenario.
2.4. Simulation Design
To reduce the influences of initial soil and canopy conditions on the modeled results, we ran ecosys for a 20-year spinup period (1986 to 2005) with the same set of equations and parameters as used in the following numerical experiments. The outputs of this preceding period were used as the initial conditions for model validations and applications. The present-day ecohydrological and biogeochemical dynamics for Pinus densiflora were estimated forward in time through the historical period until 2015 using observed weather. We then perform numerical experiments to investigate the impacts of climate change on the growth and carbon fixation of Pinus densiflora. For the parameters of Pinus densiflora, we used approaches described in previous studies [40,41,42]. Other parameters used in this study are provided in supplementary materials in a previous study [38].
3. Results
3.1. Model Validation
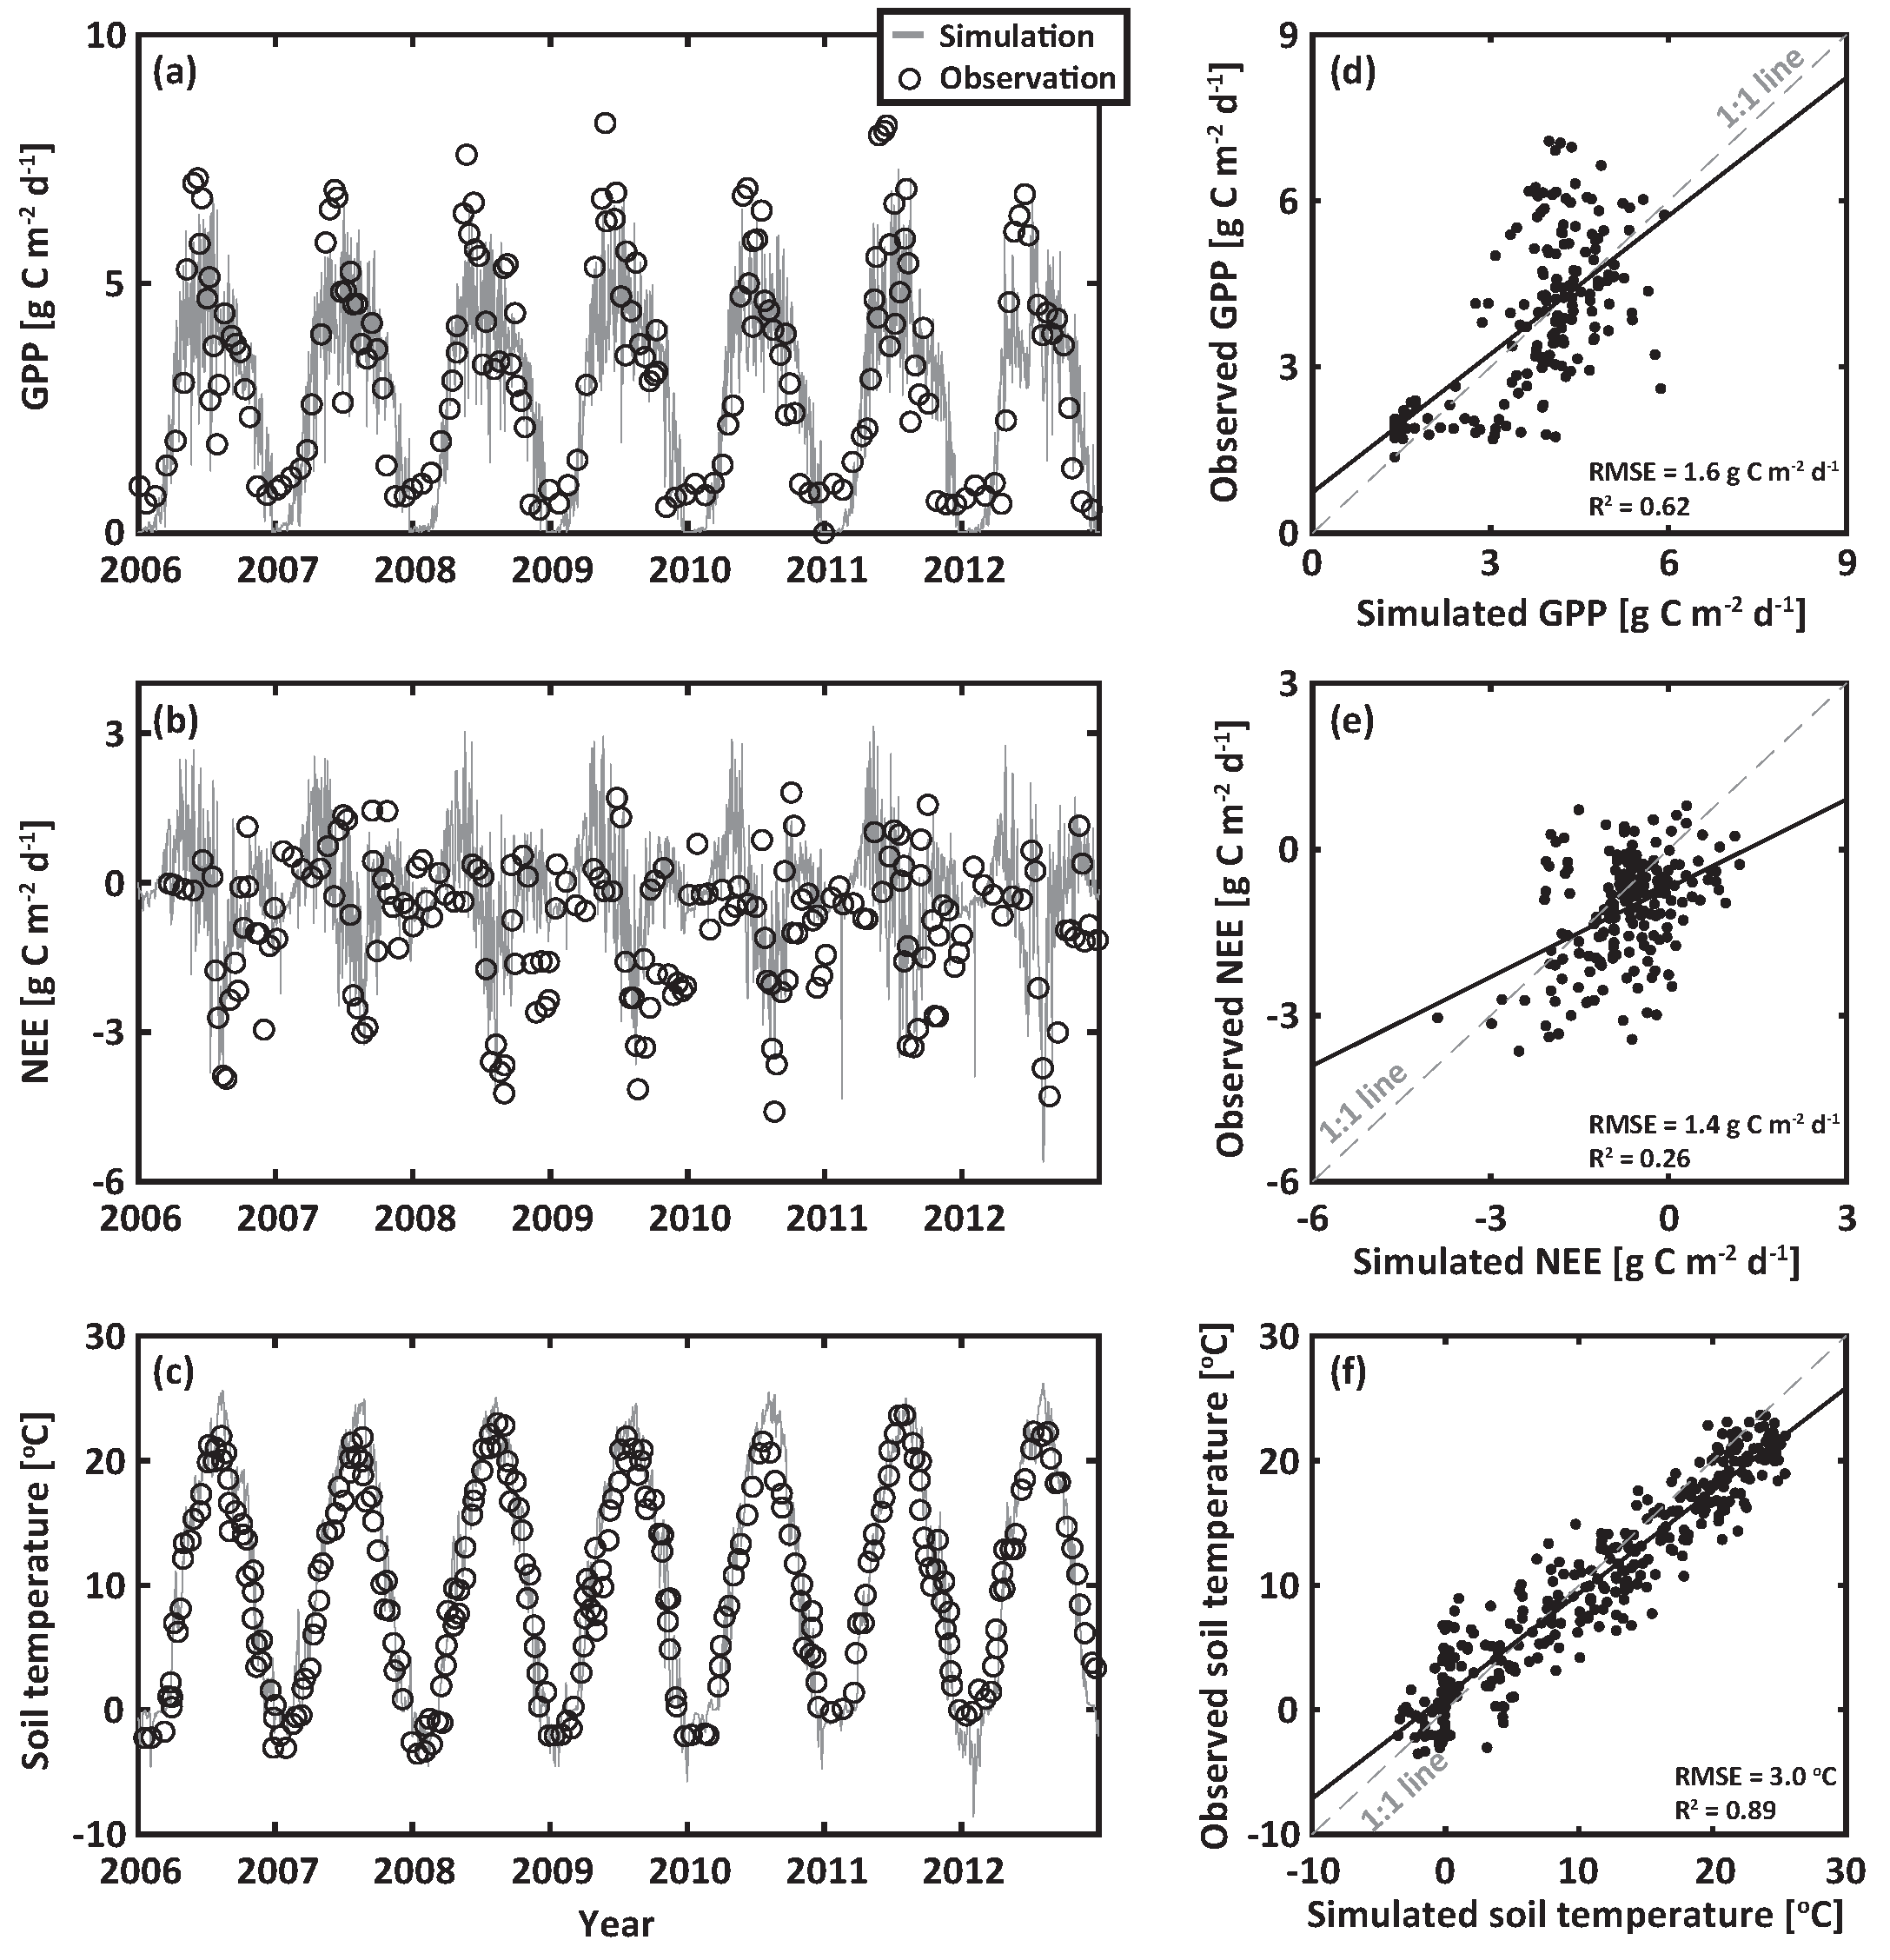
We compared the modeled results with observations at the study site over seven years (2006 to 2012); these observations included GPP, NEE, and soil temperature at a depth of 15 cm (Figure 2). The predicted variables through numerical estimations satisfactorily captured their seasonal variations. The corresponding root mean square errors (RMSE) were 1.6 g C m d, 1.4 g C m d, and 3.0 C for GPP, NEE and soil temperature, respectively. In particular, our results showed excellent agreement between modeled and observed seasonal trends in soil temperature (Figure 2e,f). However, there were some discrepancies between modeled and observed GPP and NPP, especially during high flux events. These differences were in part caused by weather forcing data that were not obtained from the study, as explained above. However, the seasonal variations and magnitudes of GPP, NEE, and soil temperature were comparable with the observations, providing confidence in modeled results for exploring the growth of Pinus densiflora under climate change.
3.2. GPP and NPP
We estimated separately and in combination the impacts of precipitation, temperature, and CO concentration under four different RCP scenarios (RCP2.6, RCP4.5, RCP6.0, and RCP8.5) on the GPP and NPP of Pinus densiflora (Figure 3). An increase in precipitation was projected in all seasons, with larger increases in higher greenhouse gas emission scenarios (Table 1). For the scenario of precipitation change alone, our results showed that changes in precipitation did not considerably alter GPP and NPP compared to baseline (Figure 3, first column). The percentage changes of GPP and NPP under climate change scenarios compared to baseline were less than 0.2%. At a first glance, water availability would not be a limiting factor to the rate of Pinus densiflora photosynthesis and soil respiration. However, the small changes in GPP and NPP were indeed caused by the balance between two opposite effects: (i) reduced oxygen in the root zone, which lowered nutrient uptake and thus photosynthesis, and (ii) improved photosynthesis and respiration under well-watered conditions.
For the scenario of temperature change alone, slight changes in GPP of −0.69%, −0.23%, −0.48%, and 0.89% under RCP 2.6, 4.5, 6.0, and 8.5, respectively, were modeled compared to baseline (Figure 3, second column). The potential improvement of photosynthesis due to increased kinetic energy under elevated temperature was offset by increased water stress. Warming led to an increase in the energy used to support evaporation, thereby leading to water-limited environments. With the rising temperature, an increase in stomatal conductance decreased the leaf water potential and growth of Pinus densiflora. That is, the benefits of elevated temperature for photosynthesis were offset by water stresses. For NPP dynamics under temperature change only, we modeled decreases in NPP of −9.89%, −11.69%, −9.75%, and −13.87% under RCP 2.6, 4.5, 6.0, and 8.5, respectively, compared to baseline. Mean annual temperatures were projected to increase by 1.2, 1.56, 1.29, and 2.14 C under RCP 2.6, 4.5, 6.0, and 8.5, respectively, compared to baseline. That is, there was an approximately 7% reduction of NPP per degree celsius increase in temperature. These results were obtained through the positive influence of temperature on plant and microbial respiration, leading to reduced NPP.
For the scenario of CO change alone, the improvements of GPP and NPP were modeled compared to baseline (Figure 3, third column). There was a positive relationship between CO concentration and photosynthesis rate due to CO fertilizer effects, as expected. However, we noted that elevated CO also stimulated soil respiration from increased litter inputs into the soil (explained in further detail in Section 3.3). The ratios of NPP to GPP were 0.5059, 0.5142, 0.5157, and 0.5205 under RCP 2.6, 4.5, 6.0, and 8.5, respectively.
When all of the climate variables were considered together, which included changes in precipitation, temperature, and atmospheric CO concentration, increases in GPP of 5.51%, 10.85%, 12.16%, and 19.74% under RCP2.6, 4.5, 6.0, and 8.5, respectively, were modeled compared to baseline (Figure 3, fourth column). We noted that the sums of changes in GPP under the individual climate change scenarios were 4, 7, and 12% smaller than those under all-considered RCP 2.6, 4.5, and 8.5, respectively. The corresponding case for RCP6.0 was not considerably different (due to relatively small changes in precipitation). That is, the beneficial influences of elevated CO on the GPP of Pinus densiflora were not fully restored due to nutrient limitations. Increases in precipitation during growing seasons under climate change scenarios (see Table 1) caused increased nutrient leaching and thus reduced nutrient uptake. Higher NPP was modeled as climate change scenarios become more pronounced in responses to GPP dynamics under climate change.
3.3. Soil CO and NO Flux
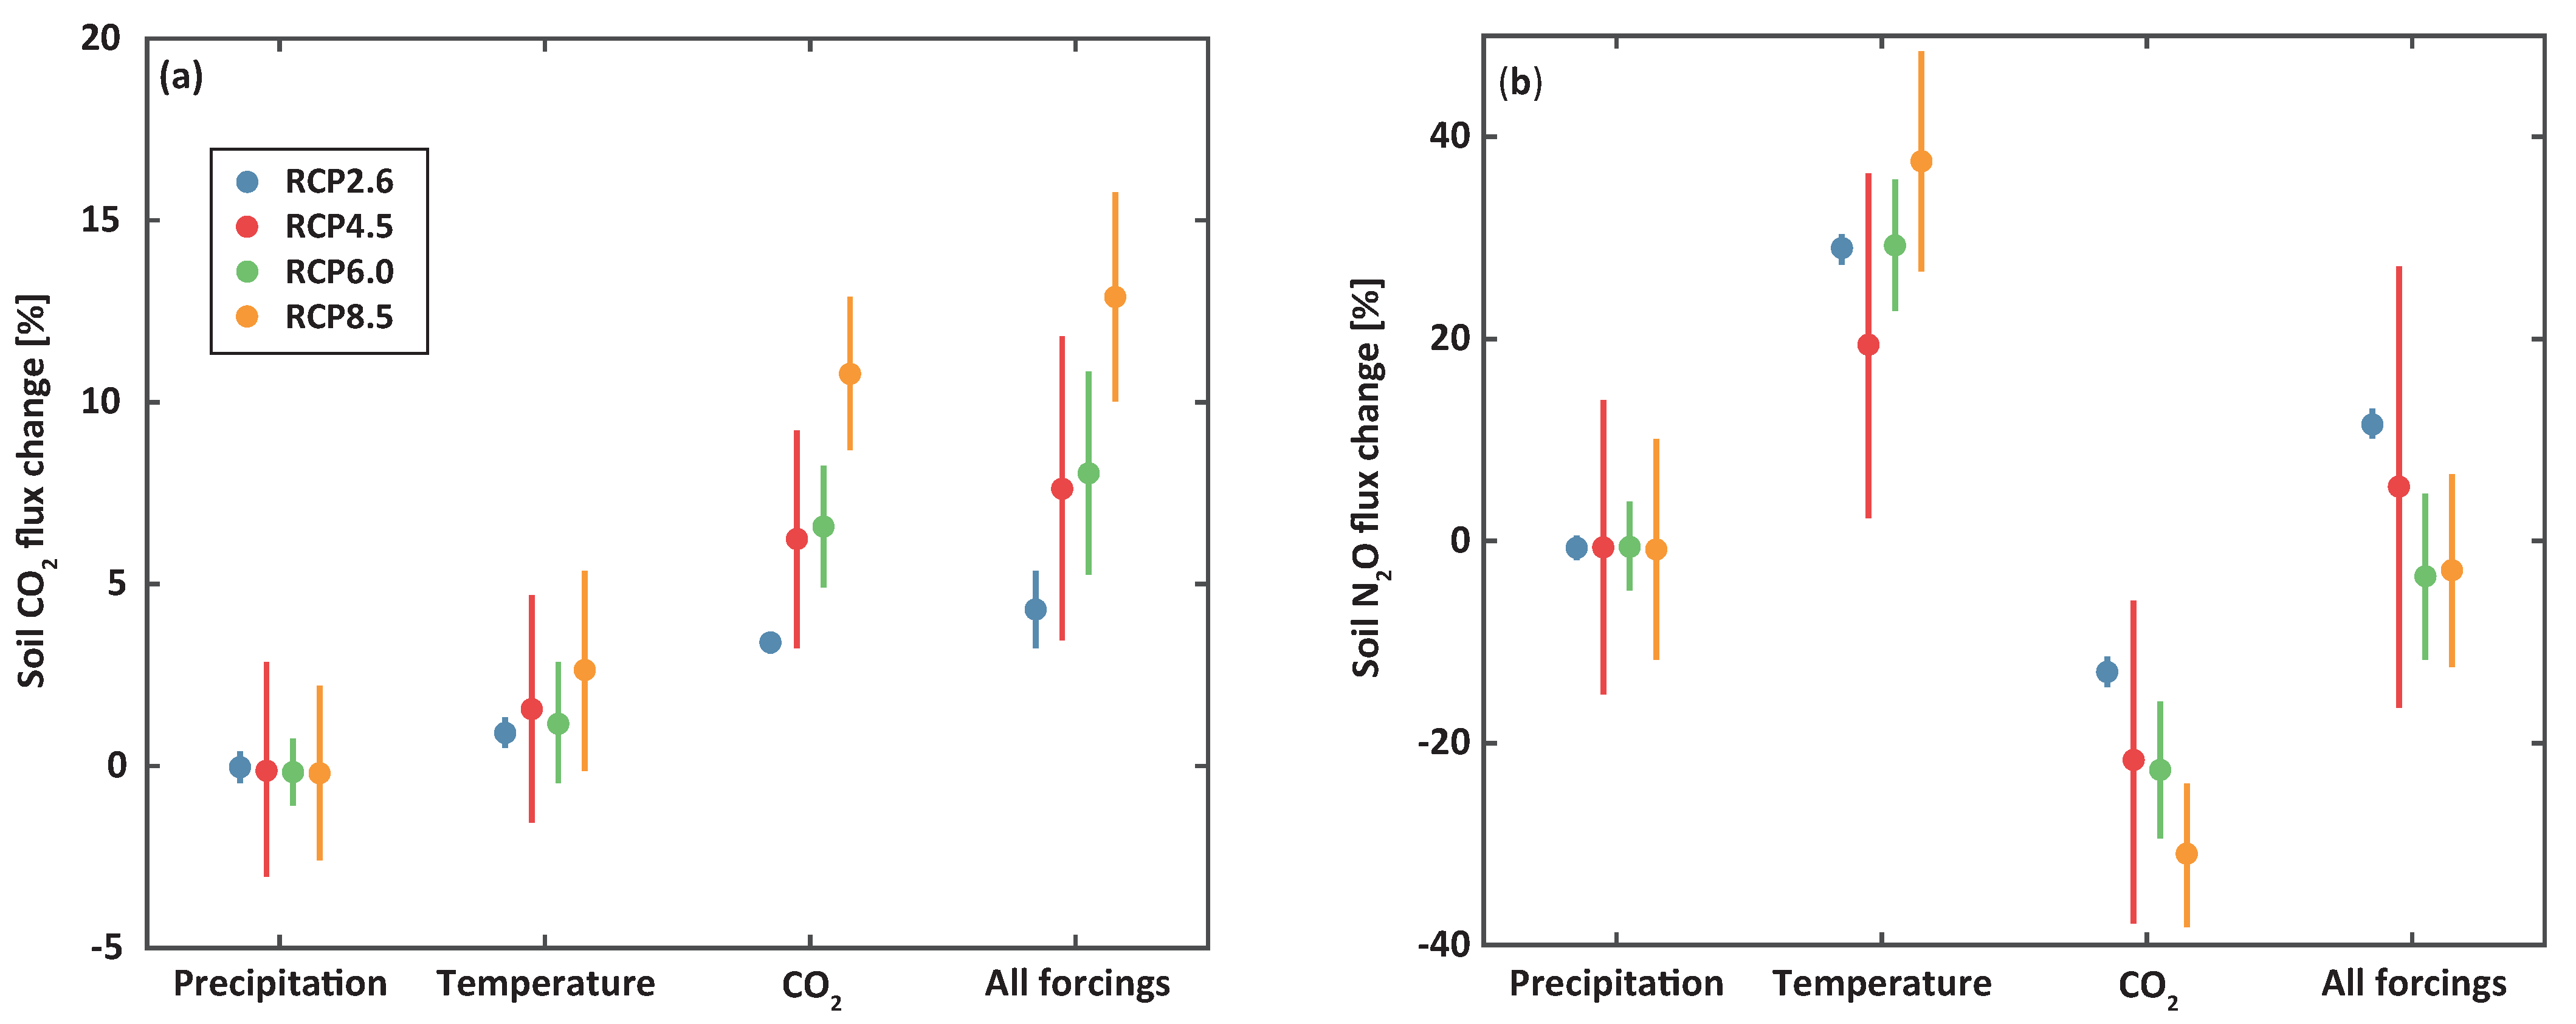
Changes in precipitation only had small effects on soil CO and NO fluxes. These changes were less than 1% compared to baseline (Figure 4). These inconsiderable alterations were mainly due to similar litterfall amounts between baseline and climate change scenarios in response to changes in precipitation. For the case of temperature change only, we modeled approximately 0.97 and 23.18% increases of soil CO and NO fluxes, respectively, per 1 C increase in mean air temperature. The increased temperature promoted the growth of soil microbes and thus stimulated soil CO and NO fluxes. We noted, under elevated CO change only, an increase in soil CO fluxes, but a decrease in soil NO fluxes. Stimulated leaf photosynthetic CO fixation, due to a high internal CO level, naturally increased litterfall and thus soil respiration. The reduced soil NO emissions were mainly explained by an increase in nutrient uptake of Pinus densiflora to meet its growth demands, resulting in reduced soil nitrogen and losses as NO via denitrification. When all of the climate variables were considered together, changes in soil CO fluxes of 4.30, 7.62, 8.05, and 12.90% while changes in soil NO fluxes of 11.53, 5.39, −3.49, and −2.89% were modeled under RCP 2.6, 4.5, 6.0, and 8.5, respectively, compared to baseline. In other words, higher soil CO and lower NO emissions were expected under higher greenhouse gas emission scenarios.
3.4. Inorganic Nitrogen Leaching
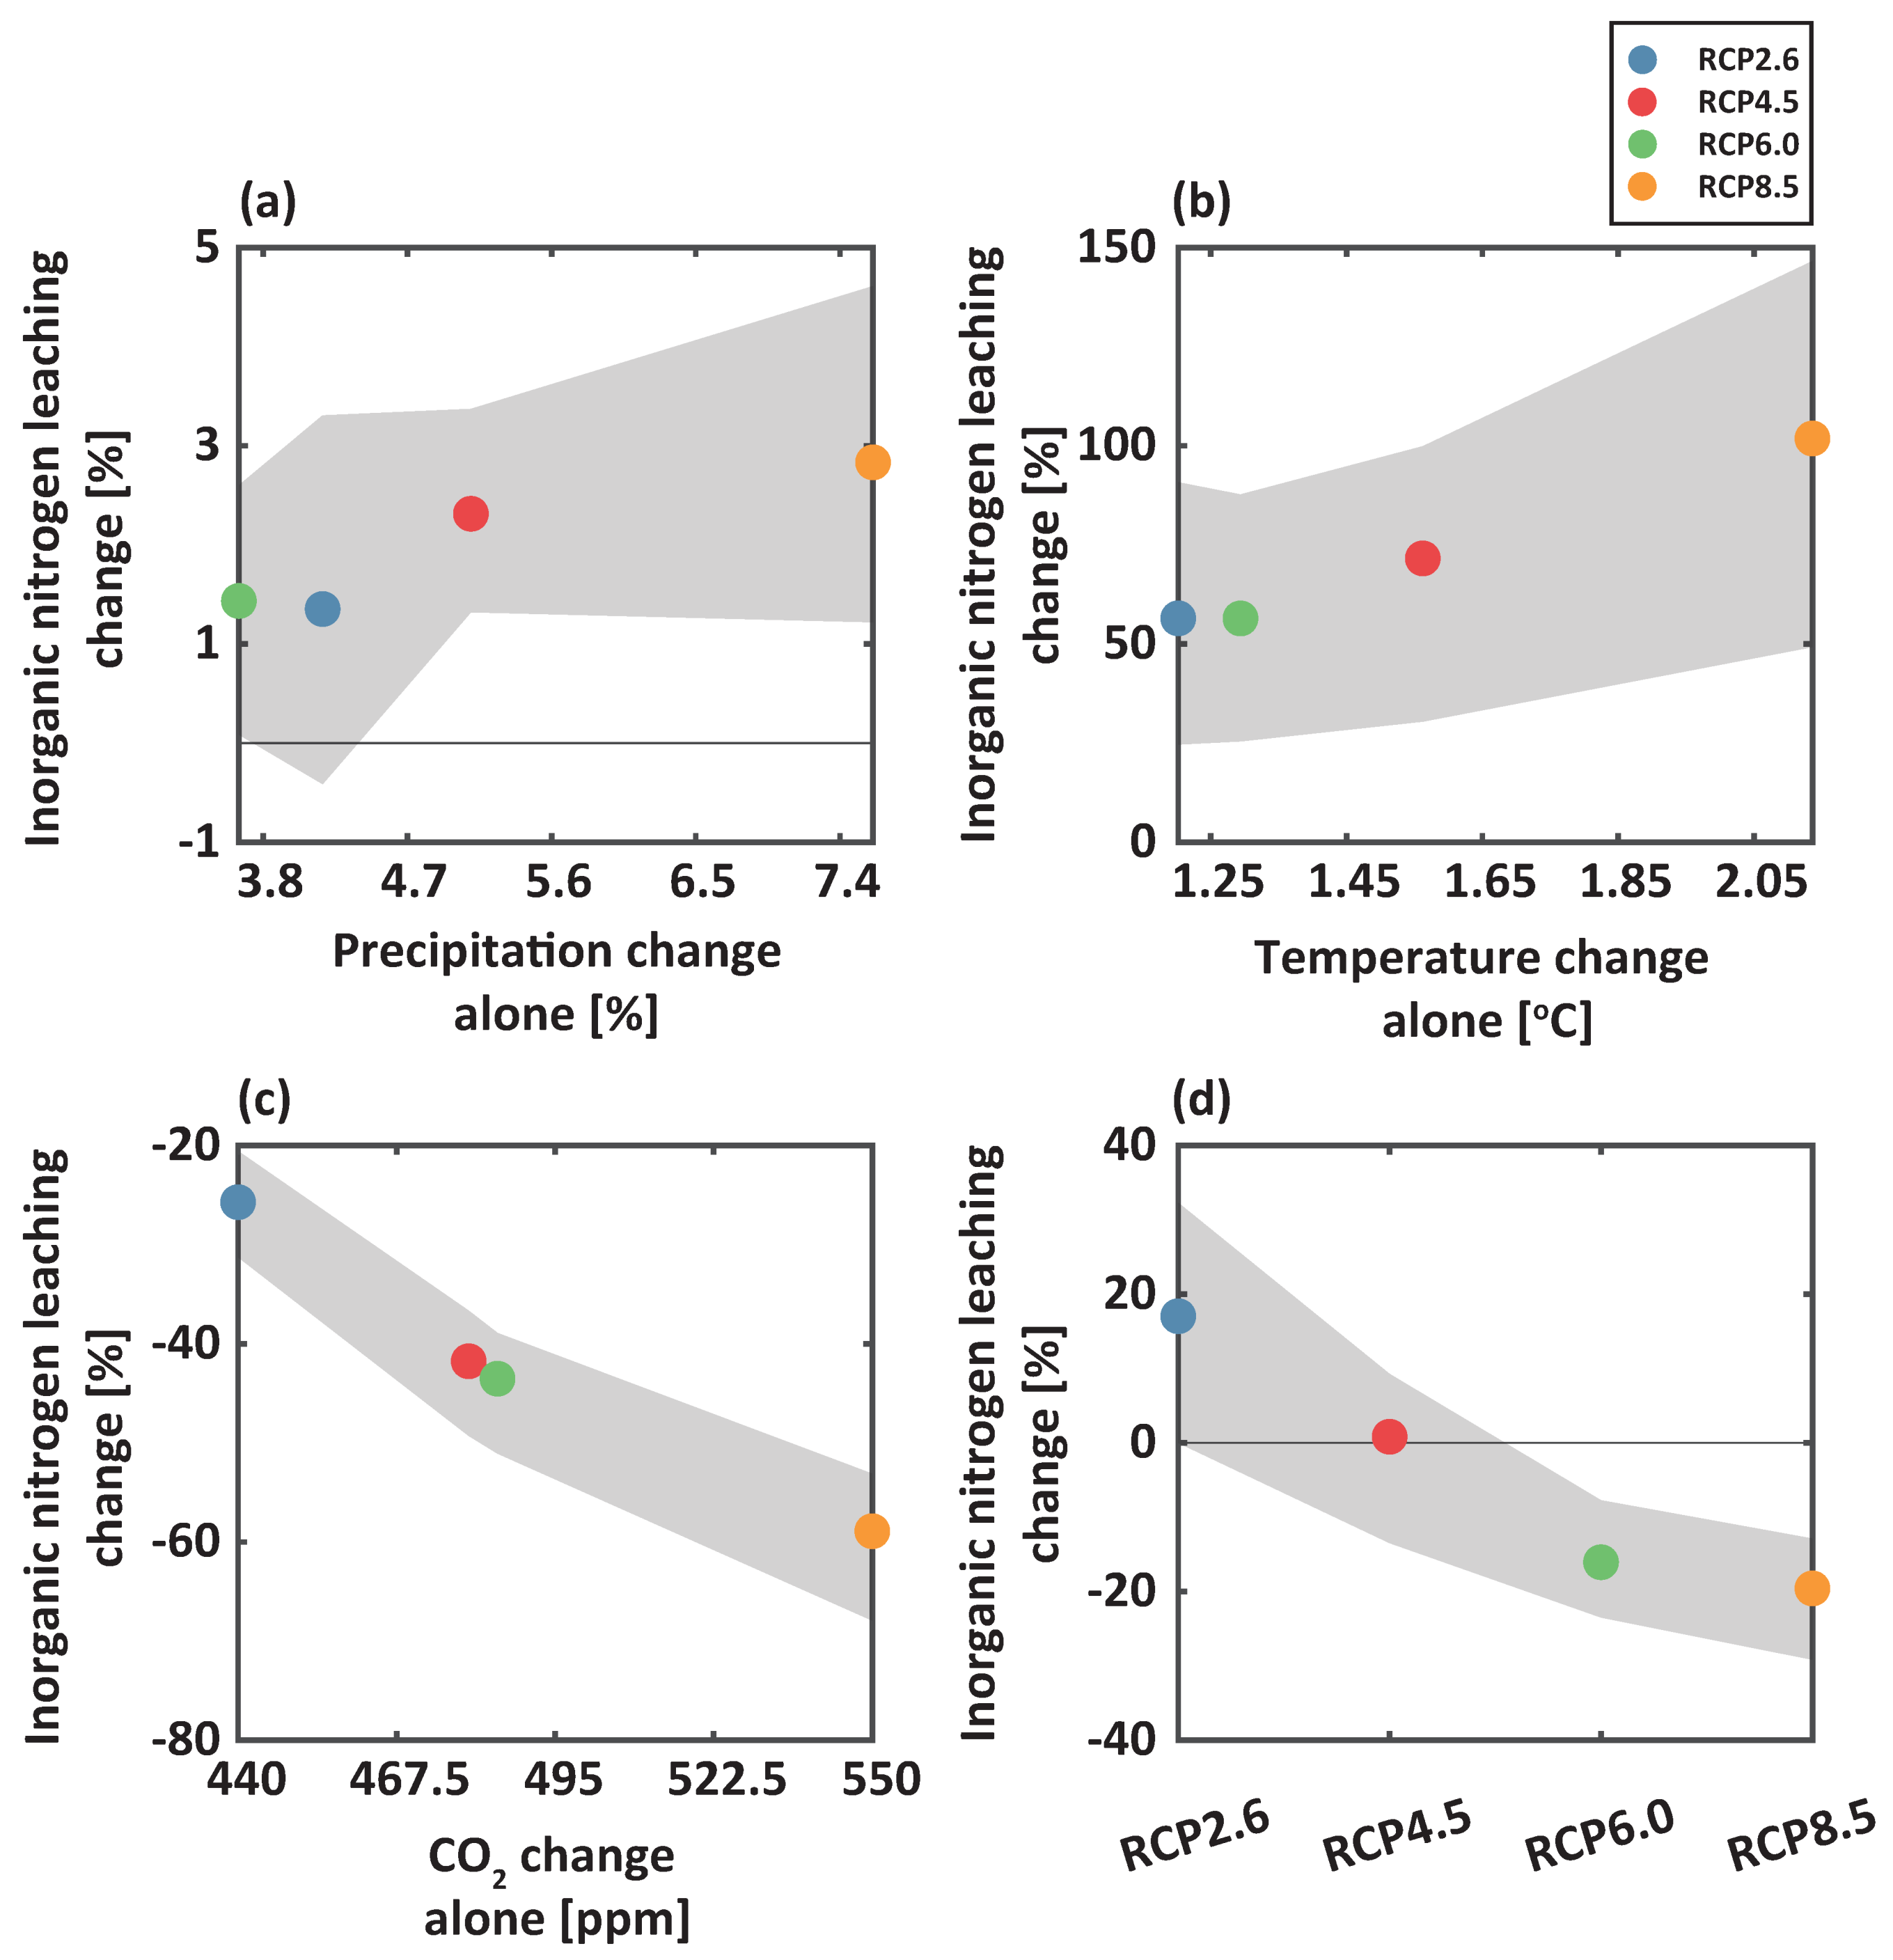
We analyzed the influences of climate change on inorganic nitrogen leaching at the study site to evaluate its environmental risks for receiving water bodies (Figure 5). The increases in precipitation only slightly increased inorganic nitrogen leaching, which was caused by enhanced water percolation (Figure 5a). For the case of temperature change only, considerable increases in inorganic nitrogen leaching of 56.48, 71.59, 56.45, and 101.84%, respectively, were modeled compared to baseline (Figure 5b). Warming stimulated microbial activity and led to higher nitrification and mineralization rates. Additionally, the high solubility and negative charge of nitrate accelerated its losses. As atmospheric CO increased alone, inorganic nitrogen leaching decreased (Figure 5c). The relatively high rates of photosynthesis of Pinus densiflora due to CO fertilization effects increased nitrogen uptake and thus reduced nitrogen available for leaching. We noted that, when all the climate variables were considered together, nitrogen leaching reduced as climate scenarios became severe (Figure 5d).
3.5. Evapotranspiration
We estimated the impacts of changes in precipitation, temperature, and CO concentration separately and in combination on evaporation and transpiration of Pinus densiflora (Figure 6a) under RCP 2.6, RCP 4.5, RCP 6.0, and RCP 8.5. For the case of increases in precipitation alone, almost no changes in evaporation were modeled (less than 0.3% compared to baseline). These results indicated that, at the study site, the processes of surface evaporation were limited by energy availability rather than water. These limitations were also explained by the numerical experiments of temperature change-only scenarios. We modeled an approximately 5.71 mm yr increase of evaporation per degree Celsius increase in temperature. For the case of CO concentration alone, slight decreases in evaporation were modeled. The stimulated photosynthesis due to CO fertilizer effects enhanced biomass allocation to leaves, developing increased shading covers that reduced the energy available for evaporation. When all of the climate variables were considered together, increases in evaporation of 4.51, 5.84, 4.61, and 8.14% were modeled under RCP 2.6, RCP 4.5, RCP 6.0, and RCP 8.5, respectively. That is, temperature was the most important regulator between the other climate variables in positively affecting evaporation.
We explored the transpiration of Pinus densiflora under climate change (Figure 6b). For the case of precipitation change only, we modeled slightly higher water losses through transpiration of 0.52, 0.65, 0.46, 0.85% under RCP 2.6, RCP 4.5, RCP 6.0, and RCP 8.5, respectively, due to increased water availability. For the cases of temperature change only, the rising temperature increased the atmospheric vapor pressure deficit and thus the gradient of water between the atmosphere and leaf interior. These processes resulted in increased transpiration under elevated temperature scenarios. We estimated an approximately 2.53 mm yr increase in transpiration per degree Celsius increase in temperature. For the case of elevated CO alone, we noted that, although CO fertilizer effects reduced the stomatal opening of Pinus densiflora, slight increases in transpiration of 1.08, 1.29, 1.19, and 1.39% under RCP 2.6, RCP 4.5, RCP 6.0, and RCP 8.5, respectively, were modeled due to enhanced photosynthesis rates. We found that the combined impacts of precipitation changes and rising temperature and CO levels on the transpiration of Pinus densiflora were not far from the additive.
3.6. Water Use Efficiency
Due to increases in both evapotranspiration and GPP under climate change scenarios, we evaluated water use efficiency (defined as GPP per unit water uptake) to explore the environmental sustainability of Pinus densiflora (Figure 7). For the case of precipitation change only (Figure 7a), water use efficiency was not considerably influenced by increases in precipitation. This finding indicated that water stress was not one of the limiting factors to prevent the growth of Pinus densiflora at the study site. When Pinus densiflora were exposed to an increasing water deficit caused by heat-induced drought stress, decreases in water use efficiency of 2.84, 3.07, 2.83, and 2.88% were modeled under RCP 2.6, RCP 4.5, RCP 6.0, and RCP 8.5, respectively (Figure 7b). For the case of CO change alone, water use efficiency almost linearly increased with rising atmospheric CO concentration (Figure 7c). We found an increase in water use efficiency of 6.08 gC g HO per ppm increase of CO. When all of the climate change variables were considered together, the benefits of CO-induced improvements in water use efficiency were lowered to 2.57, 6.77, 8.70, 13.68% under RCP 2.6, RCP 4.5, RCP 6.0, and RCP 8.5, respectively, compared to baseline (Figure 7d).
4. Discussion
Climate change is already ongoing and more change is expected. Climate change mitigation is thus, and will continue to be, a major concern for human beings in the next decades [30,43]. Several studies have demonstrated the essential role of maintaining and planting trees as a way of tackling climate change [9,18,44]. However, there were still debates on whether the benefits of CO fertilizer effects on GPP and NPP were offset by the negative influences of increased temperatures and changes in precipitation, such as heat stress and drought [45,46,47]. Elevated temperature reduced soil moisture and triggered stomatal closure due to increases in transpiration, leading to negative impacts on the growth of Pinus densiflora, which could be compensated by elevated CO, as shown in free air CO enrichment (FACE) studies [16,48,49,50]. In this study, to explore interactions between climate change and forests, we studied separately and in combination the impacts of climate change on the growth of Pinus densiflora for the case of a research forest in South Korea. Our results demonstrated that the stimulated photosynthetic CO fixation and water use efficiency of Pinus densiflora due to elevated CO outweighed temperature and precipitation-driven decreases in GPP and NPP. We also found that, at the study site, increases in the GPP and NPP of Pinus densiflora were modeled as climate change scenarios became severe. These results indicated that Pinus densiflora could serve as a carbon buffer against climate change.
Soil NO flux and nitrogen leaching have been important concerns associated with climate change [30,51]. This is mainly because NO has, on an equivalent mass basis, a greenhouse gas 300 times more potent than CO, although the concentration of atmospheric NO is much lower than that of CO. Nitrogen leaching also causes serious environmental damage, such as infant methemoglobinemia and eutrophication [30,52,53]. Several studies have noted that increases in precipitation and temperature would lead to increases in soil NO emissions and nitrogen leaching due to enhanced subsurface water flux and organic matter decomposition, respectively [54,55]. In line with previous studies, our results also showed that soil NO emission and nitrogen leaching would reduce as the intensity of climate change scenarios increased. Elevated atmospheric CO stimulated the growth of Pinus densiflora and thus increased nitrogen uptake, leading to a decrease in soil inorganic nitrogen.
Previous studies noted that changes in precipitation and temperature due to climate change resulted in increases in evapotranspiration [56,57,58]. Improved soil water availability and molecule kinetic energy due to warming led to an increase in evapotranspiration rates. In line with the findings, our results also showed that elevated atmospheric CO decreased evaporation, but increased transpiration. The elevated CO stimulated the growth of Pinus densiflora, leading to increases in water uptake and thus decreases in soil moisture available for evaporation. Although water loss through evapotranspiration increased under climate change, we found improvements in the water use efficiency of Pinus densiflora induced by elevated CO-induced stomatal closure.
There are still debates on whether planting and maintaining trees will act as a pivotal role in mitigating climate change [18,23,24]. Although forest management could reduce atmospheric CO through photosynthesis and sequestrate carbon in the soil, the effects of changes in albedo and cloud cover induced by tree planting would offset the benefits of reducing the atmospheric concentration of CO [43]. It has been reported that the benefits of forest management to mitigate climate change are site-specific, depending on local ecological and climate conditions [10,11,44]. These intertwined processes were not considered in this study and might be thus dealt with together to further confirm whether trees have a carbon-absorbing capacity under climate change. The results obtained in this study are dependent on the parameters and structures of the model. Further numerical and experimental research is thus required to evaluate the uncertainties of the modeled results.
5. Conclusions
In this study, we examined the growth of Pinus densiflora under climate change for the case of the Gwangneung Experimental Forest, South Korea using a coupled ecohydrological and biogeochemical model, ecosys. We found that the most dominant tree species in South Korea, Pinus densiflora, could act as a nature-based solution to mitigate climate change by increases in GPP, NPP, and water use efficiency and decreases in soil NO emission and nitrogen leaching. That is, maintaining Pinus densiflora may have great potential to aid climate change mitigation by absorbing greenhouse gas and could be considered to be an environmentally friendly practice to mitigate climate change. To extend our results, we recommend that short- and long-term regional simulations and analyses be conducted to further assess the growth of Pinus densiflora under climate change.
Author Contributions
Conceptualization and formal analysis, D.K.W.; writing–original draft preparation, D.K.W., W.D.; writing–review and editing, D.K.W. All authors have read and agreed to the published version of the manuscript.
Funding
This research was supported by the Bisa Research Grant of Keimyung University in 2020.
Institutional Review Board Statement
Not applicable.
Informed Consent Statement
Not applicable.
Data Availability Statement
Not applicable.
Acknowledgments
This research was supported by the Bisa Research Grant of Keimyung University in 2020.
Conflicts of Interest
The authors declare no conflict of interest.
References
- Kemp, D.B.; Eichenseer, K.; Kiessling, W. Maximum rates of climate change are systematically underestimated in the geological record. Nat. Commun. 2015, 6, 8890. [Google Scholar] [CrossRef] [Green Version]
- Williams, I.N.; Torn, M.S.; Riley, W.J.; Wehner, M.F. Impacts of climate extremes on gross primary production under global warming. Environ. Res. Lett. 2014, 9, 094011. [Google Scholar] [CrossRef] [Green Version]
- Gaertner, B.A.; Zegre, N.; Warner, T.; Fernandez, R.; He, Y.; Merriam, E.R. Climate, forest growing season, and evapotranspiration changes in the central Appalachian Mountains, USA. Sci. Total Environ. 2019, 650, 1371–1381. [Google Scholar] [CrossRef]
- Haag, I.; Jones, P.D.; Samimi, C. Central Asia’s Changing Climate: How Temperature and Precipitation Have Changed across Time, Space, and Altitude. Climate 2019, 7, 123. [Google Scholar] [CrossRef] [Green Version]
- Min, S.K.; Son, S.W.; Seo, K.H.; Kug, J.S.; An, S.I.; Choi, Y.S.; Jeong, J.H.; Kim, B.M.; Kim, J.W.; Kim, Y.H.; et al. Changes in weather and climate extremes over Korea and possible causes: A review. Asia-Pac. J. Atmos. Sci. 2015, 51, 103–121. [Google Scholar] [CrossRef]
- Im, E.S.; Thanh, N.X.; Kim, Y.H.; Ahn, J.B. 2018 summer extreme temperatures in South Korea and their intensification under 3 °C global warming. Environ. Res. Lett. 2019, 14, 094020. [Google Scholar] [CrossRef]
- Korea Meteorological Administration. Annual Report for 2018 Extreme Climate; Korea Meteorological Administration: Seoul, Korea, 2019; pp. 1–198.
- Bax, V.; Castro-Nunez, A.; Francesconi, W. Assessment of Potential Climate Change Impacts on Montane Forests in the Peruvian Andes: Implications for Conservation Prioritization. Forests 2021, 12, 375. [Google Scholar] [CrossRef]
- Camarero, J.J.; Valeriano, C.; Gazol, A.; Colangelo, M.; Sanchez-Salguero, R. Climate Differently Impacts the Growth of Coexisting Trees and Shrubs under Semi-Arid Mediterranean Conditions. Forests 2021, 12, 381. [Google Scholar] [CrossRef]
- Fibbi, L.; Moriondo, M.; Chiesi, M.; Bindi, M.; Maselli, F. Impacts of climate change on the gross primary production of Italian forest. Ann. For. Sci. 2019, 79, 59. [Google Scholar] [CrossRef]
- Kim, J.S.; Son, C.Y.; Moon, Y.I.; Lee, J.H. Seasonal rainfall variability in Korea within the context of different evolution patterns of the central Pacific El Nino. J. Water Clim. Chang. 2017, 8, 412–422. [Google Scholar] [CrossRef]
- Byun, J.G.; Lee, W.K.; Kim, S.H.; Choi, J.K.; Lee, Y.J. The Relationship Between Tree Radial Growth and Topographic and Climatic Factors in Red Pine and Oak in Central Regions of Korea. J. Korean Soc. For. Sci. 2010, 99, 908–913. [Google Scholar]
- Choung, Y.; Lee, J.; Cho, S.; Noh, J. Review on the succession process of Pinus densiflora forests in South Korea: Progressive and disturbance-driven succession. J. Ecol. Environ. 2020, 44, 16. [Google Scholar] [CrossRef]
- Lim, J.H.; Shin, J.H.; Jin, G.Z.; Chun, J.H.; Oh, J.S. Forest Stand Structure, Site Characteristics and Carbon Budget of the Kwangneung Natural Forest in Korea. Korean J. Agric. For. Meteorol. 2003, 5, 101–109. [Google Scholar]
- Chun, J.H.; Lee, C.B. Assessing the Effects of Climate Change on the Geographic Distribution of Pinus densiflora in Korea using Ecological Niche Model. Korean J. Agric. For. Meteorol. 2013, 15, 219–233. [Google Scholar] [CrossRef]
- Kim, M.; Lee, W.K.; Nam, K.; Yu, H.; Choi, S.E.; Kim, C.G. Estimating Stand Volume Pinus densiflora Forest Based on Climate Change Scenario in Korea. J. Korean For. Soc. 2014, 103, 105–112. [Google Scholar] [CrossRef] [Green Version]
- Byun, J.G.; Lee, W.K.; Kim, M.; Kwak, D.A.; Kwak, H.; Park, T.; Byun, W.H.; Son, Y.; Choi, J.K.; Lee, Y.J.; et al. Radial growth response of Pinus densiflora and Quercus spp. to topographic and climatic factors in South Korea. J. Plant Ecol. 2013, 6, 380–392. [Google Scholar] [CrossRef] [Green Version]
- Popkin, G. How much can forests fight climate change? Nature 2019, 565, 280–282. [Google Scholar] [CrossRef] [PubMed] [Green Version]
- Tor-ngern, P.; Leksungnoen, N. Investigating carbon dioxide absorption by urban trees in a new park of Bangkok, Thailand. BMC Ecol. 2020, 20, 2020. [Google Scholar] [CrossRef] [Green Version]
- Nunes, L.J.; Meireles, C.I.; Gomes, C.J.P.; Ribeiro, N.M.A. Forest Contribution to Climate Change Mitigation: Management Oriented to Carbon Capture and Storage. Climate 2020, 8, 21. [Google Scholar] [CrossRef] [Green Version]
- Pan, Y.; Birdsey, R.A.; Fang, J.; Houghton, R.; Kauppi, P.E.; Kurz, W.A.; Phillips, O.L.; Shvidenko, A.; Lewis, S.L.; Canadell, J.G.; et al. A Large and Persistent Carbon Sink in the World’s Forests. Science 2011, 333, 988–993. [Google Scholar] [CrossRef] [Green Version]
- Bonan, G.B. Forests and Climate Change: Forcings, Feedbacks, and the Climate Benefits of Forests. Science 2008, 320, 1444–1449. [Google Scholar] [CrossRef] [Green Version]
- Xiao, J.L.; Zeng, F.; He, Q.L.; Yao, Y.X.; Han, X.; Shi, W.Y. Responses of Forest Carbon Cycle to Drought and Elevated CO2. Atmosphere 2021, 12, 212. [Google Scholar] [CrossRef]
- Konapala, G.; Mishra, A.K.; Wada, Y.; Mann, M.E. Climate change will affect global water availability through compounding changes in seasonal precipitation and evaporation. Nat. Commun. 2020, 11, 3044. [Google Scholar] [CrossRef]
- Yoon, T.K.; Noh, N.J.; Chung, H.; Yang, A.R.; Son, Y. Soil Nitrogen Transformations and Availability in Upland Pineand Bottomland Alder Forests. Forests 2015, 6, 2941–2958. [Google Scholar] [CrossRef] [Green Version]
- Noh, N.J.; Kim, C.; Bae, S.W.; Lee, W.K.; Yoon, T.K.; Muraoka, H.; Son, Y. Carbon and nitrogen dynamics in a Pinus densiflora forest with low and high stand densities. J. Plant Ecol. 2013, 6, 368–379. [Google Scholar] [CrossRef] [Green Version]
- Hengl, T.; de Jesus, J.M.; Heuvelink, G.B.M.; Gonzalez, M.R.; Kilibarda, M.; Blagotic, A.; Shangguan, W.; Wright, M.N.; Geng, X.; Bauer-Marschallinger, B.; et al. SoilGrids250m: Global gridded soil information based on machine learning. PLoS ONE 2017, 12, e0169748. [Google Scholar] [CrossRef] [Green Version]
- Saxton, K.E.; Rawls, W.J. Soil Water Characteristic Estimates by Texture and Organic Matter for Hydrologic Solutions. Soil Sci. Soc. Am. J. 2006, 70, 1569–1578. [Google Scholar] [CrossRef] [Green Version]
- Yun, S.J.; Chun, J. Long-term ecological research on Korean forest ecosystems: The current status and challenges. Ecol. Res. 2018, 33, 1289–1302. [Google Scholar] [CrossRef]
- Woo, D.K.; Riley, W.J.; Wu, Y. More Fertilizer and Impoverished Roots Required for Improving Wheat Yields and Profits under Climate Change. Field Crop. Res. Revis. 2020, 249, 107756. [Google Scholar] [CrossRef]
- Woo, D.K.; Riley, W.J.; Paez-Garcia, A.; Marklein, A.R.; Mekonnen, Z.A.; Liu, X.; Ma, X.F.; Blancaflor, E.; Wu, Y. Impoverishing roots will improve wheat yield and profitability through increased water and nitrogen use efficiencies. JGR Biogeosci. 2021, 126, e2020JG005829. [Google Scholar] [CrossRef]
- Grant, R.F.; Mekonnen, Z.A.; Riley, W.J.; Wainwright, H.M.; Graham, D.; Torn, M.S. Mathematical Modelling of Arctic Polygonal Tundra with Ecosys: 1. Microtopography Determines How Active Layer Depths Respond to Changes in Temperature and Precipitation. JGR Biogeosci. 2017, 122, 3161–3171. [Google Scholar] [CrossRef]
- Mekonnen, Z.A.; Riley, W.J.; Grant, R.F. Accelerated nutrient cycling and increased light competition will lead to 21st century shrub expansion in North American Arctic tundra. J. Geophys. Res. Biogeosci. 2018, 123, 1683–1701. [Google Scholar] [CrossRef]
- Grant, R.F. A Review of the Canadian Ecosystem Model Ecosys; CRC Press: Boca Raton, FL, USA, 2001. [Google Scholar]
- Grant, R.F.; Jarvis, P.G.; Massheder, J.M.; Hale, S.E.; Moncrieff, J.B.; Rayment, M.; Scott, S.L.; Berry, J.A. Controls on carbon and energy exchange by a black spruce-moss ecosystem: Testing the mathematical model Ecosys with data from the BOREAS Experiment. Glob. Biogeochem. Cycles 2001, 15, 129–147. [Google Scholar] [CrossRef] [Green Version]
- Grant, R.F. Nitrogen mineralization drives the response of forest productivity to soil warming: Modelling in Ecosys Vs. Meas. Harvard Soil Heat. Exp. Ecol. Model. 2014, 288, 38–46. [Google Scholar] [CrossRef]
- Schaefer, K.; Schwalm, C.R.; Williams, C.; Arain, M.A.; Barr, A.; Chen, J.M.; Davis, K.J.; Dimitrov, D.; Hilton, T.W.; Hollinger, D.Y.; et al. A model-data comparison of gross primary productivity: Results from the North American Carbon Program site synthesis. J. Geophys. Res. 2012, 117, G03010. [Google Scholar] [CrossRef] [Green Version]
- Grant, R.F.; Black, T.A.; Jassal, R.S.; Bruemmer, C. Changes in net ecosystem productivity and greenhouse gas exchange with fertlization of Douglas fir: Mathematical modeling in ecosys. J. Geophys. Res. 2010, 115, G04009. [Google Scholar] [CrossRef] [Green Version]
- Fatichi, S.; Ivanov, V.Y.; Caporali, E. Simulation of future climate scenarios with a weather generator. Adv. Water Resour. 2010, 34, 448–467. [Google Scholar] [CrossRef]
- Grant, R.F. Modeling topographic effects on net ecosystem productivity of boreal black spruce forests. Tree Physiol. 2004, 24, 1–18. [Google Scholar] [CrossRef] [PubMed]
- Grant, R.F.; Barr, A.G.; Black, T.A.; Gaumont-Guay, D.; Iwashita, H.; Kidson, J.; McCaughey, H.; Morgenstern, K.; Murayama, S.; Nesic, Z.; et al. Net ecosystem productivity of boreal jack pine stands regenerating from clearcutting under current and future climates. Glob. Chang. Biol. 2007, 13, 1423–1440. [Google Scholar] [CrossRef]
- Welegedara, N.P.Y.; Grant, R.F.; Quideau, S.A.; Gupta, S.D. Modelling nitrogen mineralization and plant nitrogenuptake as affected by reclamation cover depth in reclaimedupland forestlands of Northern Alberta. Biogeochemistry 2020, 149, 293–315. [Google Scholar] [CrossRef]
- Luyssaert, S.; Marie, G.; Valade, A.; Chen, Y.Y.; Djomo, S.N.; Ryder, J.; Otto, J.; Naudts, K.; Lanso, A.S.; Ghattas, J.; et al. Trade-offs in using European forests to meet climate objectives. Nature 2018, 562, 259–262. [Google Scholar] [CrossRef]
- Frenne, P.D.; Lenoir, J.; Luoto, M.; Scheffers, B.R.; Zellweger, F.; Aalto, J.; Ashcroft, M.B.; Christiansen, D.M.; Decocq, G.; Pauw, K.D.; et al. Forest microclimates and climate change: Importance, drivers and future research agenda. Glob. Chang. Biol. 2021, 27, 2279–2297. [Google Scholar] [CrossRef]
- Fang, O.; Wang, Y.; Shao, X. The effect of climate on the net primary productivity (NPP) of Pinus koraiensis in the Changbai Mountains over the past 50 years. Trees 2016, 30, 281–294. [Google Scholar] [CrossRef]
- Sun, B.; Zhao, H.; Wang, X. Effects of drought on net primary productivity: Roles of temperature, drought intensity, and duration. Chin. Geogr. Sci. 2016, 26, 270–282. [Google Scholar] [CrossRef] [Green Version]
- Ngoma, J.; Braakhekke, M.C.; Kruijt, B.; Moors, E.; Supit, I.; Speer, J.H.; Vinya, R.; Leemans, R. Modelling the response of net primary productivity of the Zambezi teak forests to climate change along a rainfall gradient in Zambia. Biogeosciences 2019, 16, 3853–3867. [Google Scholar] [CrossRef] [Green Version]
- Ainsworth, E.A.; Long, S.P. What have we learned from 15 years of free-air CO2 enrichment (FACE)? A meta-analytic review of the responses of photosynthesis, canopy properties and plant production to rising CO2. New Phytol. 2005, 165, 351–371. [Google Scholar] [CrossRef] [PubMed]
- Norby, R.J.; Zak, D.R. Ecological Lessons from Free-Air CO2 Enrichment (FACE) Experiments. Annu. Rev. Ecol. Evol. Syst. 2011, 42, 181–203. [Google Scholar] [CrossRef] [Green Version]
- Sperry, J.S.; Venturas, M.D.; Todd, H.N.; Trugman, A.T.; Anderegg, W.R.L.; Wang, Y.; Tai, X. The impact of rising CO2 and acclimation on the response of US forests to global warming. Proc. Natl. Acad. Sci. USA 2019, 116, 25734–25744. [Google Scholar] [CrossRef] [PubMed]
- Del Grosso, S.J.; Parton, W.J. Climate change increases soil nitrous oxide emissions. New Phytol. 2012, 196, 327–328. [Google Scholar] [CrossRef]
- Gundersen, P.; Schmidt, I.K.; Raulund-Rasmussen, K. Leaching of nitrate from temperate forests–effects of air pollution and forest management. Can. Sci. 2006, 14, 1–57. [Google Scholar] [CrossRef]
- Woo, D.K.; Kumar, P. Role of Micro-topographic Variability on Mean Age of Soil Nitrogen in Intensively Managed Landscape. Water Resour. Res 2017, 53, 8404–8422. [Google Scholar] [CrossRef]
- Phillips, R.L.; McMillan, A.M.S.; Palmada, T.; Dando, J.; Giltrap, D. Temperature effects on N2O and N2 denitrificationend-products for a New Zealand pasture soil. N. Z. J. Agric. Res. 2015, 58, 89–95. [Google Scholar] [CrossRef]
- Geng, S.; Chen, Z.; Han, S.; Wang, F.; Zhanga, J. Rainfall reduction amplifies the stimulatory effect of nitrogen addition on N2O emissions from a temperate forest soil. Sci. Rep. 2017, 7, 43329. [Google Scholar] [CrossRef] [PubMed] [Green Version]
- Snyder, R.L.; Moratiel, R.; Zhenwei Song, A.S.; Jomaa, I. Evapotranspiration response to climate change. Acta Hortic. 2011, 922, 91–98. [Google Scholar] [CrossRef]
- Lindner, M.; Fitzgerald, J.B.; Zimmermann, N.E.; Reyerc, C.; Delzon, S.; der Maaten, E.; Schelhaas, M.J.; Lasch, P.; Eggers, J.; der Maaten-Theunissen, M.; et al. Climate change and European forests: What do we know, what are the uncertainties, and what are the implications for forest management? J. Environ. Manag. 2014, 2014, 69–83. [Google Scholar] [CrossRef] [PubMed] [Green Version]
- Hadiwijaya, B.; Pepin, S.; Isabelle, P.E.; Nadeau, D.F. The Dynamics of Transpiration to EvapotranspirationRatio under Wet and Dry Canopy Conditions in aHumid Boreal Forest. Forests 2020, 11, 237. [Google Scholar] [CrossRef] [Green Version]
Figure 1.
Observed (green) and reproduced (black) weather forcing data. A total of 50 years of hourly weather data were reproduced using a stochastic weather generator based on observations from 1986 to 2015. The 50th percentile (lines) and 5th to 95th percentile intervals (shaded areas) of the multi-year ensemble are shown for: (a) monthly precipitation, (b) monthly temperature, and (c) hourly solar radiation.

Figure 2.
Model validation: (a) predicted (gray lines) and observed (circles) GPP (RMSE = 1.6 g C m d), (b) NEE (RMSE = 1.4 g C m d), and (c) soil tmperature to a depth of 0.15 m (RMSE = 3 C) during the model validation period from 2006 to 2012. The corresponding results were presented in (d–f), respectively. The gray dashed line in (d–f) represents the 1:1 relationship.

Figure 3.
Projected (a) GPP and (b) NPP over the 50-year study period for the scenario of precipitation change alone (first column), temperature change alone (second column), CO change alone (third column), and all together (fourth column) under RCP 2.6 (blue), 4.5 (red), 6.0 (green), and 8.5 (orange) for the 2050s (from 2036 to 2065). Error bars are standard deviations. The variables at baseline, climate conditions based on the 2010s (from 1986 to 2015), are shown in dashed lines.

Figure 4.
Percent changes in projected soil for (a) CO and (b) NO over the 50-year study period for the scenario of precipitation change alone (first column), temperature change alone (second column), CO change alone (third column), and all together (fourth column) under RCP 2.6 (blue), 4.5 (red), 6.0 (green), and 8.5 (orange) for the 2050s (from 2036 to 2065) compared with baseline. Error bars and circles are standard deviations and average values, respectively.

Figure 5.
Percent changes in projected inorganic leaching at a depth of 3m compared with baseline for the scenario of (a) precipitation change alone, (b) temperature change alone, (c) CO change alone, and (d) all together under RCP 2.6 (blue), 4.5 (red), 6.0 (green), and 8.5 (orange) for the 2050s (from 2036 to 2065). Shaded areas represent the 25th to 75th percentile intervals.

Figure 6.
Projected (a) evaporation and (b) transpiration over the 50-year study period for the scenario of precipitation change alone (first column), temperature change alone (second column), CO change alone (third column), and all together (fourth column) under RCP 2.6 (blue), 4.5 (red), 6.0 (green), and 8.5 (orange) for the 2050s (from 2036 to 2065). Error bars are standard deviations. The variables at baseline, climate conditions based on the 2010s (from 1986 to 2015), are shown in dashed lines.

Figure 7.
Projected water use efficiency for the scenario of (a) precipitation change alone, (b) temperature change alone, (c) CO change alone, and (d) all together under RCP 2.6 (blue), 4.5 (red), 6.0 (green), and 8.5 (orange) for the 2050s (from 2036 to 2065) compared with baseline. Shaded areas represent the 25th to 75th percentile intervals. The variables at baseline are shown in dashed lines.


Table 1.
Climate change scenarios. Comparisons of seasonal changes in CO, precipitation (PPT), and minimum (Min) and maximum (Max) temperature (Temp) were considered under four different RCP pathways (RCP2.6, RCP4.5, RCP6.5, and RCP8.5) between the baseline in the 2010s (from 1986 to 2015) and 2050s (2036 to 2065). These data were obtained from KNMI Climate Explorer (https://climexp.knmi.nl).
| Scenario | Season | CO (ppm) | PPT (%) | Min Temp (C) | Max Temp (C) |
|---|---|---|---|---|---|
| RCP2.6 | Dec–Feb Mar–May Jun–Aug Sep–Nov | 440 | 1.04 1.06 1.04 1.03 | 1.20 1.08 1.21 1.23 | 1.22 1.14 1.28 1.24 |
| RCP4.5 | Dec-Feb Mar–May Jun–Aug Sep–Nov | 480 | 1.04 1.06 1.06 1.04 | 1.59 1.45 1.57 1.60 | 1.60 1.45 1.59 1.65 |
| RCP6.0 | Dec–Feb Mar–May Jun–Aug Sep–Nov | 485 | 1.01 1.05 1.03 1.05 | 1.38 1.19 1.18 1.35 | 1.40 1.20 1.23 1.41 |
| RCP8.5 | Dec–Feb Mar–May Jun–Aug Sep–Nov | 550 | 1.07 1.09 1.07 1.06 | 2.17 1.97 2.10 2.22 | 2.23 1.98 2.13 2.33 |
Publisher’s Note: MDPI stays neutral with regard to jurisdictional claims in published maps and institutional affiliations. |
© 2021 by the authors. Licensee MDPI, Basel, Switzerland. This article is an open access article distributed under the terms and conditions of the Creative Commons Attribution (CC BY) license (https://creativecommons.org/licenses/by/4.0/).
Share and Cite
MDPI and ACS Style
Woo, D.K.; Do, W. The Role of Forests in Climate Change Regarding Carbon, Nitrogen, and Water: A Case Study of Pinus densiflora. Water 2021, 13, 3050. https://doi.org/10.3390/w13213050
AMA Style
Woo DK, Do W. The Role of Forests in Climate Change Regarding Carbon, Nitrogen, and Water: A Case Study of Pinus densiflora. Water. 2021; 13(21):3050. https://doi.org/10.3390/w13213050
Chicago/Turabian StyleWoo, Dong Kook, and Wonseok Do. 2021. "The Role of Forests in Climate Change Regarding Carbon, Nitrogen, and Water: A Case Study of Pinus densiflora" Water 13, no. 21: 3050. https://doi.org/10.3390/w13213050
Note that from the first issue of 2016, this journal uses article numbers instead of page numbers. See further details here.