Article

Multivariate Statistical and Hydrochemical Analysis of Drinking Water Resources in Northern Cameroon Watersheds

by
Estelle Gaëlle Dammi Djimi
1,
Akebe Luther King Abia
2,3,*,
Placide Désiré Belibi Belibi
1,
Patrice Takam Soh
4,
Randy Nanga Che
5,
Julius Numbonui Ghogomu
6 and
Joseph Mbadcam Ketcha
1
1
Department of Inorganic Chemistry, University of Yaoundé I, P.O. Box 812 Yaoundé, Cameroon
2
Department of Microbiology, Venda University, Thohoyando 1950, South Africa
3
Environmental Research Foundation, Westville 3630, South Africa
4
Department of Mathematics, University of Yaoundé I, P.O. Box 812 Yaoundé, Cameroon
5
Local Materials Promotion Authority, MINRESI, P.O. Box 2396 Yaoundé, Cameroon
6
Department of Chemistry, University of Dschang, P.O. Box 067 Dschang, Cameroon
*
Author to whom correspondence should be addressed.
Water 2021, 13(21), 3055; https://doi.org/10.3390/w13213055
Submission received: 25 September 2021 / Revised: 20 October 2021 / Accepted: 24 October 2021 / Published: 1 November 2021
(This article belongs to the Section Water Quality and Contamination)

Abstract

:
Watershed pollution by natural and anthropogenic activities remains a global challenge that requires careful and prompt attention. So, identifying possible pollution sources and studying the hydrochemistry of water resources would positively affect human health, especially in resource-limited communities and their economy. Water samples were collected during the rainy season in the North (R-NO) and Adamawa (R-AD) Region communities of Cameroon and assessed for physicochemical parameters using standard methods. The data were analysed using multivariate statistical and hydrochemical methods. Principal component analysis (PCA) retained seven and six principal components explaining 77.65% (R-NO) and 72.24% (R-AD) of the total variance, respectively. The drinking water sources assessed were highly, moderately, and lightly contaminated with turbidity, PO43−, Al3+, Fe2+, Mn2+, NH4+, NO3, NO2, and electrical conductivity (EC) from surface runoff and soil erosion sources. PCA and factor analysis (PCA/FA) revealed two main groups, distinguished by natural and anthropogenic sources, responsible for water quality variations. Hierarchical cluster analysis (HCA) grouped sampling sites into three clusters: low, moderate, and high pollution areas in the R-NO and unpolluted, low, and moderate pollution areas in the R-AD. The order of dominant cations was Mg2+ > Ca2+ > K+ and HCO3 > Cl > SO42− for anions. Based on Piper diagram classification, watersheds studied were predominated by the Mg-Ca-HCO3 water type in 85% (R-NO) and 79% (R-AD) of water samples. The chemical composition of shallow and deep water was dominantly controlled by the dissolution of silicates and carbonate, reverse ion exchange, and precipitation of calcite. These results reveal that diffuse pollution predominantly impacted the study sites during the rainy season, and this should be the focus of policymakers when planning and implementing measures to protect drinking water sources, human health, and reduce water treatment costs.

1. Introduction

Source water contamination poses a public health risk and increases the cost of drinking water treatment. In 2012, among the estimated 842,000 global deaths from diarrheal disease, 43% were children under five years, and 502,000 deaths were caused by inadequate drinking water [1]. The United Nations recognises that water is at the core of socio-economic development and that non-discriminatory access to safe drinking water for the population contributes to combating poverty [2], as stipulated in the Sustainable Development Goals (SDGs) [1]. However, authorities (governmental and local) do not pay special attention to improving water management in rural areas [3], especially those located in developing countries.
In Cameroon, for example, as in many other developing countries, the water sector is not considered in the social and economic development strategy [4]. Despite abundant and diverse water resources, Cameroon’s northern regions are semi-arid and less watered, depending mainly on groundwater [5]. This region of the country is also characterised by high poverty rates, with 56% of the population living below the poor line [6]. According to the United Nations Development Programme (UNDP) in 2006, populations living in northern Cameroon were exacerbated by poverty during periods of rain due to the numerous damages it causes, including water pollution [7]. Heavy rains coupled with excessive dry surfaces have long caused overflooding in the Lagdo Dam and River Benue (the second-largest river of Cameroon) for more than 60 years, usually leading to floods that extend into Nigeria [8]. These floods negatively impact small watersheds, existing infrastructure, and water quality downstream, resulting in irrigation and drinking water sources failing to comply with existing standards [9]. According to Waarde [10], municipalities can manage smaller watershed areas in the Sanaga River (the first-largest river of Cameroon) as part of the village water supply system. Therefore, stakeholders have been invited to urgently establish a repository for technical resources on source water protection in these areas and other low-income areas in Cameroon [11].
To improve drinking water quality, there is an urgent need to adopt a precautionary approach to protect water sources [11]. Identifying water pollution sources, natural or anthropogenic, is also essential, as these affect water parameters [12]. Although scientists usually generate large data volumes from constant water sampling and analysis, improper statistical analysis of these results usually leads to the non-implementation of findings. Therefore, hydrochemical and multivariate statistical methods are two research approaches that provide helpful information for implementing such solutions. Multivariate statistical methods mainly include principal component analysis (PCA), factor analysis (FA), and hierarchical clustering analysis (HCA). The combination of PCA/FA is a dimension-reduction technique that provides quantitative and qualitative information by the most significant factors, with a simpler representation of the data and about potential pollution sources, respectively [13,14]. Aljahdali and Alhassan [15] used HCA to establish a clear relationship between stations with similar characteristics. It is essential for regions with limited water resources to use global hydrochemistry to provide appropriate information for their effective management [16]. Hydrochemistry helps to simultaneously evaluate the hydrogeochemical processes responsible for temporal and spatial changes in groundwater chemistry [17,18]. It has been shown that physicochemical parameters (e.g., temperature, pH, and turbidity) are essential for surface water quality assessment, while hydrochemical parameters (major cations and anions) are important for groundwater quality assessment [19].
Although water quality has been assessed in watersheds located in southern Cameroon using either multivariable statistical methods or hydrochemical methods or both [20,21,22,23], studies in northern Cameroon have been limited to evaluating the status of water resources. Environmental issues, such as source water protection, still lack technical solutions. This is partly because a systematic search for preventative solutions to drinking water pollution issues has not yet been addressed in the northern Cameroon watersheds, specifically the portion of the R-NO and R-AD. Moreover, no hydrochemical studies have been conducted in this study area.
Therefore, the current study focused on ground and surface water resources of the Benue, Mayo-Rey, Faro-et-Déo, Djérem, and Mbéré small watersheds. The study sought to: (1) identify the potential water pollution sources and the factors responsible for it; (2) classify the water resources according to the level of pollution; (3) describe the hydrochemical characteristics of shallow, deep, and surface water resources; (4) identify the hydrogeochemical processes which control groundwater quality in the study area. The findings of this study provide useful information that could aid the design and implementation of water resource management strategies to protect drinking water resources.

2. Materials and Methods

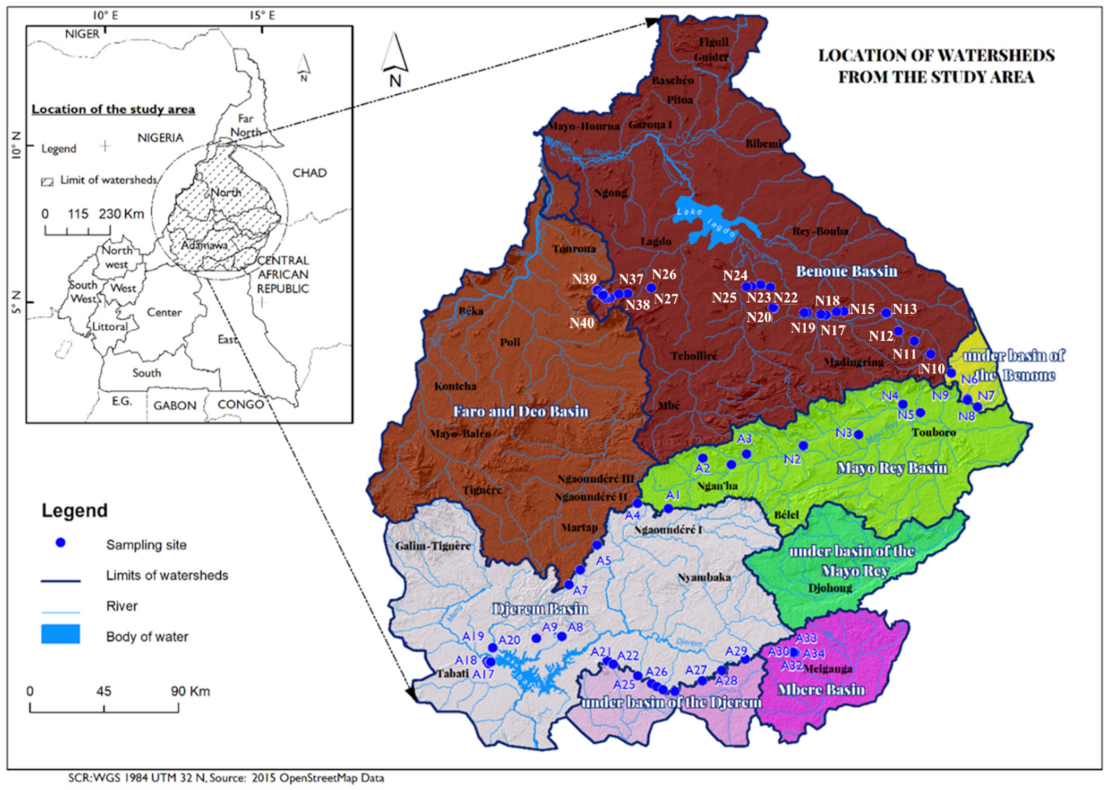
2.1. Site Description

The study area consists of the first-largest river (Sanaga basin, 133,000 km2) [23] and the second-largest river (Benue basin, 75,000 km2) in Cameroon, subdivided into the five watersheds. It is in the R-NO and R-AD, which share Mayo-Rey and Faro-et-Déo basins. These basins, together with the Benue basin in the R-NO, are found between latitudes 7°60′–8°53′ N and longitudes 13°21′–15°29′ E° (Figure 1). Meanwhile, in the R-AD, added to the Djérem and Mbéré, the basins extend between latitudes 6°30′–7°58′ N and longitudes 12°60′–14°29′ E° (Figure 1). Moreover, the southern Lake Chad watershed merges with the Mbéré basin at the Cameroon–Central African Republic border, 314 km from the source [24].

2.2. Geographical Setting

The studied watersheds are drained from the Adamawa mountains range in West Africa, stretching from south-eastern Nigeria through north-central Cameroon, with altitudes between 255 m and 909 m in the northern Adamawa Plateau and between 1000 m and 1166 m in the core of the Adamawa Plateau. The rainy season extends from mid-May to the start of September, with annual rainfall between 650–1000 mm and an annual average temperature of 28.9 °C in the R-NO [25]. However, this season extends from April to October, with annual precipitation between 1500 and 1800 mm and an annual average temperature of 22.06 °C in the R-AD [25]. Different landscapes gradually rise from the Benue plain near Garoua (altitude 180 m) towards the foot of the Adamawa cliffs in the south (altitude 600 m) [26].
In the Sanaga River, including the Djérem watershed (main tributaries in the R-AD), between 1945–2006 hydrologic year, the specific flow rate in inter-year was 14.24 L/s/km2 [24]. The volume of water flowing into the southern basin of Lake Chad (Mayo-Rey) is estimated at 3.51 km3, and in the northern Niger basin, the most watered stations are those of Poli (1.489.1 mm/year) and Tcholliré (1.308.2 mm/year), with the annual volume flow of 8.91 km3 in the Benue station [24].

2.3. Pedological, Geological and Hydrogeological Settings

Ferruginous soils predominate in the Benue basin, while in the Sanaga basin, these soils have intrusions of ferrallitic soils covering basaltic, granitic, and sedimentary rocks [27]. Ferrallitic soils found in R-AD have highly porose fine structures (50 to 60%), with very high surface permeability (under forest: 100 to 1000 mm/h) and a rapidly decreasing depth reaching 10 mm/h [27].
The watersheds studied are dominated by Precambrian basement. The basement rocks of the Ngaoundere plateau are crosscut and partially covered by numerous types of Oligocene to Pleistocene volcanic rocks with alkaline to peralkaline affinities [27]. Granitic and metamorphic rocks underlie the Mbéré basin (in the Meiganga area). These consist of primary minerals, such as banded amphibolite formed of quartz-feldspar layers alternating with amphibole-rich layers and pyroxene-amphibole-biotite granite formed of quartz, plagioclase, K-feldspar, biotite, hornblende, pyroxene, and accessory minerals, such as sphene, zircon, and apatite [28]. Mayo-Rey basin is made up of 9.1% of sedimentary formations, 21.3% of volcanic formations, and 69.6% Precambrian formations, represented by granites (majority) and migmatites (minority) [24]. The Benue basin, precisely from Touboro subdivision to Poli through Tcholliré, is dominated by a basement of rocks such as Post-Pan-African cover (sedimentary rock) and Pan-African granitoids, Pan-African orthogneisses, biotite, and biotite-hornblende gneisses [29]. Moreover, Nomo et al. [30] underlined that Tcholliré batholith is divided into metamorphic rocks (mica schists, amphibolite, orthogneisses, and migmatites) and magmatic rocks forming plutons of Tcholliré batholith including diorites, granodiorites, biotite-amphibole granites, muscovite granites, and leucogranites. Dolomite is the dominant carbonate (over calcite) at the western and upstream of the study area (southeastern Nigeria) [31].
Hydrologically, the Benue basin is constituted mainly of quaternary alluvial deposits; its tributaries are made up mainly of gravel, sand, silt, and clay [32]. This is characteristic either of poor hydraulic conductivity or a lack of water flow. The studied watersheds rely on shallow aquifers (alterites) and deeper fractured aquifers [33], with thickness ranging between 30 and 80 m [34]. The water table is not far from the soil surface in the shallow aquifers (between 10 and 20 m). As such, groundwater is stored in weathering layers of the ground [34]. These sub-surface water bodies (wells) used to be polluted by chemical and bacteriological parameters because of their connection with wastes facilities and other anthropogenic activities (livestock, agriculture) [35,36]. The borehole waters from discontinuous fissured aquifers of the basement (usually >20 m deep) are generally of good quality [23], especially in the R-AD, where there are fissured aquifers, and local aquifers with hydraulic conductivity varying between 0.012 and 1.677 m/day have been detected [37].

2.4. Ground and Surface Water Collection and Analysis

Sample collection was conducted during the moderate-wet period (towards the end of the rainy season) between September–October 2017 from five watersheds distributed in the portion of two regions of northern Cameroon (Figure 1). Deep groundwater (DGW) (R-NO = 24; R-AD = 19) and shallow groundwater (SGW) samples (R-NO = 10; R-AD = 14) were collected. Moreover, surface water (SW) samples (R-NO = 6; R-AD = 1) were collected. Samples were collected following the European guide for sampling water resources [38] into polyethylene bottles for physicochemical analysis. To preserve samples after collection, samples for cations analysis were acidified using acid (HNO3) at a pH less than 2.0 to avoid iron precipitation, as recommended [39]. Samples for anions analysis were not acidified but filtered to remove organic matter and some bacteria, which could participate in reactions such as sulphate reduction [39].
Unfiltered samples were used to measure temperature (T), pH, and electrical conductivity (EC) in situ using an electronic thermometer (E5473 Ama-digit ad 30th, Amarell, Kreuzwertheim, Germany), a HI-98100 Checker® Plus pH Tester pH meter (HANNA Instruments Deutschland GmbH, Vöhringen, Germany), and a HI-8733 Portable Multi-range Conductivity Meter (HANNA Instruments Inc., Woonsocket, RI, USA), respectively. The estimations of total dissolved solids (TDS) were based on EC through the relationship TDS (mg/L) = k × EC (μS/cm), where k is a constant of proportionality. Subsequently, the samples were transported to the laboratory, and major chemical constituents (Ca2+, Mg2+, K+, Cl, SO42−, and HCO3 (from the measure of alkalinity)) were analysed. Furthermore, NH4+, NO3, NO2, PO43−, Fe2+, Mn2+, Al3+, F, total hardness (TH), and turbidity were also analysed in the laboratory, where Ca2+, Mg2+, TH, and total alkalinity (TAC) were measured by volumetric titration methods described in the APHA manual [40]. Except for turbidity, measured in unfiltered samples using a Hach 2100N turbidimeter (Hach Company, Loveland, CO, USA), the remaining parameters were analysed using a Photometer 7500 Bluetooth® (Palintest, Beijing, China). All samples were analysed in triplicates.

2.5. Multivariate Statistical Analyses

Multivariate statistical methods were implemented using SPSS (Statistical Package for the Social Sciences) software, version 16.0 (IBM, Armonk, NY, USA). To refine the representations, factor analysis and hierarchical clustering analysis (HCA) were performed in RStudio version 3.4.0 64. Data were first centred and reduced, since the units of measurement were different. Principal component analysis (PCA)/factor analysis (FA) was also used in this study to provide information on the most meaningful parameters, which described the whole dataset, rendering data reduction with minimum loss of original information [41]. Kaiser’s criterion (eigenvalues > 1) was used to explain the total variation (%) and extract significant principal components (PCs) that accounted for a proportion of variance > 10% from twenty original parameters. These PCs were subjected to varimax rotation generating factors (FA) to reduce the contribution of variables with minor significance. The FA allowed increased visibility on the most influential parameters on water quality and defined the correlation between variables and sample points in their spatial distribution, grouped according to similar environmental characteristics. Moreover, HCA is commonly applied in many research fields for statistical data analysis and exploratory datamining [41]. HCA was computed for water quality assessment in this study to classify the waters sampled according to the pollution levels, as previously described [42]. Ward’s algorithm was used as a linkage method with square Euclidean distances to measure similar observations [43].

2.6. Reliability Checking of Chemical Data and Hydrochemical Analyses

The reliability of chemical analysis (concentrations expressed in meq/L) was checked for accuracy by calculating the percent charge balance error (%CBE) [44] (Formula (6); see Supplementary Table S1). Water analysis of laboratories considers a charge-balance error of less than 5% (%E ≤ ±5%) to be good or acceptable [45], conforming to the reliability of the analytical result. However, sometimes up to 10% (%E ≤ ±10%) is acceptable in diluted water (such as rainwater) and salt water, due to some errors during measurement [46,47]. The relative errors (%CBE) were calculated by the Aquachem software (version 2014.2) developed by Schlumberger, and samples N2, N5, N11, N16, N17, N27, A5, A7, A11, and A21 (%E ≤ ±5%) and samples N4, N20, N35, N39, A4, and A10 (%E ≤ ±10%) were all acceptable. However, conclusions cannot be drawn for samples with poor charge-balance errors without conducting a hydrochemical study that provides information on the chemical composition of the water samples. Therefore, all data were used for hydrochemical analysis.
Hydrochemistry can provide an excellent indicator to identify the sources of groundwater chemistry from different aquifers [48]. Therefore, the source of solutes was studied by determining relationships between ion ratios and determining the main hydrogeochemical processes of various ions in groundwater [49]. Hydrochemical calculations and representations of significant ion relationships were plotted using Microsoft Excel version 2016; all the plots highlighting the water chemistry were generated by Aquachem software (version 2014.2). The hydrochemical formula and the criteria for categorising water are presented in the Supplementary Materials (see Supplementary Table S1).

3. Results

3.1. Multivariate Analyses

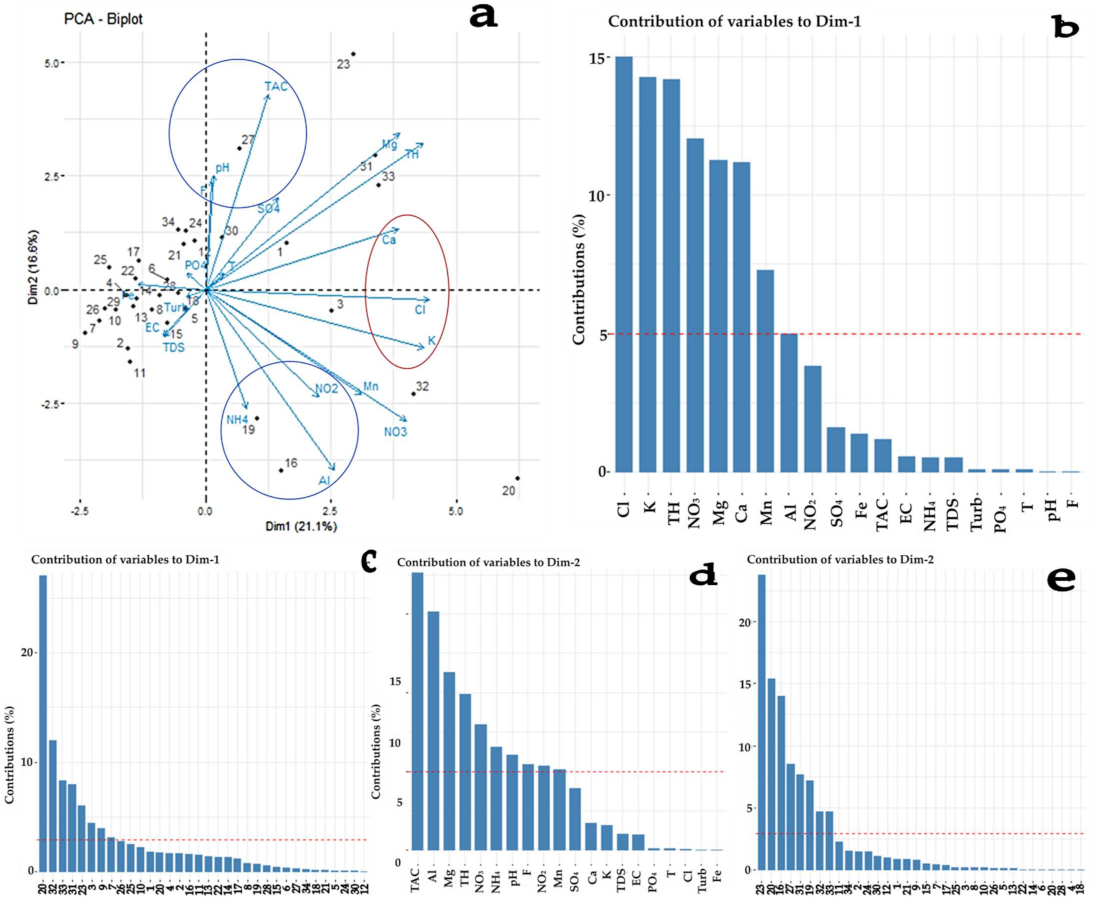
3.1.1. Principal Component Analysis/Factor Analysis (PCA/FA)

The detailed results of the physicochemical parameters are presented in the Supplementary Materials (see Supplementary Table S2). The varimax rotated factor loadings of principal components (PCs) of the water points’ physicochemical properties within watersheds are presented in Table 1 (R-NO) and Table 2 (R-AD), indicating the effect of physicochemical parameters on the quality of water resources in the study area. Varimax rotated method, together with Kaiser normalization, was used to retain the critical factors for further interpretations. Each new variable presents an association of water quality parameters influenced by the same environmental factors.
In the R-NO, seven factors with Eigenvalues >1 explained 77.65% of the total variance of the dataset. PC1 had a maximum variance and explained 17.71% of the total variance, which is highly and positively loaded on TH, Mg2+, and pH, and moderately and positively loaded on TAC and Ca2+. High and moderate loading of these variables shows that this factor is strongly related to magnesium hardness sources from rock–water interaction, specifically more the dissolution of silicate (ferromagnesian minerals) than the dissolution of carbonate. PC2 explained 12.95% of the total variance and contained strong negative loading of turbidity and Mn2+. In addition, PC2 had moderate positive loading of F and HCO3. This factor represents an increase in the amount of suspended solids influenced by the erosion of primary manganese silicate deposits rather than the dissolution of fluoride-bearing silicate minerals. Moreover, this factor, which contributes to soil erosion, contributes to diffuse pollution. PC3 explains about 12.47% of the total variance and is highly and positively loaded on NO3, NO2 and K+. This factor is initially related to the oxidation of nitrite to nitrate and, after that, the formation of potassium nitrate (KNO3), which is less soluble in water, avoiding water quality deterioration. PC4 explains about 10.98% of the total variance and represents strong positive loading of EC and TDS and moderate negative loading of Al3+. PC4 indicates mineralisation from mineral dissolution, rather than incomplete hydrolysis of tropical ferruginous soils. PC5 explains about 9.53% of the total variance and contains strong positive loading of Cl and SO42−, indicating natural inputs due to their very low concentration. CP6 explains about 7.47% of the total variance and has strong positive loading of temperature (T) and strong negative loading of PO43−. This factor shows the opposite influence between water temperature and PO43− values. PC7 explains about 6.58% of the total variance and has a strong negative charge on Fe2+. This factor indicates a source other than mineral weathering, which is probably a surface input such as soil erosion.
In the R-AD, six factors with Eigenvalues >1 explained 72.24% of the total variance of the dataset. First component PC1 explained 19.60% of the total variance and had a strong positive loading of NO3, NO2, K+, and Cl and moderate positive loading of Ca2+, Mg2+, TH, and Mn2+. PC1 represents a low concentration of nutrients influenced by natural factors such as the vegetation and hydrogeology of this area. PC2 explained 18.65% of the total variance and was highly and positively loaded on TAC, Mg2+, and TH and moderate negative loading of Mn2+. This factor represents carbonate magnesium hardness from carbonate minerals influenced by soil erosion containing primary manganese silicates deposits. PC3 explained about 11.51% of the total variance and had strong positive loading of EC and TDS and moderate positive charge of F, indicating medium mineralisation influenced by low F ions content from fluoride-bearing minerals. The remaining factors (from CP4 to CP6) explained about 8.89%, 7.07%, and 6.52% of the total variance and had strong negative loading of pH, moderate positive loading of temperature (T), and moderate positive loading of turbidity. CP4 is a sign of a reducing environment. CP5 and CP6 are related to geographical settings favourable to low chemical elements concentrations due to climate and great hydrology potential as a water tower, leading to high dilution.
Following FA, the overlay of the variable/individual graphs revealed that their scatter plots did not belong to the same space (Figure 2a and Figure 3a). These bi-plots come from the first two components, which explained about 39% (R-NO) and 37.7% (R-AD) of the total variance in the dataset. Figure 2a shows the bi-plot of 20 variables and 40 individuals during the rainy season in the R-NO. The water samples most represented and dispersed on axis one in decreasing order were N37 > N19 > N28 > N6 > N12 > N24 > N33 > N38 > N3 > N21 > N34 > N39 > N29 > N9 (Figure 2c), characterised by a high value of the variables in the same order Ca > TH > TAC > EC > TDS > Mg2+ > Al3+ > F (Figure 2b). Except for surface water N12 influenced by runoff, the convergence of the water points to axis one may be interpreted by their similar geology. On the other hand, the water points that tend to be dispersed towards axis two are N3 > N19 > N37 > N27 > N40 > N34 > N4 > N26 > N39 > N17 (Figure 2e), characterised by a high value of the variables pH > K+ > NO2 > Mn2+ > SO42− > Cl > TDS > EC (Figure 2d). This suggests that the nature of the rock highly influenced N3. Moreover, the water points represented in axis three are N37 > N34 > N40 > N13 > N19 > N12 > N7 > N27 > N23 > N14 > N18, characterised by a high value of the variables above the average: SO42− > K+> NO3 > NO2 > Turb > Cl > Fe2+ (see Supplementary Figure S1), showing interactions between surface water and groundwater.
Figure 3a shows the bi-plot of 20 variables and 34 individuals during the rainy season in the R-AD. Despite the clustering pattern, the small water samples seem dispersed towards axis one or axis two. The water samples most represented and dispersed on axis one in decreasing order were A20 > A32 > A33 > A31 > A23 > A3 > A9 > A7 > A26 (Figure 3c), characterised by a high value of the variables Cl > K+ > TH > NO3 > Mg2+ > Ca2+ > Mn2+ > Al3+ (Figure 3b). The individuals were close because the water points that they represented belonged to the same geological environment (basement zone). Moreover, they came from the same supply source (SGW), except for individuals A32, A23, A7, and A26 (DGW). The water points are dispersed towards axis two and their contributions were in decrease order A23 > A20 > A16 > A27 > A31 > A19 >A32 > A33 (Figure 3e), characterised by a high value of the variables TAC > Al3+ > Mg2+ >TH > NO3 > NH4+ > pH > F > NO2 > Mn2+ (Figure 3d), indicating the presence of high alkaline rocks. These water samples were similar regarding their geological environment (basement zone). Moreover, the water points represented in axis three are A7 > A23 > A19, characterised by a high value of variables above the average: SDT > CE > F (see Supplementary Figure S2), which suggests moderate mineralisation, mainly in sample A7.

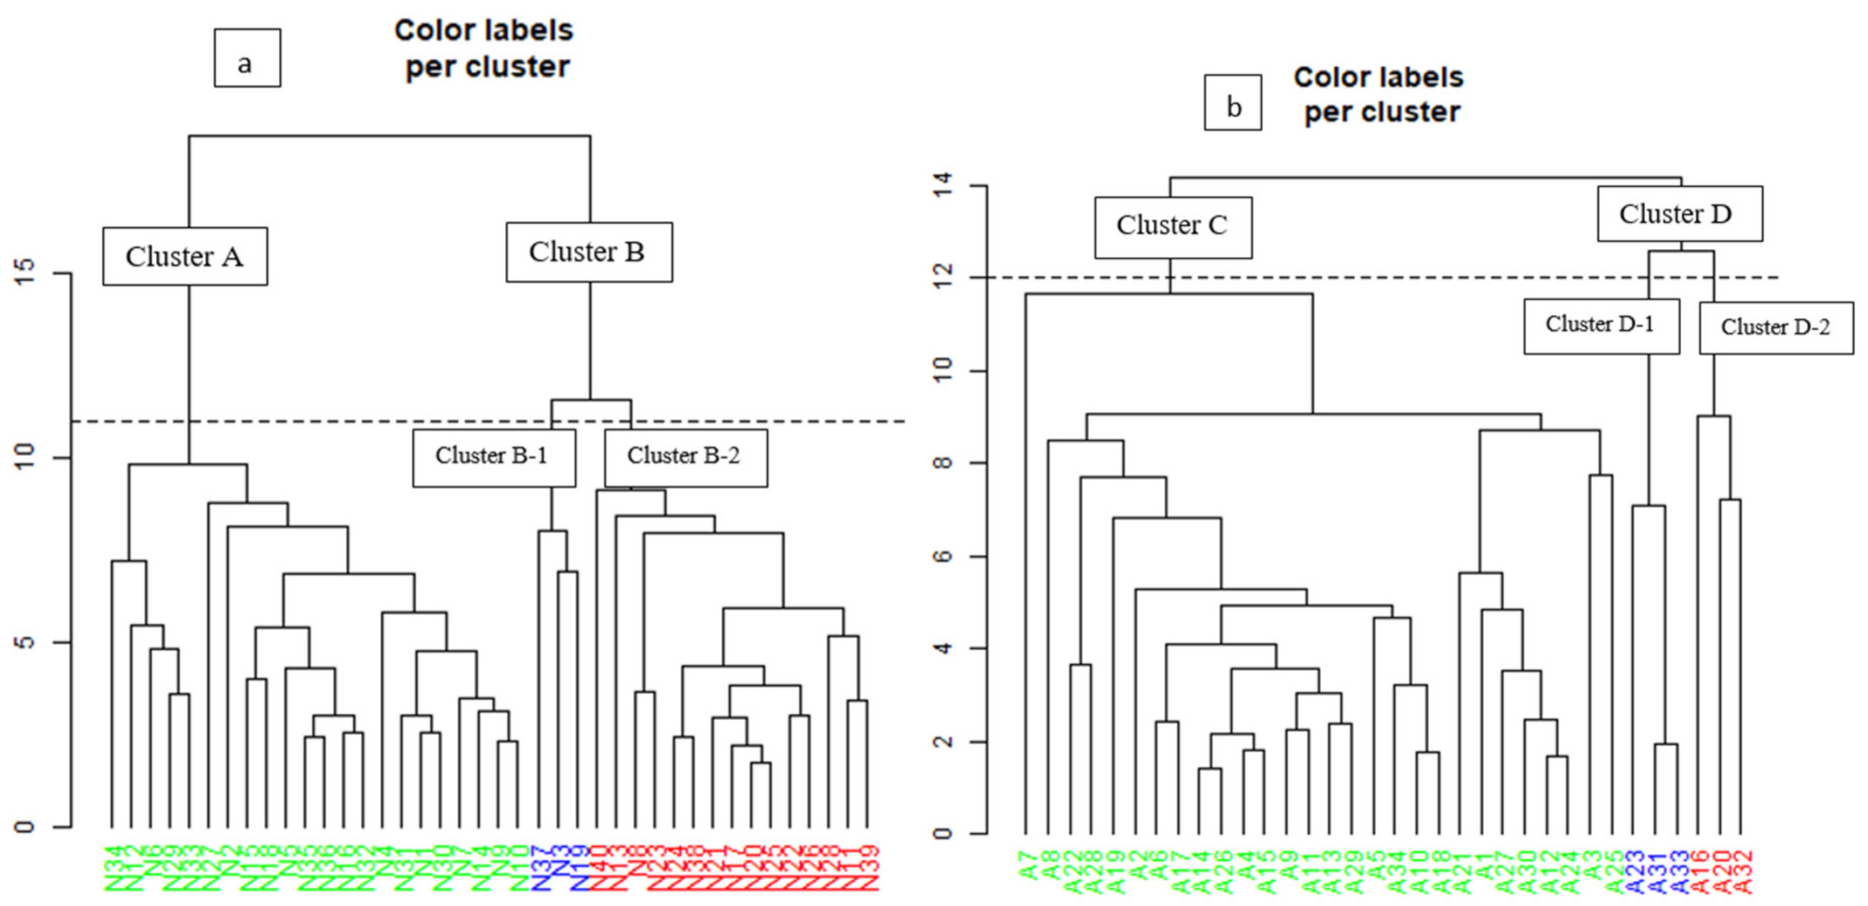
3.1.2. Hierarchical Clustering Analysis (HCA)

The HCA was carried out using surface water and groundwater samples from several classes, based on similarities within a class and dissimilarities between different classes. The results of HCA showed that 40 and 34 water points in the R-NO and the R-AD, respectively, were classified into three types of cluster groups (Figure 4a,b).
The R-NO is divided into two main groups, A and B. Cluster A is subdivided into two sub-groups, A-1 and A-2, which have similar characteristics. A-1 and A-2 were composed of the groundwaters and surface water (N34, N12, N6, N29, N33, N27, N2, N15, N18, N5, N35, N36, N16, N32, N4, N31, N1, N30, N7, N14, N9, and N10) (Figure 4a). These water points were spread over three watersheds areas (Mayo-Rey, Benue, and Faro-et-Déo). This group corresponds to high polluted waters, characterised mainly by high turbidity (N34, N12, N6, N29, N33, N15, N4, N31, N7, N14, N9, and N10) and Al3+ (only N6) values exceeding the Cameroon drinking water standard (CDWS) and World Health Organization (WHO) regulations (see Supplementary Table S2).
Cluster B in the R-NO is divided into two sub-clusters, B-1 and B-2, with different characteristics. Group B-1 includes N37, N3, and N19 (Figure 4a), a small hierarchical group located in the positive direction of axes one and two (Figure 2a). This group presents natural groundwater mineralisation, considering the low contents of the majority of correlated variables NO2, Mn2+, K+, Cl, and SO42− (see Supplementary Table S2), which oppose a slightly basic pH, suggesting a reducing environment. Group B-1 is characterised mainly by high EC values in samples N37, N3, and N19 that did not meet the CDWS standards (see Supplementary Table S2). Thus, this group represents low polluted waters.
Sub-group B-2 comprises water samples N40, N13, N8, N23, N24, N38, N21, N17, N20, N25, N22, N26, N28, N11, and N39, all of which belonged to the Benue watershed. The water points located in the negative direction along axis three (see Supplementary Figure S1) were all boreholes (N13, N21, N17, N20, N25, N22, N26), characterised by K+ and NO3. Only N13 had a NO3 value (67.2 mg/L) exceeding the CDWS and WHO norms (see Supplementary Table S2). On the other hand, the water points (N40, N8, N23, N24, N38, N28, N11, and N39) of the positive direction of axes 3 and 1 (see Supplementary Figure S1) and their proximity to each other is due to the parameters SO42−, NO2, Cl, turbidity, and Fe2+. Samples N23 and N8 were excessively turbid, while N40, N8, N23, N24, N38, N21, N20, N25, N22, N26, N28, N11, and N39 had excess Fe2+. This group represents moderately polluted waters.
In the R-AD, cluster C is subdivided into two sub-groups, C-1 and C-2, which are represented with similar characteristics, and it is constituted of water points A7 (isolated), A8, A22, A28, A19, A2, A6, A17, A14, A26, A4, A15, A9, A11, A13, A29, A5, A34, A10, A18 (grouped), A21, A1, A27, A30, A12, A24, A3, and A25 (grouped). Their coordinates were close to axis one and located in the negative direction of this axis, except A19, A1, A27, A30, and A3 (Figure 4b). Only A8 (16.1 NTU), among all samples, had a turbidity value exceeding CDWS (see Supplementary Table S2). Similarly, A18, A9, A29, A17, A34, A7, A22, and A28 had an excess of Fe2+. Therefore, all water points were divided into three R-NO watersheds (Mayo-Rey, Faro-et-Déo, and Djérem). This group corresponds to moderate polluted waters, characterised by low participation of Fe2+, PO43−, and turbidity.
Cluster D is divided into sub-groups D-1 and D-2, which represent different characteristics. The sub-group D-1 consisted of A23 (Djérem watershed), A31, and A33 (Mbéré watersheds). These three samples contained the highest Mg2+ values, exceeding the CDWS (see Supplementary Table S2). In addition, they are characterised by high TAC, Mg2+, and pH, which might originate from the dissolution of magnesium-rich minerals. Group D-1 represents unpolluted waters.
The sub-group D-2 constituted water points A16, A32 (negative direction of axis one), and A20 (positive direction of axis three) (see Supplementary Figure S2). Water sample A20 (Djérem watersheds) was characterised by CE, TDS, and F, probably meaning weak mineralisation from fluorite-bearing mineral deposits. Water samples A16 and A32, located in the Djérem and Mbéré watersheds, were characterised by low PO43− and turbidity content, but high Al3+. This sub-group represents low polluted waters.

3.2. Hydrochemical Analyses

3.2.1. Physicochemical Characteristics for Drinking Suitability

In this study, physicochemical characteristics included pH, total hardness (TH) as CaCO3, total dissolved solids (TDS), total alkalinity (TAC) as CaCO3, Langelier saturation index (LSI), and Ryznar stability index (RSI) (Table 3 and Table 4). TDS results indicated that most samples, except shallow groundwaters (N3 and N19) and deep groundwater (N37), were permissible for drinking, in accordance with the low water pollution previously shown by HCA. The alkalinity (CaCO3) of most water samples revealed that the water samples were favourable for domestic and agricultural use, except for samples N14, A9, A13, A14, A15, A16, A19, A20, A22, A26, and A29. The values of LSI > 0 and RSI ˂ 6 (Table 3 and Table 4) showed that water sampled within watersheds was supersaturated and tended to precipitate CaCO3, except the undefined (nd) water samples A1 and A22. Supersaturated water implied that pH > pHs, ranging between 6.99–8.09 (R-NO) and 6.83–8.64 (R-AD), showing slightly acidic and slightly alkaline water. In the same way, the sampled water varied from moderately hard (N32, A4, A9, A10, A11, A26) to hard (N7, N34, A2, A5, A7, A15, A16, A17, A25) and very hard for the remaining samples (59/74; 79.73%).

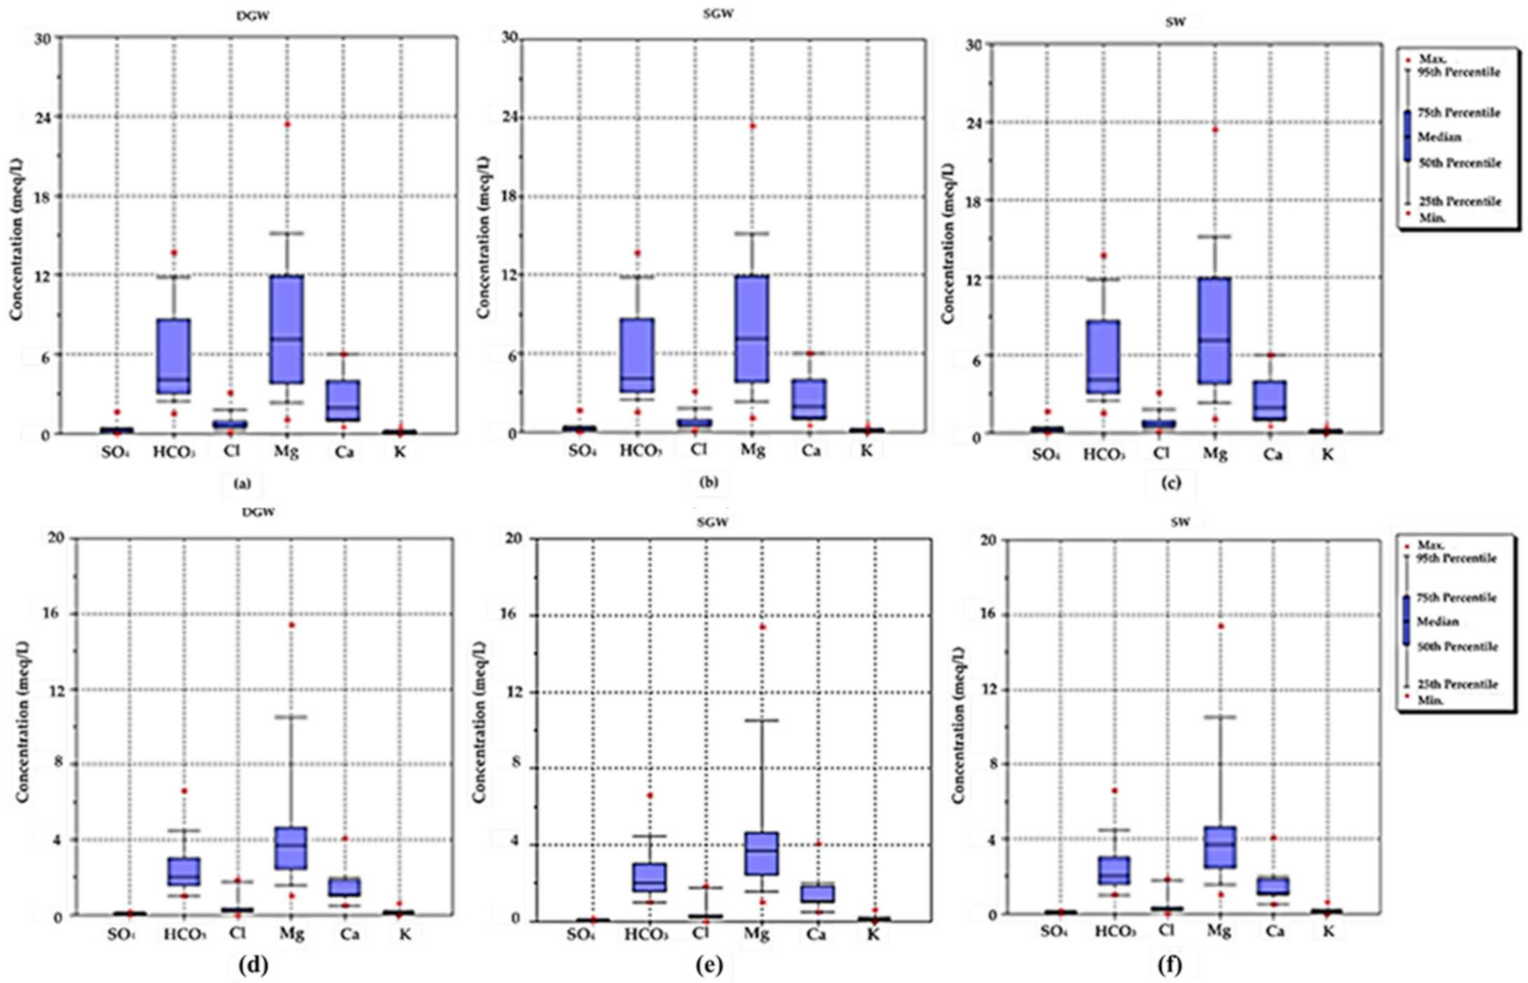
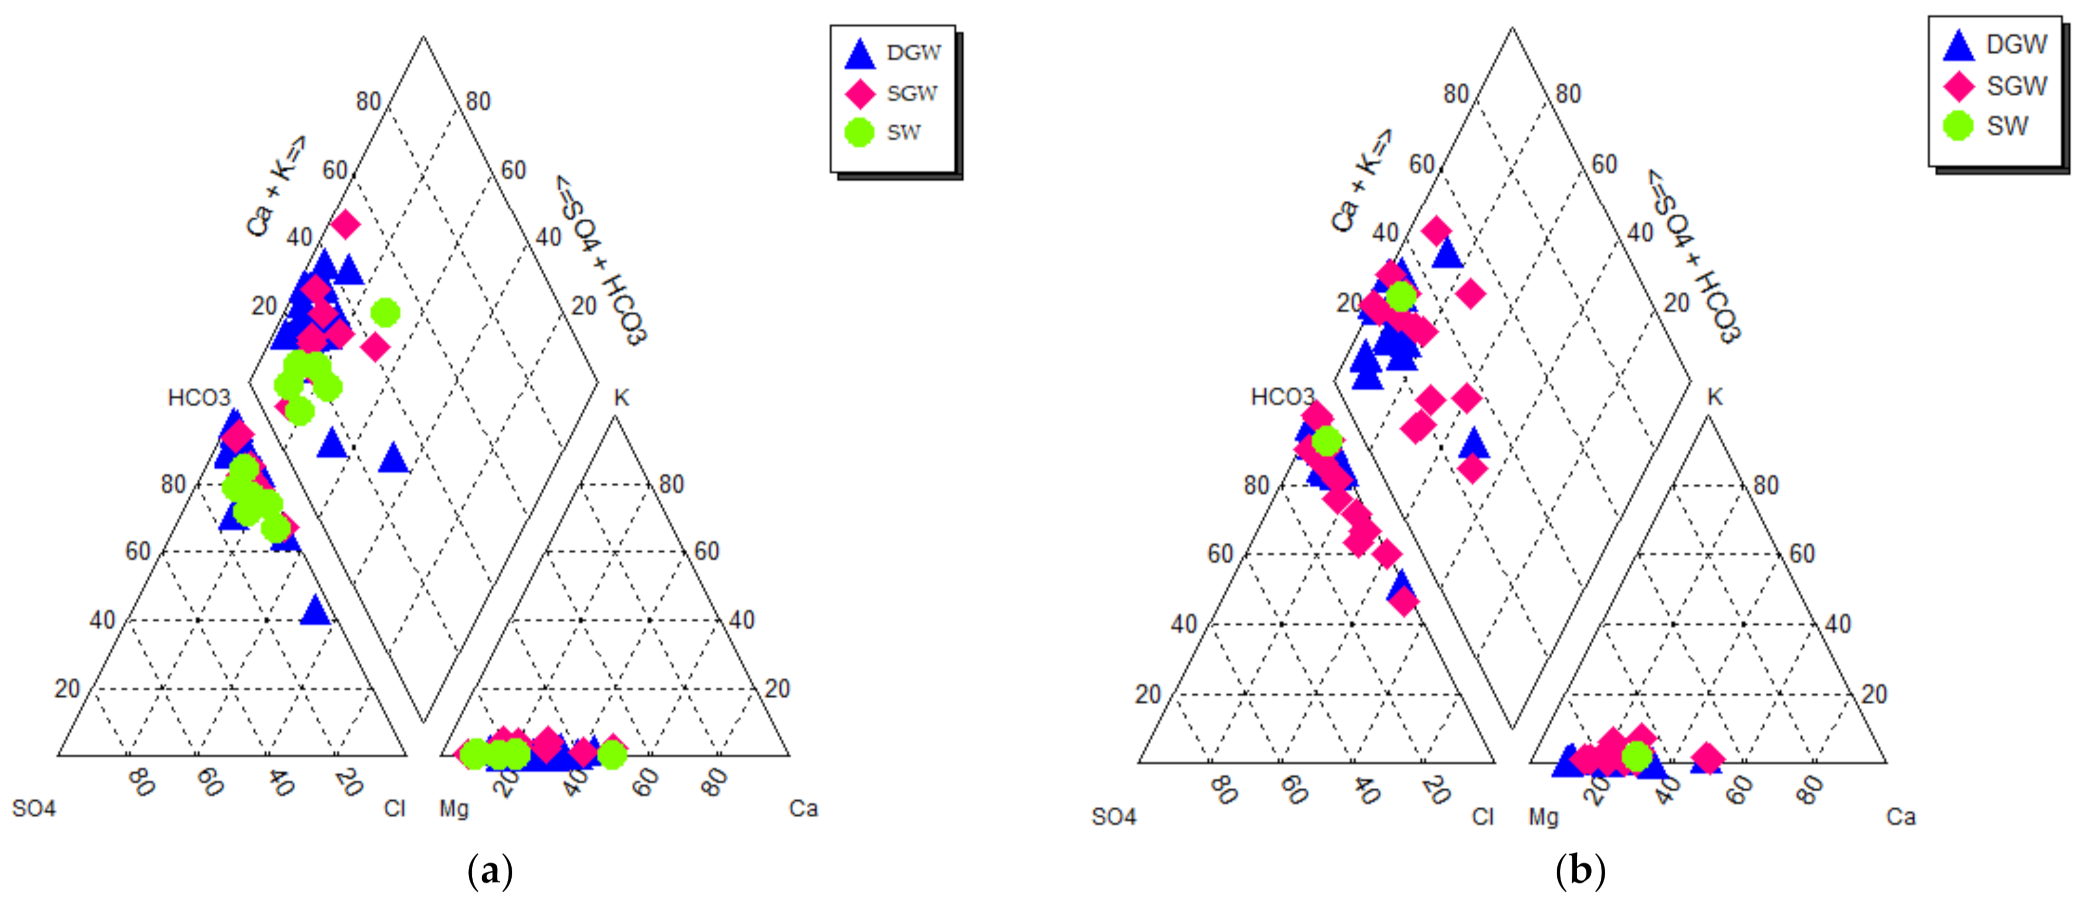
3.2.2. Hydrochemical Characteristics

Box-whisker was represented to identify the predominant cations and anions. The major ion concentrations in meq/L of DGW, SGW, and SW within watersheds in the R-NO and R-AD were in the following order for cations Mg2+ >Ca2+ > K+ and for anions HCO3 > Cl > SO42− (Figure 5).
The meq/L of the relative concentrations of major ions were plotted on Piper diagrams (Figure 6). In this hydrologic setting, stable chemical compositions described more than 50% of Mg2+ and HCO3. The ground and surface water samples (DGW, SGW, and SW) were classified into four groups of hydrochemical facies. Most samples were mainly Mg-Ca-HCO3 type (R-NO = 85% and R-AD = 79.41%), followed by minor types, Mg-HCO3 (10% in the R-NO and 8.82% in the R-AD), Mg-Ca-HCO3-Cl (2.5% in the R-NO and 8.82% in the R-AD), Mg-Ca-Cl-HCO3 (2.5% in the R-NO, N34), and Mg-Ca (2.94% in the R-AD, A20). These hydrochemical results suggest that water–rock interaction is not the only phenomenon from the dissolution processes that determines groundwater and surface water chemical composition.
Moreover, an extended Durov plot was used to better explain the hydrochemical structure of groundwater in the study area (Figure 7a,b). These plots show that there was grouping in the chemical composition of all the water resources, particularly in the R-NO. There was medium and small dispersion in the chemical composition of DGW and SGW, respectively. The cations were grouped in the Mg2+ side and anions in the HCO3 side in all water resources, due to their high concentrations. This corroborates with the result revealed by the box-whisker and Piper diagrams on the predominant cations and anions.

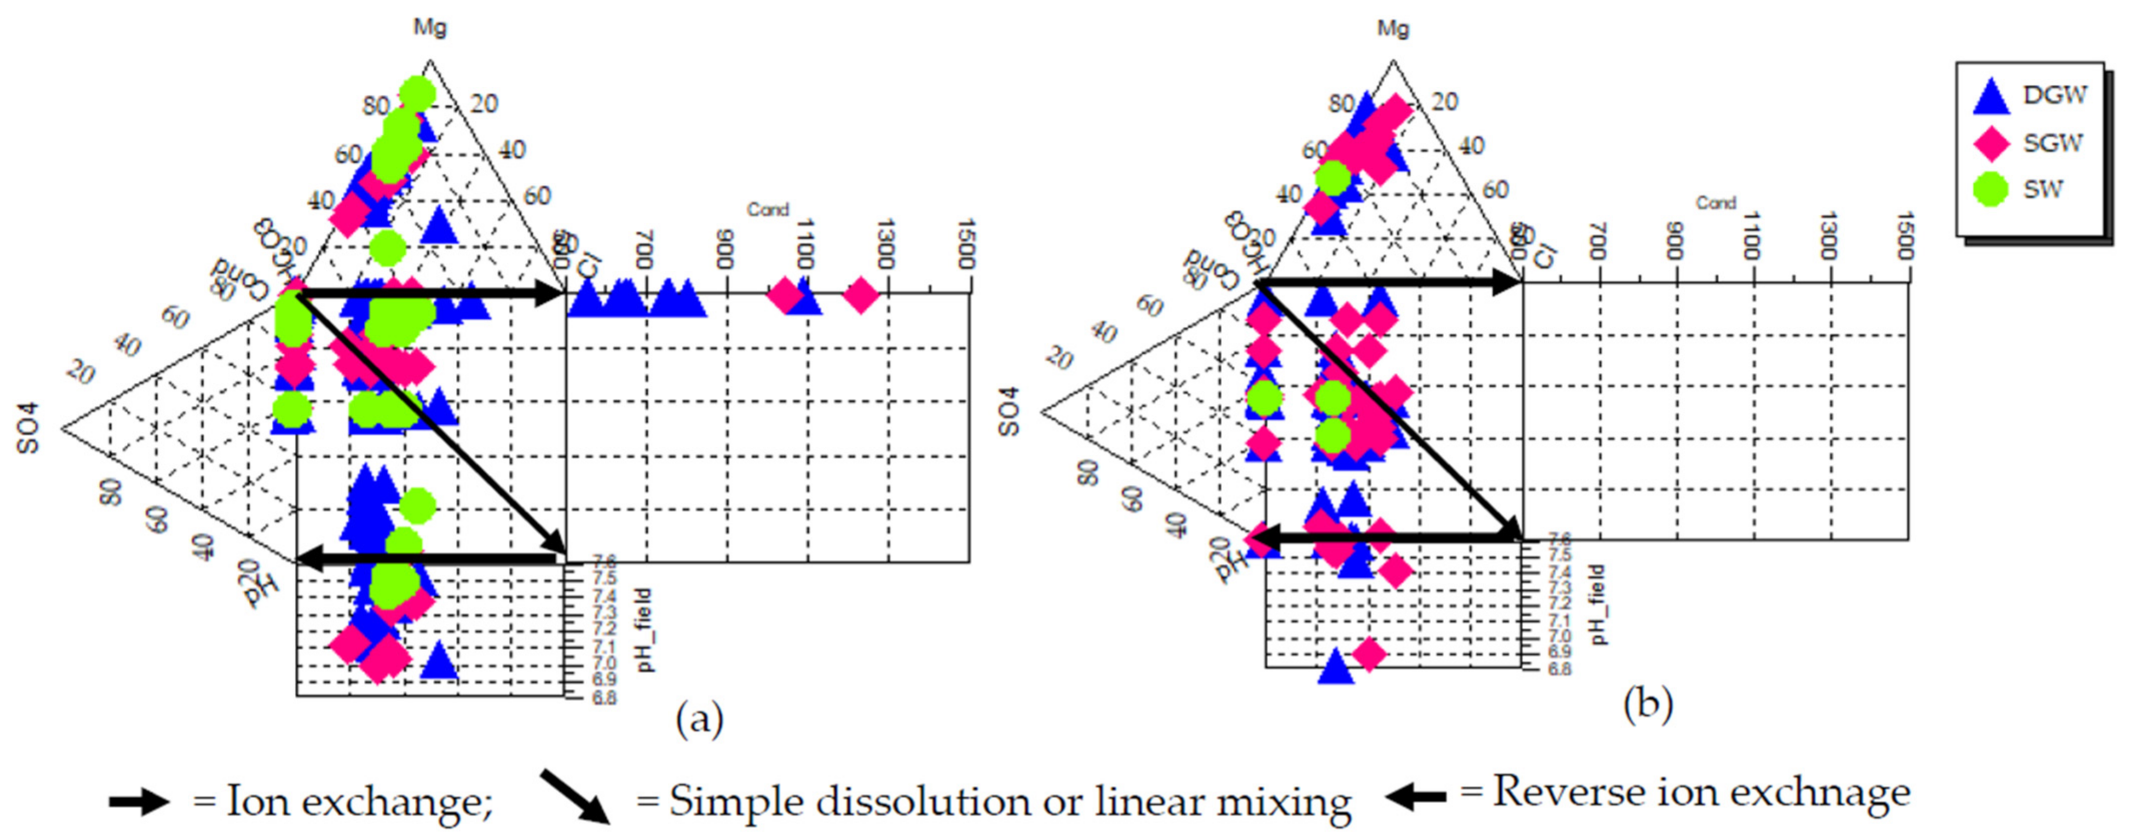
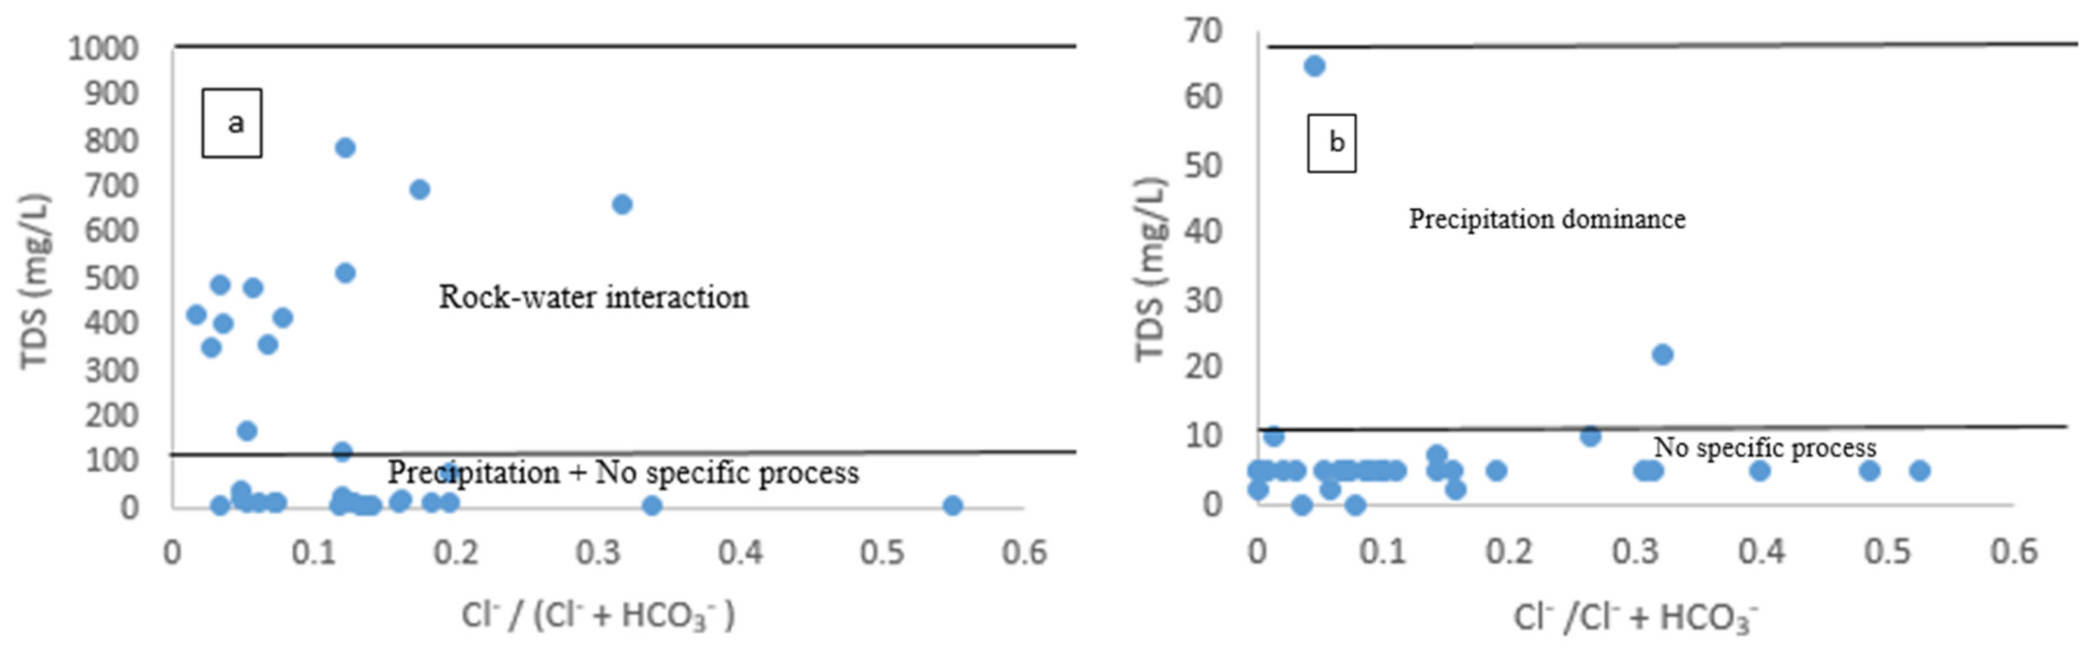
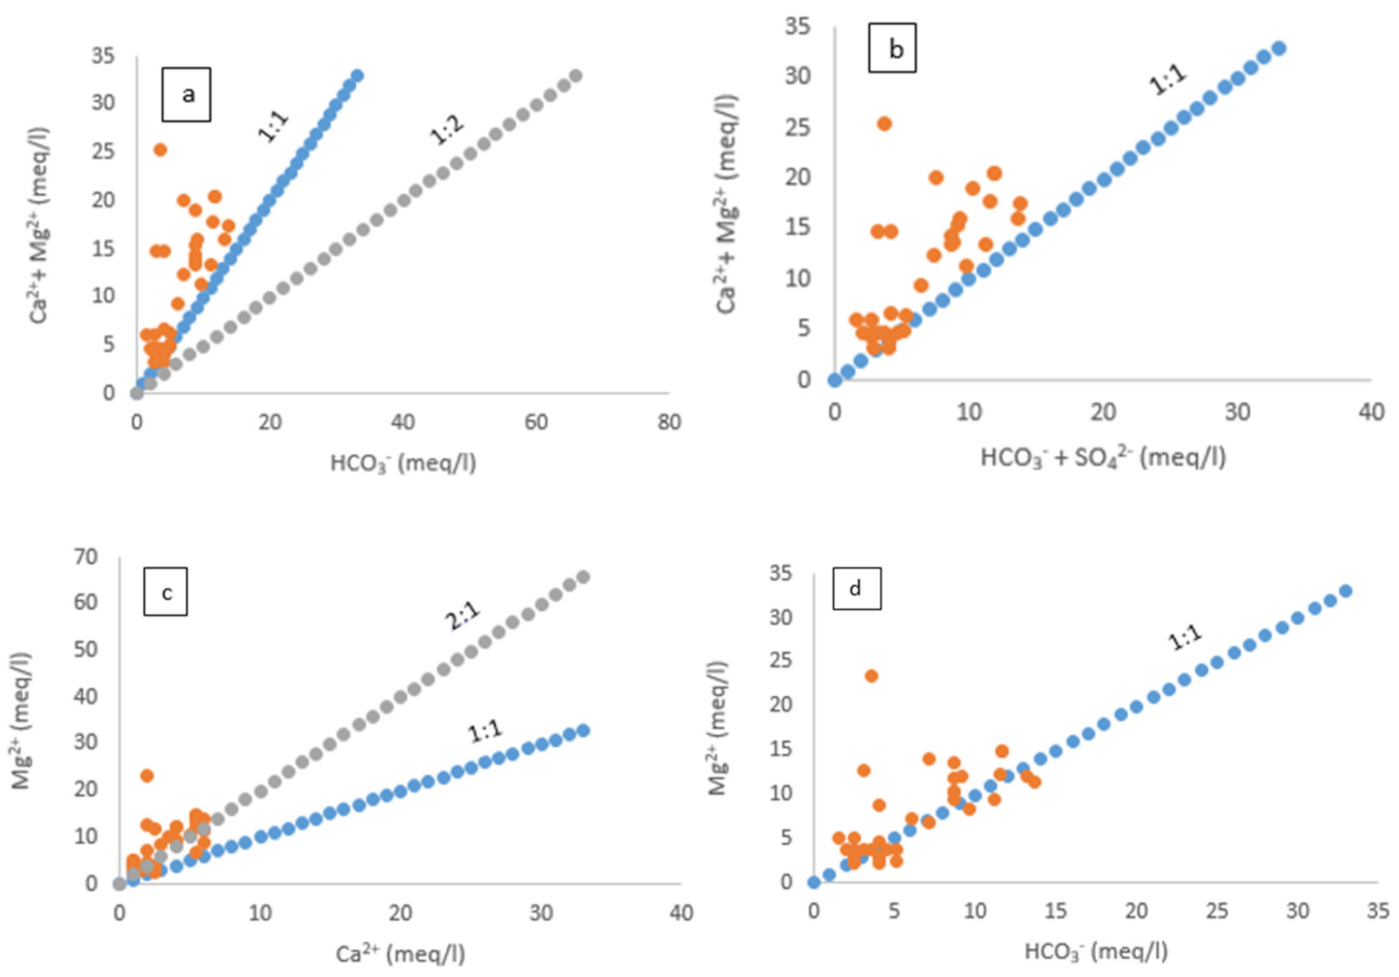
3.2.3. Hydrogeochemical Processes

In this study, one of the two diagrams proposed by Gibbs was plotted to represent groundwater samples in the watersheds of the R-NO and R-AD (Figure 8a,b, respectively). TDS vs. (Cl/ Cl + HCO3) ranged between 10 and 100 mg/L, indicating that 14 groundwater samples (N29, N35, N4, N27, N2, N39, N7, N18, N14, N13, N8, N6, N5, and N1) existed in the precipitation zone, while 13 (N16, N31, N22, N25, N38, N21, N20, N17, N28, N24, N3, N37, and N19) were classified as under the rock–water interaction. The remaining groundwater samples within the R-AD watersheds (values between 0 and 10 mg/L) had no specific mechanism controlling groundwater chemistry. Therefore, only samples A19 and A7 were located between 10 and 100 mg/L and were classified under precipitation dominance.
Based on the hydrochemical data, the major ions’ relationship was plotted to explain the mechanism controlling the local groundwater in the R-NO (Figure 9a–h) and R-AD (Figure 10a–h).

4. Discussion

4.1. Multivariate Statistical Analysis

The linear correlation coefficients between each initial variable and the selected factor are generated in Table 1 and Table 2. The strong and moderate terms applied to the load factor reflect absolute load values > 0.75 and between 0.75–0.50, respectively [50]. Therefore, the selected factors could represent potential sources of pollution, which also correspond to the main factors influencing water quality. Seven (R-NO) and six (R-AD) components explained, respectively, 77.65% and 72.24% of the total variance of the dataset and enabled the critical environmental factors that impacted water quality to be identified. Water quality within watersheds in the R-NO was affected by silicate (mainly) and carbonate minerals dissolution and soils erosion. In contrast, in the R-AD, they were affected by rock–water/soil–water interactions, cation exchange capacity (CEC) in soils, silicates weathering, carbonate dissolution, and geographical setting.
In the R-NO, axis one was mainly defined by Ca2+, TH, HCO3, EC, TDS, Mg2+, Al3+, and F (27.7%), reflecting water–rock interaction, mainly silicates dissolution and their weathering. Furthermore, it was also observed that the sampling points that contributed most (N37 and N19) were widely distant from others (Figure 2a). This suggests that these areas were protected, and groundwaters were only influenced by carbonate dissolution. Similarly, Che et al. [51] attributed high HCO3, Ca2+, Mg2+, and TDS contents (27.011% contribution rate) in groundwater of the Wan River Valley plain area to strong carbonate dissolution. Axis two was determined by the participation of the variables pH, K+, NO2, Mn2+, SO42−, and Cl with an 11.3% contribution rate. Among these parameters, only pH contributed negatively to axis two. pH fluctuations could influence microbial life, favouring the oxidoreduction of some elements, such as sulphur [52]. In a dynamic milieu such as water, many ions interact, causing reduction reactions in the soil and underground, thus the generally low concentration of K+, NO2, Mn2+, SO42−, and Cl. It could be assumed that NO3 was reduced to NO2. Moreover, MnO4 reacted with K+ to form potassium permanganate (KMnO4), which was further reduced to Mn2+. Moreover, low Cl could have originated from natural mineral deposits such as biotite, while low SO42− could also be due to the oxidation of pyrite mineral. The sampling points that contributed most to axis two (N3, N19, and N37) are almost identical for axis one. Therefore, 39% of the information extracted from the Dim1 × Dim2 (Figure 2a) reflects soil and rock minerals dissolution. A similar result was reported in Egypt during the assessment of surface water quality in the Northern Nile Delta [53]. However, axis three was defined by SO42−, K+, NO3, NO2, turbidity, Cl, and Fe2+, and its contribution rate was 8.9%. This axis reflects the natural and anthropogenic influence (livestock activities). N37 had the highest contribution on axis three, showing the reduction of iron-bearing rocks, especially pyrite, due to the uranium deposit above this sampling point (in Poli). In contrast, K+ and NO3 located in the negative direction (see Supplementary Figure S1) shows anthropogenic sources, such as animal waste. Thus, the medium content of iron-bearing minerals and anthropogenic inputs participated in the medium deterioration of water.
In the R-AD, axis one was formed by Cl, K+, TH, NO3, Mg2+, Ca2+, and Mn2+, and its contribution rate was 21.1%. The nearest variables at axis one are Ca2+, Cl, and K+, reflecting a strong interaction between these ions, leading to CaCl2 and KCl formation. Meanwhile, TH and Mg2+ strongly correlated, contrasting the nearest parameters of axis one with the nearest parameters of axis two in a positive direction, while NO3 and Mn2+ strongly correlated, opposing the parameters of axis one with the nearest parameters of axis two in a negative direction (Figure 3a). Sampling points more distant and distributed (A20 > A32 > A33 > A31 > A23 > A3 > A9 > A7) showed natural and anthropogenic sources. Sample A20 had the highest Al3+ value, exceeding CDWS and WHO norms (see Supplementary Table S2). Axis two reflected groundwater pollution affected by water infiltration from the soil and was defined by TAC, Al3+, Mg2+, TH, NO3, NH4+, pH, F, NO2, and Mn2+, and its contribution rate was 16.6%. The variables TAC and pH (positive direction) depend on the nature of the rock, while variables Al3+, NH4+, and NO2 (negative direction) originated from the soil. Sampling points A23 > A20 > A16 > A27 > A31 > A19 > A32 > A33 with decreasing scores were dispersed, indicating high alkaline water samples, notably in A23, and the influence of aluminium-bearing soil mineral on shallow groundwater. These results are understandable because, in the north-eastern part of the R-AD, rocks such as alkali granite, gneiss, and amphibole–biotite granite are made up of high alkali oxide values (K2O, Na2O, Fe2O3, MgO, CaO, but low abundance in MnO) and Al2O3 [54]. Moreover, the concentration of Al3+ (A20, A19, A16, and A32) and NH4+ (A16) in groundwater exceeded the CDWS guidelines (see Supplementary Table S2). This might mainly reflect bauxitic land in Minim-Martap and Ngaoundal, from which Al3+ (alkaline form of aluminium oxide) was moved easily because of dilution. Thus, 37.7% of the information extracted from the Dim1 × Dim2 in the R-AD (Figure 3a) highlights a precipitation phenomenon and weathering of soil minerals by carbon dioxide’s action in shallow groundwater. However, axis three was defined by a little group of variables (EC, TDS, and F); its contribution rate was 11.8% (see Supplementary Figure S2). Axis three reflects the mineralisation of water from the dissolution of fluorite-bearing minerals. The correlation of these three parameters in the positive direction shows the natural influence on groundwaters A7, A23, and A19, especially the protected deep groundwater A7 and A23. Moreover, A19 shows that after the dissolution of fluorite-bearing mineral, Al3+, a hydrolysis product of aluminium-bearing soil mineral, reacted with F and aluminium fluoride, forming precipitates. Thus, shallow groundwater A19 was recharged by surface runoff transporting exogenous and endogenous solid particles, indicating non-point sources of pollution.
Hierarchical clustering analysis (HCA), adopted using Ward’s procedure, generates approximately identical grouped clusters [55]. Our study used cluster analysis to classify the pollution level of seventy-four water samples of northern Cameroon watersheds (Figure 4). Except for river N23, all other surface waters and some groundwaters were the most polluted water resources sampled in the R-NO (Figure 4a). The pollution extended close to the Benue plain near Garoua (altitude 255 m) until Touboro district, toward the north of the R-AD (altitude 909 m) in the order: N18 > N16 > N15 > N14 > N12 > N27 > N34 > N36 > N33 > N32 > N35 > N31 > N29 > N30 > N4 > N5 > N10 > N7 > N6 > N9 > N2 > N1. Given that dramatic erosion has previously occurred in the areas near the Benue plain, most inhabitants have deserted, and the animals are constantly moving [26]. The high participation of Al3+, turbidity, and NH4+ corresponding to this group of samples, appeared in the negative direction of axis one (Figure 2a). This might reflect soil erosion, animal wastes, and traditionally constructed shallow pit latrines (point sources of pollution) and rain runoff (non-point sources of pollution). Ning et al. [56] reported that soil erosion associated with diffuse pollution is considered a land degradation process in many terrestrial environments. This fact corroborates with the land degradation combined with high population growth and strong climate fluctuations showing environmental changes, which have been found in the pedogenesis of the R-NO [57]. Rural and remote areas of Cameroon also show both point and diffuse sources of pollution as the cause of chemical and microbial qualities of alternative water type sources such as springs, wells, and streams [58]. Runoff from the Lagdo reservoir located upstream from the study area can be due to flash floods that often occur in northern Cameroon. For instance, in 1999 and 2012, the Lagdo Dam experienced serious floods, forcing water to be released from reservoir, which in turn exacerbated the flooding downstream [59]. According to Cheo et al. [60], any climate change with rising temperature in the northern Cameroon region would impact water resources either positively or negatively. During the rainy season, rainfall increases, and surface runoff could carry large amounts of debris (suspended solids and nutrients such as NH4+) from the Benue floodplain upstream to other basins (R-NO) downstream. This group indicates possible non-point and point sources of pollution.
In the R-AD, the most affected group of water samples belonged to the Mayo-Rey, Faro-et-Déo, Djérem, and Mbéré watersheds and were moderately polluted. The weak participation of turbidity, Fe2+, and PO43−, associated to this group in the negative direction of axis one (Figure 3a), is probably due to natural sources and surface runoff from the Adamawa Plateau and precipitation. The watersheds in the R-AD (827 to 1166 m altitude) are located upstream and in the core of the Adamawa Plateau area (1000 to 1400 m altitude) [61]. As such, the level of water pollutants upstream of the Adamawa Plateau (A8, A22, A28, A19, A17, A14, A15, A9, A11, A13, A29, A10, A18, A21, A27, A30, A12, A24, A3, and A25) and inner (spring A34 and protected well A1) are moderate due to the medium content of suspended particles transported from the R-NO joining north of the R-AD. Only sample A8 exceeded the CDWS and WHO norms regarding turbidity (see Supplementary Table S2). This was likely related to the particulate matter transported by rain runoff in the R-NO from the Lagdo Reservoir in September. This can further be explained by high discharges registered in August and September, where high-intensity rainfalls influenced the release of water from the Lagdo Dam along the Benue River (a peak recharge of 7140 cum/sec) in the R-NO [62]. The weak contribution of iron reflects its consideration among poor mobile elements preferentially retained in the solid residue of incongruent dissolution [63]. Then, in the core of the Adamawa Plateau, the different groundwaters (boreholes A7, A2, A6, A26, A4, and A5) were unpolluted due to the protected water table. The high capacity of ions to be dilute and remain in the acceptable limit comes from greatly the hydrologic potential of the R-AD, called “the water tower of Cameroon” (150 to 300 km wide), which feeds three of the four major watersheds [64] and recharges naturally in the deep protected aquifer. Moreover, the high porosity (50 to 60%) with very high surface permeability of the soils in the R-AD, as presented in its pedology setting, can support this result. This sufficiently justifies the moderate water pollution in this part of the study area. A previous study conducted in the Adamawa Plateau (R-AD) has shown that groundwater from captured and fractured aquifers were not only of good quality [65]. Thus, water within the watersheds in this portion of the R-AD is mostly affected by non-point source pollution, mainly runoff. This pollution source also shows how the negative effect of climate conditions can indirectly affect water resources, health, and economic development.

4.2. Hydrochemical Evaluation

4.2.1. Physicochemical Properties Related to Groundwater

The Langelier saturation index (LSI) indicates the degree of saturation of calcite (CaCO3) in water and is calculated by pH, alkalinity, calcium concentration, total dissolved solids, and water temperature [66], while with the Ryznar stability index (RSI) the result is more accurate. In this study, both indices show that all water samples were supersaturated in the R-NO and tended to precipitate CaCO3, the same as in the R-AD, except for samples A1 and A22. The supersaturated water, with respect to the calcium carbonate, is explained by the fact that the dissolved CO2 gas pressure of the waters is higher than that of the atmosphere [67]. In Egypt, it was revealed that 98% of samples were in a supersaturated condition, which indicates the precipitation of carbonate minerals [68]. Hard and scale water obtained in the study area is likely the consequence of the leaching of the hard lands encountered (mostly granitic). However, TDS results can already give a global view on water type classification based on the European Union (EU), as proposed by Salem and El-Sayed [69]. Thus, TDS less than 50 mg/L was registered in all samples in the R-AD (except deep groundwater A7) and in 57.5% of the total samples in the R-NO, which are attributed to the very low mineral concentration. At the same time, TDS between 50 and 500 mg/L was observed in samples A7, N16, N17, N20, N21, N22, N23, N25, N28, N29, N30, N31, N32, and N38, which show low mineral concentrations. TDS between 500 and 1500 mg/L was observed only in the R-NO through the samples N3, N19, N24, and N37, which suggests the presence of the intermediate mineral. Although TDS classified most of the water as drinkable (freshwater), their hard and scale properties could have a tremendous economic impact.

4.2.2. Hydrochemical Characteristics of Groundwater and Surface Water

Research on hydrochemistry has been widely conducted worldwide to protect water quality [70]. Box-whisker representation and the Piper diagram (Figure 5 and Figure 6b) identified, in the DGW, SGW, and SW, Mg2+ and HCO3 as the dominant cation and anion, respectively. The predominance of HCO3 is in accordance with pH values, mostly slightly alkaline in all sampled waters, reflecting the alkaline nature of the rocks in the study area. Similarly, previous studies had reported the dominance of HCO3, consistent with most natural waters along the Cameroon volcanic line (CVL) [71,72,73] in the Mbéré division in the R-AD and its surroundings [74], as well as in many studies around the world. The dominance of the cation Mg2+ is in line with the geology of the study area. Notably, ferromagnesian minerals were found in the Tcholliré subdivision (R-NO), the western part of the Poli subdivision [75], the Touboro subdivision [54], and in the Adamawa Plateau (R-AD) [27]. Similarly, in west Cameroon, Tchamako et al. [76] recorded that waters in the Mou River watershed were dominated by magnesium (signature of olivines and pyroxenes from basalts). Moreover, a higher Mg2+ concentration has been identified in some bottled waters in Cameroon from the volcanic terrain and justified by the presence of magnesium-rich minerals such as olivine and pyroxene [77].
In the Piper diagram, major cations and anions are plotted in the two base ternary plots as milliequivalent percentages before being projected onto the diamond field [78], which shows the water chemistry type. Thus, the projection of the concentrations in meq/L of the major elements on the Piper diagram (Figure 6a,b) and on the Durov diagram (Figure 7a,b) revealed that the chemical facies was dominated by a Mg-Ca-HCO3 water type. This result indicates the influence of a rock–water interaction, mainly the dissolution of minerals containing Mg2+ and Ca2+ during groundwater recharge. After Mg2+, Ca2+, and HCO3 were released in the water, the hydrochemical facies were formed due to their high mobility and the rock/soil type. According to Fantong et al. [63], alkalis and alkaline earth are more mobile and enriched in the aqueous phase. In this study, the hydrochemical characteristics of groundwater were similar to that of surface water, indicating the interaction between groundwater and surface water, likely due to abundant perched aquifers in this area. Similarly, Beatrice et al. [79] identified Mg-Ca-HCO3 among the two main water types of groundwater in Edéa, at the outlet of the Sanaga basin (Cameroon). Gabr et al. [80] found from Gibbs and Piper diagrams that the majority of groundwater in the city of Dayrout, Upper Egypt fell within a water–rock interaction and belonged to the Mg-Ca-HCO3 hydrogeochemical facies.

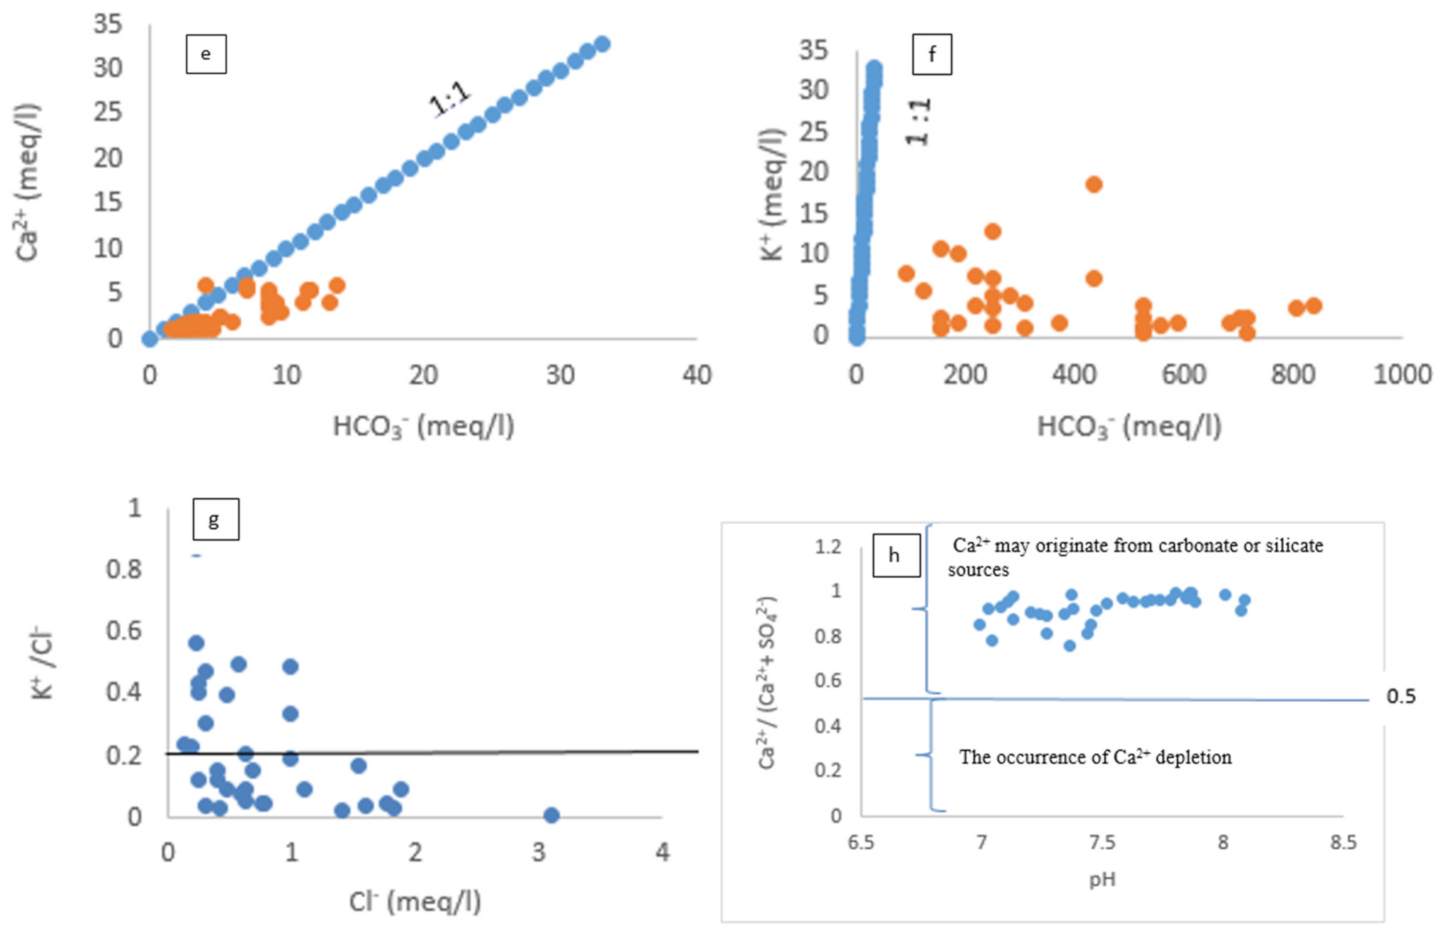
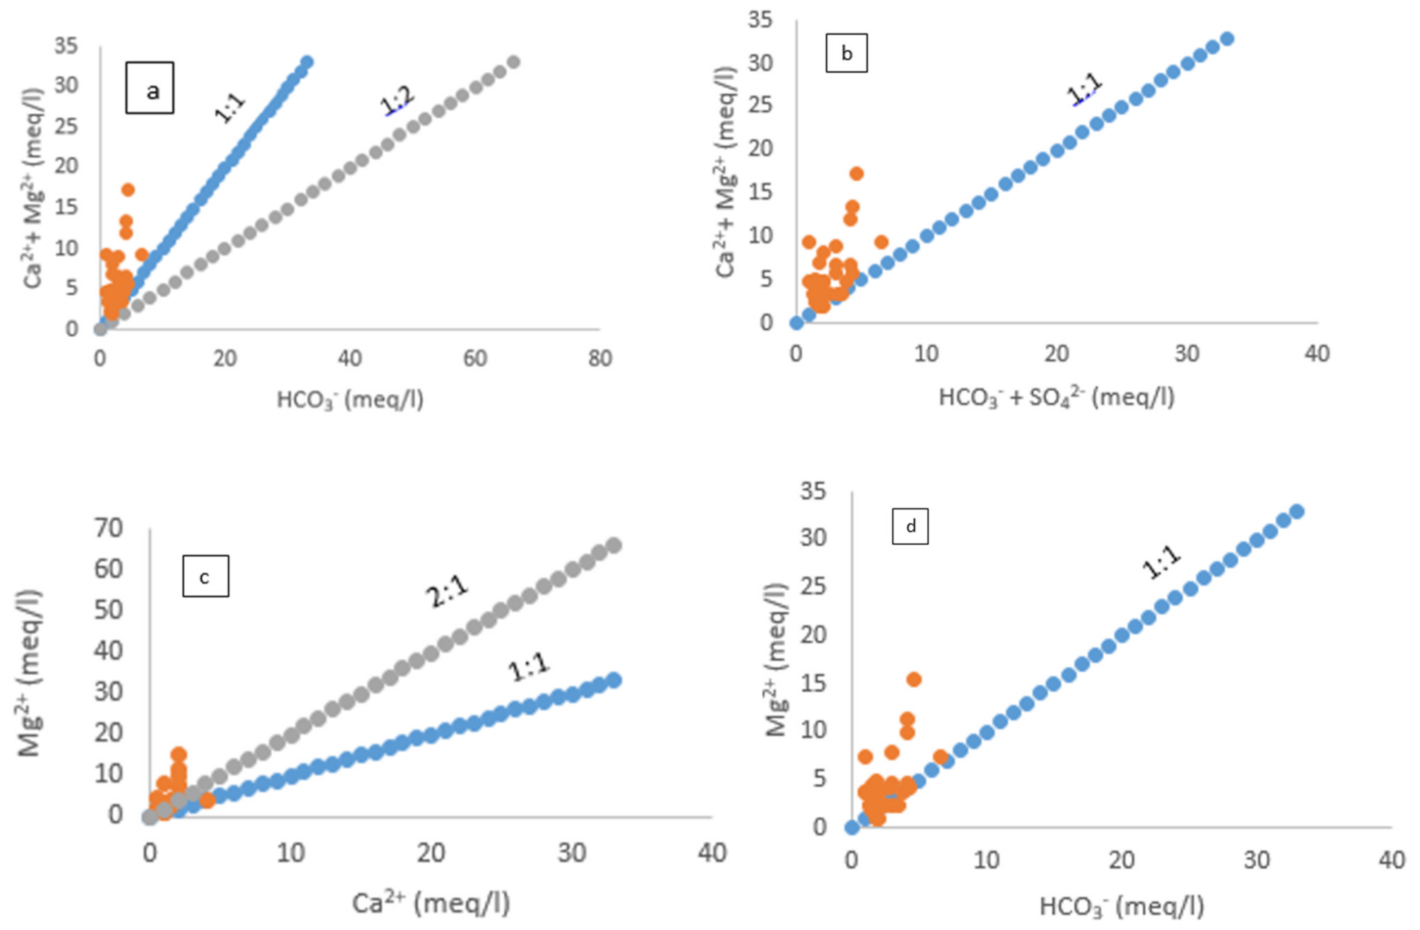
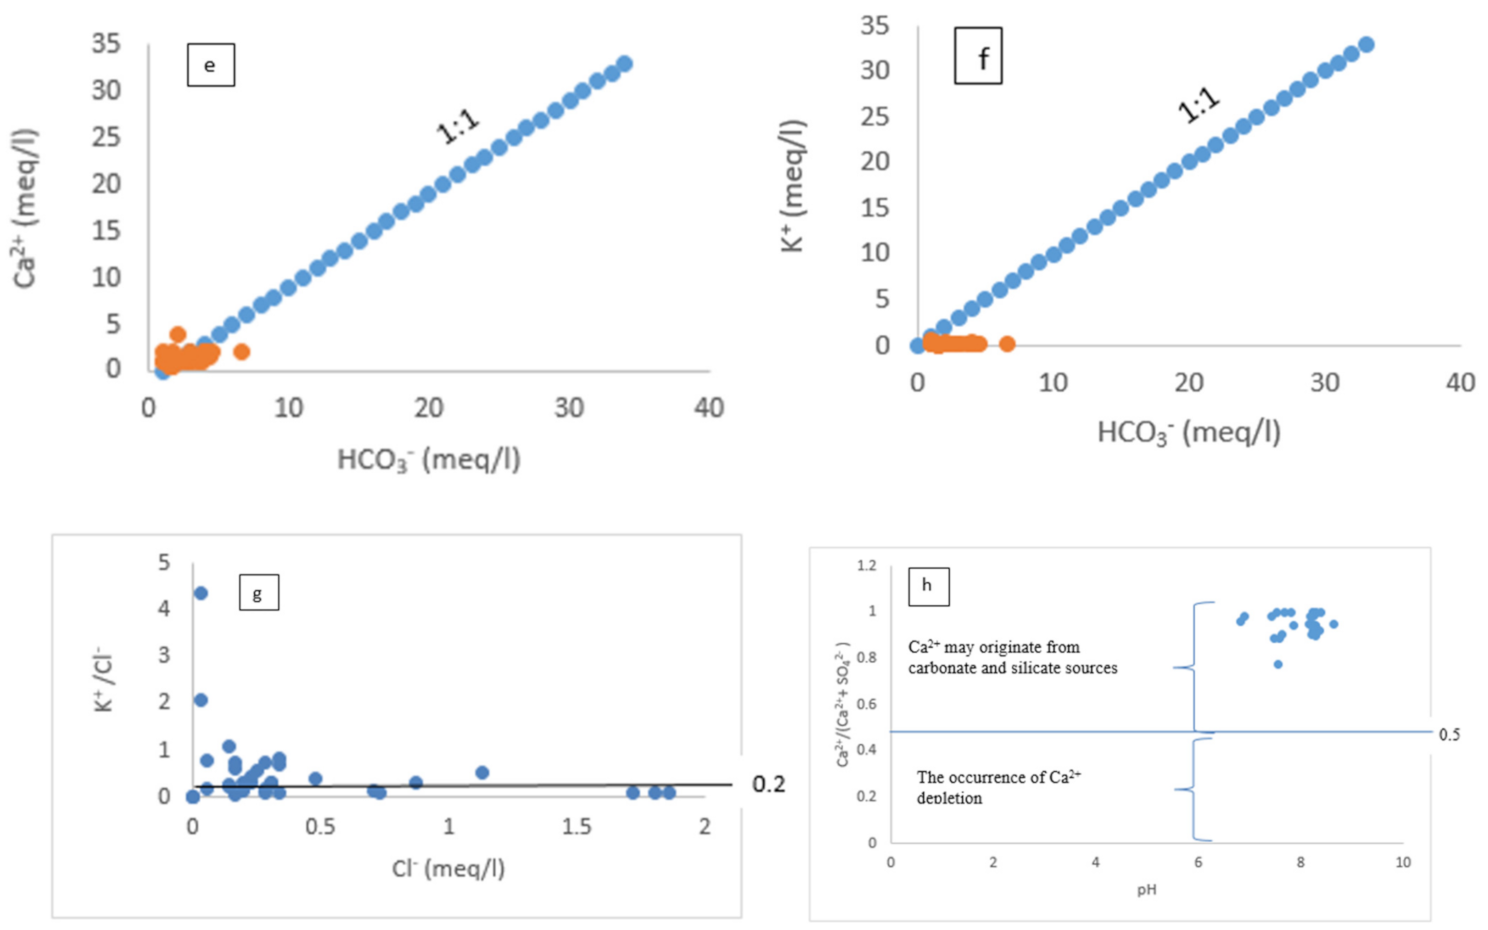
4.2.3. Hydrogeochemical Processes

Regarding the chemical composition, it appears that a large charge imbalance between reported cations and anions could be due to using multiple instruments (two) for analyses of ions or/and the influence of dilute solutions such as rainwater. According to Fritz et al. [45], the samples prone to charge-balances of >10% are those with low ionic strength. This study applied a Durov plot, Gibbs plot, and ionic ratios to understand hydrogeochemical processes that regulate water chemistry. A Gibbs plot was also initiated in the framework of hydrogeochemical processes to evaluate the source of chemical constituents in groundwater [81]. The common hydrogeochemical processes given by Gibbs were atmospheric precipitation (TDS = 10–100 mg/L), rock–water interaction (TDS = 100–1000 mg/L), and evaporation (TDS = 1000–10,000 mg/L) [82]. In this study, just one of the two diagrams proposed by Gibbs (TDS vs. (Cl/Cl + HCO3)) was plotted (Figure 8a,b) to represent groundwater samples in the watersheds of the R-NO and R-AD, respectively.
In the R-NO, between 0 and 10 mg/L, a few groundwater samples (N26, N15, N34, N11, N40, N3, and N33) existed without a specific mechanism controlling groundwater chemistry. Between 10 and 100 mg/L, 14 groundwater samples (N29, N35, N4, N27, N2, N39, N7, N18, N14, N13, N8, N6, N5, and N1) existed in the precipitation zone, while 13 groundwater samples (N16, N31, N22, N25, N38, N21, N20, N17, N28, N24, N3, N37, and N19) were classified under rock–water interaction. Meanwhile, between 0 and 10 mg/L, most groundwater samples within watersheds in the R-AD had no specific mechanism controlling groundwater chemistry. Only samples A19 and A7 were located between 10 and 100 mg/L and were classified under the precipitation zone. Although the R-NO and R-AD are semi-arid regions, no water points in the watersheds studied were influenced by evaporation. Similarly, in the Benue River Basin (Cameroon side), groundwater is recharged by monsoon rainwater from July to September via a permeable clayey sandy lithology that favours hydraulic connectivity, preferentially flow pass mechanism, but minimises evaporation [63]. Nevertheless, a second Gibbs diagram could specify other phenomena which had a certain influence on the main ions in the water [83]. By default, the ionic ratios give at the same time an ion source and highlight the hydrogeochemical processes that control ion evolution in the watersheds studied.
The relationship between the major ions within the watersheds of the R-NO and R-AD are represented in Figure 9 and Figure 10, respectively.
The scatter plot of Ca2++ Mg2+ vs. HCO3 (Figure 9a and Figure 10a) explains the sources of Ca2+ and Mg2+ in groundwater and provides a better understanding of the primary source of the dissolved solids. The ratio (Ca2++ Mg2+)/ HCO3 for most of the data fell above the 1:1 trend line, indicating the predominance of alkaline earth metals (Ca2+ and Mg2+) from silicates weathering and carbonate dissolution, such as dolomite (because of calcium carbonate precipitation). This further reaffirms the role of silicate weathering as the main mechanism for the appearance of dissolved salts in groundwater [84]. Similarly, Figure 10a shows that the majority of the data points fell above the theoretical range of the 1:1 or 1:2 line, except A4 and A7, indicating a predominance of alkaline earth metals in the amphibole and garnet gneisses belonging to the Paleoproterozoic basement [85]. The weathering of silicate minerals is the main source of Ca2+ and Mg2+ in the groundwater of the R-AD. Recently, in the phreatic aquifer of Odisha (India), Sahu et al. [86] obtained the ratio (Ca2++ Mg2+)/HCO3 > 0.5 for 98.2% of the groundwater samples, and they attributed the origin of the solutes in groundwater to the predominance of silicate weathering processes, to the detriment of carbonate dissolution. Abdelshafy et al. [68] found that most of the water points placed in the Ca2+ and Mg2+ side, showing that the excess of calcium and magnesium derived from other processes such as reverse ion exchange, because, if Ca2+ and Mg2+ solely originated from carbonate and silicate weathering, these should be balanced by the alkalinity alone. According to Narany et al. [87], the high (Ca2++ Mg2+)/ HCO3 ratio suggests that the excess of Ca2+ and Mg2+ has been balanced by Cl and SO42−. Moreover, it has been shown that (Ca2++ Mg2+)/HCO3 > 0.5 implies that a reverse cation exchange process took place [88]. In the study area, the (Ca2++ Mg2+)/ HCO3 ratio varied from 0.83 to 7.14 (R-NO) and 0.94 to 9.23 (R-AD), indicating that a reverse cation exchange process also contributed to the release of Ca2+ and Mg2+ into groundwater. The reverse ion exchange processes, which release Ca2+ and Mg2+ in the groundwater within the watersheds studied, are shown in reactions one and two [89].
2 Na 2 + + Ca - Clay   2 Na - Clays + Ca 2 +
2 Na 2 + + Mg - Clay   2 Na - Clays + Mg 2 +
The Ca2++ Mg2+ vs. HCO3 + SO42− plots were used to explore the possibility of an ion exchange process. If normal ion exchange is prominent, the plotted points must shift towards the HCO3 + SO42− domain. However, if reverse ion exchange dominates, the shift is towards the Ca2++ Mg2+ domain [90], due to increased Ca2+ and Mg2+ released by rocks. A few groundwater samples (N5, N16, N2, and N7) fell along the 1:1 trend line (Figure 9b), indicating the dissolution of dolomite and silicates minerals in the R-NO, as represented in reactions three, and four to six (Table 5). Moreover, most of the samples, which appeared above the 1:1 trend line (Figure 9b), indicate the influence of the reverse cation exchange process [91]. During the reverse ion exchange process (reactions one and two), Na+ cations are maintained in the soil, while Ca2+ and Mg2+ are released to groundwater [92]. Likewise, Figure 10b shows that all groundwater samples in the R-AD shifted towards the Ca2++ Mg2+ zone, suggesting a reverse ion exchange process. The dominance of alkaline earth metals (Ca2+ and Mg2+) over alkali metals (Na+ + K+) confirms the different levels of hard water found in the study area. Similarly, in an arid environment such as north-western Saudi Arabia, a reverse ion exchange process has been found to control groundwater chemistry, and in all the sites, this phenomenon accounted for the dominance of Ca2+ and Mg2+ over Na+ [93].
The Mg2+/Ca2+ ratio helps to understand the dissolution of the main minerals. Figure 9c shows that all the groundwater samples were distributed above the 1:1 trend line, while N5, N31, and N35 were the only samples above the 2:1 trend line. In the R-AD, Mg2+/Ca2+ exceeded the 2:1 line for almost all samples (except A22, A4, A11, and A3) and the 1:1 line (except A3) (Figure 10c), indicating carbonate and silicate minerals rich in magnesium. Recently, high Mg has been identified in the Adamawa Plateau bordered to the Adamawa and Mbéré–Djérem faults, mainly from orthopyroxene, olivine, spinel, and amphibole minerals [27]. Moreover, as categorised by Salem and El-Sayed, Mg2+/Ca2+ > 0.9 shows aquifers with silicate rocks rich in magnesium [69]. The ratio of Mg2+/Ca2+ varies from 1.02 to 11.70 (R-NO) and 0.99 to 9.03 (R-AD), indicating the water–rock reaction mainly dominated by the congruent dissolution of igneous rocks made up of magnesium-rich minerals such as ferromagnesian. Similar results have been found in another recent study in the Saraburi region (Thailand), where rocks were mainly composed of alkali feldspar, amphibole, and biotite phenocrysts with a groundmass of calcic-plagioclase and quartz [94].
The plot of Mg2+ vs. HCO3 was used to learn the sources of Mg2+ and HCO3 in groundwater. Assuming that Mg2+ and HCO3 only originated from the dissolution of dolomite and silicates such as clinopyroxene, olivine, amphibole, and biotite, based on the chemical reactions (Equations (3), (4)–(7) in Table 5), the Mg2+/HCO3 ratio in meq/L would be dolomite (2:1 line), clinopyroxene (1.9:0.9 line), olivine (2:1 line), amphibole (7:4 line), and biotite (4:4 line), respectively. Figure 9d shows the relation of Mg2+ and HCO3, and samples N9, N6, N19, and N3 line almost along the 2:1 line and 1.9:0.9 line suggests a source of dolomite, clinopyroxene, and olivine congruent dissolution. Most of the samples fell between the 7:4 line and 1:2 line, suggesting that the main source of Mg2+ and HCO3 was amphibole and biotite (incongruent) dissolution. Whereas in the R-AD, reactions (3, 5–9) in Table 5 show the main processes that can release Mg2+ and HCO3. According to those reactions, the ratios between Mg2+ and HCO3 from the dissolution reactions are 2:1 (dolomite, olivine, and spinel), 7:4 (amphibole), 4:2 (biotite), and 0.9:1.9 (orthopyroxene). As shown in Figure 10d, except for samples A4, A11, A7, A5, A21, and A24, most of the samples fell above the 4:2 and 2:1 line, indicating a source of dolomite, olivine, biotite, and spinel dissolution.
The main processes that may release Ca2+ and HCO3 during rainwater infiltration (recharge of groundwater) in the study area are shown in reactions (3–4, 6,10–11) in Table 5. Regarding these reactions, the ratios between Ca2+ and HCO3 from the dissolution reactions of carbonate and silicates are 1:2 (dolomite), 0.4:1.9 (clinopyroxene), 2:7 (amphibole), 1:2 (anorthite), and 5:3 (fluorapatite), respectively. Figure 9e (Ca2+ vs. HCO3) shows that, except sample N3, all water samples were below the 1:1 line, in which more HCO3 than Ca2+ and dissolution of dolomite, clinopyroxene, amphibole, and anorthite happened. An excess of HCO3 is balanced by Mg2+. It is almost the same result in the R-AD, where, except A3, A20, and A32 (indicating dissolution of fluorapatite), the remaining water samples fell below the 1:1 line (Figure 10e). This suggests the dissolution of dolomite, clinopyroxene, amphibole, and anorthite. Furthermore, the supersaturated water in the calcite registered in the study area shows the loss of calcite by precipitation. Similarly, Carol et al. [100] reported that the contribution of HCO3 originated from CO2(gas) dissolution during rainwater infiltration, and carbonate dissolution sources produced Ca2+ defects with respect to HCO3.
Regarding chemical reactions 7 and 12 (Table 5), if K+ and HCO3 were mainly derived from the weathering of biotite and K-feldspar, the K+/HCO3 ratios would be 1:4 (biotite) and 1:1 (K-feldspar), respectively. K+ vs. HCO3 shows that all the samples fell below the 1:1 trend line (Figure 9f), indicating higher HCO3 than K+ concentrations, from which the source is mainly biotite due to high temperature. Even in the K+ vs. HCO3 plot with data collected in the R-AD (Figure 10f), HCO3 was mainly from biotite for all groundwater. This result is in line with biotite minerals found in the Upper Benue valley upstream of the study area [101] and in the Tcholliré subdivision (R-NO) [30].
Trends of K+/Cl vs. Cl(Figure 9g) revealed that 38% of groundwater samples within the R-NO watersheds (N14, N7, N6, N19, N9, N2, N22, N4, N18, N5, N31, N20, and N16) had a K+/Cl ratio >0.2, suggesting weathering of K-feldspar. Meanwhile, within the R-AD watersheds, the K+/Cl ratio was >0.2 for samples A11, A29, A16, A24, A5, A15, A19, A6, A20, A18, A7, A1, A23, A30, A10, A28, A27, A2, and A12 (Figure 10g), indicating incongruent dissolution of K-feldspar (reaction 12 in Table 5), confirmed by the abundance of kaolinite clay in the R-AD. Similar results have been found in two different arid areas of China: in the northwestern part, Chang and Wang [102] attributed most water samples with a K+/Cl ratio >0.2 to weathering of K-feldspar, while according to Yang et al. [70], weathering and dissolution of K-feldspar occurred in the southeastern part if the K+/Cl ratio >0.2.
Plot Ca2+/ Ca2++ SO42− vs. pH is plotted to represent dissolution of carbonate minerals [103]. In all portions of the study area, all the water samples fell in the zone showing that Ca2+ may have originated from carbonate or silicate sources (Figure 9h and Figure 10h). This result corroborates the dissolution processes of carbonate and silicates, from which Ca2+ is released (reactions 3–4, 6, 10–11 in Table 5). However, in other selected tropical estuaries and coastal water of the Strait of Malacca, only 8% of total samples fell in the same compartment [103].

5. Conclusions

PCA/FA showed that the possible pollution sources for the most polluted water sources were natural sources such as iron-bearing minerals (R-NO), aluminium-rich soils (R-AD), and surface runoff, with high contributions of Fe2+, Al3+, NH4+, NO3, K+, EC, and turbidity, outside of CDWS and WHO norms. Dissolution of silicates (mainly), soil erosion, and oxidation reaction are identified as phenomena that influence water quality in the R-NO, while water quality in the R-AD was influenced by phenomena such as soil–water/rock–water interactions, silicate weathering with cation exchange capacity (CEC), and dissolution of carbonate and silicates. The key environmental factors that impact water quality in the study area are mainly natural, with some anthropogenic influence. The HCA revealed three water clusters: low, moderate, and high pollution areas in the R-NO, and as unpolluted areas, low, and moderate pollution areas in the R-AD. The hydrochemical study showed that more than 50% of the total water collected had very low mineral concentrations, was supersaturated, and tended to precipitate CaCO3. Box-whisker gave the relative abundance of major ions of cations Mg2+ > Ca2+ > K+ and anions HCO3 > Cl > SO42− in DGW, SGW, and SW. A Piper trilinear diagram classified 85% and 79% of water samples within the watersheds in the portion of the R-NO and R-AD, respectively, and under dominant Mg-Ca-HCO3 type. Durov and Gibbs diagrams, as well as major ion ratio relations, indicated that the main hydrochemical processes controlling groundwater chemistry in the watersheds studied were the dissolution of silicates (clinopyroxene, olivine, amphibole, biotite, orthopyroxene, spinel, anorthite, and fluorapatite) and carbonate (dolomite), precipitation of calcite, and reverse ion exchange. For the first time, the present study provides the identification of water pollution sources and the responsible factors for the pollution. Nevertheless, the findings can help environmental managers in the social and economic development strategies framework in this study area. Particularly, hydrochemical results can provide information to elaborate the protection of groundwater resources, which is technical support relevant for the stakeholders of these municipalities. However, many projects should be implemented in the study area to provide the necessary data to enable decision-makers to address other critical water-related issues.

Supplementary Materials

The following are available online at https://www.mdpi.com/article/10.3390/w13213055/s1—Figure S1: Representation of correlation circle of variables and individuals in axis 1 × axis 3 and their contributions referring to axis 3 within watersheds studied in the R-NO.; Figure S2. Representation of correlation circle of variables and individuals in axis 1 × axis 3 and their contributions referring to axis 3 within watersheds studied in the R-AD.; Table S1: Formula of hydrochemical data with their water resources conditions; Table S2: Median and Range (Maximum–Minimum) values of physicochemical parameters for the North Region (R-NO) and Adamawa Region (R-AD) during the rainy season. All physicochemical parameters are given in mg/L except pH; temperature in °C; EC in μS/Cm; turbidity in NTU.

Author Contributions

Conceptualization, E.G.D.D.; methodology, E.G.D.D.; validation, A.L.K.A., J.N.G. and J.M.K.; formal analysis, E.G.D.D.; investigation, E.G.D.D.; resources, P.T.S., R.N.C., J.N.G. and J.M.K.; data curation, A.L.K.A., P.T.S., R.N.C. and P.D.B.B.; writing—original draft preparation, E.G.D.D.; writing—review and editing, E.G.D.D., A.L.K.A., P.T.S., P.D.B.B. and J.N.G.; supervision, J.N.G. and J.M.K. All authors have read and agreed to the published version of the manuscript.

Funding

This research received no external funding. The APC was funded by A.L.K.A.

Institutional Review Board Statement

Not applicable.

Informed Consent Statement

Not applicable.

Data Availability Statement

All data regarding this article have been included in the manuscript and Supplementary Materials. The raw data can only be made available to the readers upon request due to ethical reasons linked with the affiliation of the first author.

Acknowledgments

This work was partially funded by UNICEF through “Première Urgence Internationale” a Non-Governmental Organization (NGO) based in Yaounde, which supplied the kits used for water analysis. The authors would like to thank SIELIECHI Joseph-Marie of the University of Ngaoundere, Department of Applied Chemistry for the analysis of magnesium, calcium, hardness, total alkalinity, and turbidity. We also thank GHOGOMU Paul MINGO of the Department of Inorganic Chemistry of the University of Yaoundé I for the material and financial support.

Conflicts of Interest

The authors declare no conflict of interest.

References

  1. Jamison, D.T.; Nugent, R.; Gelband, H.; Horton, S.; Jha, P.; Laxminarayan, R.; Mock, C.N. Injury Prevention and Environmental Health, 7th ed.; International Bank for Reconstruction and Development/The World Bank: Washington, DC, USA, 2017. [Google Scholar]
  2. WWAP (United Nations World Water Assessment Programme). The United Nations World Water Development Report 2015: Water for a Sustainable World; UNESCO: Paris, France, 2015. Available online: https://unesdoc.unesco.org/ark:/48223/pf0000231823 (accessed on 10 August 2021).
  3. Machado, A.V.M.; dos Santos, J.A.N.; Quindeler, N.d.S.; Alves, L.M.C. Critical Factors for the Success of Rural Water Supply Services in Brazil. Water 2019, 11, 2180. [Google Scholar] [CrossRef] [Green Version]
  4. GWP (Global Water Partnership). Développement d ’une Stratégie de Financement du Secteur de l ’eau en Afrique Centrale: Cameroun, 2010. Etude Nationale sur le Financement du Secteur de l’eau; GWP-CAf Secretariat: Yaounde, Ameroun, 2010; Available online: https://www.gwp.org/globalassets/global/gwp-caf-files/etude-nationale-sur-le-financement-du-secteur-de-leau-au-cameroun.pdf (accessed on 12 July 2021).
  5. Molua, E.L.; Lambi, C.M. Climate Hydrology and Water Resources in Cameroon; Unique Printers: Buea, Cameroon, 2010. Available online: https://www.scirp.org/(S(351jmbntvnsjt1aadkposzje))/reference/ReferencesPapers.aspx?ReferenceID=1787945 (accessed on 1 October 2021).
  6. World Bank. The World Bank in Cameroon. Available online: https://www.worldbank.org/en/country/cameroon/overview#1 (accessed on 10 October 2021).
  7. Jiatsa, Z.T.M. Can Fog and Rain Harvesting Secure Safe Drinking Water in Rural Cameroon? Case Study of Bafou (Mountainous) and Mora (Low-Lying) Villages; Kristianstad University: Kristianstad, Sweden, 2010. [Google Scholar]
  8. Bang, H.N.; Miles, L.; Gordon, R. Enhancing local livelihoods resilience and food security in the face of frequent flooding in Africa: A disaster management perspective. J. Afr. Stud. Dev. 2018, 10, 85–100. [Google Scholar]
  9. Ngatcha, B.N.; Njitchoua, R.; Naah, E. Impact sur les plaines d’inondation de la Bénoué. In Le barrage de Lagdo (Nord-Cameroun); IRD Editions: Paris, France, 1988; Available online: https://www.documentation.ird.fr/hor/fdi:010030382 (accessed on 23 July 2021).
  10. Van der Waarde, J. Integrated River Basin Management of the Sanaga River, Cameroon. Benefits and Challenges of Decentralised Water Management; Internationa Rivers: Oakland, CA, USA, 2007; Available online: https://archive.internationalrivers.org/resources/integrated-river-basin-management-of-the-sanaga-river-cameroon-4036 (accessed on 26 October 2021).
  11. Folifac, F.; Lifongo, L.; Nkeng, G.; Gaskin, S. Municipal drinking water source protection in low-income countries: Case of Buea municipality-Cameroon. J. Ecol. Nat. Environ. 2009, 1, 73–84. [Google Scholar]
  12. Gaikwad, S.K.; Kadam, A.K.; Ramgir, R.R.; Kashikar, A.S.; Wagh, V.M.; Kandekar, A.M.; Gaikwad, S.P.; Madale, R.B.; Pawar, N.J.; Kamble, K.D. Assessment of the groundwater geochemistry from a part of west coast of India using statistical methods and water quality index. HydroResearch 2020, 3, 48–60. [Google Scholar] [CrossRef]
  13. Nguyen, B.T.; Minh, T.; Nguyen, T.; Bach, Q. Assessment of groundwater quality based on principal component analysis and pollution source-based examination: A case study in Ho Chi Minh City, Vietnam. Environ. Monit. Assess. 2020, 192, 382–395. [Google Scholar] [CrossRef] [PubMed]
  14. Tomaz, A.; Palma, P.; Fialho, S.; Lima, A.; Alvarenga, P.; Potes, M.; Salgado, R. Spatial and temporal dynamics of irrigation water quality under drought conditions in a large reservoir in Southern Portugal. Environ. Monit. Assess. 2020, 192, 76–93. [Google Scholar] [CrossRef] [PubMed]
  15. Aljahdali, M.O.; Alhassan, A.B. Ecological risk assessment of heavy metal contamination in mangrove habitats, using biochemical markers and pollution indices: A case study of Avicennia marina L. in the Rabigh lagoon, Red Sea. Saudi J. Biol. Sci. 2020, 27, 1174–1184. [Google Scholar] [CrossRef] [PubMed]
  16. Hua, K.; Xiao, J.; Li, S.; Li, Z. Analysis of hydrochemical characteristics and their controlling factors in the Fen River of China. Sustain. Cities Soc. 2020, 52, 101827. [Google Scholar] [CrossRef]
  17. Zekâi Şen Groundwater Quality. In Practical and Applied Hydrogeology; Elsevier: Amsterdam, The Netherlands, 2015; pp. 1–61. [CrossRef]
  18. Reyes-toscano, C.A.; Alfaro-cuevas-villanueva, R.; Morton-bermea, O.; Hern, E.; Buenrostro-delgado, O.; Ávila-Olivera, J.A. Hydrogeochemical Characteristics and Assessment of Drinking Water Quality in the Urban Area of Zamora, Mexico. Water 2020, 12, 556. [Google Scholar] [CrossRef] [Green Version]
  19. Vadiati, M.; Asghari-moghaddam, A.; Nakhaei, M.; Adamowski, J.; Akbarzadeh, A.H. A fuzzy-logic based decision-making approach for identification of groundwater quality based on groundwater quality indices. J. Environ. Manag. 2016, 184, 255–270. [Google Scholar] [CrossRef] [PubMed]
  20. Tatou, R.D.; Kabeyene, V.K.; Mboudou, G.E. Multivariate Statistical Analysis for the Assessment of Hydrogeochemistry of Groundwater in Upper Kambo Watershed (Douala-Cameroon). J. Geosci. Environ. Prot. 2017, 5, 252–264. [Google Scholar] [CrossRef]
  21. Enyegue, A.; Nyam, F.M.; Yomba, A.E.; Tchikangoua, A.N.; Bounoung, C.P.; Nouayou, R. Assessment and characterization of groundwater quality under domestic distribution using hydrochemical and multivariate statistical methods in Bafia, Cameroon. Groundw. Sustain. Dev. 2020, 10, 100347. [Google Scholar] [CrossRef]
  22. Mandeng, B.; Bondj, L.M.; Zacharie, A.; Bessa, E.; Ntomb, Y.D.; Wadjou, J.W.; Paternie, E.; Doumo, E.; Dieudonné, L.B. Contamination and risk assessment of heavy metals, and uranium of sediments in two watersheds in Abiete-Toko gold district, Southern Cameroon. Heliyon 2019, 5, e02591. [Google Scholar] [CrossRef] [PubMed] [Green Version]
  23. Rakotondrabe, F.; Ngoupayou, J.R.N.; Mfonka, Z.; Harilala, E.; Jacob, A.; Abolo, N.; Ako, A. Water quality assessment in the Bétaré-Oya gold mining area (East-Cameroon): Multivariate Statistical Analysis approach. Sci. Total Environ. 2018, 611, 831–844. [Google Scholar] [CrossRef] [PubMed]
  24. GWP (Global Water Partnership). Etat des lieux du secteur: Connaissance et usages des ressources en eau. In Plan d’Action National de Gestion Integree des Ressources en Eau; GWP-CAf Secretariat: Yaounde, Cameroon, 2009; Available online: https://www.pseau.org/outils/biblio/resume.php?d=3816 (accessed on 26 October 2021).
  25. Silatsa, B.A.; Kuiate, J.; Njiokou, F.; Simo, G.; Feussom, J.K.; Tunrayo, A.; Amzati, G.S.; Bett, B.; Bishop, R.; Githaka, N.; et al. A countrywide molecular survey leads to a seminal identification of the invasive cattle tick Rhipicephalus (Boophilus) microplus in Cameroon, a decade after it was reported in Cote d ’Ivoire. Ticks Tick. Borne. Dis. 2019, 10, 585–593. [Google Scholar] [CrossRef] [PubMed]
  26. Brabant, P. Sols Ferrugineux Tropicaux et Les Sols Apparents du Nord-Cameroun; ORSTOM: Yaoundé, Cameroon, 1968. [Google Scholar]
  27. Temdjim, R.; Patrick, M.; Wagsong, N.; Julien, A.; Tsepeng, N.; Foley, S. Variation in mantle lithology and composition beneath the Ngao Bilta volcano, Adamawa Massif, Cameroon volcanic line, West-central Africa. Geosci. Front. 2020, 11, 665–677. [Google Scholar] [CrossRef]
  28. Alexandre, A.; Frisch, W.; Siebel, W.; Emmanuel, G.; Kongyuy, C.; Ngako, V. Archean inheritances in the pyroxene–amphibole-bearing gneiss of the Méiganga area (Central North Cameroon): Geochemical and 207 Pb/ 206 Pb age imprints. Comptes Rendus Geosci. 2008, 340, 211–222. [Google Scholar]
  29. Saha, F.A.N.; Tchameni, R.; Nomo, N.E.; Daouda, D.; Penaye, J.; Fosso, T.P.M. Polyphase deformation in the Mbé-Sassa-Bersi area: Implications on the tectono-magmatic history of the area and the tectonic evolution of the Tcholliré-Banyo and Central Cameroon Shear Zones (Central North Cameroon). J. Geosci. Geomat. 2018, 6, 41–54. [Google Scholar]
  30. Nomo, E.N.; Tchameni, R.; Vanderhaeghe, O.; Sun, F.; Barbey, P.; Tekoum, L.; Tchunte, P.M.F.; Eglinger, A.; Fouotsa, N.A.S. Structure and LA-ICP-MS zircon U- Pb dating of syntectonic plutons emplaced in the Pan-African Banyo-Tcholliré shear zone (central north Cameroon). J. Afr. Earth Sci. 2017, 131, 251–271. [Google Scholar] [CrossRef]
  31. Ephraim, B.E. Investigation of the geochemical signatures and conditions of formation of metacarbonate rocks occurring within the Mamfe embayment of south-eastern Nigeria. Eart Sci. Res. J. 2012, 16, 121–138. [Google Scholar]
  32. Njitchoua, R.; Dever, L.; Fontes, J.C.; Naah, E. Geochemistry, origin and recharge mechanisms of groundwaters from the Garoua Sandstone aquifer, northern Cameroon. J. Hydrol. 1997, 190, 123–140. [Google Scholar] [CrossRef]
  33. Kouassy, K.P.S.; Ngoupayou, J.-R.N.; Rakotondrabe, F.; Ondoa, J.M. Quantitative assessment of water resources by the method of the hydrological balance in the Kadey catchment area (East-Cameroon). Groundw. Sustain. Dev. 2020, 10, 100278. [Google Scholar]
  34. Defo, C.; Mishra, A.K.; Yerima, B.P.K.; Mabou, P.B.; Ako, A.A.; Fonkou, T. Current conditions of groundwater resources development and related problems in the Republic of Cameroon, West Africa. Eur. Water 2016, 54, 43–68. [Google Scholar]
  35. Kringel, R.; Rechenburg, A.; Kuitcha, D.; Fouépé, A.; Bellenberg, S.; Kengne, I.M.; Fomo, M.A. Masse balance of nitrogen and potassium in urban groundwater in Central Africa, Yaounde/Cameroon. Sci. Total Environ. 2016, 547, 382–395. [Google Scholar] [CrossRef] [PubMed] [Green Version]
  36. Fantong, W.Y.; Fouépé, A.T.; Djomou, S.L.B.; Banseka, H.S.; Anazawa, K.; Sma, A.; Mendjo, J.W.; Aka, F.T.; Ohba, T.; Hell, V.; et al. Temporal pollution by nitrate (NO3), and discharge of springs in shallow crystalline aquifers: Case of Akok Ndoue catchment, Yaounde (Cameroon). Afr. J. Environ. Sci. Technol. 2013, 7, 175–191. [Google Scholar]
  37. Aretouyap, Z.; Bisso, D.; Nouck, P.N.; Menkpa, L.E.A.; Asfahani, J. Hydrogeophysical Characteristics of Pan-African Aquifer Specified Through an Alternative Approach Based on the Interpretation of Vertical Electrical Sounding Data in the Adamawa Region, Central Africa. Nat. Resour. Res. 2018, 28, 63–77. [Google Scholar] [CrossRef]
  38. CEN Water Quality-Sampling-Part 1: Guidance on the design of sampling programmes and sampling techniques (ISO 5667–1:2006). In ILNAS-EN ISO 5667-1:2006; British Standards Institution: London, UK, 2006; Available online: https://www.iso.org/standard/36693.html (accessed on 15 July 2021).
  39. Jiricek, M.; Sracek, O.; Janda, V. Removal of chlorinated solvents from carbonate-buffered water by zero-valent iron. Cent. Eur. J. Chem. 2007, 5, 87–106. [Google Scholar] [CrossRef]
  40. Gharahi, N.; Zamani-Ahmadmahmoodi, R. Evaluation of groundwater quality for drinking purposes: A case study from the Beheshtabad Basin, Chaharmahal and Bakhtiari Province, Iran. Environ. Earth Sci. 2020, 79, 82. [Google Scholar] [CrossRef]
  41. Vadde, K.K.; Wang, J.; Cao, L.; Yuan, T.; McCarthy, A.J.; Sekar, R. Assessment of Water Quality and Identification of Pollution Risk Locations in Tiaoxi River (Taihu Watershed), China. Water 2018, 10, 183. [Google Scholar] [CrossRef] [Green Version]
  42. Nnorom, I.C.; Ewuzie, U.; Eze, S.O. Multivariate statistical approach and water quality assessment of natural springs and other drinking water sources in Southeastern Nigeria. Heliyon 2019, 5, e01123. [Google Scholar] [CrossRef] [Green Version]
  43. Abo, R.; Merkel, B.J. Water quality of the Helvetian and Eocene aquifers in Al Zerba catchment and southern parts of Al Qweek Valley, Aleppo basin, Syria. Sustain. Water Resour. Manag. 2015, 1, 189–211. [Google Scholar] [CrossRef] [Green Version]
  44. Noshadi, M.; Ghafourian, A. Groundwater quality analysis using multivariate statistical techniques (case study: Fars province, Iran). Environ. Monit. Assess. 2016, 188, 406–419. [Google Scholar] [CrossRef]
  45. Fritz, S.J. A Survey of Charge-Balance Errors on Published Analyses of Potable Ground and Surface Waters. Groundwater 1994, 32, 539–545. [Google Scholar] [CrossRef]
  46. Olumana, M.; Loiskandl, W.; Ndambuki, J.M. Hydrochemical characterization of various surface water and groundwater resources available in Matahara areas, Fantalle Woreda of Oromiya region. J. Hydrol. Reg. Stud. 2015, 3, 444–456. [Google Scholar]
  47. Fetter, C.W. Applied Hydrogeology, 4th ed.; Prentice Hall: Hoboken, NJ, USA, 2001. [Google Scholar]
  48. Cao, W.; Yang, H.; Liu, C.; Li, Y.; Bai, H. Hydrogeochemical characteristics and evolution of the aquifer systems of Gonghe Basin, Northern China. Geosci. Front. 2018, 9, 907–916. [Google Scholar] [CrossRef]
  49. Prasanna, M.V.; Chidambaram, S.; Senthil Kumar, G.; Ramanathan, A.L.; Nainwal, H.C. Hydrogeochemical assessment of groundwater in neyveli basin, Cuddalore district, South India. Arab. J. Geosci. 2011, 4, 319–330. [Google Scholar] [CrossRef]
  50. Soltani, A.A.; Bermad, A.; Boutaghane, H.; Oukil, A.; Abdalla, O.; Hasbaia, M.; Oulebsir, R.; Zeroual, S.; Lefkir, A. An integrated approach for assessing surface water quality: Case of Beni Haroun dam (Northast Algeria). Environ. Monit. Assess. 2020, 192, 1–17. [Google Scholar] [CrossRef] [PubMed]
  51. Che, Q.; Su, X.; Wang, S.; Zheng, S.; Li, Y. Hydrochemical Characteristics and Evolution of Groundwater in the Alluvial Plain (Anqing Section) of the Lower Yangtze River Basin: Multivariate Statistical and Inversion Model Analyses. Water 2021, 13, 2403. [Google Scholar] [CrossRef]
  52. Trudinger, P.A. Geological significance of sulphur oxidoreduction by bacteria. Philos. Trans. R. Soc. Lond. B Biol. Sci. 1982, 298, 563–581. [Google Scholar]
  53. Gad, M.; Elsayed, S.; Moghanm, F.S.; Almarshadi, M.H.; Alshammari, A.S.; Khedher, K.M.; Eid, E.M.; Hussein, H. Combining Water Quality Indices and Multivariate Modeling to Assess Surface Water Quality in the Northern Nile Delta, Egypt. Water 2020, 12, 2142. [Google Scholar] [CrossRef]
  54. Seguem, N.; Alexandre, G.A.; Klötzli, U.; Kepnamou, A.D.; Emmanuel, E.G. Petrography and Geochemistry of Precambrian Basement Straddling the Cameroon-Chad Border: The Touboro Baïbokoum Area. Int. J. Geosci. 2014, 5, 418–431. [Google Scholar] [CrossRef] [Green Version]
  55. Banda, T.D.; Kumarasamy, M. Application of Multivariate Statistical Analysis in the Development of a Surrogate Water Quality Index (WQI) for South African Watersheds. Water 2020, 12, 1584. [Google Scholar] [CrossRef]
  56. Ning, S.; Chang, N.; Jeng, K.; Tseng, Y. Soil erosion and non-point source pollution impacts assessment with the aid of multi-temporal remote sensing images. J. Environ. Manag. 2006, 79, 88–101. [Google Scholar] [CrossRef] [PubMed]
  57. Karlson, M.; Ostwald, M. Remote sensing of vegetation in the Sudano-Sahelian zone: A literature review from 1975 to 2014. J. Arid Environ. 2016, 124, 257–269. [Google Scholar] [CrossRef] [Green Version]
  58. Wotany, E.R.; Ayonghe, S.N.; Fantong, W.Y.; Wirmvem, M.J.; Ohba, T. Hydrogeochemical and anthropogenic influence on the quality of water sources in the Rio del Rey Basin, South Western, Cameroon, Gulf of Guinea. Afr. J. Environ. Sci. Technol. 2013, 7, 1053–1069. [Google Scholar]
  59. Bang, H.; Miles, L.; Gordon, R. The Irony of Flood Risks in African Dryland Environments: Human Security in North Cameroon. World J. Eng. Technol. 2017, 5, 109–121. [Google Scholar] [CrossRef] [Green Version]
  60. Cheo, A.E.; Voigt, H.; Mbua, R.L. Vulnerability of water resources in northern Cameroon in the context of climate change. Environ. Earth Sci. 2013, 70, 1211–1217. [Google Scholar] [CrossRef]
  61. JICA. Data Collection Survey on the Transport Network Development in Douala; Japan International Cooperation Agency: Yaounde, Cameroon, 2017; Available online: https://openjicareport.jica.go.jp/710/710/710_505_12286837.html (accessed on 3 March 2018).
  62. Abubakar, B.; Umar, H.; Barde, M.M.; Adamu, S. Socio-economic Impact of Flooding on the Riverine Communities of River Benue in Adamawa State, Nigeria. FUTY J. Environ. 2020, 14, 1–9. [Google Scholar]
  63. Fantong, W.Y.; Nenkam, T.L.L.J.; Kringe, P.N.; Kimbi, S.B.; Fru, E.C.; Kamtchueng, B.T.; Takoundjou, A.F.; Tejiobou, A.R.; Ngueutchoua, G.; Kringel, R. Compositions and mobility of major, dD, d18O, trace, and REEs patterns in water sources at Benue River Basin—Cameroon: Implications for recharge mechanisms, geo-environmental controls, and public health. Environ. Geochem. Health 2020, 42, 2975–3031. [Google Scholar] [CrossRef] [PubMed]
  64. Arétouyap, Z.; Bisso, D.; Larissa, J.; Nouck, P.N.; Njoya; Asfahani, J. Hydraulic parameters evaluation of the Pan-African aquifer by applying an alternative geoelectrical approach based on vertical electrical soundings. Geofísica Int. 2019, 58, 113–126. [Google Scholar] [CrossRef] [Green Version]
  65. Zebaze, A.T.; Njueya, A.K.; Kwekam, M.; Temgoua, E. Assessment of Hydrogeoelectrical Characteristics of Crystalline Aquifers and Groundwaters Quality in Adamawa Plateau: Case of Mbakaou (Adamawa-Cameroon). Environ. Earth Sci. Res. J. 2020, 7, 153–163. [Google Scholar]
  66. Ahmed, S.; Wajahat, M.; Alam, M.; Hussain, A.; Qureshi, F.; Khurshid, S. Evaluation of corrosive behaviour and scaling potential of shallow water aquifer using corrosion indices and geospatial approaches in regions of the Yamuna River basin. J. King Saud Univ.-Sci. 2021, 33, 101–237. [Google Scholar] [CrossRef]
  67. Srinivasamoorthy, K.; Gopinath, M.; Chidambaram, S.; Vasanthavigar, M.; Sarma, V.S. Hydrochemical characterization and quality appraisal of groundwater from Pungar sub basin, Tamilnadu, India. J. King Saud Univ.-Sci. 2014, 26, 37–52. [Google Scholar] [CrossRef] [Green Version]
  68. Abdelshafy, M.; Saber, M.; Abdelhaleem, A.; Abdelrazek, S.M.; Seleem, E.M. Hydrogeochemical processes and evaluation of groundwater aquifer at Sohag city, Egypt. Sci. Afr. 2019, 6, e00196. [Google Scholar] [CrossRef]
  69. Salem, W.M.; El-sayed, M. Hydro-geochemical and isotopic composition of ground water in Helwan area. Egypt. J. Pet. 2015, 24, 411–421. [Google Scholar] [CrossRef] [Green Version]
  70. Yang, Q.; Li, Z.; Ma, H.; Wang, L.; Delgado, J. Identification of the hydrogeochemical processes and assessment of groundwater quality using classic integrated geochemical methods in the Southeastern part of Ordos basin, China. Environ. Pollut. 2016, 218, 879–888. [Google Scholar] [CrossRef]
  71. Wirmvem, M.J.; Ohba, T.; Fantong, W.Y.; Ayonghe, S.N.; Justice, Y.; Asaah, A.N.E.; Tanyileke, G.; Hell, J.V. Hydrochemistry of shallow groundwater and surface water in the Ndop plain, North West Cameroon. Afr. J. Environ. Sci. Technol. 2013, 7, 518–530. [Google Scholar]
  72. Kamtchueng, B.T.; Fantong, W.Y.; Wirmvem, M.J.; Tiodjio, R.E.; Takounjou, A.F.; Ngoupayou, J.R.N.; Kusakabe, M.; Zhang, J.; Ohba, T.; Tanyileke, G.; et al. Hydrogeochemistry and quality of surface water and groundwater in the vicinity of Lake Monoun, West Cameroon: Approach from multivariate statistical analysis and stable isotopic characterization. Environ. Monit. Assess. 2016, 188, 1–24. [Google Scholar] [CrossRef]
  73. Njoyim, K.I.; Kengni, L.; Tita, M.A.; Njoyim, E.; Tamungang, B.; Fonzenyuy, V.F.; Aziwo, B.T. Hydrogeochemistry of Surface and Ground Water in Alatening Village, Northwest Region, Cameroon. Appl. Environ. Soil Sci. 2020, 2020, 8347095. [Google Scholar] [CrossRef]
  74. Gounti, M.; Mimba, M.E.; Teddy, F. Importance of rocks and their weathering products on groundwater quality in Central-East Cameroon. Hydrology 2017, 4, 23. [Google Scholar]
  75. Toteu, S.F.; Penaye, J.; Deloule, E.; Van Schmus, W.R.; Tchameni, R. Diachronous evolution of volcano-sedimentary basins north of the Congo craton: Insights from U–Pb ion microprobe dating of Groups (Cameroon) zircons from the Poli, Lom and Yaounde. J. Afr. Earth Sci. 2006, 44, 428–442. [Google Scholar] [CrossRef]
  76. Tchamako, K.; Fotsing, T.; Tchouankoue; Ngoupayou; Ngatcha, N. Hinman Influences of lithology on water quality: A study of the Ngam and Mou watersheds in West Cameroon (Central Africa). Procedia Earth Planet. Sci. 2013, 7, 405–408. [Google Scholar] [CrossRef] [Green Version]
  77. Abonoje, S.; Ako, A.; Elambo, G.; Cheo, E. Hydrogeochemical characteristics of some Cameroon bottled waters, investigated by multivariate statistical analyses. J. Geochem. Explor. 2012, 112, 118–130. [Google Scholar]
  78. Ouarani, M.; Bahir, M.; Mulla, D.J.; Ouazar, D.; Chehbouni, A.; Dhiba, D.; Ouhamdouch, S.; Mountassir, O. El Groundwater Quality Characterization in an Overallocated Semi-Arid Coastal Area Using an Integrated Approach: Case of the Essaouira Basin, Morocco. Water 2020, 12, 3202. [Google Scholar] [CrossRef]
  79. Beatrice, N.A.; Brell, M.K.; Aboubakar, A.; Youtha, Y.S.A.; Yaka, M.A.D.; Bertrand, Z.Z.; Nindum, S.Y.N.; Crépin, M.A.; Clarisse, M.M.Y. Soil Assessment of Physicochemical and Heavy Metal Properties of Groundwater in Edéa (Cameroon). Am. J. Water Resour. 2019, 7, 1–10. [Google Scholar] [CrossRef] [Green Version]
  80. Gabr, M.E.; Soussa, H.; Fattouh, E. Groundwater quality evaluation for drinking and irrigation uses in Dayrout city Upper Egypt. Ain Shams Eng. J. 2020, 12, 327–340. [Google Scholar] [CrossRef]
  81. Udeshani, W.A.C.; Dissanayake, H.M.K.P.; Gunatilake, S.K.; Chandrajith, R. Assessment of groundwater quality using water quality index (WQI): A case study of a hard rock terrain in Sri Lanka. Groundw. Sustain. Dev. 2020, 11, 100421. [Google Scholar] [CrossRef]
  82. Madhav, S.; Ahamad, A.; Kumar, A.; Kushawaha, J.; Mishra, P.K. Geochemical assessment of groundwater quality for its suitability for drinking and irrigation purpose in rural areas of Sant Ravidas Nagar (Bhadoh), Uttar Pradesh. Geol. Ecol. Landsc. 2018, 2, 127–136. [Google Scholar] [CrossRef] [Green Version]
  83. Singh, G.; Rishi, M.S.; Herojeet, R.; Kaur, L.; Priyanka; Sharma, K. Multivariate analysis and geochemical signatures of groundwater in the agricultural dominated taluks of Jalandhar district, Punjab, India. J. Geochem. Explor. 2020, 208, 106395. [Google Scholar] [CrossRef]
  84. Okiongbo, K.S.; Akpofure, E. Identification of Hydrogeochemical Processes in Groundwater using Major ion Chemistry: A case study of Yenagoa and Environs, Southern Nigeria. Glob. J. Geol. Sci. 2014, 12, 39–52. [Google Scholar] [CrossRef] [Green Version]
  85. Tchameni, R.; Pouclet, A.; Penaye, J.; Ganwa, A.A.; Toteu, S.F.; Tchameni, R.; Pouclet, A.; Penaye, J.; Ganwa, A.; Toteu, S.F. Petrography and geochemistry of the Ngaoundéré Pan-African granitoids in Central North Cameroon: Implications for their sources and geological setting. J. Afr. Earth Sci. 2006, 44, 511–529. [Google Scholar] [CrossRef] [Green Version]
  86. Sahu, S.; Gogoi, U.; Nayak, N.C. Groundwater solute chemistry, hydrogeochemical processes and fluoride contamination in phreatic aquifer of Odisha, India. Geosci. Front. 2021, 12, 101093. [Google Scholar] [CrossRef]
  87. Narany, T.S.; Ramli, M.F.; Aris, A.Z.; Nor, W.; Sulaiman, A.; Juahir, H.; Fakharian, K. Identification of the Hydrogeochemical Processes in Groundwater Using Classic Integrated Geochemical Methods and Geostatistical Techniques, in Amol-Babol Plain, Iran. Sci. World J. 2014, 2014, 419058. [Google Scholar]
  88. Kanagaraj, G.; Elango, L.; Sridhar, S.G.D.; Gowrisankar, G. Hydrogeochemical processes and influence of seawater intrusion in coastal aquifers south of Chennai, Tamil Nadu, India. Environ. Sci. Pollut. Res. 2018, 25, 8989–9011. [Google Scholar] [CrossRef]
  89. Li, P.; Wu, J.; Qian, H. Hydrogeochemistry and Quality Assessment of Shallow Groundwater in the Southern Part of the Yellow River Alluvial Plain (Zhongwei Section), Northwest China. Earth Sci. Res. J. 2014, 18, 27–38. [Google Scholar] [CrossRef]
  90. Kumar, P.J.S.; James, E.J. Identification of hydrogeochemical processes in the Coimbatore district, Tamil Nadu, India. Hydrol. Sci. J. 2016, 61, 719–731. [Google Scholar] [CrossRef]
  91. Karunanidhi, D.; Aravinthasamy, P.; Deepali, M.; Subramani, T.; Roy, P.D. The effects of geochemical processes on groundwater chemistry and the health risks associated with fluoride intake in a semi-arid region of South India. RSC Adv. 2020, 10, 4840–4859. [Google Scholar] [CrossRef] [Green Version]
  92. Mahmoudi, N.; Nakhaei, M.; Porhemmat, J. Assessment of hydrogeochemistry and contamination of Varamin deep aquifer, Tehran Province, Iran. Environ. Earth Sci. 2017, 76, 1–14. [Google Scholar] [CrossRef]
  93. Zaidi, F.K.; Nazzal, Y.; Jafri, M.K.; Naeem, M.; Amed, I. Reverse ion exchange as a major process controlling the groundwater chemistry in an arid environment: A case study from northwestern Saudi Arabia. Environ. Monit. Assess. 2015, 187, 1–19. [Google Scholar] [CrossRef] [PubMed]
  94. Wisitthammasri, W.; Chotpantarat, S.; Thitimakorn, T. Multivariate statistical analysis of the hydrochemical characteristics of a volcano sedimentary aquifer in Saraburi. J. Hydrol. Reg. Stud. 2020, 32, 100745. [Google Scholar] [CrossRef]
  95. Zhang, B.; Zhao, D.; Zhou, P.; Qu, S.; Liao, F.; Wang, G. Hydrochemical Characteristics of Groundwater and Dominant Water–Rock Interactions in the Delingha Area, Qaidam Basin, Northwest China. Water 2020, 12, 836. [Google Scholar] [CrossRef] [Green Version]
  96. Oelkers, E.H.; Declercq, J.; Saldi, G.D.; Gislason, S.R.; Schott, J. Olivine dissolution rates: A critical review. Chem. Geol. 2018, 500, 1–19. [Google Scholar] [CrossRef] [Green Version]
  97. Lee, J.M.; Koh, D.; Chae, G.; Kee, W.; Ko, K. Integrated assessment of major element geochemistry and geological setting of traditional natural mineral water sources in South Korea at the national scale. J. Hydrol. 2021, 598, 126249. [Google Scholar] [CrossRef]
  98. Kim, K. Plagioclase weathering in the groundwater system of a sandy, silicate aquifer. Hydrol. Process. 2002, 16, 1793–1806. [Google Scholar] [CrossRef]
  99. Chaïrat, C. Etude Expérimentale de la Cinétique et des Mécanismes d’altération de Minéraux Apatitiques. Application au Comportement d’une Céramique de Confinement d’actinides Mineurs. Géochimie. Ph.D. Thesis, Université Paul Sabatier—Toulouse III, Toulouse, France, 2005. Available online: https://tel.archives-ouvertes.fr/tel-00011686/document (accessed on 8 June 2020).
  100. Carol, E.S.; Kruse, E.E.; Laurencena, P.C.; Rojo, A.; Deluchi, M.H. Ionic exchange in groundwater hydrochemical evolution. Study case: The drainage basin of El Pescado creek (Buenos Aires province, Argentina). Environ. Earth Sci. 2012, 65, 421–428. [Google Scholar] [CrossRef]
  101. Ngounouno, I.; Deruelle, B.; Demaiffe, D.; Montigny, R. Petrology of the Cenozoic volcanism in the Upper Benue valley, northern Cameroon (Central Africa). Contrib. Mineral. Petrol. 2003, 145, 87–106. [Google Scholar] [CrossRef]
  102. Chang, J.; Wang, G. Major ions chemistry of groundwater in the arid region of Zhangye Basin, northwestern China. Environ. Earth Sci. 2010, 61, 539–547. [Google Scholar] [CrossRef]
  103. Juen, L.L.; Aris, A.Z.; Shan, N.T.; Yusoff, F.M.; Hashim, Z. Geochemical modeling of element species in selected tropical estuaries and coastal water of the Strait of Malacca. Procedia Environ. Sci. 2015, 30, 109–114. [Google Scholar] [CrossRef] [Green Version]
Figure 1. Study area with seventy-four sampling water points within five watersheds.
Water 13 03055 g001
Figure 2. Bi−plot for the general variation of variables and individuals (a) and their respective contributions (be) within watersheds studied in the R-NO.
Water 13 03055 g002
Figure 3. Bi−plot for the general variation of variables and individuals (a) and their respective contributions (be) within watersheds studied in the R-AD.
Water 13 03055 g003
Figure 4. Dendrogram of hierarchical cluster analysis based on water points within watersheds in the R-NO (a) and in R-AD (b).
Water 13 03055 g004
Figure 5. Box-whisker of DGW, SGW and SW in the R-NO (ac) and R-AD (df) portion of northern watersheds.
Water 13 03055 g005
Figure 6. Piper diagram showing hydrochemical facies of groundwaters (DGW, SGW) and surface water (SW) within the Benue, a part of the Mayo-Rey and Faro-et-Déo watersheds in the R-NO (a) and Djérem, Mbéré, and another part of the Mayo-Rey and Faro-et-Déo in the R-AD (b).
Water 13 03055 g006
Figure 7. Extended Durov plots of the analysed samples in the R-NO (a) and R-AD (b) portion of northern watersheds.
Water 13 03055 g007
Figure 8. Gibbs diagrams for the major ion composition of the groundwater in the R-NO (a) and R-AD (b) parts of northern watersheds.
Water 13 03055 g008
Figure 9. Relationships between major ion concentrations of groundwater samples collected in the R-NO portion of northern watersheds to discriminate hydrochemical processes. (a) (Ca2++ Mg2+) vs. HCO3, (b) Ca2++ Mg2+ vs. HCO3 + SO42−, (c) Mg2+ vs. Ca2+, (d) Mg2+ vs. HCO3, (e) Ca2+ vs. HCO3, (f) K+ vs. HCO3, (g) K+/Cl vs. Cl, (h) Ca2+/ Ca2++ SO42− vs. pH.
Water 13 03055 g009aWater 13 03055 g009b
Figure 10. Relationships between major ion concentrations of groundwater samples collected in the R-AD portion of northern watersheds to discriminate hydrochemical processes. (a) (Ca2+ + Mg2+) vs. HCO3, (b) Ca2+ + Mg2+ vs. HCO3 + SO42−, (c) Mg2+ vs. Ca2+, (d) Mg2+ vs. HCO3, (e) Ca2+ vs. HCO3, (f) K+ vs. HCO3, (g) K+/Cl vs. Cl, (h) Ca2+/ Ca2+ + SO42− vs. pH.
Water 13 03055 g010aWater 13 03055 g010b
Table 1. Loading for varimax rotated factor matrix of sept-factors explaining 77.65% of the total variance.
ParametersCP1CP2CP3CP4CP5CP6CP7
TH0.8450.2030.1090.2970.220 0.108
Mg2+0.824 0.2320.171
pH0.777 −0.182−0.227−0.2120.161−0.198
TAC0.6550.528 0.170 0.157
Ca2+0.6510.4960.2170.3260.243 0.137
NH4+−0.480−0.294−0.103 0.3840.2900.441
Turb. 1 −0.881 0.120
Mn2+−0.217−0.750 −0.1810.108
F0.1720.585 0.1780.162−0.1930.327
NO3 0.1080.956
NO2 0.1110.955
K+−0.130−0.1120.7110.343 −0.172−0.122
SDT0.3590.280 0.7980.209
CE0.3590.281 0.7980.209
Al3+0.2080.140−0.155−0.5800.447−0.238−0.115
Cl 0.102 0.8210.122
SO42− 0.2810.700 0.193
T −0.1050.808
PO43−−0.216−0.187 −0.266−0.7090.177
Fe2+ −0.883
Eigenvalues3.5422.5902.4942.1971.9061.4841.317
Explained variance %17.70912.95112.47110.9849.5317.4206.583
Cumulative % of variance17.70930.65943.13054.11463.64671.06677.649
1 Turb. = Turbidity. Values less than ±0.10 were eliminated. Bold values indicate strong and moderate loadings.
Table 2. Loading for varimax rotated factor matrix of six-factors explaining 72.24% of the total variance.
ParametersCP1CP2CP3CP4CP5CP6
NO30.830−0.401 −0.104−0.179
NO20.830−0.405 −0.171
K+0.788 0.194−0.1530.298−0.116
Cl0.7790.108 0.140
Ca2+0.6490.347 0.278−0.171−0.244
TAC0.1010.7830.219−0.150−0.181
Mg2+0.5600.732 0.112
TH0.6560.705
Mn2+0.579−0.6170.110−0.1790.176
PO43−0.277−0.469 −0.307−0.1860.432
SDT−0.114−0.1980.9180.102−0.1940.103
CE−0.121−0.1980.9130.108−0.208
F 0.4450.593
pH 0.430−0.158−0.724
NH4+0.421−0.3080.1130.4790.355−0.211
SO42−0.2200.380−0.2310.444 0.310
T 0.141 0.700
Al3+−0.258 0.204−0.2110.388−0.220
Turb 1 −0.1750.4180.1460.690
Fe2+ −0.1550.361−0.407−0.441
Eigenvalues3.9213.7302.3021.7781.4141.304
Explained variance %19.60318.64811.5098.8917.0716.519
Cumulative % of variance19.60338.25149.76058.65265.72272.242
1 Turb. = Turbidity. Values less than ±0.10 were eliminated. Bold values indicate strong and moderate loadings.
Table 3. Chemical characteristics of drinking water resources in the R-NO portion of northern watersheds.
S(N)Captured
Aquifers
WatershedsStation IDpHTDSTHTACpHsLSIRSIWater Types
N1BasementMayo-ReyDGW7.1312.80468.02304.92−2.019.14−11.15Mg-Ca-HCO3
N2BasementMayo-ReySGW7.1119.20252.41254.10−1.828.93−10.75Mg-Ca-HCO3
N3BasementMayo-ReySGW7.37665.60738.84203.28−0.617.98−8.59Mg-Ca-HCO3
N4ISMayo-ReySGW6.9925.60234.01177.87−1.238.22−9.44Mg-Ca-HCO3
N5ISMayo-ReyDGW7.2012.80217.97203.28−1.798.99−10.79Mg-Ca-HCO3
N6BasementBenueSGW7.4512.80300.53127.05−1.378.82−10.18Mg-Ca-HCO3
N7BasementBenueSGW7.1312.80167.49203.28−1.578.70−10.27Mg-Ca-HCO3
N8BasementBenueSGW7.3812.801266.29177.87−1.818.90−11.00Mg-HCO3
N9BasementBenueSGW7.346.40234.01101.64−1.579.19−10.45Mg-Ca-HCO3
N10BasementBenueSW7.706.40351.02127.05−1.859.55−11.40Mg-Ca-HCO3
N11BasementBenueDGW7.476.40803.00660.66−2.9810.45−13.44Mg-Ca-HCO3
N12ISBenueSW7.536.40250.05127.05−1.358.88−10.22Mg-HCO3
N13ISBenueDGW7.7012.80621.83355.74−2.6110.31−12.91Mg-Ca-HCO3
N14BasementBenueSGW7.6812.8300.5376.23−1.188.86−10.04Mg-Ca-HCO3
N15BasementBenueDGW7.526.40734.11152.46−2.079.59−11.65Mg-Ca-HCO3
N16ISBenueDGW7.63128.00234.01228.69−0.718.34−9.04Mg-HCO3
N17ISBenueDGW8.09480.00568.99482.79−0.908.99−9.90Mg-Ca-HCO3
N18ISBenueSGW7.0812.80334.98203.28−1.959.03−10.98Mg-Ca-HCO3
N19ISBenueSGW7.03787.201004.93355.74−0.847.87−8.71Mg-Ca-HCO3
N20BasementBenueDGW7.85422.40669.95559.02−1.118.96−10.07Mg-Ca-HCO3
N21BasementBenueDGW7.88416.00803.00457.38−1.108.98−10.08Mg-Ca-HCO3
N22BasementBenueDGW7.80352.00669.95431.97−1.098.89−9.98Mg-Ca-HCO3
N23BasementBenueSW7.9364.001000.20127.05−1.028.95−9.97Mg-HCO3
N24BasementBenueDGW7.85512.001020.97584.43−1.199.04−10.24Mg-Ca-HCO3
N25BasementBenueDGW7.74358.40685.99431.97−1.018.75−9.77Mg-Ca-HCO3
N26BasementBenueDGW7.866.40718.07431.97−2.6210.48−13.11Mg-Ca-HCO3
N27BasementBenueDGW7.8719.20217.97203.28−1.609.47−11.08Mg-Ca-HCO3
N28BasementBenueDGW7.58486.40887.92574.27−1.218.79−10.00Mg-Ca-HCO3
N29BasementBenueDGW7.4476.80234.01127.05−0.608.04−8.64Mg-Ca-HCO3
N30BasementBenueSW7.4451.20234.01127.05−0.728.16−8.89Mg-Ca-HCO3
N31BasementBenueDGW7.24172.80217.97127.05−0.427.66−8.07Mg-Ca-HCO3
N32BasementBenueSW7.4376.80100.97152.46−0.728.15−8.88Mg-Ca-HCO3-Cl
N33BasementFaro-et-DéoDGW7.276.40234.01152.46−1.839.10−10.92Mg-Ca-HCO3
N34BasementFaro-et-DéoDGW7.046.40167.49127.05−1.718.75−10.46Mg-Ca-Cl-HCO3
N35BasementBenueDGW7.2738.40318.94254.10−1.658.92−10.57Mg-Ca-HCO3
N36BasementBenueSW7.4932.00601.07177.87−1.549.03−10.56Mg-Ca-HCO3
N37BasementBenueDGW7.36697.60954.44431.97−0.928.28−9.20Mg-Ca-HCO3
N38BasementBenueDGW7.78403.201020.97584.43−1.289.06−10.34Mg-Ca-HCO3
N39BasementBenueDGW8.0112.80871.88686.07−2.8810.89−13.77Mg-Ca-HCO3
N40BasementBenueDGW8.076.40770.92431.97−2.8910.96−13.86Mg-Ca-HCO3
S(A) = samples in the R-AD, IS = intergranular sedimentary, SW = surface water, SGW = shallow groundwater, DGW = deep groundwater, nd = not defined.
Table 4. Chemical characteristics of drinking water resources in the R-AD portion of northern watersheds.
S(A)Captured
Aquifers
WatershedsStation IDpHTDSTHTACpHsLSIRSIWater Types
A1VolcanicMayo-ReySGW8.640.00334.98203.28ndndndMg-Ca-HCO3
A2BasementMayo-ReyDGW6.8312.80167.49101.64−1.178.00−9.16Mg-Ca-HCO3
A3BasementMayo-ReySGW6.9012.80402.38101.64−1.838.73−10.56Mg-Ca-HCO3
A4VolcanicFaro-et-DéoDGW8.279.60100.97101.64−1.329.59−10.90Mg-Ca-HCO3
A5BasementDjéremDGW8.216.40167.49152.46−1.689.89−11.57Mg-Ca-HCO3
A6BasementDjéremDGW7.876.40234.01101.64−1.529.39−10.91Mg-Ca-HCO3
A7BasementDjéremDGW7.8283.20167.49177.87−0.658.47−9.12Mg-Ca-HCO3
A8BasementDjéremDGW7.486.40234.01111.6−1.498.97−10.46Mg-Ca-HCO3
A9BasementDjéremSGW7.546.40117.0176.23−1.088.62−9.69Mg-Ca-HCO3
A10BasementDjéremSGW7.556.40117.0191.48−1.188.73−9.92Mg-Ca-HCO3
A11BasementDjéremSGW7.696.40100.9791.48−1.479.16−10.63Mg-Ca-HCO3
A12BasementDjéremSGW8.286.40334.98152.46−2.0010.28−12.27Mg-Ca-HCO3
A13BasementDjéremDGW8.246.40234.0150.82−1.249.48−10.72Mg-Ca-HCO3
A14BasementDjéremSGW8.233.20167.4976.23−1.699.92−11.61Mg-Ca-HCO3
A15BasementDjéremSGW8.266.40167.6966.07−1.329.58−10.89Mg-Ca-HCO3
A16BasementDjéremSGW8.246.40167.4966.07−1.329.56−10.88Mg-Ca-HCO3-Cl
A17BasementDjéremSW8.256.40167.69127.05−1.629.87−11.50Mg-Ca-HCO3
A18 BasementDjéremDGW7.596.40234.01101.64−1.549.13−10.67Mg-Ca-HCO3
A19BasementDjéremSGW7.6428.80234.0150.82−0.588.22−8.80Mg-Ca-HCO3
A20BasementDjéremSGW7.426.40468.0250.82−1.548.96−10.51Mg-Ca
A21BasementDjéremDGW8.186.40234.01193.12−1.8810.06−11.93Mg-Ca-HCO3
A22BasementDjéremDGW8.160.00217.9776.23ndndndMg-Ca-HCO3
A23BasementDjéremDGW8.303.20867.16228.69−2.4910.79−13.27Mg-HCO3
A24BasementDjéremDGW8.276.40284.49218.53−2.0310.30−12.33Mg-Ca-HCO3
A25BasementDjéremDGW8.266.40167.69101.64−1.519.77−11.29Mg-Ca-HCO3
A26BasementDjéremDGW8.246.40117.0176.23−1.099.33−10.42Mg-Ca-HCO3
A27BasementDjéremDGW8.386.40468.02330.33−2.3410.72−13.05Mg-Ca-HCO3
A28BasementDjéremDGW8.256.40234.01101.64−1.529.77−11.29Mg-Ca-HCO3
A29BasementDjéremDGW8.276.40250.0576.23−1.089.35−10.43Mg-HCO3
A30BasementDjéremDGW8.256.40446.88152.46−1.699.94−11.63Mg-HCO3
A31BasementMbéréSGW8.306.40667.59203.28−2.1110.41−12.51Mg-Ca-HCO3
A32BasementMbéréDGW8.296.40346.8791.48−1.7610.05−11.82Mg-Ca-HCO3-Cl
A33BasementMbéréSGW8.376.40601.07203.28−2.1210.49−12.61Mg-Ca-HCO3-Cl
A34BasementMbéréSGW8.286.40284.49142.30−1.8410.12−11.96Mg-Ca-HCO3
S(A) = samples in the R-AD, SW = surface water, SGW = shallow groundwater, DGW = deep groundwater, nd = not defined.
Table 5. Dissolution of minerals, reactions, and ions ratio in the groundwater within watersheds of the R-NO and the R-AD.
ReactionsReaction Equations of Minerals DissolutionRatio
a 3 CaMg ( CO 3 ) 2 (dolomite) + 2 H 2 O + 2 CO 2     Ca 2 + + Mg 2 + + 4 HCO 3 Ca:HCO3 = 1:2; Mg:HCO3 = 1:2
a 4 Ca 0.4 Mg 0.9 Fe 0.2 Si 2 O 6 (Clinopyroxene) + 3.8 CO 2 + 2.4 H 2 O ↦ 0.4 Ca 2 + + 0.9 Mg 2 + + 2 SiO 2 + 3.8 HCO 3 + 0.4 H + + 0.2 Fe OH 3 Ca:HCO3 = 0.4:1.9;
Mg:HCO3 = 0.9:1.9
b 5 MgFe 2 SiO 4 (olivine) + 4 CO 2 + 2 H 2 O ↦ 2 Mg 2 + + 2 Fe 2 + + SiO 2 + 4 HCO 3 Mg:HCO3 = 1:2
a 6 Ca 2 Mg 4 Si 8 O 22 OH 2 (Amphibole) + 14 CO 2 + 22 H 2 O   2 Ca 2 + + 4 Mg 2 + + 14 HCO 3 + 8 H 4 SiO 4 Ca:HCO3 = 2:7; Mg:HCO3 = 4:7
c 7 2 k ( Mg 2 Fe ) ( AlSi 3 ) O 10 OH 2 (Biotite) + 4 CO 2 + 6 H 2 O + 4 CO 2 + 6 H 2 O   Al 2 Si 2 O 5 OH 4 + 2 K + + 4 Mg 2 +   2 Fe 2 +   4 H 4 SiO 4 + 8 HCO 3 Mg:HCO3 = 2:4; K:HCO3 = 1:4
d 8 Mg 0.9 Fe 0.2 Si 2 O 6 (Orthopyroxene) + 3.8 CO 2 + 2.4 H 2 O ↦ 0.9 Mg 2 + + 2 SiO 2 + 3.8 HCO 3 + 0.4 H + + 0.2 Fe OH 3 Mg:HCO3 = 0.9:1.9
e 9 MgAl 2 O 4 (Spinel) + CO 2 + 3 / 2 H 2 O ↦ Mg 2 + + Al 2 O 3 + 2 HCO 3 Mg:HCO3 = 1:2
c 10 2 CaAl 2 Si 2 O 8 (anorthite) + 4 CO 2 + 6 H 2 O ↦ 2 Ca 2 + + Si 4 O 10 Al 4 OH 8   + 4 HCO 3 Ca:HCO3 = 1:2
f 11 Ca 10 ( PO 4 ) 6 F 2 (Fluorapatite) + 6 CO 2 + 6 H 2 O ↦ 10 Ca 2 + + 6 HPO 4 2 + 2 F + 6 HCO 3 Ca:HCO3 = 5:3
a 12 2 KAlSi 3 O 8 (K-feldspar) + 9 H 2 O + 2 H 2 CO 3     Al 2 Si 2 O 5 OH 4   + 2 K + + 2 HCO 3 + 4 H 4 SiO 4 K: HCO3 = 1:1
Note: a [95], b [96], c [97], d [98], e [27], f [99].
Publisher’s Note: MDPI stays neutral with regard to jurisdictional claims in published maps and institutional affiliations.

