
Effects of Combined Nitrogen Deficient and Mixotrophic (+Glucose) Culture on the Lipid Accumulation of Parachlorella Kessleri TY


1
School of Chemical and Biological Engineering, Taiyuan University of Science and Technology, Taiyuan 030024, China
2
School of Life Science, Shanxi Key Laboratory for Research and Development of Regional Plants, Shanxi University, Taiyuan 030006, China
3
School of Environmental Science and Engineering, Taiyuan University of Science and Technology, Taiyuan 030024, China
*
Author to whom correspondence should be addressed.
Water 2021, 13(21), 3066; https://doi.org/10.3390/w13213066
Submission received: 24 September 2021
/
Revised: 27 October 2021
/
Accepted: 28 October 2021
/
Published: 2 November 2021
(This article belongs to the Special Issue Water Pollution and Its Impact on Human Health)
Abstract
:The combustion explosion of ordinary diesel is a global environmental problem. Green microalgae, which do not cause eutrophication, are a raw material that can be used to clean biodiesel. To increase lipid productivity, this study used a nitrogen deficient & mixotrophic (+Glucose) culture of lipid-producing microalgae Parachlorella kessleri TY from Shanxi Province, China. To examine the growth of P. kessleri TY, we measured dry weight, chlorophyll content, and chlorophyll fluorescence intensity under different culture conditions, in addition to the contents of neutral lipids, total lipids, and fatty acids, to examine its lipid accumulation ability. Cells were cultured in autotrophic, nitrogen deficient, mixotrophic (+Glucose), and nitrogen deficient & mixotrophic (+Glucose) conditions for 7 days. We found the growth of P. kessleri TY under nitrogen deficient & mixotrophic conditions was higher than that under the autotrophic and nitrogen deficient conditions, but lower than that under the mixotrophic (+Glucose) conditions. However, its lipid accumulation ability was significantly higher than that of control cultures. In conclusion, P. kessleri TY cultured under nitrogen-deficient and mixotrophic (+Glucose) conditions has significant lipid production capacity. Our results provide a theoretical basis for the use of microalgae as a raw material in the production of biodiesel, and promote the application of P. kessleri TY in large-scale production.
1. Introduction
As a result of socio-economic growth, the global demand for energy has multiplied, and the world’s staggering energy consumption has prompted researchers to search for new renewable and environmentally friendly fuels. The components of ordinary diesel engine emission pollutants are complex and include some unconventional pollutants that have significant impacts on the atmospheric environment and human health, such as polycyclic aromatic hydrocarbons (PAHs) and oxygen-containing hydrocarbons. Diesel exhaust contains gaseous and particulate PAHs and nitro-PAHs, which are considered to have carcinogenic effects on the human body under high concentrations and long-term exposure [1]. Biodiesel is considered a clean fuel, and the pollutant emission characteristics of biodiesel are different from those of ordinary diesel. Furthermore, their impacts on human health are also different. It was reported that biodiesel with rapeseed oil and soybean oil as raw materials reduces PAH emission from diesel engines [2]. As such, biodiesel is a promising alternative fuel. The use of biodiesel can reduce the harm of diesel engine emissions to the atmospheric environment and human health.
However, ordinary biodiesel (such as animal fats) can pollute water bodies, because water pollution occurs mainly due to eutrophication caused by the accumulation of nutrients such as N and P in rivers and lakes. Microalgae are an environmental protection plant, which has a positive remediation effect on pollution caused by water eutrophication. In addition, microalgae are one of the best raw materials for biodiesel production. Because of their short growth cycle, high photosynthetic efficiency, high lipid content, and simple growth, microalgae are known as the “green oil field”. In this study, the combination of nitrogen deficient and concurrent cultures of microalgae did not only increase the lipid content, but also reduced nitrogen, and thus did not cause eutrophication of water. Therefore, it is of great significance to promote green and sustainable development.
Although there are many reports on the study of nitrogen deficient cultures of microalgae under autotrophic conditions to improve their lipid content [3,4,5,6,7], and some studies of the lipid accumulation of microalgae in heterotrophic (or mixotrophic) cultures [8,9,10], there are few reports on the combination of heterotrophic (or mixotrophic) conditions and nitrogen deficient conditions for cultivation. This may be due to the limited number of algae suitable for growth in heterotrophic (or mixotrophic) conditions.
The algal species Parachlorella kessleri TY examined in this study is suitable for both nitrogen deficient [11] and mixotrophic (+Glucose) cultures. Previous studies have shown that P. kessleri TY can improve the lipid content of microalgae under nitrogen deficient conditions; however, the low biomass is associated with low lipid productivity. Moreover, it was also found that P. kessleri TY is suitable for growth under heterotrophic and mixotrophic (+Glucose) growth conditions, and its biomass, lipid content, and lipid productivity were all higher than those under autotrophic conditions, and the mixotrophic (+Glucose) culture was more conducive to the accumulation of lipids and more suitable for biodiesel production. However, the lipid content under the condition of mixotrophic (+Glucose) was still lower than that under the condition of nitrogen deficient. The goal of obtaining a high biomass of algal cells while achieving the highest lipid productivity is addressed in this study.
Previous studies have adopted two-stage cultures to cultivate microalgae to simultaneously obtain high biomass and high lipid content [12,13], indicating that the combination of nitrogen deficient cultures and additional carbon sources can have a certain impact on the lipid productivity of microalgae. However, the balance of nutrient consumption and supplementation in the culture medium must be maintained in two-stage cultures, thisrequires a high cost, and the process is tedious, so it is not applicable.
Biomass productivity and lipid accumulation of algae were also different under culture conditions that used different carbon sources. The presence of Parachlorella combined with a lack of nutrients and heterotrophic (or mixotrophic (+Glucose)) culture has not been reported. Therefore, in P. kessleri TY, we combined a nitrogen deficient with added carbon sources to observe and analyze the changes in biomass productivity, lipid content, and fatty acid content, and determined whether the combinations were more conducive to the accumulation of lipid as the raw material of biodiesel. Our findings lay a foundation for the co-culture of microalgae, and also have great significance for enhancing the lipid productivity of microalgae and applying it to large-scale production in the future.
2. Materials and Methods
2.1. Algal Strain and Cultivation
The experimental algal species used in this study was the high lipid green algae P. kessleri TY from Shanxi Province, China. The algal strains were first cultured in Tris-acetate-phosphate (TAP) [14] full medium. The pH was 7.0 ± 0.1, and the culture conditions were as follows: a temperature of 25 ± 1 °C; a light:dark ratio of 12:12 h; and a light intensity of 3000 lux. Cultures were incubated in a shaking incubator (HY-5A, Guohua, Changzhou, China) with continuous shaking at 150 rpm. After the algal strain reached the logarithmic stage, the culture was centrifuged (5000 rpm/min, 10 min) to obtain an algal pellet, which was placed in a 1 L conical flask and further cultured (culture medium was no more than 700 mL). The initial dry weight of the inoculation was approximately 0.07 g/L. The experiment was divided into the nitrogen sufficient & autotrophic, nitrogen deficient, and mixotrophic (+Glucose) culture group (nitrogen deficient: TAP without nitrogen source, replaced NH4Cl with NaCl, mixotrophic (+Glucose) culture: the TAP medium was supplemented with 10 g/L of glucose); the nitrogen deficient, nitrogen sufficient & autotrophic culture group (control group 1); the nitrogen deficient culture group (control group 2); and the mixotrophic (+Glucose) culture group (control group 3). Each group had three replicates, and was cultured for 7 d as indicated. The samples were analyzed every day.
2.2. Determination of Biomass and Biomass Productivity
The method used in this study followed that of Lv et al. [15], with some changes made, and the biomass of the algal solution was measured. The biomass of the algal solution was expressed as the dry weight. In brief, 10 mL of algal cultivation broth was filtered, pre-dried on a 0.45 μm membrane, dried to a constant weight, and weighed. The difference in quality between the two values was recorded as the algal dry weight. The formula was as follows:
where DW is the microalgal dry weight (g/L), m1 (g) is the constant dry weight of the filter membrane, m2 (g) is the total weight of the filter membrane and algal solution after extraction and filtration, and V (L) is the volume of the algal cultivation broth in Equation (1).
where BP (mg/(L·d)) is the biomass productivity of the alga, DW (g) is the dry weight of the algal powder, and T (d) is the time of the cultivation in Equation (2).
2.3. Determination of Pigment Contents
According to the method of Mera et al. [16], the contents of chlorophyll and carotenoids were determined. Firstly, 3 mL of the algal solution was collected every day, and centrifuged (5000 rpm/min, 10 min). The supernatant was discarded and 3 mL of 95% ethanol was added and mixed. Cell walls of the algal strain were broken (20%, 10 min) with an ultrasonic crushing instrument (SCIIENTZ-IID, Scientz, Ningbo, China). The mixture was wrapped in tin foil and placed in a refrigerator at 4 °C (darkness and low temperature) and pigments were extracted for 24 h. After 24 h, the sample was removed and centrifuged (5000 rpm/min, 10 min). The obtained supernatant was collected for subsequent experiments. A solution of 95% alcohol served as the blank control, and the absorbance at 649, 665, and 470 nm was determined using a UV spectrophotometer (TU-1810, Persee, Beijing, China). The pigment content was calculated according to the following formulae:
where Chl. a (mg/L) is the content of chlorophyll a (mg/L) in algal cells in Equation (3), Chl. b (mg/L) is the content of chlorophyll b (mg/L) in algal cells in Equation (4), Chl. (a + b) is the content of total chlorophyll in Equation (5), and Car. (mg/L) is the content of carotenoids in Equation (6).
2.4. Determination of Chlorophyll Fluorescence
To further investigate the effect of nitrogen deficiency on the photosynthetic activity of P. kessleri TY, three indicators of PSII activity were measured with a portable PAM fluorometer (AquaPen-C AP-C 100, EcoTech, Beijing, China). This reflected the photosynthetic capacity of algae. The method of chlorophyll fluorescence was determined according to Markou et al. [17]. The parameters were measured after 3 mL of the algal solution was treated in a dark reaction for 20 min; the indexes included the maximum quantum yield of photosystem II photochemistry (Fv/Fm), the potential activity of photosystem II (Fv/Fo), and the total light energy flux (PIABS values).
2.5. Determination of Neutral Lipid Content
Nile Red (NR) is a fluorescent dye soluble in lipid, which can be used to detect the neutral lipid content of cells. Neutral lipids react with NR to form bright yellow fluorescence, so the fluorescence intensity is an indicator of the neutral lipid content [18].
2.6. Determination of Total Lipid Content and Fatty Acid Composition
2.6.1. Determination of Total Lipid Content
The algal solution was centrifuged (5000 rpm/min, 10 min), and the algal mud was stored in a freeze dryer (18ND, Scientz, Ningbo, China). The dried algal powder was weighed and 0.1 g (w1, g) was placed in a 5 mL empty glass bottle, which was also weighed again (w2, g). Thereafter, 3 mL of methanol and 1.5 mL of chloroform were added to the algal powder, followed by mixing, crushing with an ultrasonic crushing machine (25%, 10 min), and centrifugation (5000 rpm/min, 10 min). The upper phase was removed, and 1.5 mL of 0.75% KCl solution and 1.5 mL of chloroform were added, followed by mixing and centrifugation (5000 rpm/min, 10 min). The lower phase was removed. The above steps were repeated two times, and all collected liquids were combined in a 5 mL glass bottle, dried with nitrogen, then redissolved with an appropriate amount of chloroform/methanol (2:1, v/v) solution. The total lipid extract was transferred to a CNWBOND Carbon-GCB solid phase extraction column (CNW, Frankfurt, Germany) for chlorophyll removal. Later, the filtrate was collected and blow dried with nitrogen. Finally, it was weighed (w3, g) [19]. Three repetitions were established for each group. The formula was as follows:
where LC (% DW) is the weight percentage of the total lipid in the algal powder, w1 (g) is the dry weight of the algal powder, w2 (g) is the weight of the empty bottle, and w3 (g) is the total weight of the algal lipids (after removing chlorophyll) and the glass bottle after the algal lipids were extracted. LP (mg/(L∙d)) is the lipid productivity of the algae in Equation (8).
2.6.2. Determination of Fatty Acid Composition
The extracted algal oil was methylated. The dried algal oil was dissolved in chloroform, and transferred to a 1.5 mL Agilent bottle. Thereafter, 1 mL of 1 mol/L sulfuric acid methanol solution was added, the bottle was filled with nitrogen and sealed, heated in a 100 °C water bath for 1 h, and cooled to room temperature. Thereafter, 200 μL of ultra-pure water was added and mixed. The organic phase was added to another 1.5 mL Agilent bottle and dried with nitrogen [20].
The sample was analyzed by gas chromatography-mass spectrometry (GC-MS) (7890A-5975C, Agilent, Santa Clara, CA, USA). For GC-MS analysis, the column RTW-WAX (30 m × 0.25 mm, 0.5 μm) at a temperature program was used to start from 50 to 150 °C and maintained for 2 min, increased to 200 °C at a rate of 10 °C/min and maintained for 6 min, increased to 230 °C at a rate of 10 °C/min for 30 min, and increased to 240 °C at a rate of 10 °C/min for 10 min. The carrier gas was nitrogen at a flow velocity of 0.35 mL/min and the electron ionization (EI) source had an electron energy of 70 eV. The mass spectrum scanning range was m/z 20–450 and the sample size was 0.2 μL. The mass spectral data base NIST 05 was used. The molecular structure of each component was determined and its relative content was calculated using the peak area normalization method [21].
2.7. Determination of Total Carbohydrate Content
Similarly, 0.1 g of algal powder was weighed, and 6 M HCl was heated in a water bath at 100 °C for 30 min. After cooling, the solution was neutralized with 6 M NaOH, and the supernatant was centrifugated [22]. Total carbohydrates were extracted using the phenol sulfuric acid method. An aliquot was obtained, and 1.5 mL of distilled water was added, followed by 1 mL of 9% phenol solution and 5 mL of concentrated sulfuric acid solution. The solution was allowed to stand for 30 min. UV spectrophotometry was used for the determination of the total carbohydrate content at 485 nm. A sucrose solution served as the standard, a standard curve was generated, and the content was calculated against the standard curve [22,23]. The content of carbohydrates was converted, and the formula was as follows:
where CSC is the content of carbohydrate in the sample (% DW), C1 is the content of carbohydrate according to the standard curve (μg), VT1 is the total volume of the extract (mL), dr is the dilution factor, VS1 is the amount added in the determination (mL), and WF1 is the dry weight of the sample [22].
2.8. Determination of Total Protein Content
The algal solution was centrifuged and freeze dried under different culture conditions. Approximately 0.1 g algal of freeze-dried powder was weighed. PBS was added, and cells were crushed with a cell breaker for 10 min to crush the cell walls. The determination of protein content was undertaken with reference to He et al. [24], the determination of protein content referred to the method of Guo [25], and the content was calculated against the standard curve. The protein content was converted, and the formula was as follows:
where CSP is the protein content in the sample (% DW), C2 is the protein content according to the standard curve (μg), VT2 is the total volume of the extract (mL), VS2 is the amount of sample added during the determination (mL), and WF2 is the dry weight of the sample [24].
2.9. Statistical Analysis
The experiment was replicated three times. All data are expressed as mean ± standard error of the mean (SEM). A completely randomized design was used. A t-test was used to determine the statistical significance of differences between mean values at p ≤ 0.05 [26]. All statistical analyses were carried out using SPSS 19.0 software (IBM Inc., Chicago, IL, USA).
3. Results
3.1. Analysis of Changes in Growth
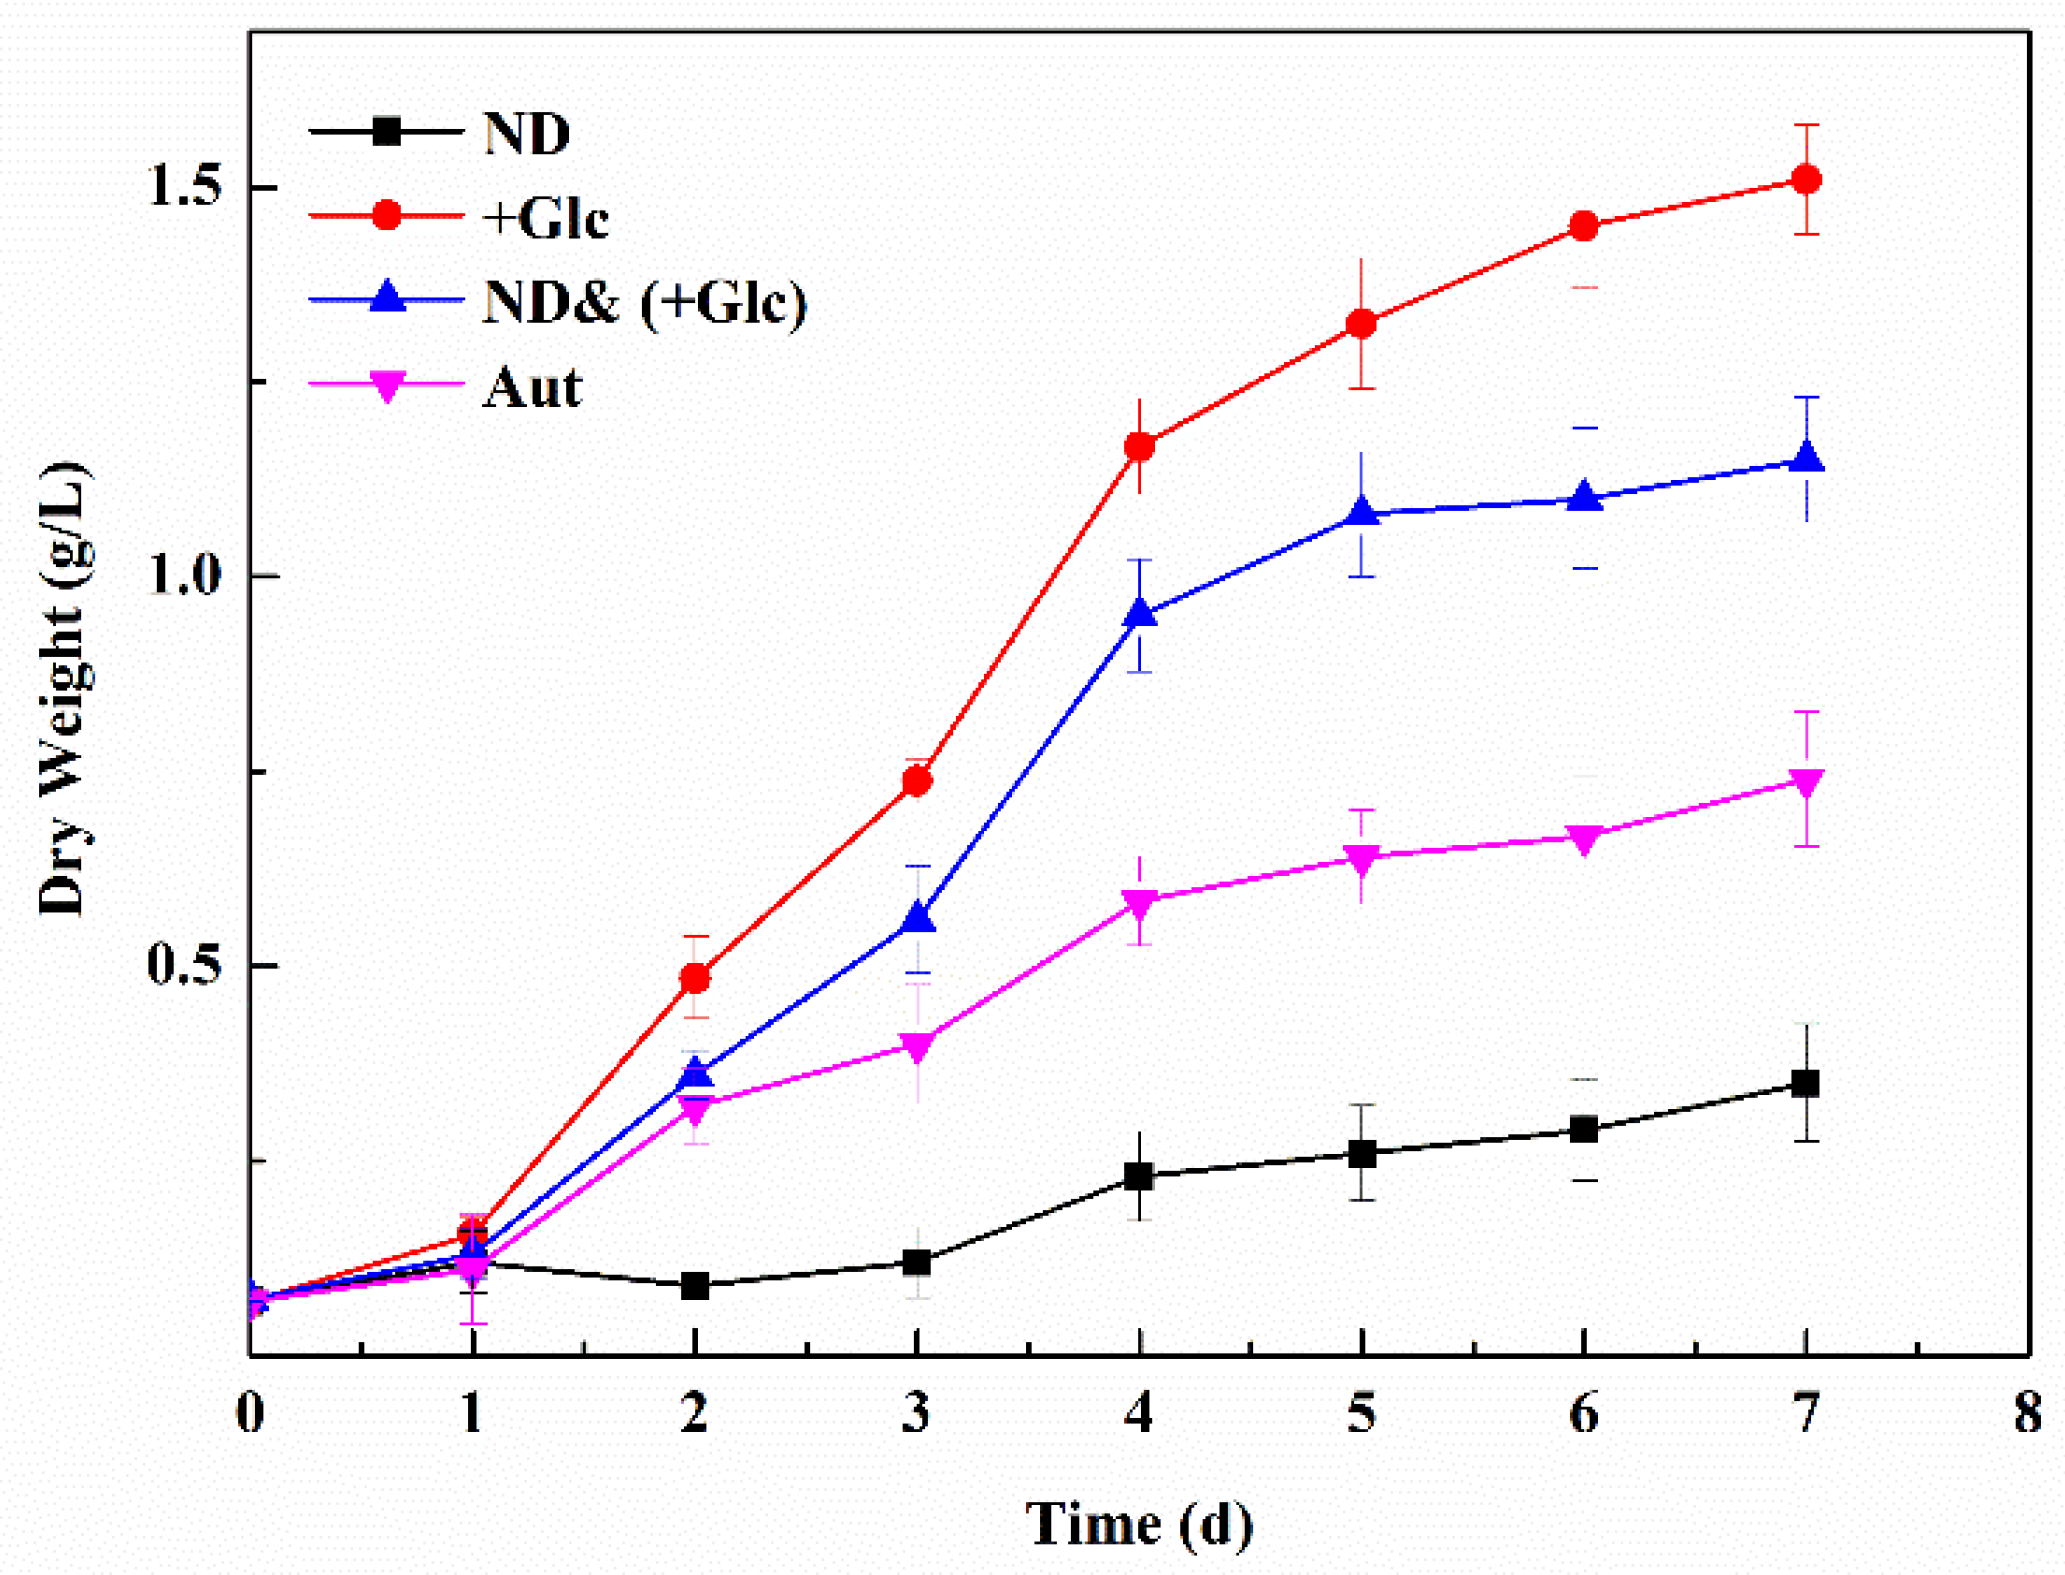
The dry weight of biomass of P. kessleri TY increased under the conditions of the autotrophic, nitrogen deficient, and mixotrophic (+Glucose) culture and the nitrogen deficient, nitrogen deficient & mixotrophic (+Glucose) culture. During days 1–4, the autotrophic group, the nitrogen deficient group, and the nitrogen deficient & mixotrophic (+Glucose) groups entered the logarithmic stage. On day 4, the biomass then began to grow slowly, and their growth trend was significantly higher than that of the nitrogen deficient group. On day 7, the dry weight of the deficiency & mixotrophic (+Glucose) group reached 1.15 g/L, which was higher than that of the autotrophic group and nitrogen deficient group, but lower than that of the mixotrophic (+Glucose) group (Figure 1). The rank of the biomass productivity was the same as the dry weight of biomass (Table 1). The biomass productivity in the nitrogen deficient & mixotrophic (+Glucose) group was about 164.29 mg/(L·d), lower than that in the mixotrophic (+Glucose) group but higher than that in the autotrophic group and nitrogen deficient group. The biomass productivity was about 1.56 times that in the autotrophic group, 3.3 times of that in the nitrogen deficient group, and 0.76 times that in the mixotrophic (+Glucose) group. It was indicated that the increased carbon source could improve the dry weight and biomass productivity of P. kessleri TY, whereas the nitrogen deficient could inhibit its growth. When the nitrogen deficient and the mixotrophic (+Glucose) condition acted on the algal cells at the same time, the dry weight and biomass productivity were affected by the nitrogen element and the carbon source. For P. kessleri TY, its growth was more affected by carbon sources than nitrogen.
In this study, the growth results of P. kessleri TY under mixotrophic (+Glucose) and autotrophic conditions were similar to those of Wan et al. [9] and Girard et al. [27]. Wan studied the growth of Nannochloropsis oculata CCMP 525, Dunaliella salina FACHB 435, and Chlorella sorokiniana CCTCC M209220 under mixotrophic and autotrophic growth conditions (a temperature of 25 °C, and a light intensity of 20,000 lux with light:dark cycles of 12:12 h). In Wan et al.’s study, glucose was used as the carbon source for mixotrophy, but the optimal glucose concentrations required for different microalgae were different. For example, N. oculata CCMP 525, D. salina FACHB 435, and C. sorokiniana CCTCC M209220 had the highest biomass when the glucose concentration was 10, 15, and 10 g/L, respectively. The biomasses were higher than those under autotrophic conditions (1.4, 2.2, and 4.2 times, respectively). Girard et al. reported the growth of Scenedesmus obliquus under mixotrophic and autotrophic conditions (a temperature of 22.5 °C, 100 μmol m−2 s−1, a light intensity of 5000 lux with light:dark cycles of 16:8 h. S. obliquus was cultured in the presence of lactose in cheese whey permeate as the carbon source (40% of the medium volume), and its growth was significantly better than that under autotrophic conditions. In the presence of a carbon source, it grew rapidly during days 1–6, and then slowed to a stable growth rate during days 7–13. Mixotrophic culture conditions promoted the growth of algae. However, the temperature, light intensity, and light-to-dark ratio of different algae species were different, and the concentration of the carbon source was also different under the mixotrophic condition. The addition of an optimal concentration of the carbon source is important for the growth of microalgae.
3.2. Analysis of Pigment Content
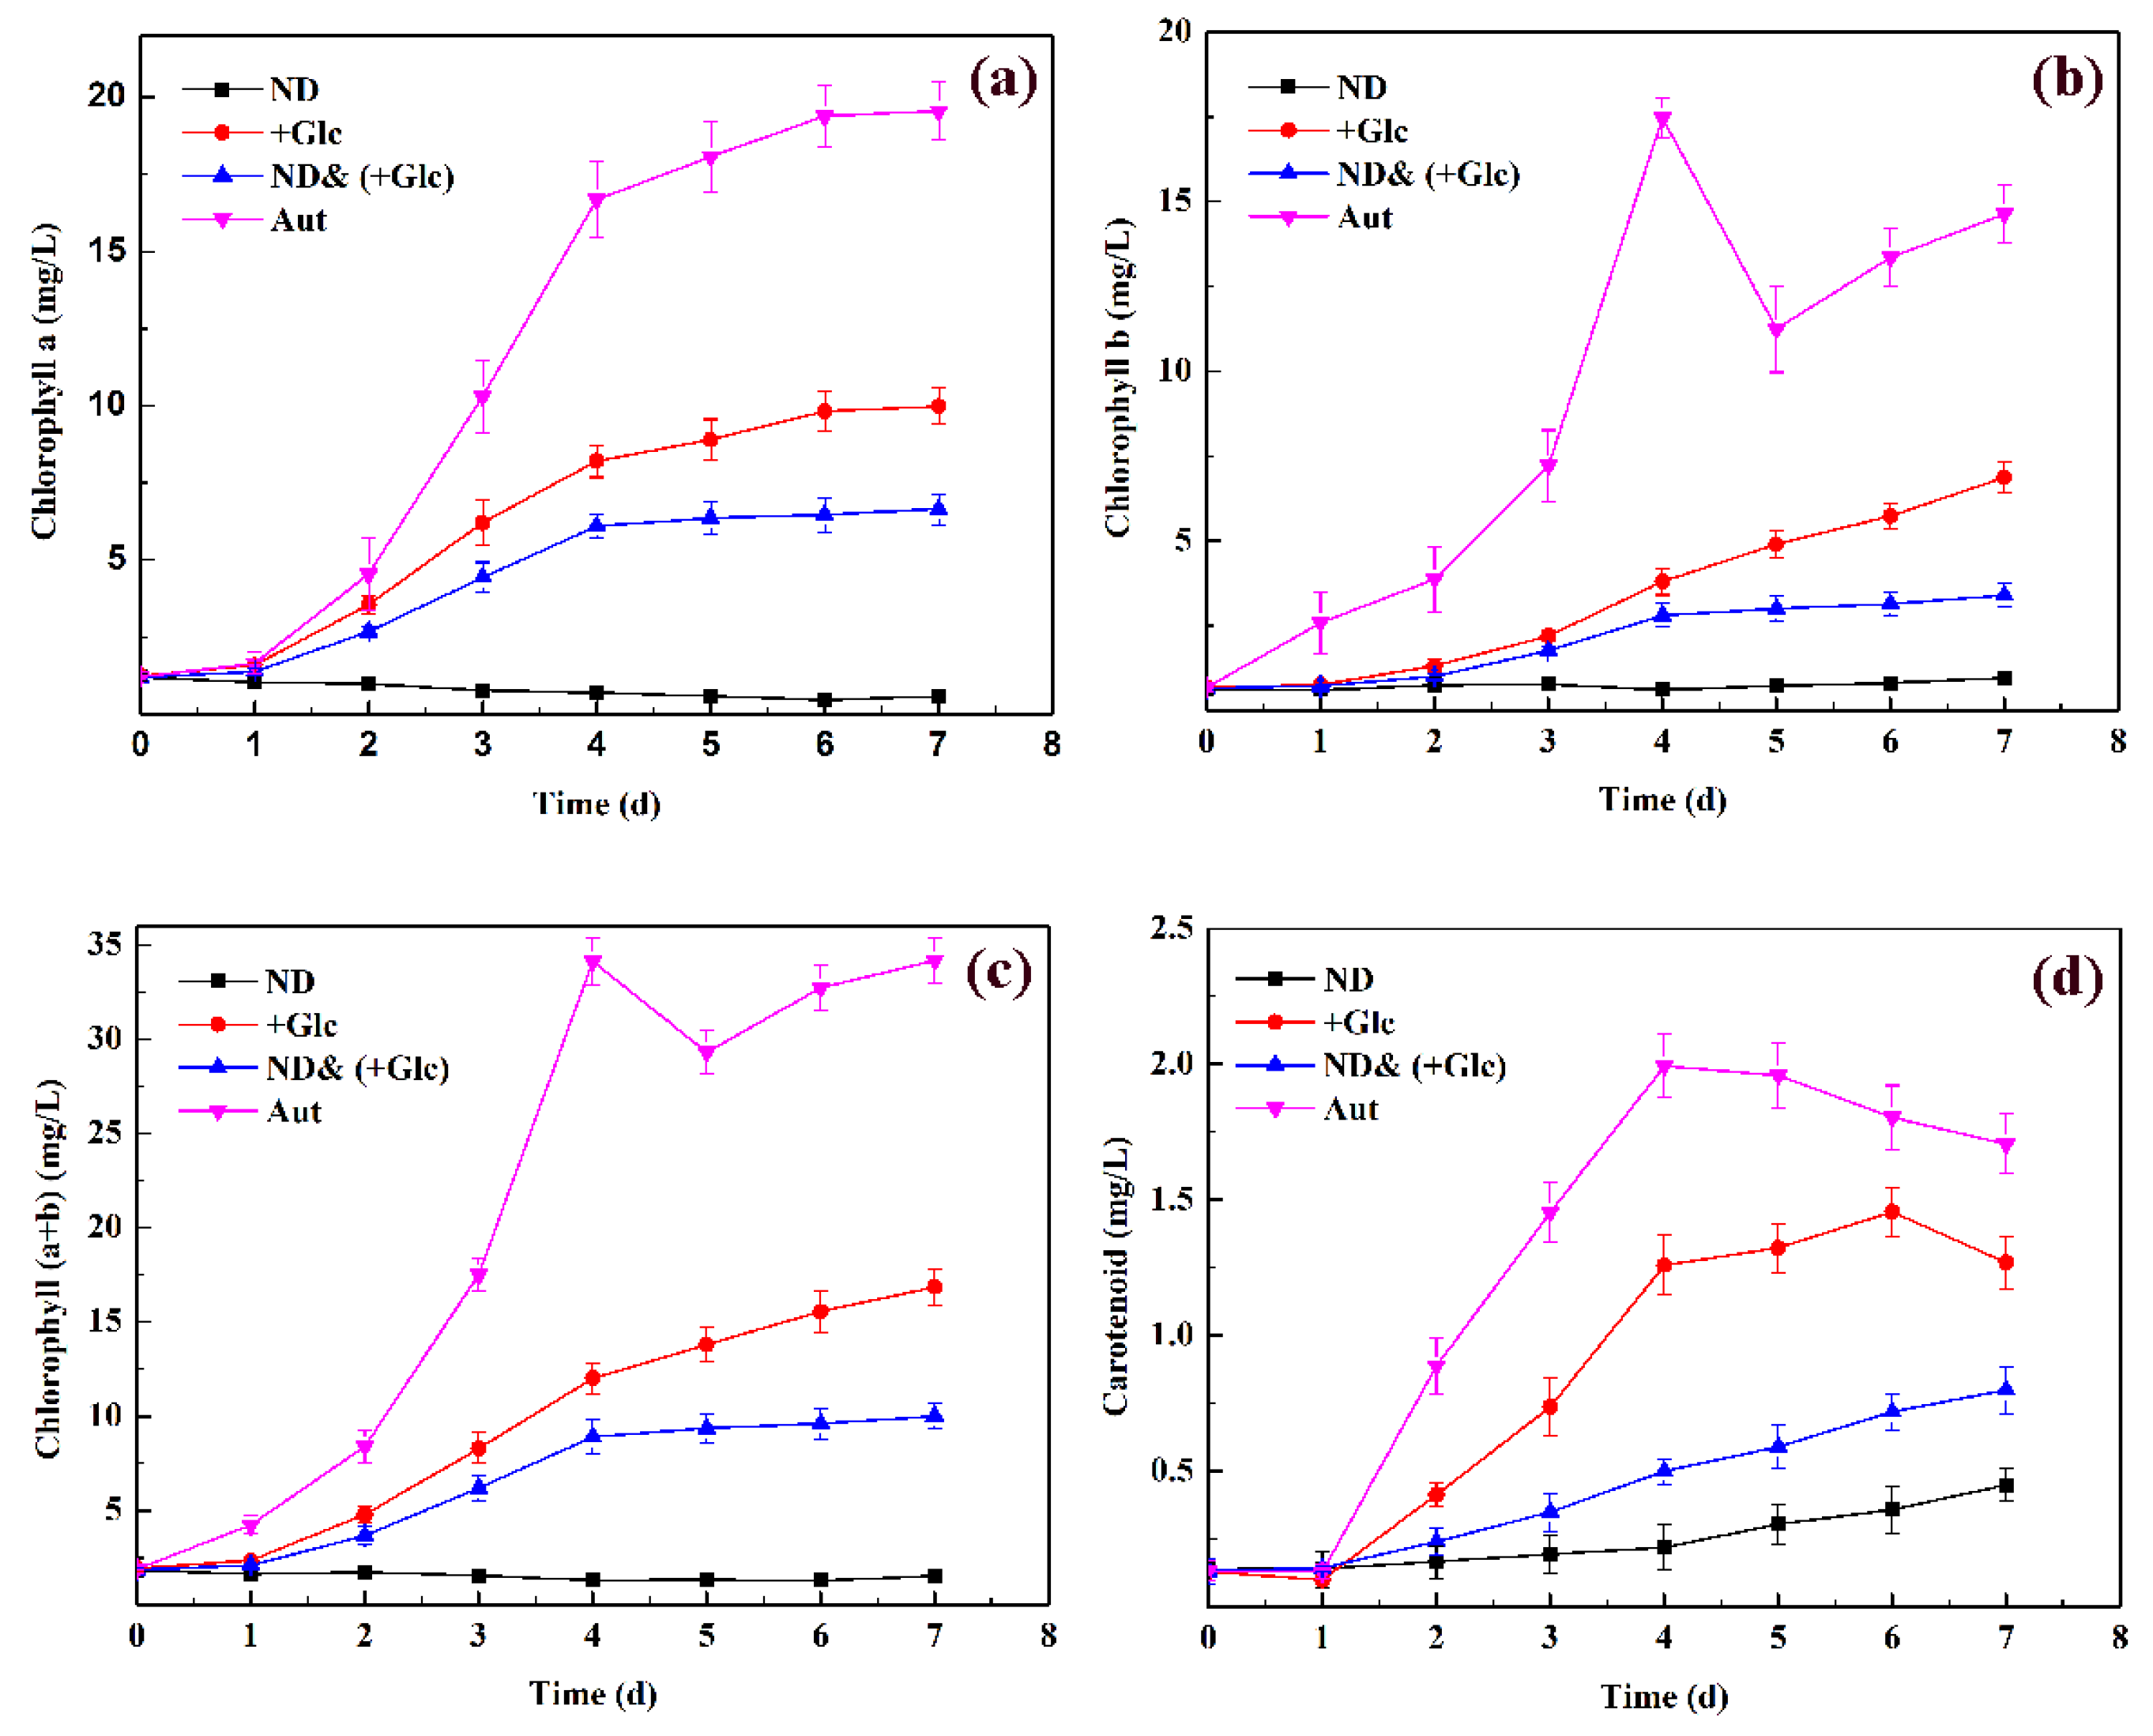
The content changes of periodic pigments in P. kessleri TY in different culture methods are shown in Figure 2. Chlorophyll a (Chl. a), chlorophyll b (Chl. b), chlorophyll (a + b) (Chl. (a + b)), and carotenoids in the nitrogen deficient & mixotrophic (+Glucose) group were significantly lower than those in the autotrophic group and mixotrophic (+Glucose) group but higher than those in the nitrogen deficient group. The trend was basically the same in Chl. a, Chl. B, and Chl. (a + b) in these three culture conditions. The chlorophyll content in the autotrophic group and mixotrophic (+Glucose) group consistently increased, whereas that in the nitrogen deficient group and nitrogen deficient & mixotrophic (+Glucose) group increased first, then leveled off or even slightly decreased. During the period of 0–4 d, the pigment content of the nitrogen deficient & mixotrophic (+Glucose) group increased rapidly and became stable during 4–7 d. The content of carotenoids in the three culture conditions was slightly different. Although the contents of carotenoids in the autotrophic group and mixotrophic (+Glucose) group were both high, their carotenoid contents increased slowly or even decreased after day 4. However, the content of carotenoids in the other two groups increased continuously during the 7-day culture period, and the difference with the autotrophic group and mixotrophic (+Glucose) group gradually narrowed.
Many studies have shown that the chlorophyll content of microalgae under nitrogen deficient conditions was significantly lower than that under other conditions [28,29]. Chlorophyll molecules contain four nitrogen atoms, so the incomplete organelles under nitrogen deficient conditions are not conducive to chlorophyll synthesis. In addition, nitrogen is one of the main nutritional requirements for any cell in medium. Under nitrogen deficient conditions, microalgae stopped proliferating because nitrogen is the primary requirement for all metabolic activities. Furthermore, nitrogen deficient conditions can increase free radical production in cells, thereby increasing the β-carotene content [30]. Under nitrogen deficient conditions, the chlorophyll content of microalgae decreased, whereas the carotenoid content increased; under the condition of the nitrogen deficient and mixotrophic culture, the results showed that the chlorophyll content increased first and then tended to stabilize or even decrease. It was speculated that under the initial culture conditions, the autotrophic and mixotrophic growth conditions increased the chlorophyll content compared to the nitrogen deficient conditions. After several days of culture, due to the slow consumption of glucose, nitrogen deficient was prevalent in the system, so the chlorophyll content decreased after day 4.
3.3. Analysis of Chlorophyll Fluorescence Characteristics
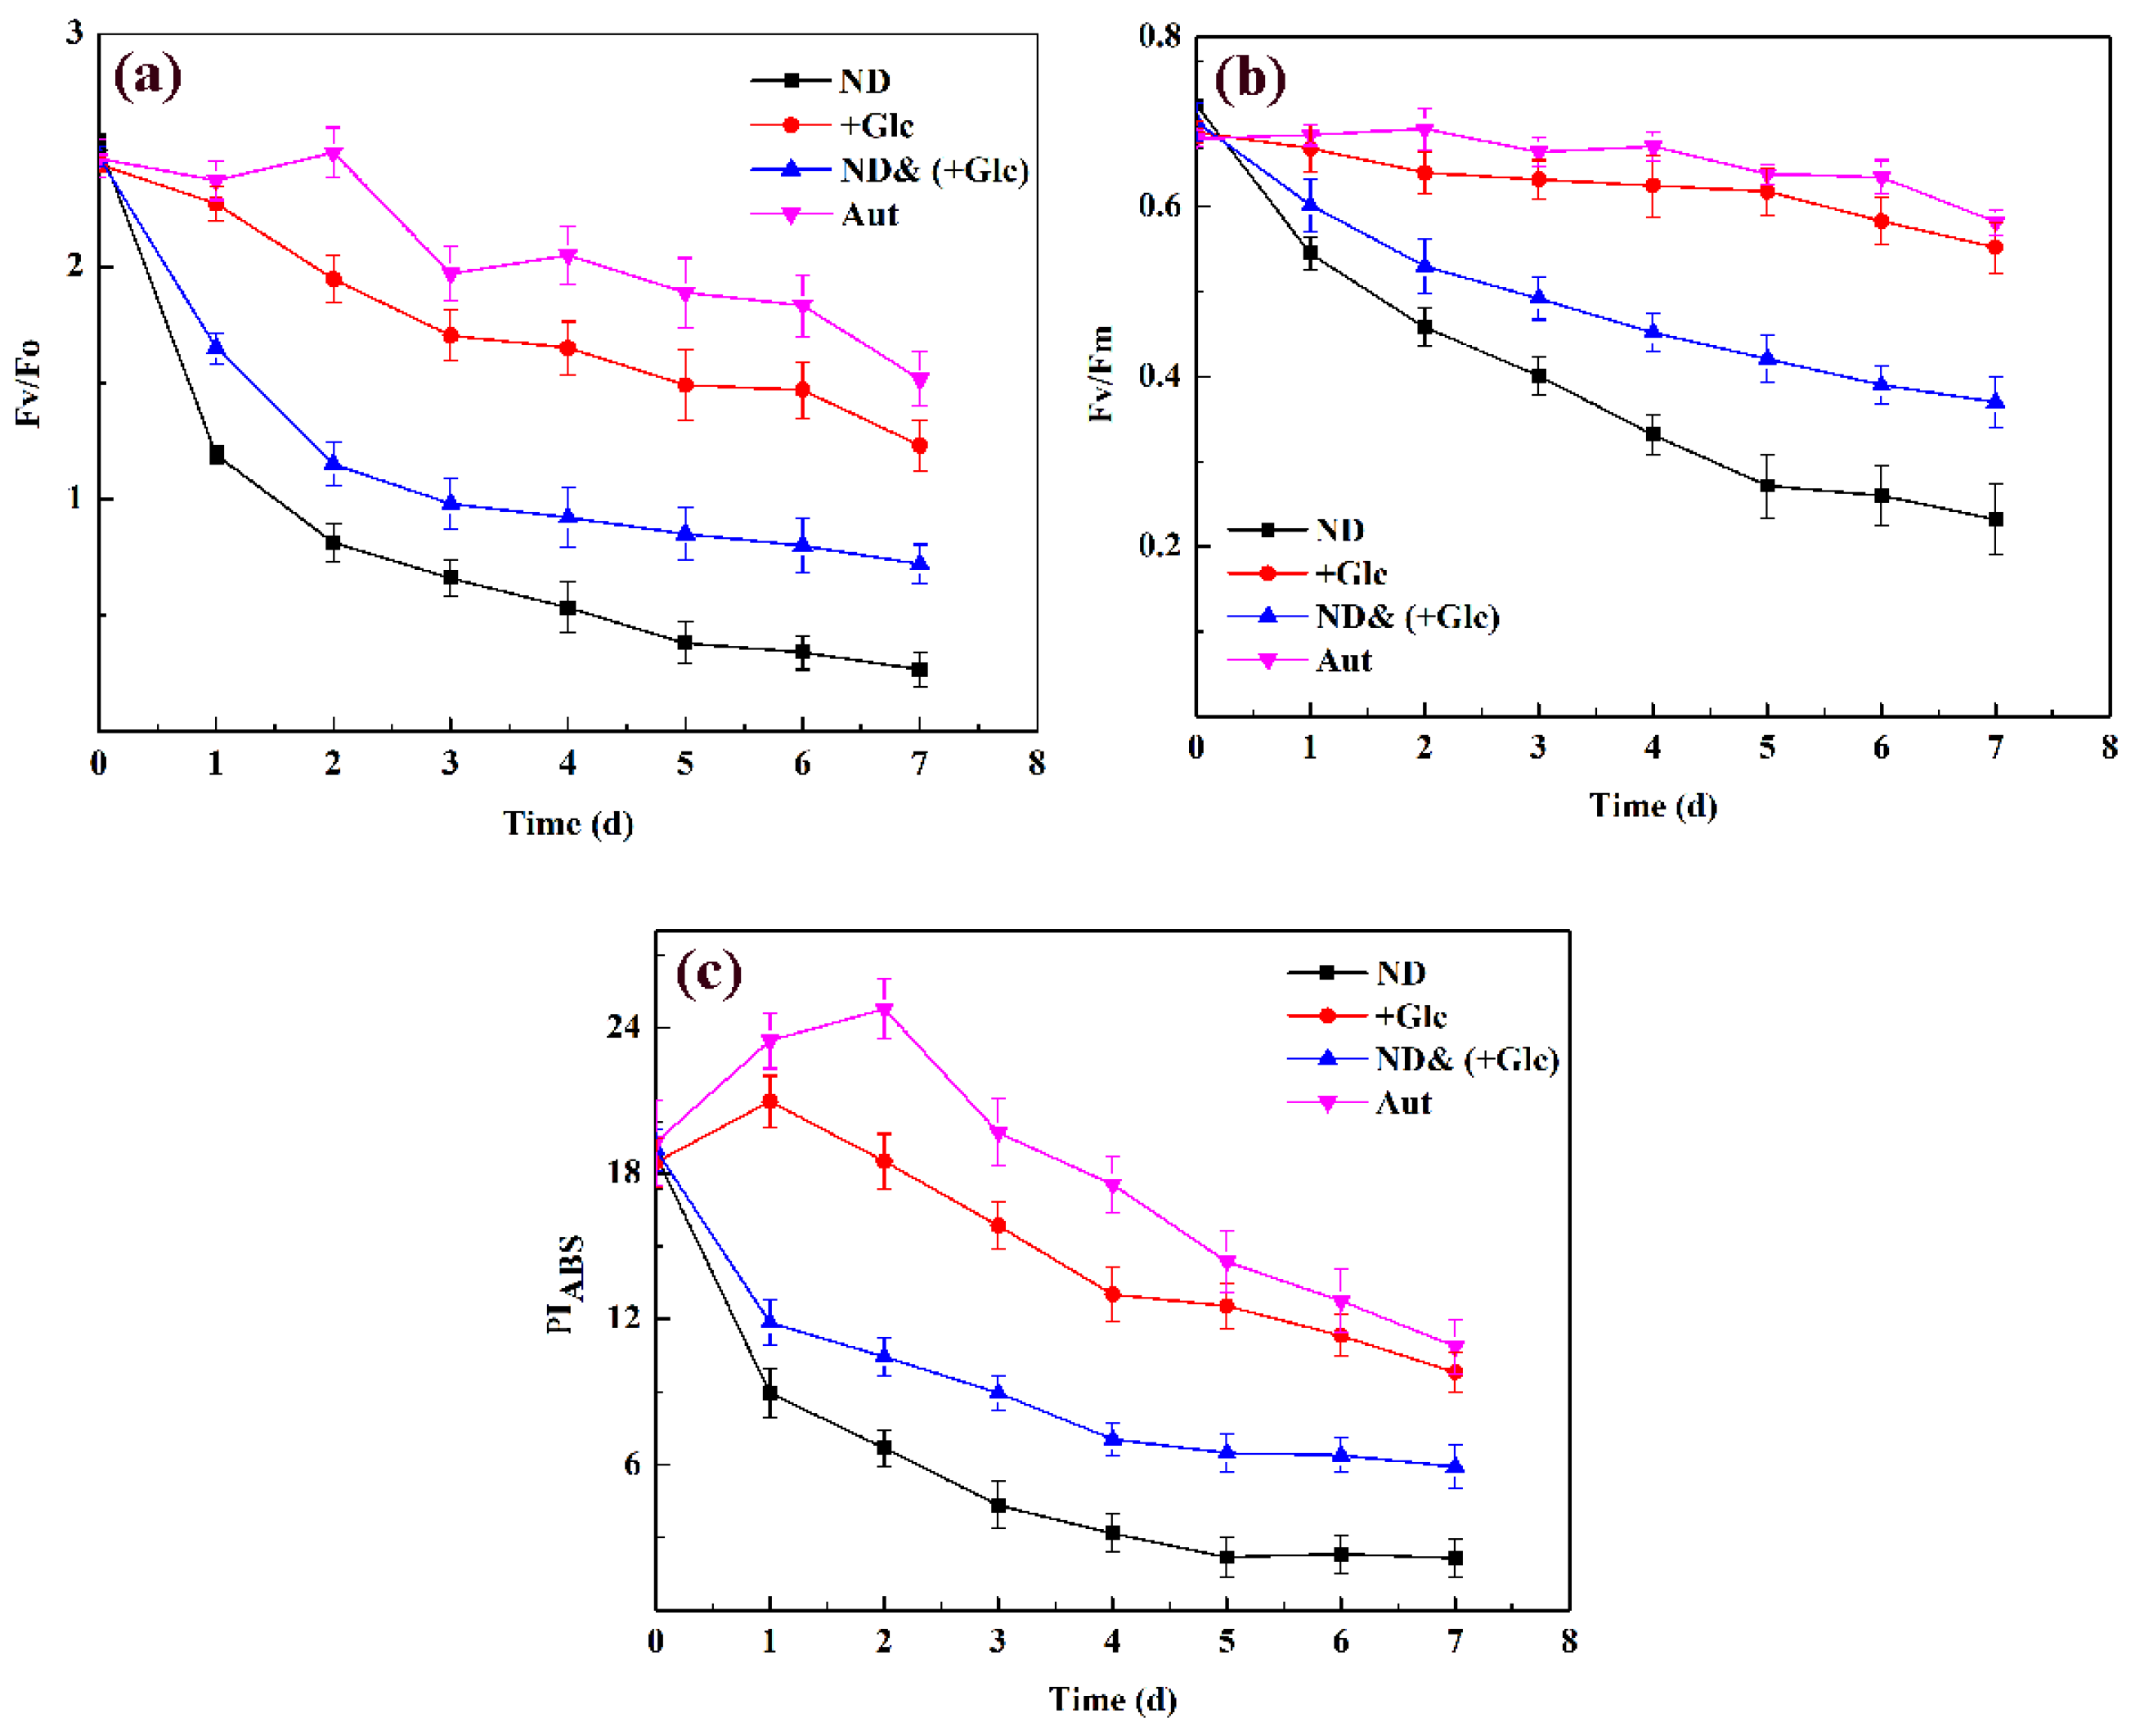
As shown in Figure 3, Fv/Fo, Fv/Fm, and PIABS showed a decreasing trend in the three culture conditions, and the nitrogen deficient & mixotrophic (+Glucose) group was still lower than the autotrophic group and the mixotrophic (+Glucose) group but higher than the nitrogen deficient group, although its trend was basically consistent with that of nitrogen deficient group. During 0–1 d, fluorescence parameters in both the nitrogen deficient group and the nitrogen deficient & mixotrophic (+Glucose) group were significantly reduced, whereas there was no significant change in the autotrophic group and mixotrophic (+Glucose) group. After 7 d, the fluorescence parameters in the autotrophic group and the mixotrophic (+Glucose) group were higher, followed by the nitrogen deficient & mixotrophic (+Glucose) group, and lowest in the nitrogen deficient group. The Fv/Fo, Fv/Fm, and PIABS of nitrogen deficient & mixotrophic (+Glucose) group were 0.47, 0.64, 0.54 times those of the autotrophic group, respectively; 0.59, 0.67 and 0.6 times those of the mixotrophic (+Glucose) group, respectively; and 2.7, 1.7 and 2.76 times those of the nitrogen deficient group, respectively. The conclusions demonstrated that the photosynthetic capacity and PSII activity of P. kessleri TY were severely inhibited under the condition of nitrogen deficiency, and glucose also inhibited the photosynthetic capacity and PSII activity of microalgae to some extent, but its effect was far less than that of nitrogen deficiency.
3.4. Analysis of Neutral Lipid Content
As shown in Figure 4, the neutral lipid content in all cultures increased with the passage of time. The neutral lipid content in the nitrogen deficient & mixotrophic (+Glucose) group was significantly higher than that of the other groups, and the neutral lipid content was similar in the nitrogen deficient group and the mixotrophic (+Glucose) group, although it was slightly higher in the nitrogen deficient group. The neutral lipid content increased exponentially during 0–4 d, with the level being highest on day 7. The neutral lipid content of the nitrogen deficient & mixotrophic (+Glucose) group was the highest, and was 4.35 times, 1.48 times, and 1.74 times that in the autotrophic, nitrogen deficient, and mixotrophic (+Glucose) groups, respectively. The results indicated that removal of nitrogen source in the medium and supplementation of glucose as an organic carbon source were both conducive to the accumulation of neutral lipids in P. kessleri TY, and the effect of nitrogen on neutral lipids in algal cells was more beneficial than that of carbon source. Furthermore, when algal cells were cultured under mixotrophic growth and nitrogen deficient & mixotrophic (+Glucose) culture, the neutral lipid content increased significantly.
Tevatia et al. [31] indicated that nitrogen limiting was beneficial to the accumulation of triglyceride (TAG) (a neutral lipid) of Coccomyxa Subellipsoidea. Yang et al. [32] showed that nitrogen limiting of Phaeodactylum tridactylum was conducted in the late exponential period, and found that the neutral lipid content of each cell in P. tridactylum increased by 2.4 times after nitrogen limiting the culture. The above results are consistent with our study, which demonstrated that nitrogen deficiency was beneficial to the accumulation of neutral lipids in microalgae.
3.5. Analysis of Total Lipid Content and Fatty Acid Composition
3.5.1. Analysis of Total Lipid Content
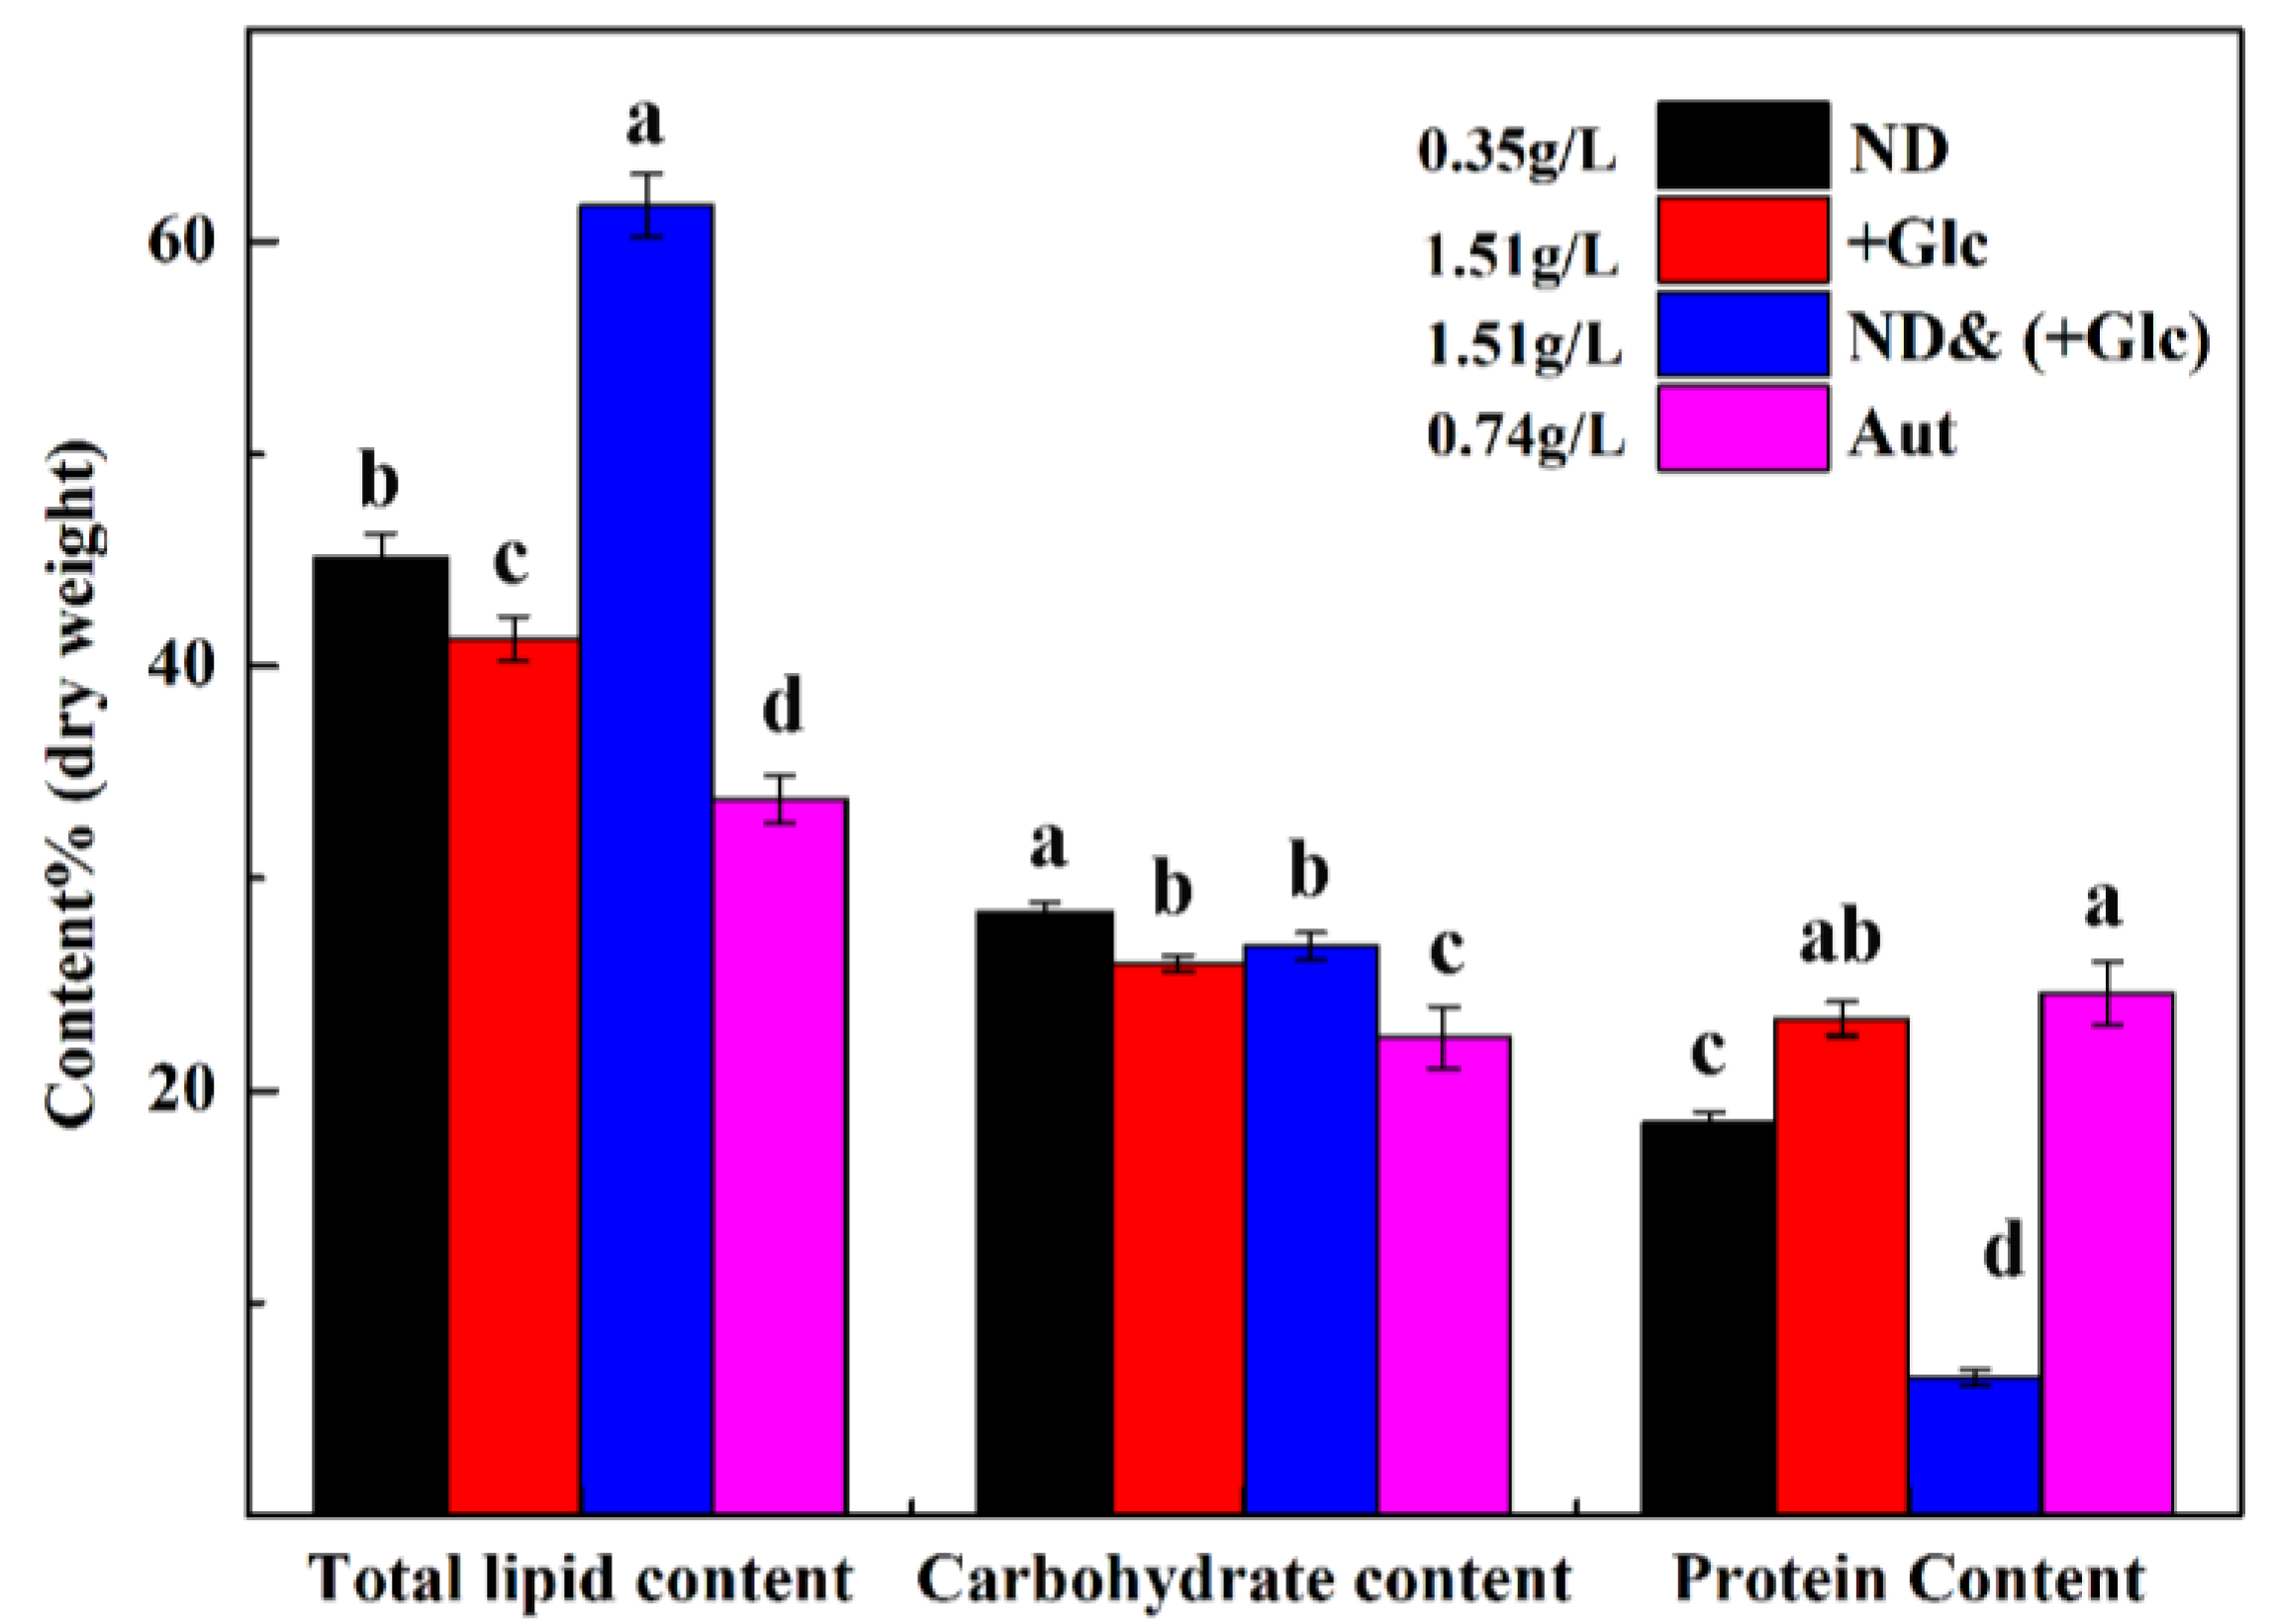
As shown in Figure 5, at the end of the experiment, two conditions were conducive to lipid accumulation (combined with nitrogen deficiency and additional glucose in the medium), and it was found that the total lipid content of the nitrogen deficient & mixotrophic (+Glucose) group was significantly higher than that of other groups, followed by the nitrogen deficient group and the mixotrophic (+Glucose) group, and the autotrophic group was lowest. On day 7, the total lipid content of the nitrogen deficient & mixotrophic (+Glucose) group was as high as 61.7%, followed by that in the nitrogen deficient group (45.1%) and the mixotrophic (+Glucose) group (41.3%), and was lowest in the autotrophic group (24.5%). The lipid productivity in the nitrogen deficient & mixotrophic (+Glucose) group was the highest (101.26 mg/(L·d)), followed by the mixotrophic (+Glucose) group (91.25 mg/(L·d)) and autotrophic group (35.61 mg/(L·d)), and the nitrogen deficient group was lowest (22.48 mg/(L·d)). The lipid productivity of the nitrogen deficient & mixotrophic (+Glucose) group was 4.5 times higher than that in nitrogen deficient group (Table 2).
Andreotti et al. [33] found that the lipid content of Tetraselmis suecica was higher in aquaculture wastewater (nitrogen content was limited). Paes et al. [34] examined the related indicators of Chlorella sp. and Nannochloropsis oculata under nitrogen deficient conditions. Under nitrogen deficient conditions, the carbohydrate content of Chlorella sp. increased, but the lipid content did not change significantly. In N. oculata, nitrogen deficient conditions were conducive to the increase in the lipid content. Furthermore, Tan’s [35] study reported that the lipid content of Chlorella pyrenoidosa could be increased (about 3.2 times) by adding acidified starch wastewater as a carbon source. Our results were similar to those of the aforementioned studies, indicating that lipid accumulation is different in different algal species under different nitrogen conditions. Nitrogen deficient and mixotrophic conditions can both promote the accumulation of total lipid in microalgae. Furthermore, total lipid content contained a neutral lipid content, so the condition of allowing a higher neutral lipid content is similar to the condition of maximizing the total lipid content.
3.5.2. Analysis of Fatty Acid Composition
The fatty acid contents of P. kessleri TY under different culture conditions are shown in Table 3. Fatty acids, including six main types, were identified in P. kessleri TY in the mixotrophic (+Glucose) group; seven different types were identified in the autotrophic group; whereas eight different types were each identified in the nitrogen deficient group and the nitrogen deficient & mixotrophic (+Glucose) group. They were mainly composed of C16 and C18 fatty acids. The fatty acid content of the nitrogen deficient & mixotrophic (+Glucose) group reached 94.48%, which was significantly higher than of the mixotrophic (+Glucose) group (91.11%), the nitrogen deficient group (92.64%), and the autotrophic (87.56%). They all contained saturated fatty acids (SFA) and unsaturated fatty acids (UFA), and no aromatic ring heterogeneous structure of fatty acids. There were no more than four unsaturated double bonds. However, they were slightly different in their main fatty acids; that is, they all contained palmitic acid (C16:0, autotrophic group: 22%, nitrogen deficient group: 26.79%, mixotrophic (+Glucose) group: 23.95%, nitrogen deficient & mixotrophic (+Glucose) group: 29.02%); oleic acid (C18:1, autotrophic group: 5.31%, nitrogen deficient group: 17.08%, mixotrophic (+Glucose) group: 15.87%, nitrogen deficient & mixotrophic (+Glucose) group: 17.84%); linoleic acid (C18:2, autotrophic group: 14.64%, nitrogen deficient group: 22%, mixotrophic (+Glucose) group: 21.12%, nitrogen deficient & mixotrophic (+Glucose) group: 20.38%); and linolenic acid (C18:3, autotrophic group: 28.79%, nitrogen deficient group: 10.3%, mixotrophic (+Glucose) group:17.94%, nitrogen deficient & mixotrophic (+Glucose) group: 12.35%). According to a previous study, C16:0, C18:1, C18:2, and C18:3 were the main fatty acids required for the preparation of biodiesel [36].
As shown in Table 3, the contents of C16:0 and C18:1 in the nitrogen deficient & mixotrophic (+Glucose) group were significantly higher than those in the other control groups. The content of C18:2 was significantly lower than that of the control groups, and the content of C18:3 was similar to that of the control groups, indicating that the fatty acids of the algae in the nitrogen deficient & mixotrophic (+Glucose) group not only contained the characteristics of the nitrogen deficient group and mixotrophic (+Glucose) group, but also differed from them. Moreover, the content of SFA in the nitrogen deficient & mixotrophic (+Glucose) group was up to 40.15%, which was significantly higher than that in the other groups, indicating that it had a positive effect on the SFA. The content of MUFA was also high (23.2%). This was significantly higher than that of the autotrophic group and the mixotrophic (+Glucose) group, but not significantly different from that of the nitrogen deficient group, indicating that nitrogen deficiency was more conducive to the increase in MUFA. The polyunsaturated fatty acid (PUFA) was significantly lower than that of the other groups. The above results were similar to the studies of Juntila et al. [37] and Shen et al. [38], indicating that the algae strains were different and the content of fatty acids under the same culture conditions was also different.
3.6. Analysis of Total Carbohydrate Content
As shown in Figure 5, the carbohydrate content of P. kessleri TY under different culture conditions was different from the total lipid content. The carbohydrate content in the nitrogen deficient group (28.4%) was significantly higher than that in the other groups. There was no significant difference in the carbohydrate content between the mixotrophic (+Glucose) group and the nitrogen deficient & mixotrophic (+Glucose) group (26% and 26.8%, respectively). The autotrophic group was lowest (22.5%). The above results illustrated that the nitrogen deficiency condition can promote the accumulation of total carbohydrates in P. kessleri TY, and under conditions of mixotrophic growth and nitrogen deficiency, the total carbohydrate content was not as high as that under the nitrogen deficient conditions.
Andreotti et al. [33] illustrated that the total carbohydrate content of Tetraselmis suecica was higher in aquaculture wastewater (nitrogen content was limited). Paes et al. [34] studied the Chlorella sp. and Nannochloropsis oculata under nitrogen deficient conditions. The carbohydrate content of both of the above algae was increased, and the carbohydrate content of Chlorella sp. was more pronounced than that in the other. The results of our study are similar to the above results.
3.7. Analysis of Total Protein Content
The results of total protein, total lipid, and total carbohydrate content under the culture conditions were different (Figure 5). The total protein content of nitrogen deficient and nitrogen deficient & mixotrophic (+Glucose) groups was significantly lower than that of the other two groups. The total protein content of the nitrogen deficient & mixotrophic (+Glucose) groups was 6.5%, whereas that of the nitrogen deficient, mixotrophic (+Glucose), and autotrophic groups were 18.5%, 23.4%, and 24.6%, respectively. The results showed that the protein content of algal strains was inhibited by nitrogen, whereas the protein content was the lowest under mixotrophic growth and nitrogen deficient and mixotrophic (+Glucose) conditions.
When nitrogen was deficient, the carbon sources turned to lipids and carbohydrates. When both nutrients and nitrogen were deficient, algae cells allocated more carbon sources and energy to lipids. Thus, carbohydrates were limited and protein synthesis was low. As shown in Figure 5, the total lipid content under the nitrogen deficient & mixotrophic (+Glucose) condition was significantly higher than that under the nitrogen deficient condition, whereas the carbohydrate content under the nitrogen deficient & mixotrophic (+Glucose) condition was lower than that under the nitrogen deficient condition. However, the difference was significantly lower than the difference between the two groups in terms of the lipid content, so more carbon sources were generated in protein content. Therefore, the protein content under the nitrogen deficient condition was higher than that under the nitrogen deficient & mixotrophic (+Glucose) condition. In addition, nitrogen deficiency changed the metabolic processes in microalgae, and the metabolic process of nitrogen deficiency in the concurrent system is extremely complex. Therefore, studying the physiological and biochemical levels of nitrogen deficiency is subject to limitations. In the future, we will conduct more in-depth studies on nitrogen deficiency at the molecular level to explore the breakdown of lipids, proteins, and carbohydrates.
Paes’s [34] study showed that under nitrogen deficient conditions, Chlorella sp. and N. oculata indicated a significant decrease in protein content from the exponential stage to the stable stage. This conclusion is similar to that of our study.
In summary, this may be because, when nitrogen deficiency occurred, the carbon source produced lipids and carbohydrates, and in the trend of carbon flow, there was a competitive relationship between lipids and carbohydrates. This resulted in different changes in carbohydrate and lipids contents in nitrogen deficient conditions.
4. Discussion
Although a few microalgae have been heterotrophically cultured under nitrogen deficient conditions, the results were varied. For example, Juntila et al. [37] examined the growth and lipid accumulation of Chlorella sorokiniana in medium supplemented with glucose under nitrogen deficient conditions, and demonstrated that although C. sorokiniana was under the nitrogen deficient & mixotrophic (+Glucose) culture, the biomass productivity and lipid productivity were lower than those under the normal nitrogen & mixotrophic (+Glucose) culture. It was found that its total lipids were higher, but the difference was not statistically significant. Shen et al. [38] conducted similar experiments that were relevant to lipid accumulation in Scenedesmus obliquus cultures with sodium acetate as a heterotrophic carbon source under conditions of normal nitrogen and phosphorus, and nitrogen and phosphorus deficiency. The authors found that the lipid productivity of algal cells was the highest under the nitrogen and phosphorus deficiency and heterotrophic culture. These authors also reported that under the nitrogen deficient conditions, Chlorella vulgaris NIES-227 was added to the glucose and sodium acetate heterotrophic culture, and their results were inconsistent. In the presence of glucose, biomass production under nitrogen deficient conditions was significantly lower than that under heterotrophic growth and normal nitrogen, and although its lipid content was higher, lipid production was lower than that under autotrophic growth conditions. In the presence of sodium acetate, C. vulgaris NIES-227 under nitrogen deficient conditions was lower than that under normal nitrogen conditions; however, the difference was not statistically significant. By contrast, its lipid production and total lipid content were significantly higher than those under normal nitrogen conditions [38,39]. Our findings are inconsistent with the aforementioned results. Here, biomass production under mixotrophic (+Glucose) growth and nitrogen deficient conditions was lower than under the mixotrophic (+Glucose) growth conditions (0.76 times), whereas the lipid content was higher than that under mixotrophic (+Glucose) growth conditions (1.37 times), indicating that lipid production was 1.1 times higher than that under mixotrophic (+Glucose) growth conditions. As such, nitrogen sources were removed and extra carbon sources were added to the algae to change lipid production.
Fatty acids in P. kessleri TY cultured under nitrogen deficient & mixotrophic (+Glucose) conditions were analyzed. The main fatty acids were C16:0, C18:1, C18:2, and C18:3, which are important raw materials for biodiesel production. The content of C16 and C18 fatty acids in algae cultured in the nitrogen deficient & mixotrophic (+Glucose) group was 94.48%, which is higher than that of the other two groups. Furthermore, the levels of C16:0 and C18:1 in the nitrogen deficient & mixotrophic (+Glucose) group were higher than those of the other two groups, but the levels of C18:2 and C18:3 were lower than those of the control group. In addition, the content of SFA and MUFA in the nitrogen deficient & mixotrophic (+Glucose) group was higher than that in the two control groups. The main fatty acids needed for biodiesel production are palmic acid (C16:0), oleic acid (C18:1), linoleic acid (C18:2), and linolenic acid (C18:3). Fatty acids do not have aromatic cyclic isomerism structures, and have carbon chain lengths of 14 to 20 carbons and no more than four unsaturated double bonds [40,41,42]. Moreover, SFA has antioxidant properties that are conducive to the long-term storage of biodiesel fuels, whereas MUFA has better stability at low temperatures and high oxidative conditions [43], indicating that P. kessleri TY cultured under nitrogen deficient & mixotrophic (+Glucose) conditions is more suitable for biodiesel production. Liu et al. [44] investigated fatty acids in Scenedesmus dimorphus under conditions of nitrogen deficiency & autotrophic growth, normal nitrogen with glucose added, and nitrogen deficient with glucose added, and reported the content of C16:0 was ordered: nitrogen deficient & mixotrophy > nitrogen deficient & autotrophy > normal nitrogen & mixotrophy (consistent with the results of this study); the contents of C18:1 and C18:2 were ordered: nitrogen deficient & autotrophy > normal nitrogen & mixotrophy > nitrogen deficient & mixotrophy (different from the results of this study); in C18:3, the order was nitrogen normal & mixotrophy > nitrogen deficient & mixotrophy > nitrogen deficient & autotrophy (different from the results of this study). However, the contents of SFA and MUFA were the highest when the algae were cultured under nitrogen deficient conditions, consistent with the results of this study. Shen [45] examined Scenedesmus obliquus, which uses sodium acetate as its heterotrophic carbon source, and observed that the content of C16:0 was highest under conditions of normal nitrogen & mixotrophy compared to nitrogen deficiency & mixotrophy (different from the results of this study); that of C18:1 was highest under conditions of nitrogen deficiency & mixotrophy compared to normal nitrogen & mixotrophy (consistent with the results of this study); that of C18:2 was highest under conditions of nitrogen deficiency & mixotrophy compared to normal nitrogen & mixotrophy (different from the results of this study); that of C18:3 was highest under conditions of normal nitrogen & mixotrophy compared to nitrogen deficient & mixotrophy (consistent with the results of this study); and that of SFA was highest under conditions of nitrogen deficiency & mixotrophy compared to normal nitrogen & mixotrophy (consistent with the results of this study). Venkata et al. [46] cultured microalgae under a variety of conditions and mixotrophic growth, normal nitrogen & mixotrophy, and normal deficiency & autotrophy. It was found that the important fatty acids for biodiesel preparation only contained C16:0 and C18:2. The results showed that the content of C16:0 in algal strains under the condition of nitrogen deficiency & mixotrophy was higher than that of normal nitrogen & mixotrophy (the same as the results of this study), whereas lower than that in C18:2 (the same as the results of this study). The above results also indicated that nitrogen deficiency and extra carbon sources were added to algae strains. The composition and content of fatty acids were also distinct with different carbon sources and algae strains.
The results of this study also showed that the total lipid content in the nitrogen deficient & mixotrophic (+Glucose) group was significantly higher than that in the other control groups. The protein content in the autotrophic group and the mixotrophic (+Glucose) group was higher than that in the other groups, and the carbohydrate content in the nitrogen deficient group was the highest. These findings suggested that nitrogen deficiency can inhibit protein synthesis, and that algae cells transferred more carbon sources and energy to lipids and carbohydrates under the nitrogen deficient conditions. In contrast, the lipid content under nitrogen deficient & mixotrophic growth conditions was much larger than that of the carbohydrate content, consistent with Shen’s study [45], which indicated that P. kessleri TY could more effectively transform carbon into lipid under nitrogen deficient and mixotrophic (+Glucose) growth conditions.
The results of this study showed that the mixotrophic growth conditions complement photoautotrophic growth with organic matter, thereby shortening the growth cycle, increasing biomass production, and reducing the cost of microalgae cultures. Our results support the benefits of high lipid productivity produced by nitrogen deficient & mixotrophic (+Glucose) growth cultures, which were much greater than the cost of additional carbon added in the laboratory. However, its application in large-scale culture may be restricted. Although the additional glucose added to the mixotrophic cultures in this study was a high-quality carbon source, and was easy to assimilate, its cost was relatively high. In the future, we need to identify cheaper carbon sources, such as urban sewage or industrial wastewater, with this culture method, using some organic carbon-rich wastewater to cultivate microalgae, and combining waste recycling to reduce costs and maximize the lipid productivity of microalgae.
5. Conclusions
In this study, it was found that the growth trend, dry weight of biomass, and biomass productivity of P. kessleri TY under nitrogen deficient & mixotrophic (+Glucose) growth conditions were higher than those under both autotrophic and nitrogen deficient conditions but lower than those in mixotrophic (+Glucose) culture, indicating that the growth of algae was not affected by nitrogen deficiency. For P. kessleri TY under nitrogen deficient & mixotrophic (+Glucose) growth conditions, the contents of neutral lipids and total lipids, and lipid productivity, were all significantly higher than those of other groups, indicating that it had a positive effect on the accumulation of lipids, and the increase in the lipid content was far greater than the decrease in biomass; therefore, its lipid productivity was also higher. In the analysis of fatty acids, the contents of C16 and C18 fatty acids, C16:0, C18:1, SFA, and MUFA were also the highest in P. kessleri TY under nitrogen deficient & mixotrophic (+Glucose) growth conditions. According to the above results, combined with the analysis of two important indexes of lipid productivity and fatty acid composition, the nitrogen deficient & mixotrophic (+Glucose) culture was more conducive to the improvement in the lipid productivity of P. kessleri TY. Furthermore, its fatty acid composition and content were also found to be highly suitable as a raw material of biodiesel fuel.
Author Contributions
Conceptualization, S.X.; Investigation, L.J. and Y.G.; Methodology, L.J. and Y.G.; Validation, L.J., J.F. and Y.G.; Formal Analysis, S.X.; Data Curation, J.F. and J.L.; Writing-Original Draft Preparation, Y.G. and S.X.; Writing-Review & Editing, S.X.; Visualization, Y.G. and S.X.; Supervision, S.X.; Project Administration, S.X.; Funding Acquisition, Y.G. and S.X. All authors approved the final manuscript. All authors have read and agreed to the published version of the manuscript.
Funding
This study was funded by the National Natural Science Foundation of China, grant number 42177057, the Research Award Fund for Outstanding Doctoral Coming to Work in Shanxi, grant number 20212023; and the Doctoral Scientific Research Foundation for Taiyuan University of Science and Technology, grant number 20202069.
Acknowledgments
We are grateful to Jason Q for his editorial assistance with the English, and thank Shengli Shi, Kunpeng Fang, Jing Yang for algal culture and technical assistance.
Conflicts of Interest
The authors declare no conflict of interest.
References
- Swanson, K.J.; Madden, M.C.; Ghio, A.J. Biodiesel exhaust: The need for health effects research. Environ. Health Perspect. 2007, 115, 496–499. [Google Scholar] [CrossRef] [PubMed] [Green Version]
- Lapuerta, M.; Armas, O.; Rodríguez-Fernández, J. Effect of biodiesel fuels on diesel engine emissions. Prog. Energy Combus. Sci. 2008, 34, 198–223. [Google Scholar] [CrossRef]
- Song, P.P.; Jia, Y.; Li, Q. Effects of nitrogen deficiency on growth and lipid and protein content of Isochrysis galbana. Technol. Mark. 2015, 22, 113–116. [Google Scholar] [CrossRef]
- Pancha, I.; Chokshi, K.; George, B.; Ghosh, T.; Paliwal, C.; Maurya, R.; Mishra, S. Nitrogen stress triggered biochemical and morphological changes in the microalgae Scenedesmus sp. CCNM 1077. Bioresour. Technol. 2014, 156, 146–154. [Google Scholar] [CrossRef] [PubMed]
- Rios, L.F.; Klein, B.C.; Luz, L.F.J.; Filho, R.M.; Maciel, M.R.F. Nitrogen starvation for lipid accumulation in the microalga species Desmodesmus sp. Appl. Biochem. Biotechnol. 2015, 175, 469–476. [Google Scholar] [CrossRef] [PubMed]
- Siaut, M.; Cuine, S.; Cagnon, C.; Fessler, B.; Nguyen, M.; Carrier, P.; Beyly, A.; Beisson, F.; Triantaphylidès, C.; Li-Beisson, Y.; et al. Oil accumulation in the model green alga Chlamydomonas reinhardtii: Characterization, variability between common laboratory strains and relationship with starch reserves. BMC Biotechnol. 2011, 11, 7. [Google Scholar] [CrossRef] [PubMed] [Green Version]
- Zhu, S.N.; Huang, W.; Xu, J.; Wang, Z.M.; Xu, J.L.; Yuan, Z.H. Metabolic changes of starch and lipid triggered by nitrogen starvation in the microalga Chlorella zofingiensis. Bioresour. Technol. 2014, 152, 292–298. [Google Scholar] [CrossRef]
- Lin, T.S.; Wu, J.Y. Effect of carbon sources on growth and lipid accumulation of newly isolated microalgae cultured under mixotrophic condition. Bioresour. Technol. 2015, 184, 100–107. [Google Scholar] [CrossRef] [PubMed]
- Wan, M.X.; Liu, P.; Xia, J.L.; Rosenberg, J.N.; Oyler, G.A.; Betenbaugh, M.J.; Nie, Z.Y.; Qiu, G.Z. The effect of mixotrophy on microalgal growth, lipid content, and expression levels of three pathway genes in Chlorella sorokiniana. Appl. Microbiol. Biotechnol. 2011, 91, 835–844. [Google Scholar] [CrossRef]
- El-Sheekh, M.M.; Bedaiwy, M.Y.; Osman, M.E.; Ismail, M.M. Mixotrophic and heterotrophic growth of some microalgae using extract of fungal-treated wheat bran. Int. J. Recycl. Org. Waste Agric. 2012, 1, 12–20. [Google Scholar] [CrossRef] [Green Version]
- Gao, Y.F.; Feng, J.; Lv, J.P.; Liu, Q.; Nan, F.R.; Liu, X.D.; Xie, S.L. Physiological changes of Parachlorella Kessleri TY02 in lipid accumulation under nitrogen stress. Int. J. Environ. Res. Public Health 2019, 16, 1188. [Google Scholar] [CrossRef] [PubMed] [Green Version]
- Ge, Z.Z.; Wang, J.; Yu, X.B. Effects of fed-batch cultivation and nitrogen deficiency on lipid yield of Chlorella vulgaris. J. Anhui Agric. Sci. 2012, 40, 2453–2456. [Google Scholar] [CrossRef]
- Chen, Y.M. The Invention Relates to a Culture Method for Increasing the Yield of Microalgae Biomass and Lipid. A Patent for Invention. Chinese Patent No. CN103484372A, 2014. [Google Scholar]
- Cho, D.H.; Ramanan, R.; Kim, B.H.; Lee, J.; Kim, S.; Yoo, C.; Choi, G.G.; Oh, H.M.; Kim, H.S. Novel approach for the development of axenic microalgal cultures from environmental samples. J. Phycol. 2013, 49, 802–810. [Google Scholar] [CrossRef] [PubMed]
- Lv, J.P.; Guo, J.Y.; Feng, J.; Liu, Q.; Xie, S.L. Effect of sulfate ions on growth and pollutants removal of self-flocculating microalga Chlorococcum sp. GD in synthetic municipal wastewater. Bioresour. Technol. 2017, 234, 289–296. [Google Scholar] [CrossRef]
- Mera, R.; Torres, E.; Abalde, J. Effects of sodium sulfate on the freshwater microalga Chlamydomonas moewusii: Implications for the optimization of algal culture media. J. Phycol. 2016, 52, 75–88. [Google Scholar] [CrossRef]
- Markou, G.; Muylaert, K. Effect of light intensity on the degree of ammonia toxicity on PSII activity of Arthrospira platensis and Chlorella vulgaris. Bioresour. Technol. 2016, 216, 453–461. [Google Scholar] [CrossRef]
- Chen, W.; Zhang, C.; Song, L.; Sommerfeld, M.; Hua, Q. A high throughput Nile red method for quantitative measurement of neutral lipids in microalgae. J. Microbiol. Methods 2015, 77, 41–47. [Google Scholar] [CrossRef]
- Bohnenberger, J.E.; Crossetti, L.O. Influence of temperature and nutrient content on lipid production in freshwater microalgae cultures. An. Acad. Bras. Ciênc. 2014, 86, 1239–1248. [Google Scholar] [CrossRef] [Green Version]
- Thang, D.V.; Faruq, A.; Thomas-Hall, S.R.; Simon, Q.; Ekaterina, N.; Schenk, P.M. High protein and high lipid-producing microalgae from northern Australia as potential feedstock for animal feed and biodiesel. Front. Bioeng. Biotechnol. 2015, 3, 53–60. [Google Scholar] [CrossRef] [Green Version]
- Liu, J.; Huang, J.; Sun, Z.; Zhong, Y.; Jiang, Y.; Chen, F. Differential lipid and fatty acid profiles of photoautotrophic and heterotrophic Chlorella zofingiensis: Assessment of algal oils for biodiesel production. Bioresour. Technol. 2011, 102, 106–110. [Google Scholar] [CrossRef]
- Li, H.S. Determination of Total Protein and Carbohydrate Content. In Principles and Techniques of Plant Physiological and Biochemical Experiments; Higher Education Press: Beijing, China, 2000; pp. 184–199. [Google Scholar]
- Prajapati, S.K.; Kaushik, P.; Malik, A.; Vijay, V.K. Phycoremediation and biogas potential of native algal isolates from soil and wastewater. Bioresour. Technol. 2013, 135, 232–238. [Google Scholar] [CrossRef]
- He, Q.N.; Yang, H.J.; Hu, C.X. Effects of temperature and its combination with high light intensity on lipid production of Monoraphidium dybowskii Y2 from semi-arid desert areas. Bioresour. Technol. 2018, 265, 407–414. [Google Scholar] [CrossRef]
- Guo, Y.N. Optimizing Cultivation and Mechanism of Lipid Accumulation Research in Chlorococcum sphacosum GD. Master’s Dissertation, Shanxi University, Taiyuan, China, 2017. [Google Scholar]
- Deng, D.X.; Deng, D.Y.; Liu, J.P.; Cheng, K.; Xu, Y.J. Field trial multiple comparison results alphabetic difference counting method and its letter abbreviation. Seeds 2018, 37, 131–132. [Google Scholar] [CrossRef]
- Girard, J.M.; Roy, M.L.; Hafsa, M.B.; Gagnon, J.; Faucheux, N.; Heitz, M.; Tremblay, L.; Deschênes, J.S. Mixotrophic cultivation of green microalgae Scenedesmus obliquus on cheese whey permeate for biodiesel production. Algal Res. 2014, 5, 241–248. [Google Scholar] [CrossRef]
- Begum, H.; Yusoff, F.M.; Banerjee, S.; Khatoon, H.; Shariff, M. Availability and utilization of pigments from microalgae. Crit. Rev. Food Sci. 2016, 56, 2209–2222. [Google Scholar] [CrossRef] [PubMed]
- Ordog, V.; Stirk, W.A.; Bálint, P.; Staden, J.; Lovász, C. Changes in lipid, protein and pigment concentrations in nitrogen-stressed Chlorella minutissima cultures. J. Appl. Phycol. 2012, 24, 907–914. [Google Scholar] [CrossRef]
- Møller, A.P.; Biard, C.; Blount, J.D.; Houston, D.C.; Ninni, P.; Saino, N.; Surai, P.F. Carotenoid-dependent signals: Indicators of foraging efficiency, immune competence or detoxification ability? Avian Poult. Biol. Rev. 2000, 11, 137–159. [Google Scholar] [CrossRef]
- Tevatia, R.; Allen, J.; Blum, P.; Demirel, Y.; Black, P. Modeling of rhythmic behavior in neutral lipid production due to continuous supply of limited nitrogen: Mutual growth and lipid accumulation in microalgae. Bioresour. Technol. 2014, 170, 152–159. [Google Scholar] [CrossRef] [Green Version]
- Yang, Z.K.; Niu, Y.F.; Ma, Y.H.; Xue, J.; Zhang, M.H.; Yang, W.D.; Liu, J.S.; Lu, S.H.; Guan, Y.; Li, H.Y. Molecular and cellular mechanisms of neutral lipid accumulation in diatom following nitrogen deprivation. Biotechnol. Biofuels 2013, 6, 67. [Google Scholar] [CrossRef] [Green Version]
- Andreotti, V.; Solimeno, A.; Rossi, S.; Ficara, E.; Marazzi, F.; Mezzanotte, V.; García, J. Bioremediation of aquaculture wastewater with the microalgae Tetraselmis suecica: Semi-continuous experiments, simulation and photo-respirometric tests. Sci. Total Environ. 2020, 738, 139859. [Google Scholar] [CrossRef] [PubMed]
- Paes, C.; Faria, G.R.; Tinoco, N.; Castro, D.; Lourenco, S.O. Growth, nutrient uptake and chemical composition of Chlorella sp. and Nannochloropsis oculata under nitrogen starvation. Lat. Am. J. Aquat. Res. 2017, 44, 275–292. [Google Scholar] [CrossRef]
- Tan, X.B.; Yang, L.B.; Zhang, W.W.; Zhang, X.C. Lipids production and nutrients recycling by microalgae mixotrophic culture in anaerobic digestate of sludge using wasted organics as carbon source. Bioresour. Technol. 2020, 297, 122379. [Google Scholar] [CrossRef]
- Li, T.T.; Zheng, Y.; Yu, L.; Chen, S.L. Mixotrophic cultivation of a Chlorella sorokiniana strain for enhanced biomass and lipid production. Biomass Bioenergy 2014, 66, 204–213. [Google Scholar] [CrossRef]
- Juntila, D.J.; Bautista, M.A.; Monotilla, W. Biomass and lipid production of a local isolate Chlorella sorokiniana under mixotrophic growth conditions. Bioresour. Technol. 2015, 191, 395–398. [Google Scholar] [CrossRef] [PubMed]
- Shen, X.F.; Liu, J.J.; Chu, F.F.; Lam, P.K.S.; Zeng, R.J. Enhancement of FAME productivity of Scenedesmus obliquus by combining nitrogen deprivation with sufficient phosphorus supply in heterotrophic cultivation. Appl. Energy 2015, 158, 348–354. [Google Scholar] [CrossRef]
- Shen, X.F.; Chu, F.F.; Lam, P.K.S.; Zheng, R.J. Biosynthesis of high yield fatty acids from Chlorella vulgaris NIES-227 under nitrogen starvation stress during heterotrophic cultivation. Water Res. 2015, 81, 294–300. [Google Scholar] [CrossRef]
- Knothe, G. Improving biodiesel fuel properties by modifying fatty ester composition. Energy Environ. Sci. 2009, 2, 759–766. [Google Scholar] [CrossRef]
- Hoekman, S.K.; Broch, A.; Robbins, C.; Ceniceros, E.; Natarajan, M. Review of biodiesel composition, properties and specifications. Renew. Sustain. Energy Rev. 2012, 16, 143–169. [Google Scholar] [CrossRef]
- Chen, X.; Yuan, Y.N.; Sun, P.; Mei, D.Q.; Cui, Y. Effects of structural features of the fatty acid methyl esters upon the cetane number of biodiesel. Chem. Eng. Oil Gas 2007, 36, 481–484. [Google Scholar] [CrossRef]
- Luo, W.; Yuan, Z.H.; Liao, C.P. Biodiesel standard and quality assessment. Renew. Energy Res. 2006, 4, 33–37. [Google Scholar] [CrossRef]
- Liu, H.; Zhang, S.S.; Fan, J.F.; Fu, B.; Zhang, L.J. Methods to Improve Biomass and Lipid Accumulation of Lipid-Producing Microalgae by Using the Two-Stage Culture Strategy of Mixotrophic Culture and Nitrogen-Enriched & Nitrogen-Deficient Culture. A Patent for Invention. Chinese Patent No. CN102268377A, 7 December 2011. [Google Scholar]
- Shen, X.F. Heterotrophic and Mixotrophic Cultivation of Microalgae under Nitrogen Starvation for Biodiesel Production. Ph.D. Thesis, University of Science and Technology of China, Wuhan, China, 2017. [Google Scholar]
- Venkata Mohan, S.; Devi, M.P. Salinity stress induced lipid synthesis to harness biodiesel during dual mode cultivation of mixotrophic microalgae. Bioresour. Technol. 2014, 165, 288–294. [Google Scholar] [CrossRef] [PubMed]
Figure 1.
Changes in the dry weight in P. kessleri TY under different culture conditions. (Abbreviations: Aut. Autotrophic; ND. nitrogen deficient; +Glc. mixotrophic (+Glucose); ND& (+Glc). nitrogen deficient & mixotrophic (+Glucose). (Mean ± SEM, n = 3).
Figure 1.
Changes in the dry weight in P. kessleri TY under different culture conditions. (Abbreviations: Aut. Autotrophic; ND. nitrogen deficient; +Glc. mixotrophic (+Glucose); ND& (+Glc). nitrogen deficient & mixotrophic (+Glucose). (Mean ± SEM, n = 3).

Figure 2.
Changes in the pigment content in P. kessleri TY under different culture conditions: (a). the contents of Chl. a; (b). the contents of Chl. b; (c). the contents of Chl. (a + b); (d). the contents of carotenoid. Abbreviations: Aut. Autotrophic; ND. nitrogen deficient; +Glc. mixotrophic (+Glucose); ND& (+Glc). nitrogen deficient & mixotrophic (+Glucose)). (Mean ± SEM, n = 3).

Figure 3.
Changes in the chlorophyll fluorescence parameter in P. kessleri TY under different culture conditions: (a). Fv/Fo (the potential activity of photosystem II); (b). Fv/Fm (the maximum quantum yield of photosystem II photochemistry); (c). PIABS (the maximum quantum yield of photosystem II photochemistry). Abbreviations: Aut. autotrophic; ND. nitrogen deficient; +Glc. mixotrophic (+Glucose); ND& (+Glc). nitrogen deficient & mixotrophic (+Glucose). (Mean ± SEM, n = 3).

Figure 4.
Changes in the fluorescence intensity in P. kessleri TY under different culture conditions. (The content of neutral lipids in cells is shown by the fluorescence intensity. Abbreviations: Aut. autotrophic; ND. nitrogen deficient; +Glc. mixotrophic (+Glucose); ND& (+Glc). nitrogen deficient & mixotrophic (+Glucose)). (Mean ± SEM, n = 3).

Figure 5.
The content of total lipid, carbohydrate, and protein in P. kessleri TY under different culture conditions on day 7. (The dry weight (g/L) of different culture conditions is displayed in the figure. Values with the same letters are not significantly different at the same time (p < 0.05)). (Mean ± SEM, n = 3).


Table 1.
Biomass productivity of P. kessleri TY under different culture conditions on day 7.
| Culture Conditions | Biomass Productivity (mg/(L·d)) |
|---|---|
| Autotrophic | 105.27 ± 2.33 c |
| Nitrogen deficient | 50.00 ± 10.33 d |
| Mixotrophic (+Glucose) | 215.71 ± 10.00 a |
| Nitrogen deficient & mixotrophic (+Glucose) | 164.29 ± 10.73 b |
Note: Data are means of triplicates. Means in each bar sharing the different superscript letter are significantly different, as determined by Tukey’s test (p < 0.05).
Table 2.
Lipid productivity of P. kessleri TY under different culture conditions on the 7th d.
| Culture Conditions Culture Conditions | Lipid Productivity (mg/(L∙d)) |
|---|---|
| Autotrophic | 35.61 ± 0.32 c |
| Nitrogen deficient | 22.48 ± 4.18 d |
| Mixotrophic (+Glucose) | 91.25 ± 1.86 b |
| Nitrogen deficient & mixotrophic (+Glucose) | 101.26 ± 4.18 a |
Note: Data are means of triplicates. Means in each bar sharing the different superscript letter is significantly different determined by Tukey’s test (p < 0.05).
Table 3.
Fatty acids composition of P. kessleri TY under different culture conditions. (Mean ± SEM, n = 3).
Table 3.
Fatty acids composition of P. kessleri TY under different culture conditions. (Mean ± SEM, n = 3).
| Fatty Acids Composition | Autotrophic (% DW) | Nitrogen Deficient (% DW) | Mixotrophic (+Glucose) (% DW) | Nitrogen Deficient & Mixotrophic (+Glucose) (% DW) |
|---|---|---|---|---|
| C16:0 | 22 ± 0.26 d | 26.79 ± 0.55 b | 23.95 ± 0.09 c | 29.02 ± 0.21 a |
| C16:1 | 2.3 ± 0.05 c | 4.17 ± 0.02 a | 3.88 ± 0.06 b | 4.08 ± 0.06 a |
| C16:2 | 6.81 ± 0.06 a | 2.30 ± 0.03 b | — | 0.80 ± 0.02 c |
| C16:3 | — | 3.70 ± 0.04 a | — | 1.10 ± 0.03 b |
| C18:0 | 7.71 ± 0.05 c | 6.29 ± 0.08 d | 8.35 ± 0.03 b | 8.93 ± 0.07 a |
| C18:1 | 5.31 ± 0.14 d | 17.08 ± 0.20 b | 15.87 ± 0.04 c | 17.84 ± 0.04 a |
| C18:2 | 14.64 ± 0.11 d | 22.00 ± 0.10 a | 21.12 ± 0.02 b | 20.38 ± 0.20 c |
| C18:3 | 28.79 ± 0.25 a | 10.30 ± 0.12 d | 17.94 ± 0.12 b | 12.35 ± 0.05 c |
| C16 + C18 | 87.56 ± 0.5 d | 92.64 ± 0.12 b | 91.11 ± 0.09 c | 94.48 ± 0.32 a |
| Other | 12.44 ± 0.5 a | 7.36 ± 0.12 c | 8.89 ± 0.09 b | 5.52 ± 0.32 d |
| SFA | 33.93 ± 0.06 c | 35.71 ± 0.19 b | 35.46 ± 0.16 b | 40.15 ± 0.15 a |
| MUFA | 8.69 ± 0.06 c | 22.90 ± 0.20 a | 21.65 ± 0.09 b | 23.20 ± 0.18 a |
| PUFA | 57.38 ± 0.11 a | 41.39 ± 0.01 b | 42.89 ± 0.08 b | 36.65 ± 0.03 c |
Note: Data are the means of triplicates. Means in each bar sharing the different superscript letter is significantly different determined by Tukey’s test (p < 0.05).
Publisher’s Note: MDPI stays neutral with regard to jurisdictional claims in published maps and institutional affiliations. |
© 2021 by the authors. Licensee MDPI, Basel, Switzerland. This article is an open access article distributed under the terms and conditions of the Creative Commons Attribution (CC BY) license (https://creativecommons.org/licenses/by/4.0/).
Share and Cite
MDPI and ACS Style
Gao, Y.; Ji, L.; Feng, J.; Lv, J.; Xie, S. Effects of Combined Nitrogen Deficient and Mixotrophic (+Glucose) Culture on the Lipid Accumulation of Parachlorella Kessleri TY. Water 2021, 13, 3066. https://doi.org/10.3390/w13213066
AMA Style
Gao Y, Ji L, Feng J, Lv J, Xie S. Effects of Combined Nitrogen Deficient and Mixotrophic (+Glucose) Culture on the Lipid Accumulation of Parachlorella Kessleri TY. Water. 2021; 13(21):3066. https://doi.org/10.3390/w13213066
Chicago/Turabian StyleGao, Yifan, Li Ji, Jia Feng, Junping Lv, and Shulian Xie. 2021. "Effects of Combined Nitrogen Deficient and Mixotrophic (+Glucose) Culture on the Lipid Accumulation of Parachlorella Kessleri TY" Water 13, no. 21: 3066. https://doi.org/10.3390/w13213066
Note that from the first issue of 2016, this journal uses article numbers instead of page numbers. See further details here.