
Applying Risk Indices to Assess and Manage Soil Salinization and Sodification in Crop Fields within a Mediterranean Hydro-Agricultural Area

 ,
,  ,
,  ,
,  ,
, 
Abstract
:1. Introduction
2. Materials and Methods
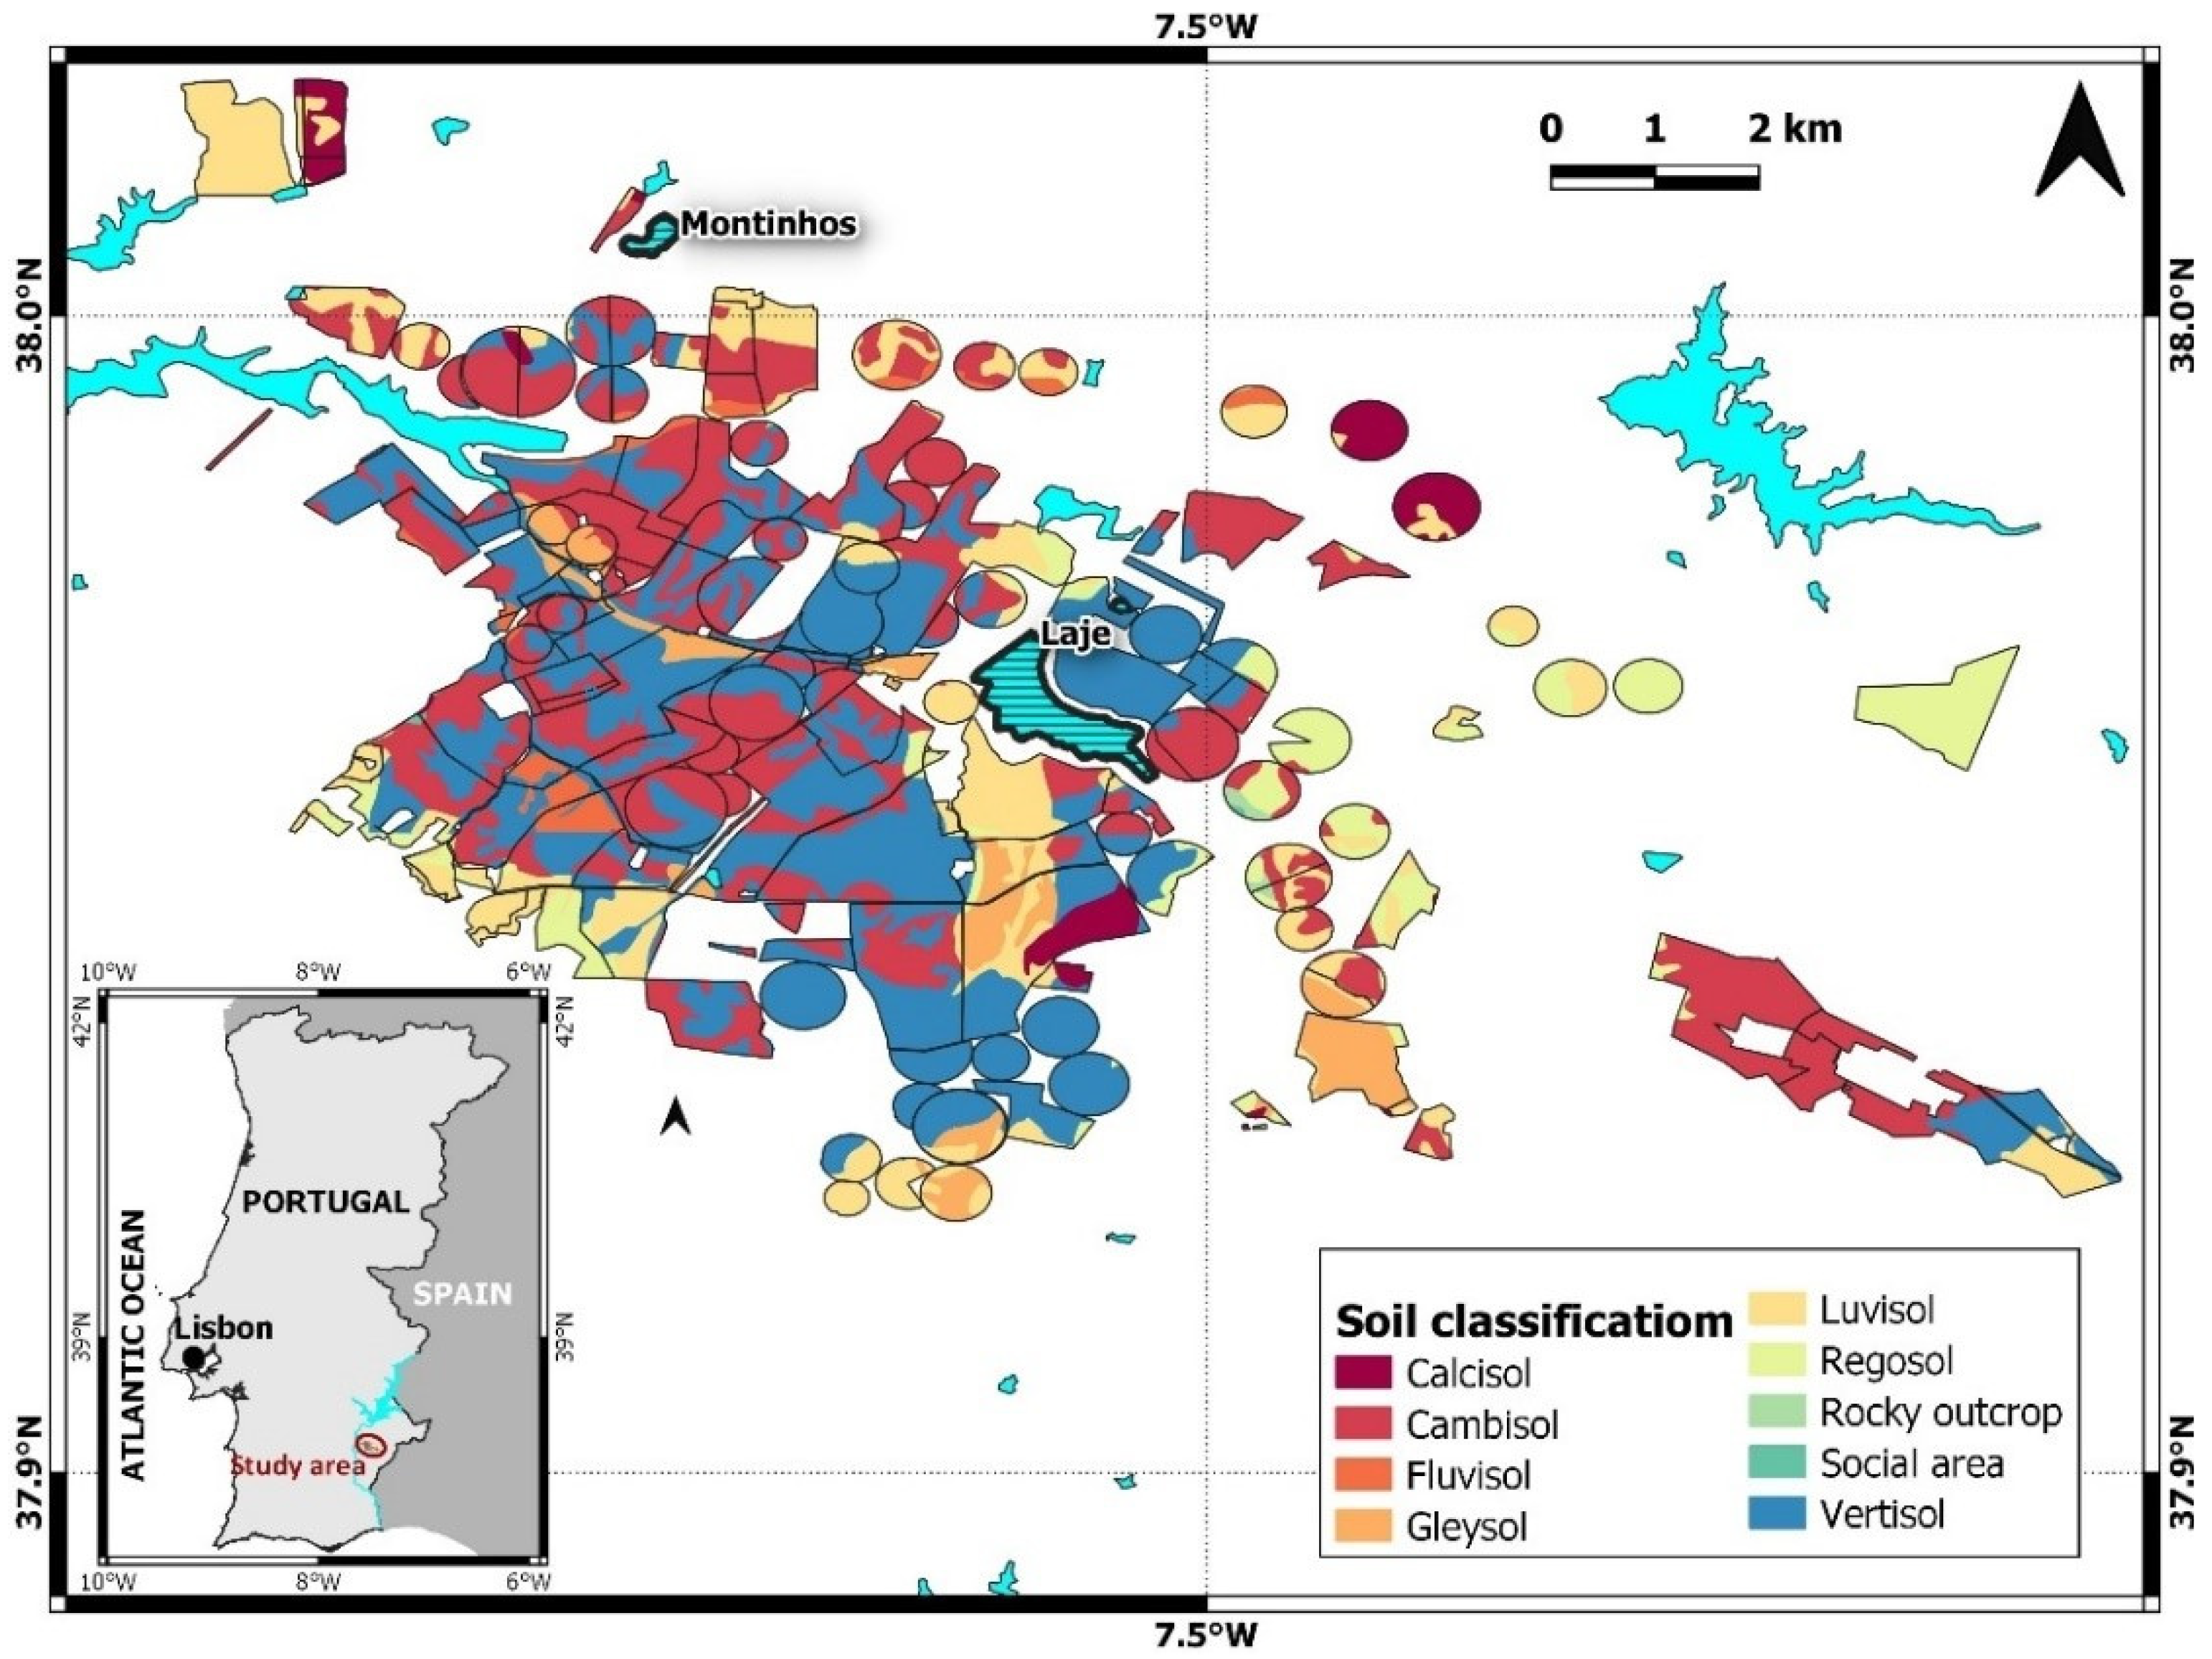
2.1. Study Area
2.1.1. Hydro-Agricultural Area
2.1.2. Irrigated Crop Fields
2.2. Risk Assessment
2.3. Data Collection, Sampling, and Physical-Chemical Analyses

| Indicator | Data Sources and Estimation Methods | |
|---|---|---|
| Hydro-Agricultural Area | Crop Fields | |
| AI | Ratio P/ETP [27]; P and ETP obtained from the ERA5 dataset of Monthly-mean averages values. ERA5 is the fifth-generation reanalysis product provided by the European Centre for Medium-Range Weather Forecasts (ECMWF; [31]) | |
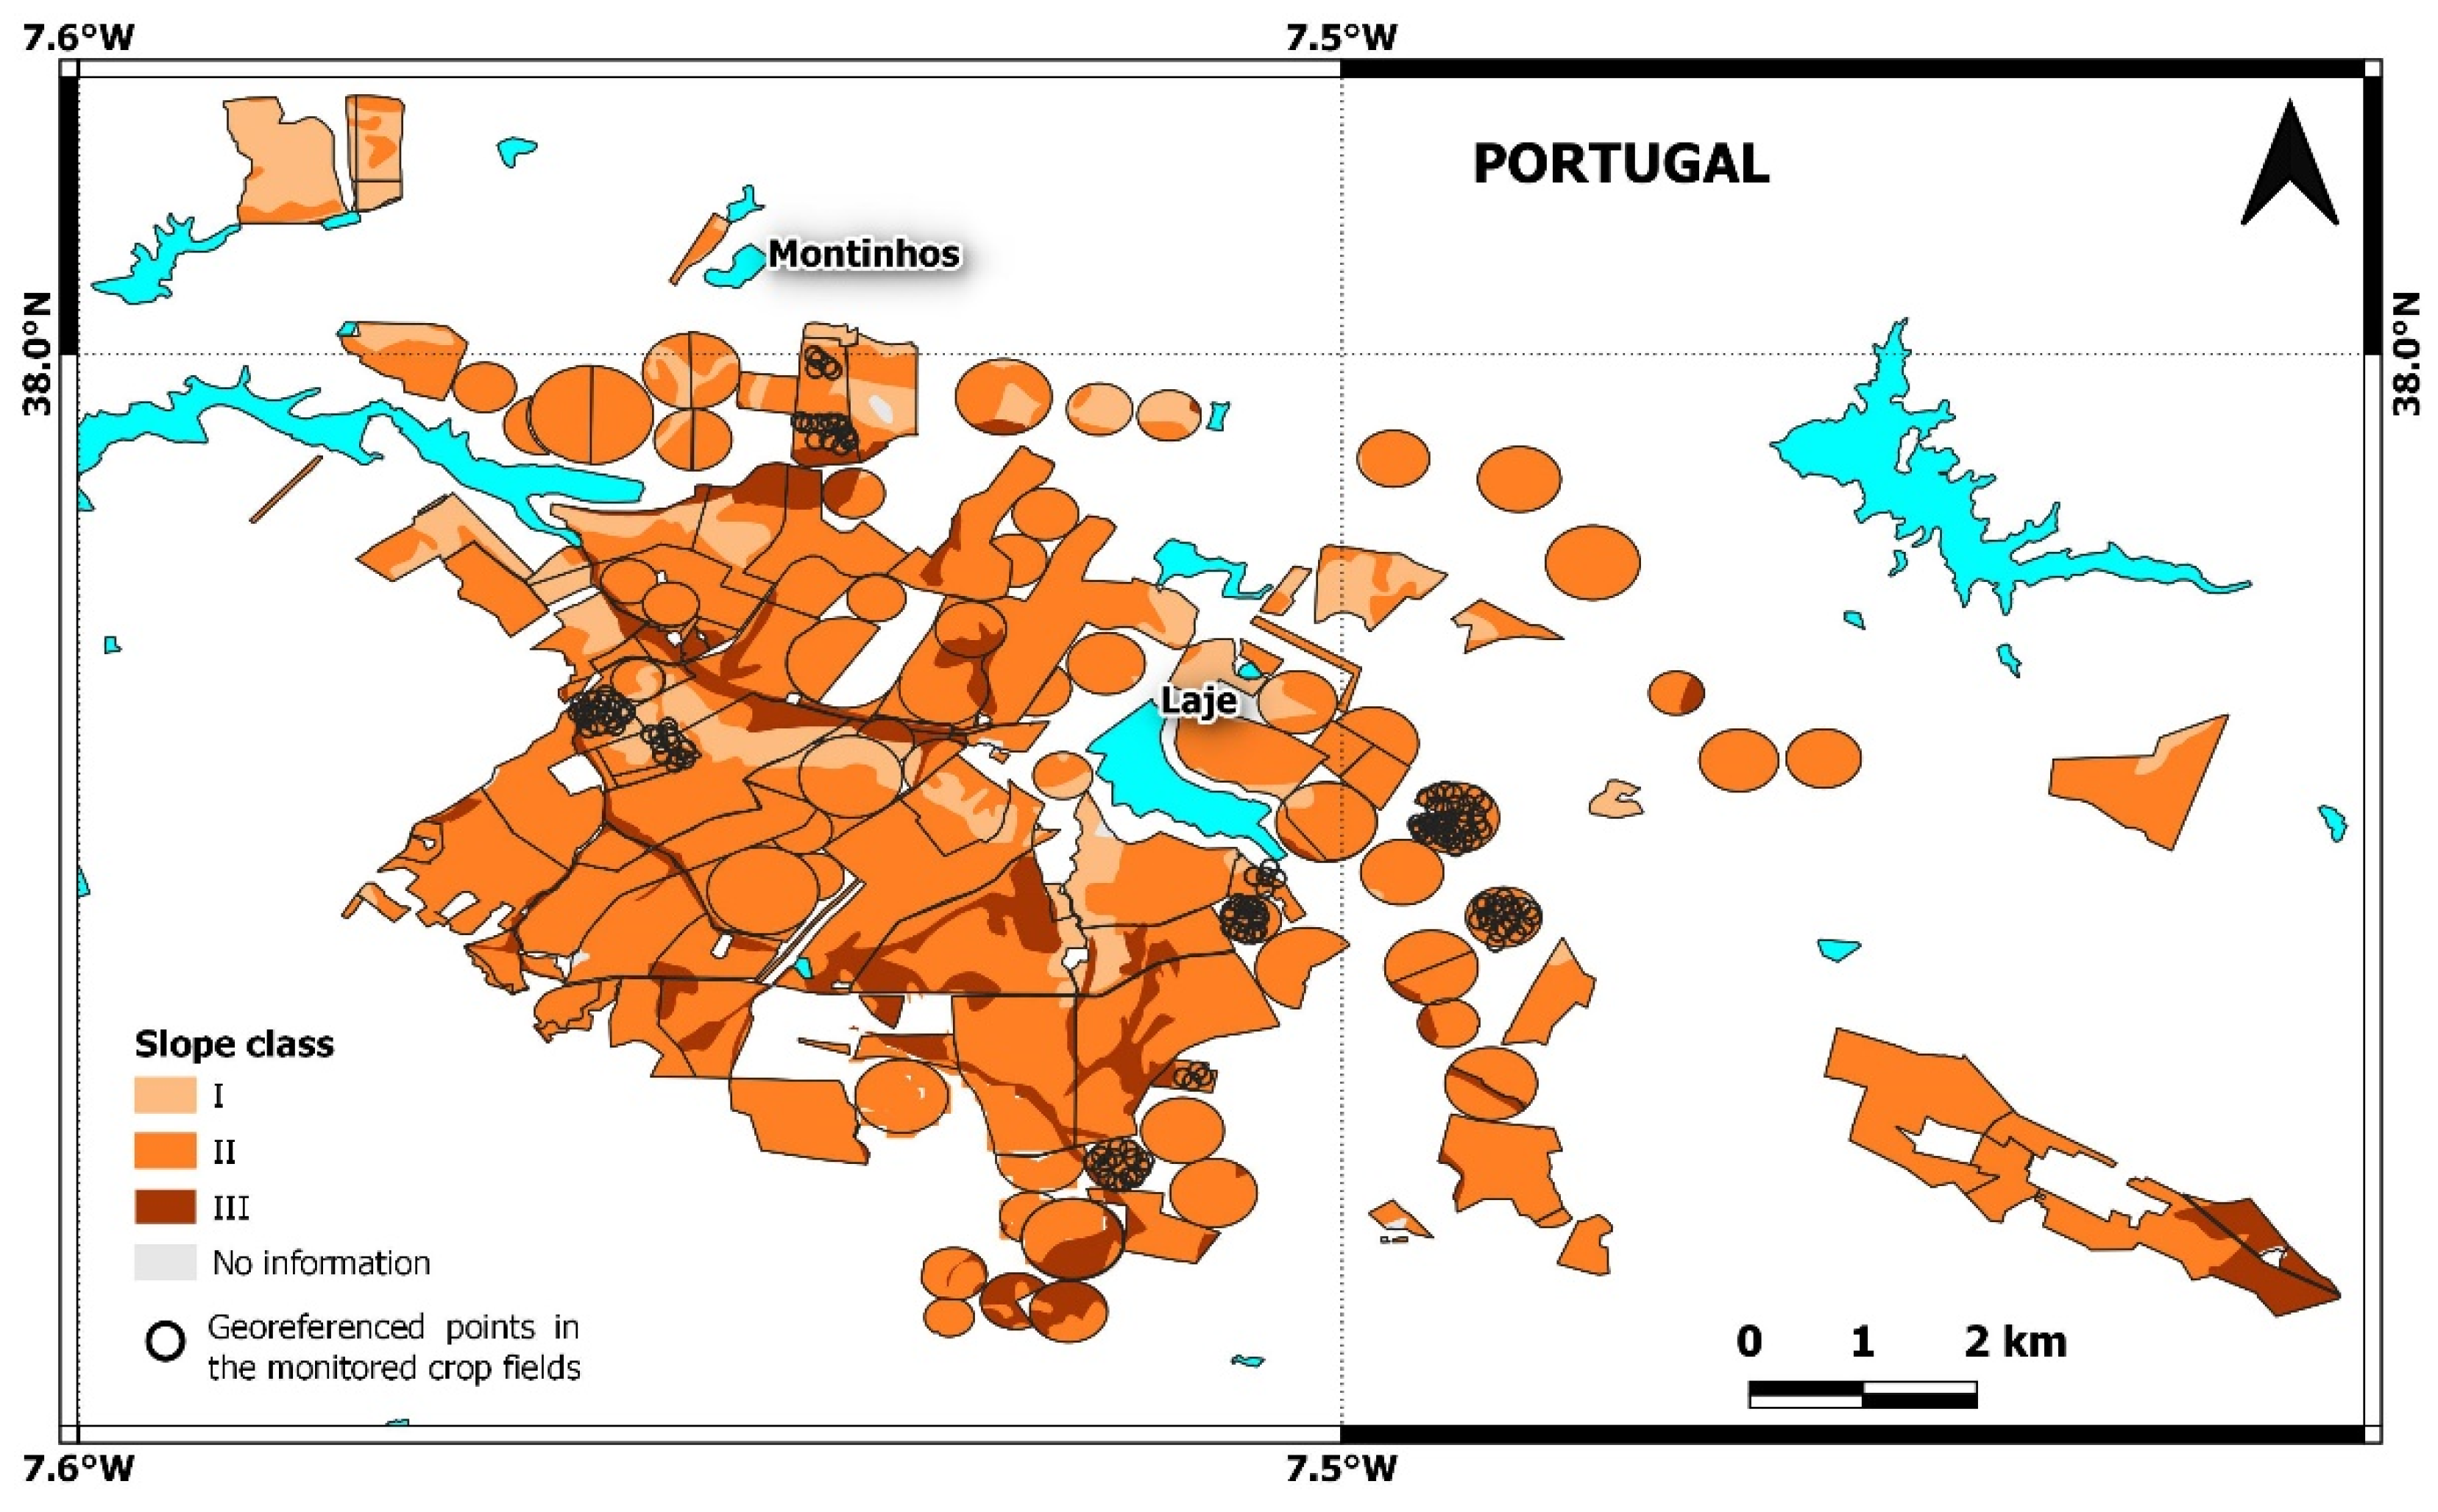
| Sl | Portuguese soil and land use capacity chart [32] | |
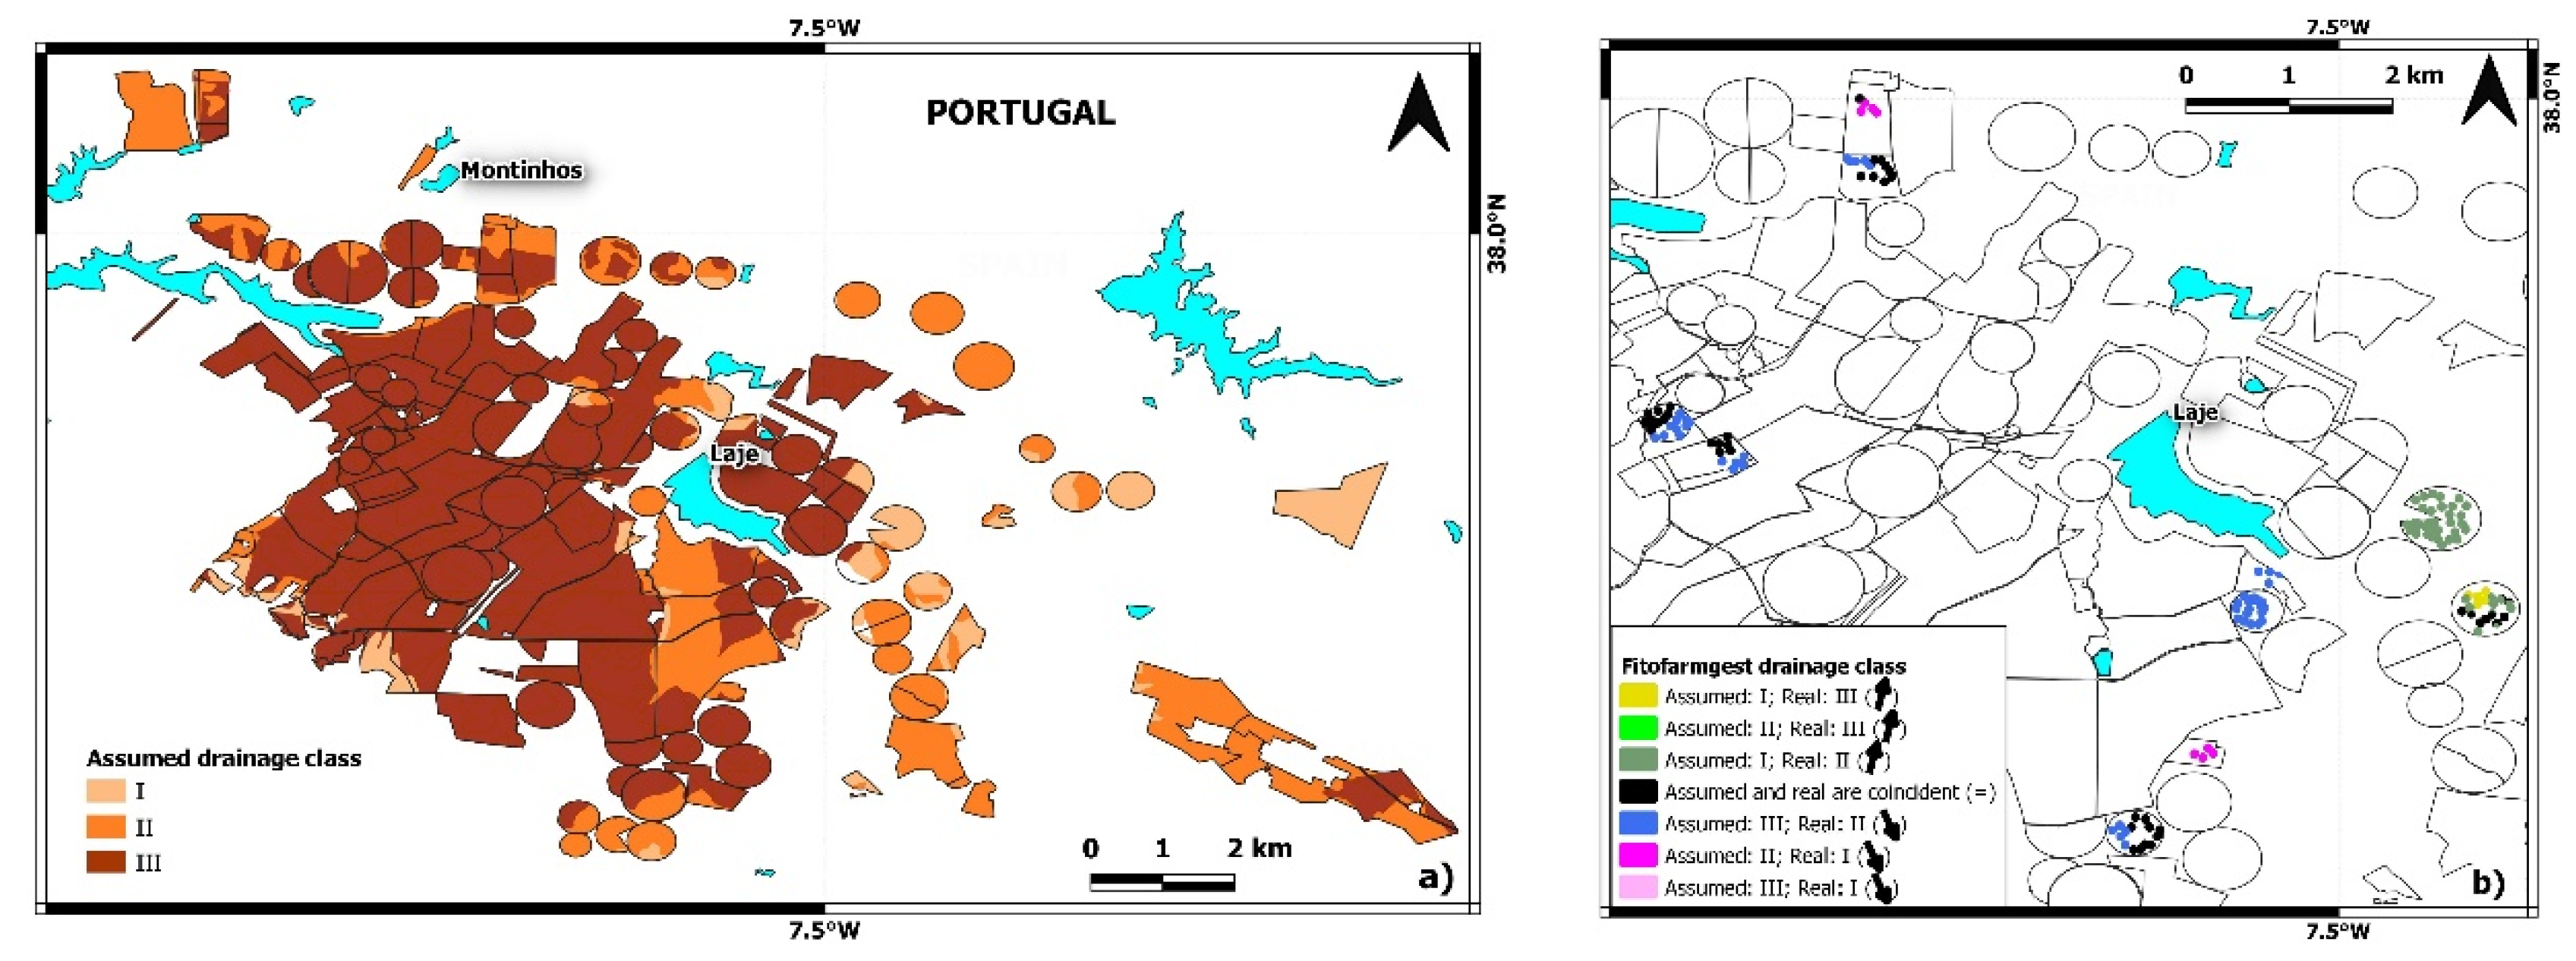
| SD | Estimated from textural classes of the surface horizons/layers of the predominant soil units in the Portuguese soil and land use capacity chart [32] | Estimated from textural classes determined from particle size distribution of soil samples |
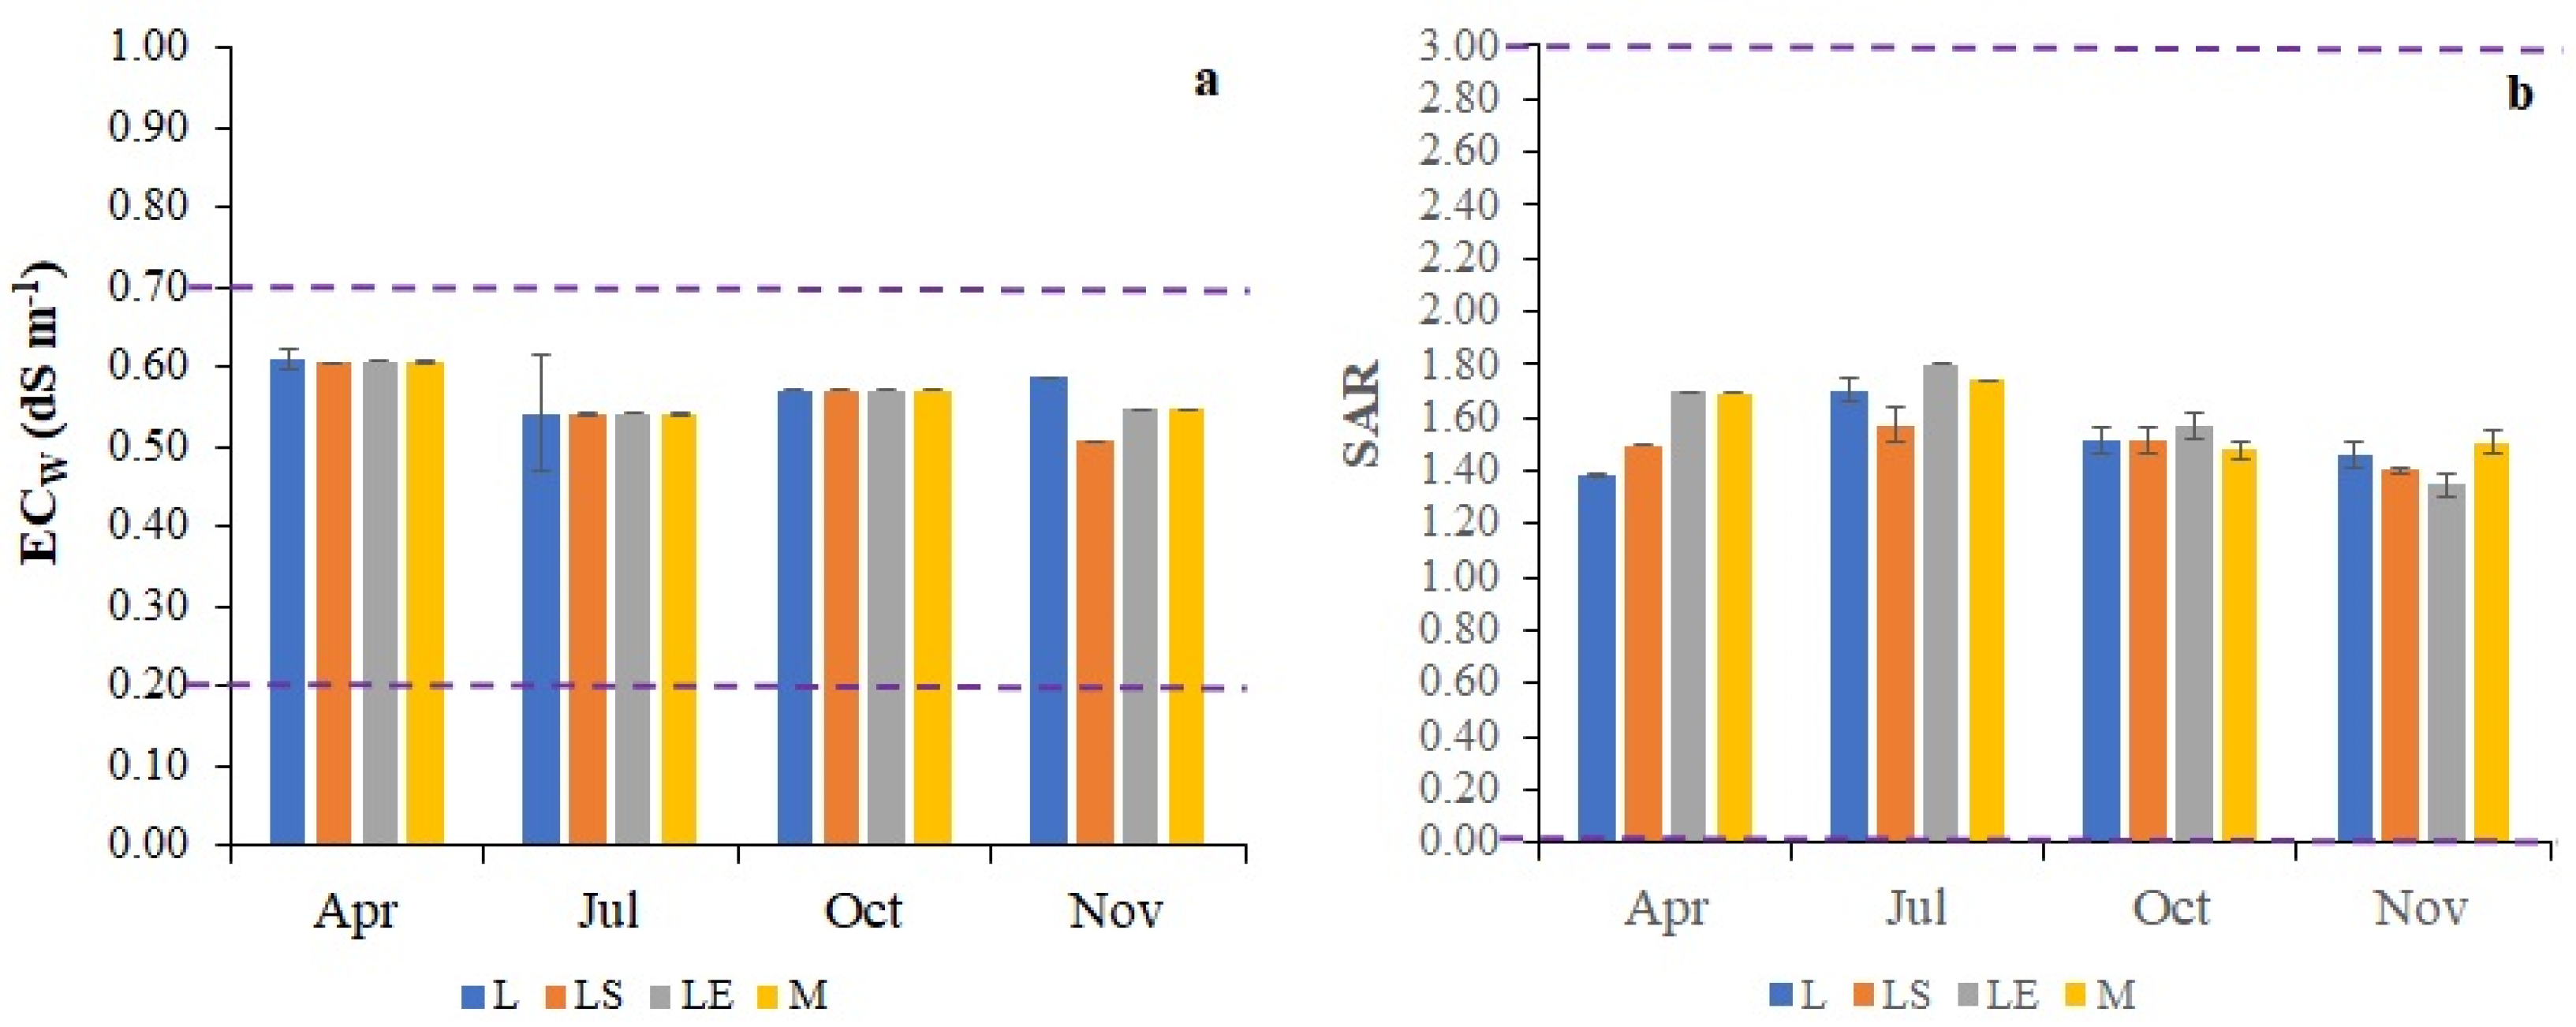
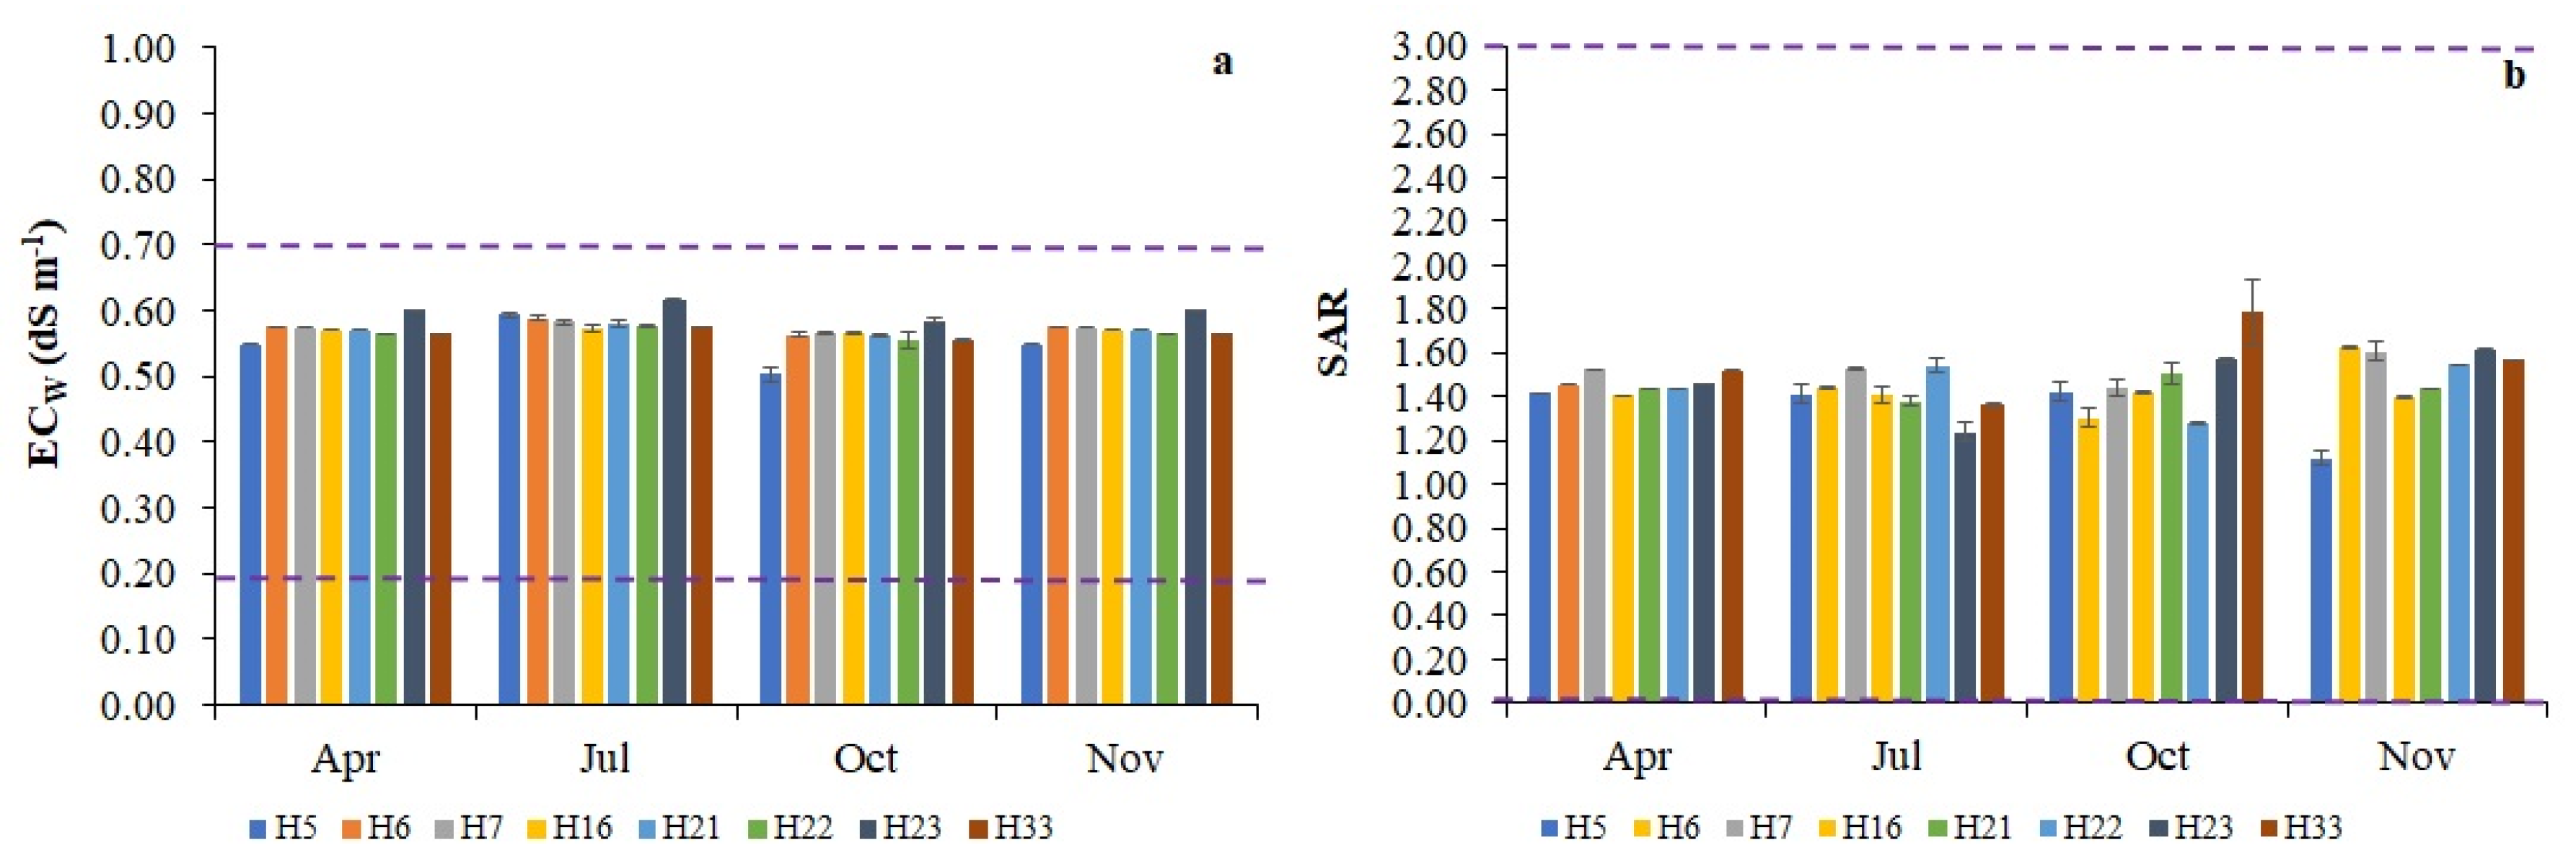
| ECw | Evaluation of the reservoir water quality for irrigation according to the FAO guidelines [28] | Evaluation of the hydrants’ water quality for irrigation according to the FAO guidelines [28] |
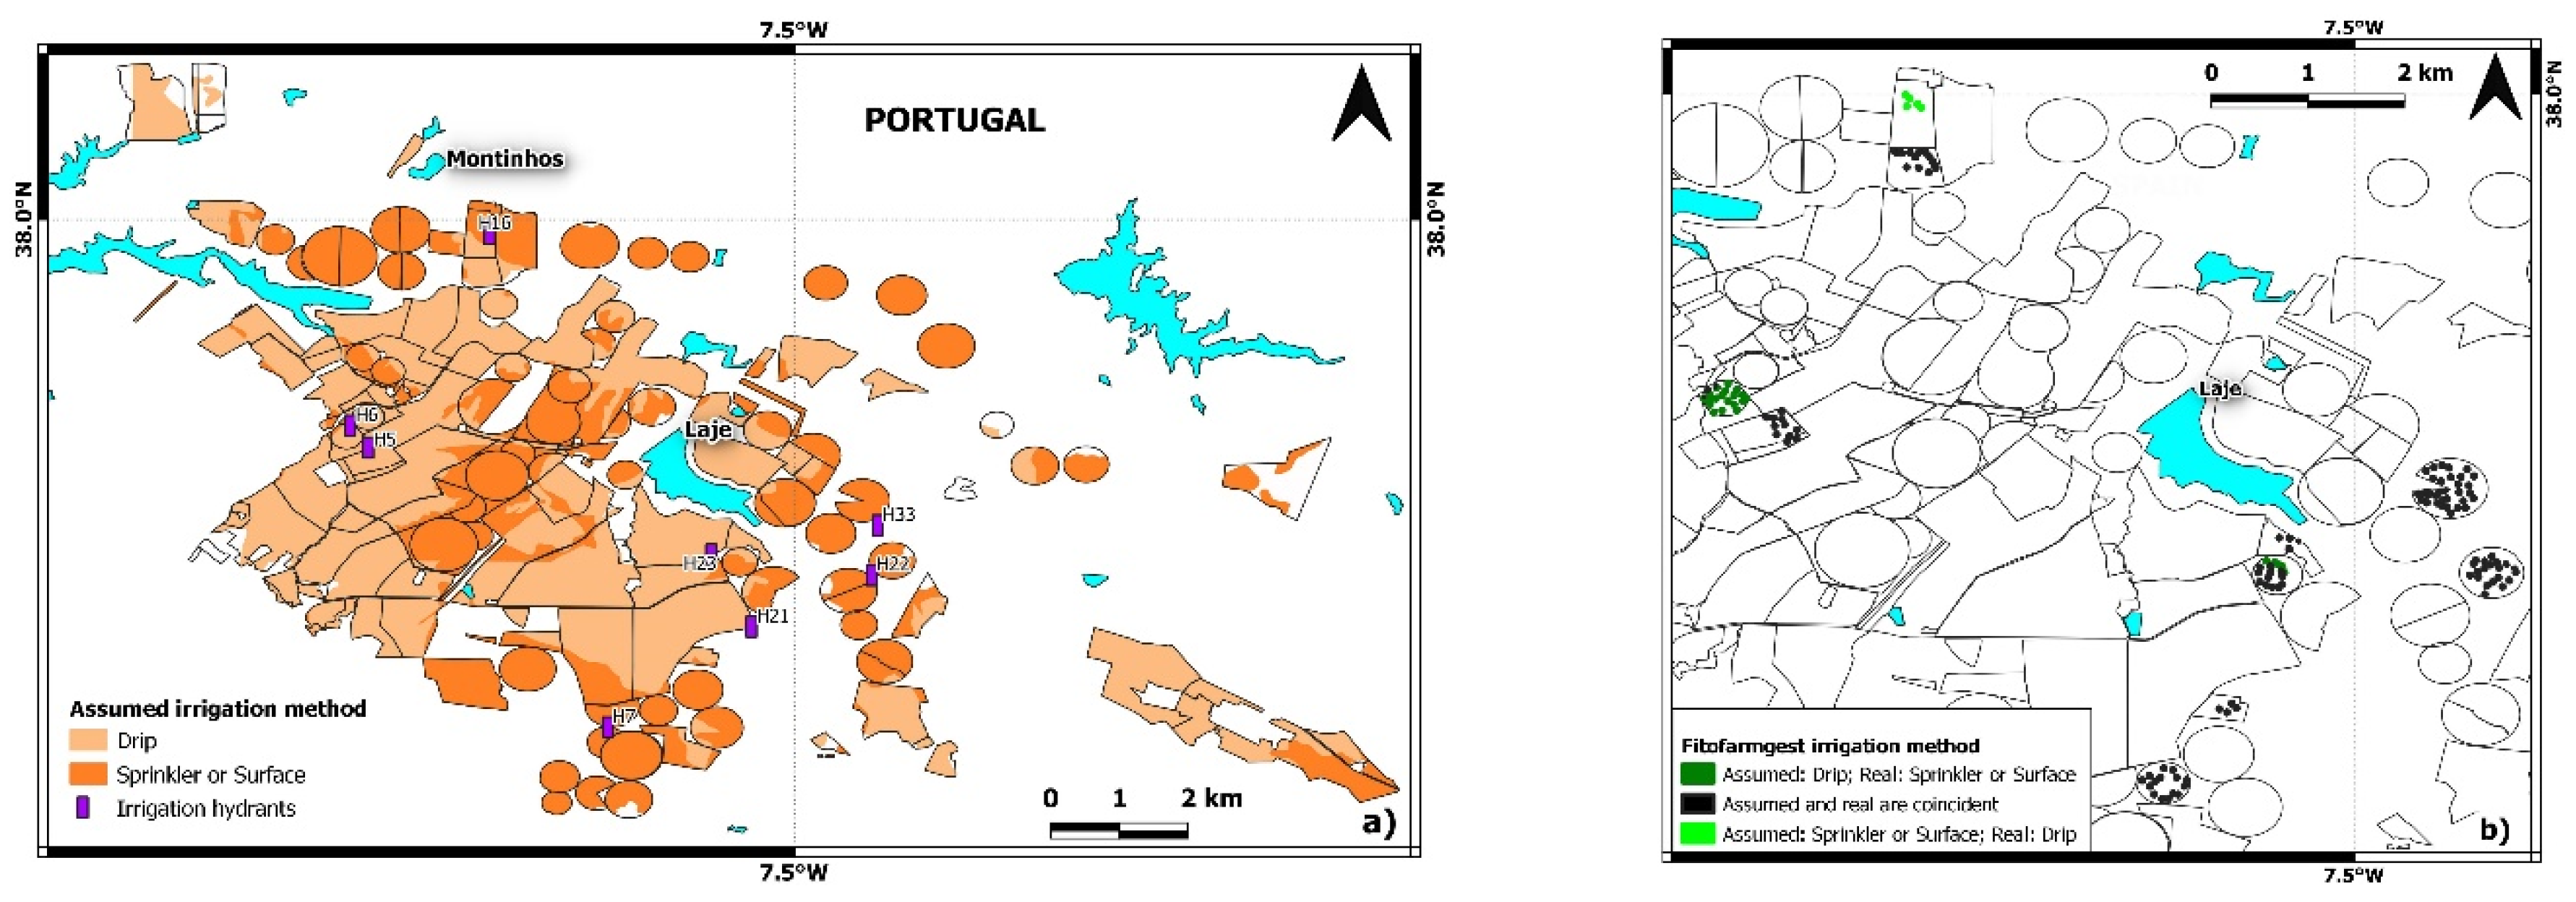
| IM | A probable irrigation method is assigned based on the chart of Land Use and Occupation (COS2018) in Continental Portugal, made available from the Portuguese Directorate General for Territory (DGT—Direcção-Geral do Território) [33] | Actual data of crop occupation made available from the Alqueva Development and Infrastructures Company (EDIA—Empresa de Desenvolvimento e Infraestruturas de Alqueva) [34] |
| SAR ˄ ECW | Evaluation of the reservoir water quality for irrigation according to the FAO guidelines [28] | Evaluation of the hydrants’ water quality for irrigation according to the FAO guidelines [28] |
3. Results and Discussion
3.1. Indicators
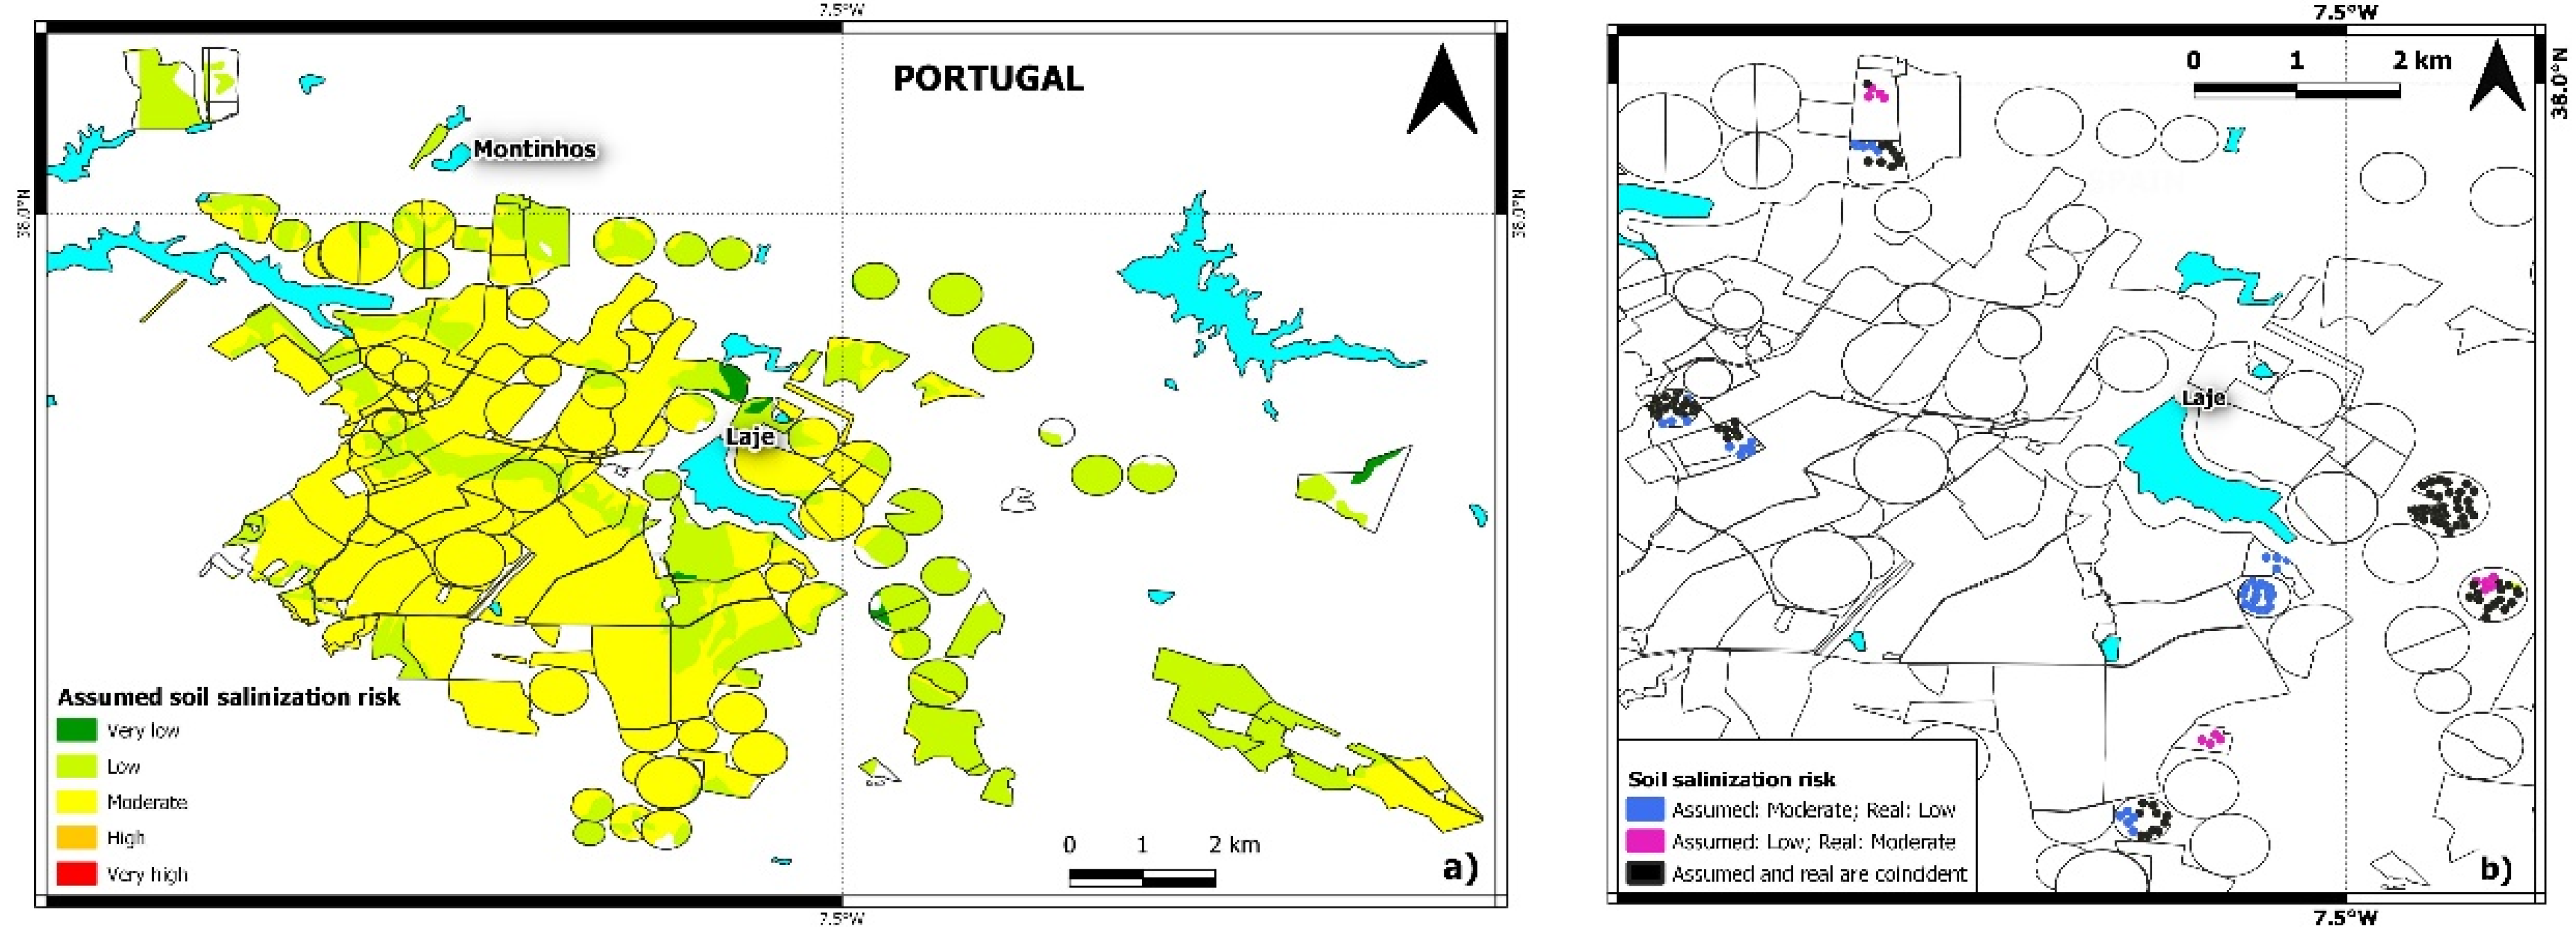
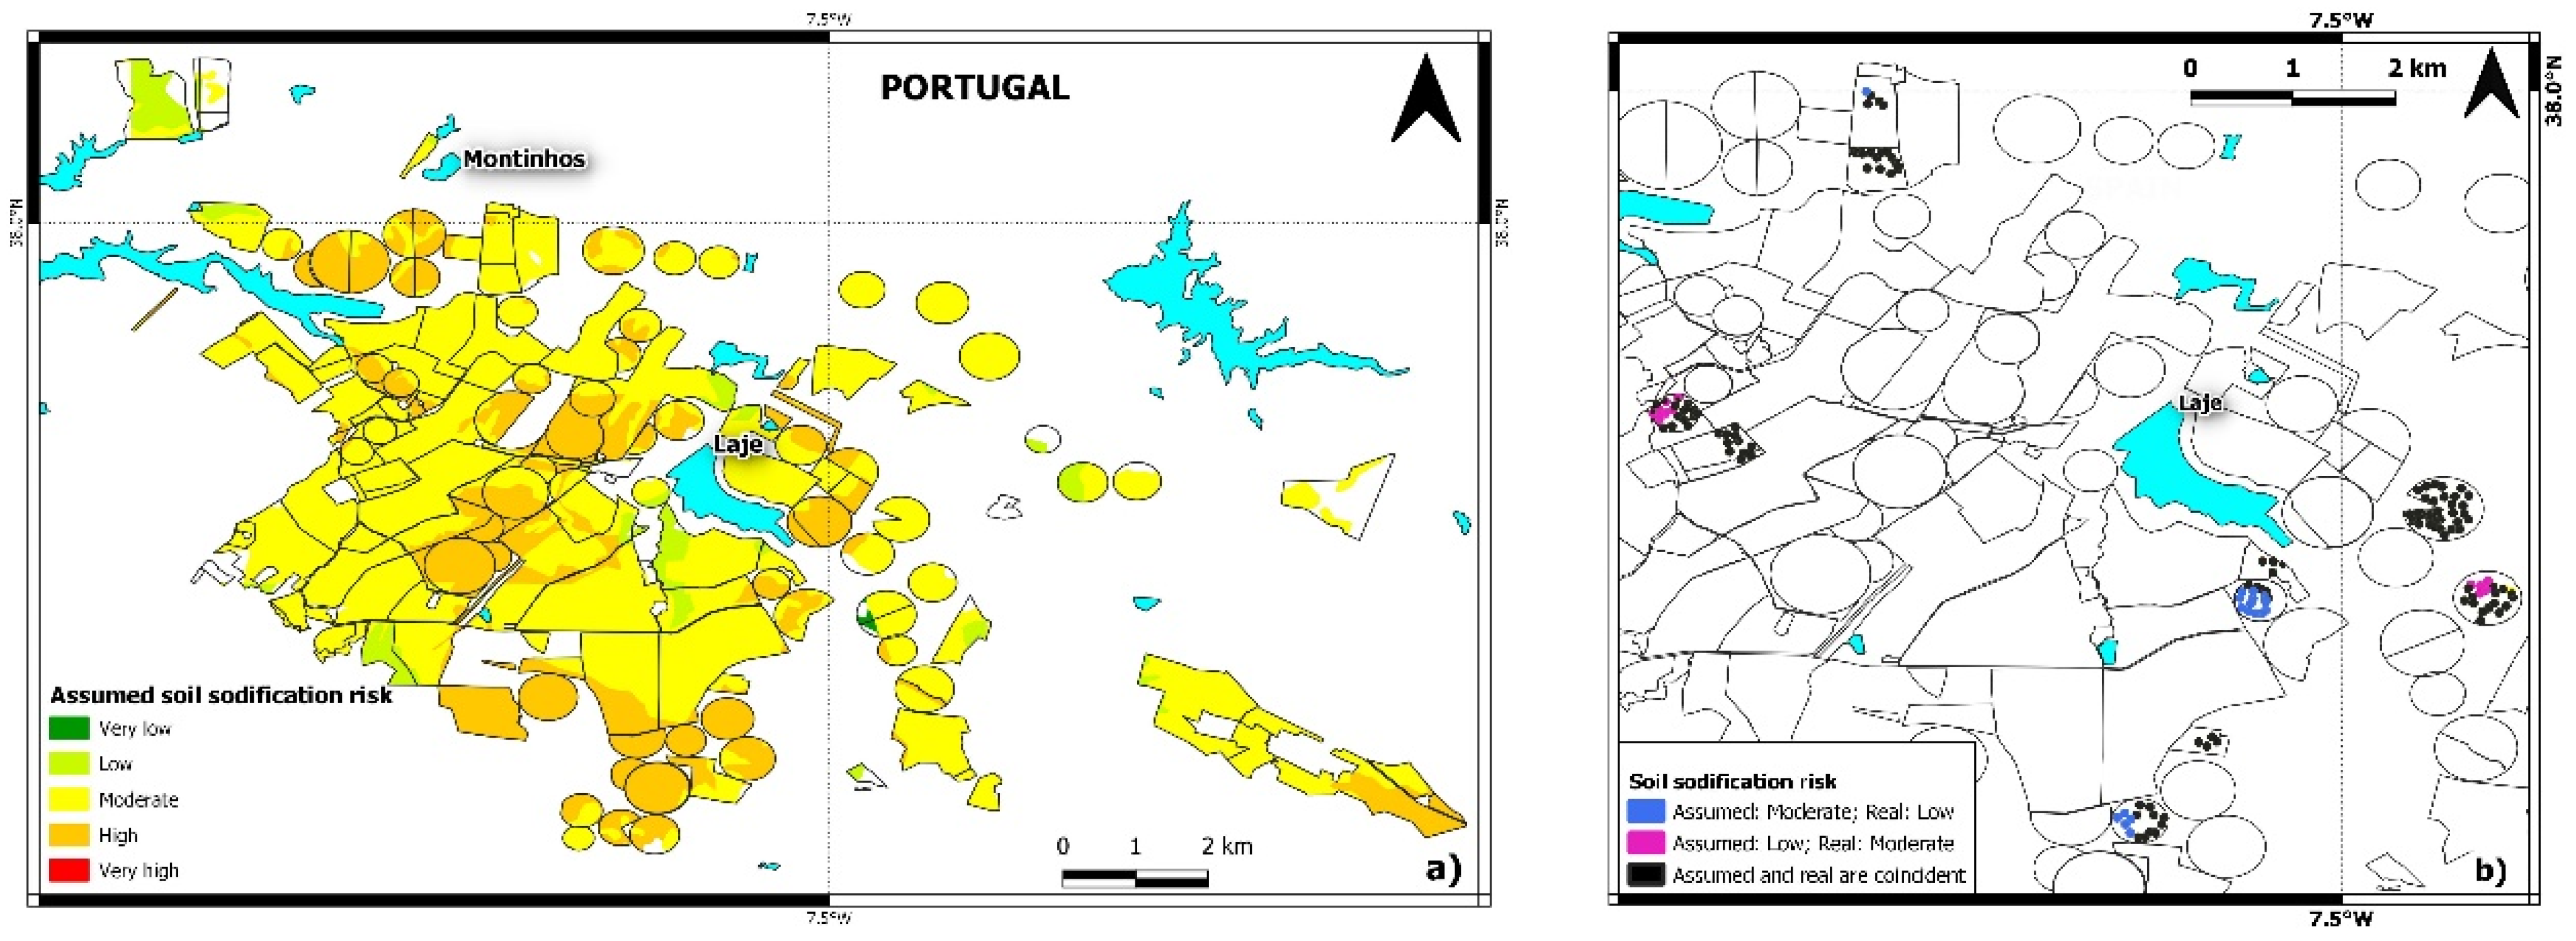
3.2. Maps of Salinization and Sodification Risk
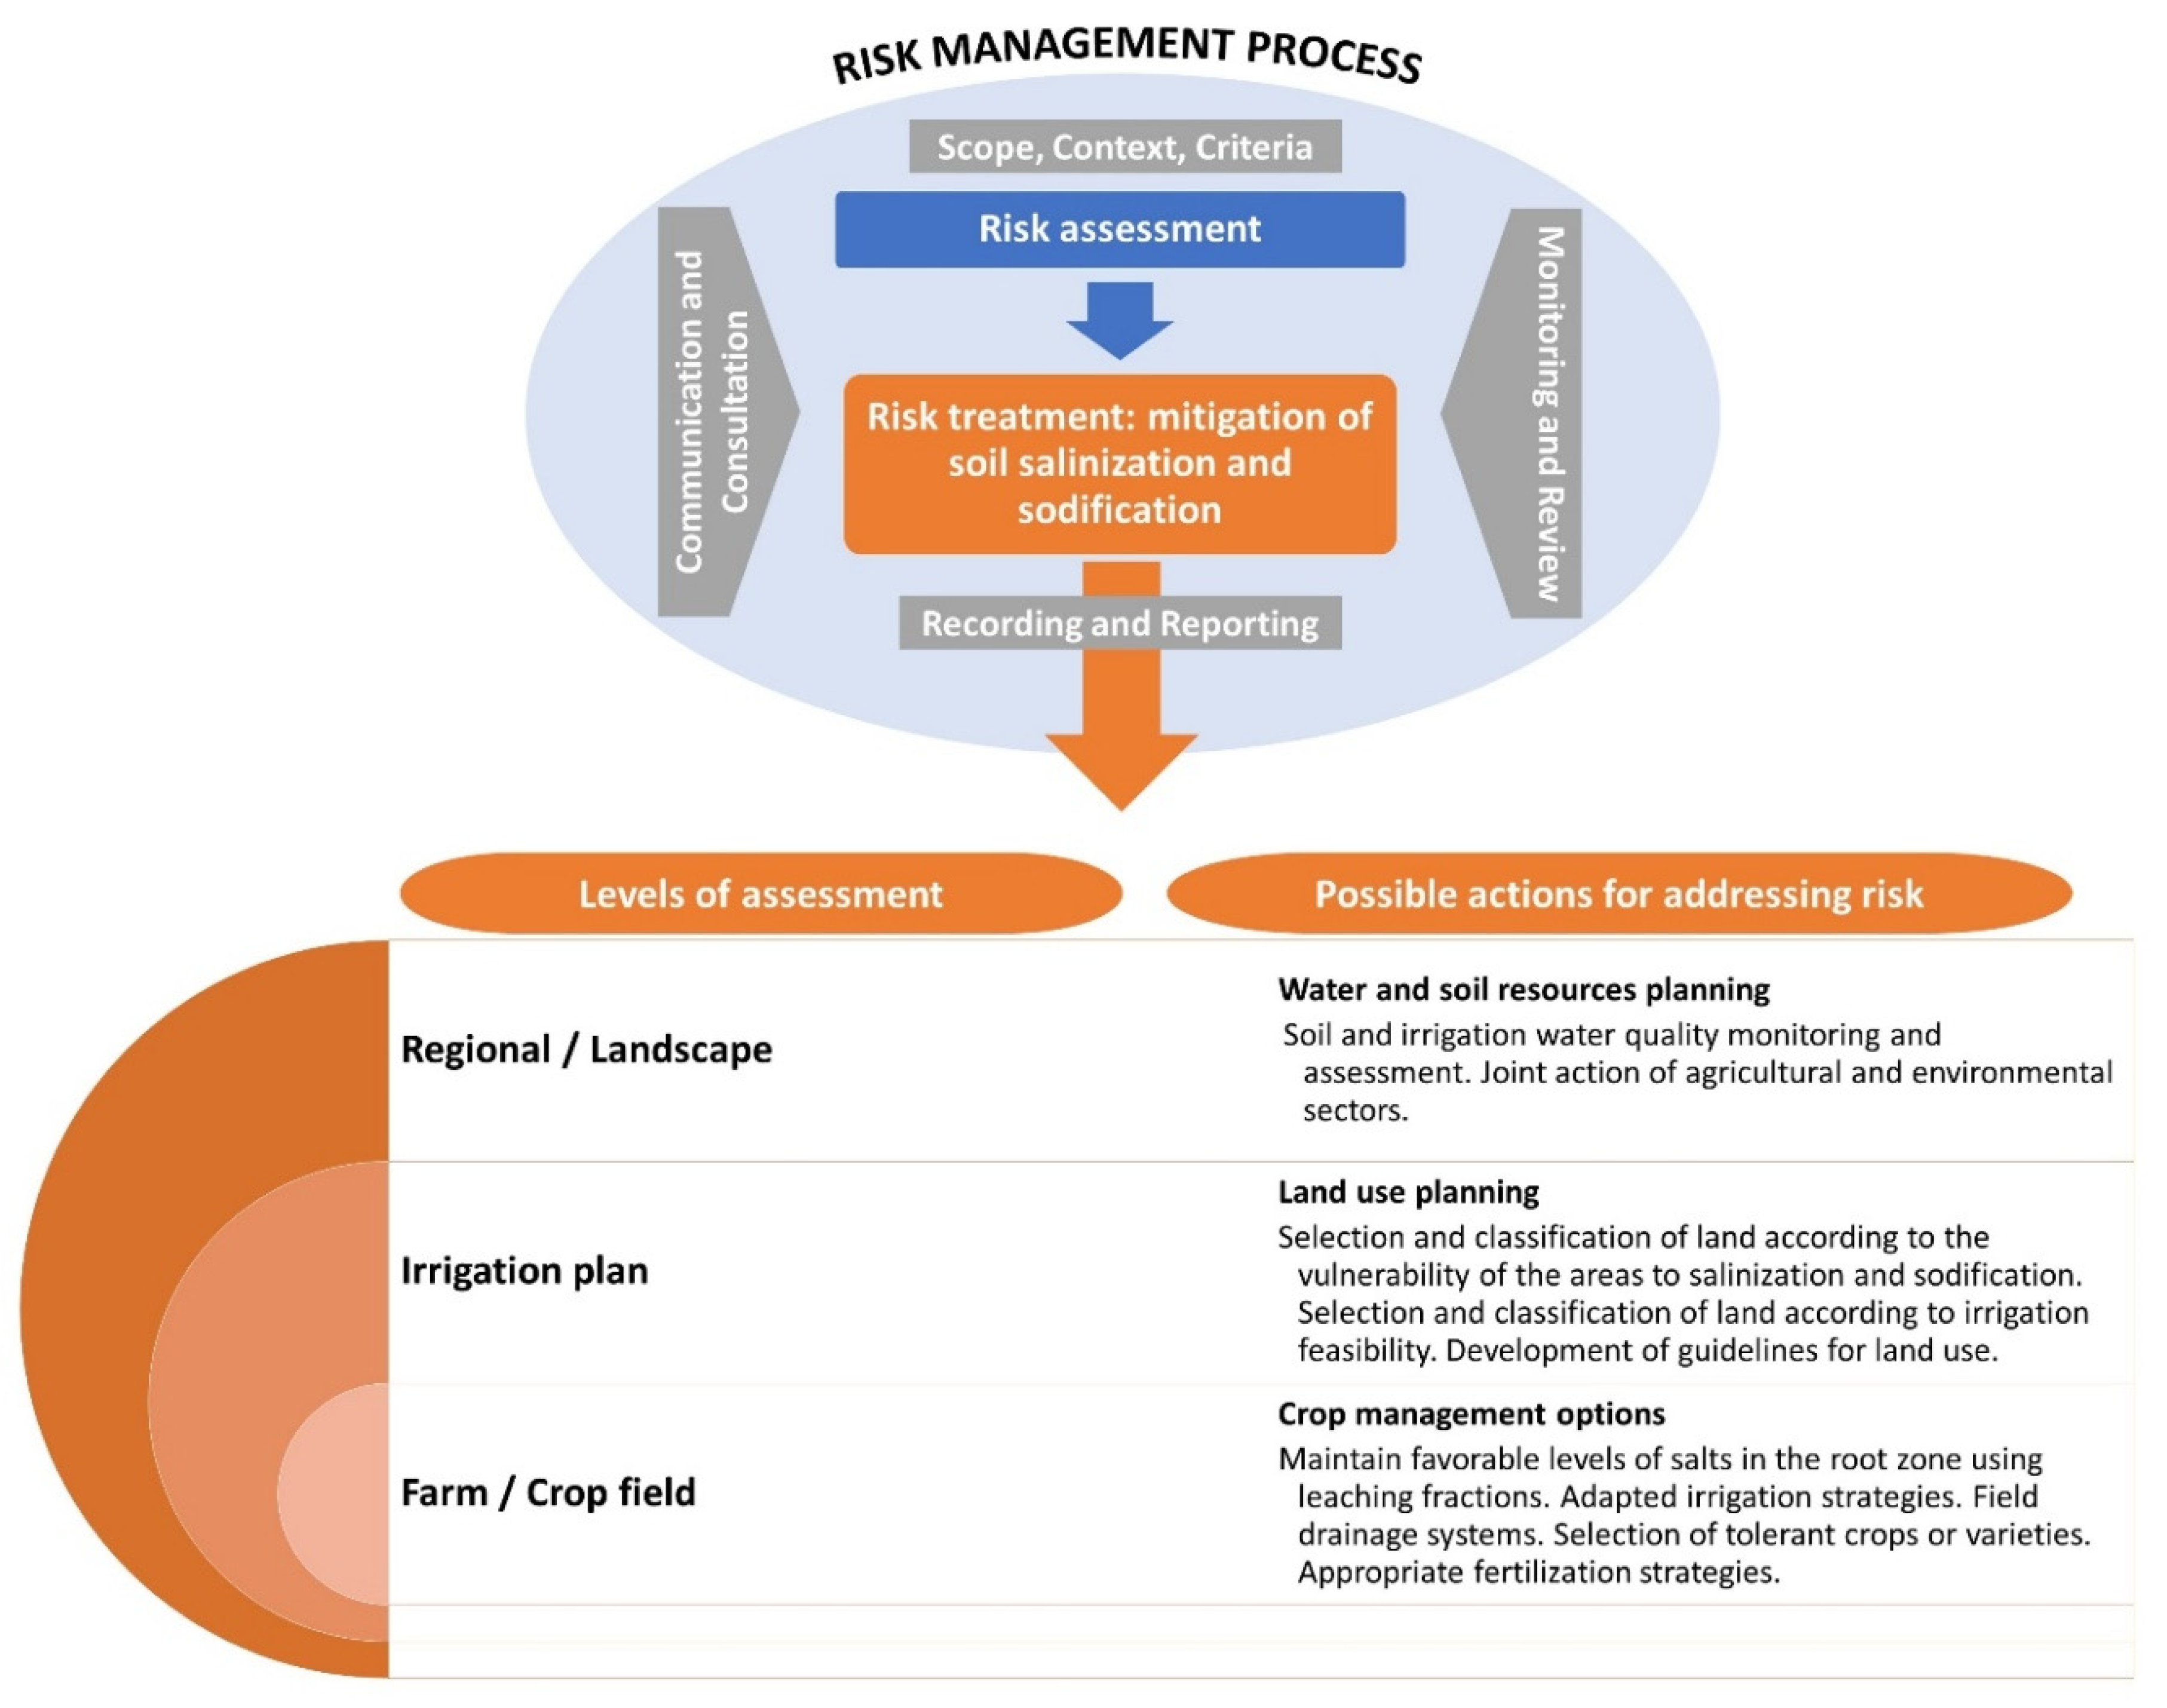
3.3. Hints for Risk Management of Salinization and Sodification in Irrigated Agroecosystems
- Regional scale: management and planning of water and soil resources—long term irrigation water and soil quality assessment regarding its uses (involves the strengthening of actions and links between institutions in the agricultural and environmental sectors responsible for the implementation of resource-planning policies).
- Irrigation plan/perimeter scale: land use planning—selection and classification of land according to the vulnerability of the areas to salinization and sodification processes; selection and classification of land according to irrigation feasibility; development of guidelines for land use.
- Farm/crop scale: crop management options—maintain favorable levels of salts in the root zone through the use of leaching fractions; adapted irrigation and field drainage strategies; selection of tolerant crops or varieties; other agronomic practices for prevention and mitigation.
4. Conclusions
Author Contributions
Funding
Institutional Review Board Statement
Informed Consent Statement
Acknowledgments
Conflicts of Interest
References
- Nuñez, M.; Tóth, T. Ecosystem Services and Salinisation. In Final Report of the EIP-AGRI Focus Group: Soil Salinisation; European Comission: Brussels, Belgium, 2020; p. 10. [Google Scholar]
- Adhikari, K.; Hartemink, A.E. Linking Soils to Ecosystem Services—A Global Review. Geoderma 2016, 262, 101–111. [Google Scholar] [CrossRef]
- Richards, L.A. Diagnosis and Improvement of Saline and Alkali Soils; Agriculture Handbook; USDA: Washington, DC, USA, 1954; Volume 60.
- Minhas, P.S.; Ramos, T.B.; Ben-Gal, A.; Pereira, L.S. Coping with Salinity in Irrigated Agriculture: Crop Evapotranspiration and Water Management Issues. Agric. Water Manag. 2020, 227, 105832. [Google Scholar] [CrossRef]
- Weil, R.R.; Brady, N.C. The Nature and Properties of Soils, 15th ed.; Pearson: Columbus, OH, USA, 2016; ISBN 978-0-13-325448-8. [Google Scholar]
- Rengasamy, P. Soil Processes Affecting Crop Production in Salt-Affected Soils. Funct. Plant. Biol. 2010, 37, 613. [Google Scholar] [CrossRef]
- Qadir, M.; Quillérou, E.; Nangia, V.; Murtaza, G.; Singh, M.; Thomas, R.J.; Drechsel, P.; Noble, A.D. Economics of Salt-Induced Land Degradation and Restoration. Nat. Resour. Forum. 2014, 38, 282–295. [Google Scholar] [CrossRef]
- Mateo-Sagasta, J.; Burke, J. Agriculture and Water Quality Interactions: A Global Overview; SOLAW Background Thematic Report-TR08; Food and Agriculture Organization of the United Nations: Rome, Italy, 2010. [Google Scholar]
- Stolte, J.; Tesfai, M.; Øygarden, L.; Kværnø, S.; Keizer, J.; Verheijen, F.; Panagos, P.; Ballabio, C.; Hessel, R. Soil Threats in Europe; JCR Technical Report; European Comission: Brussels, Belgium, 2016. [Google Scholar]
- Tomaz, A.; Palma, P.; Fialho, S.; Lima, A.; Alvarenga, P.; Potes, M.; Salgado, R. Spatial and Temporal Dynamics of Irrigation Water Quality under Drought Conditions in a Large Reservoir in Southern Portugal. Environ. Monit. Assess. 2020, 192, 93. [Google Scholar] [CrossRef] [PubMed]
- Tomaz, A.; Palma, P.; Alvarenga, P.; Gonçalves, M.C. Chapter 13-Soil salinity risk in a climate change scenario and its effect on crop yield. In Climate Change and Soil Interactions; Prasad, M.N.V., Pietrzykowski, M., Eds.; Elsevier: Amsterdam, The Netherlands, 2020; pp. 351–396. ISBN 978-0-12-818032-7. [Google Scholar]
- Yeo, A. Predicting the Interaction between the Effects of Salinity and Climate Change on Crop Plants. Sci. Hortic. 1998, 78, 159–174. [Google Scholar] [CrossRef]
- Zalidis, G.; Stamatiadis, S.; Takavakoglou, V.; Eskridge, K.; Misopolinos, N. Impacts of Agricultural Practices on Soil and Water Quality in the Mediterranean Region and Proposed Assessment Methodology. Agric. Ecosyst. Environ. 2002, 88, 137–146. [Google Scholar] [CrossRef]
- Singh, A. Soil Salinization and Waterlogging: A Threat to Environment and Agricultural Sustainability. Ecol. Indic. 2015, 57, 128–130. [Google Scholar] [CrossRef]
- Muyibul, Z.; Jianxin, X.; Muhtar, P.; Qingdong, S.; Run, Z. Spatiotemporal Changes of Land Use/Cover from 1995 to 2015 in an Oasis in the Middle Reaches of the Keriya River, Southern Tarim Basin, Northwest China. Catena 2018, 171, 416–425. [Google Scholar] [CrossRef]
- Bloem, E.; van der Zee, S.E.A.T.M.; Tóth, T.; Hagyo, A. Risk Assessment Methods of Salinity; Report EUR 24097 EN; Publications Office of the European Union: Luxembourg, 2008; ISBN 978-92-79-14291-8. [Google Scholar]
- Shahid, S. Developments in Soil Salinity Assessment, Modeling, Mapping, and Monitoring from Regional to Submicroscopic Scales; Shahid, S., Abdelfattah, M., Taha, F., Eds.; Springer: Dordrecht, The Netherlands, 2013; pp. 3–43. ISBN 978-94-007-5683-0. [Google Scholar]
- Tomaz, A.; Palma, P.; Fialho, S.; Lima, A.; Alvarenga, P.; Potes, M.; Costa, M.; Salgado, R. Risk Assessment of Irrigation-Related Soil Salinization and Sodification in Mediterranean Areas. Water 2020, 12, 3569. [Google Scholar] [CrossRef]
- Chartzoulakis, K.S. The Use of Saline Water for Irrigation of Olives: Effects on Growth, Phisiology, Yield and Oil Quality. Acta Hortic. 2011, 888, 97–108. [Google Scholar] [CrossRef]
- Rhoades, J.D.; Kandiah, A.; Mashali, A.M. The Use of Saline Waters for Crop. Production; FAO Irrigation and Drainage Paper; Food and Agriculture Organization of the United Nations: Rome, Italy, 1992; ISBN 978-92-5-103237-4. [Google Scholar]
- Hillel, D. Salinity Management for Sustainable Irrigation: Integrating Science, Environment, and Economics; The World Bank: Washington, DC, USA, 2000; ISBN 978-0-8213-4773-7. [Google Scholar]
- Ren, D.; Wei, B.; Xu, X.; Engel, B.; Li, G.; Huang, Q.; Xiong, Y.; Huang, G. Analyzing Spatiotemporal Characteristics of Soil Salinity in Arid Irrigated Agro-Ecosystems Using Integrated Approaches. Geoderma 2019, 356, 113935. [Google Scholar] [CrossRef]
- IPMA. Climate Normals-1981-2010-Beja. Available online: https://www.ipma.pt/en/oclima/normais.clima/1981-2010/002/ (accessed on 6 July 2019).
- IUSS Working Group WRB. World Reference Base for Soil Resources 2014, Update 2015; FAO: Rome, Italy, 2014. [Google Scholar]
- Madeira, M.; Monteiro, F. A Base de Referência Para Os Solos Do Mundo e a Classificação Dos Solos de Portugal. Rev. De Cienc. Agrárias 2004, 27, 13–23. [Google Scholar]
- Lopes, R.; Madeira, M.; Arsénio, P. Mapping of Land Units and Land Capability Classification in Portugal. The Case of Lourinhã Municipality. Finisterra 2017, 52, 103–127. [Google Scholar] [CrossRef] [Green Version]
- UNEP. World Atlas of Desertification; The United Nations Environmental Programme: London, UK, 1993. [Google Scholar]
- Ayers, R.S.; Westcot, D.W. Water Quality for Agriculture; FAO Irrigation and Drainage Paper; Food and Agriculture Organization of the United Nations: Rome, Italy, 1985; ISBN 978-92-5-102263-4. [Google Scholar]
- Varennes, A.D. Produtividade Dos Solos e Ambiente; Escolar Editora: Lisboa, Portugal, 2003. [Google Scholar]
- International Organization for Standardization. Soil Quality—Determination of Particle Size Distribution in Mineral. Soil Material—Method by Sieving and Sedimentation (ISO Standard No. 11277:2020); International Organization for Standardization: London, UK, 2020; p. 16. [Google Scholar]
- Hersbach, H.; Dee, D. ERA5 Reanalysis Is in Production. In ECMWF Newsletter; European Centre for Medium-Range Weather Forecasts: Reading, UK, 2016; 147p. [Google Scholar]
- SROA/CNROA/IEADR Cartas de Solos e Capacidade de Uso (1:25000); Direção Geral de Agricultura e Desenvolvimento Rural: Lisbon, Portugal, 1960.
- DGT Carta de Uso e Ocupação Do Solo (COS2018); Direção Geral do Território: Lisbon, Portugal, 2018.
- EDIA Crop Occupation 2018; Empresa de Desenvolvimento e Infraestruturas de Alqueva: Beja, Portugal, 2018.
- APHA. Standard Methods for the Examination of Water and Wastewater, 20th ed.; American Public Health Association, American Water Works Association and Water Environmental Federation: Washington, DC, USA, 1998. [Google Scholar]
- Eckelmann, W.; Baritz, R.; Bialousz, S.; Bielek, P.; Carre, F.; Houskova, B.; Jones, R.J.A.; Kibblewhite, M.; Kozak, J.; le Bas, C.; et al. Common Criteria for Risk Area Identification According to Soil Threats; Office for Official Publications of the European Communities: Luxembourg, 2006. [Google Scholar]
- International Organization for Standardization. Risk Management—Guidelines (ISO Standard No. 31000:2018); International Organization for Standardization: London, UK, 2018; p. 16. [Google Scholar]
- Thompson, R.; Amezketa, E.; Nuñez, M.; Falsone, G.; Toth, T.; Paz, A.; Gonçalves, M.; Castanheira, N.; Gould, I.; Tamvakidis, S. EIP-AGRI Focus Group Soil Salinisation. Measuring, Mapping and Monitoring of Soil Salinity; The European Innovation Partnership: Brussels, Belgium, 2020. [Google Scholar]
- Department of Environment and Resource Management. Salinity Management Handbook, 2nd ed.; Department of Environment and Resource Management: Queensland, Australia, 2011; ISBN 0-7242-7412-X. [Google Scholar]
- Corwin, D.L.; Rhoades, J.D.; Šimůnek, J. Leaching Requirement for Soil Salinity Control: Steady-State versus Transient Models. Agric. Water Manag. 2007, 90, 165–180. [Google Scholar] [CrossRef]
- Wallender, W.W.; Tanji, K.K. Agricultural Salinity Assessment and Management, 2nd ed.; American Society of Civil Engineers: Reston, VA, USA, 2011; ISBN 978-0-7844-1169-8. [Google Scholar]
- Hanson, B.R.; Grattan, S.R.; Fulton, A. Agricultural Salinity and Drainage; Water Management Series publication; University of California Irrigation Program: Davis, CA, USA, 2006. [Google Scholar]
- Qadir, M.; Oster, J.D. Crop and Irrigation Management Strategies for Saline-Sodic Soils and Waters Aimed at Environmentally Sustainable Agriculture. Sci. Total Environ. 2004, 323, 1–19. [Google Scholar] [CrossRef]
- Phogat, V.; Mallants, D.; Cox, J.W.; Šimůnek, J.; Oliver, D.P.; Awad, J. Management of Soil Salinity Associated with Irrigation of Protected Crops. Agric. Water Manag. 2020, 227, 105845. [Google Scholar] [CrossRef]
- Machado, R.; Serralheiro, R. Soil Salinity: Effect on Vegetable Crop Growth. Management Practices to Prevent and Mitigate Soil Salinization. Horticulturae 2017, 3, 30. [Google Scholar] [CrossRef]


| Crop 1 | Monitored Area (ha) | Predominant Soil Types 2 | Irrigation Method | Irrigation Hydrant |
|---|---|---|---|---|
| Alfalfa (Medicago sativa L.) (A) | 27.6 | Calcaric Cambisols; Regosols | Sprinkler | H33 |
| Permanent Pasture (grasses (70%), legumes (18%) and others (12%)) (P) | 21.7 | Calcaric Cambisols; Chromic Luvisols; Regosols | Sprinkler | H22 |
| Grapevine (Vitis vinifera L. Cv. ‘Antão Vaz) (G1) | 4.5 | Chromic Vertisols | Drip | H23 |
| Sunflower (Helianthus annus L.) (S1) | 13.1 | Calcaric Cambisols; Chromic Vertisols | Sprinkler | H23 |
| Olive (Olea europaea L. Cv. ‘Cobrançosa’) (O1) | 8.0 | Chromic Vertisols; Pellic Vertisols | Drip | H21 |
| Sunflower (Helianthus annus L.) (S2) | 15.0 | Pellic Vertisols; Calcaric Vertisols | Sprinkler | H7 |
| Grapevine (Vitis vinifera L. Cv. ‘Aragonez) (G2) | 9.0 | Calcaric Cambisols; Chromic Vertisols | Drip | H5 |
| Maize (Zea mays L.) (M) | 10.3 | Calcaric Cambisols; Chromic Vertisols | Sprinkler | H6 |
| Grapevine (Vitis vinifera L. Cv. ‘Antão Vaz) (G3) | 1.5 | Chromic Luvisols; Calcaric Cambisols | Drip | H16 |
| Olive (Olea europaea L. Cv. ‘Cordovil’) (O2) | 14.0 | Calcaric Cambisols; Chromic Vertisols; Vertic Luvisols | Drip | H16 |
| Crop | Sowing/Beginning of Cycle (dd/mm) | Seasonal Irrigation Water (m3 ha−1) | First Irrigation (dd/mm) | Last Irrigation (dd/mm) | N (kg N ha−1) | P (kg P2O5 ha−1) | K (kg K2O ha−1) | Other Fertilizers (kg ha−1) | Harvest (dd/mm) |
|---|---|---|---|---|---|---|---|---|---|
| A | 26/04 | 4000 | 01/05 | 30/09 | 10 | 10 | - | - | - 1 |
| P | - 2 | 1000 | 15/05 | 15/10 | 43 | - | - | 6 CaO | - |
| G1 | 15/03 | 3960 | 28/06 | 30/10 | 50 | 50 | 56 | - | 31/08 |
| S1 | 18/04 | 2517 | 19/04 | 01/08 | 127 | 34 | - | 16 SO2; 0.2 B | 27/08 |
| O1 | 07/02 3 | 3300 | 01/04 | 30/09 | 83 | 84 | 92 | 0.3 B | 06/12 |
| S2 | 27/04 | 4606 | 28/04 | 26/08 | 109 | 40 | 12 | 16 SO2 | 18/09 |
| G2 | 02/04 | 2600 | 04/06 | 10/09 | 96 | 102 | 179 | 8 Fe; 53 CaO | 24/09 |
| M | 18/07 | 4800 | 18/07 | 04/10 | 202 | 144 | 216 | 27 SO2 | 17/01 4 |
| G3 | 15/03 | 3000 | 15/05 | 15/10 | 66 | 21 | 51 | - | 23/08 |
| O2 | 15/01 3 | 1700 | 15/05 | 23/10 | 69 | 24 | 35 | - | 21/11 |
| Indicator | Rating Score | ||||
|---|---|---|---|---|---|
| 1 | 2 | 3 | 4 | 5 | |
| AI—Aridity Index 1 | ≥0.65 (Humid) | 0.50–0.65 (Dry sub-humid) | 0.20–0.50 (Semi-arid) | 0.05–0.20 (Arid) | <0.05 (Hyper-arid) |
| Sl—Slope (%) | >9 | - | 3–8 | - | 0–2 |
| SD—Soil Drainage class 2 | Good | - | Moderate | - | Restricted |
| ECw (dS m−1) —water Electrical Conductivity | <0.7 (No restriction) | - | 0.7–3.0 (Slight to moderate restriction) | - | >3.0 (Severe restriction) |
| IM—Irrigation Method | Drip | - | - | - | Surface or Sprinkler |
| SAR ˄ ECW (dS m−1) 3—water Sodium Adsorption Ratio and Electrical Conductivity | SAR 0–3 and ECW > 0.7 (No restriction) | - | SAR 0–3 and 0.2 < ECW < 0.7 (Slight to moderate restriction) | - | SAR 0–3 and ECW < 0.2 (Severe restriction) |
Publisher’s Note: MDPI stays neutral with regard to jurisdictional claims in published maps and institutional affiliations. |
© 2021 by the authors. Licensee MDPI, Basel, Switzerland. This article is an open access article distributed under the terms and conditions of the Creative Commons Attribution (CC BY) license (https://creativecommons.org/licenses/by/4.0/).
Share and Cite
Tomaz, A.; Costa, M.J.; Coutinho, J.; Dôres, J.; Catarino, A.; Martins, I.; Mourinha, C.; Guerreiro, I.; Pereira, M.M.; Fabião, M.; et al. Applying Risk Indices to Assess and Manage Soil Salinization and Sodification in Crop Fields within a Mediterranean Hydro-Agricultural Area. Water 2021, 13, 3070. https://doi.org/10.3390/w13213070
Tomaz A, Costa MJ, Coutinho J, Dôres J, Catarino A, Martins I, Mourinha C, Guerreiro I, Pereira MM, Fabião M, et al. Applying Risk Indices to Assess and Manage Soil Salinization and Sodification in Crop Fields within a Mediterranean Hydro-Agricultural Area. Water. 2021; 13(21):3070. https://doi.org/10.3390/w13213070
Chicago/Turabian StyleTomaz, Alexandra, Maria João Costa, João Coutinho, José Dôres, Adriana Catarino, Inês Martins, Clarisse Mourinha, Isabel Guerreiro, Maria Margarida Pereira, Marta Fabião, and et al. 2021. "Applying Risk Indices to Assess and Manage Soil Salinization and Sodification in Crop Fields within a Mediterranean Hydro-Agricultural Area" Water 13, no. 21: 3070. https://doi.org/10.3390/w13213070