
Analysis of the Radiation Fluxes over Complex Surfaces on the Tibetan Plateau
by
 , , and
Chunxiao Wang
1,2,3, 
Yaoming Ma
1,2,3,*,
Binbin Wang
1,2,
Weiqiang Ma
1,2,
Xuelong Chen
1,2 and
Cunbo Han
1,2 1
Land-Atmosphere Interaction and Its Climatic Effects Group, State Key Laboratory of Tibetan Plateau Earth System, Resources and Environment (TPESRE), Institute of Tibetan Plateau Research, Chinese Academy of Sciences, Beijing 100101, China
2
College of Earth and Planetary Sciences, University of Chinese Academy of Sciences, Beijing 100049, China
3
Lanzhou University, Lanzhou 730000, China
*
Author to whom correspondence should be addressed.
Water 2021, 13(21), 3084; https://doi.org/10.3390/w13213084
Submission received: 7 August 2021
/
Revised: 11 October 2021
/
Accepted: 29 October 2021
/
Published: 3 November 2021
(This article belongs to the Special Issue Energy and Water Cycles in the Third Pole)
Abstract
:Analysis of long-term, ground-based observation data on the Tibetan Plateau help to enhance our understanding of land-atmosphere interactions and their influence on weather and climate in this region. In this paper, the daily, monthly, and annual averages of radiative fluxes, surface albedo, surface temperature, and air temperature were calculated for the period of 2006 to 2019 at six research stations on the Tibetan Plateau. The surface energy balance characteristics of these six stations, which include alpine meadow, alpine desert, and alpine steppe, were then compared. The downward shortwave radiation at stations BJ, QOMS, and NAMORS was found to decrease during the study period, due to increasing cloudiness. Meanwhile, the upward shortwave radiation and surface albedo at all stations were found to have decreased overall. Downward longwave radiation, upward longwave radiation, net radiation, surface temperature, and air temperature showed increasing trends on inter-annual time scales at most stations. Downward shortwave radiation was maximum in spring at BJ, QOMS, NADORS, and NAMORS, due to the influence of the summer monsoon. Upward shortwave radiation peaked in October and November due to the greater snow cover. BJ, QOMS, NADORS, and NAMORS showed strong sensible heat fluxes in the spring while MAWORS showed strong sensible heat fluxes in the summer. The monthly and diurnal variations of surface albedo at each station were “U” shaped. The diurnal variability of downward longwave radiation at each station was small, ranging from 220 to 295 W·m−2.The diurnal variation in surface temperature at each station slightly lagged behind changes in downward shortwave radiation, and the air temperature, in turn, slightly lagged behind the surface temperature.
1. Introduction
With a mean elevation over 4000 m, the Tibetan Plateau is considered as ‘the roof of the world’ or ‘third pole’ and has the world’s most complex mountain topography [1]. The high and undulating endorheic hinterland of the Tibetan Plateau is surrounded by a chain of steeply descending marginal mountains, including the eight highest peaks of the world, including Mount Everest, in the south [2]. This extensive plateau lies between 26°00′ N and 39°47′ N, 73°19′ E, and 104°47′ E [3]. The complex and high-elevation topography, and the solar radiation absorbed by the ground in summer, lead to significant land-atmosphere interactions across the Tibetan Plateau. Consequently, the region’s energy and water circulation processes have important effects on the Asian monsoon, the East Asian general circulation, and global climate change [4,5,6].
Solar radiation is the basic energy source driving a diversity of physical processes in the atmosphere, and it is also an important meteorological element characterizing the thermal condition of the Tibetan Plateau. At the same time, the free atmosphere is subject to various thermal as well as dynamic effects, which propagate from the plateau surface, through the near-earth layer and into the boundary layer [7,8,9]. Therefore, the study of the various radiation fluxes that affect the development of the boundary layer is particularly important. The ground gains heat due to the absorption of downward shortwave radiation and downward longwave radiation emitted by the atmosphere. The ground can also lose heat via the emission of upward longwave radiation and reflection of incoming shortwave radiation. In the absence of other modes of heat exchange, the net radiation determines the change in surface temperature. Surface temperature is an indicator that characterizes the variability of heat sources [10] and is an important parameter that describes the material exchange and energy balance between the surface and the atmosphere. Moreover, the air temperature is directly influenced by the surface temperature, as the surface emits upward longwave radiation to heat the near-surface air. Changes in air temperature can thus reflect the influence of the surface on the near-surface layer of the plateau.
The vast area, complex subsurface type, high altitude, and uneven distribution of a small number of observation stations on the Tibetan Plateau limit our understanding of land-atmosphere interactions in this region. Many studies in the past were based either on satellite data and reanalysis data or on short time series of observations. Moreover, many studies focused on the analysis of solar radiation or net radiation and did not analyze the radiation components. There is a lack of detailed analysis of long-term observation data over complex surfaces in highland areas.
Ma et al. [11,12] first analyzed the pre-monsoon, mid-monsoon, and post-monsoon radiation characteristics of the Nagqu region using the radiometric observations of GAME/Tibet during the 1998 Intensification Observation Period (IOP), and then compared the observations with the results obtained from remote sensing parameterization.
Philipona et al. [13] showed profiles of solar and terrestrial radiation measured with balloon-borne radiometers. They revealed the solar absorption in the free atmosphere and strong reflection in clouds and albedo effects on the ground and the atmosphere above. They also revealed that the longwave upward radiation is partly absorbed and reemitted by water vapor and other greenhouse gases. Obregón et al. [14] used the satellite data during the period 2000–2018. They found that water vapor and aerosols reduce solar radiation reaching the surface. This reduction ranges between 2% and 8% for aerosol optical thickness, 11.5% and 15% for precipitable water vapor, and 14% and 20% for the combined effect. Wang et al. [15] also pointed out that aerosols and total clouds attenuate surface solar radiation using the second Modern-Era Retrospective Analysis for Research and Applications (MERRA-2) reanalysis product. Jandaghian et al. [16] used the online Weather Research and Forecasting model coupled with Chemistry (WRF-Chem) to simulate the effects of albedo enhancement on aerosol, radiation, and cloud interactions in the Greater Montreal Area during the 2011 heatwave period. They found that albedo enhancement led to a net decrease in radiative balance at solar noon by 25 W/m2.
You et al. [17] analyzed the annual and seasonal variations of all-sky and clear-sky surface solar radiation in the eastern and central Tibetan Plateau during the period 1960–2009, based on surface observational data, reanalysis, and ensemble simulations with the global climate model ECHAM5-HAM. They found a decreasing trend in the mean annual all-sky surface solar radiation, at a rate of −1.00 W m−2 decade−1. A stronger decrease of −2.80 W m−2 decade−1 was found in the mean annual clear-sky surface solar radiation series. They also indicated that both NCEP/NCAR and ERA-40 reanalysis do not capture the decadal variations of the all-sky and clear-sky surface solar radiation.
Neither the satellite data nor the reanalysis data accurately reflect the true surface characteristics. Meanwhile, the short time series of observation data cannot accurately capture longer-term trends. Therefore, we need to statistically analyze data on observed surface characteristics over long time periods to more accurately quantify the changes and relationships amongst surface radiation fluxes, surface temperature, and air temperature on the Tibetan Plateau. This is important for understanding land-atmosphere interactions their influence on weather and climate in this region.
2. Materials and Methods
2.1. Study Area
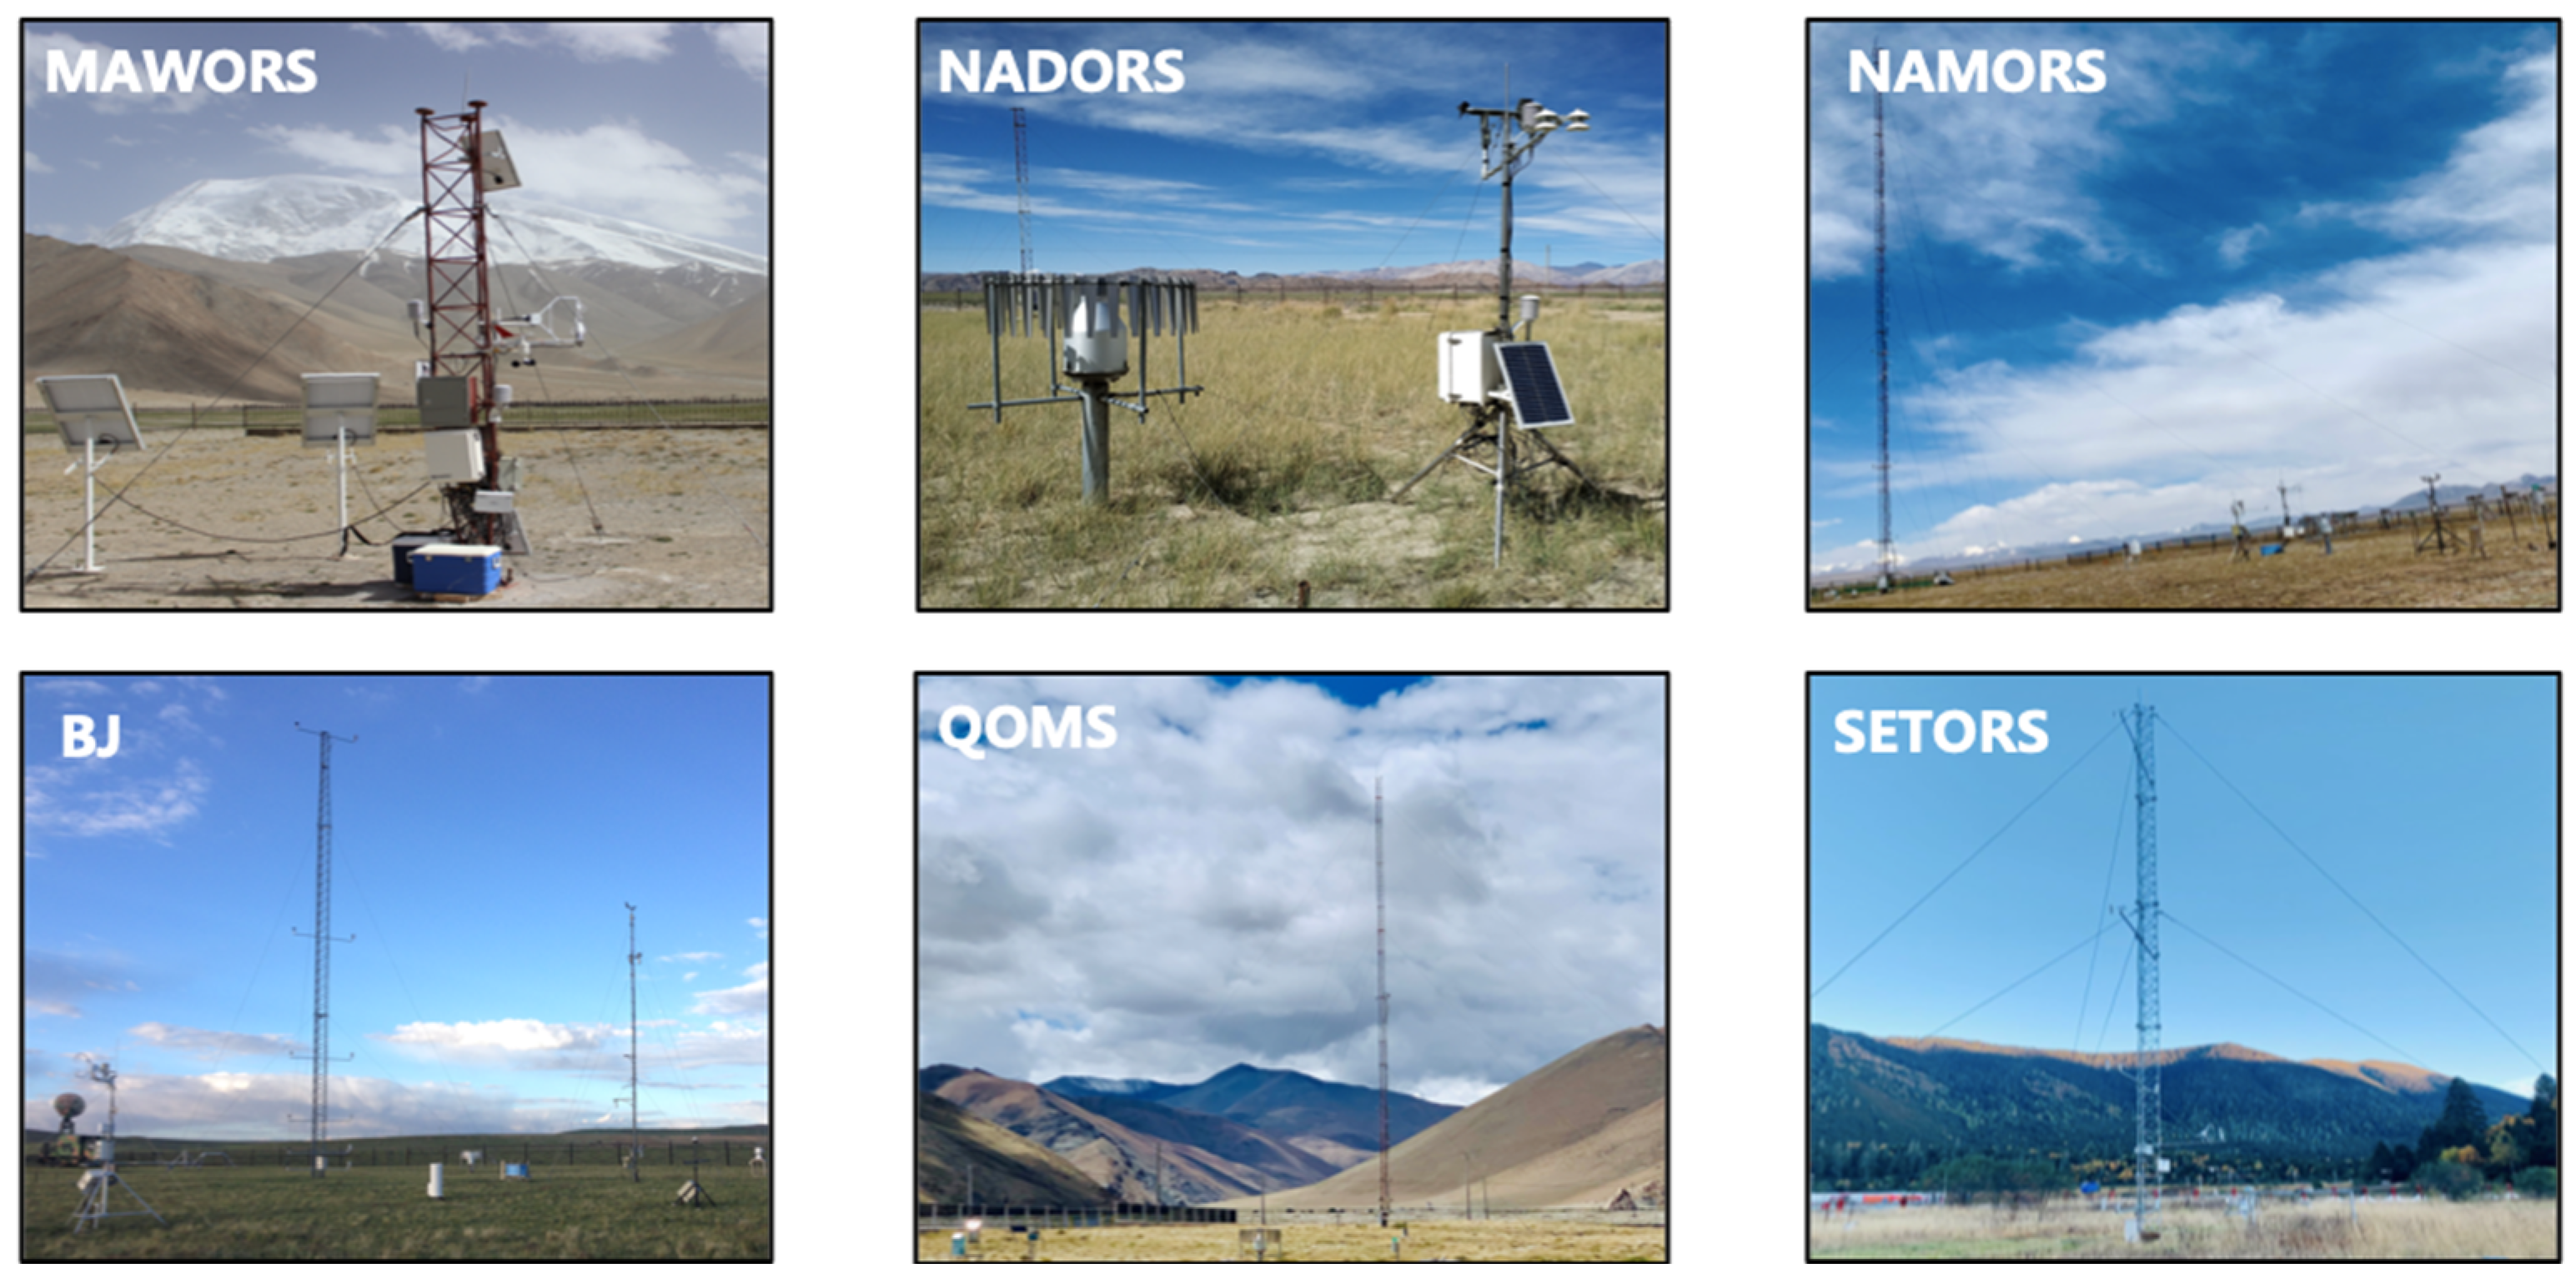
The observation sites used in this paper comprised 6 field stations operated by the Chinese Academy of Science on the Tibetan Plateau, namely, the Qomolangma Atmospheric and Environmental Observation and Research Station (QOMS), the Southeast Tibetan Observation and Research Station for the Alpine Environment (SETORS), the BJ site of Nagqu Station of Plateau Climate and Environment (BJ), the Nam Co Monitoring and Research Station for Multisphere Interaction (NAMORS), the Ngari Desert Observation and Research Station (NADORS), and the Muztagh Ata Westerly Observation and Research Station (MAWORS). The stations were at altitudes in the range 3327 m to 4730 m, and included several surface types (e.g., alpine meadow, alpine desert, and alpine steppe). Figure 1 shows the instrument setup and subsurface conditions at the observation site.
QOMS is located in Tingri County, Tibet, about 40 km from Everest Base Camp. The station is built in a river valley, with relatively flat topography and an open area around it, and the surface is mainly bare ground with sparse and small vegetation [18]. SETORS is located in Linzhi County, Tibet. The station is built in a valley with a relatively flat topography, surrounded by woodland, and the surface type is an alpine meadow with good growth conditions, and the grass height can reach 30–40 cm in summer [18]. BJ is located in Amdo County, Tibet. The station is flat and open all around, the surface is mainly sandy soil with sparse distribution of fine stones, and alpine meadows with a height of 10–20 cm grow unevenly in summer [10]. NAMORS is located on the southeastern shore of Namucuo Lake in Tibet, Dangxiong County, backed by the snowy peaks of the Nyingchi Tanggula mountain range, the lower cushion for alpine meadows [18]. The surface of NADORS and MAWORS are similar, both being desert, gravel and sparse short grass. NADORS is located in Ritu County, Ali Region, Tibet. MAWORS is located in Aktau County, Xinjiang, near Mushtag Mountain and Karakuri Lake, which is a typical westerly climate influence area. Figure 2 shows the Surface emissivity and station distribution in the observation area.
2.2. Data and Methods
The observations used here were collected hourly from 2006 to 2019, and include downward shortwave radiation, upward shortwave radiation, upward longwave radiation, downward longwave radiation, and air temperature. The annual and monthly averages of downward shortwave radiation, upward shortwave radiation, and surface albedo were calculated using observation data from 8:00 to 20:00 Beijing time.
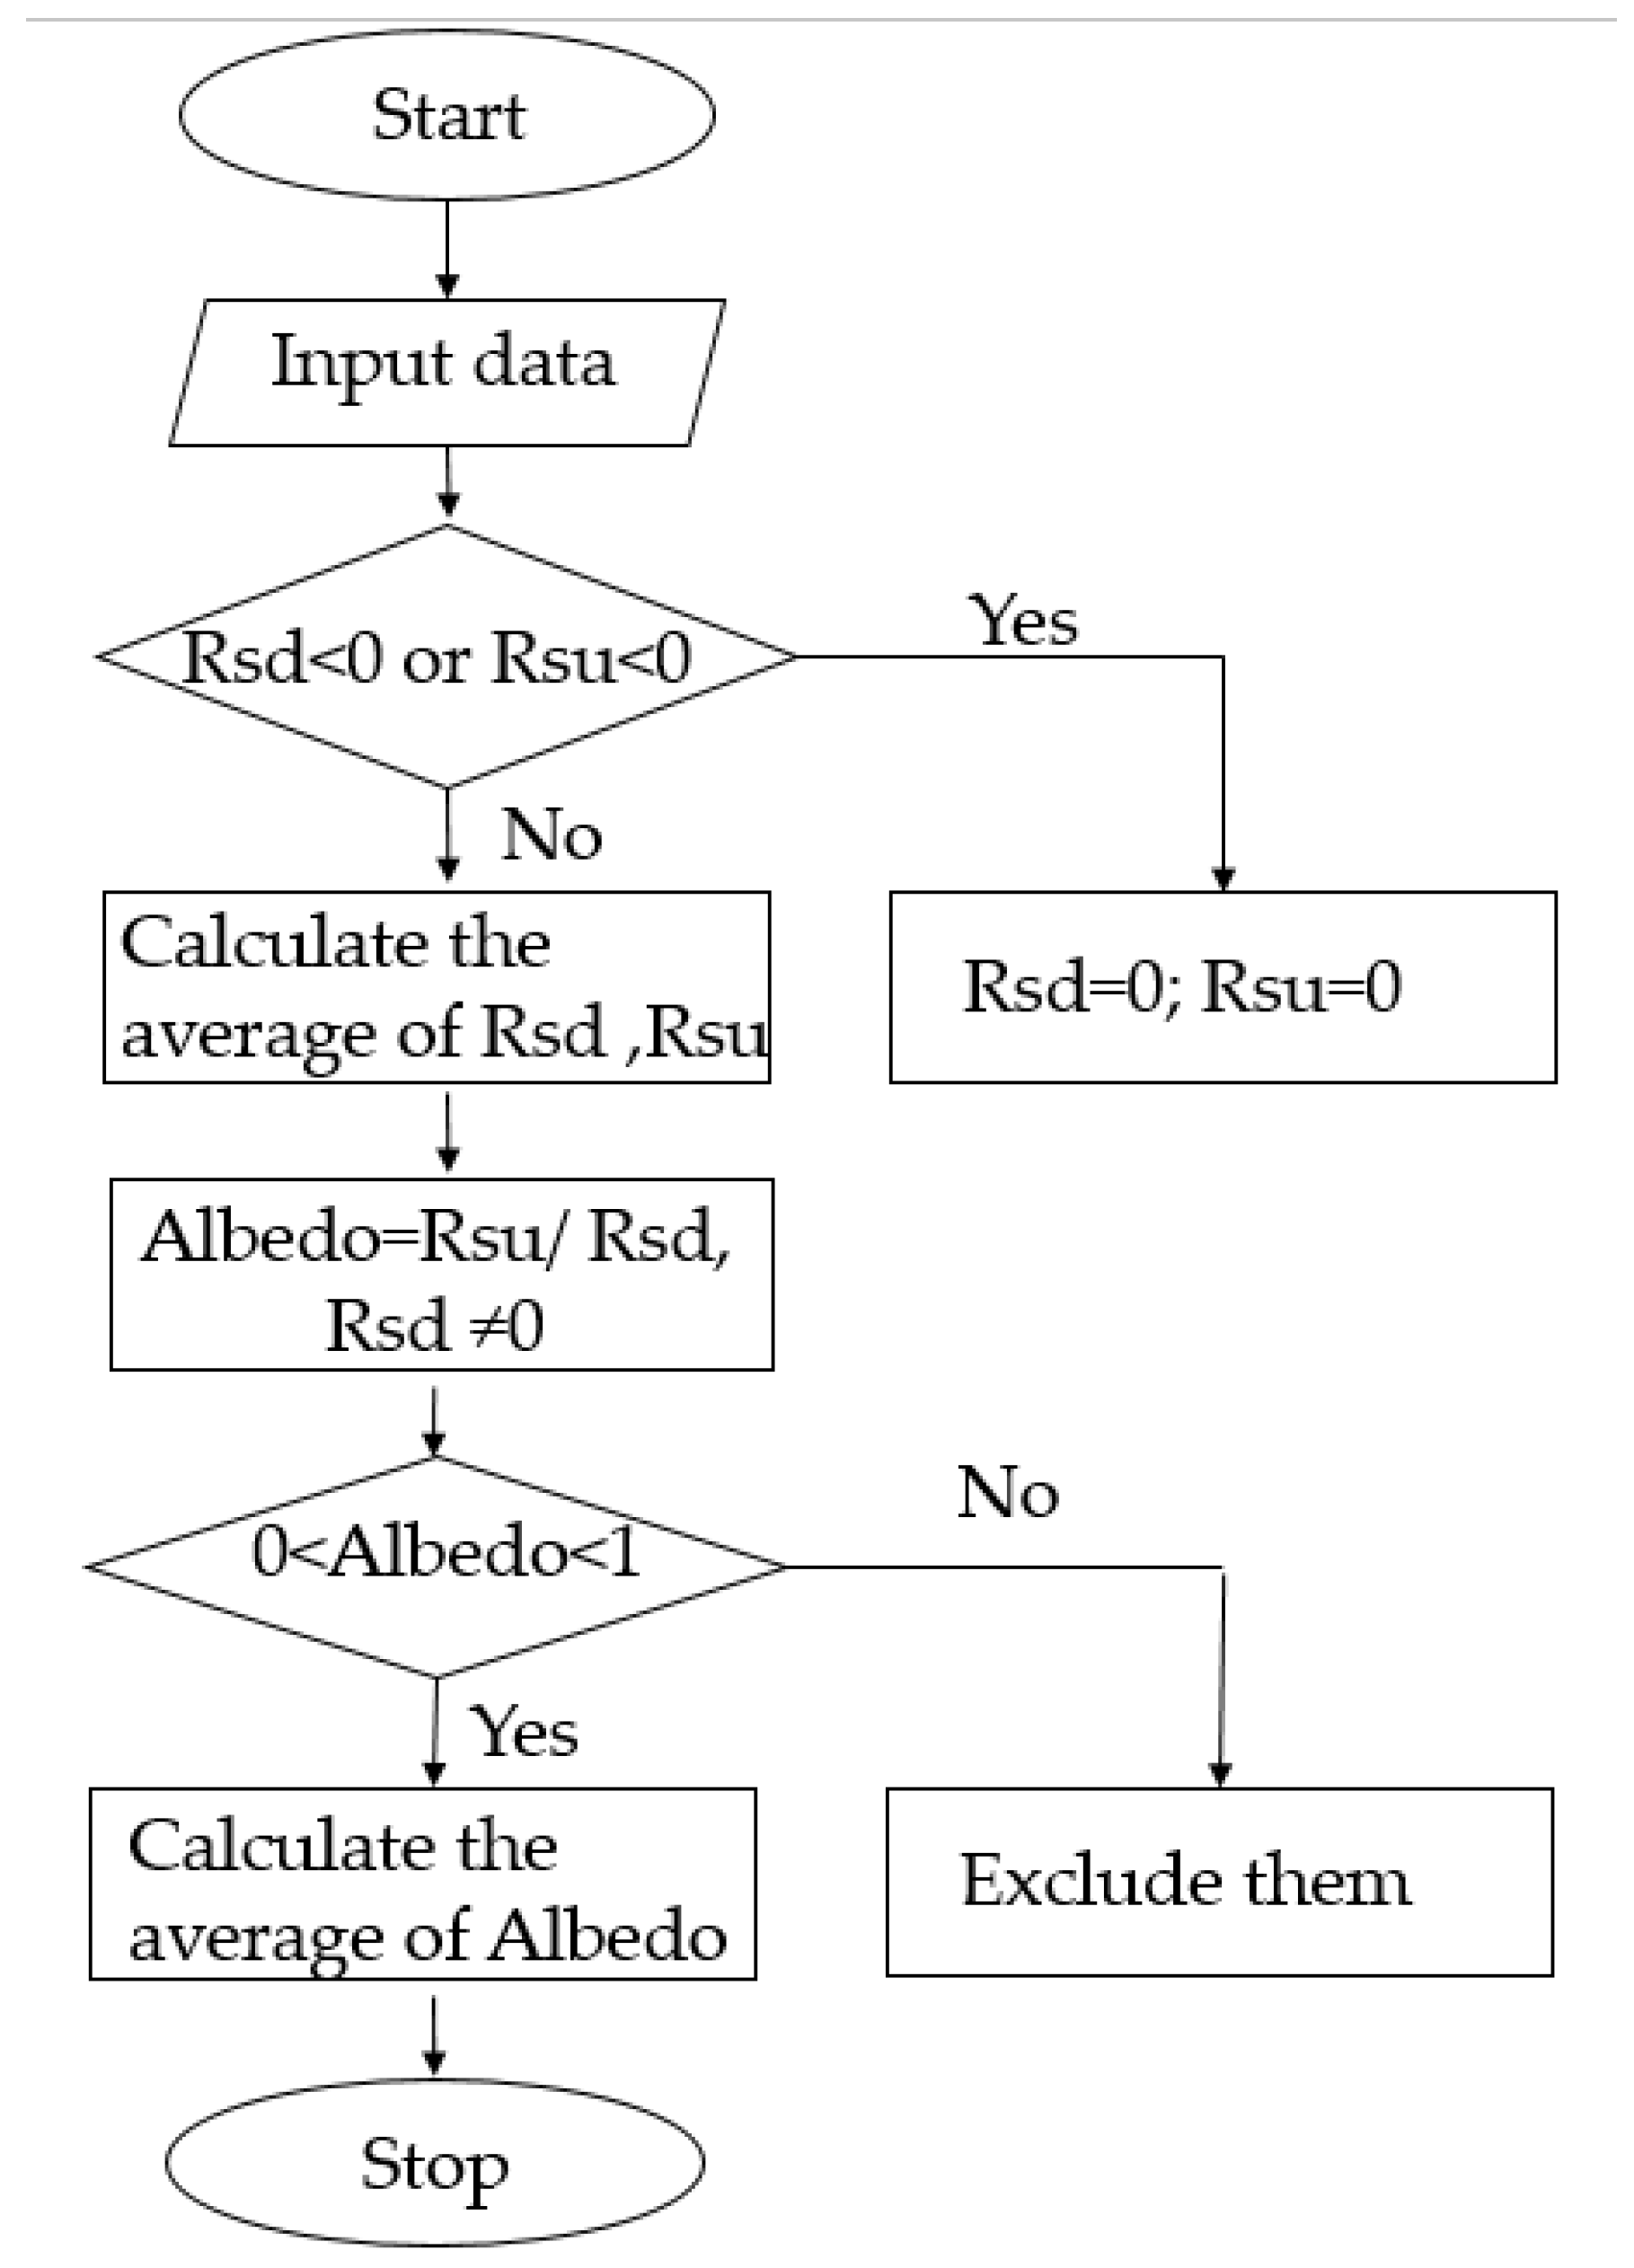
The upward longwave radiation, downward longwave radiation, and air temperature data at SETORS were problematic. The values were greater than the other stations, and the annual variation of upward longwave radiation and the diurnal variation in downward longwave radiation was not consistent with the variations of the rest of the stations, which was caused by the monitoring problem. The above data were rounded off and the calculation of the average value was not performed. Due to instrumental limitations, air temperatures were taken at 1.5 m at NAMORS, QOMS, and NADORS; 1.3 m at SETORS; and 1.9 m at MAWORS. Air temperatures were taken at 1.03 m at BJ from 2006 to 2014, and 1.5 m from 2015 to 2019. Although each radiometer observed the voltage value, the radiation data acquisition system has already calculated the radiation flux value according to the classical methodology and special controlling factor in each station of the Tibetan Plateau. We directly used the output radiation flux value of the observation system in our analysis. If the downward shortwave radiation or upward shortwave radiation value was less than 0, it would be revised to 0. If the surface albedo was greater than 0 and less than 1, it would be further averaged, otherwise, it would be excluded (Figure 3). When annual averages were calculated for each station, if the number of missing measurements in a given year was greater than 40% of the total number of data, the data for that year was rounded off, the annual average was no longer calculated and not represented in the graph. The monthly and daily averages were calculated by simply rounding off the missing measurements. Cloud data were selected from MOD08 product, NDVI data were selected from MOD13C2 product. Pearson’s correlation coefficient r was calculated for the monthly average of cloud cover and the annual average of downward shortwave radiation, and also for the annual average of NDVI and the annual average of upward shortwave radiation. In addition, the observed surface temperatures were limited by instrumental functionality. To calculate accurate surface temperatures for each site, we selected the MOD11C3 product from 2006 to 2019. The MOD11C3 Version 6 product provides monthly Land Surface Temperature and Emissivity values in a 0.05 degree (5600 m at the equator) latitude/longitude Climate Modeling Grid. Each MOD11C3 product consists of LSTs, quality control assessments, observation times, view zenith angles, and the number of clear-sky observations, along with a percentage of land in the grid and emissivities from bands 20, 22, 23, 29, 31, and 32. Here we chose the emissivities from bands 31 and 32.
The wide-band specific emissivity was obtained by linearly fitting the emissivity from bands 31 and 32 following the method proposed by Shunlin Liang [20], as follows:
where is the wide-band emissivity, is the emissivity from band 31, and is the emissivity from band 32.
The total ground surface longwave irradiance includes the longwave radiation emitted from the ground and the downward longwave radiation reflected from the ground surface. The surface temperature can be calculated using the measured upward and downward longwave radiation and the surface emissivity:
where and are the upward longwave radiation and downward longwave radiation, respectively; is the surface emissivity; and is the Stephen Boltzmann constant (5.67 × 10⁻⁸ W·m−2 K−4).
The fundamental equations governing the net energy budget of the Earth system are listed as follows:
where Rsd is the downward shortwave radiation; Rld is the downward longwave radiation; Rsu is the upward shortwave radiation; and Rlu is the upward longwave radiation.
3. Data Analysis and Results
3.1. Downward Shortwave Radiation Flux
The radiation emitted by the sun may be absorbed and scattered by air molecules, water vapor, clouds, and dust in the atmosphere before it reaches the ground. The portion that eventually reaches the ground is called downward shortwave radiation [21], and is determined by both solar altitude angle and atmospheric transparency. The average altitude of the Tibetan Plateau is above 4000 m; here, the atmospheric cleanliness is high, thus the downward shortwave radiation in the Tibetan Plateau region is strong.
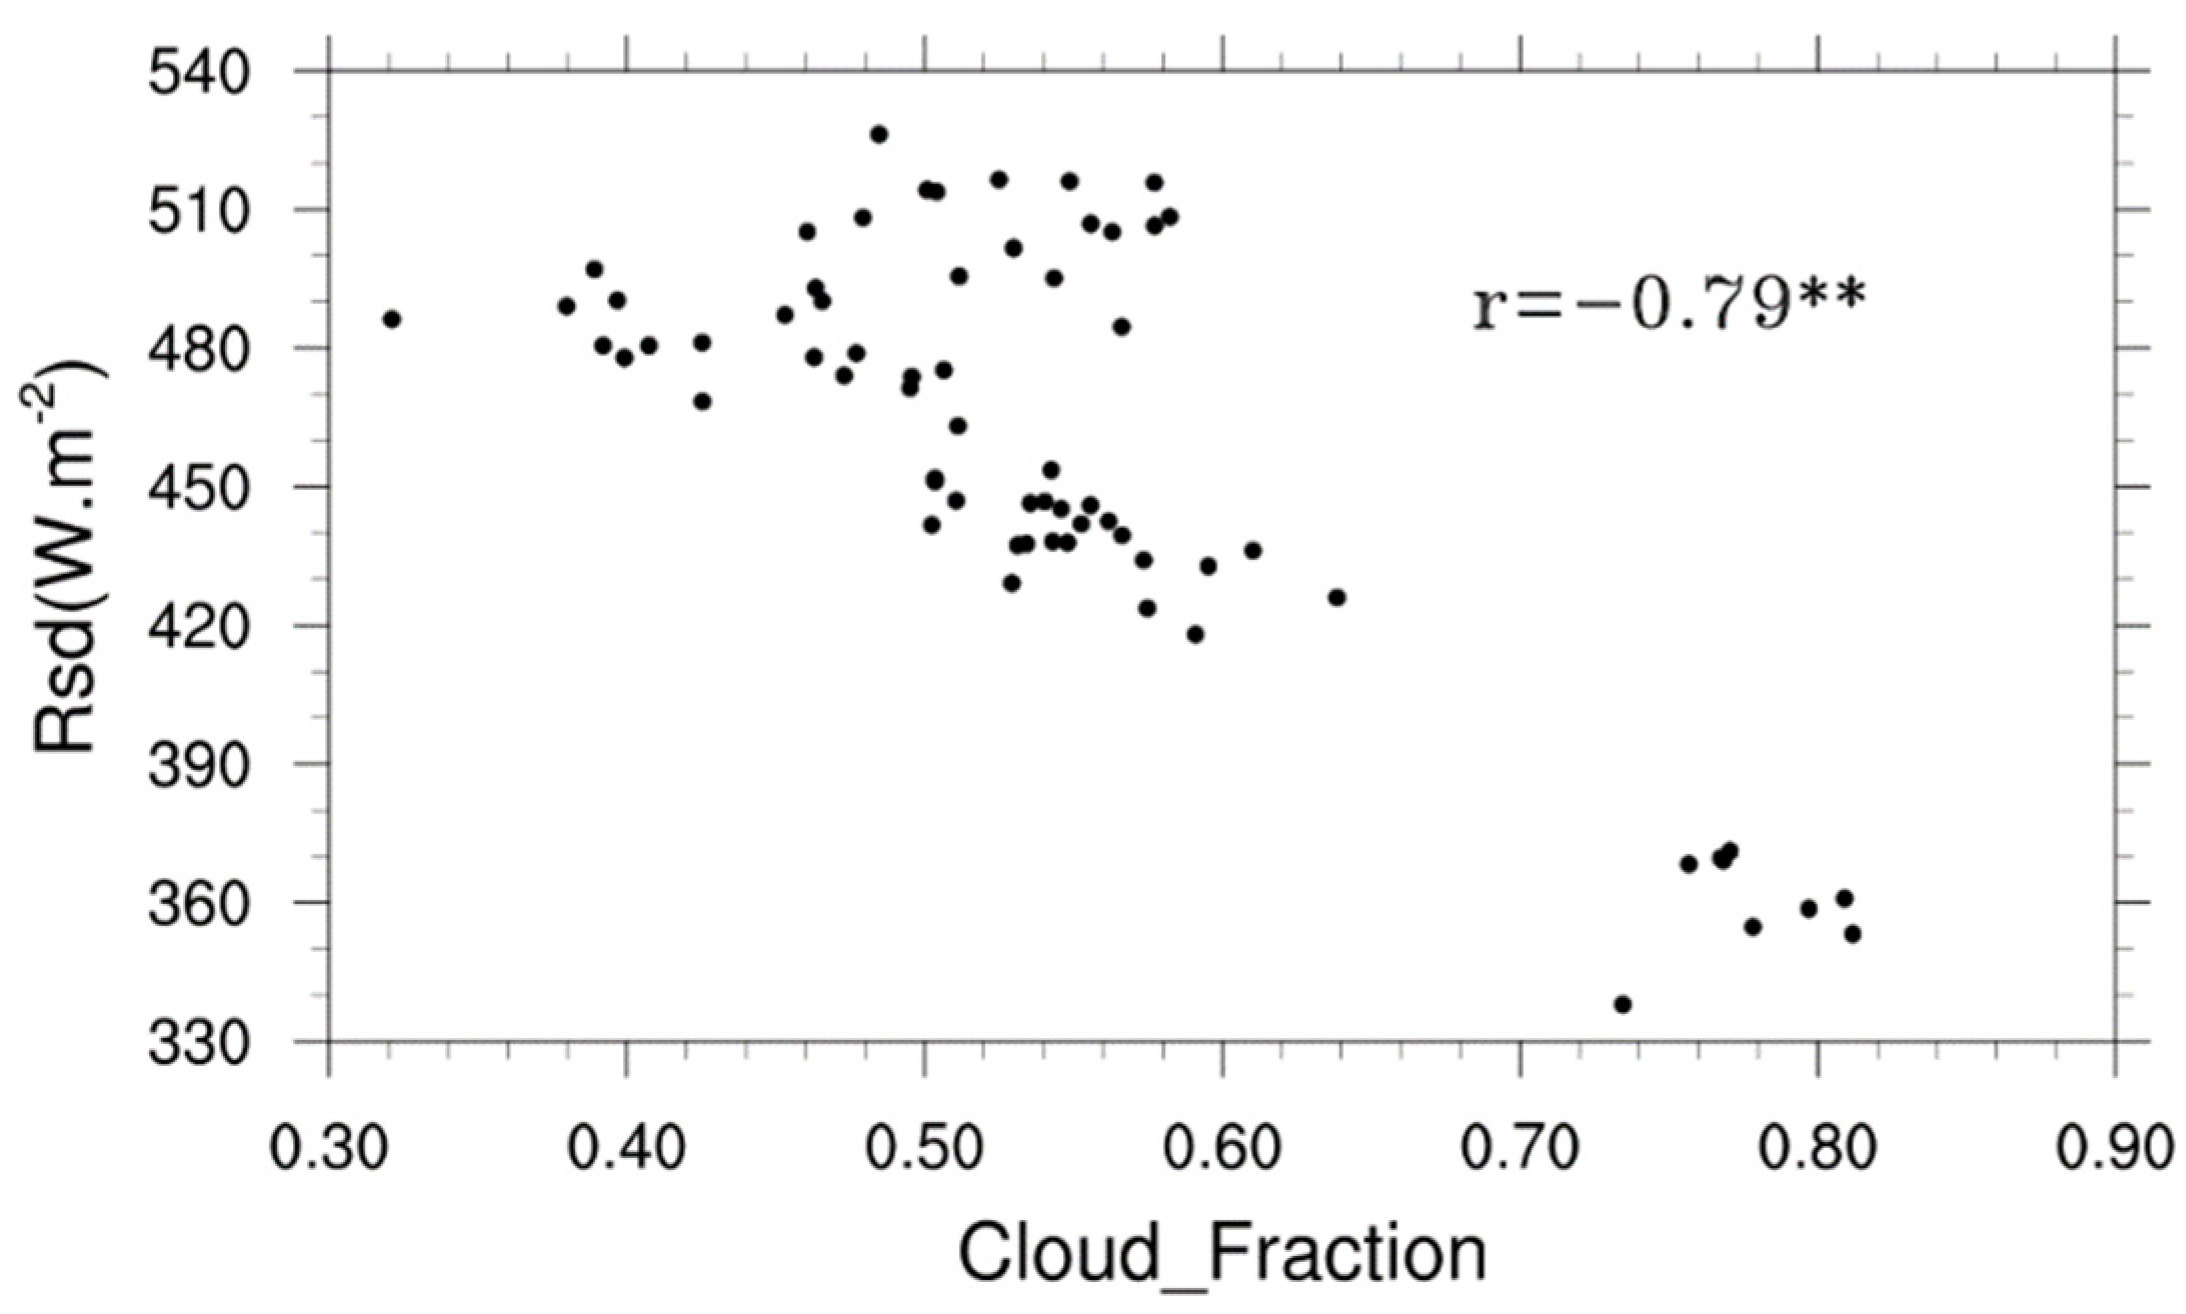
Atmospheric transparency is negatively correlated with cloud cover [22]. The higher the cloud cover is, the lower the atmospheric transparency is. In addition, atmospheric transparency can affect downward shortwave radiation [23]. The downward shortwave radiation reaching the ground decreased with decreasing atmospheric transparency. Therefore, an increase in cloudiness leads to a decrease in downward shortwave radiation to some extent, which can also be reflected in the relationship between the monthly average downward shortwave radiation and cloudiness at each station (Figure 4).
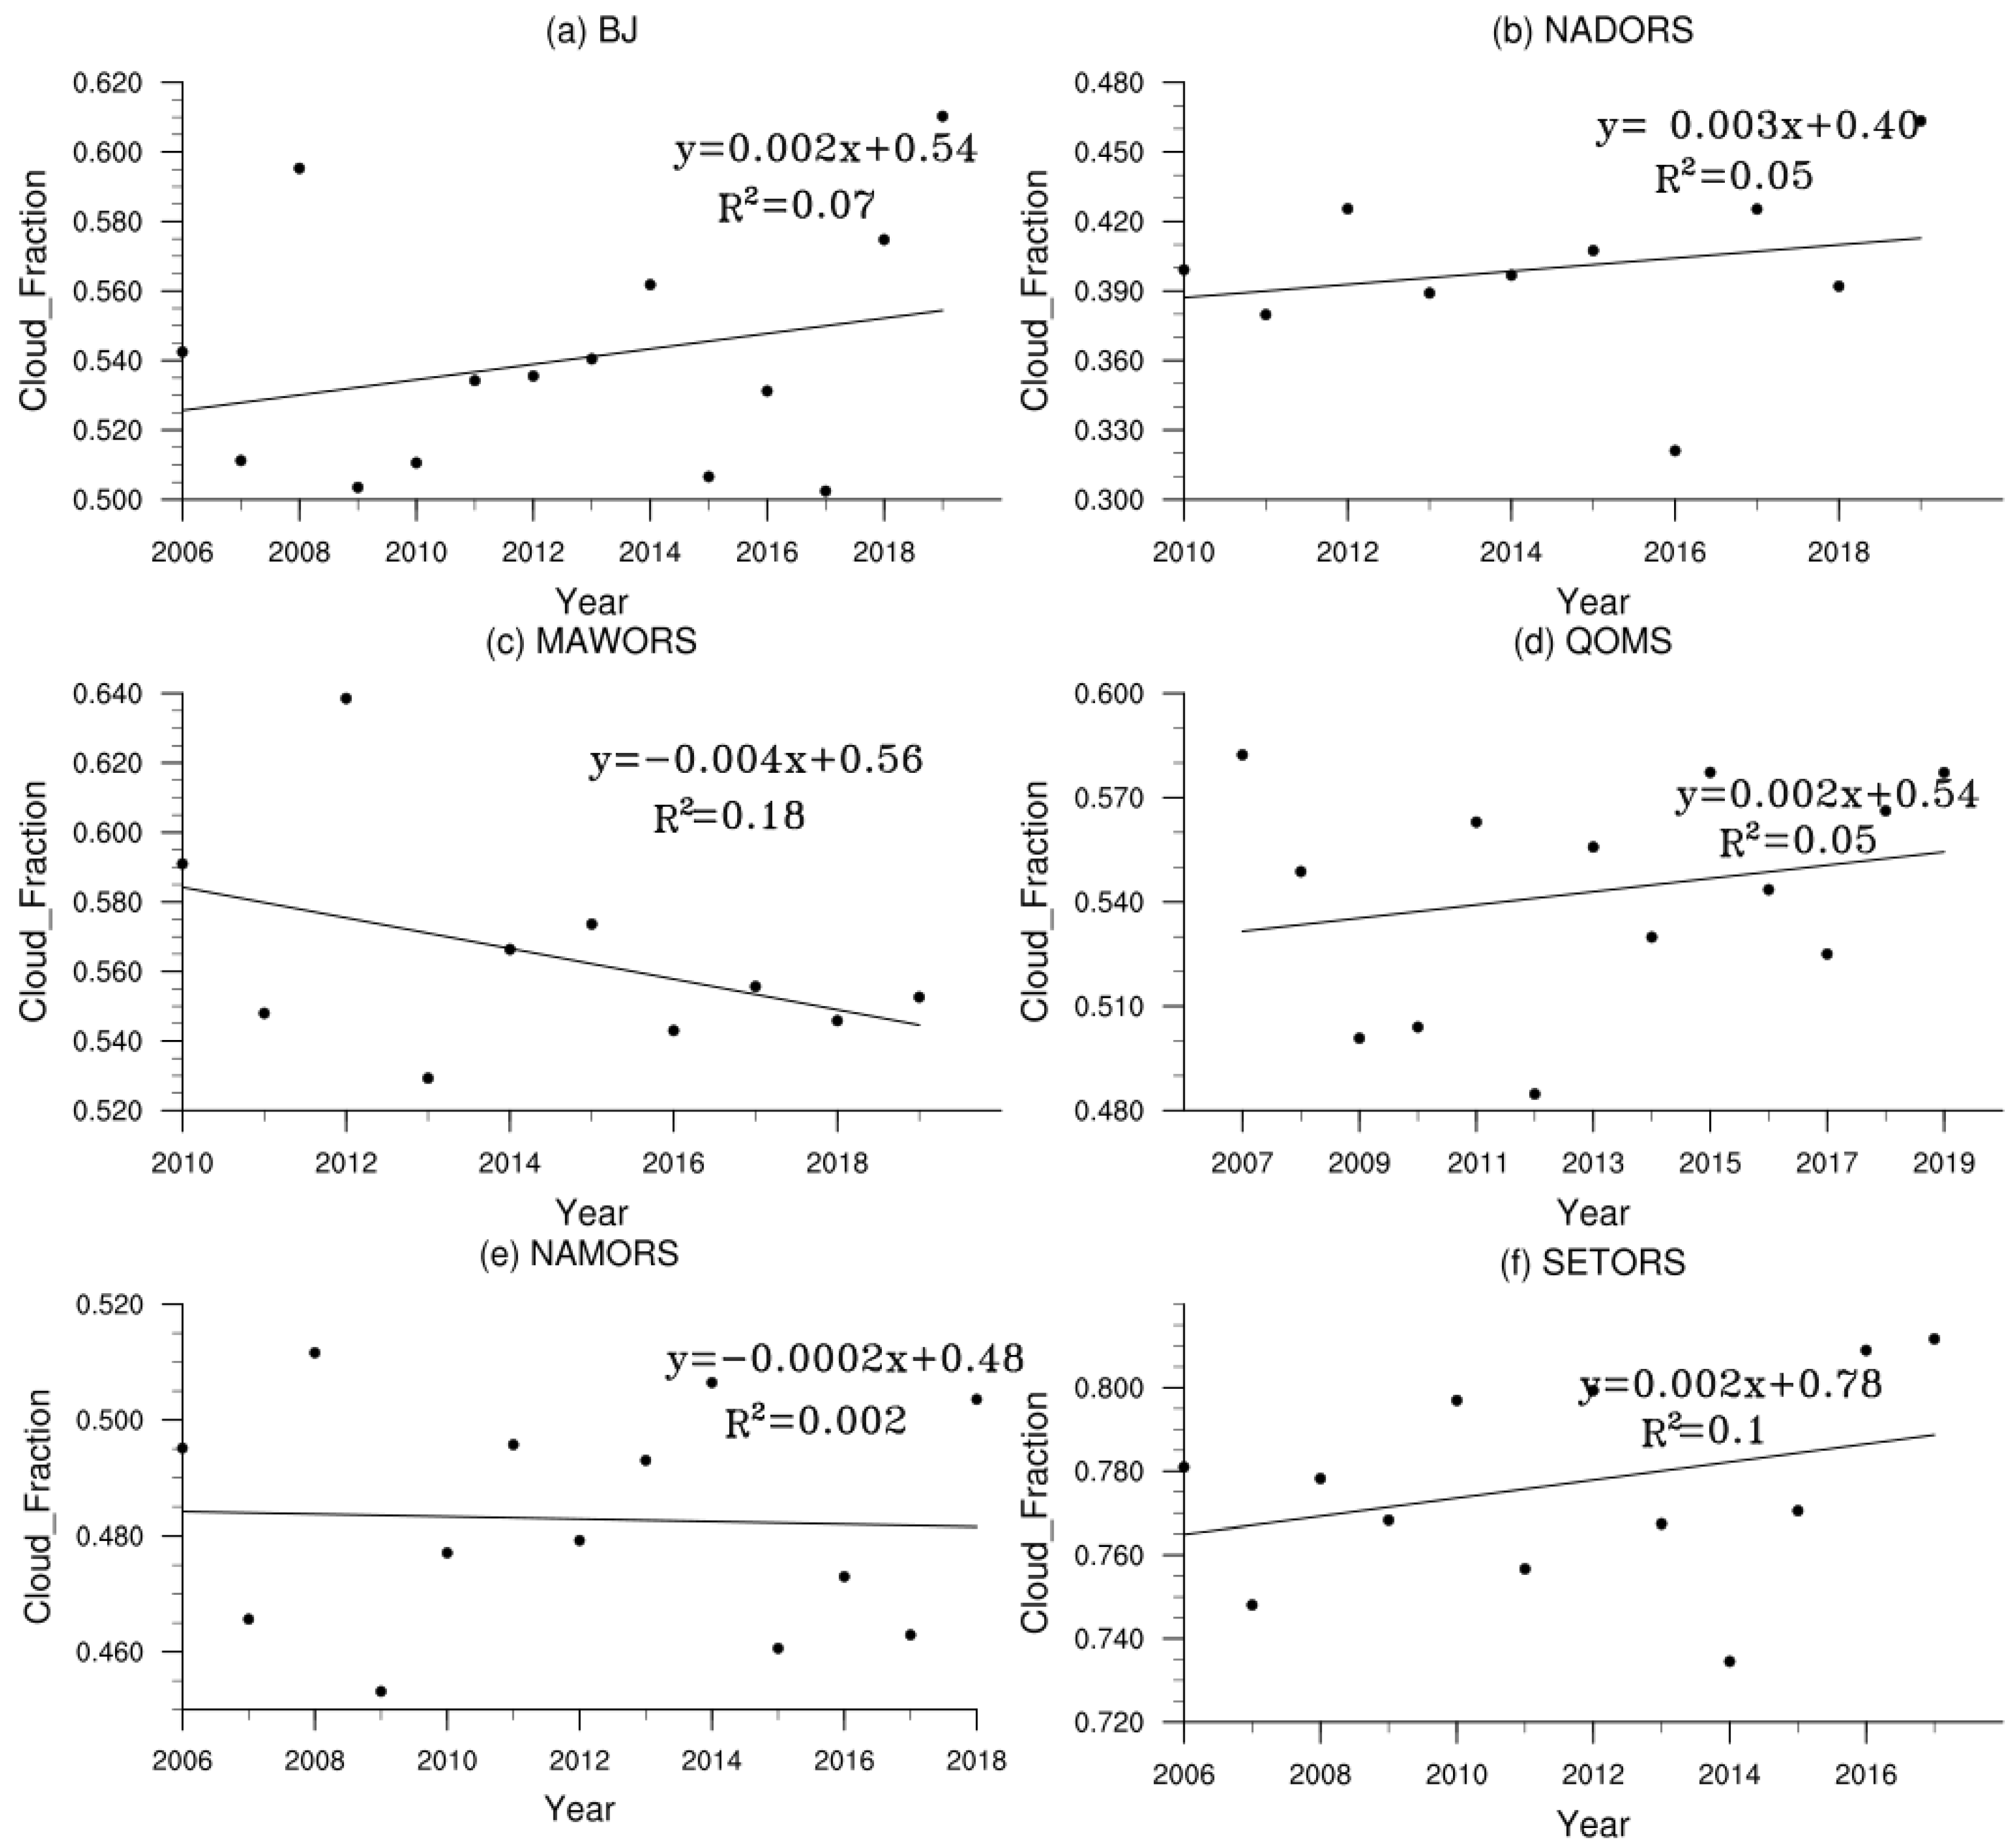
The interannual variability of downward shortwave radiation at each station (Figure 5) shows fluxes between 335 W·m−2 and 525 W·m−2 on the Tibetan Plateau. The downward shortwave radiation at BJ and QOMS had a tendency to decrease year by year, especially at BJ, which decreased by 1.55 W·m−2 per year, as previously attributed to an increase in convective clouds over the plateau [24,25]. However, there was an increasing trend in downward shortwave radiation at MAWORS, which may have been caused by decreasing cloud over MAWORS (Figure 6). The cloud cover at NADORS and SETORS showed an increasing trend, while the downward shortwave radiation at NADORS and SETORS showed no obvious change trend. In addition, the downward shortwave radiation at NAMORS decreased, and the cloud cover fluctuated. This may be due to changes in the atmosphere, such as water vapor and aerosols. However, the overall cloud cover at each station was negatively correlated with downward shortwave radiation can still be seen from Figure 4, and the Pearson correlation coefficient reached −0.79 and passed the 99% significance test.
The intra-annual variations of downward shortwave radiation at each station (Figure 7a) showed a gradual increase with increasing solar altitude angle, starting from January. However, the downward shortwave radiation at BJ, QOMS, NAMORS, and NADORS did not reach their maximum in summer when the solar altitude angle was at its maximum, but in spring (when it reached a maximum of 620 W·m−2). Spring represents the early stage of the monsoon outbreak, characterized by low soil humidity, low cloudiness, and strong downward shortwave radiation. In summer, the monsoon is in its outbreak period: precipitation increases, the water vapor content increases, the air becomes more humid, and there is a corresponding decrease in atmospheric transparency, which results in less downward shortwave radiation reaching the ground. The downward shortwave radiation fluctuated between 450 W·m−2 and 550 W·m−2 at each station. In autumn and winter, the downward shortwave radiation decreased with the decreasing solar altitude angle. The annual variation of downward shortwave radiation at QOMS was obvious. The difference between the downward shortwave radiation in spring and summer reached 200 W·m−2. The annual variation of downward shortwave radiation at SETORS fluctuated relatively weakly, between 300 W·m−2 and 400 W·m−2. MAWORS is located in the northwestern part of the Tibetan Plateau, far inland, and is almost unaffected by the summer monsoon. At that site the downward shortwave radiation reached its maximum in July.
The diurnal variation in downward shortwave radiation at each station (Figure 7b) shows similar patterns at all stations. From 8:00, the downward shortwave radiation increased above zero, reaching a maximum of 900 W·m−2 at around 14:00, and returned to negative values at around 21:00. QOMS had the largest diurnal range of downward shortwave radiation (0 to 950 W·m−2). SETORS had the smallest diurnal range (0 to 700 W·m−2).
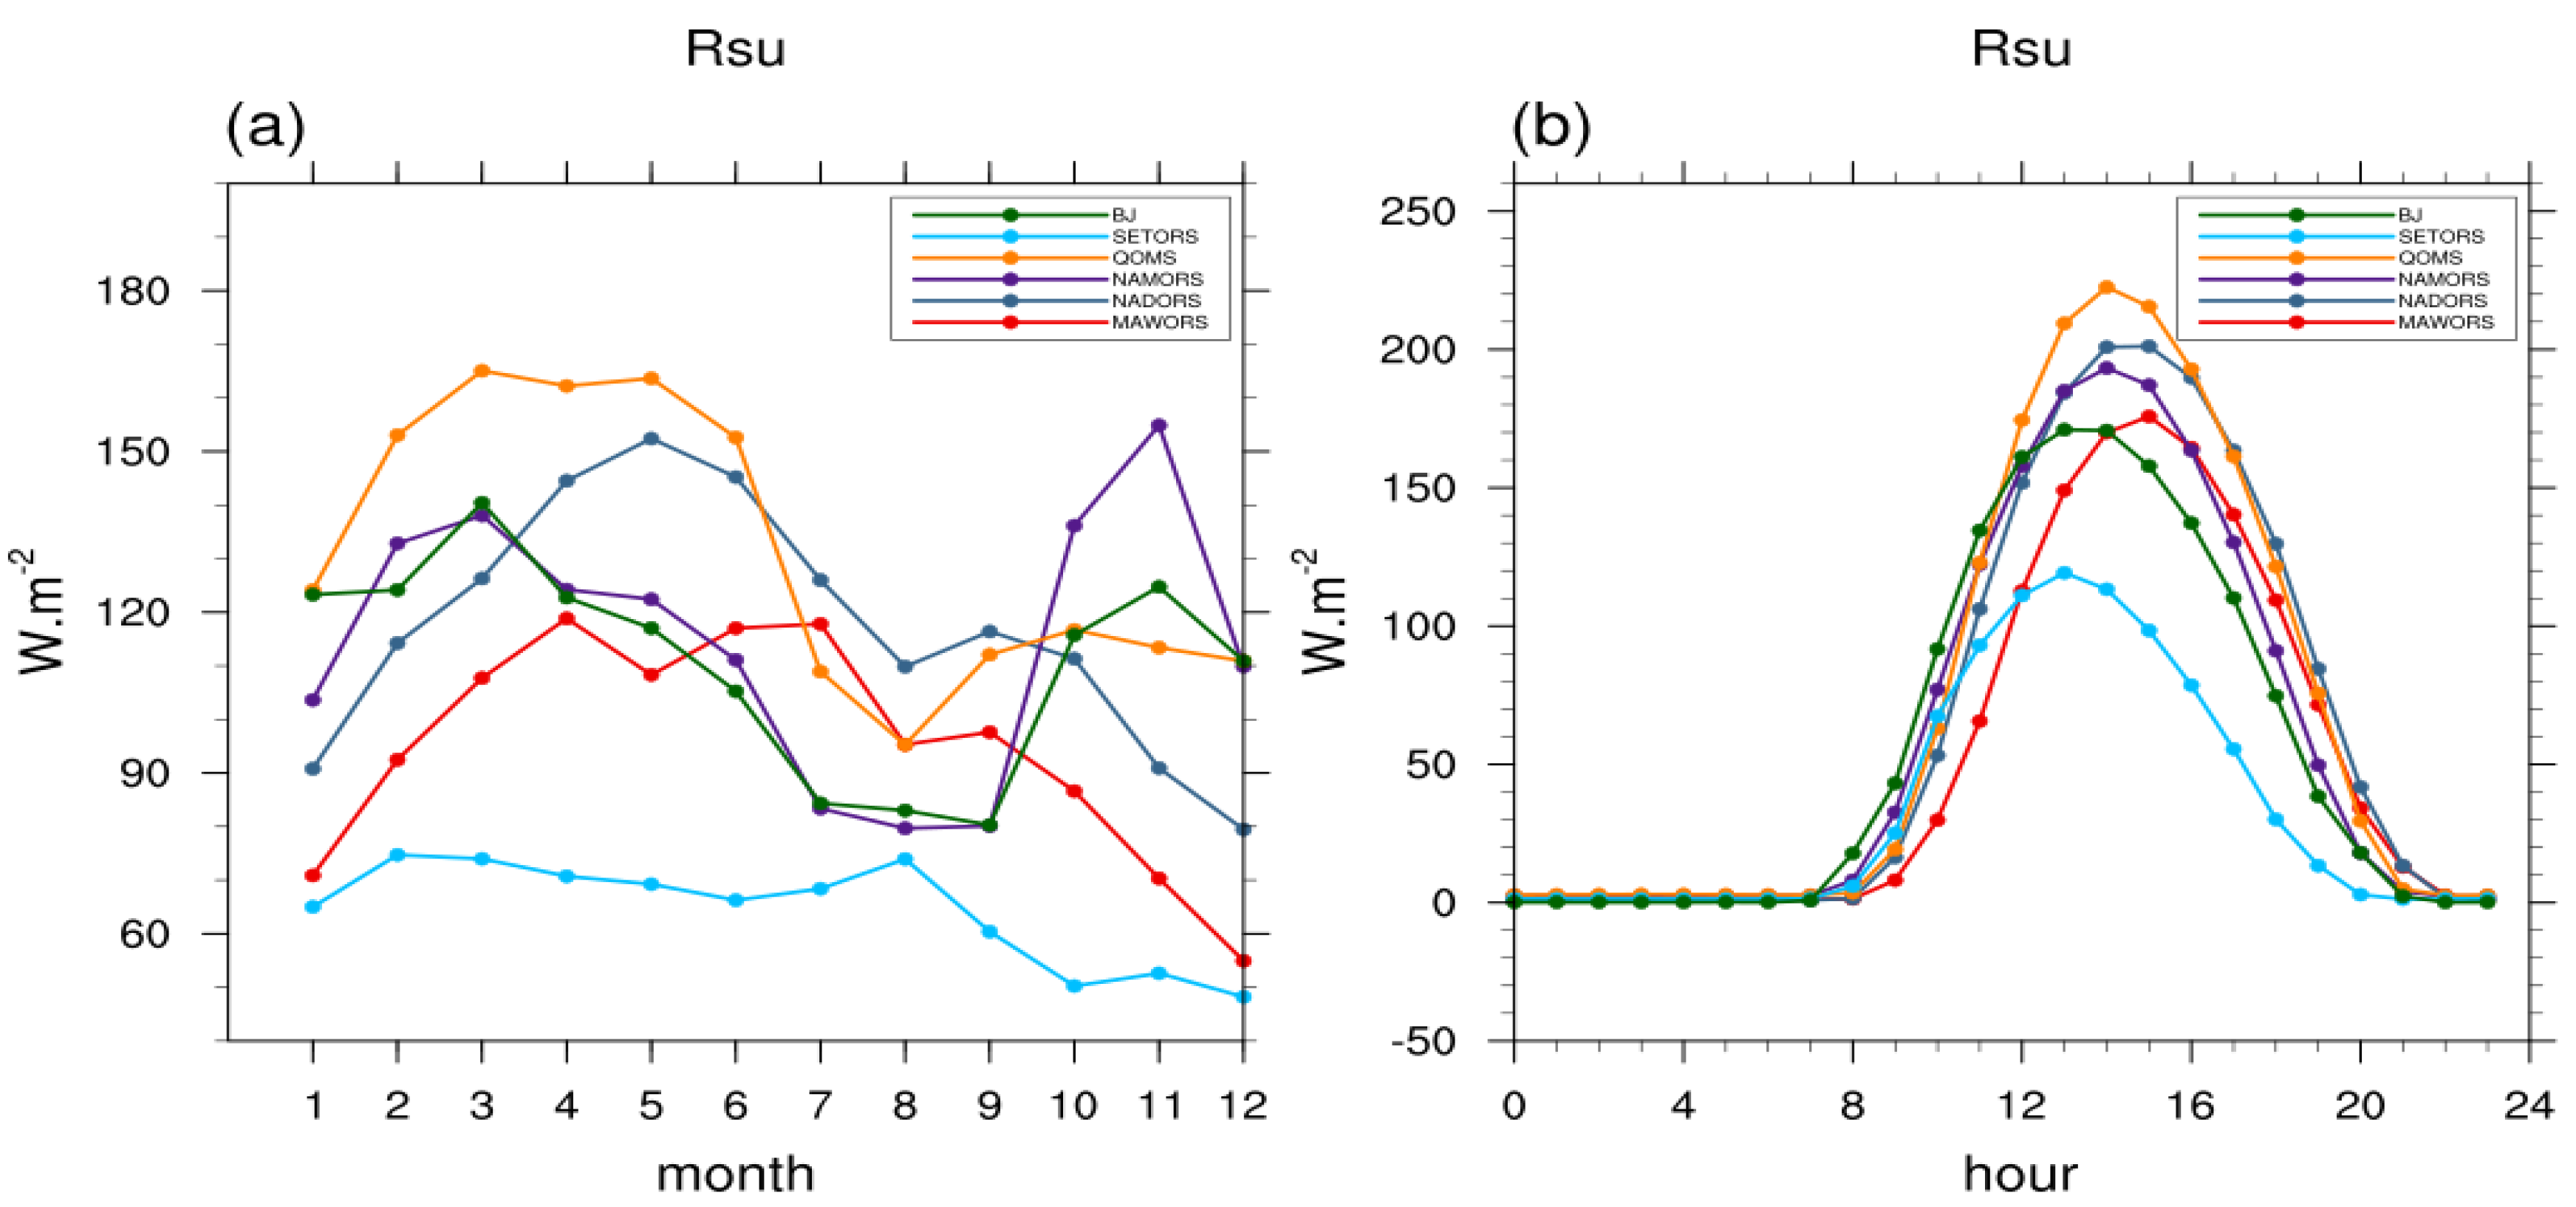
3.2. Upward Shortwave Radiation Flux
Upward shortwave radiation comes from the reflection of downward shortwave radiation from the surface. Therefore, it is mainly controlled by the downward shortwave radiation and the surface conditions. Diurnal variations in upward shortwave radiation (Figure 8b) were similar to those of downward shortwave radiation: upward shortwave radiation increased with increasing solar altitude angle, to a maximum between 13:00 and 15:00, before decreasing again. The greatest diurnal range was at QOMS (0 to 230 W·m−2), and the smallest was at SETORS (0 to 130 W·m−2).
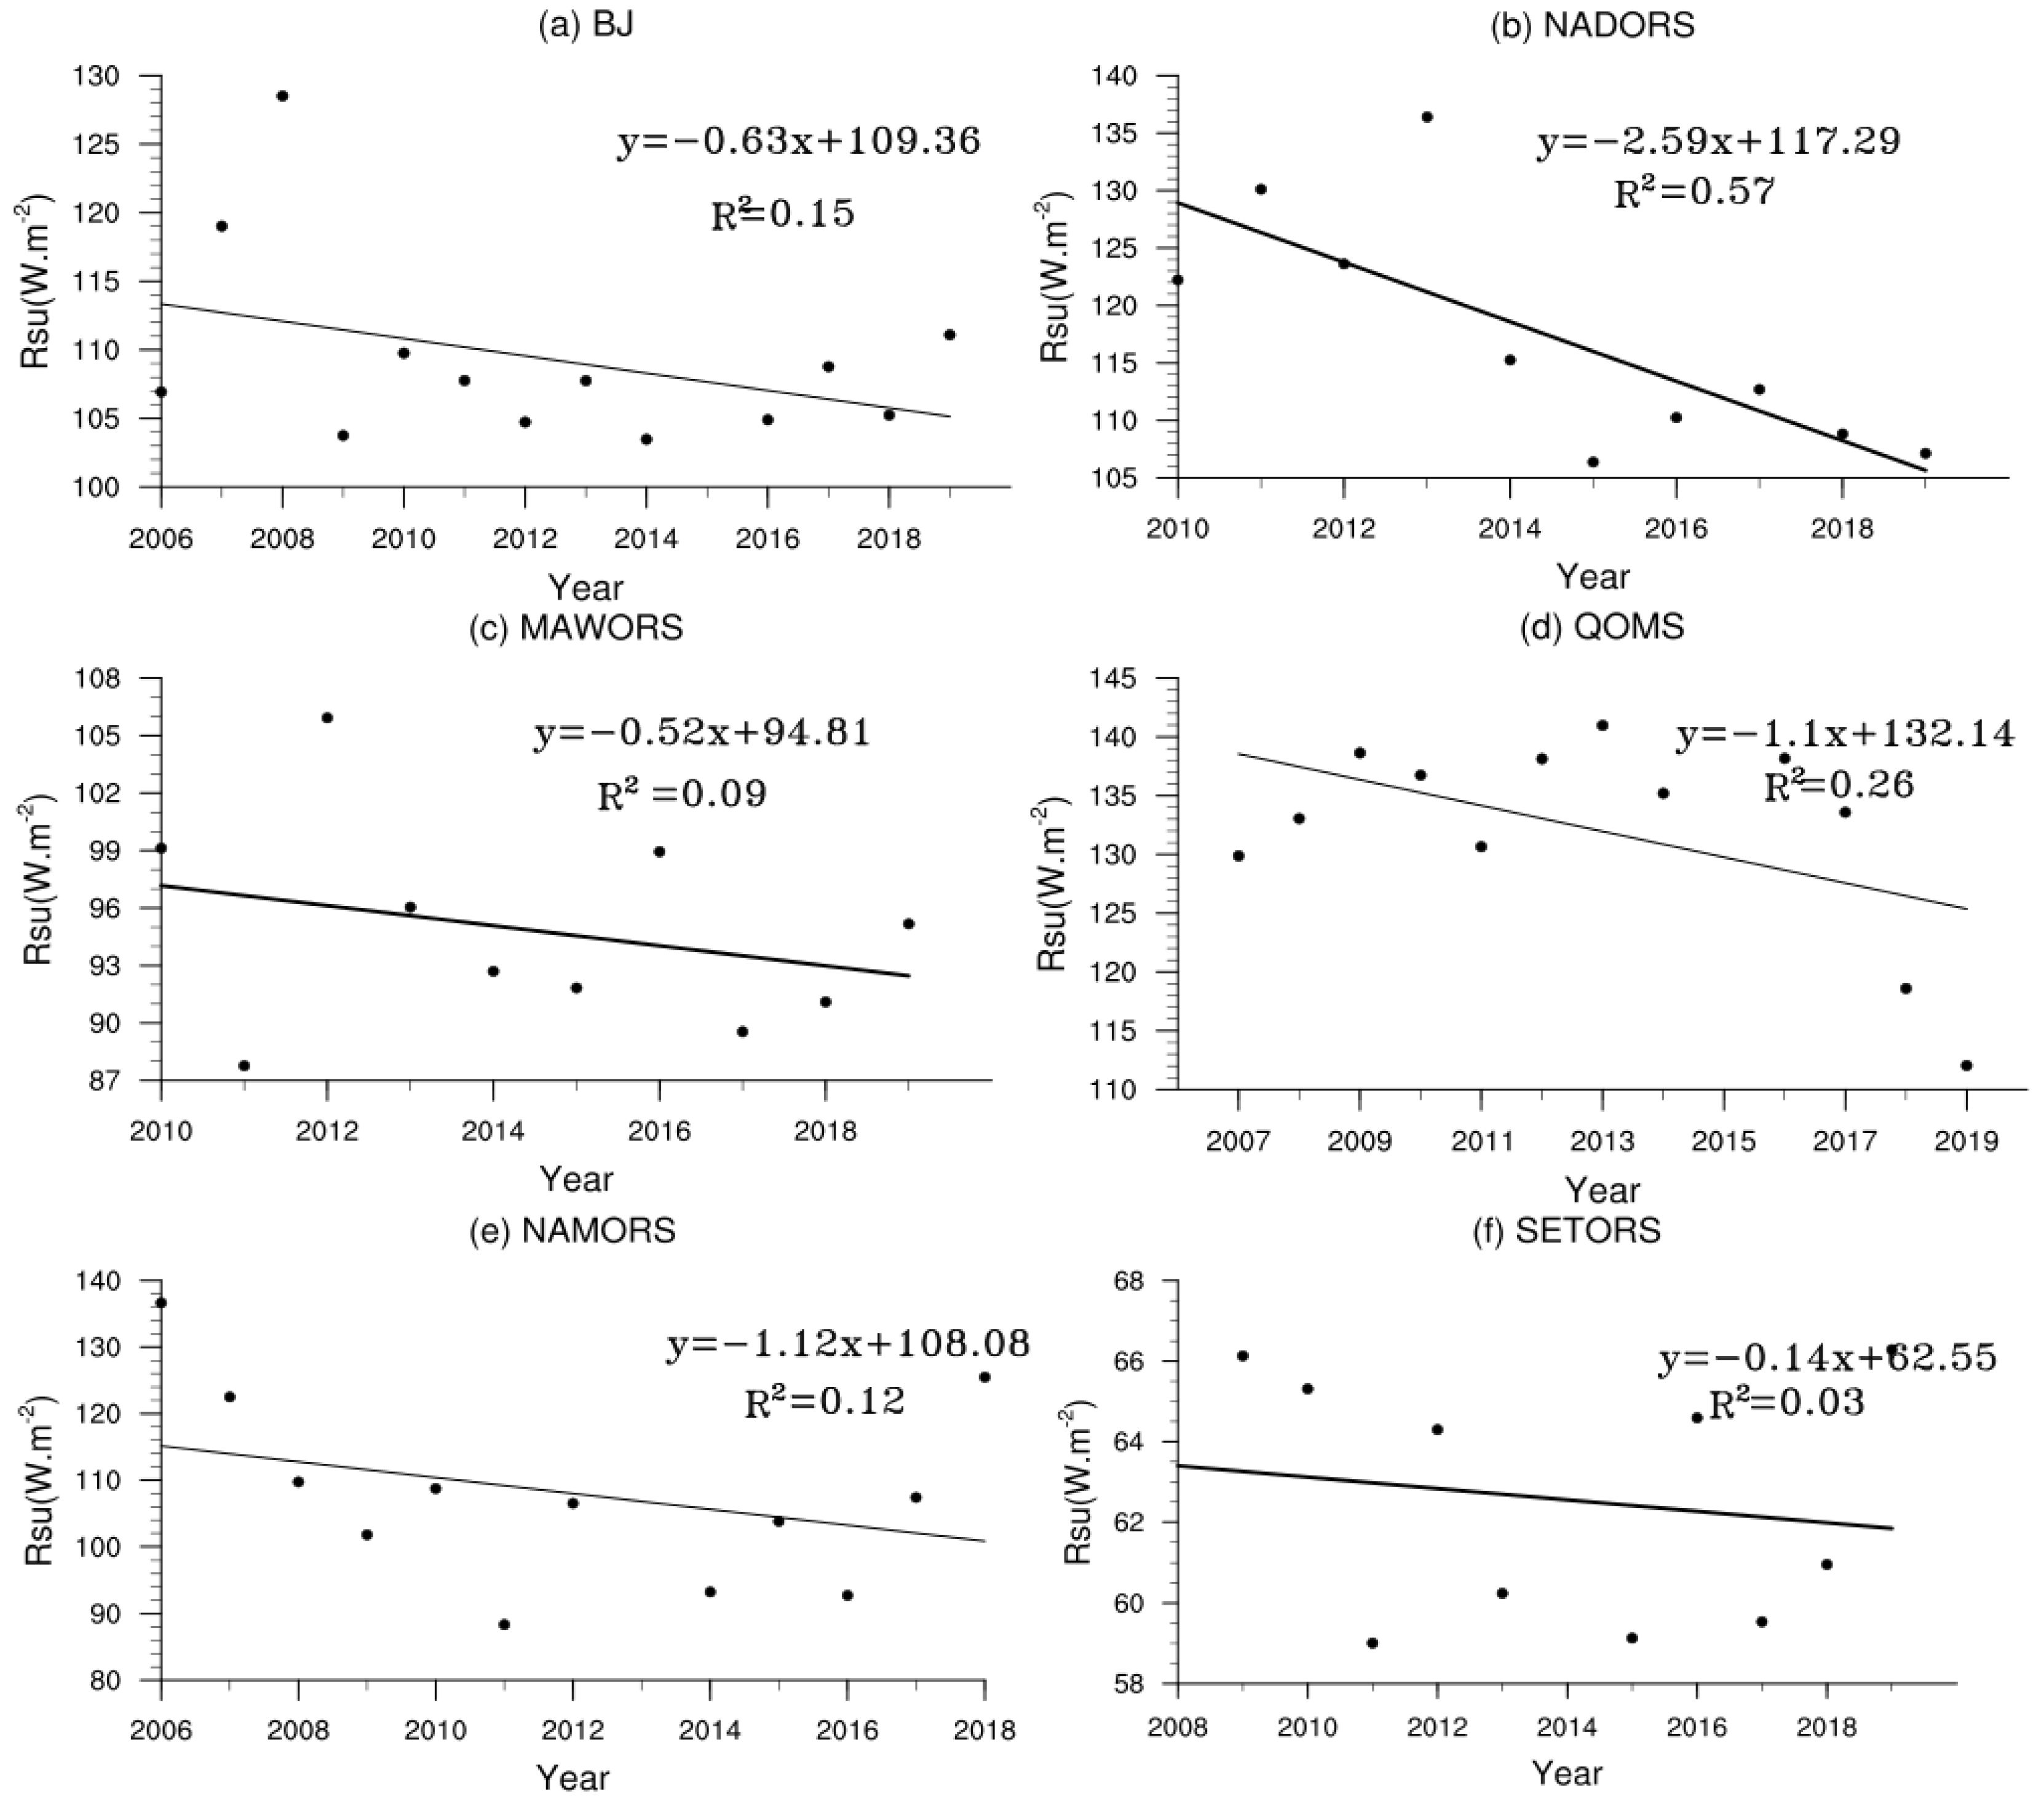
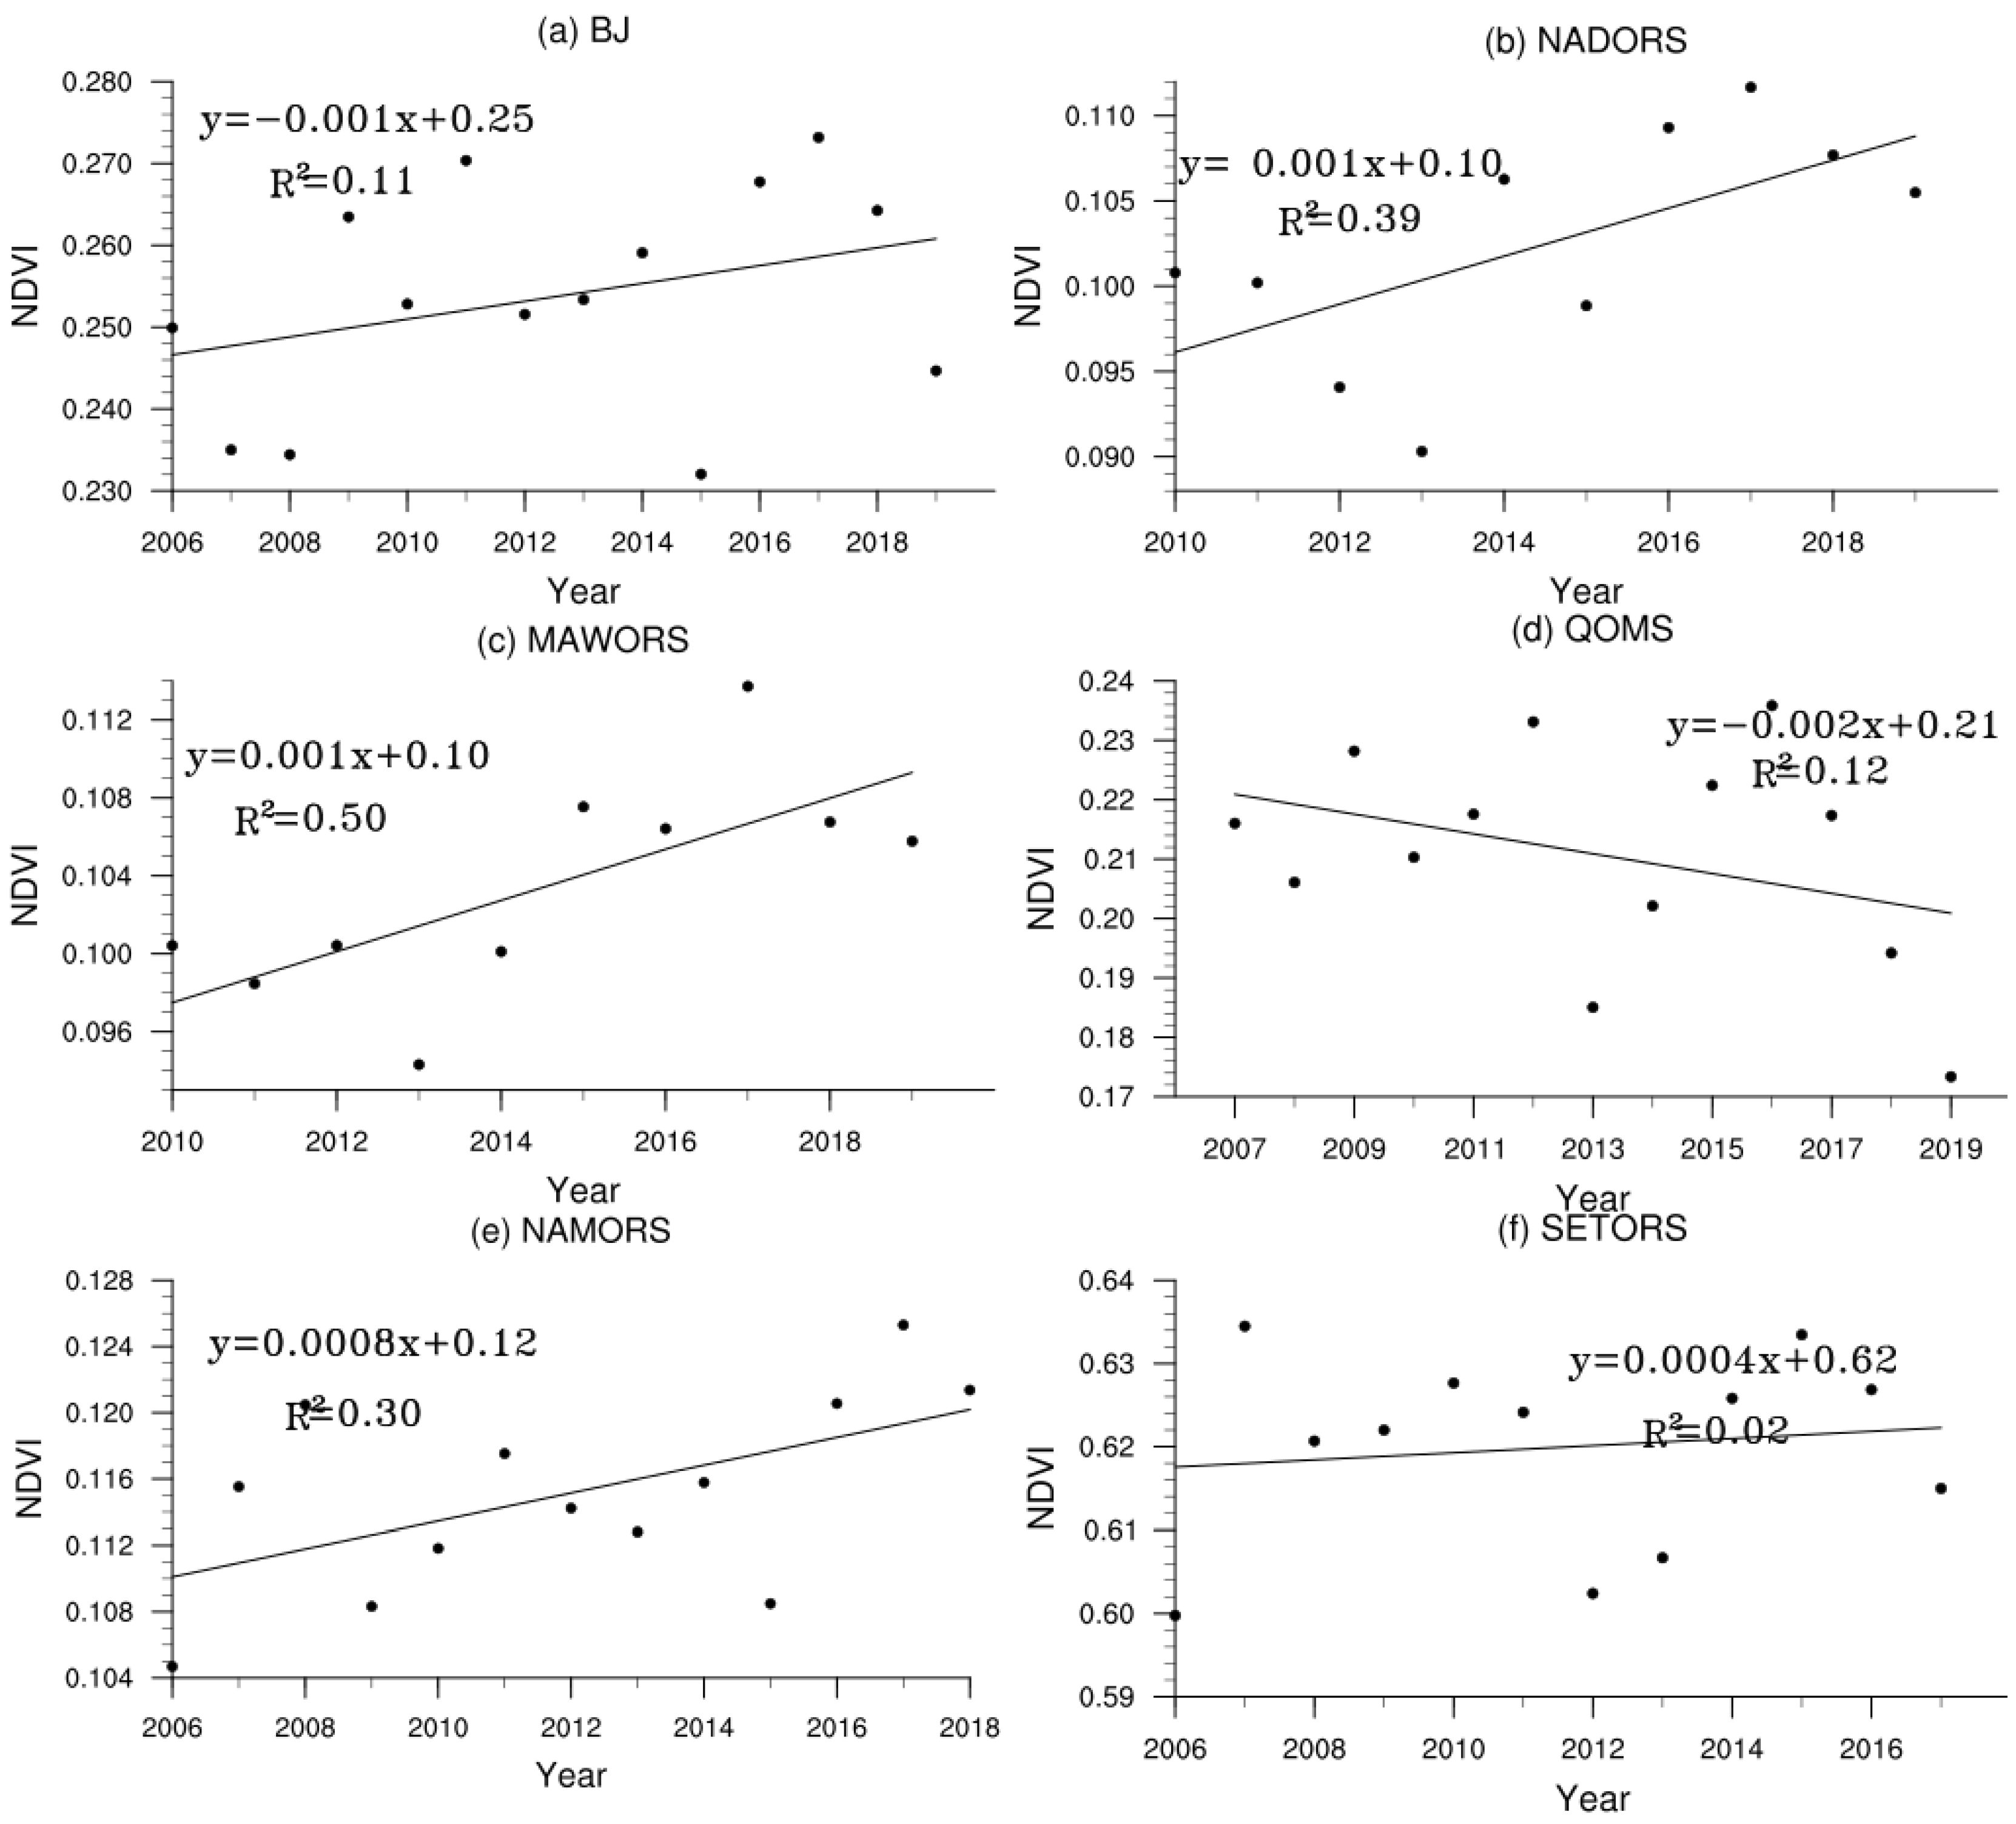
The inter-annual variations in upward shortwave radiation at each station (Figure 9) ranged between 80 W·m−2 and 142 W·m−2. The trend in upward shortwave radiation decreased year by year at all stations, most notably at NADORS, which decreased by 2.59 W·m−2 per year. On the one hand, the trend in upward shortwave radiation can be affected by downward shortwave radiation. On the other hand, it can be affected by vegetation density. An increase in vegetation density (NDVI) is generally expected to reduce upward shortwave radiation because of the strong absorptance in the Photosynthetically Active Radiation (PAR) region of the solar spectrum [26]. The downward shortwave radiation at BJ and NAMORS was decreasing year by year, and consequently, there was a decreasing trend in the upward shortwave radiation. The NDVI at these two stations showed an increasing trend(Figure 10), the vegetation cover increased, and the ground absorbed more downward shortwave radiation, which further led to a decrease in upward shortwave radiation. The downward shortwave radiation at NADORS and SETORS fluctuated, and the downward shortwave radiation at MAWORS increased, but the upward shortwave radiation at the above three stations increased, which was caused by the increase of ground vegetation coverage and the increase of NDVI. The NDVI at QOMS showed a decreasing trend, and the decreasing trend of upward shortwave radiation was mainly due to the decrease of downward shortwave radiation.
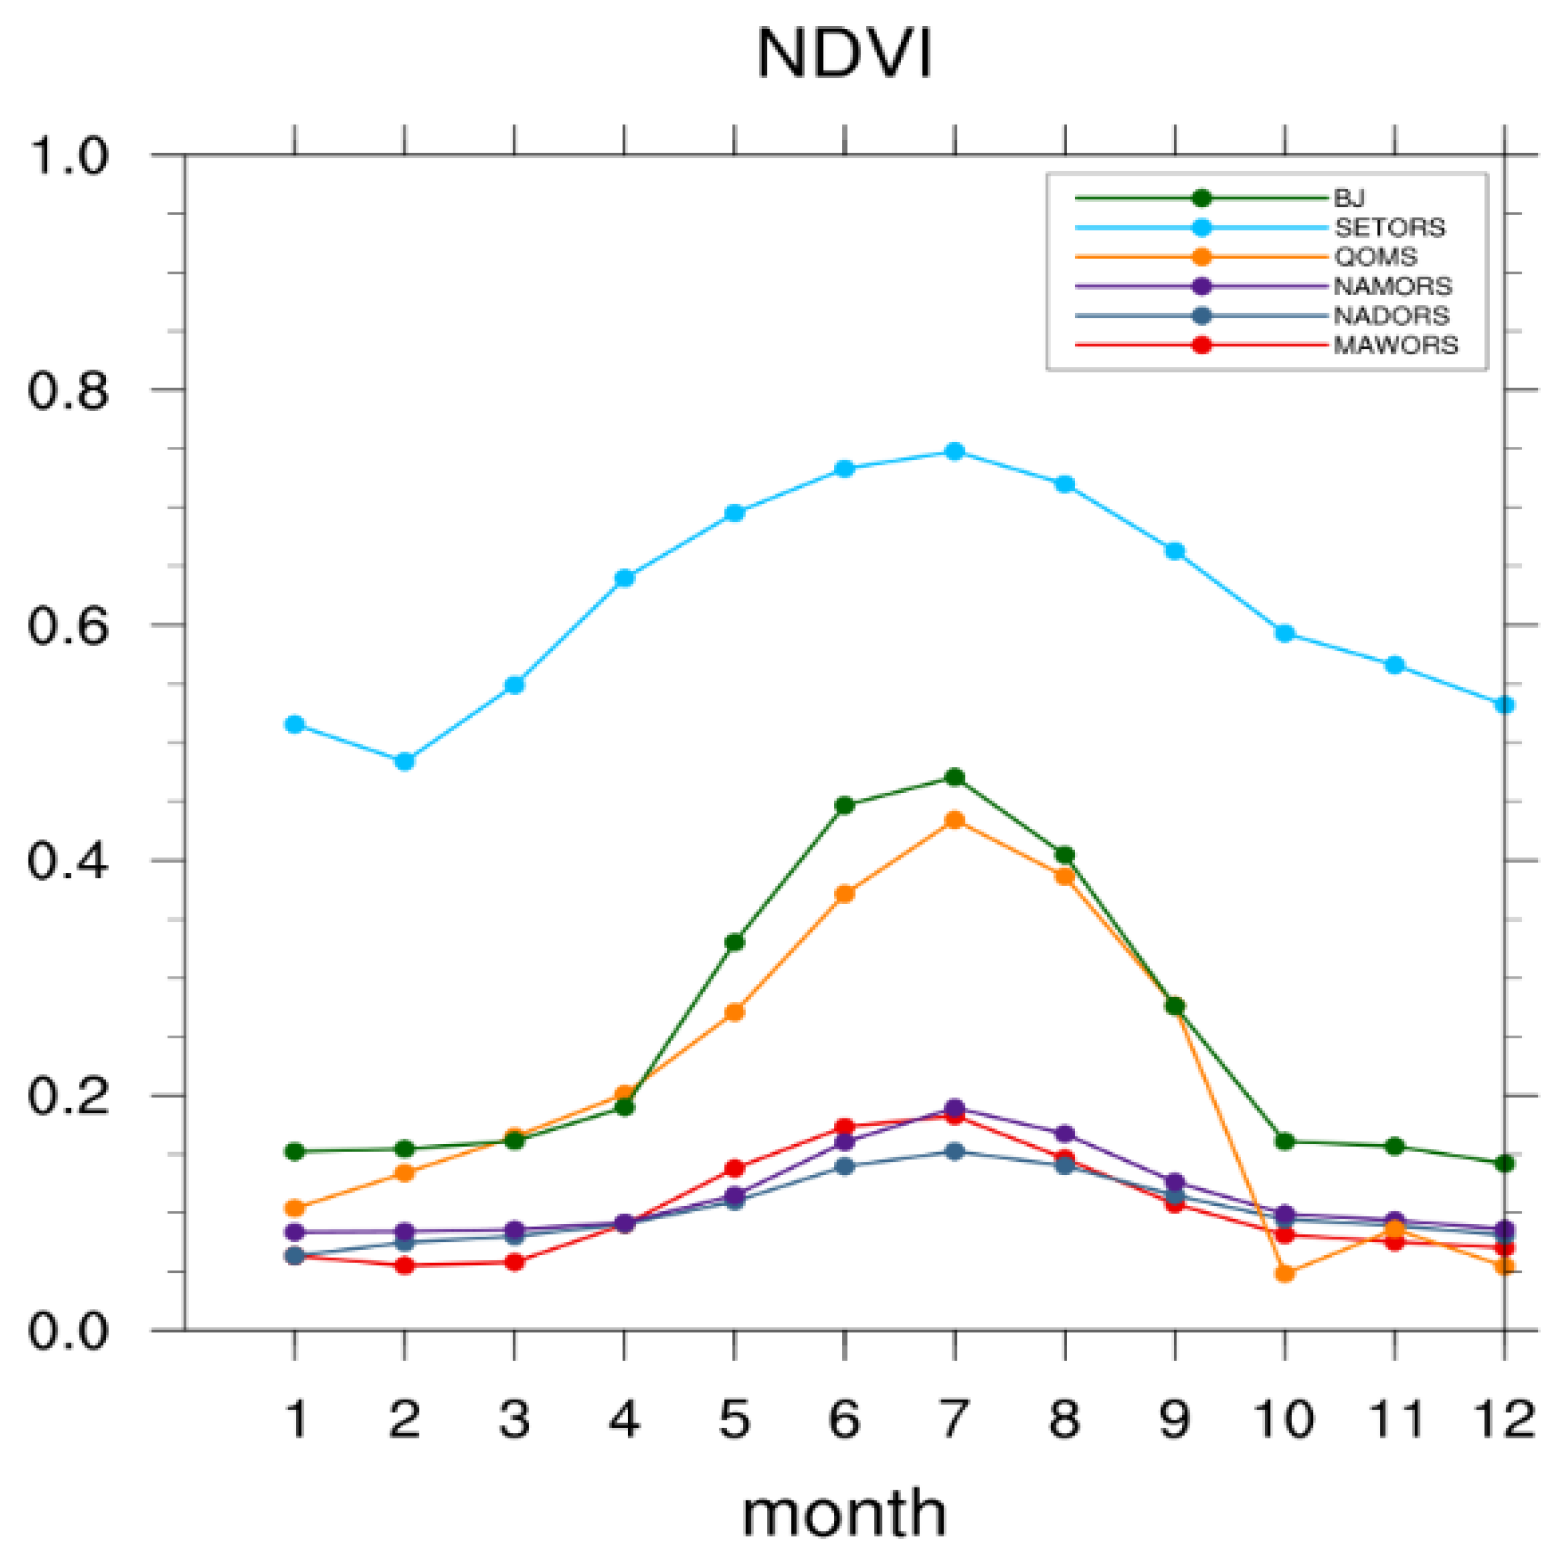
The annual variation of upward shortwave radiation (Figure 8a) showed trends at MAWORS and SETORS that were broadly consistent with those of downward shortwave radiation. There were notable annual variations in upward shortwave radiation at BJ, QOMS, NAMORS, and NADORS. In spring, the trend generally followed that of downward shortwave radiation. In summer, NDVI increased (Figure 11), vegetation became lush, and the ground absorbed more downward shortwave radiation, while the ground received less shortwave radiation. Therefore, the upward shortwave radiation decreased. In autumn, the air temperature dropped below 0 °C (Figure 12a), due to snow accumulation on the ground, an increasing trend of upward shortwave radiation was observed, especially at NAMORS, where the upward shortwave radiation in November reached 160 W·m−2. In winter, the area of snow on the ground remained largely unchanged, thus the upward shortwave radiation flux decreased with the decreasing solar altitude angle.
3.3. Surface Albedo
Surface albedo is the ratio of upward shortwave radiation to downward shortwave radiation, and is an important factor affecting the energy balance of the surface. Surface albedo can be affected by solar altitude angle, atmospheric transparency, land cover, soil moisture, and weather conditions [27,28].
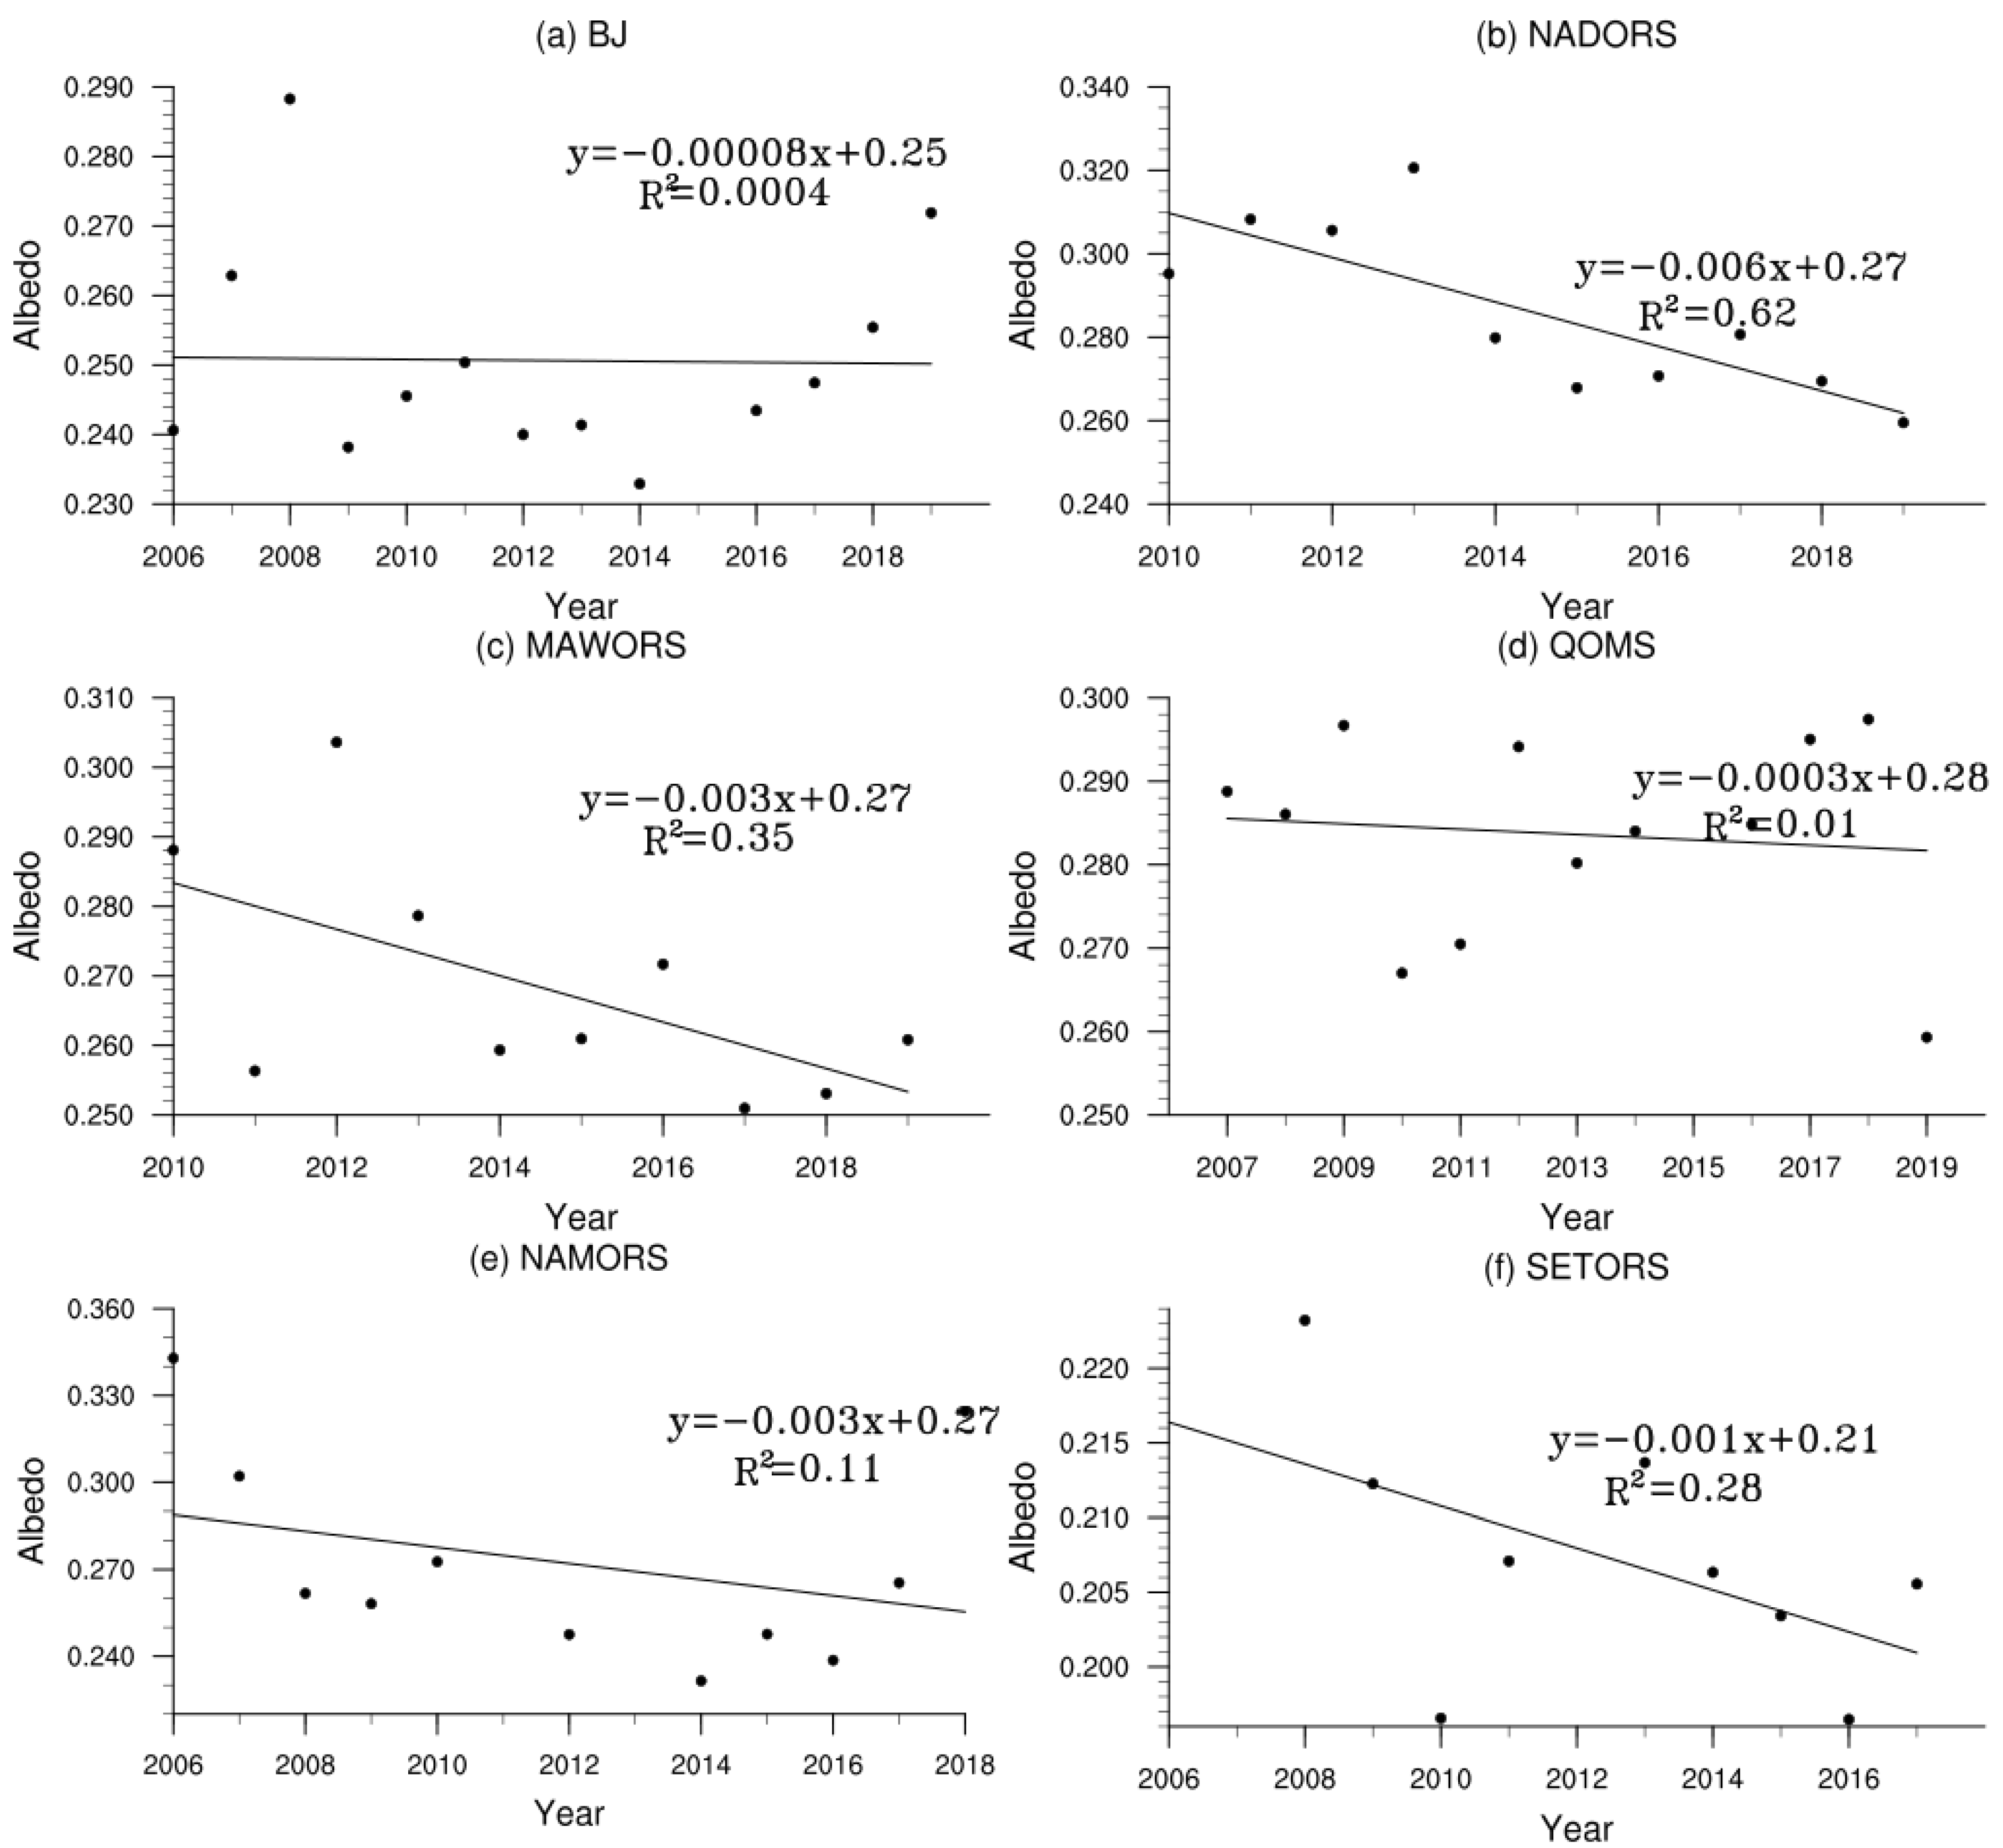
In general, snow melting or vegetation greening causes a typical decrease in surface albedo [29]. Therefore, surface albedo can broadly reflect changes in surface conditions, which is also reflected in the relationship between NDVI and surface albedo (Figure 13). The Pearson correlation coefficient between NDVI and surface albedo reached −0.73 and passed the significance test of 99%. We found the inter-annual variations in surface albedo (Figure 14) fluctuated between 0.18 and 0.33 at each station. From 2006 to 2016, the surface albedo at all stations decreased year by year. This trend was consistent with the findings of Li et al. [30], who used the MODIS shortwave white sky albedo product (MOD43A3) and found that the land surface albedo has been decreasing on the Tibetan Plateau from 2000 to 2013. This paper further supports their conclusion with real observation data. From 2006 to 2016, the surface albedo at all stations showed a decreasing trend, and the NDVI at all stations (except QOMS station) showed an increasing trend. From 2016 to 2019, the surface albedo at BJ, MAWORS, NAMORS, and SETORS showed an increasing trend, and the NDVI at these stations showed a decreasing trend. The interannual trends of surface albedo can broadly reflect the changes in surface conditions.
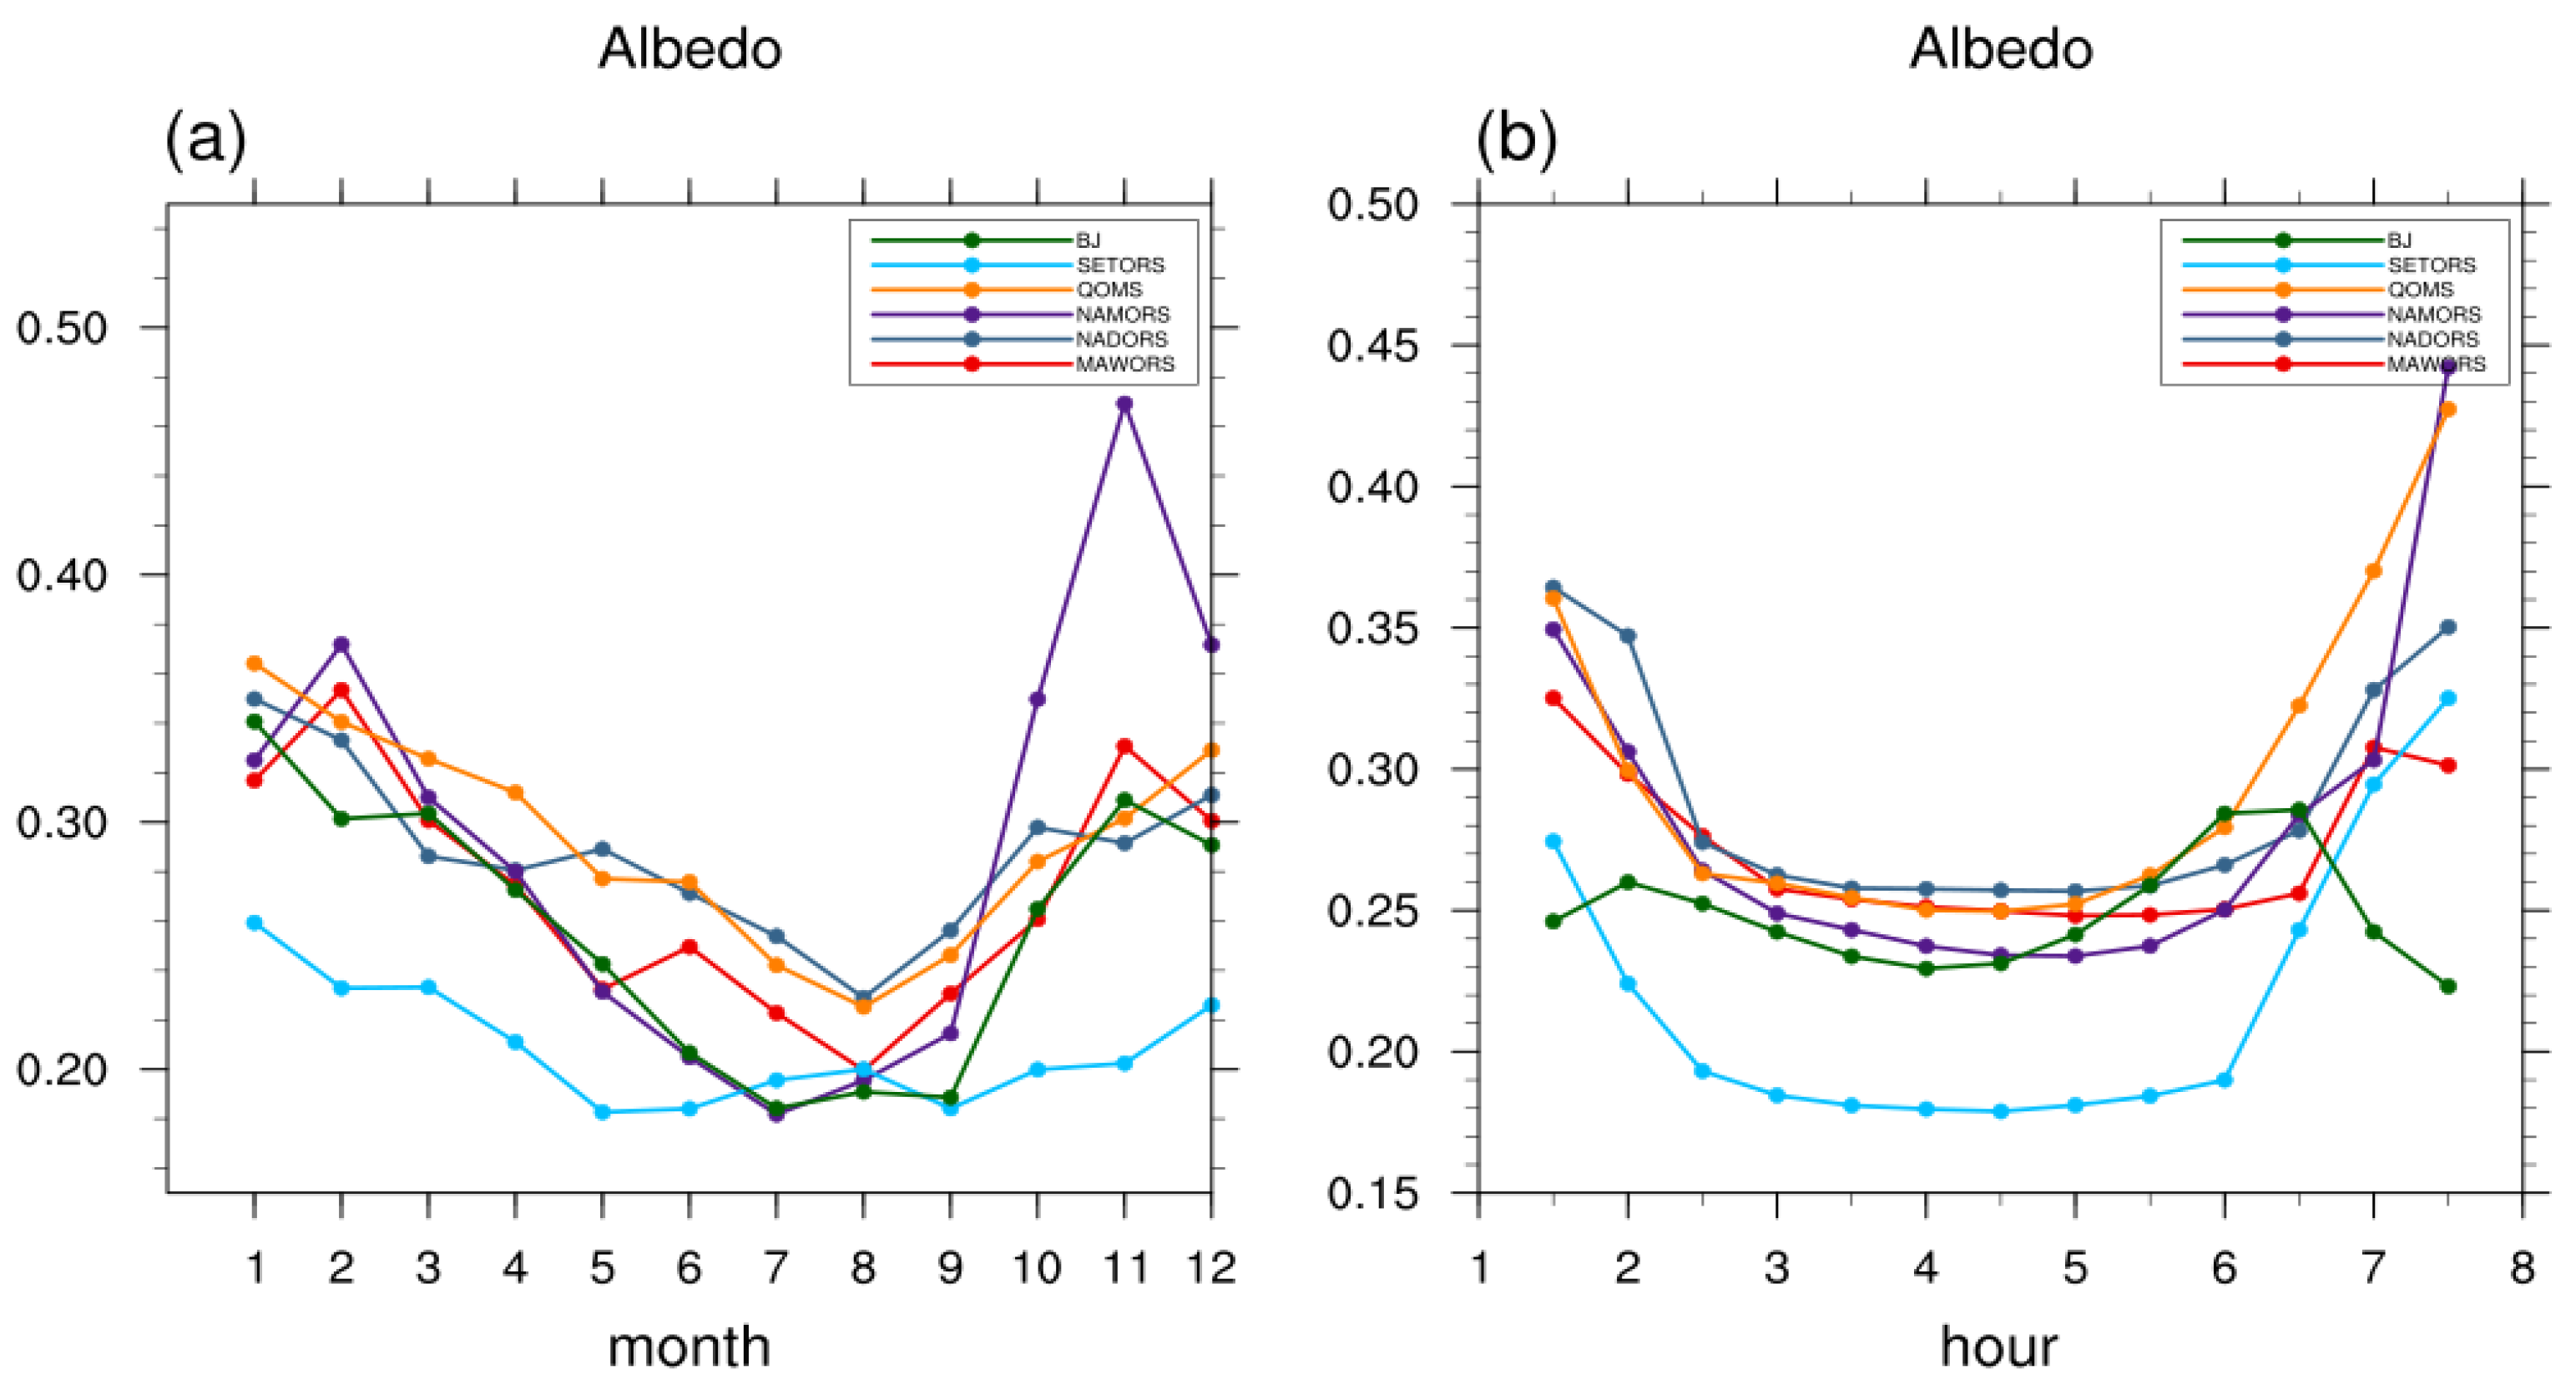
The annual variation of surface albedo (Figure 15a) at each station generally follows a “U” shape. From January to March, the temperature at all stations was below 0 °C (Figure 12a), the ice was thicker, and the solar altitude angle was small, the surface albedo of each station was the largest, with a value around 0.35 (except SETORS). In April, the temperature at all stations was around 0 °C (Figure 12a), the snow and ice gradually melted, and the surface albedo gradually decreased. May to September is the plant growth period with large NDVI values at all stations (Figure 11). During this period, the vegetation cover increased, and the surface albedo continued to decrease, reaching a minimum in the range 0.2 to 0.25 during July or August. After October, the temperature at all stations was below 0 °C (Figure 12a), vegetation dieback, and increasing snow and ice cover caused the surface albedo to increase further. From October to December, the surface albedo at NAMORS was significantly higher than that of other stations due to the snow on the plateau, reaching a maximum of 0.48. The difference between surface albedo at SETORS and that at the other stations was not significant in summer, but in other seasons the surface albedo was significantly smaller than that at the rest of the stations, probably due to a lower snow and ice cover.
The diurnal variations in surface albedo (Figure 15b) were similar at all stations, being highest in the morning and evening and lower at noon. This is mainly related to the change of solar altitude angle. When the solar altitude angle is low, a relatively greater proportion of the solar radiation reaching the ground is longwave, and the ground is very reflective to longwave radiation. When the solar altitude angle is high, the surface is less reflective to solar radiation. This effect is more evident when the solar altitude angle is low [31]. Therefore, the surface albedo at each station varied widely in the morning and evening but remained steady from 11:00 to 18:00. Surface albedo can broadly reflect changes in surface conditions. The ground surface at QOMS was covered with ice, sand, and gravel, and the vegetation was sparse. From 11:00 to 18:00, the surface albedo was around 0.27, which was the largest among the six stations. The ground surface at SETORS was forested grassland, with relatively high vegetation. The surface albedo from 11:00 to 18:00 was around 0.18, which was the smallest among the six stations.
3.4. Upward Longwave Radiation Flux
The ground surface temperature increases when the surface absorbs downward shortwave radiation. This leads to increased emission of longwave radiation back into the atmosphere. The inter-annual variations in upward longwave radiation (Figure 16) fluctuated between 321 W·m−2 and 368 W·m−2. The upward longwave radiation showed overall increasing trends at BJ, MAWORS, QOMS, and NAMORS (most significant at MAWORS; weakest at NAMORS). Upward longwave radiation at NADORS showed a decreasing trend from 2011 to 2013, then an increasing trend from 2013 to 2019, with the initial decrease caused by the stronger upward longwave radiation in 2011. The overall increasing trend of upward longwave radiation at each station reflected changes in the surface climate of the plateau in the context of global warming.
The annual variations in upward longwave radiation (Figure 17a) revealed obvious seasonal signals at each station, in which upward longwave radiation was significantly smaller in winter than in summer. Monthly maxima varied between the different stations: upward longwave radiation peaked at BJ in July and August, at QOMS and NAMORS in June, and at NADORS and MAWORS in July. The maximum varied between 380 W·m−2 and 410 W·m−2. Due to the different surface characteristics and geographic locations, the upward longwave radiation changes showed varying patterns between different stations. However, in general, the upward longwave radiation at all stations reached the maximum in summer and the minimum in winter.
Diurnal variations in upward longwave radiation (Figure 17b) show a peak between 15:00 and 16:00, slightly lagging the peak in downward shortwave radiation. The maximum upward longwave radiation at QOMS reached 470 W·m−2, and the minimum was at MAWORS.
3.5. Downward Longwave Radiation Flux
Downward longwave radiation, also known as atmospheric inverse radiation, is longwave radiation emitted by the atmosphere to the surface. It is mainly influenced by temperature, atmospheric transparency, cloud amount, and cloud type. Geographical location also affects downward longwave radiation to some extent [32,33]. The Tibetan Plateau has a high altitude, and the overlying atmosphere holds less aerosol and water vapor than that of the lowlands. Therefore, the downward longwave radiation over the plateau is only 50%~70% of that in the lowlands [34].
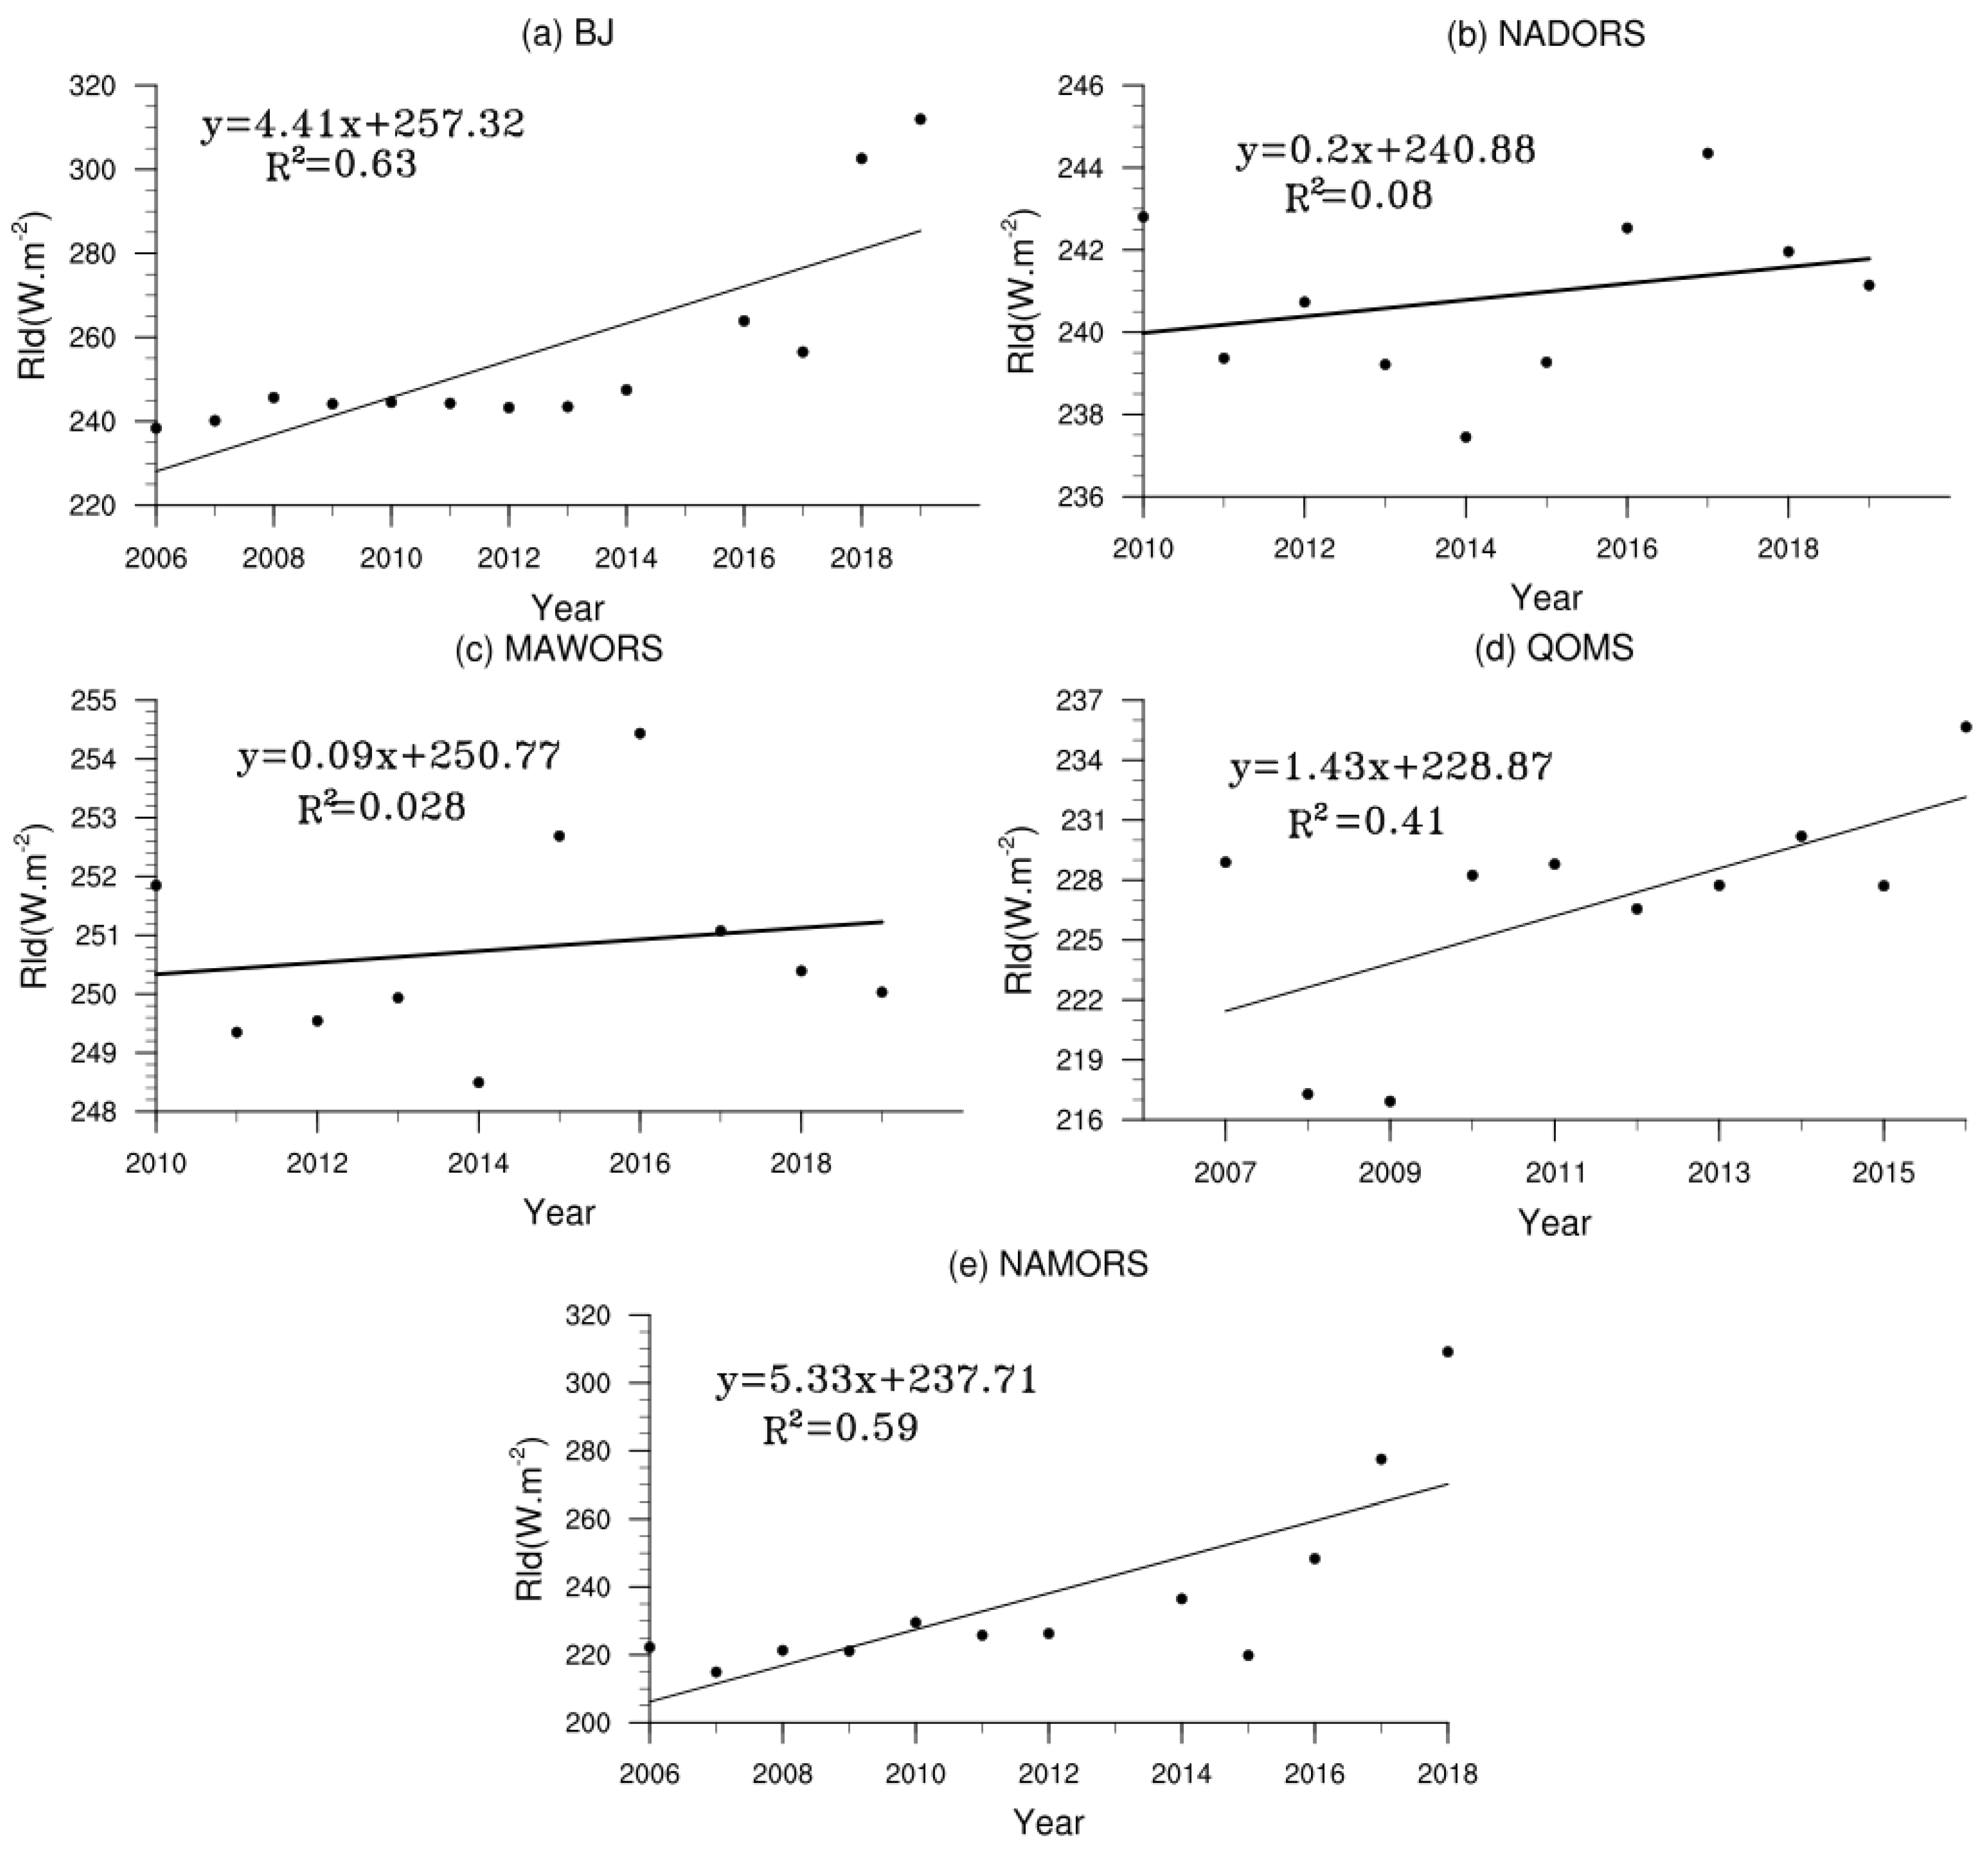
The inter-annual variations of downward longwave radiation (Figure 18) ranged from 200 W·m−2 to 320 W·m−2 at each station and followed an increasing trend. MAWORS was mainly influenced by the increase of upward longwave radiation, NADORS was mainly influenced by the increase of convective clouds, while BJ, QOMS and NAMORS were influenced by a combination of both of those factors.
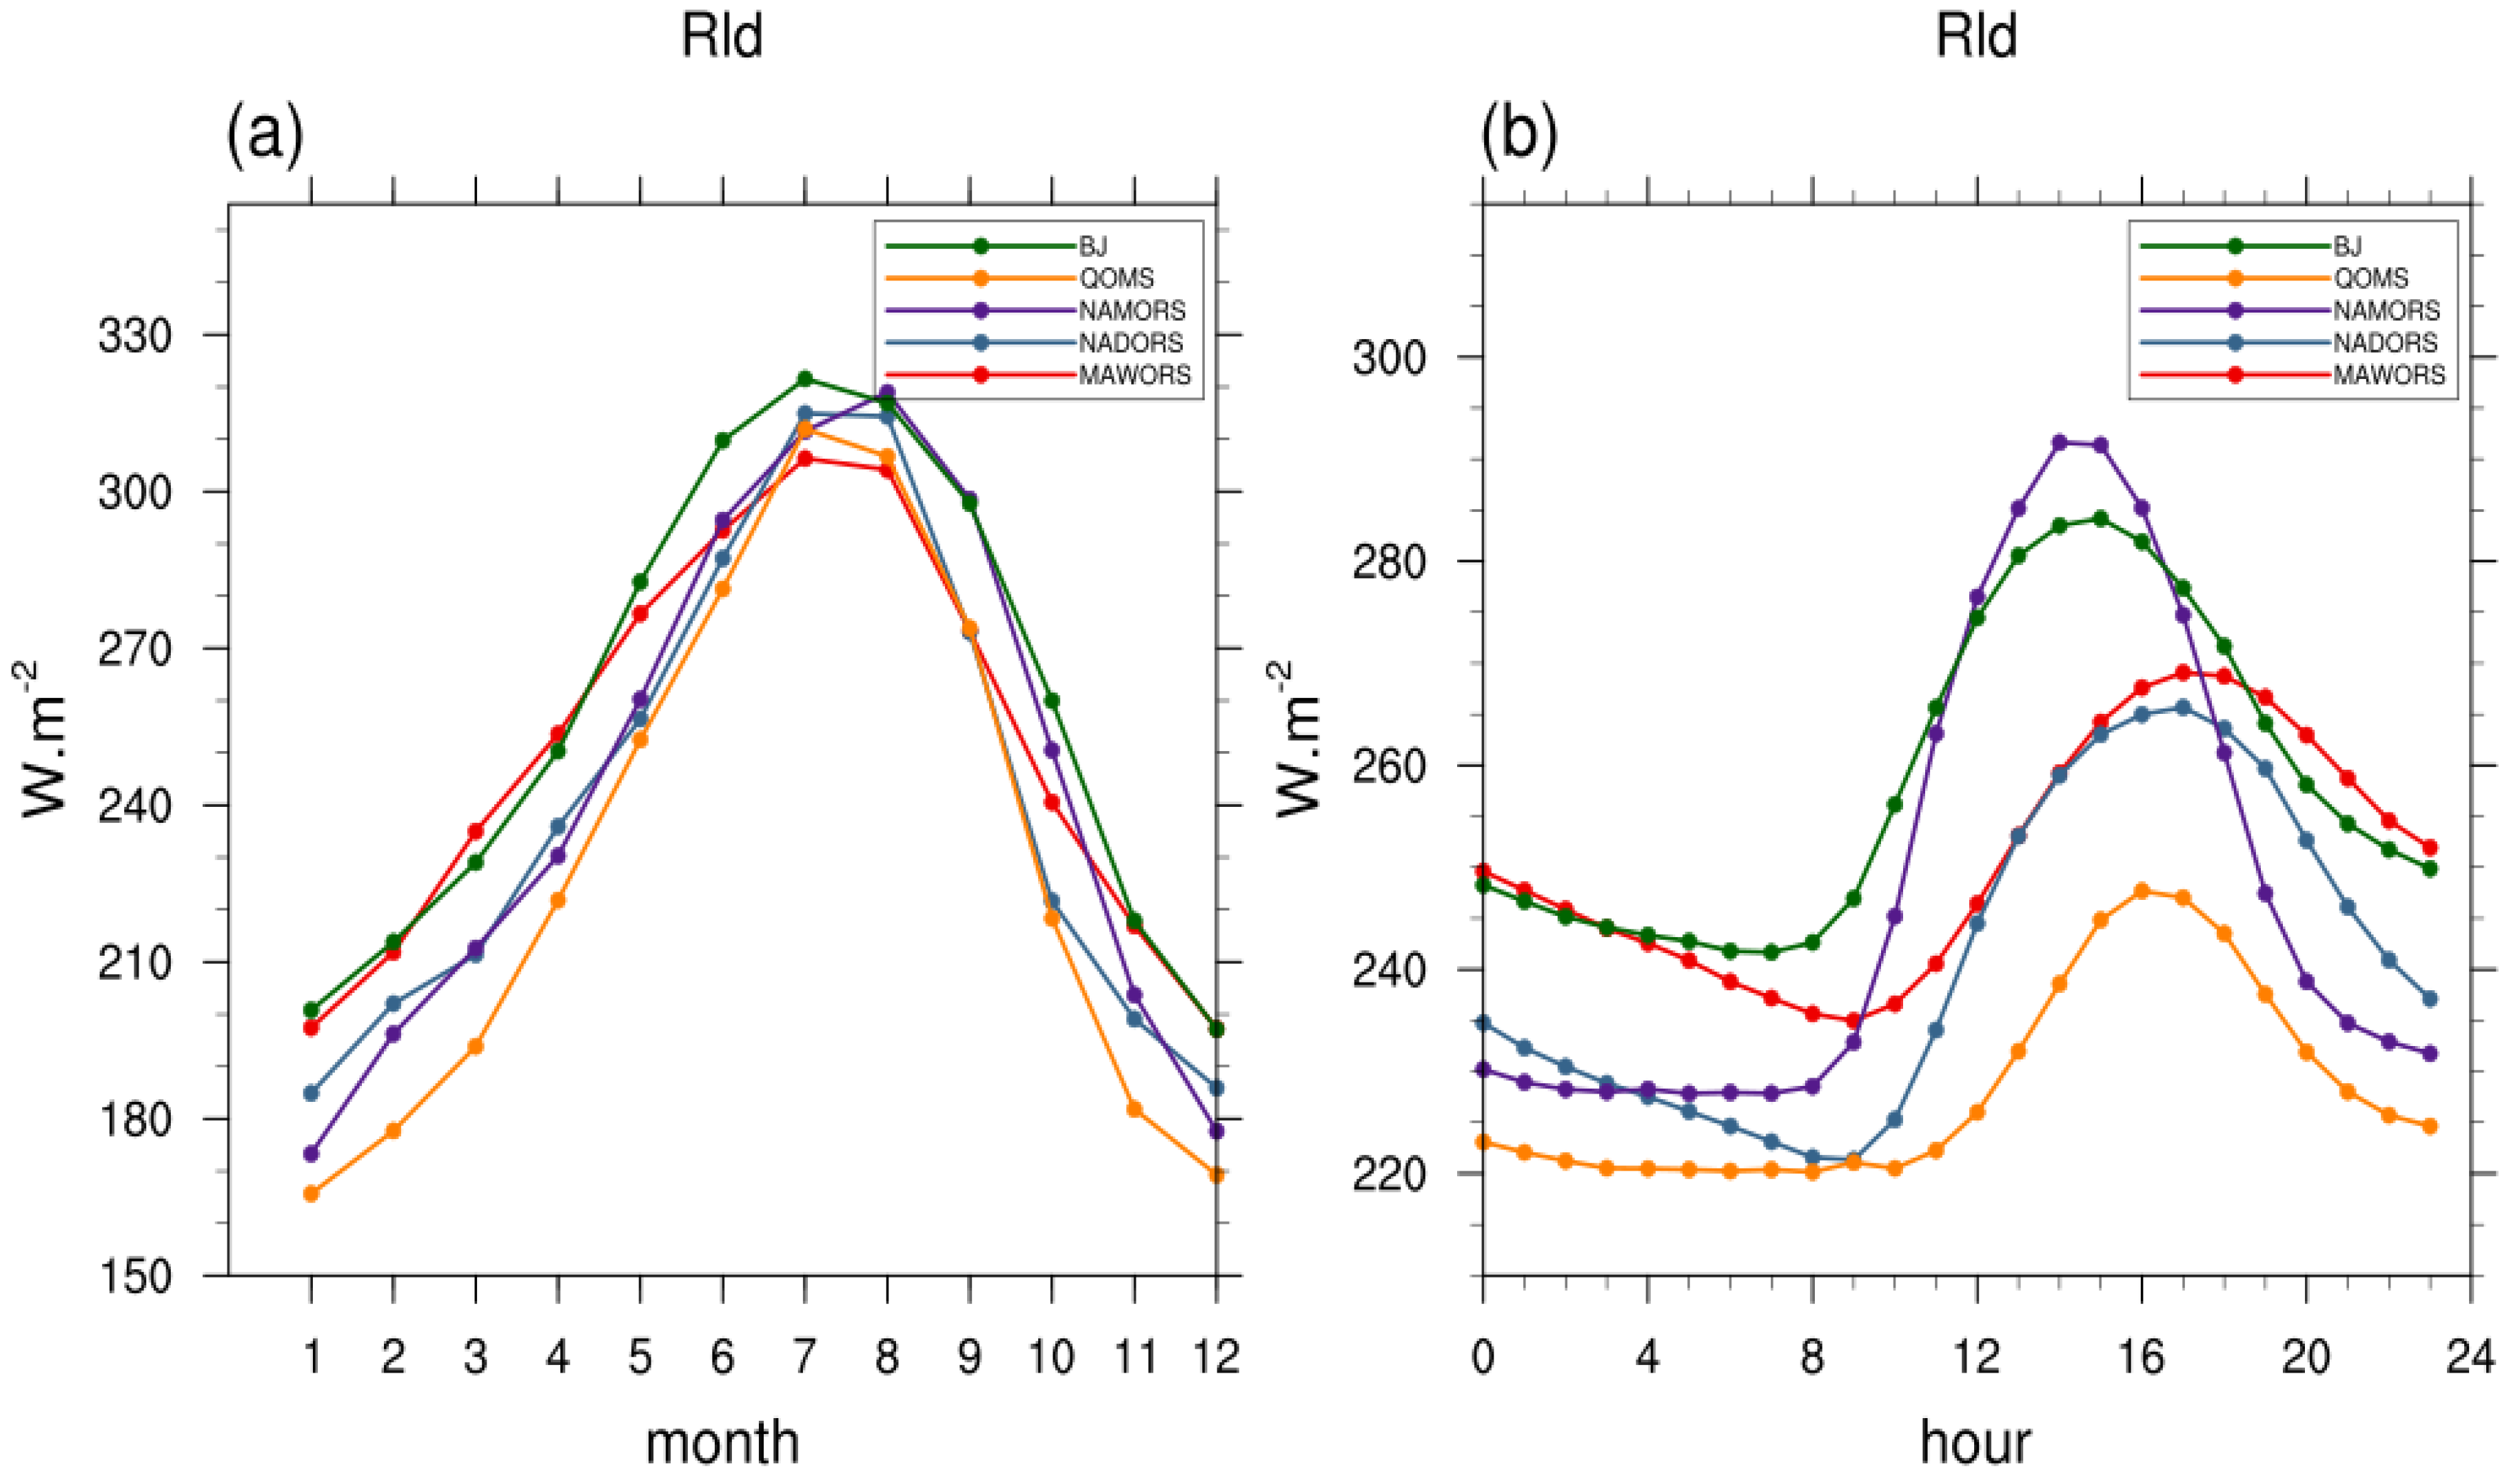
The annual variations of downward longwave radiation at each station (Figure 19a) showed an increase from January to a maximum in July or August and then a gradual decrease. In spring and winter, when temperatures were low, both upward and downward longwave radiation fluxes were small. In summer, at the time of monsoon break, water vapor was abundant, and upward longwave radiation was at its peak. Thus the downward longwave radiation was also greatest (at around 310 W·m−2).
Diurnal variations of downward longwave radiation (Figure 19b) were very small, ranging from 220 W·m−2 to 295 W·m−2. The downward longwave radiation at NAMORS and BJ reached a minimum at around 8:00 and a maximum between 14:00 and 15:00. Respective minima and maxima at MAWORS, NADORS, and QOMS were at around 9:00 and 16:00 to 17:00. QOMS showed the least variation in downward longwave radiation.
3.6. Net Radiation Flux
The net radiation (Rn) is the difference between the downwards and upwards radiation fluxes at the ground surface. In the absence of other modes of heat exchange, the surface temperature increases when the net radiation is positive; remains constant when the net radiation is zero; and decreases when the net radiation is negative. Net radiation is jointly determined by each component of the radiation balance, and thus is affected by solar altitude angle, atmospheric transparency, altitude, underlying surface conditions, etc. [35].
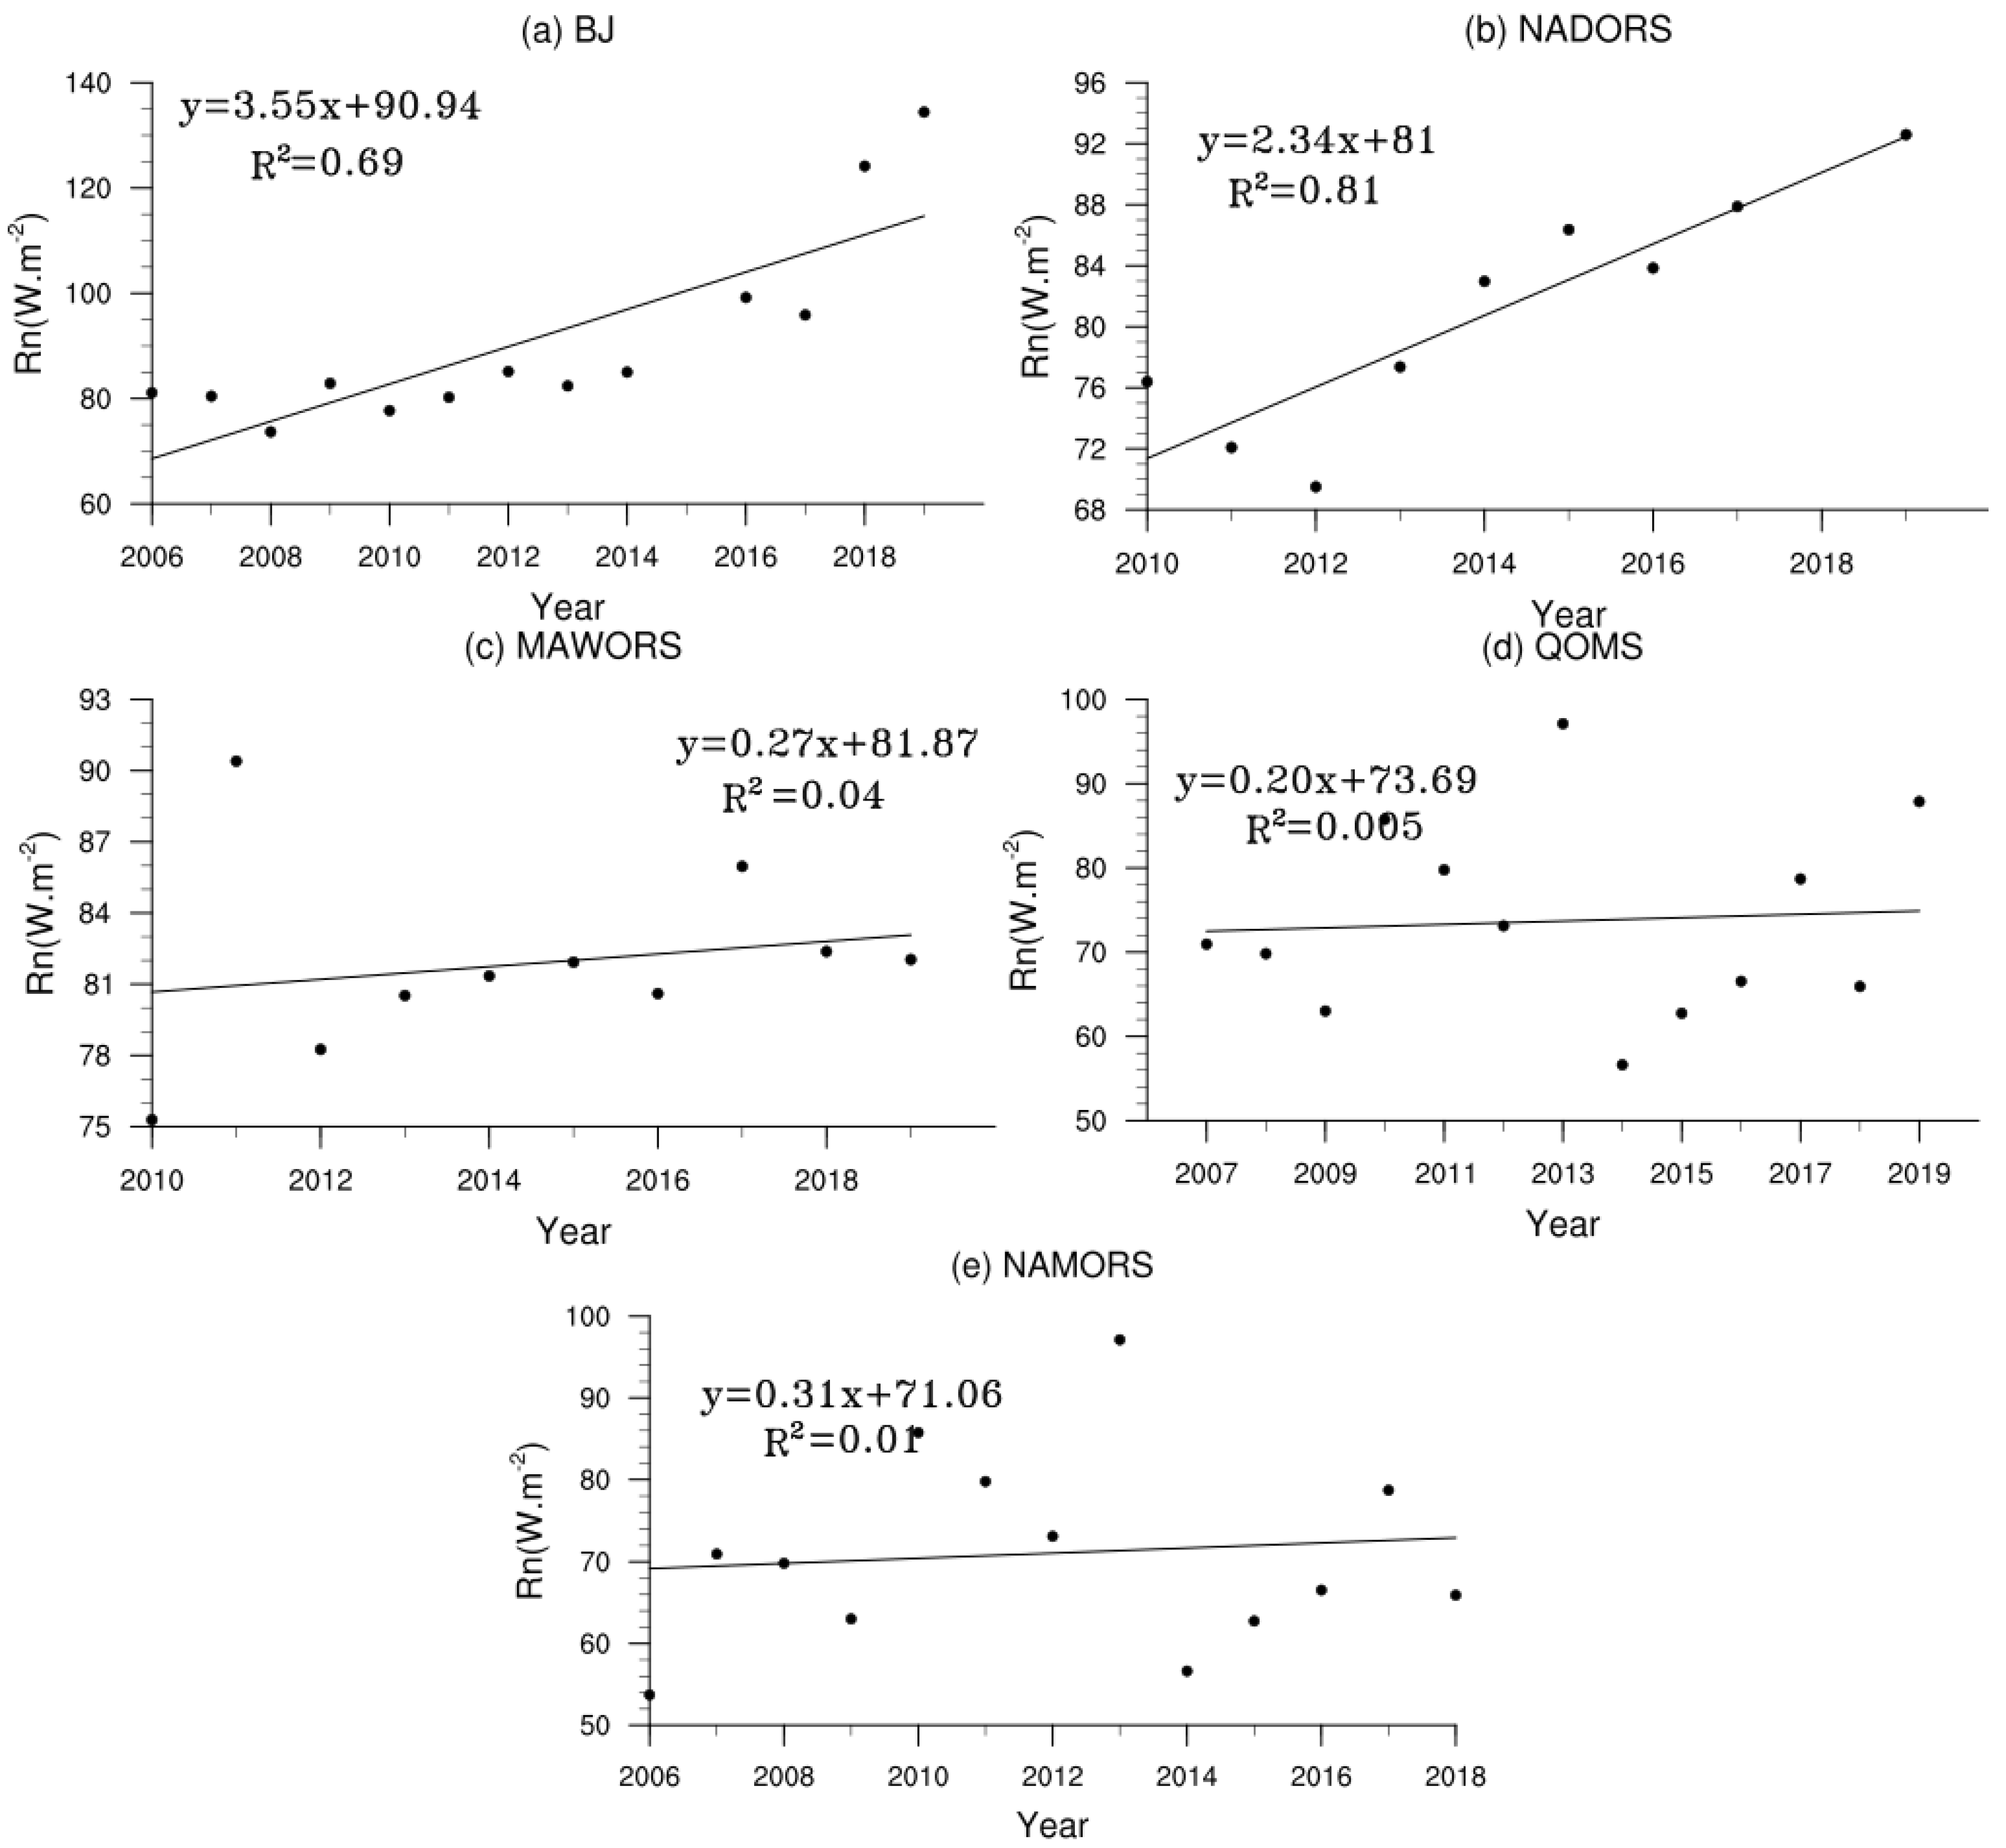
The inter-annual variations in net radiation (Figure 20) ranged between 50 W·m−2 and 140 W·m−2, with an overall increasing trend at each station. Although the downward shortwave radiation showed decreasing trends at BJ and NAMORS, the upward shortwave radiation reflected by the ground surface also decreased. This was due to increasing vegetation cover (Figure 10). Although the upward longwave radiation showed an increasing trend, the downward longwave radiation also increased. Overall, the net radiation showed an increasing trend. At QOMS, the upward shortwave radiation decreased, the downward longwave radiation increased. Thus, the net radiation showed an increasing trend. At NADORS, the downward shortwave radiation showed little change, the upward shortwave radiation decreased, and the downward longwave radiation increased. Thus, the net radiation showed an increasing trend. At MAWORS, the downward shortwave radiation increased and upward shortwave radiation decreased, and although the upward longwave radiation increased, the downward longwave radiation also increased, and overall the net radiation showed an increasing trend.
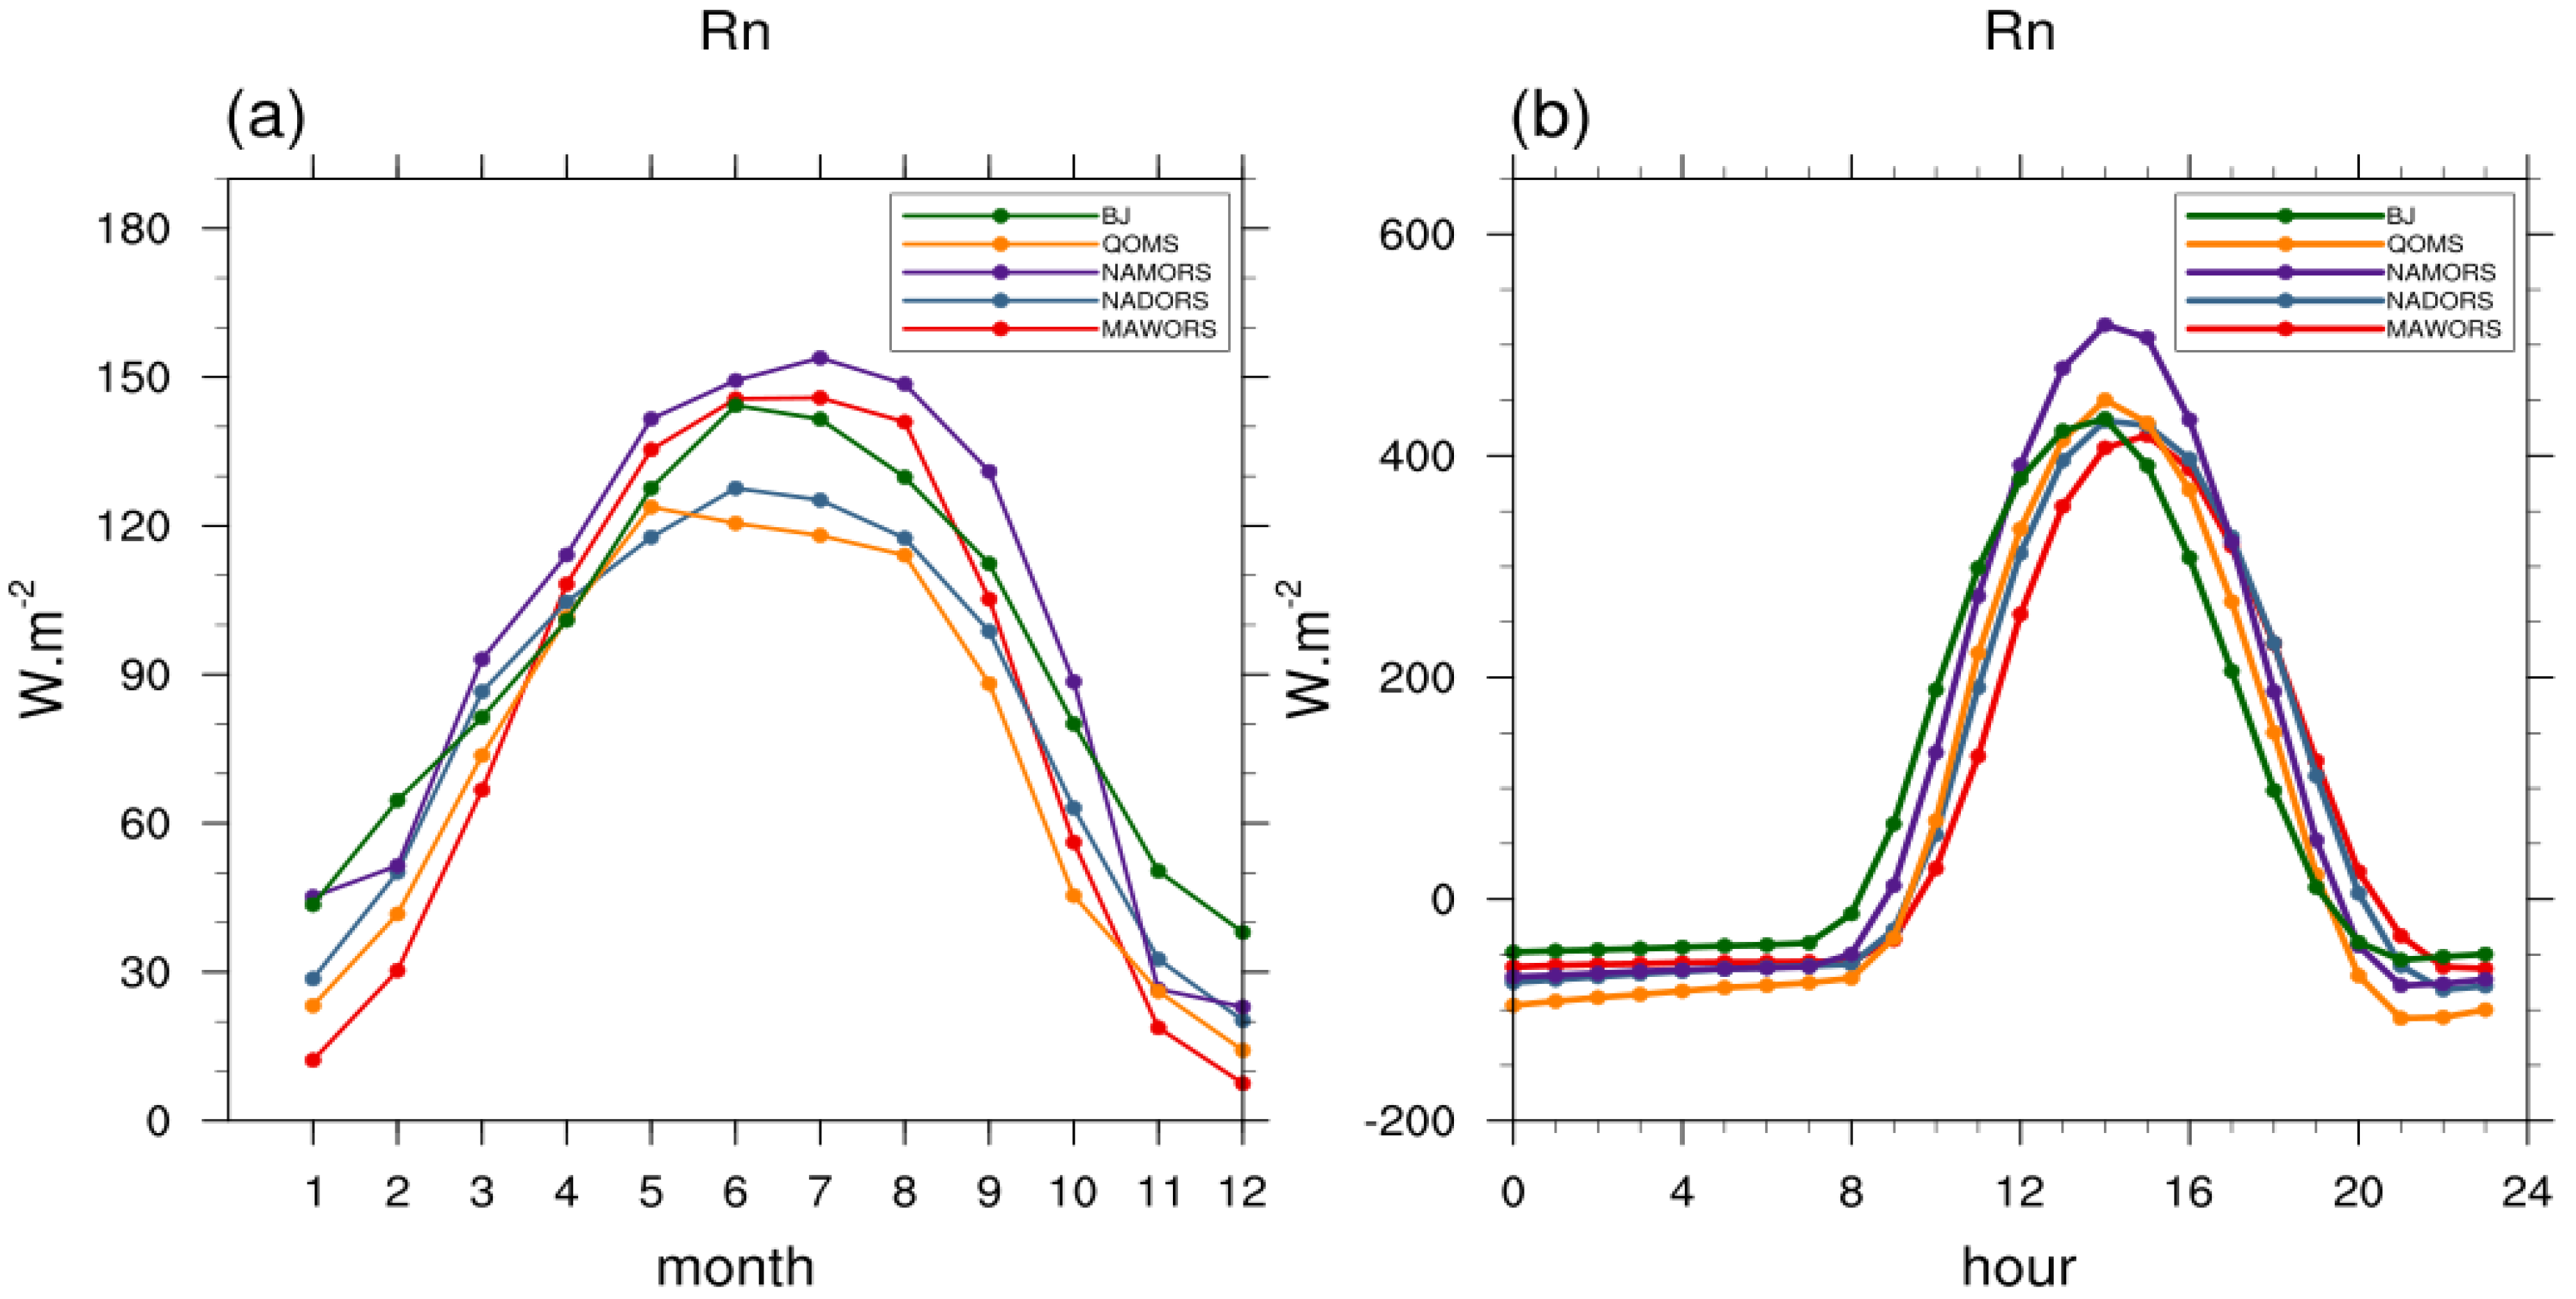
Annual variability in net radiation (Figure 21a) increased with the increasing total solar radiation at each station in spring. In summer, although the downward shortwave radiation at BJ, NADORS, QOMS, and NAMORS was slightly lower than that in spring (under the influence of monsoon), the upward shortwave radiation was lower than that in spring. Moreover, the downward longwave radiation was higher than that in spring. Therefore, the net radiation in summer at the above four stations was higher than that in spring. The net radiation at MAWORS continued to increase with the increasing total solar radiation. The net radiation flux at each station in summer ranged from 110 W·m−2 to 160 W·m−2, and then decreased with the declining total solar radiation in autumn, reaching an annual minimum in winter.
Clear diurnal patterns of net radiation (Figure 21b) showed positive values from 8:00 to 20:00 (range from 0 to 500 W·m−2) and negative at other times (range from 0 to −120 W·m−2). The diurnal pattern generally followed downward shortwave radiation. NAMORS had the largest daily variation in net radiation, up to 600 W·m−2.
From 8:00, the downward shortwave radiation increased above zero, reaching a maximum of 900 W·m−2 at around 14:00, and returned to negative values at around 22:00. QOMS had the largest diurnal range of downward shortwave radiation (0 to 950 W·m−2). SETORS had the smallest diurnal range (0 to 700 W·m−2).
3.7. Surface Temperature
The surface temperature represents the strength of the ground heat source [10]. The difference between the surface temperature and the air temperature above the surface directly affects the sensible and latent surface heat fluxes, which in turn affect the surface energy and water balances [36].
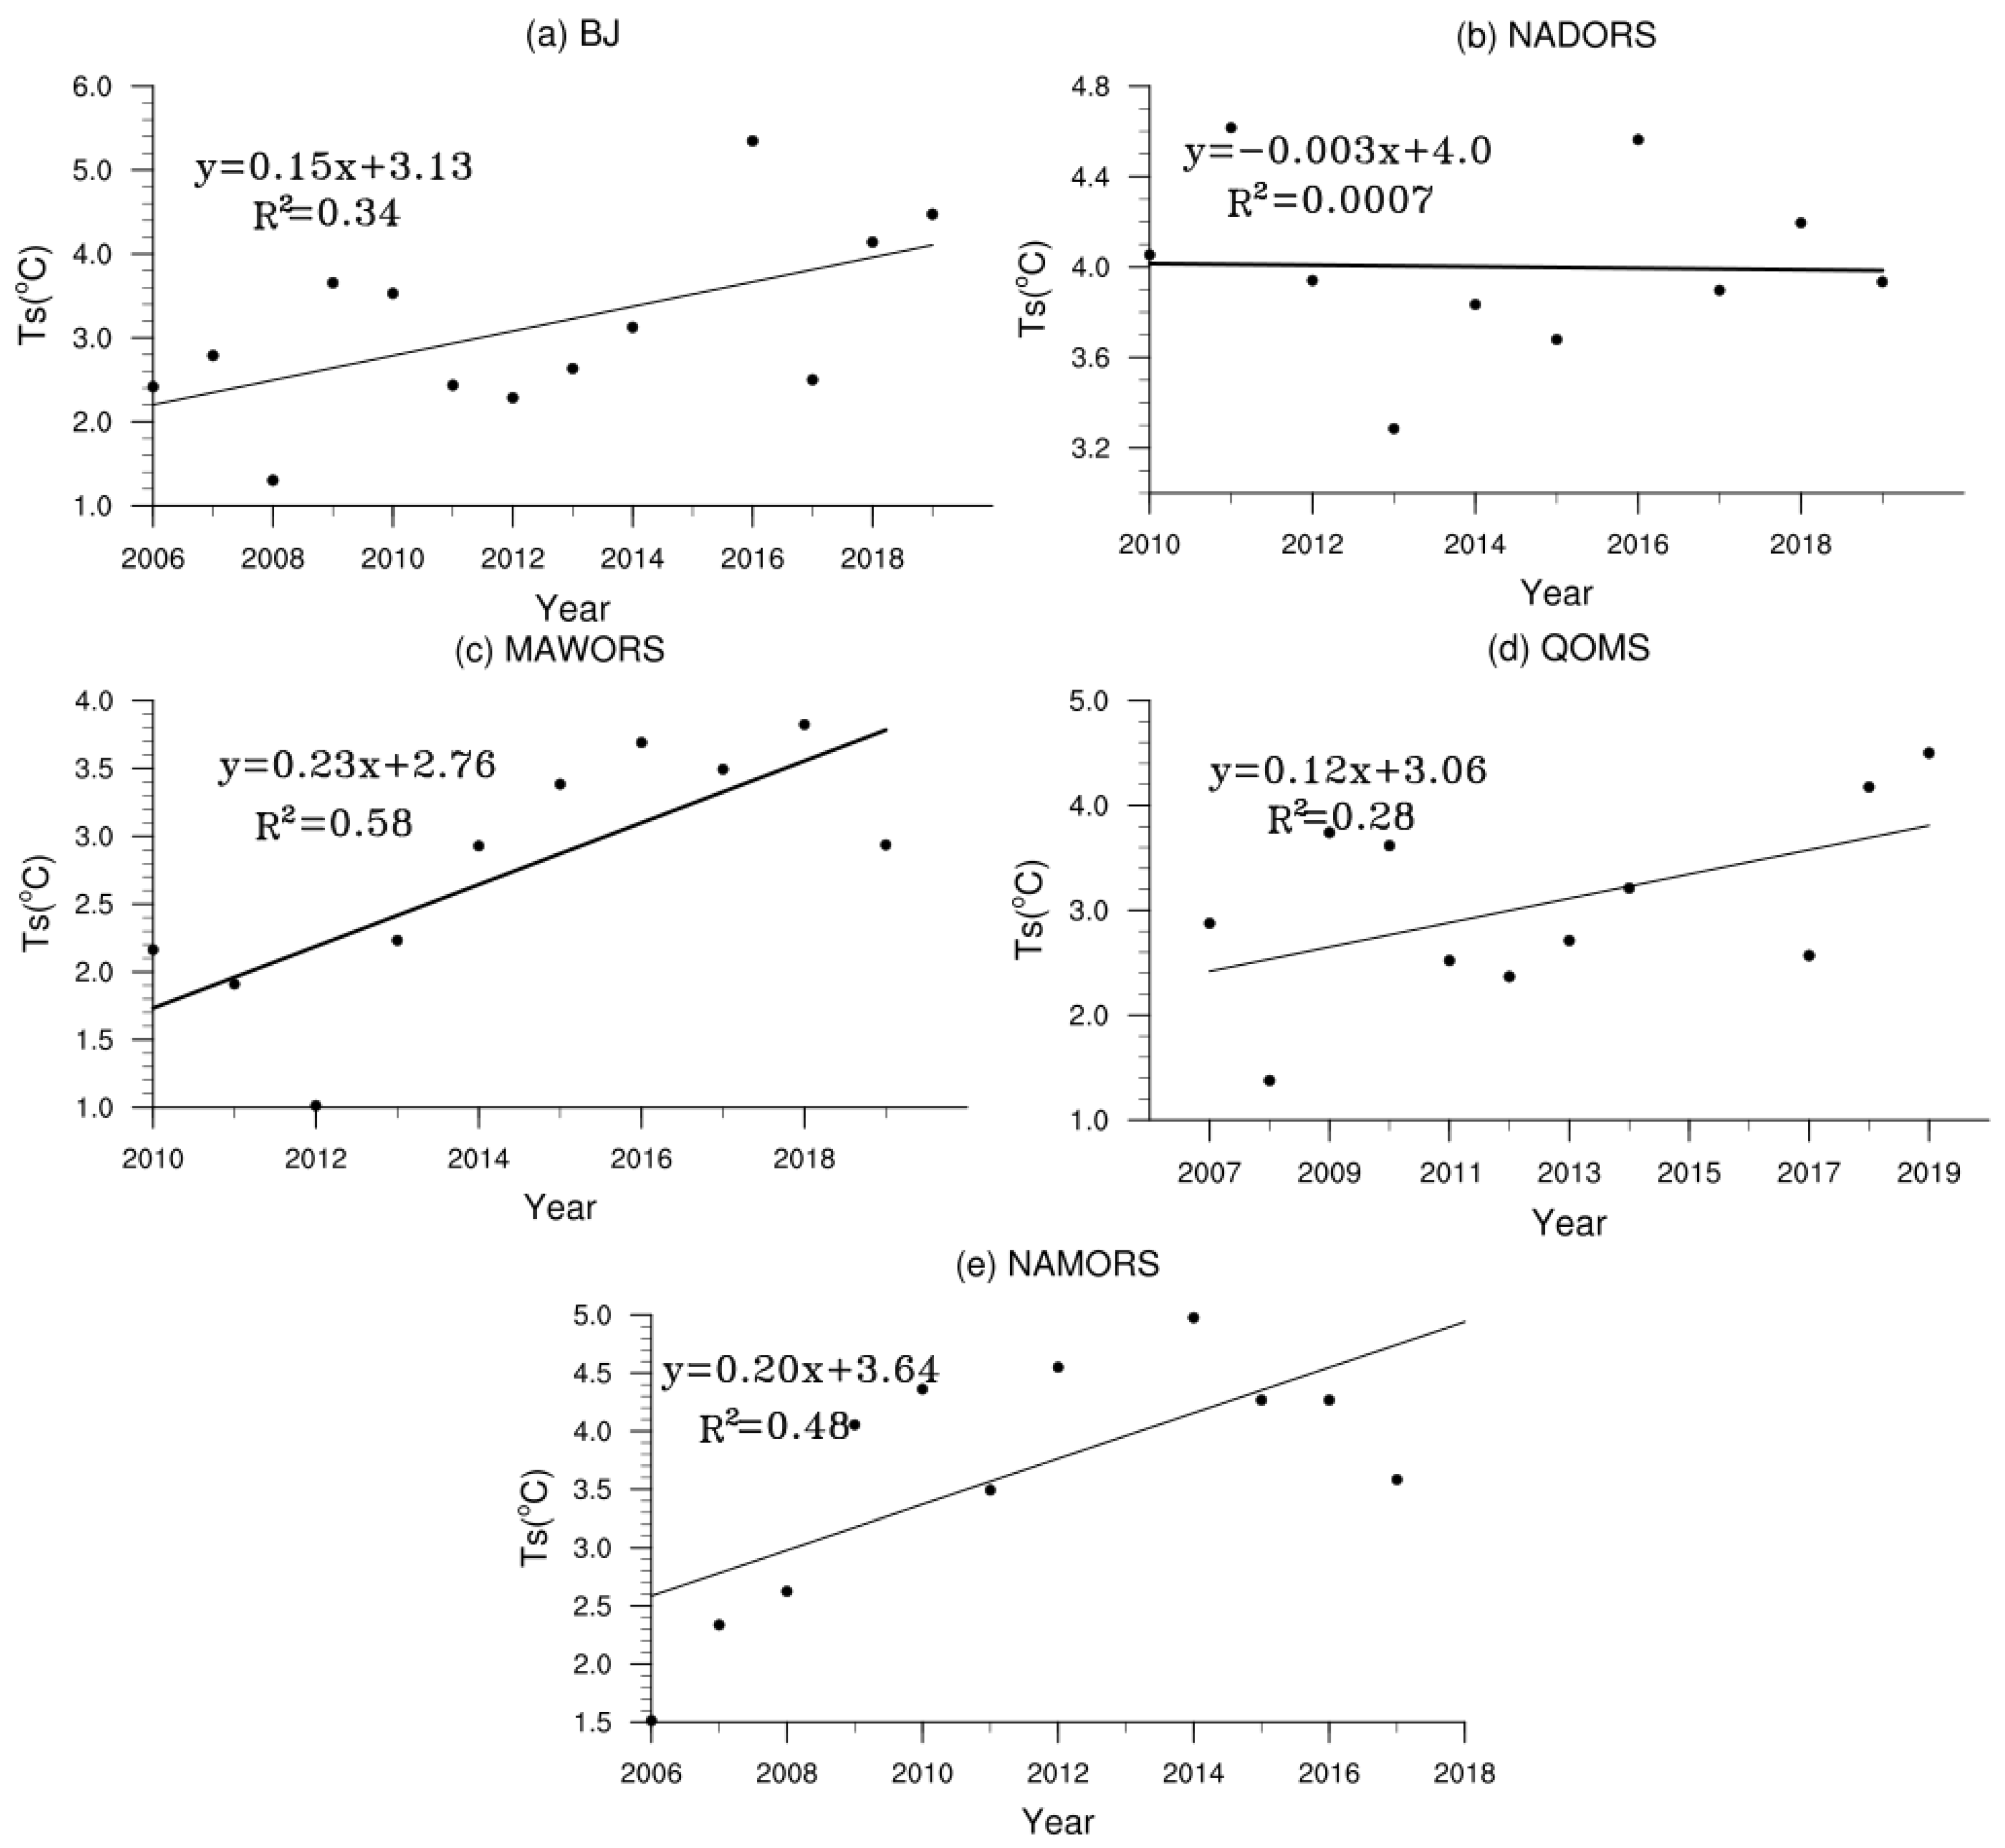
The inter-annual variations in surface temperature at each station (Figure 22) followed similar patterns to the upward longwave radiation and fluctuated between 1.2 °C and 5.5 °C. The surface temperature at BJ, MAWORS, QOMS, and NAMORS showed an increasing trend. The surface temperature at NADORS showed a decreasing trend from 2011 to 2013 and an increasing trend from 2013 to 2019.
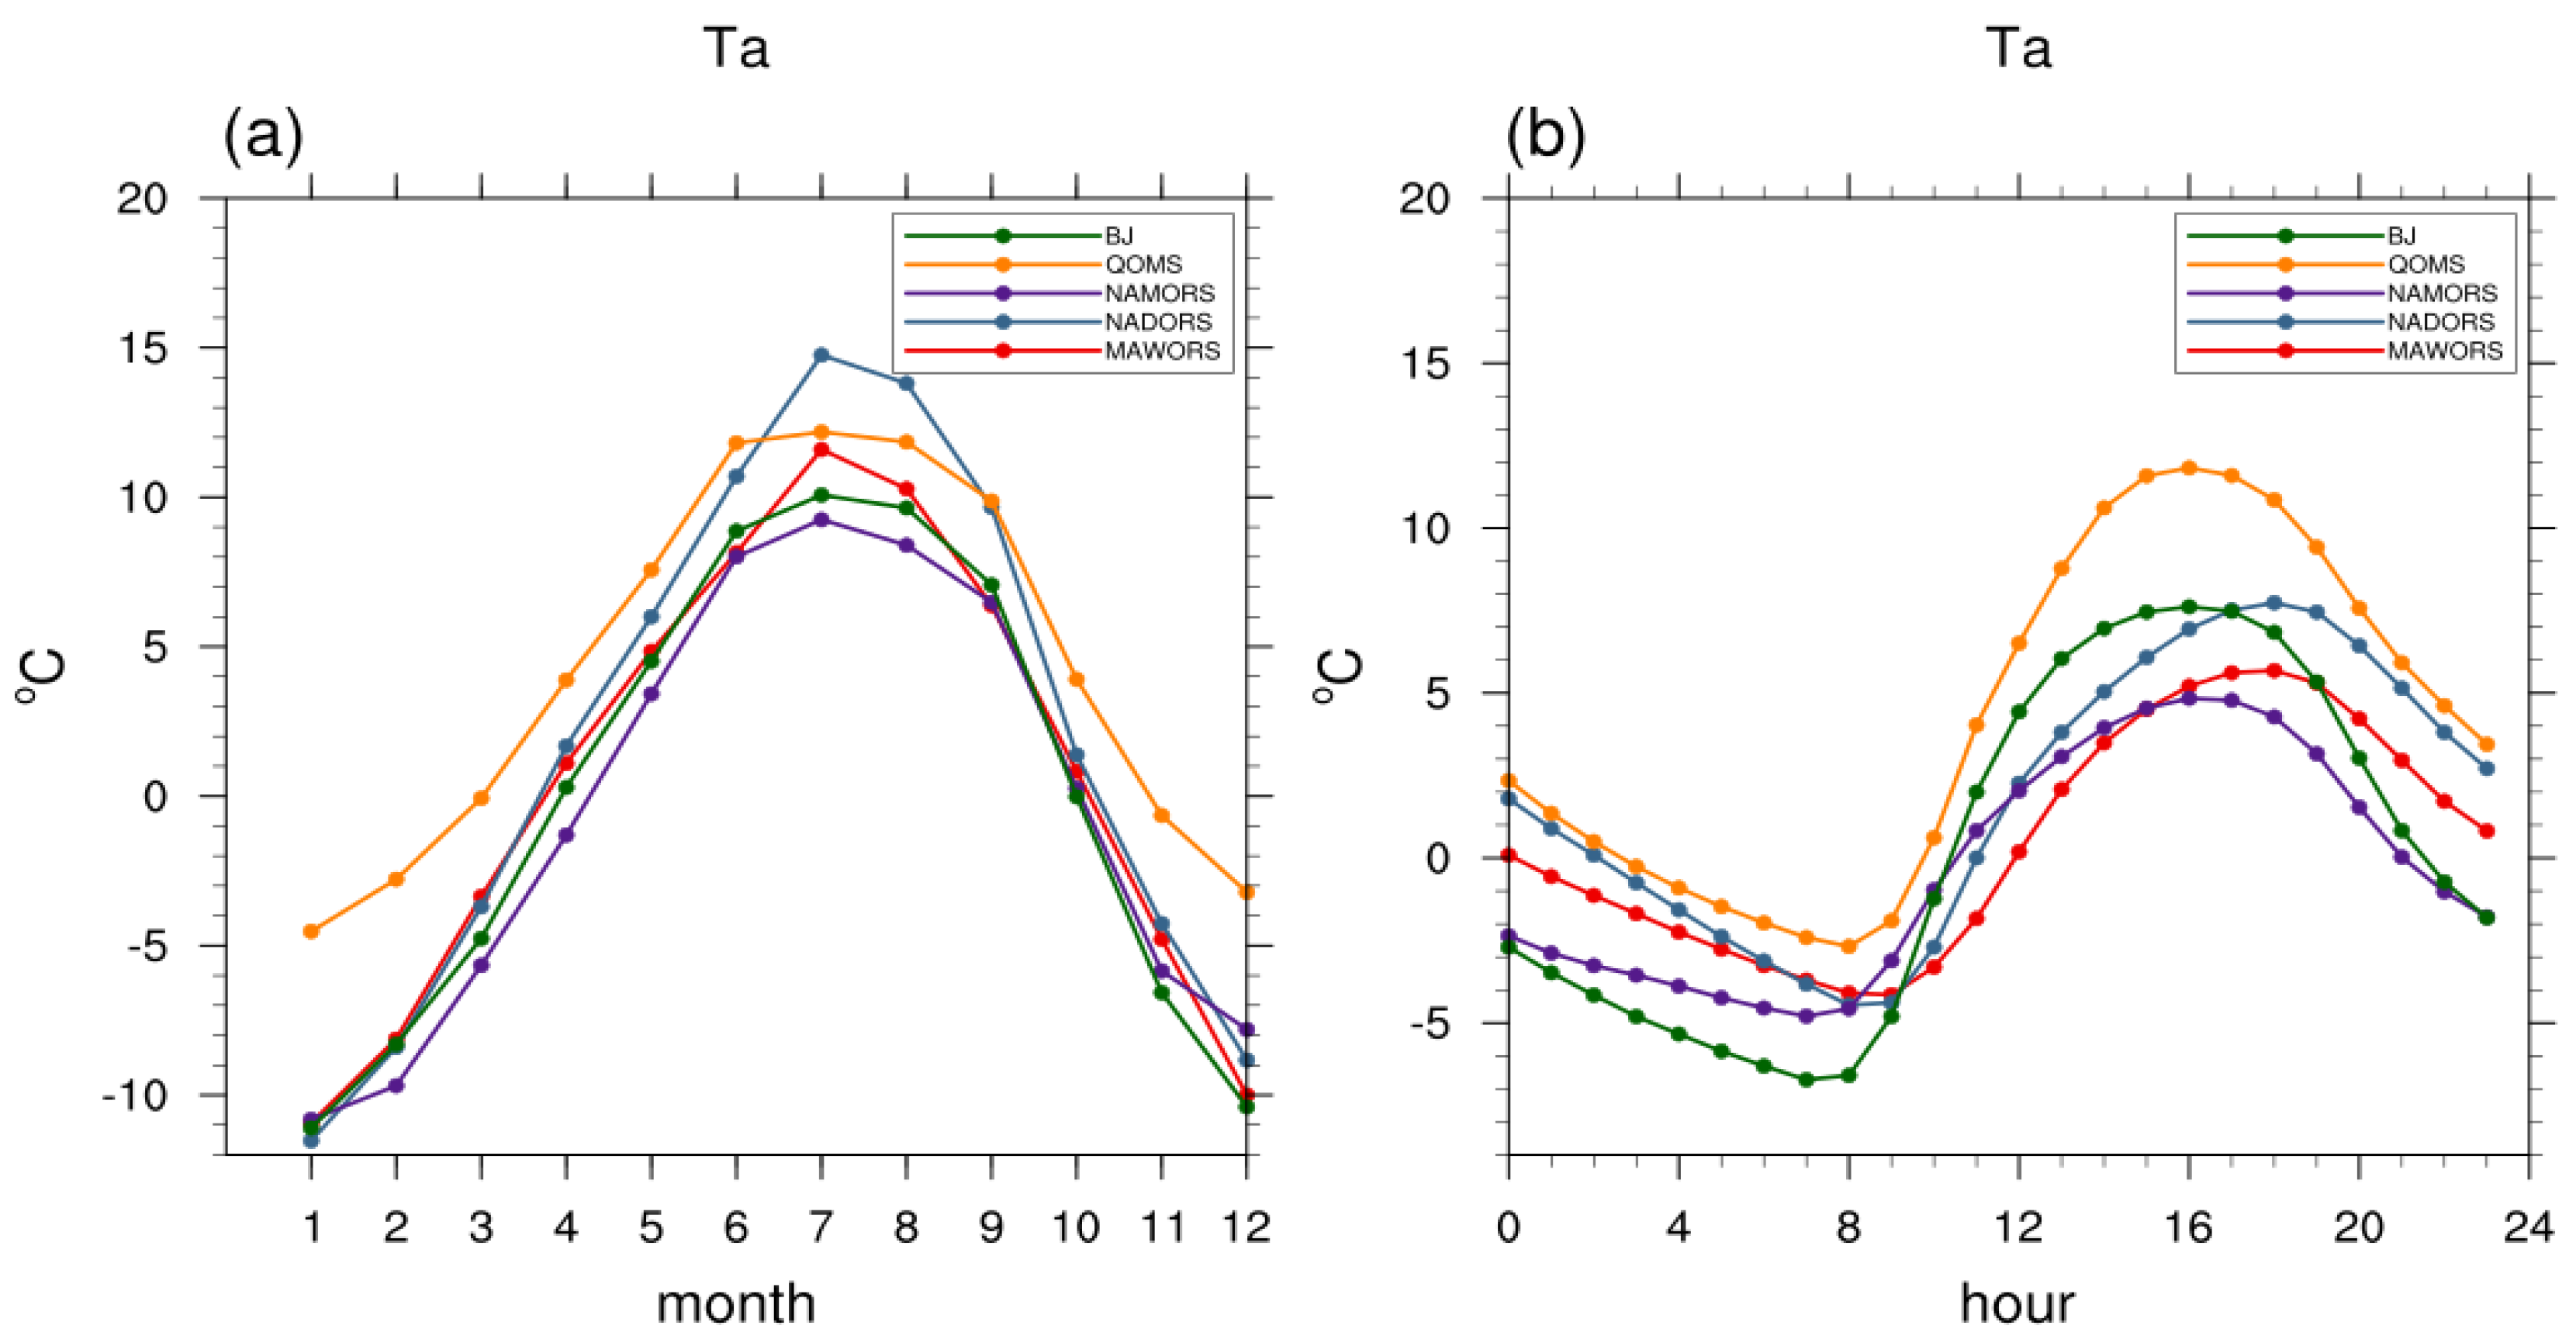
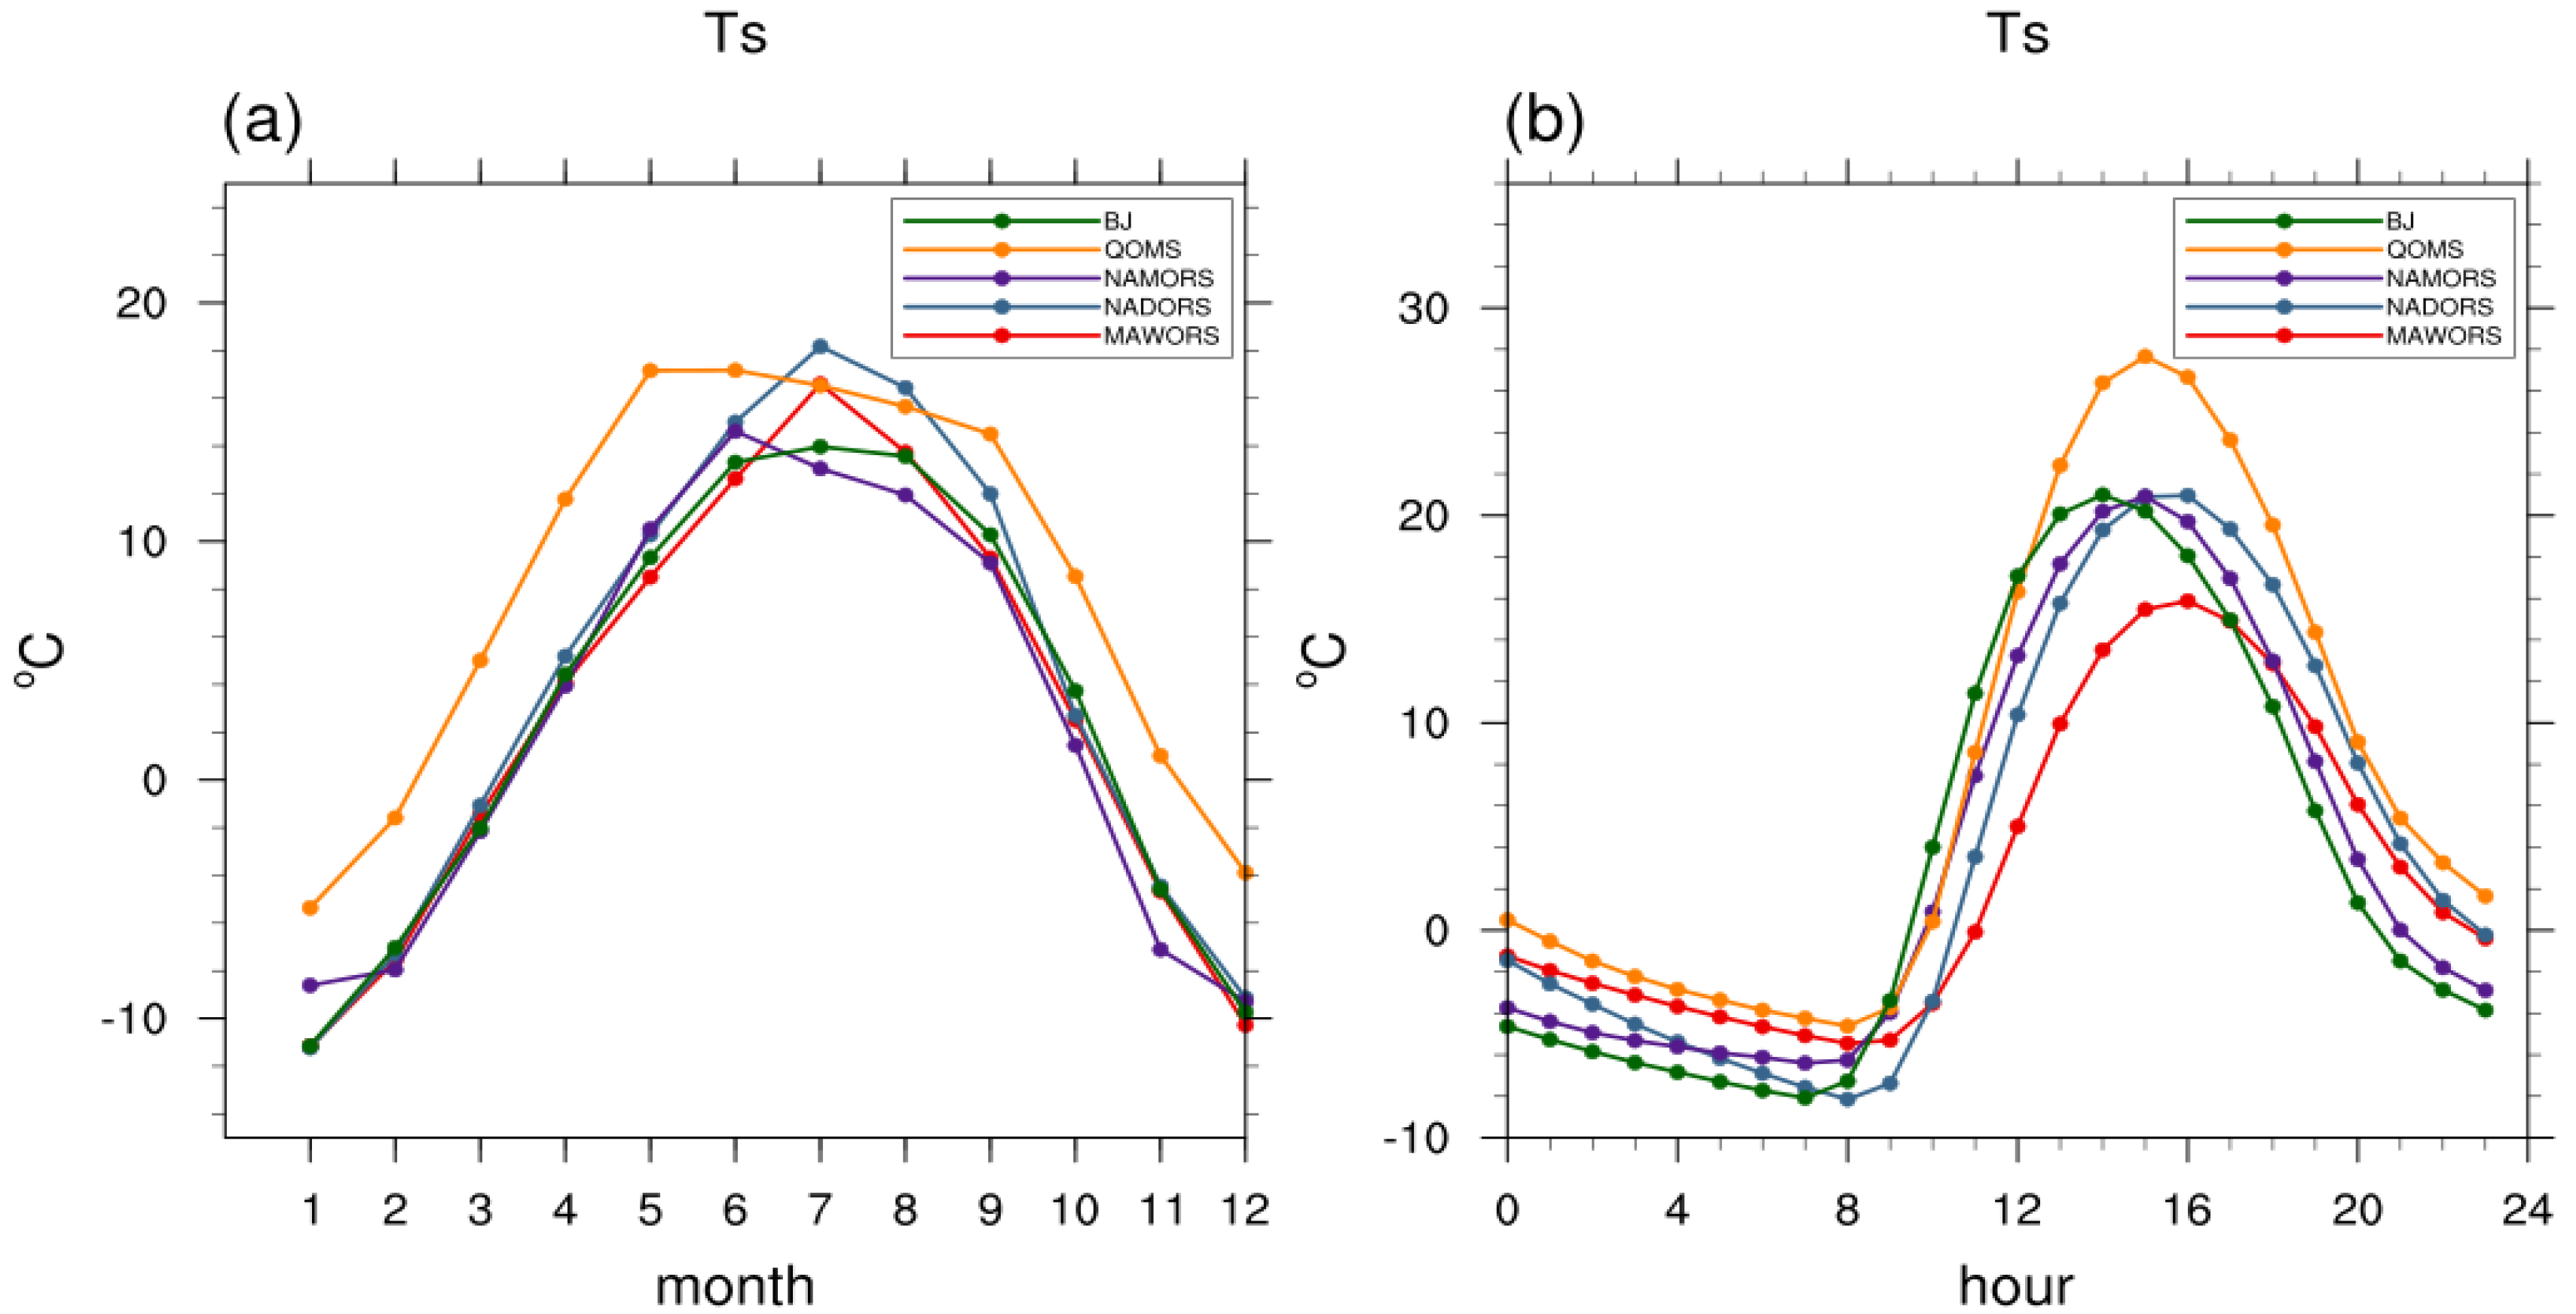
The annual variation of surface temperature at each station (Figure 23a) was similar to those of the net radiation. Surface temperatures peaked in June and July, between 17 °C and 20 °C. The minimum reached in January was between −7 °C and −12 °C. From November to March, the surface temperature was less than 0 °C.
Diurnal variations in surface temperature (Figure 23b) were similar at all stations and slightly lagged the downward shortwave radiation. The surface temperature peaked between 14:00 and 16:00 and reached its minimum at around 8:00. The surface temperature was below 0 °C from 0:00 to 10:00. Diurnal temperature ranges were relatively large, reaching 30 °C. The surface temperature was highest at QOMS, the southernmost station, and lowest at MAWORS, the northernmost station.
3.8. Air Temperature
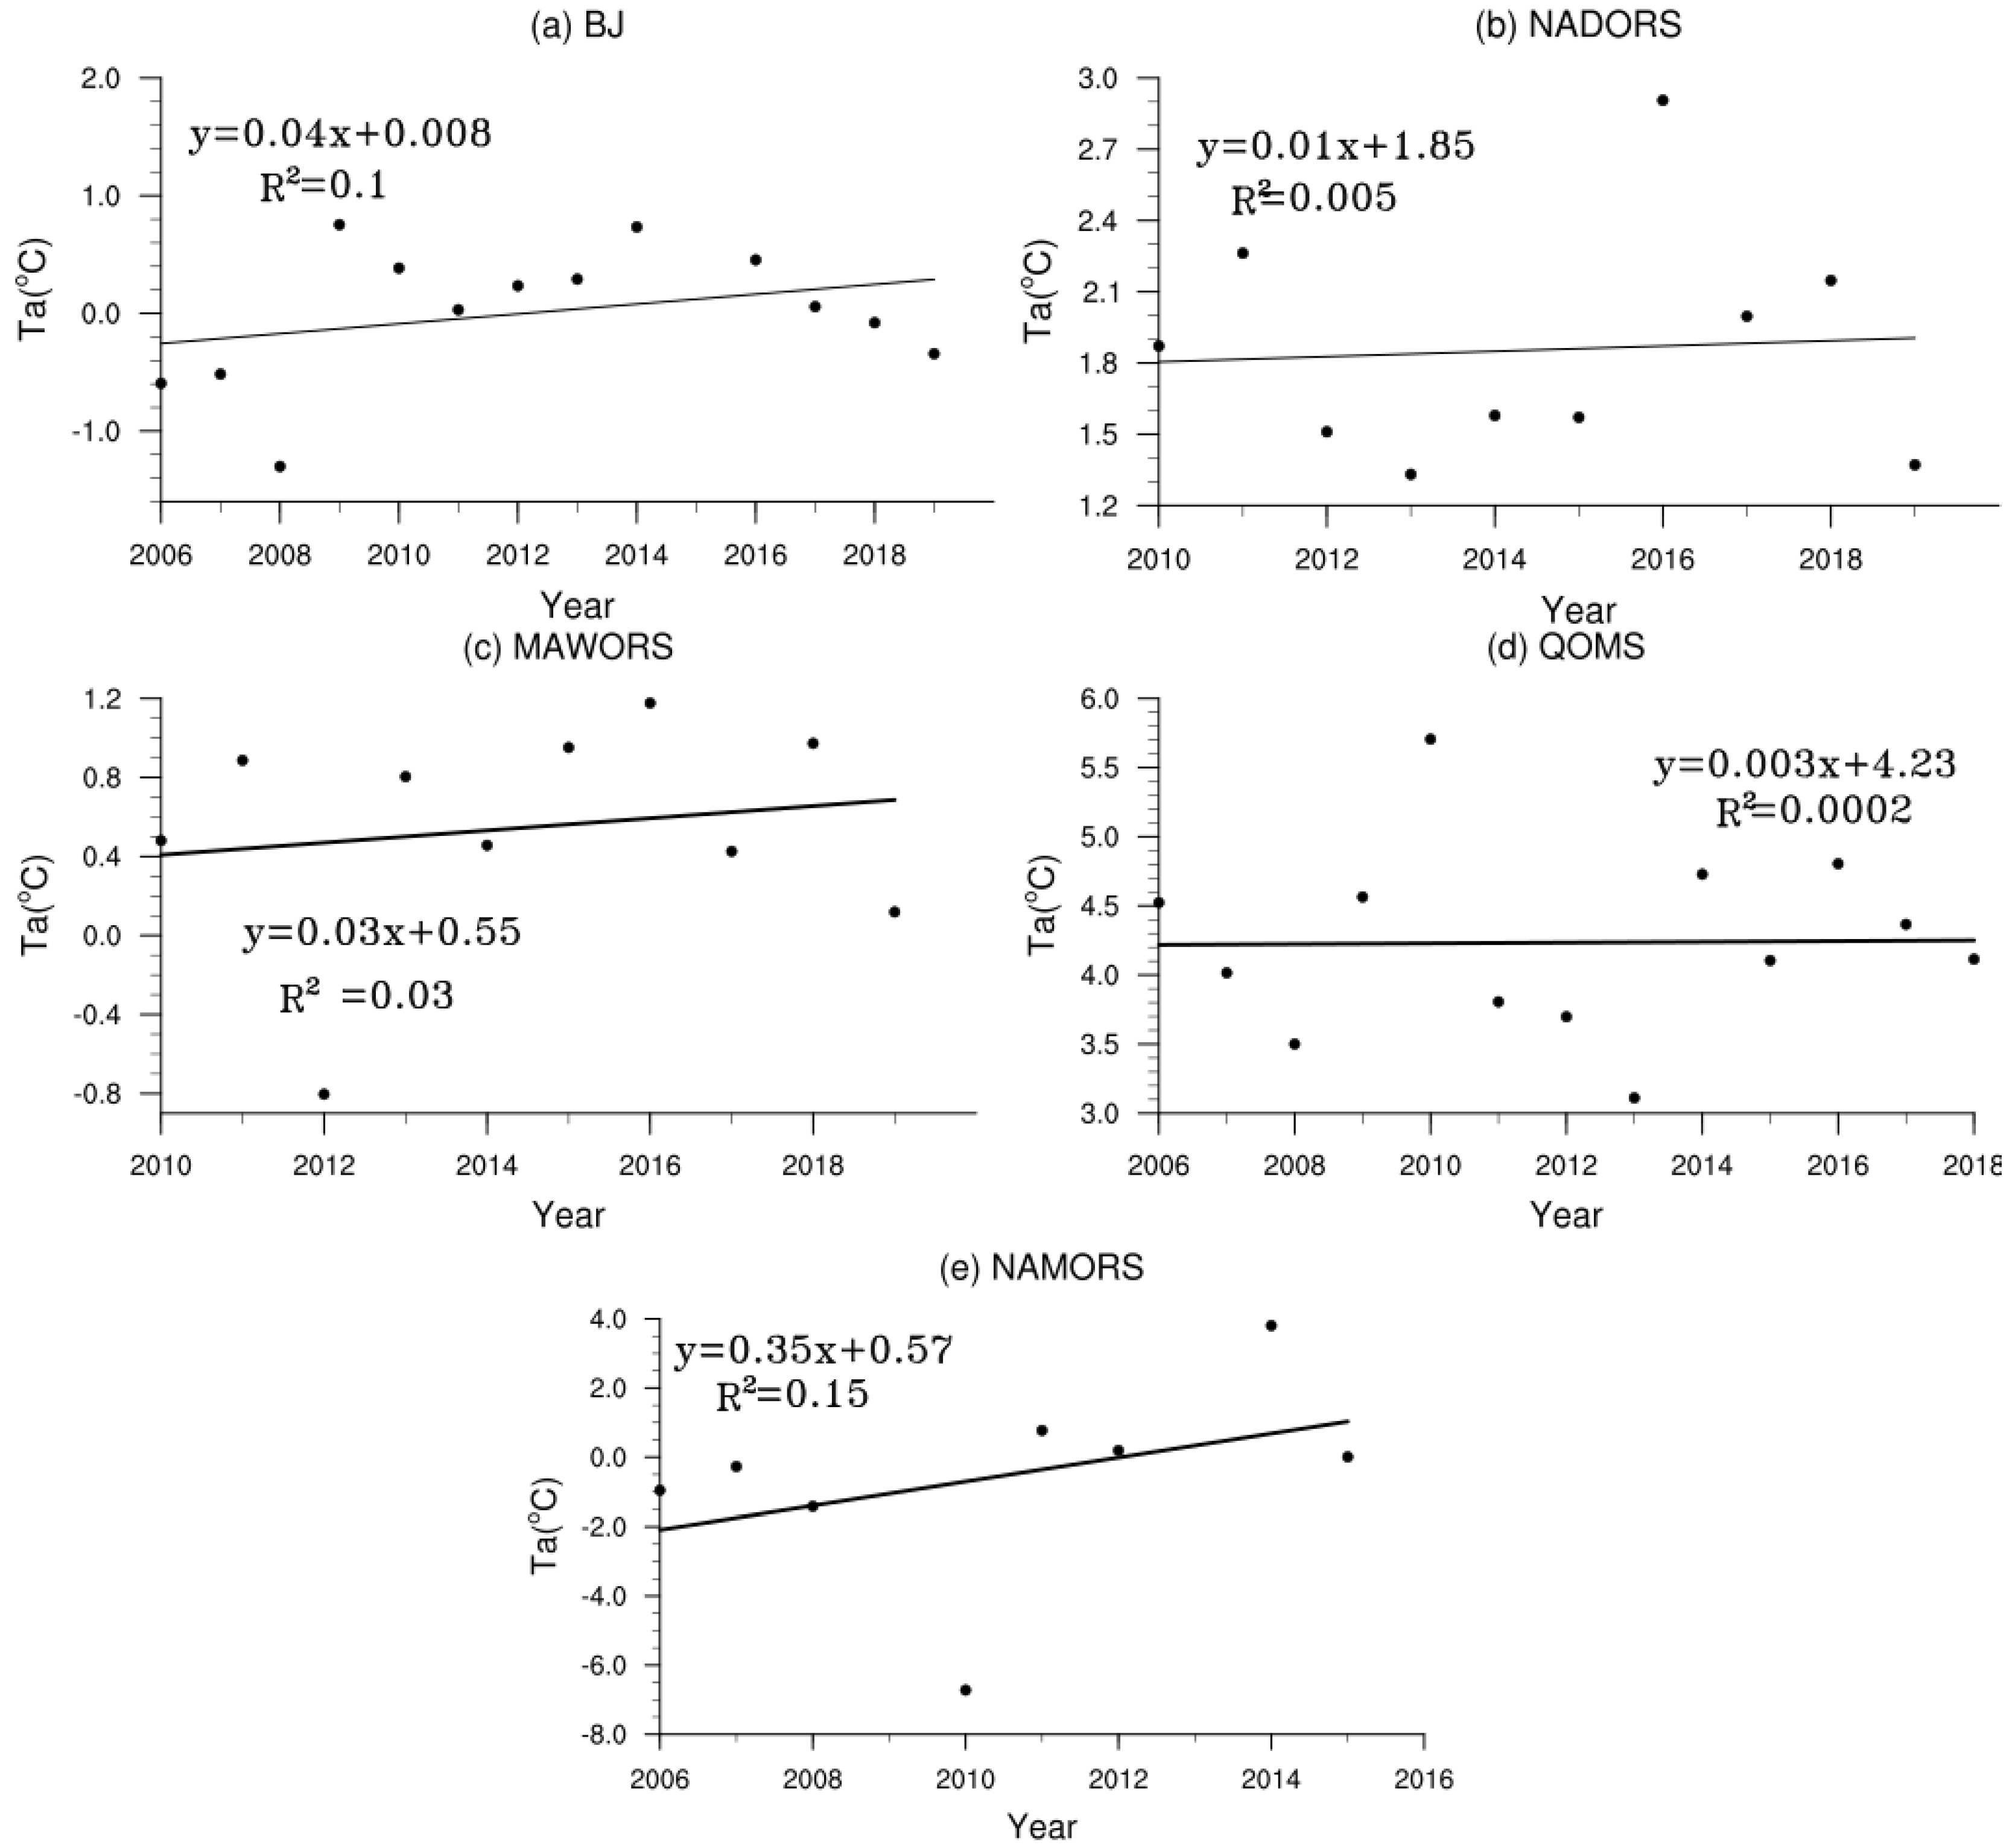
Inter-annual variations in air temperature (Figure 24) fluctuated from −1 °C to 5.5 °C. The air temperature at BJ, MAWORS, and NAMORS showed an increasing trend, consistent with the trend of surface temperature. Air temperature at NADORS showed an increasing trend from 2011 to 2013 and a decreasing trend from 2013 to 2019. The increasing air temperature trends at the above stations were consistent with the global warming trend. There was no significant air temperature trend at QOMS.
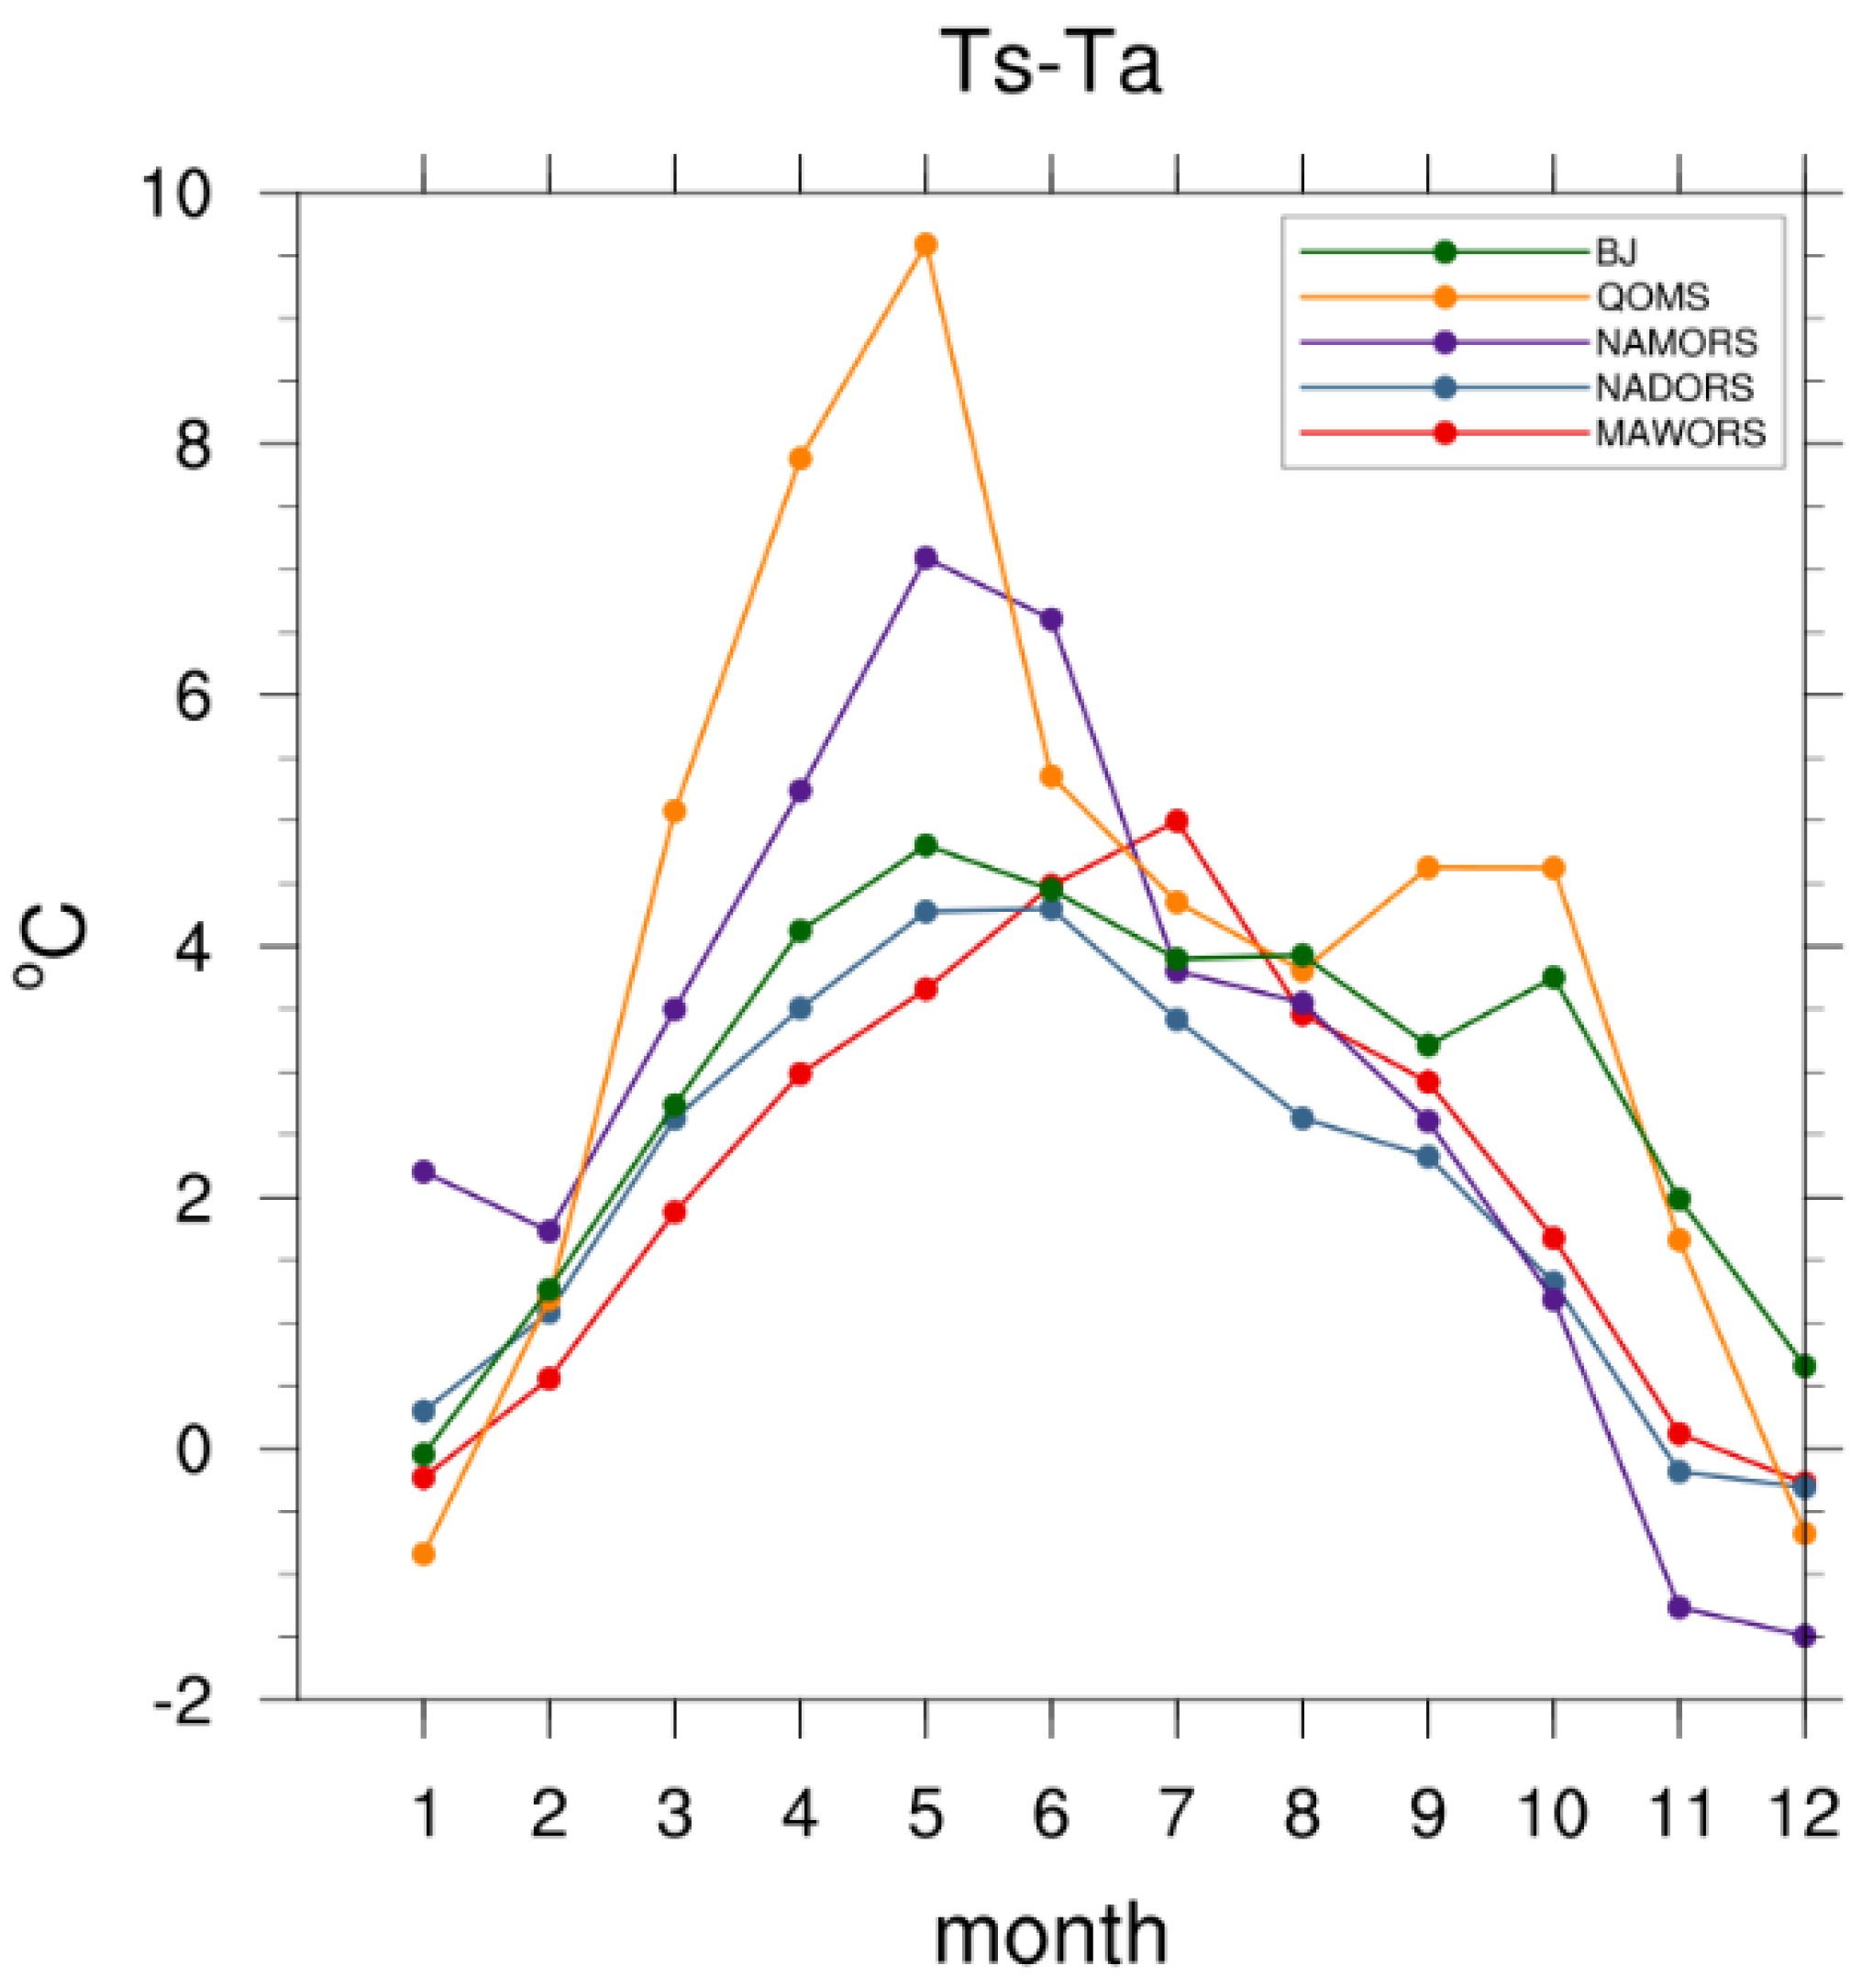
Annual variations in air temperature were similar at each station (Figure 12a), reaching a maximum around July and a minimum around January. From October to March, the air temperature was below 0 °C. The MAWORS was less affected by the summer monsoon, and the difference between surface temperature and surface air temperature reached its maximum in July(Figure 25). The difference between surface temperature and surface air temperature at BJ, QOMS, NADORS, and NAMORS reached a maximum in spring(Figure 25), before the outbreak of the summer monsoon: at this time, surface vegetation growth had not yet commenced and the soil moisture was low. In addition, because the sensible heat flux is directly proportional to the difference between surface temperature and surface air temperature, the surface sensible heat transfer to the atmosphere was strong in spring. QOMS was significantly affected by the summer monsoon, the surface vegetation was sparse, soil moisture was low, and this station showed the strongest difference between surface temperature and surface air temperature.
Diurnal air temperature variations at each station (Figure 12b) reached a minimum between 8:00 and 9:00 and a maximum between 16:00 and 18:00. Following sunrise between 8:00 and 9:00, downward shortwave radiation became positive. At this time, the net radiation was still negative, and the air and surface temperatures at each station reached their daily minima. As the solar altitude angle increased, the downward shortwave radiation, surface temperature, and air temperature all increased. Between 13:00 and 15:00, the downward shortwave radiation and net radiation reached their diurnal maxima. Subsequently, the downward shortwave radiation started to weaken, but the energy gained at the surface was still more than that lost by the emission of upward longwave radiation. Therefore, the surface temperature continued to rise while the net surface energy balance remained positive, reaching a peak between 16:00 and 18:00.
4. Concluding Remarks
In this paper, the diurnal, annual, and inter-annual variations in downward shortwave radiation, upward shortwave radiation, downward longwave radiation, upward longwave radiation, surface albedo, net radiation, surface temperature, and air temperature of typical surfaces (alpine meadow, alpine desert, and alpine steppe) were analyzed using ground observations from 2006 to 2019 at QOMS, SETORS, BJ, NAMORS, MAWORS, and NADORS. The conclusions from our analysis are as followings.
- The net radiation at each station (except SETORS) showed an increasing trend year by year. Although the upward longwave radiation at BJ, NADORS, MAWORS, QOMS, and NAMORS showed an increasing trend from 2013 to 2019, the downward longwave radiation also increased. Although the downward shortwave radiation at BJ and QOMS showed a decreasing inter-annual trend, probably due to an increase of cloudiness. The upward shortwave radiation increased due to decreasing downward shortwave radiation and increasing vegetation cover. Although the inter-annual downward shortwave radiation at NADORS and NAMORS fluctuated and decreased year by year, respectively. The upward shortwave radiation increased. At MAWORS, the downward shortwave radiation increased due to decreasing cloudiness and upward shortwave radiation decreased due to increasing vegetation cover.
- The net radiation of each station is maximum in summer and minimum in winter. In summer, although the downward shortwave radiation at BJ, NADORS, QOMS, and NAMORS was slightly lower than that in spring (under the influence of monsoon), the upward shortwave radiation was lower than that in spring. The net radiation decreased with the declining total solar radiation in autumn, reaching an annual minimum in winter.
- The diurnal pattern of net radiation generally followed downward shortwave radiation. It showed positive values from 8:00 to 20:00 (range from 0 to 500 W·m−2). Moreover, diurnal variations in upward shortwave radiation were similar to those of downward shortwave radiation. Diurnal variations in upward longwave radiation show a peak between 15:00 and 16:00, slightly lagging the peak in downward shortwave radiation. The daily variation of downward longwave radiation at each station was small, ranging from 220 to 295 W·m−2.
- The surface albedo at each station was decreasing year by year due to stronger vegetation growth under global warming. The annual change in surface albedo at each station followed a “U” shape. In winter, the ground was frozen, and the surface albedo was large. During the plant growth period from May to September, the surface albedo was small and showed little change. The daily variation of surface albedo at each station was also “U” shaped. The grass height at SETORS can reach 30 to 40 cm in summer, thus, here, the surface albedo was the smallest of all the stations.
- The surface temperature at BJ, MAWORS, QOMS, NAMORS, and NADORS showed an increasing trend from 2013 to 2019. The annual variation of surface temperature at each station generally followed the changes in net radiation. The diurnal variation at each station was generally consistent with changes in upward longwave radiation and slightly lagged the downward shortwave radiation. The southernmost station (QOMS) had the highest surface temperature, and the northernmost station (MAWORS) had the lowest surface temperature.
- The air temperature at BJ, MAWORS, NAMORS, and NADORS showed an increasing trend from 2013 to 2019, consistent with the trend in surface temperature. The difference between surface temperature and surface air temperature at BJ, QOMS, NADORS, and NAMORS was maximum in spring before the monsoon outbreak. There was strong sensible heat transport from the surface to the atmosphere in spring. The difference between surface temperature and surface air temperature at MAWORS was maximum in summer. QOMS had the largest difference between surface temperature and surface air temperature. The diurnal variation in surface temperature at each station slightly lagged behind changes in downward shortwave radiation, and the air temperature, in turn, slightly lagged behind the surface temperature.
In the absence of other modes of heat exchange, the net radiation determines the change in surface temperature. Surface temperature is an important parameter that describes the material exchange and energy balance between the surface and the atmosphere. Moreover, changes in air temperature can reflect the influence of the surface on the near-surface layer of the plateau. The variation characteristics of radiation fluxes, surface temperature, air temperature over the six stations in the Tibetan Plateau were derived in this study. The reasons for the variation of net radiation were analyzed in detail after analyzing each component of the radiation. This paper helps to enhance our understanding of land-atmosphere interactions and their influence on weather and climate in the Tibetan Plateau. However, due to the complex landscape of the Tibetan Plateau, we have to extend the results presented here to a broader perspective. In the other words, the results obtained in this study have to be compared to the analysis from more stations observation. All this research will be conducted in the coming days.
Author Contributions
Writing—original draft preparation, C.W.; formal analysis, C.W.; data curation, B.W., W.M., X.C., C.H.; supervision, Y.M. All authors have read and agreed to the published version of the manuscript.
Funding
This research was funded by the National Natural Science Foundation of China (91837208). The Second Tibetan Plateau Scientific Expedition and Research (STEP) program (2019QZKK0103), the Strategic Priority Research Program of Chinese Academy of Sciences (XDA20060101).
Institutional Review Board Statement
Not applicable.
Informed Consent Statement
Not applicable.
Data Availability Statement
The data presented in this study are openly available in National Tibetan Plateau Data Center. Ma, Y. (2020). A long-term dataset of integrated land-atmosphere interaction observations on the Tibetan Plateau (2005–2016). DOI: 10.11888/Meteoro.tpdc.270910. CSTR: 18406.11.Meteoro.tpdc.270910.
Acknowledgments
We would like to thank Zhipeng Xie, Ling Yuan of Institute of Tibetan Plateau Research, Chinese Academy of Sciences, and Jiankai Zhang of Lanzhou University for their suggestions and help in this study.
Conflicts of Interest
The authors declare no conflict of interest.
Abbreviations
The following abbreviations are used in this manuscript:
| GAME/Tibet | GEWEX Asian Monsoon Experiment in the Tibetan Plateau |
| IOP | Intensification Observation Preriod |
| QOMS | Qomolangma Atmospheric and Environmental Observation and Research Station |
| SETORS | Southeast Tibetan Observation and Research Station for the Alpine Environment |
| BJ | BJ site of Nagqu Station of Plateau Climate and Environment |
| NAMORS | Nam Co Monitoring and Research Station for Multisphere Interaction |
| NADORS | Ngari Desert Observation and Research Station |
| MAWORS | Muztagh Ata Westerly Observation and Research Station |
References
- Qiu, J. The third pole. Nature 2008, 454, 393–396. [Google Scholar] [CrossRef] [Green Version]
- Liu, J.; Ding, L.; Zeng, L.; Paul, T.; Yves, G. Large-scale terrain analysis of selected regions of the Tibetan Plateau: Discussion on the origin of plateau planation surface. Earth Sci. Front. 2006, 13, 285–299. [Google Scholar]
- Zhang, Y.; Li, B.; Zheng, D. A discussion on the boundary and area of the Tibetan Plateau in China. Geogr. Res. 2002, 21, 128. [Google Scholar]
- Ma, Y.; Yao, T.; Hu, Z.; Wang, J. The Cooperative Study on Energy and Water Cycle over the Tibetan Plateau. Adv. Earth 2009, 24, 1280–1284. [Google Scholar]
- Yeh, T.; Lo, S.; Chu, P. The Wind Structure and Heat Balance in the Lower Troposphere over Tibetan Plateau. Inst. Meteorol. Geophys. 1957, 28, 108–121. [Google Scholar]
- Yanai, M.; Li, C. Mechanism of heating and the boundary layer over the Tibetan Plateau. Mon. Weather Rev. 1994, 122, 305–323. [Google Scholar] [CrossRef]
- Ma, Y.; Ma, W.; Hu, Z.; Li, M.; Wang, J.; Ishikawa, H.; Tsukamoto, O. Similarity Analysis of Atmospheric Turbulent Intensity over Grassland Surface of Qinghai-Xizang Plateau. Plateau Meteorol. 2002, 21, 514–517. [Google Scholar]
- Ma, Y.; Osamu, T.; Wu, X.; Tamagawa, I.; Wang, J.; Ishikaw, H.; Hu, Z.; Gao, H. Characteristics of Energy Transfer and Micrometeorology in the Surface Layer of the Atmosphere above Grassy Marshland of the Tibetan Plateau Area. Chin. J. Atmos. Sci. 2000, 24, 715–722. [Google Scholar]
- Ma, Y.; Osamu, T.; Wang, J.; Hirohiko, I.; Ichiro, T. Analysis of aerodynamic and thermodynamic parameters on the grassy marshland surface of Tibetan Plateau. Prog. Nat. Sci. 2002, 12, 38–42. [Google Scholar]
- Huang, F.; Ma, W.; Li, M.; Ma, Y. Analysis on responses of land surface temperature on the Northern Tibetan Plateau to climate change. Plateau Meteorol. 2016, 35, 55–63. [Google Scholar] [CrossRef]
- Ma, W.; Ma, Y.; Hu, Z.; Li, M.; Wang, J.; Qian, Z. Analyses on Surface Radiation Budget in Northern Tibetan Plateau. Plateau Meteorol. 2004, 23, 348–352. [Google Scholar]
- Ma, W.; Ma, Y.; Hu, Z.; Li, M.; Sun, F.; Gu, L.; Wang, J.; Qian, Z. The Contrast Between the Radiation Budget Plus Seasonal Variation and Remote Sensing Over the Northern Tibetan Plateau. J. Arid Land Resour. Environ. 2005, 19, 109–115. [Google Scholar]
- Philipona, R.; KRäUCHI, A.; Kivi, R.; Peter, T.; Wild, M.; Dirksen, R.; Fujiwara, M.; Sekiguchi, M.; Hurst, D.; Becker, R. Balloon-borne radiation measurements demonstrate radiative forcing by water vapor and clouds. Meteorol. Z. 2020, 29, 501–509. [Google Scholar] [CrossRef]
- Obregón, M.; Costa, M.; Silva, A.; Serrano, A. Spatial and temporal variation of aerosol and water vapour effects on solar radiation in the mediterranean basin during the last two decades. Remote Sens. 2020, 12, 1316. [Google Scholar] [CrossRef] [Green Version]
- Wang, Z.; Zhang, M.; Wang, L.; Qin, W.; Ma, Y.; Gong, W.; Yu, L. Investigating the all-sky surface solar radiation and its influencing factors in the Yangtze River Basin in recent four decades. Atmos. Environ. 2021, 244, 17888. [Google Scholar] [CrossRef]
- Jandaghian, Z.; Akbari, H. Effects of increasing surface reflectivity on aerosol, radiation, and cloud interactions in the urban atmosphere. Theor. Appl. Climatol. 2020, 139, 873–892. [Google Scholar] [CrossRef]
- You, Q.; Sanchez-Lorenzo, A.; Wild, M.; Folini, D.; Fraedrich, K.; Ren, G.; Kang, S. Decadal variation of surface solar radiation in the Tibetan Plateau from observations, reanalysis and model simulations. Clim. Dyn. 2013, 40, 2073–2086. [Google Scholar] [CrossRef]
- Wu, R.; Ma, Y. Comparative analyses on radiation characteristics in different areas over the Tibetan Plateau. Plateau Meteorol. 2010, 29, 251–259. [Google Scholar]
- Ma, Y.; Hu, Z.; Xie, Z.; Ma, W.; Wang, B.; Chen, X.; Li, M.; Zhong, L.; Sun, F.; Gu, L.; et al. A long-term (2005–2016) dataset of hourly integrated land-atmosphere interaction observations on the Tibetan Plateau. Earth Syst. Sci. Data 2020, 12, 2937–2957. [Google Scholar] [CrossRef]
- Liang, S. Quantitative Remote Sensing of Land Surfaces, 1st ed.; John Wiley & Sons, Inc: Hoboken, NJ, USA, 2003; ISBN 9780471281665. [Google Scholar]
- Gu, X.; Ma, Y.; Ma, W.; Sun, F. Climatic characteristics of surface radiation flux over the Qinghai-Tibetan Plateau. Plateau Meteorol. 2018, 37, 1458–1469. [Google Scholar] [CrossRef]
- Srivastava, A.; Rodriguez, J.; Saco, P.; Kumari, N.; Yetemen, O. Global Analysis of At-mospheric Transmissivity Using Cloud Cover, Aridity and Flux Network Datasets. Remote Sens. 2021, 13, 1716. [Google Scholar] [CrossRef]
- Baigorria, G.; Villegas, E.; Trebejo, I.; Carlos, J.; Quiroz, R. Atmospheric transmissivity: Distribution and empirical estimation around the central Andes. Int. J. Climatol. A J. R. Meteorol. Soc. 2004, 24, 1121–1136. [Google Scholar] [CrossRef]
- Tang, W.J.; Yang, K.; Qin, J.; Cheng, C.C.K.; He, J. Solar radiation trend across China in recent decades: A revisit with quality-controlled data. Atmos. Chem. Phys. 2011, 11, 393–406. [Google Scholar] [CrossRef] [Green Version]
- Yang, K.; Ding, B.; Qin, J.; Tang, W.; Lu, N.; Lin, C. Can aerosol loading explain the solar dimming over the Tibetan Plateau? Geophys. Res. Lett. 2012, 39, L20710. [Google Scholar] [CrossRef] [Green Version]
- Bounoua, L.; Collatz, G.; Los, S.; Sellers, P.; Dazlich, D.; Tucker, C.; Randall, D. Sensitivity of climate to changes in NDVI. J. Clim. 2000, 13, 2277–2292. [Google Scholar] [CrossRef] [Green Version]
- Chu, D.; Ma, W.; Zhaxi, D. Land Surface Albedo in the North Tibetan Plateau from Ground Observations and MODIS. Remote Sens. Technol. Appl. 2015, 30, 908–916. [Google Scholar] [CrossRef]
- Li, Y.; Hu, Z. A Study on Parameterization of Surface Albedo over Grassland Surface in the Northern Tibetan Plateau. Adv. Atmos. Sci. 2009, 26, 161–168. [Google Scholar] [CrossRef]
- Pang, G.; Chen, D.; Wang, X.; Lai, H. Spatiotemporal variations of land surface albedo and associated influencing factors on the Tibetan Plateau. Sci. Total Environ. 2021, 804, 150100. [Google Scholar] [CrossRef]
- Tian, L.; Zhang, Y.; Zhu, J. Decreased surface albedo driven by denser vegetation on the Tibetan Plateau. Environ. Res. Lett. 2014, 9, 104001. [Google Scholar] [CrossRef]
- Li, Y.; Zhao, L.; Zhou, H.; Xu, S.; Zhang, F. Changes in Reflected Radiation and Reflectivity for Growing Season of Alpine Swamp in the Northern Qinghai. J. Glaciol. Geocryol. 2007, 29, 137–143. [Google Scholar]
- Held, I.; Soden, B. Water vapor feedback and global warming. Annu. Rev. Energy Environ. 2000, 25, 441–475. [Google Scholar] [CrossRef] [Green Version]
- Stephens, G.L.; Wild, M.; Stackhouse, P.W., Jr.; Ecuyer, T.; Kato, S.; Henderson, D. The global character of the flux of downward longwave radiation. J. Clim. 2012, 25, 2329–2340. [Google Scholar] [CrossRef] [Green Version]
- Wang, Y.; Sheng, P.; Liu, S. Atmospheric Physics, 1st ed.; Meteorological Press: Beijing, China, 1987. [Google Scholar]
- Weng, D.; Chen, Y. Climatological Calculation of Downward Atmospheric Radiation for China and its Characteristic Distribution. J. Nanjing Inst. Meteorol. 1992, 15, 1–8. [Google Scholar] [CrossRef]
- Ouyang, B.; Che, T.; Dai, L.; Wang, Z. Estimating Mean Daily Surface Temperature over the Tibetan Plateau Based on MODIS LST Products. J. Glaciol. Geocryol. 2012, 34, 296–303. [Google Scholar]
Figure 1.
Instrument setup and subsurface conditions at the observation site [16].
Figure 1.
Instrument setup and subsurface conditions at the observation site [16].

Figure 2.
Surface emissivity and station distribution in the observation area.

Figure 3.
Flowchart representing the steps to process Rsd, Rsu, Albedo. Rsd is downward shortwave radiation, Rsu is upward shortwave radiation.
Figure 3.
Flowchart representing the steps to process Rsd, Rsu, Albedo. Rsd is downward shortwave radiation, Rsu is upward shortwave radiation.

Figure 4.
Relationship between the monthly average of downward shortwave radiation and the monthly average of cloud fraction. ** Significantly correlated at the 0.01 level (bilaterally).
Figure 4.
Relationship between the monthly average of downward shortwave radiation and the monthly average of cloud fraction. ** Significantly correlated at the 0.01 level (bilaterally).

Figure 5.
Interannual variation of downward shortwave radiation at each station.

Figure 6.
Interannual variation of cloud fraction at each station.

Figure 7.
Annual variation of downward shortwave radiation (a) and diurnal variation of downward shortwave radiation (b) at each station.
Figure 7.
Annual variation of downward shortwave radiation (a) and diurnal variation of downward shortwave radiation (b) at each station.

Figure 8.
Annual variation of upward shortwave radiation (a) and diurnal variation of upward shortwave radiation (b) at each station.
Figure 8.
Annual variation of upward shortwave radiation (a) and diurnal variation of upward shortwave radiation (b) at each station.

Figure 9.
Interannual variation of upward shortwave radiation at each station.

Figure 10.
Interannual variation of NDVI at each station.

Figure 11.
Annual variation of NDVI at each station.

Figure 12.
Annual variation of air temperature (a) and diurnal variation of air temperature (b) at each station.
Figure 12.
Annual variation of air temperature (a) and diurnal variation of air temperature (b) at each station.

Figure 13.
Relationship between the monthly average of NDVI and the monthly average of surface albedo. ** Significantly correlated at the 0.01 level (bilaterally).
Figure 13.
Relationship between the monthly average of NDVI and the monthly average of surface albedo. ** Significantly correlated at the 0.01 level (bilaterally).

Figure 14.
Interannual variation of surface albedo at each station.

Figure 15.
Annual variation of surface albedo (a) and diurnal variation of surface albedo (b) at each station.
Figure 15.
Annual variation of surface albedo (a) and diurnal variation of surface albedo (b) at each station.

Figure 16.
Interannual variation of upward longwave radiation at each station.

Figure 17.
Annual variation of upward longwave radiation (a) and diurnal variation of upward longwave radiation (b) at each station.
Figure 17.
Annual variation of upward longwave radiation (a) and diurnal variation of upward longwave radiation (b) at each station.

Figure 18.
Interannual variation of downward longwave radiation at each station.

Figure 19.
Annual variation of downward longwave radiation (a) and diurnal variation of downward longwave radiation (b) at each station.
Figure 19.
Annual variation of downward longwave radiation (a) and diurnal variation of downward longwave radiation (b) at each station.

Figure 20.
Interannual variation of net radiation of each station.

Figure 21.
Annual variation of net radiation (a) and diurnal variation of net radiation (b) at each station.
Figure 21.
Annual variation of net radiation (a) and diurnal variation of net radiation (b) at each station.

Figure 22.
Interannual variation of surface temperature at each station.

Figure 23.
Annual variation of surface temperature (a) and diurnal variation of surface temperature (b) at each station.
Figure 23.
Annual variation of surface temperature (a) and diurnal variation of surface temperature (b) at each station.

Figure 24.
Interannual variation of air temperature at each station.

Figure 25.
Annual variation of the difference between surface temperature and surface air temperature at each station.
Figure 25.
Annual variation of the difference between surface temperature and surface air temperature at each station.


Table 1.
List of the geographic characteristics of the six sites [19].
Table 1.
List of the geographic characteristics of the six sites [19].
| Site | Latitude | Longitude | Elevation (m) | Land Cover |
|---|---|---|---|---|
| QOMS | 28.36° N | 86.95° E | 4298 | Alpine desert |
| SETORS | 29.77° N | 94.74° E | 3327 | Alpine meadow |
| BJ | 31.37° N | 91.90° E | 4509 | Alpine meadow |
| NAMORS | 30.77° N | 90.96° E | 4730 | Alpine steppe |
| NADORS | 33.39° N | 79.70° E | 4270 | Alpine desert |
| MAWORS | 38.42° N | 75.03° E | 3668 | Alpine desert |
Table 2.
List of the detailed information on observation items [19].
Table 2.
List of the detailed information on observation items [19].
| Site | Variables | Sensors Models | Manufacturers | Period |
|---|---|---|---|---|
| BJ | Air temperature | HMP45D | Vaisala | 2006–2014 |
| HMP155 | Vaisala | 2016–2019 | ||
| Radiations | CM21 for shortwave radiation PIR for longwave radiation | Kipp and Zonen Eppley | 2006–2019 | |
| QOMS | Air temperature | HMP45C-GM | Vaisala | 2006–2019 |
| Radiations | CNR1 | Kipp and Zonen | 2006–2019 | |
| SETORS | Air temperature | HMP45C-GM | Vaisala | 2006–2019 |
| Radiations | CNR1 | Kipp and Zonen | 2006–2019 | |
| NADORS | Air temperature | HMP45C | Vaisala | 2006–2019 |
| Radiations | NR01 | Kipp and Zonen | 2006–2019 | |
| MAWORS | Air temperature | HMP155A | Vaisala | 2006–2019 |
| Radiations | NR01 | Kipp and Zonen | 2006–2019 | |
| NAMORS | Air temperature | HMP45D | Vaisala | 2006–2019 |
| Radiations | CMP6 | Vaisala | 2006–2019 |
Publisher’s Note: MDPI stays neutral with regard to jurisdictional claims in published maps and institutional affiliations. |
© 2021 by the authors. Licensee MDPI, Basel, Switzerland. This article is an open access article distributed under the terms and conditions of the Creative Commons Attribution (CC BY) license (https://creativecommons.org/licenses/by/4.0/).
Share and Cite
MDPI and ACS Style
Wang, C.; Ma, Y.; Wang, B.; Ma, W.; Chen, X.; Han, C. Analysis of the Radiation Fluxes over Complex Surfaces on the Tibetan Plateau. Water 2021, 13, 3084. https://doi.org/10.3390/w13213084
AMA Style
Wang C, Ma Y, Wang B, Ma W, Chen X, Han C. Analysis of the Radiation Fluxes over Complex Surfaces on the Tibetan Plateau. Water. 2021; 13(21):3084. https://doi.org/10.3390/w13213084
Chicago/Turabian StyleWang, Chunxiao, Yaoming Ma, Binbin Wang, Weiqiang Ma, Xuelong Chen, and Cunbo Han. 2021. "Analysis of the Radiation Fluxes over Complex Surfaces on the Tibetan Plateau" Water 13, no. 21: 3084. https://doi.org/10.3390/w13213084
Note that from the first issue of 2016, this journal uses article numbers instead of page numbers. See further details here.