
Major-Ion Chemistry and Quality of Water in Rivers of Northern West Siberia
by
 , , ,
, , ,
Irina Ivanova
1,* ,
,
Oleg Savichev
1,2,
Nikolay Trifonov
1,
Yulia V. Kolubaeva
1 and
Natalia Volkova
1 1
Tomsk Branch of the Trofimuk Institute of Petroleum Geology and Geophysics, Siberian Branch of Russian Academy of Sciences, 634055 Tomsk, Russia
2
School of Earth Sciences and Engineering, National Research Tomsk Polytechnic University, 634050 Tomsk, Russia
*
Author to whom correspondence should be addressed.
Water 2021, 13(21), 3107; https://doi.org/10.3390/w13213107
Submission received: 24 September 2021
/
Revised: 25 October 2021
/
Accepted: 2 November 2021
/
Published: 4 November 2021
(This article belongs to the Special Issue Insights into Organic Carbon, Iron, Metals and Phosphorus Dynamics in Freshwaters)
Abstract
:This study reports a synthesis of years-long hydrogeochemical monitoring in northern West Siberia, performed by the Russian Meteorological Service (Rosgidromet) and several academic institutions. Natural factors and intensive human economic activity lead to the disruption of the ecosystems of the northern territories of Western Siberia. The aim of this study is to estimate the background water chemistry parameters in the rivers of northern West Siberia in the beginning of the 21st century. The mean values hydrochemical and geochemical indicators were determined with STATISTICA software, which can be used as background values in assessing the actual and allowable anthropogenic impact on water bodies. We revealed four water chemistry provinces: western Ob Gulf and Ob estuary catchments (I); eastern Ob Gulf and Taz Gulf catchments, except for the Taz River and its tributaries (II); Taz River catchments (III); Yenisei River catchments, right bank (IV). The major-ion chemistry of the sampled river waters records a combination of geological, geomorphological, and hydrological conditions in the four provinces. The features typical of the northern West Siberian Plain are especially prominent in province II, which has the lowest average total of major ions (Σmi), the highest chemical oxygen demand (potassium dichromate COD), and the highest contents of Fe and phosphates. The Σmi value is the highest in province IV. The river waters from four provinces share similarity in quite high organic contents (both potassium dichromate and permanganate COD), as well as high NH4+ and Fe. The long-term average Σmi of the waters is predicted not to change much in the coming one or two decades, though it may decrease slightly in the winter season but increase in the fall and spring time.
1. Introduction
The world is currently living through notable climate change evident in many regions, including the high latitudes and specifically the Kara Sea drainage basin [1,2,3,4,5,6,7,8,9,10,11,12,13]. The near-surface air temperatures in the northern territories are increasing faster than in the middle and tropic latitudes. Correspondingly, the warming causes prominent effects on permafrost, which appear as (i) permafrost thawing, especially near rivers and lakes; (ii) coastline erosion; (iii) inputs of highly saline waters from cryopegs into the water turnover; (iv) changes in the contours of surface watersheds and aquifers; (v) disturbed water-level phases [4,6,9,11,12,14,15,16,17,18,19,20,21]. The environment changes, probably, will entrain changes in the water and solid flow regimes [22], recharge patterns, and water–rock interaction, and thus affect the chemistry and quality of surface waters.
Huge reserves of fresh water are concentrated in Western Siberia, the ecological state of which has not been alarming until recently. However, the environmental problems of the Arctic territories are becoming more relevant, since natural factors and intensive human economic activity, which associated with the extraction of hydrocarbons, lead to the disruption of the ecosystems of the northern territories of Western Siberia. The river water quality is a very important factor concerning human health and aquatic ecosystems. The gradual decrease of river water quality is considered a serious concern because it threatens the sustainability of the aquatic ecosystem. In this respect, hydrogeochemical monitoring is an environmental issue of top priority [23]. Such monitoring can follow standard government programs by meteorological and environment agencies or make part of extended research programs with a large scope of parameters and conditions to check. In Russia the monitoring results are published on a regular basis in reports of the Ministry of Natural Resources and its departments [24,25,26]. The water quality and related environmental problems have had a large literature for the recent decades, but most of the available publications focus on specific localities and water bodies (commonly lakes), or on a limited number of parameters. Some publications deal with long rivers (most often estuaries), which straddle several climate zones, but zonal variations remain overlooked [1,2,3,7,11,12,15,20,27,28,29,30,31,32,33,34,35,36]. Thus, the modern state of rivers in the Kara Sea basin is yet poorly constrained.
The aim of this study is to estimate the background water chemistry parameters in the rivers of northern West Siberia in the beginning of the 21st century. For this purpose, additional water chemistry surveys were undertaken in the Kara basin by a joint team from the Tomsk Branch of the A.A. Trofimuk Institute of Petroleum Geology and Geophysics (Tomsk), Tomsk Polytechnical University, and Tomsk State University (Tomsk). The synthesis of our results and published evidence, including the reports of the Russian Meteorological Service (Rosgidromet), has provided the required information on the concentrations of dissolved elements, which can make basis for further assessment of climate change effects and anthropogenic loads associated with petroleum production.
2. Materials and Methods
2.1. Study Area
The territory of Northern West Siberia encompasses the Arctic, Subarctic, and temperate climate zones. The winter season generally lasts as long as seven to eight months, with monthly means of −23 to −29 °C, while the summer is within two months, and the mean July temperature is 10 to 14 °C. The amount of atmospheric precipitation increases from 300 to 550 mm/yr off the coast, out of which 40% is solid precipitation. The snow depth reaches 70–90 cm. The region is located in the West Siberian Plain, with a smooth terrain as low as 35–55 m above sea level. The dominant soil in the Taiga being podzols and sandy soils. Soils are represented mainly by Cryic Histosols, less often by Eutric Histosols, with thick organogenic horizons at the study area. The state of organogenic (peat) soil horizons significantly affects the depth of permafrost. This is a zone of continuous permafrost in the Yamal, Taz, and Gydan peninsulas and sporadic permafrost south of the peninsulas down to 64° N [37].
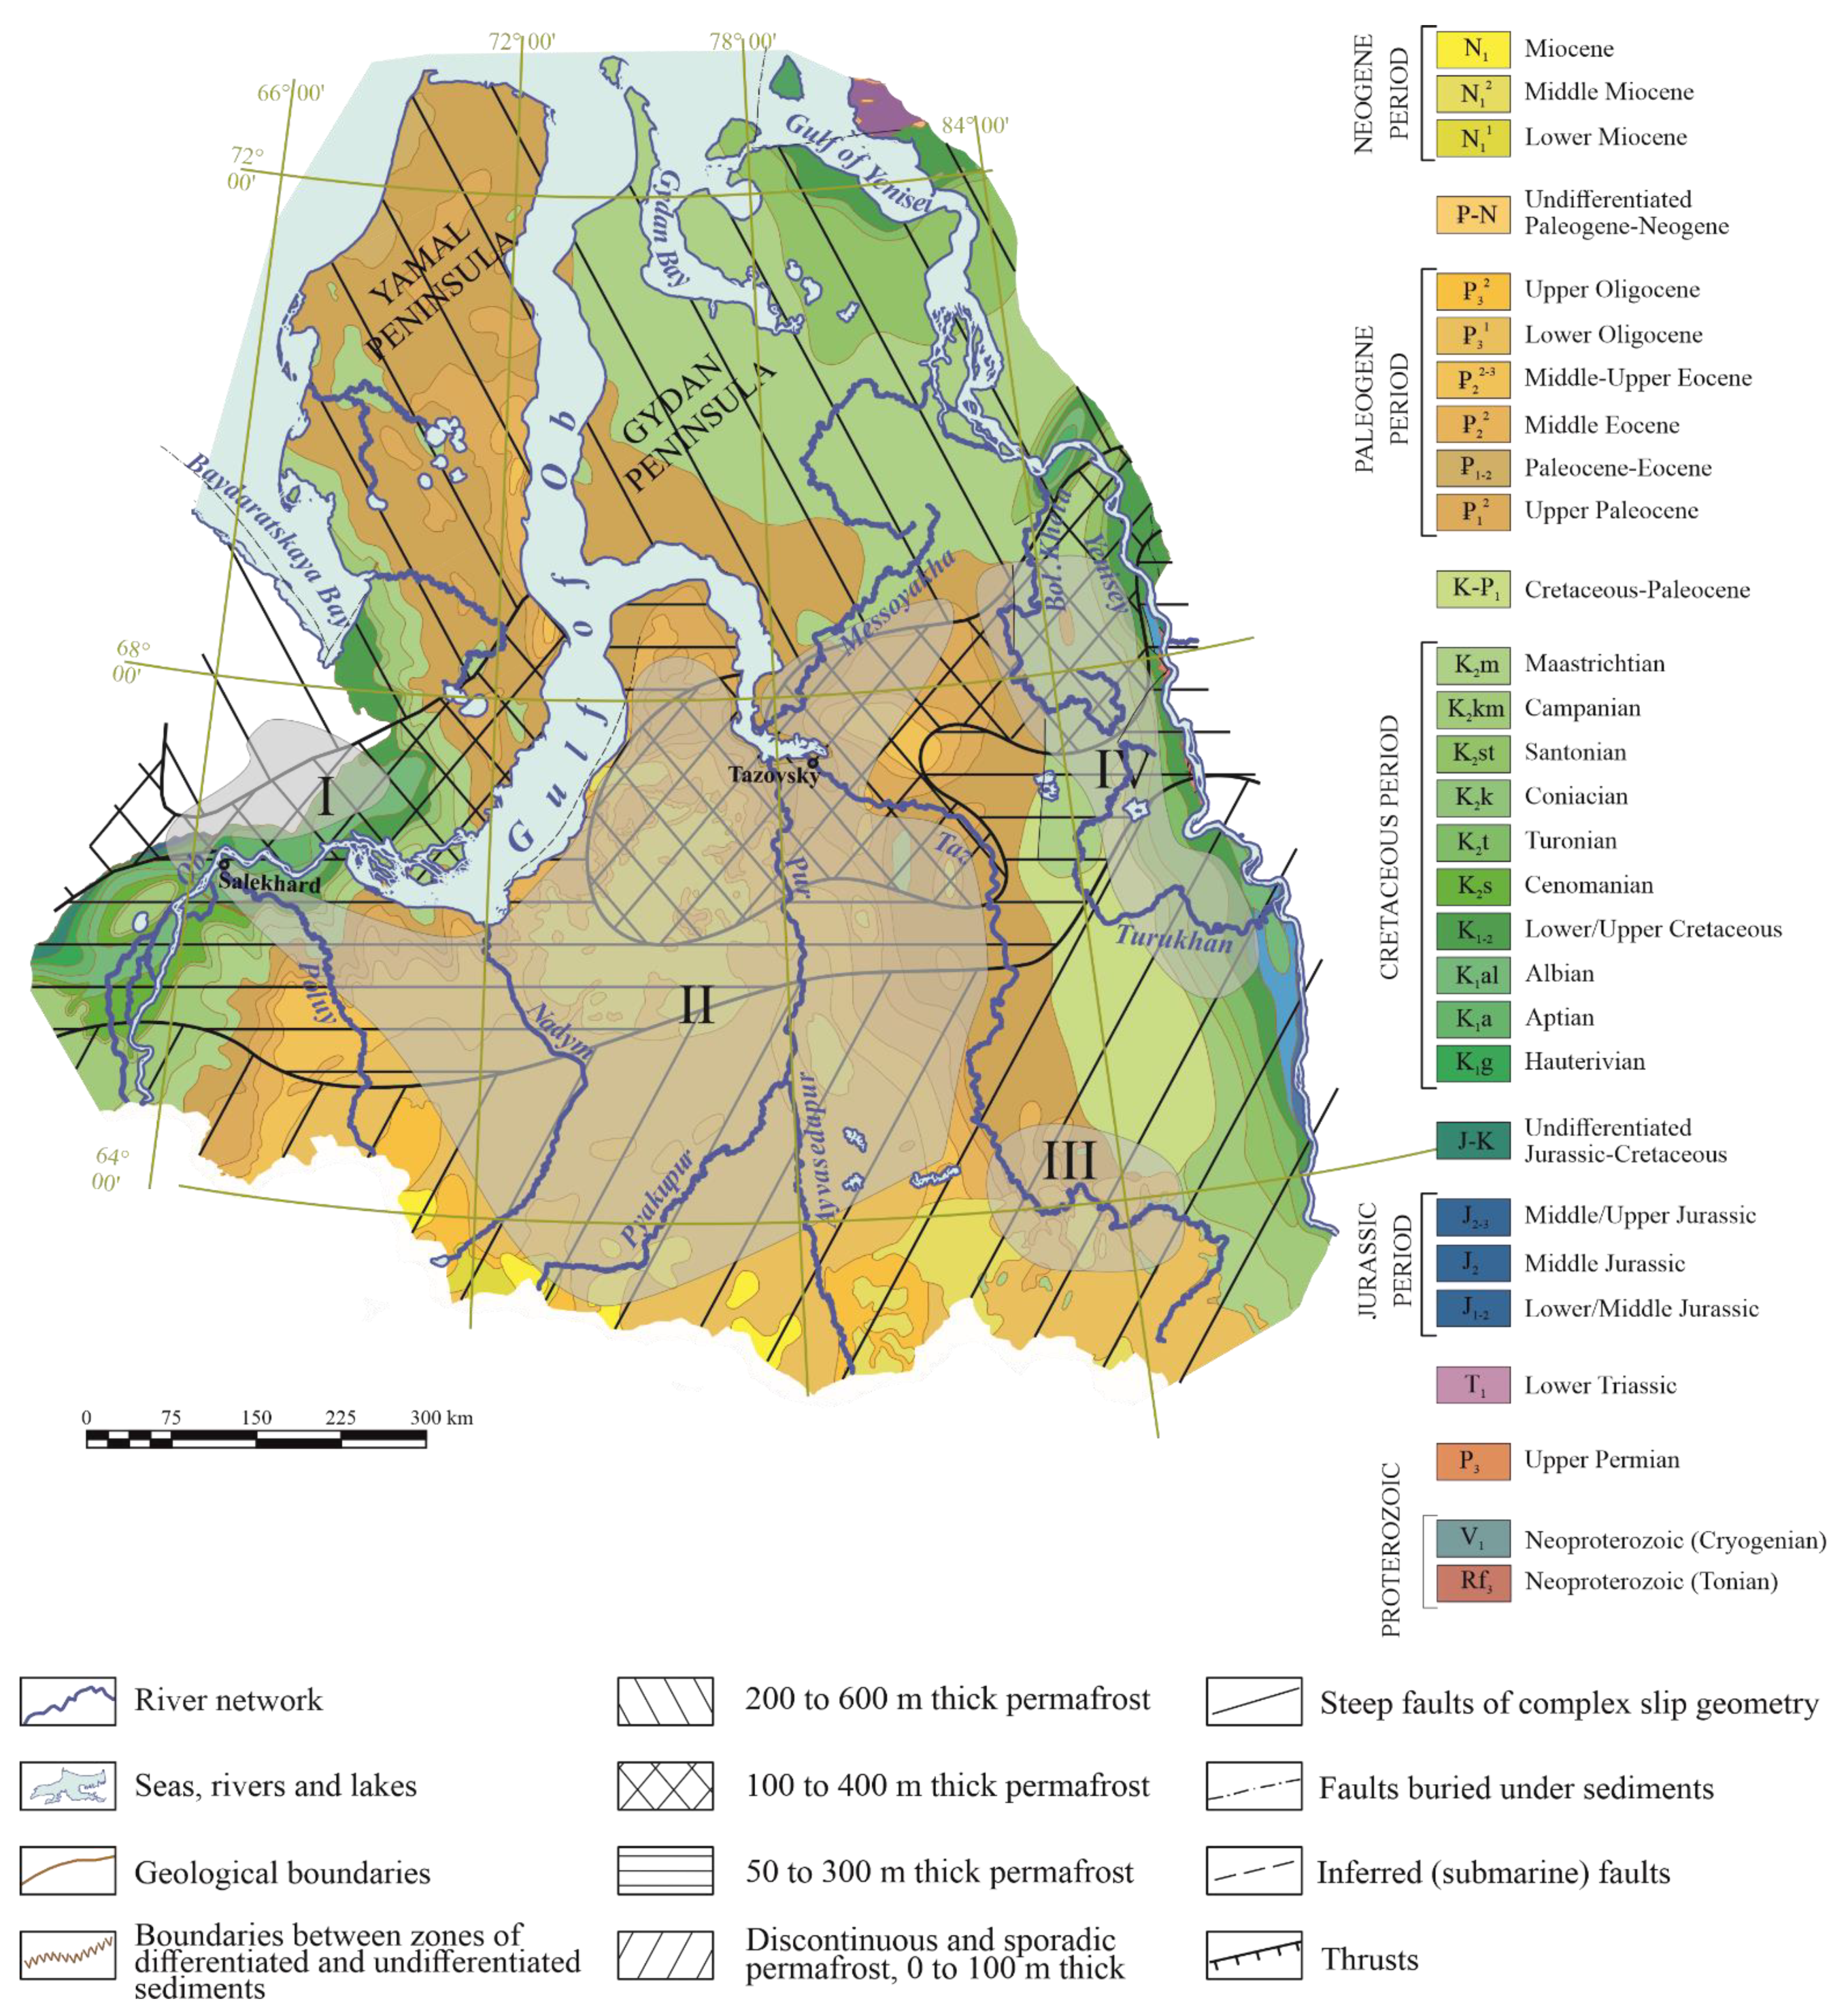
Geologically, the region belongs to the Late Paleozoic–Mesozoic West Siberian Plate, with Mesozoic-Cenozoic sediments upon a Paleozoic basement. Microcrystalline schists, phyllites and phyllitic schists of various compositions-muscovite, sericite, sericite-chlorite and chlorite, sometimes siliceous, are conventionally assigned to the Proterozoic (Rf3-V1). Lower Mesozoic (T-J) deposits are represented by alternating clays, marls, sandstones, and siltstones. Undivided Jurassic–Cretaceous deposits are represented by glauconite-quartz siltstones with interlayers of limestones and sandstones. Cretaceous deposits are represented by clays, interbedded with sandy–silty rock units. Undivided deposits (K-P1) are represented by clays (opoka-like interlayers, with nodules of marl and siderite, small pyrite inclusions) and mica kaolinized sands (with lenses and clay interlayers). The sediments of the Paleocene and Eocene are represented mainly by clayey, clayey-siliceous and siliceous rocks. Oligene deposits are represented by alternating sands and silts with clay interlayers. Neogene deposits are represented by sandy-argillaceous lignite deposits. The greatest part of the territory is occupied by marine, glacial, and mixed marine–glacial plains, where Middle Quaternary silty and clayey sediments are overlain by Middle Quaternary and Late Quaternary sand and silt deposited in lacustrine, fluvial, or mixed environments. The mostly peaty oligotrophic soils enclose thick organic horizons.
2.2. Sampling and Analytical Procedures
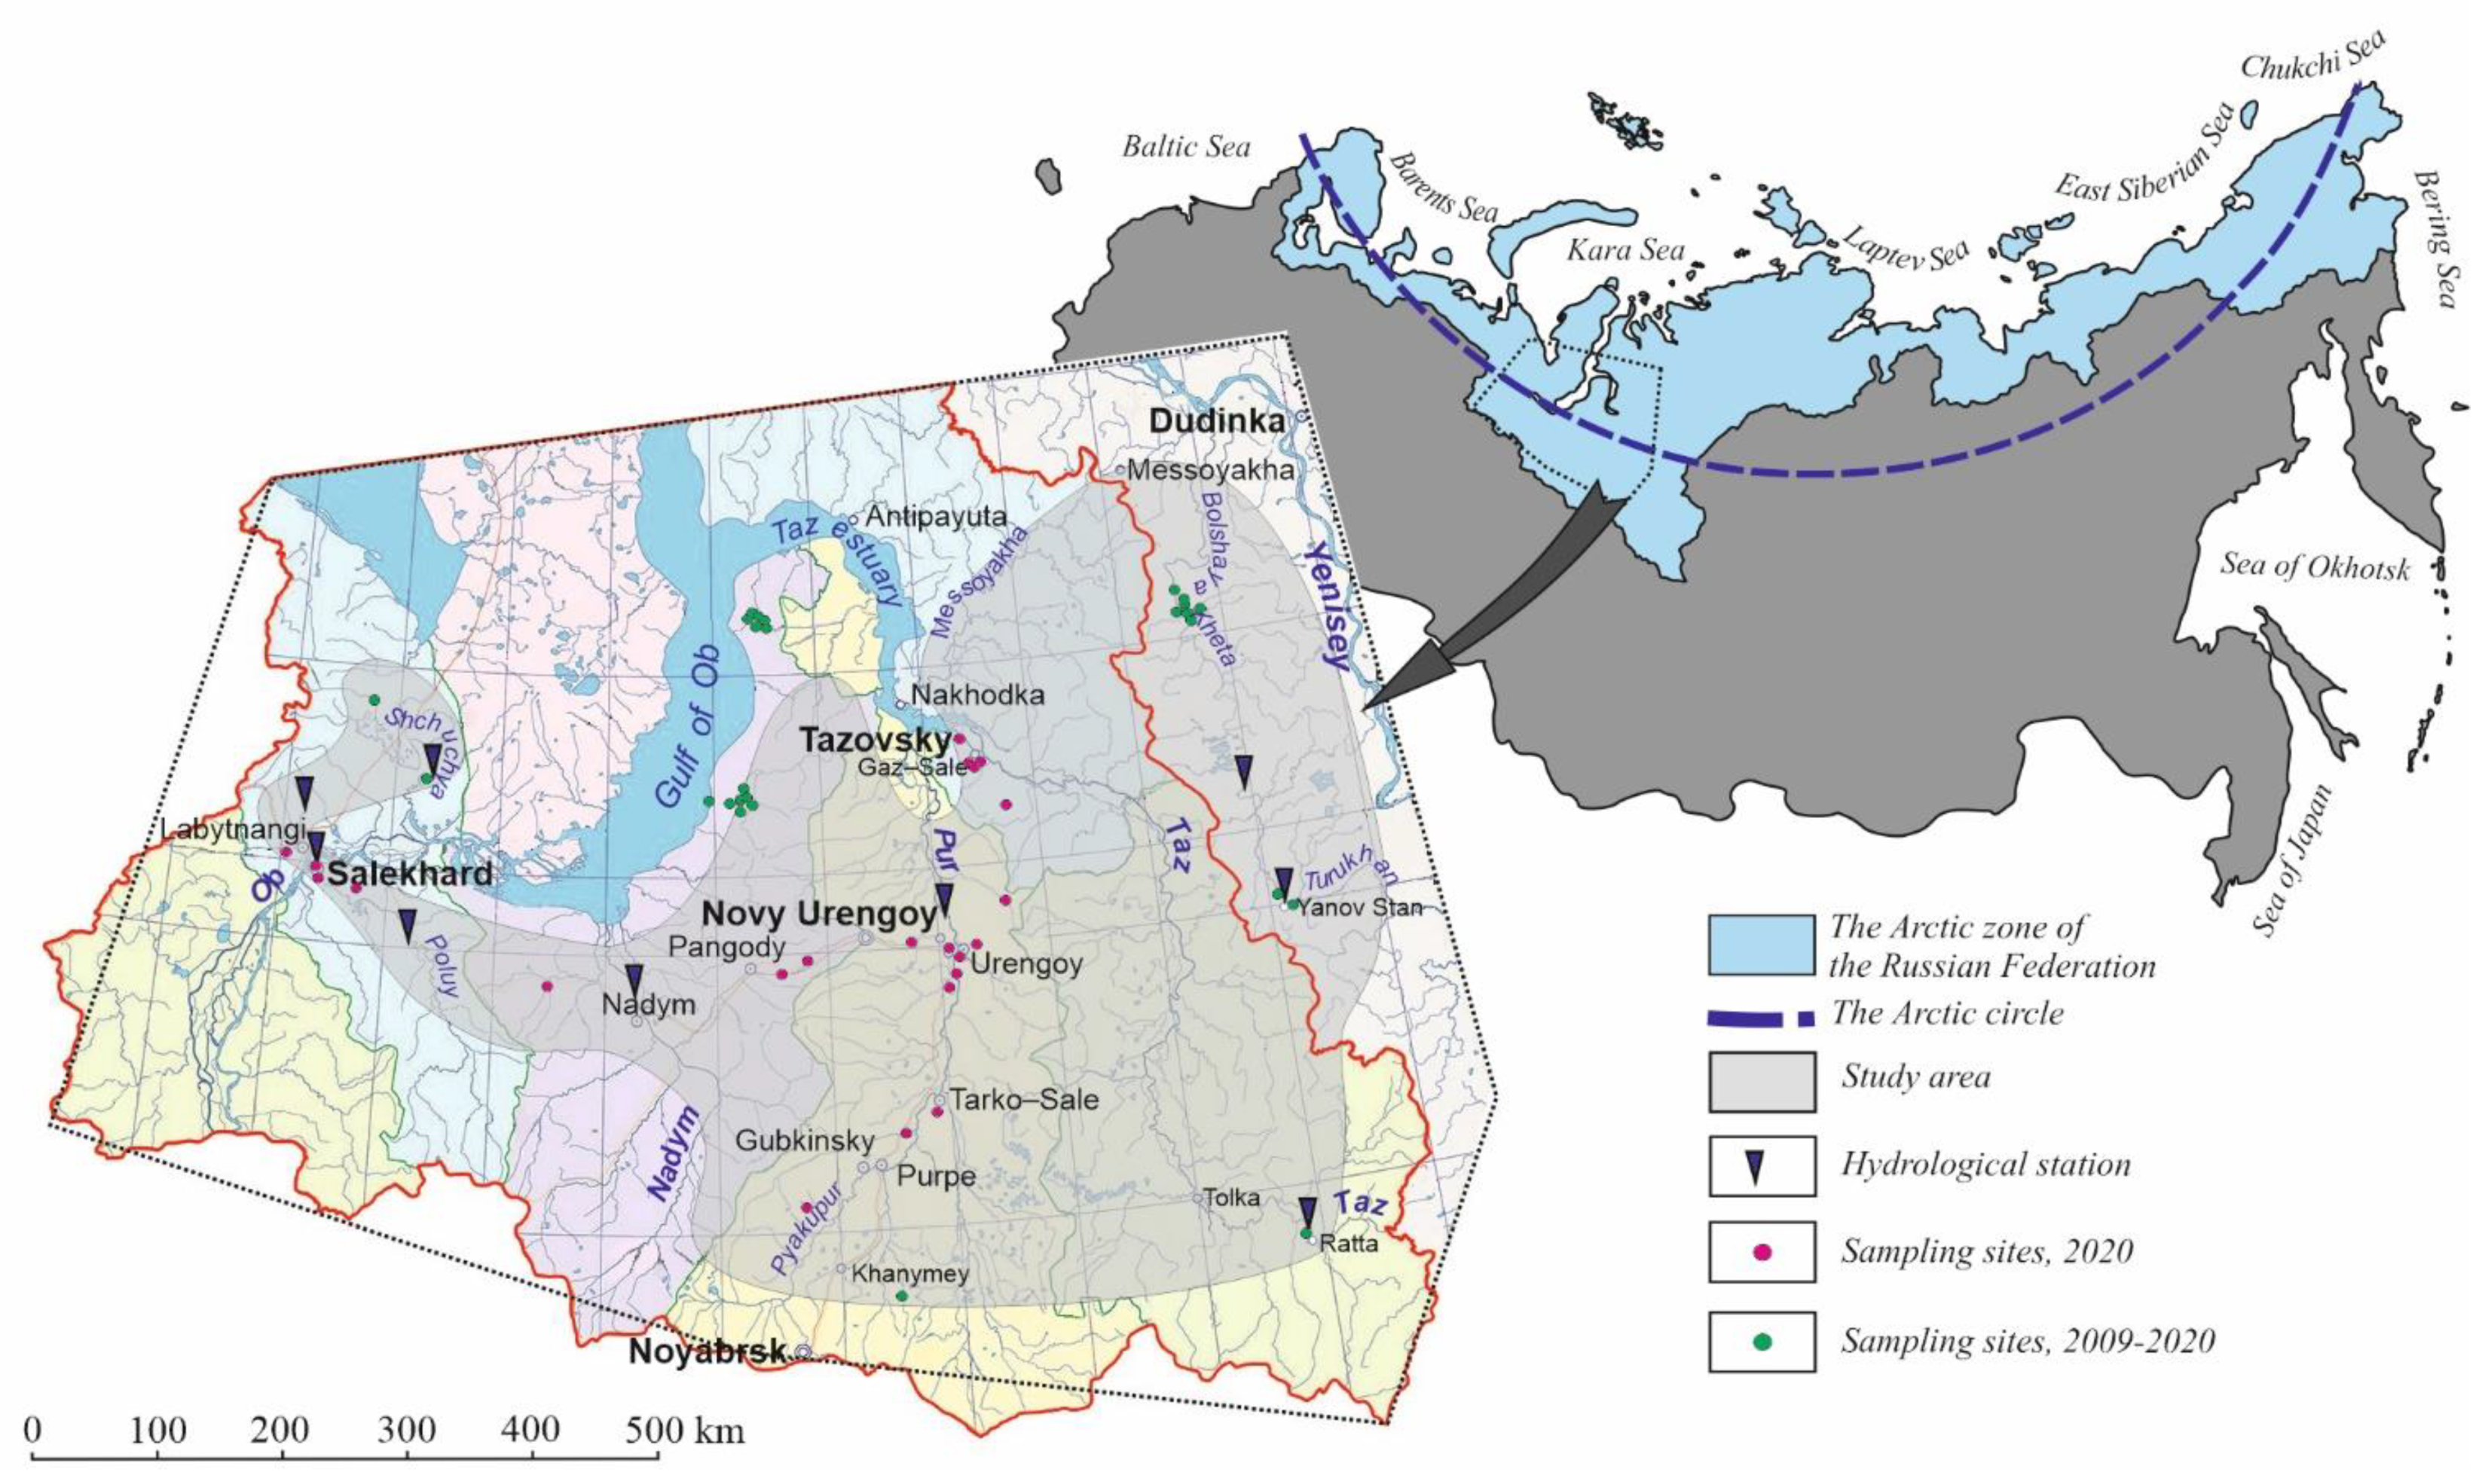
The sampled rivers with the catchment areas of ≤2000 km2 and from 2000 to 50,000 km2 [38] (Figure 1), at several sites: (1) tributaries of the Ob estuary and the Ob Gulf (Shchuchiya and Sob Rivers and Sob tributaries); (2) Poluy River, at Rosgidromet stations near Poluy community and Salekhard city; (3) tributaries of the eastern Ob Gulf catchment; (4) Nadym River and its tributaries; (5) Pur River, Pyaku-Pur River near Tarko-Sale town, and Pur tributaries; (6) Taz Gulf tributaries; (7) Taz River near Ratta community, and Taz tributaries; (8) streams in Turukhan River catchments, including Turukhan River near Yanov Stan community; (9) peat bogs and swampy areas (water-logged topographic lows with frozen organic-rich layer on top) [39]. The bog waters were sampled over the whole territory from the eastern slopes of the Urals (Ob tributaries) to the Bolshaya Kheta catchment. The sampling was from small and medium rivers, which reflect, respectively, local and zonal conditions, whereas large rivers that drain more than 50,000 km2 across multiple climate zones (Ob, Yenisei, Nadym, Pur, and Taz Rivers) are unsuitable for characterizing the water chemistry of the northern Kara basin.
The database on river water chemistry includes the results, which obtained by authors in 2009 through 2020 and published elsewhere [14,31,32,36,37,40,41,42], as well as the latest data were obtained from 23 river water samples collected during the fieldtrip to the Yamal-Nenets district in summer 2020 (Figure 1). The choice of these rivers was restricted by the possibility by using road transportation. The water samples were obtained upstream of the bridge. The total number of analyzed samples amounted to 360.
The water temperature, pH, dissolved oxygen, and electric conductivity in the main stem and tributaries were measured directly in the field using Hanna portable instruments. The water was sampled in cleaned polypropylene bottle from 20–30 cm depth in 1 or 2 m offshore [43].
The concentrations of major ions and N, P, and Si compounds, concentrations of Fe, Cu, Zn, Pb, Cd, and Hg, pH, and chemical oxygen demand (both for potassium dichromate and permanganate) were estimated with reference to compatibility between our methods and the Rosgidromet practices [44]. Most of the river and bog water were analyzed in accredited laboratories. The samples collected in 2020 were analyzed at the Basic Research Laboratory of Hydrogeochemistry of Tomsk Polytechnic University (accreditation ROSS RU.0001.511901) by different methods, following the guidelines of Rosgidromet [44] and the World Meteorological Organization [45]: potentiometry for pH; titrimetry for chemical oxygen demand and the concentrations of CO2, Ca2+, Mg2+, HCO3−, and Cl−; turbidimetry for SO42−; photometry and mass spectrometry with inductively coupled plasma (ICP-MS) on a NexION 300D spectrometer for Si, NH4+, NO2−, NO3−, phosphates, and iron; ion chromatography and atomic absorption spectrometry (AAS) for Na+ and K+; stripping voltammetry, AAS, and ICP-MS for Zn, Cu, Hg, Pb, Mn, Ni, and Al. The ICP-MC method was also applied to determine trace-element contents in filtered water samples (Sartorius filter, 0.45 µm pore size). The analytical work was performed at the certified laboratories of the Tomsk Polytechnical University and the Tomsk Regional Department of Natural Resources and Environment (Oblkompriroda).
2.3. Data Processing and Statistical Analysis
The data were processed by means of mathematical statistics using the MS Excel and Statistica software at a significance level value of 5%. The water compositions were classified into bicarbonate (HCO3−+CO32−), sulfate (SO42−), and chloride (Cl−) ionic types according to major anions [46], and each type was further divided into calcic, magnesian, and sodic subtypes according to major cations.
The water chemistry studies consisted of several steps. The work began with data inventory and classification of rivers according to flow and recharge patterns [47,48]. Then statistics were calculated over specific parts of the Kara basin [49,50], and the rms errors were estimated as
where σ is the rms error and N is the number of measurements (size of statistical sample). At the next step, the Fisher KF (Equation (2)) and Student Kt (Equation (3)) distributions of the statistics were calculated at 5% significance level to test the variance [48,49,50].
where Ax and Ay, σx and σy, Nx and Ny, are, respectively, the arithmetic means, rms errors, and sizes of the statistical samples x and y. If both Fischer and Student tests confirmed the specified low variance, the statistical samples were joined, and tested further in the same way.
Finally, the hydrochemical and hydrological parameters were correlated and the regression relationships were obtained separately for the statistical samples and for the whole data set, as recommended in [48]:
where r is the correlation coefficient; kr and δkr are the regression coefficient and its rms error.
3. Results and Discussion
The sampled rivers were first divided into eight groups: (1) tributaries of the Ob estuary and Ob Gulf: Shchuchiya, Sob (Rosgidromet station near Kharp community, and Sob tributaries), Ob Gulf tributaries; (2) Poluy River (Rosgidromet stations near Poluy community and Salekhard city); (3) tributaries of the Ob Gulf (right bank); (4) Nadym River (Rosgidromet station near Nadym community) and its tributaries; (5) Pur River (Rosgidromet station near Tarko-Sale community) and its tributaries; (6) Taz Gulf tributaries; (7) Taz River (Rosgidromet station near Ratta community) and its tributaries; (8) streams in the Turukhan (Rosgidromet station near Yanov Stan community) and Bolshaya Kheta catchments. Then the groups were joined into four provinces according to water chemistry similarity.
The rivers of group 1 flow within the western slope of the Urals, along major geological and hydrological boundaries: at the junction between the Ural orogenic belt and the West Siberian Basin filled with Paleozoic and Mesozoic sediments, and between the rivers of the mountainous-tundra zone and the plainland rivers of the West Siberian tundra and forest zones [47]. The rivers of groups 3–6 are located within the West Siberian Basin and its Paleogene, Neogene, and Quaternary sediments, and within the tundra and forest zones [47]. Groups 2 and 7 represent the conditions that are generally intermediate between the plainland rivers of the West Siberian Basin interior on one side and groups 1 and 8 on the other side [47,51].
For each group, we calculated the arithmetic means and rms errors of element concentrations, and variance in the Σmi series (Ca2+, Mg2+, Na+, K+, HCO3−, CO32−, SO42−, and Cl−) was checked by means of Fisher (Table 1) and Student (Table 2) tests, at a 5% significance level. As a result, the Σmi data for groups 1 and 2 were jointed into one statistical sample corresponding to province I. Similar Σmi values were obtained for rivers in the Taz catchment. On the other hand, the rivers of groups 1, 2, and 7 jointly belong to province III, as they share the intermediate geological and geomorphological position between plainland and highland conditions, though the Taz catchment is located far from the eastern Ural slope. Groups 3–6 that include typically plainland rivers of the tundra, forest tundra, and northern taiga zones represent similar geological and geomorphological settings. The Σmi and variance for the Yenisei tributaries differ from the respective data for all other sampled rivers, including the Taz tributaries, as well as from bog waters. Bogs generally do not represent any specific climate zones and differ from rivers in both average Σmi and variance (Table 1 and Table 2).
The major-ion totals in the river waters are the highest in the Yenisei tributaries (province IV) and the lowest in the right side of the Ob Gulf and the Taz Gukf tributaries (province II). The contents of total iron and phosphates, as well as the chemical oxygen demand (dichromate COD) are, on the contrary, the highest in province II and lowest in province IV. The waters in provinces I–III are fresh and calcium bicarbonate of type 2, according to the classification of Alekin [46]. The compositions of this type commonly result from water interaction with sediments and weathered bedrocks. The waters of the Yenisei tributaries are likewise fresh and have a calcium bicarbonate chemistry, but belong to type 1 [46] corresponding to the interaction of waters with Na- and K-rich igneous rocks. These results agree with the local geology, i.e., with the presence of Cretaceous sediments in the eastern part of the area (Figure 2). However, the greatest part of the territory, between the Ob and Taz Rivers, is occupied by Upper Quaternary and Middle Quaternary sediments covered with peat.
The bog waters of the region are on average fresh and have calcium bicarbonate chemistry, like the river waters, and are intermediate between waters of types 1 and 2 in the contents of major ions. This composition may be due to thinning of water lenses and/or to accumulation of Na and K ions in the active layer above the permafrost. Compared to the river waters, the bog waters expectedly have higher dichromate COD due to peat formation, and Fe iron contents due to accumulation of dissolved compounds with organic acids.
In general, the major-ion totals are higher along the margins of the West Siberian Plain, while the organic compounds and their derivatives are more abundant in the swampy central areas. This fact has to be taken into account when estimating natural and anthropogenic effects on water bodies, e.g., using average values for provinces I–IV as background pH, COD, major ion concentrations, inorganic compounds of N, phosphates, Si, and Fe (Table 3).
Unfortunately, the available data on trace-element contents are insufficient to provide a reliable basis for distinguishing the water chemistry provinces, though some trends appear in lateral variations across the region: e.g., Ni and Cu increase slightly eastward. The waters were sampled for a larger number of elements during the trip of September 2020 by a team from the Tomsk branch of the Trofimuk institute of petroleum geology and geophysics of Siberian branch of Russian academy of sciences (Table 4). The regional average contents of Li, B, V, Co, Ni, Ge, As, Rb, Cd, Pb, La, Ce, and Pr we obtained differ for less than 50% from the previous estimates over the rivers from the Kara Sea drainage basin [36].
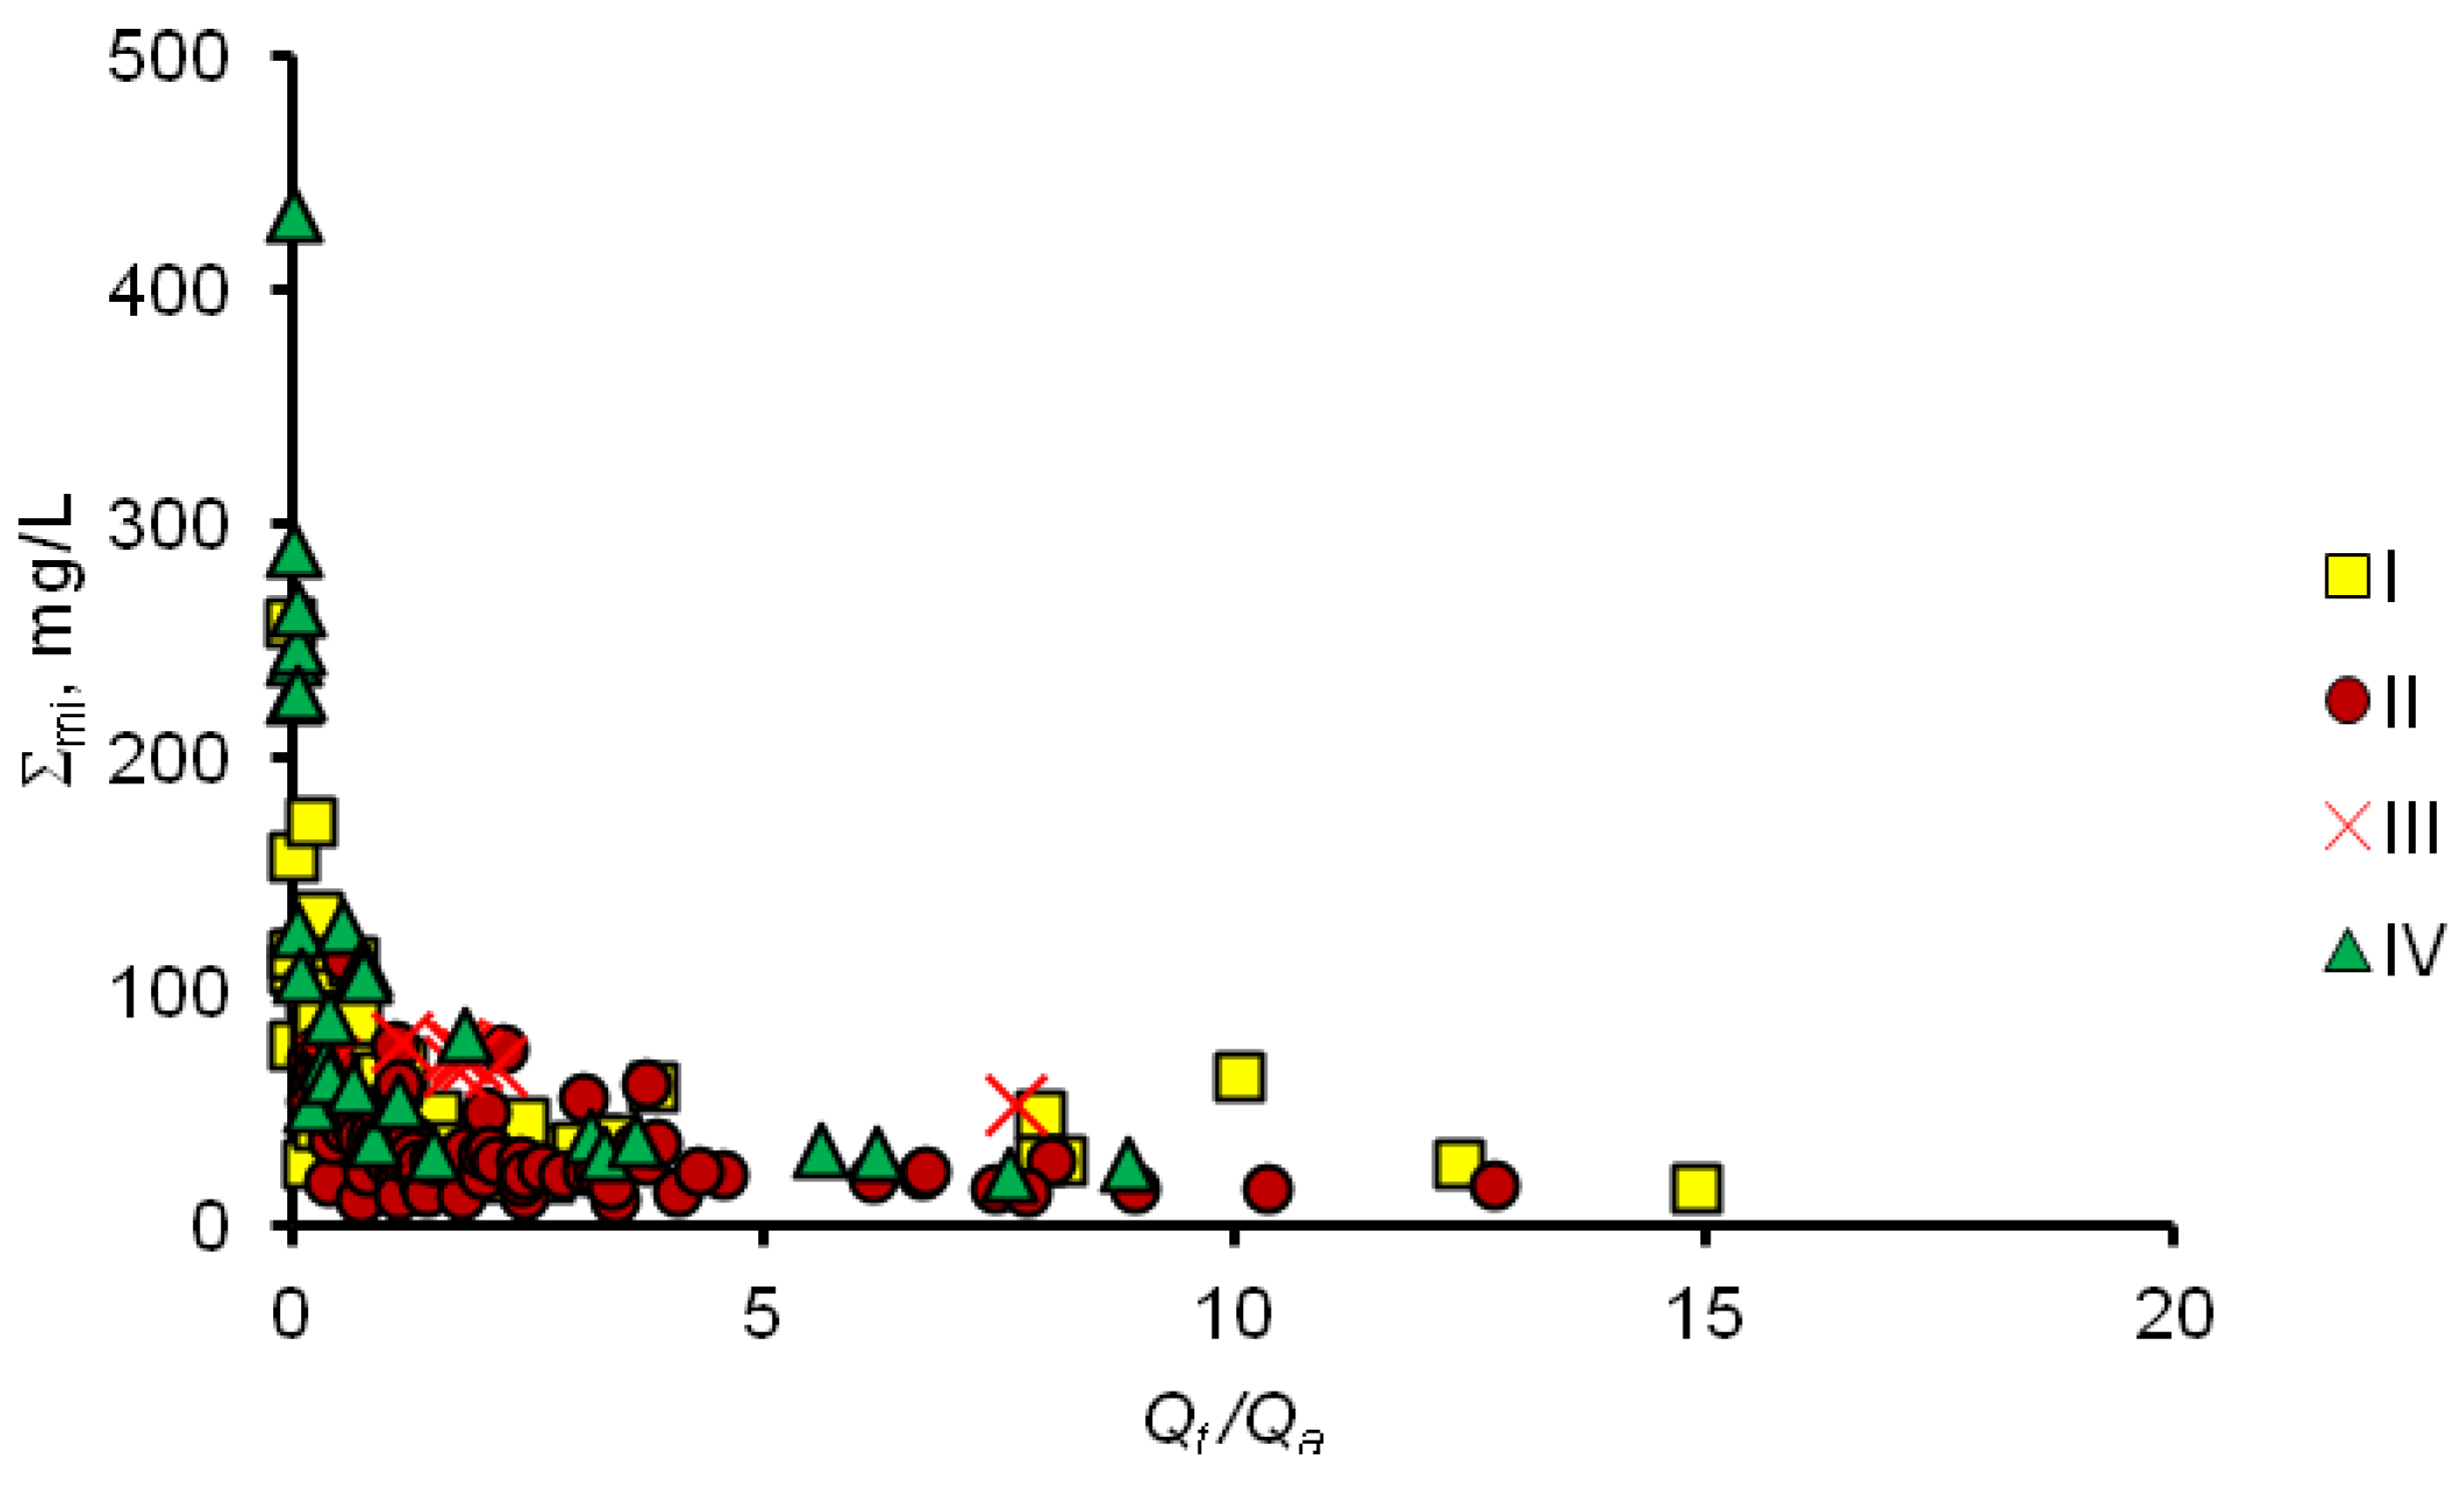
The total of major ions varies seasonally as a function of runoff patterns. The Σmi and the water discharge Qt are commonly related as
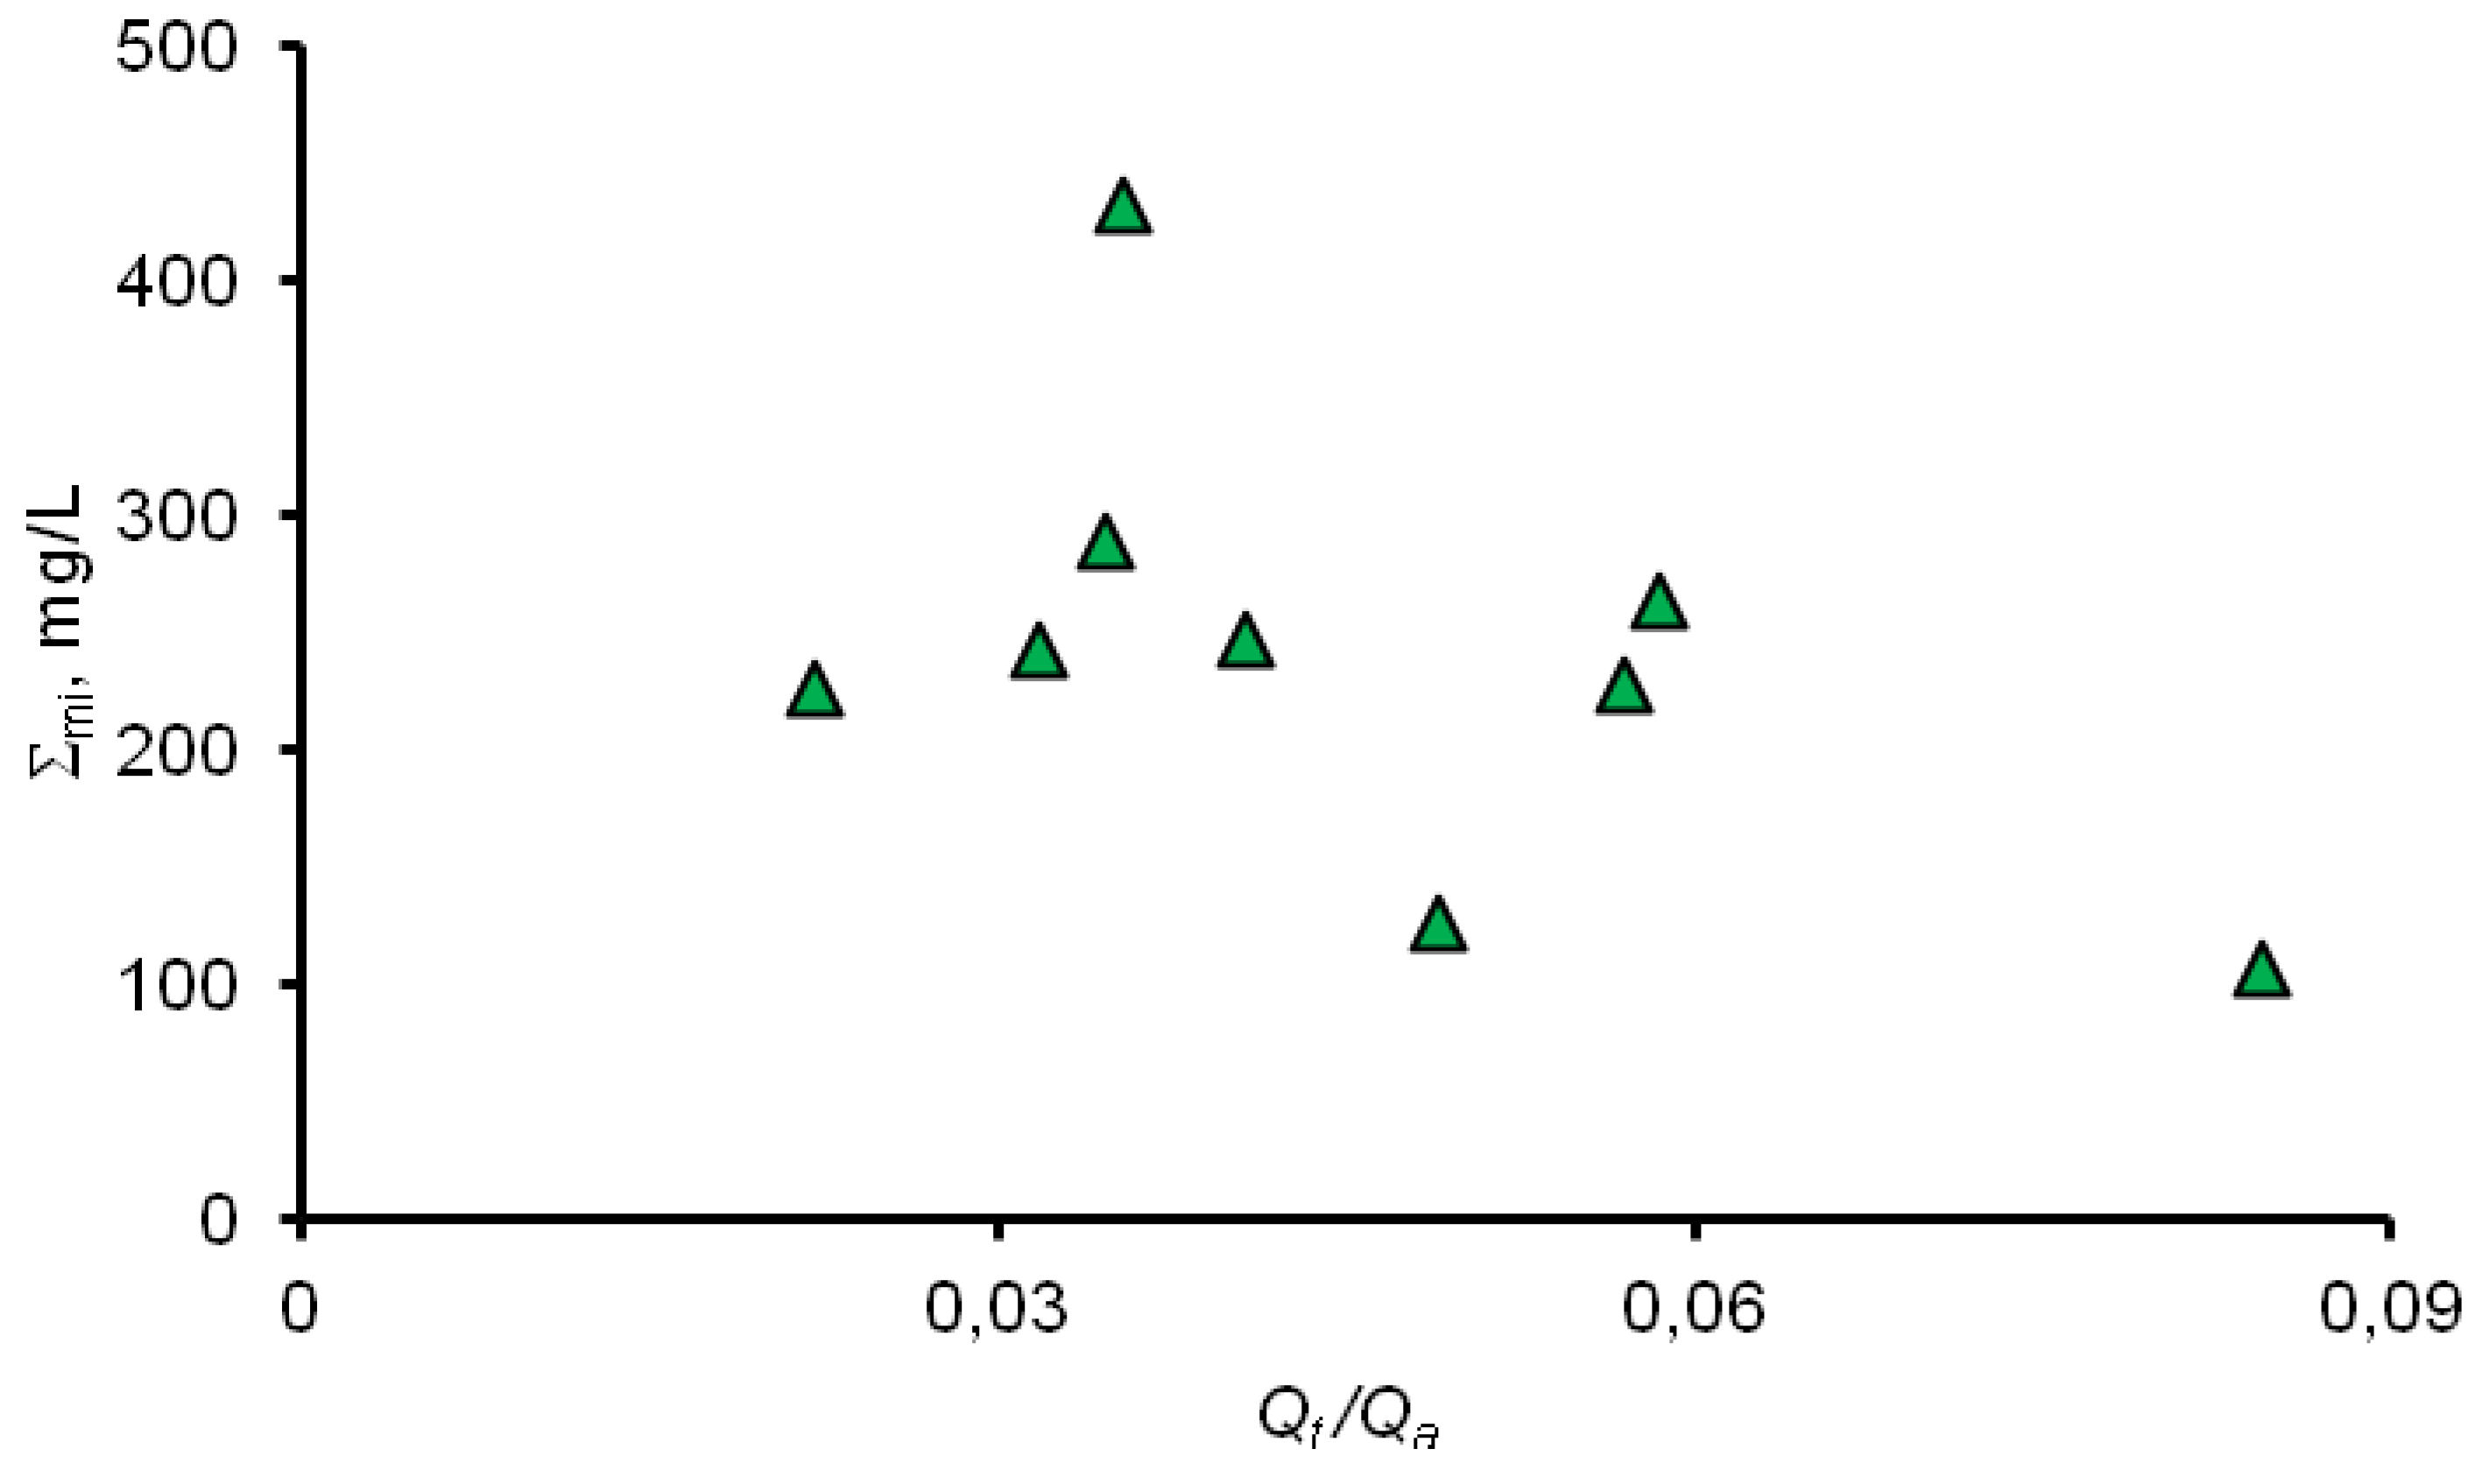
See the general Σmi vs. Qt/Qa relationship for all four provinces in Figure 3, where Qt is the water discharge (flow rate) at a certain time and Qa is the respective average value; a and b are empirical constants. In the case of province IV, at very small discharge ratios (Qt /Qa < 0.01), mainly in the winter low-water season, Σmi can even increase slightly at higher Qt /Qa (Figure 4). This state may correspond to influx from saline water lenses in permafrost (cryopegs). The effect of saline water inputs smooths down as the surface runoff into the river network increases, and the major-ion total decreases in a stable way with increasing discharge at Qt/Qa > 0.2–0.3. The Σmi and the discharge correlate in an intricate way, being first directly and then inversely proportional. This reversal was attributed [53] to the water chemistry control jointly by slope, surface, and subsurface run-off components, while the run-off, in its turn, depends nonlinearly on the air temperature [53].
The power–law relationship (Figure 3) can be used for preliminary estimation of possible climate-driven changes in the water chemistry of the Arctic rivers. Specifically, it was found out that the subsurface component of the river run-off in Northern Asia has undergone a statistically significant increase in the past two to four decades, and the duration of water-level seasons has changed [4,7,13,15]. Therefore, the major-ion total can be expected to increase slightly in the winter low-water time but may increase in the fall and spring seasons.
4. Conclusions
The analyzed statistical samples of total major-ion contents in the rivers of northern West Siberia reveal four water chemistry provinces: western Ob Gulf and Ob estuary catchments (I); eastern Ob Gulf and Taz Gulf catchments, except for the Taz River and its tributaries (II); Taz River catchment (III); and Yenisei River catchment (right bank) (IV). The compositions of river waters in different provinces record the hydrogeochemical conditions corresponding to the Ural eastern slope (province I) and to the junction between the West Siberian and Central Siberian plates (province IV), while the conditions in province III are intermediate between the two provinces. The conditions in province II are the most typical of the northern West Siberian Plain: the lowest average Σmi, the highest dichromate COD, and the highest contents of Fe and phosphates. The major-ion total is the highest in the rivers of province IV, as a result of its geological specificity and due to inputs of saline waters from cryopegs in watershed permafrost.
Some trace elements (e.g., Cu and Ni) show increasing trends from west to east. The river waters from all four provinces share similarity in quite high organic contents inferred from both dichromate and permanganate COD, as well as high NH4+ and Fe. Thus, the waters of the area do not comply with the quality requirements for the waters of fishery and household uses.
The total major-ion concentrations vary seasonally: they decrease at higher run-off and water levels and increase in the low-water season. In view of the revealed correlation between the water chemistry and water level (discharge) patterns, and in the presence of climate-induced changes in the subsurface run-off component and in the duration of hydrological seasons, it can be assumed that the long-term average Σmi values will hardly change much in the coming one or two decades, though they may decrease slightly in the winter season but increase in the fall and spring time.
Author Contributions
Sampling, conceptualization, I.I.; methodology, writing—soriginal draft preparation, O.S.; analyses, N.V.; interpretation of analytical results, Y.V.K.; visualization, N.T. All authors have read and agreed to the published version of the manuscript.
Funding
This research was funded by the Russian Science Foundation, grant No 20-77-10084.
Institutional Review Board Statement
Not applicable.
Informed Consent Statement
Not applicable.
Data Availability Statement
The data that support the findings of this study are available from the corresponding author upon reasonable request.
Conflicts of Interest
The authors declare no conflict of interest.
References
- Bring, A.; Destouni, G. Hydrological and hydrochemical observation status in the pan-Arctic drainage basin. Polar. Res. 2009, 28, 327–338. [Google Scholar] [CrossRef]
- Gordeev, V.V. The River-Sea System and Its Role in the Oceanic Water Chemistry; Shirshov Institute of Oceanology of the Russian Academy of Sciences: Moscow, Russia, 2009; 36p. [Google Scholar]
- Holmes, R.M.; McClelland, J.W.; Peterson, B.J.; Tank, S.E.; Bulygina, E.; Eglinton, T.I.; Gordeev, V.V.; Gurtovaya, T.Y.; Raymond, P.A.; Repeta, D.J.; et al. Seasonal and annual fluxes of nutrients and organic matter from large rivers to the Arctic Ocean and surrounding seas. Estuaries Coasts 2012, 35, 369–382. [Google Scholar] [CrossRef]
- Shiklomanov, A.I.; Lammers, R.B.; Lettenmaier, D.P.; Polischuk, Y.M.; Savichev, O.G.; Smith, L.G. Hydrological changes: Historical analysis, contemporary status, and future projections. In Environmental Changes in Siberia: Regional Changes and Their Global Consequences; Groisman, P.Y., Gutman, G., Eds.; Springer: Berlin, Germany, 2013; pp. 111–154. Available online: http:link.springer.com/chapter/10.1007/978-94-007-4569-8_4 (accessed on 24 September 2021).
- Bradshaw, R.H.M.; Sykes, M.T. Ecosystem Dynamics: From the Past to the Future; John Wiley & Sons: Chichester, UK, 2014; 321p. [Google Scholar]
- Reykhard, L.; Shulga, N.; Novichkova, Y.A.; Kozina, N.; Dara, O.; Sapozhnikov, P.; Gordeev, V.; Belyaev, N.; Boev, A. Biomineral indicators of hydrological, geological and climatic processes in the Arctic. Acta. Crystal. Found. Adv. 2018, 74, e250. [Google Scholar] [CrossRef]
- Dzhamalov, R.G.; Safronova, T.I. Effect of permafrost rocks on water resources formation in Eastern Siberia: Case study of some rivers in Eastern Siberia. Water Resour. 2018, 45, 455–465. [Google Scholar] [CrossRef]
- Song, C.; Wang, G.; Mao, T.; Dai, J.; Yang, D. Linkage between permafrost distribution and river runoff changes across the Arctic and the Tibetan Plateau. Sci. China Earth Sci. 2020, 62, 292–302. [Google Scholar] [CrossRef]
- Gusev, E.M.; Nasonova, O.N.; Shurkhno, E.A.; Dzhogan, L.Y. Scenario forecasting of changes in water balance components in the Ob–Irtysh basin in the context of possible climate change. Water Resour. 2019, 46, 647–658. [Google Scholar] [CrossRef]
- Kiyo, T.; Campbell, F.; Lantz, T.C.; Fraser, R.H.; Hogan, D. High Arctic vegetation change mediated by hydrological conditions. Ecosystems 2021, 24, 106–121. [Google Scholar] [CrossRef]
- Manasypov, R.M.; Lim, A.G.; Krickov, I.V.; Shirokova, L.S.; Vorobyev, S.N.; Kirpotin, S.N.; Pokrovsky, O.S. Spatial and seasonal variations of C, nutrient, and metal concentration in thermokarst lakes of Western Siberia across a permafrost gradient. Water 2020, 12, 1830. [Google Scholar] [CrossRef]
- Pokrovsky, O.S.; Manasypov, R.M.; Kopysov, S.G.; Krickov, I.V.; Shirokova, L.S.; Loiko, S.V.; Lim, A.G.; Kolesnichenko, L.G.; Vorobyev, S.N.; Kirpotin, S.N. Impact of permafrost thaw and climate warming on riverine export fluxes of carbon, nutrients and metals in Western Siberia. Water 2020, 12, 1817. [Google Scholar] [CrossRef]
- Shiklomanov, A.; Déry, S.; Tretiakov, M.; Yang, D.; Magritsky, D.; Georgiadi, A.; Tang, W. River freshwater flux to the Arctic Ocean. In Arctic Hydrology, Permafrost and Ecosystems; Yang, D., Kane, D., Eds.; Springer: Berlin, Germany, 2021; pp. 703–738. [Google Scholar] [CrossRef]
- Savichev, O.G.; Mazurov, A.K.; Pipko, I.I.; Sergienko, V.I.; Semiletov, I.P. Spatial patterns of the evolution of the chemical composition and discharge of river water in the Ob River Basin. Dokl. Earth Sci. 2016, 466, 47–51. [Google Scholar] [CrossRef]
- Savichev, O.G.; Moiseeva, Y.A. A model of intra-annual flow distribution with scanty observational data. ENVIROMIS2018 IOP Conf. Ser. Earth Environ. Sci. 2018, 211, 1–6. [Google Scholar] [CrossRef] [Green Version]
- Kopysov, S.G.; Erofeev, A.A. The influences of climate on runoff: A case study of four catchments in Western Siberia. IOP Conf. Ser. Earth Environ. Sci. 2019, 381, 012046. [Google Scholar] [CrossRef]
- Krickov, I.V.; Lim, A.G.; Manasypov, R.M.; Loiko, S.V.; Vorobyev, S.N.; Pokrovsky, O.S.; Shevchenko, V.P.; Dara, O.M.; Gordeev, V.V. Major and trace elements in suspended matter of Western Siberian rivers: First assessment across permafrost zones and landscape parameters of watersheds. Geochim. Cosmochim. Acta 2020, 269, 429–450. [Google Scholar] [CrossRef]
- Pokrovsky, O.S.; Viers, J.; Chupakov, A.V.; Shirokova, L.S.; Gordeev, V.V.; Shevchenko, V.P. Trace elements in the form of organo-mineral colloids in the mixing zone of the Arctic river. In Biogeochemistry of Trace Elements; Chemical Research and Application: New York, NY, USA, 2018; pp. 245–289. [Google Scholar]
- Victorov, A.S.; Orlov, T.V.; Trapeznikova, O.N.; Kapralova, V.N.; Arkhipova, M.V. Regularities of the distribution of lake areas on thermokarst plains with fluvial erosion. Dokl. Earth Sci. 2020, 491, 282–284. [Google Scholar] [CrossRef]
- Moiseenko, T.I.; Dinu, M.I.; Gashkina, N.A.; Kremleva, T.A.; Khoroshavin, V.Y. Geochemical features of elements distributions in the lake waters of the Arctic region. Geochem. Intern. 2020, 58, 613–623. [Google Scholar] [CrossRef]
- Lim, A.G.; Loiko, S.V.; Kuzmina, D.M.; Krickov, I.V.; Shirokova, L.S.; Kulizhsky, S.P.; Vorobyev, S.N.; Pokrovsky, O.S. Dispersed ground ice of permafrost peatlands: Potential unaccounted carbon, nutrient and metal sources. Chemosphere 2021, 266, 128953. [Google Scholar] [CrossRef]
- Schneider, C.; Laize, C.L.R.; Acreman, M.C.; Florke, M. How will climate change modify river flow regimes in Europe? Hydrol. Earth Syst. Sci. 2013, 17, 325–339. [Google Scholar] [CrossRef] [Green Version]
- Hasan, N.-E.-A.; Salam, R.; Paul, R.; Ambade, I. Health Risk and Water Quality Assessment of Surface Water in an Urban River of Bangladesh. Sustainability 2021, 13, 6832. [Google Scholar] [CrossRef]
- Shiklomanov, I.A. (Ed.) Water Resources of Russia; State Hydrological Institute: St. Petersburg, Russia, 2008; 600p. (In Russian) [Google Scholar]
- Water, C. Surface and Groundwater Resources: Uses and Water Quality, Year 2018; Rosgidromet: St. Petersburg, Russia, 2019; 153p. (In Russian) [Google Scholar]
- Rybaiskiy, N.G. (Ed.) Water Resources of the Russian Federation in 2018: State and Uses; Government Report; NIA-Priroda: Moscow, Russia, 2019; 290p. (In Russian)
- Shvartsev, S.L.; Savichev, O.G. The ecological and geochemical state of the major tributaries of the Ob in its middle course. Water Resour. 1997, 24, 707–713. [Google Scholar]
- Shvartsev, S.L.; Savichev, O.G.; Vertman, G.G.; Zarubina, R.F.; Nalivaiko, N.G.; Trifonova, N.G.; Turov, Y.P.; Frizen, L.F.; Yankovskii, V.V. The ecological and geochemical state of the water in the middle course of the Ob River. Water Resour. 1996, 23, 673–682. [Google Scholar]
- Savenko, V.S. Chemical composition of sediment load carried by rivers. Geochem. Intern. 2007, 45, 816–824. [Google Scholar] [CrossRef]
- Savichev, O.G. Influence of large tributaries on water chemistry in the Middle Ob river. Bull. Tomsk State Univ. 2010, 340, 222–228. (In Russian) [Google Scholar]
- Savichev, O.G.; Kolesnichenko, L.G.; Saifulina, E.V. The ecologo-geochemical state of water bodies in the Taz-Yenisei interfluve. Geogr. Nat. Resour. 2011, 32, 333–336. [Google Scholar] [CrossRef]
- Guseva, N.V.; Kopylova, Y.G.; Khvashchevskaya, A.A. Geochemical types of natural waters in the interfluve of the Enzor’yakhi and Yun’yakhi (Eastern Slope of the Polar Urals). Water Resour. 2013, 40, 417–425. [Google Scholar] [CrossRef]
- Shirokova, L.S.; Pokrovsky, O.S.; Kirpotin, S.N.; Desmukh, C.; Pokrovsky, B.G.; Audry, S.; Viers, J. Biogeochemistry of organic carbon, CO2, CH4, and trace elements in thermokarst water bodies in discontinuous permafrost zones of Western Siberia. Biogeochemistry 2013, 113, 573–593. [Google Scholar] [CrossRef]
- Gordeev, V.V.; Lein, A.Y.; Belyaev, N.A.; Ivanov, M.V. The distribution of heavy metals in the near-bottom particulate matter, fluffy layer, and bottom sediments over the Yenisei profile in the Kara sea. Dokl. Earth Sci. 2014, 456, 720–725. [Google Scholar] [CrossRef]
- Moskovchenko, D.V.; Babushkin, A.G.; Yurtaev, A.A. The impact of the Russian oil industry on surface water quality (a case study of the Agan River catchment, West Siberia). Environ. Earth Sci. 2020, 79, 355. [Google Scholar] [CrossRef]
- Savenko, A.V.; Savenko, V.S.; Pokrovsky, O.S. New data on the concentrations of dissolved trace elements in waters of Russian Arctic rivers. Dokl. Earth Sci. 2020, 491, 257–263. [Google Scholar] [CrossRef]
- Griva, G.I. Local Geology and Environment Conditions in Gas Fields of the Yamal Peninsula; Tomsk State University: Tomsk, Russia, 2005; 352p. (In Russian) [Google Scholar]
- State Standard. Working Document GOST 19179-73. Land Hydrology; Terms Definitions; Gosstandart USSR: Moscow, Russia, 1988; 47p. (In Russian) [Google Scholar]
- State Standard. Working Document GOST 21123-85. Peat. Terms and Definitions; 01.07.1986. Izd; Standartov: Moscow, Russia, 1985; 85p. (In Russian) [Google Scholar]
- Savichev, O.G.; Moiseeva, Y.A. Surface water stability to the anthropogenic effect in tundra and forest tundra in Western Siberia. Bull. Arct. Fed. Univ. Ser. Nat. Sci. 2016, 4, 36–46. [Google Scholar] [CrossRef]
- Zemtsov, V.A.; Savichev, O.G. Resources, regime and quality of surface waters in the Ob River basin: History, current state and problems of research. Intern. J. Environ. Stud. 2015, 72, 386–396. [Google Scholar] [CrossRef]
- Guseva, N.V.; Kopylova, Y.G. Chemistry of Natural Waters in the Yuniyakha—Enzoryakha interfluve, Eastern Slope of the Polar Urals. Bull. Tomsk State Univ. 2009, 327, 224–228. (In Russian) [Google Scholar]
- Wilde, F.D.; Radtke, D.B. Guidelines for field-measured water-quality properties. In National Field Manual for the Collection of Water-Quality Data; Wilde, F.D., Ed.; U.S. Geological Survey Techniques of Water-Resources Investigations: Reston, VA, USA, 2008; Book 9, Chapter A6. Available online: https://pubs.er.usgs.gov/publication/twri09A6.0 (accessed on 24 September 2021).
- Organization of Pollution Monitoring in Land Surface Waters. Implemented since 2017-04-03; Working Document RD 52.24.309–2016; Ministry of Natural Resources and Environment of the Russian Federation (Rosgidromet): Moscow, Russia, 2016; 135p. (In Russian)
- Hydrology—From Measurement to Hydrological Information. Guide to Hydrological Practices, 6th ed.; Book I; World Meteorological Organization WMO 168: Geneva, Switzerland, 2008; 296p. [Google Scholar]
- Alekin, O.A. Fundamentals of Hydrochemistry; Gidrometeoizdat: Leningrad, Russia, 1970; 444p. (In Russian) [Google Scholar]
- Kuzin, P.S.; Babkin, V.I. Geographic Atterns of the River Flow Regime; Gidrometeoizdat: Leningrad, Russia, 1979; 200p. (In Russian) [Google Scholar]
- State Standard. Working Document SP 33-101-2003. Guide to Determination of Basic Hydrological Parameters; Gosstroy Rossii: Moscow, Russia, 2004; 72p. (In Russian) [Google Scholar]
- Schmidt, T.S. (Ed.) Calculation of Hydrological Parameters. A Manual; Gidrometeoizdat: Leningrad, Russia, 1984; 448p. (In Russian) [Google Scholar]
- Procedure for Calculating Background Element Concentrations in Water for Standardization of Wastewater Discharge; Working Document RD 52.24.622–2017; 14.06.2017, Rostov-na-Donu, FGBU «SCHI»russia; Rosgidromet: Moscow, Russia, 2017; 96p. (In Russian)
- Nudner, V.A. (Ed.) Hydrogeology of the USSR; West Siberian Plain (Tyumen, Omsk, Novosibirsk, and Tomsk Regions); Nedra: Moscow, Russian, 1970; Volume 16, 368p. (In Russian) [Google Scholar]
- Geological Map of the Yamal-Nenets Autonomous District and Krasnoyarsk Region; 1:2500000, as of 01.09.2020; VSEGEI: St. Petersburg, Russia, 2020. (In Russian)
- Savichev, O.G.; Guseva, N.V. Methodology of management of river basins geochemical balance in Western Siberia. Bull. Tomsk. Polytech. Univ. Geo. Assets. Eng. 2020, 331, 28–45. [Google Scholar] [CrossRef]
Figure 1.
Location map of study area in northern West Siberia.

Figure 2.
Map of northern West Siberia and local geology [52].
Figure 2.
Map of northern West Siberia and local geology [52].


Table 1.
Ratio between actual KF (in formula 2) and critical KF, 5% (5% significance) variance.
| Area | 1 | 2 | 3 | 4 | 5 | 6 | 7 | 8 | 9 |
|---|---|---|---|---|---|---|---|---|---|
| 1 | 0.56 | 21.90 | 7.38 | 27.04 | 12.15 | 4.86 | 39.74 | 23.69 | 1.32 |
| 2 | 21.90 | 0.39 | 1.64 | 0.48 | 0.69 | 2.56 | 0.70 | 0.42 | 8.83 |
| 3 | 7.38 | 1.64 | 0.55 | 2.03 | 0.91 | 0.86 | 2.98 | 1.78 | 2.97 |
| 4 | 27.04 | 0.48 | 2.03 | 0.63 | 0.86 | 3.16 | 0.93 | 0.26 | 10.90 |
| 5 | 12.15 | 0.69 | 0.91 | 0.86 | 0.39 | 1.42 | 1.26 | 0.75 | 4.90 |
| 6 | 4.86 | 2.56 | 0.86 | 3.16 | 1.42 | 0.57 | 4.64 | 2.77 | 1.96 |
| 7 | 39.74 | 0.70 | 2.98 | 0.93 | 1.26 | 4.64 | 0.36 | 0.38 | 16.03 |
| 8 | 23.69 | 0.42 | 1.78 | 0.26 | 0.75 | 2.77 | 0.38 | 0.23 | 9.55 |
| 9 | 1.32 | 8.83 | 2.97 | 10.90 | 4.90 | 1.96 | 16.03 | 9.55 | 0.53 |
Note: statistically significant difference is in bold. Numerals 1–9 stand for names of areas: 1 = rivers in the Yenisei catchment; 2 = rivers in the Nadym catchment; 3 = Poluy River; 4 = rivers in the Pur catchment; 5 = rivers in the Taz catchment; 6 = rivers in the western Ob Gulf catchment; 7 = rivers in the eastern Ob Gulf catchment; 8 = rivers in the Taz Gulf catchment; 9 = bogs and swampy areas.
Table 2.
Ratio between actual Kt (in formula 3) and critical Kt, 5% (5% significance) variance, Student t test.
Table 2.
Ratio between actual Kt (in formula 3) and critical Kt, 5% (5% significance) variance, Student t test.
| Area | 1 | 2 | 3 | 4 | 5 | 6 | 7 | 8 | 9 |
|---|---|---|---|---|---|---|---|---|---|
| 1 | 0.00 | 1.29 | 1.13 | 2.63 | 0.98 | 1.32 | 1.39 | 0.95 | 0.64 |
| 2 | 1.29 | 0.00 | 1.84 | 0.19 | 1.08 | 1.24 | 0.86 | 0.34 | 1.19 |
| 3 | 1.13 | 1.84 | 0.00 | 3.49 | 0.79 | 0.38 | 2.41 | 1.54 | 0.54 |
| 4 | 2.63 | 0.19 | 3.49 | 0.00 | 1.84 | 2.48 | 0.95 | 0.31 | 2.42 |
| 5 | 0.98 | 1.08 | 0.79 | 1.84 | 0.00 | 0.39 | 1.82 | 1.08 | 0.73 |
| 6 | 1.32 | 1.24 | 0.38 | 2.48 | 0.39 | 0.00 | 1.70 | 1.07 | 0.76 |
| 7 | 1.39 | 0.86 | 2.41 | 0.95 | 1.82 | 1.70 | 0.00 | 0.34 | 1.39 |
| 8 | 0.95 | 0.34 | 1.54 | 0.31 | 1.08 | 1.07 | 0.34 | 0.00 | 0.92 |
| 9 | 0.64 | 1.19 | 0.54 | 2.42 | 0.73 | 0.76 | 1.39 | 0.92 | 0.00 |
Note: statistically significant difference is in bold. Numerals 1–9 stand for names of areas: 1 = rivers in the Yenisey catchment; 2 = rivers in the Nadym catchment; 3 = Poluy River; 4 = rivers in the Pur catchment; 5 = rivers in the Taz catchment; 6 = rivers in the western Ob Gulf catchment; 7 = rivers in the eastern Ob Gulf catchment; 8 = rivers in the Taz Gulf catchment; 9 = bogs and swampy areas.
Table 3.
Average values of hydrochemical parameters of river (four provinces) and bog (region as a whole) waters.
Table 3.
Average values of hydrochemical parameters of river (four provinces) and bog (region as a whole) waters.
| I Ob Gulf Catchment (Western Part) | II Catchments of Ob Gulf (western part) and Taz Gulf | III Upper Taz Reaches and Taz Tributaries | IV Yenisei Triburaties | V Bogs | |||||||||||
|---|---|---|---|---|---|---|---|---|---|---|---|---|---|---|---|
| A | δA | N | A | δA | N | A | δA | N | A | δA | N | A | δA | N | |
| pH, | 7.05 | 0.07 | 56 | 6.17 | 0.07 | 134 | 7.03 | 0.14 | 19 | 7.04 | 0.11 | 32 | 5.64 | 0.17 | 41 |
| Water classification after [46] | |||||||||||||||
| Class/ group/ type | C/Ca/II | C/Ca/II | C/Ca/II | C/Ca/I | C/Ca/I(II) | ||||||||||
| mgO/L | |||||||||||||||
| PO | 10.34 | 1.42 | 72 | 11.80 | 0.99 | 96 | 13.10 | 1.82 | 13 | 11.77 | 0.96 | 12 | 53.55 | 17.45 | 8 |
| BO | 20.55 | 1.82 | 65 | 30.62 | 2.30 | 108 | 27.68 | 2.70 | 17 | 20.50 | 1.61 | 23 | 167.85 | 41.35 | 8 |
| mg/L | |||||||||||||||
| CO2 | 15.0 | 3.1 | 21 | 9.3 | 1.8 | 16 | 2.1 | 1.1 | 5 | 7.1 | 1.6 | 18 | 18.2 | 3.9 | 8 |
| Σmi | 72.0 | 5.3 | 84 | 36.8 | 2.2 | 126 | 62.0 | 8.0 | 19 | 136.8 | 23.1 | 49 | 98.9 | 16.5 | 41 |
| Ca2+ | 8.0 | 0.6 | 84 | 4.2 | 0.2 | 126 | 8.1 | 1.0 | 19 | 14.1 | 1.9 | 49 | 0.9 | 0.4 | 8 |
| Mg2+ | 3.8 | 0.3 | 84 | 1.8 | 0.1 | 126 | 3.3 | 0.5 | 19 | 6.9 | 1.0 | 49 | 0.5 | 0.2 | 8 |
| Na+ | 6.5 | 0.9 | 84 | 3.6 | 0.3 | 126 | 3.7 | 0.8 | 19 | 8.7 | 2.7 | 49 | 0.7 | 0.3 | 8 |
| K+ | 0.7 | 0.1 | 84 | 0.5 | 0.1 | 126 | 1.0 | 0.3 | 19 | 2.7 | 1.2 | 49 | 0.2 | 0.1 | 8 |
| HCO3− | 35.9 | 3.0 | 84 | 17.3 | 1.5 | 126 | 38.4 | 5.9 | 19 | 88.8 | 14.2 | 49 | 5.4 | 2.9 | 8 |
| Cl− | 9.1 | 1.0 | 84 | 4.2 | 0.4 | 126 | 3.0 | 0.5 | 19 | 5.5 | 1.4 | 49 | 0.8 | 0.2 | 8 |
| SO42− | 7.8 | 0.7 | 84 | 7.7 | 1.0 | 126 | 3.6 | 0.5 | 19 | 10.1 | 3.3 | 49 | 3.5 | 1.0 | 8 |
| NO3− | 0.22 | 0.13 | 4 | 0.28 | 0.06 | 70 | 0.81 | 0.39 | 10 | 1.21 | 0.31 | 27 | 0.07 | 0.03 | 8 |
| NO2− | 0.01 | 0.00 | 8 | 0.03 | 0.00 | 71 | 0.01 | 0.00 | 10 | 0.13 | 0.08 | 19 | 0.01 | 0.00 | 8 |
| NH4+ | 0.53 | 0.20 | 4 | 0.35 | 0.05 | 74 | 0.31 | 0.06 | 11 | 0.57 | 0.09 | 17 | 2.55 | 0.47 | 8 |
| Phosphates | 0.06 | 0.04 | 4 | 0.14 | 0.04 | 54 | 0.06 | 0.03 | 5 | 0.02 | 0.01 | 8 | 0.05 | 0.02 | 8 |
| Si | 4.75 | 0.37 | 71 | 5.25 | 0.37 | 80 | 5.04 | 0.75 | 13 | 3.06 | 0.52 | 11 | 2.44 | 0.56 | 8 |
| Fe | 0.644 | 0.064 | 80 | 1.247 | 0.096 | 135 | 0.744 | 0.139 | 19 | 0.550 | 0.090 | 34 | 8.135 | 2.591 | 41 |
| μg/L | |||||||||||||||
| Ni | 2.3 | 0.5 | 16 | 10.1 | 2.2 | 62 | 22.1 | 8.5 | 9 | 21.9 | 5.8 | 15 | 2.7 | 0.4 | 41 |
| Cu | 0.8 | 0.1 | 4 | 8.9 | 1.8 | 62 | 6.1 | 2.3 | 9 | 8.0 | 1.4 | 15 | 0.5 | 0.1 | 8 |
| Zn | 2.3 | 0.9 | 4 | 15.4 | 4.2 | 62 | 19.7 | 14.4 | 9 | 63.1 | 18.8 | 15 | 7.1 | 2.2 | 8 |
| Cd | <0.01 | <0.01 | 4 | 0.28 | 0.07 | 45 | 0.07 | 0.05 | 9 | 0.04 | 0.01 | 9 | 0.03 | 0.01 | 8 |
| Pb | <0.1 | <0.1 | 4 | 2.0 | 0.5 | 62 | 2.1 | 0.9 | 9 | 2.5 | 0.7 | 15 | 1.0 | 0.5 | 8 |
Note: A and δA are, respectively, arithmetic mean and its error found by Equation (1); N is the number of measurements; BO and PO are carbon oxygen demand for potassium bichromate and potassium permanganate, respectively; Σmi is the total of major ions (Ca2+, Mg2+, Na+, K+, HCO3−, CO32−, SO42−, and Cl−).
Table 4.
Average values of trace elements in rivers of the Kara basin, sampled in September 2020, μg/L.
Table 4.
Average values of trace elements in rivers of the Kara basin, sampled in September 2020, μg/L.
| Element | Element Concentration (September 2020) | A* [36] | |
|---|---|---|---|
| A | δA | ||
| Li | 1.72 | 0.23 | 2.23 |
| B | 8.63 | 2.32 | 11.10 |
| Al | 169.5 | 74.4 | 27.8 |
| Ti | 5.77 | 3.89 | 0.39 |
| V | 0.80 | 0.28 | 1.01 |
| Cr | 0.96 | 0.16 | 0.27 |
| Mn | 15.93 | 3.51 | 34.00 |
| Co | 0.18 | 0.04 | 0.13 |
| Ni | 1.97 | 0.37 | 1.17 |
| Cu | 0.63 | 0.10 | 1.06 |
| Zn | 1.44 | 0.28 | 2.36 |
| Ge | 0.01 | 0.00 | 0.01 |
| As | 0.72 | 0.09 | 0.45 |
| Rb | 0.46 | 0.08 | 0.64 |
| Sr | 23.21 | 5.11 | 69.70 |
| Y | 0.311 | 0.044 | 0.051 |
| Mo | 0.040 | 0.012 | 0.670 |
| Cd | 0.003 | 0.001 | 0.004 |
| Cs | 0.008 | 0.005 | 0.002 |
| Ba | 5.55 | 0.66 | 22.40 |
| Pb | 0.105 | 0.047 | 0.090 |
| La | 0.217 | 0.042 | 0.166 |
| Ce | 0.475 | 0.096 | 0.310 |
| Pr | 0.064 | 0.011 | 0.046 |
| U | 0.031 | 0.019 | 0.300 |
Note: A is the arithmetic mean value; δA is the rms error found by Equation (1), at N = 23; A* = average over the rivers of the Kara basin according to [36].
Publisher’s Note: MDPI stays neutral with regard to jurisdictional claims in published maps and institutional affiliations. |
© 2021 by the authors. Licensee MDPI, Basel, Switzerland. This article is an open access article distributed under the terms and conditions of the Creative Commons Attribution (CC BY) license (https://creativecommons.org/licenses/by/4.0/).
Share and Cite
MDPI and ACS Style
Ivanova, I.; Savichev, O.; Trifonov, N.; Kolubaeva, Y.V.; Volkova, N. Major-Ion Chemistry and Quality of Water in Rivers of Northern West Siberia. Water 2021, 13, 3107. https://doi.org/10.3390/w13213107
AMA Style
Ivanova I, Savichev O, Trifonov N, Kolubaeva YV, Volkova N. Major-Ion Chemistry and Quality of Water in Rivers of Northern West Siberia. Water. 2021; 13(21):3107. https://doi.org/10.3390/w13213107
Chicago/Turabian StyleIvanova, Irina, Oleg Savichev, Nikolay Trifonov, Yulia V. Kolubaeva, and Natalia Volkova. 2021. "Major-Ion Chemistry and Quality of Water in Rivers of Northern West Siberia" Water 13, no. 21: 3107. https://doi.org/10.3390/w13213107
Note that from the first issue of 2016, this journal uses article numbers instead of page numbers. See further details here.