
Hydrochemical Characteristics of Groundwater at the Epicenter of the 2021 Biru M6.1 Earthquake in Central Tibet


National Institute of Natural Hazards, Ministry of Emergency Management of China, Beijing 100085, China
*
Author to whom correspondence should be addressed.
Water 2021, 13(21), 3111; https://doi.org/10.3390/w13213111
Submission received: 1 October 2021
/
Revised: 22 October 2021
/
Accepted: 29 October 2021
/
Published: 4 November 2021
(This article belongs to the Special Issue Earthquakes and Groundwater)
Abstract
:Groundwater is undoubtedly important for water security and eco-environmental protection, especially in areas that experience earthquakes. Analyzing the characteristics and variation of groundwater after an earthquake is significant to obtain a better understanding of the seismic risk and rational management of groundwater resources. This study investigated the hydrogeochemical characteristics of groundwater at the epicenter of the 2021 Biru M6.1 earthquake in central Tibet, southwest China, using 23 water samples. The results showed that: (1) the hydrochemical type, hydrogen and oxygen isotope ratios, and SiO2 concentrations of three hot spring water samples in the study area were significantly different from those of samples taken elsewhere, indicating that the hot spring water originates from deeper geothermal reservoirs and has undergone more distant migration and longer fractionation processes; (2) the geochemical characteristics of groundwater from some sampling sites in the epicentral area were apparently distinct from those of other shallow groundwater or surface water samples, suggesting that the groundwater environment in the epicentral area has been affected by the earthquake. Along with the macroscopic groundwater responses in the epicentral area after the earthquake, we investigated the influencing mechanisms of the earthquake on the regional groundwater environment. We conclude that a shorter distance from the epicenter to the seismogenic fault leads to a greater possibility of the generation of new fractures, which then induce macroscopic responses and chemical characteristic variations for groundwater.
1. Introduction
The hydrochemistry of groundwater is generally regulated by precipitation, geological structure, rock type, residence time, and geochemical processes along the groundwater flow paths [1,2,3]. Hydrothermal activities are closely related to deep faults and active faults, and geothermal fluids can rapidly migrate along the fault channels [4,5]. In the processes of earthquake generation and occurrence, changes in the stress conditions of aquifers and mixing of deep and shallow fluids can cause variations in the chemical composition of groundwater in the fault zone and nearby areas [6,7,8,9,10]. Therefore, we can capture possible earthquake precursor signals by analyzing the geochemical characteristics of groundwater associated with earthquakes, especially using the geochemical anomalies of geothermal water [11,12,13,14].
Crustal earthquakes induce large tectonic and crustal deformations, such as surface ruptures, liquefaction, and mountain landslides, in affected regions. Simultaneously, these geological structure deformations and ground shaking usually trigger hydrological and environmental phenomena [15,16]. Such phenomena involve the eruption of mud volcanoes, increased streamflow discharge, formation of new springs, depletion of existing springs, liquefaction, and water chemical composition changes [8,17,18,19,20]. Compared with macroscopic effects, such as surface ruptures, river flow changes, and building collapses, microscopic effects, such as changes in groundwater flow and hydrogeochemistry, are more difficult to identify. However, they can be useful parameters for understanding the responses to an earthquake [21].
Chemical components and stable isotopes in groundwater are fundamental criteria for discerning the sources of groundwater and tracking the hydrochemical evolution [21,22,23]. Combining isotopic techniques and hydrochemical methods can further improve the accuracy and reliability of the analysis results regarding fluid recharge sources and source depth in the fault zone [24,25]. Hydrochemical composition and environmental isotopes serve as tracers in water cycle studies. They record the history of water transport and transformation to a certain extent and can effectively reveal the transformation relationship between surface water and groundwater in the drainage basin [26]. In recent years, many observation tools and methods have been applied to explore groundwater sources and compositional variations. For instance, long-term continuous observations of groundwater have been conducted to obtain information on changes in the groundwater environment or sources [27,28]. Groundwater monitoring has revealed that geochemical anomalies in δ2H and δ18O isotopes, and Li+, Na+, SO42−, and Cl− ions correlate well with the occurrence of an earthquake [6,11]. For example, after the 1998 Adana M6.2 earthquake, Na+ and Cl− concentrations in groundwater at the TR167 sampling site in the Cokcapinar area increased nearly twofold within 1 week [29]. Before and after the M5.5 and M5.6 earthquakes in Iceland in October 2012 and April 2013, respectively, the δ2H, δ18O, Si, Na+, and Ca2+ concentrations of groundwater in the seismic region exhibited apparent high-value anomalies [11]. Therefore, a comprehensive analysis of the chemical ion and isotopic composition characteristics of the groundwater in the epicentral area can provide critical criteria for determining the impacts of an earthquake on the regional groundwater.
Although it has been widely reported that water chemical characteristics change before and after earthquakes, it is difficult to obtain accurate geochemical characteristics of groundwater due to great uncertainties caused by both the natural factors (aquifer lithology, travel time, geological structures, etc.) and anthropogenic disturbance [30]. Therefore, researchers often combine various methods to characterize the chemical characteristics of groundwater. The concentrations of major cations can also be noticeably modified by cation exchange, such as Piper diagrams [31,32], Na-K-Mg ternary diagrams [33], and Gibbs diagrams [34], and are effective approaches to identify the hydrochemical type, water maturity, and geogenic sources of ions in groundwater. The silica saturation concentration of geothermal fluid in the spring can be applied to calculate the equilibrium temperature of the underground thermal fluid [35]. The hydrogen and oxygen stable isotopes are effective diagnostic tools for studying water sources and hydrological processes [36,37]. Apart from these chemical analysis methods, some statistical methods, such as factor analysis, can also be used to identify groundwater sources and explain complicated relationships between hydrochemical components [30].
On 19 March 2021, an M6.1 earthquake occurred in Biru County in southwestern China. As is known to all, earthquakes can have significant influences on groundwater systems. The occurrence of this earthquake provides a good experimental field for us to study the impact of earthquakes on groundwater systems. Information on the geochemical characteristics of groundwater in the epicentral area is important for disaster assessment. The objective of this study was to systematically characterize the groundwater response at the epicenter of the Biru M6.1 earthquake based on hydrogeochemical and isotopic data in combination with surface deformation information. In this study, the methods of geochemical and statistical analysis were employed to characterize the geochemical characteristics of groundwater in the epicentral area. This work aimed to (1) identify the key factors controlling the chemical evolution of groundwater in the epicentral area; (2) ascertain the effect of the earthquake on the groundwater system. Such results can accumulate more knowledge for the research of groundwater systems affected by earthquakes, and the findings will have scientific implications for groundwater sustainable management in the epicentral area.
2. Study Area and Methodology
2.1. Study Area
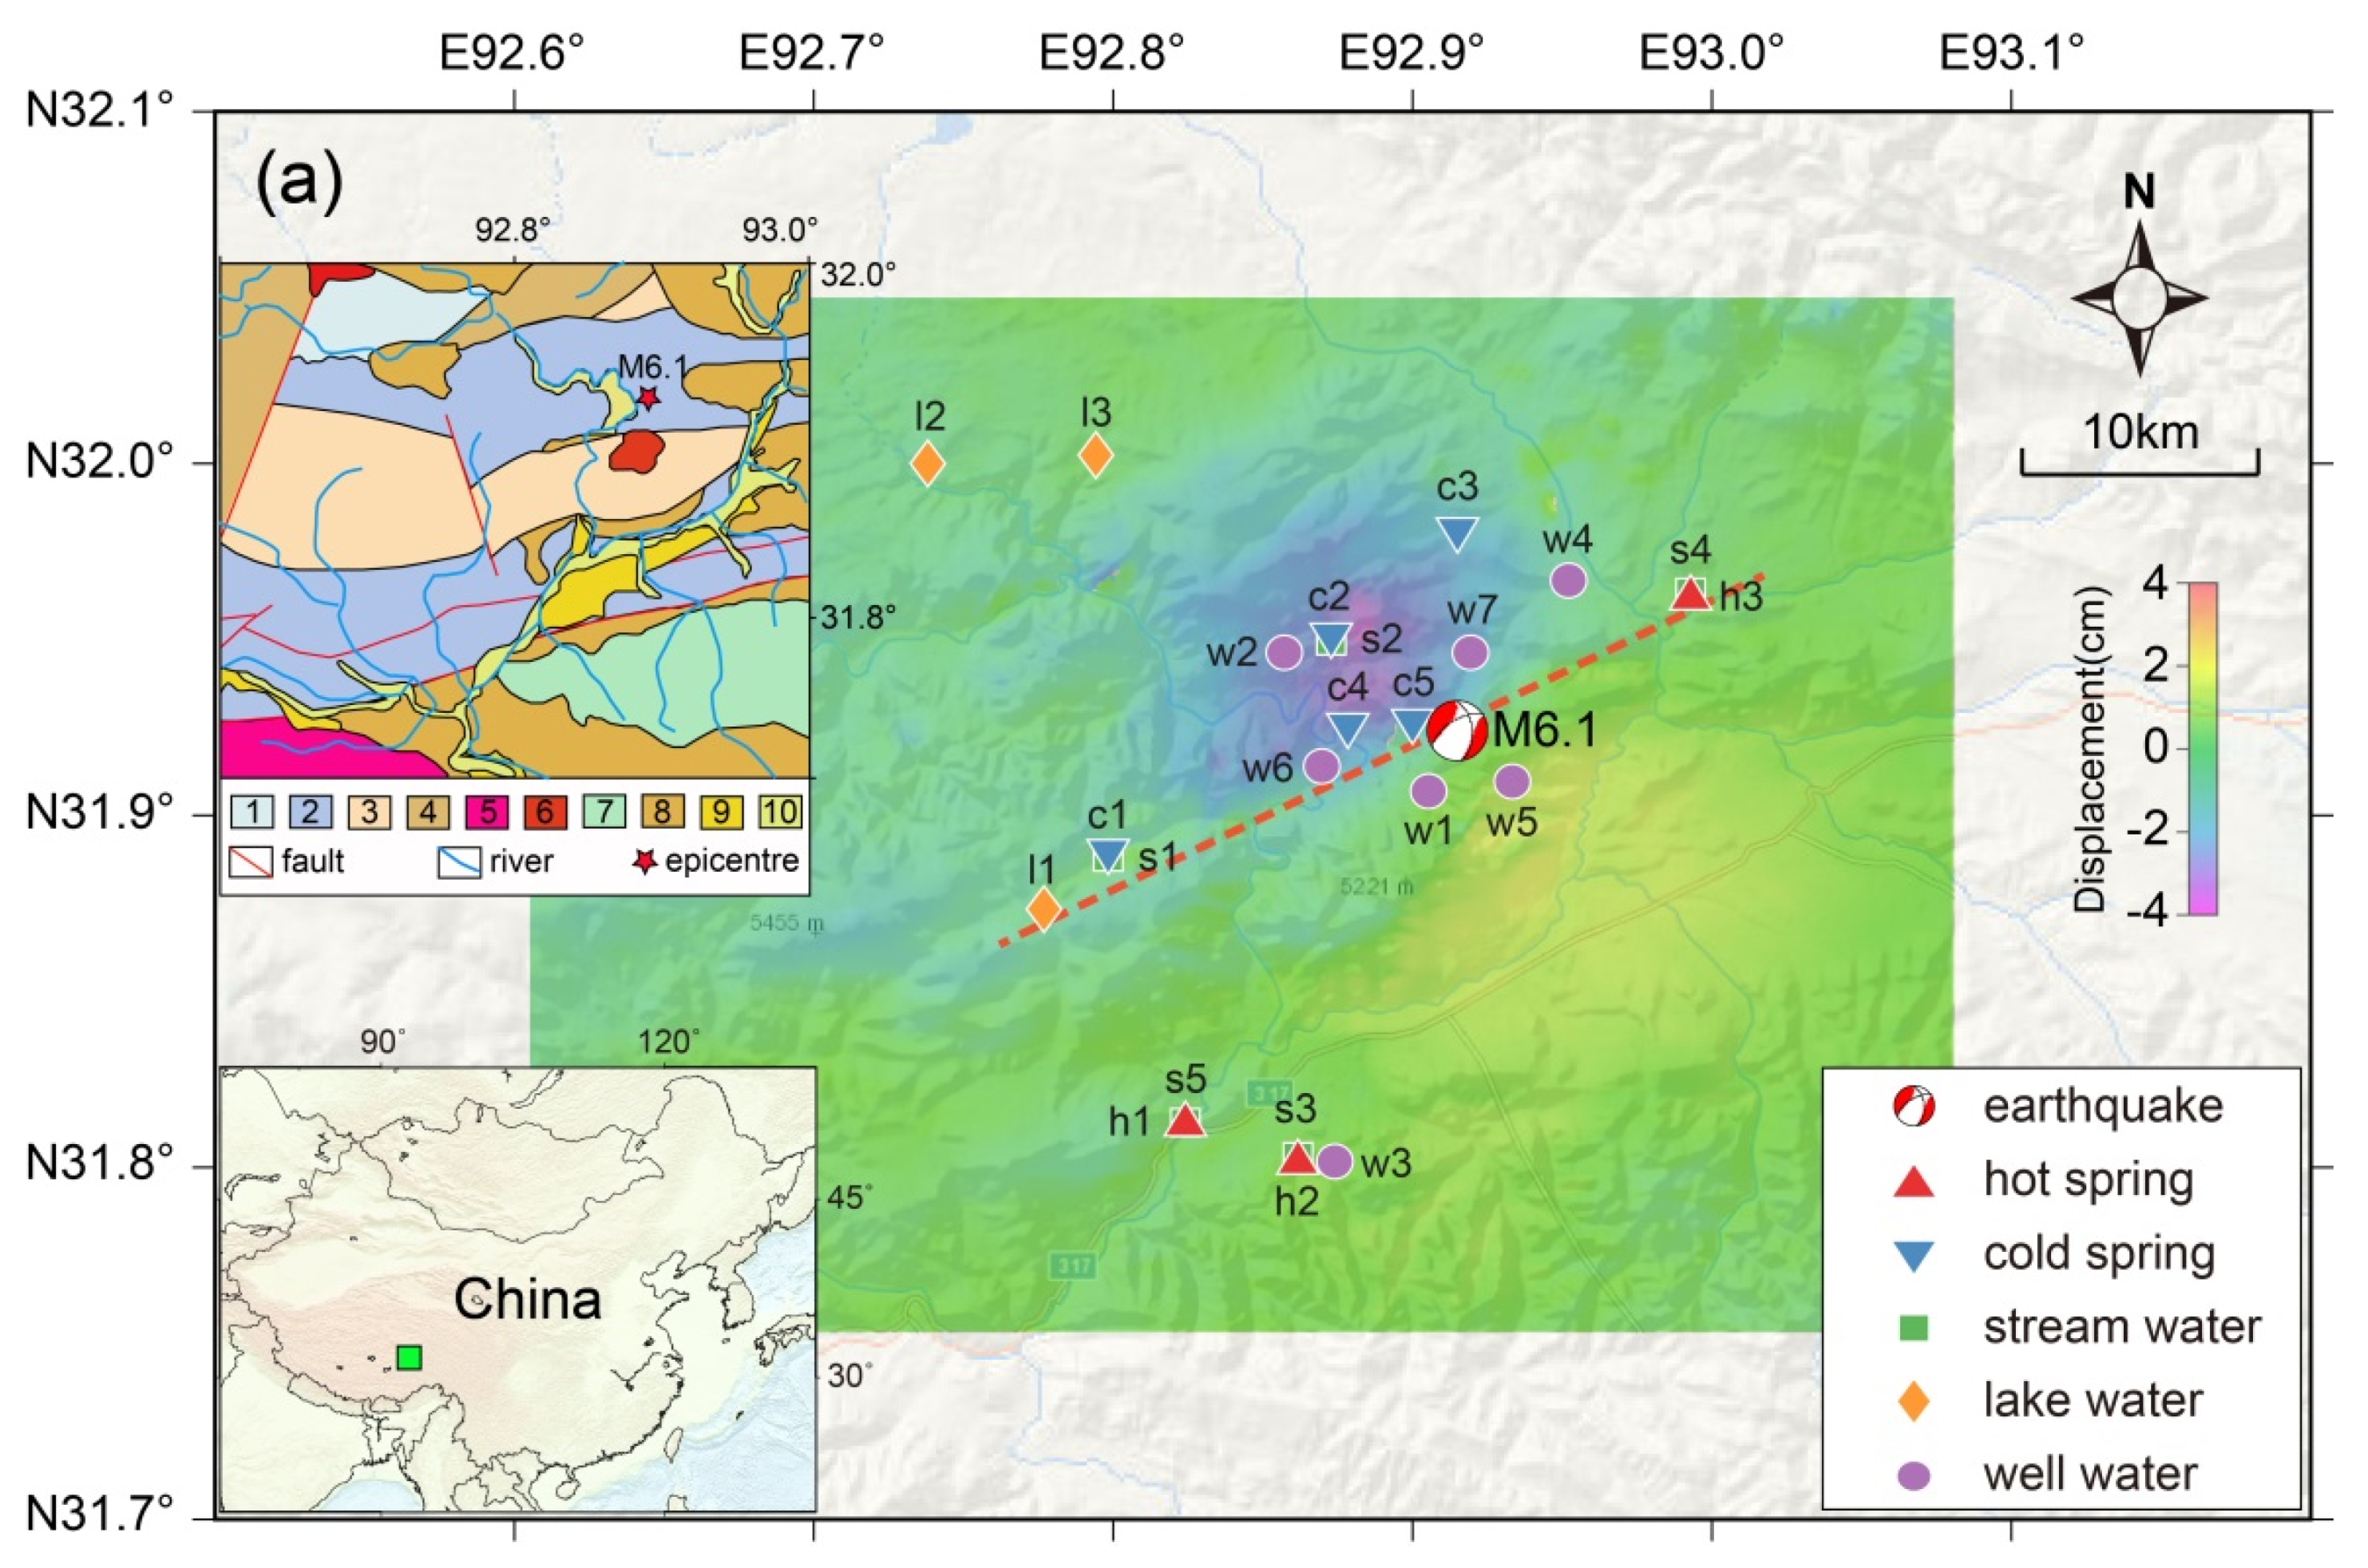
According to the China Earthquake Networks Center, an M6.1 earthquake occurred in Biru County, Nagqu city, Tibet at 14:11 on March 19, 2021 (Beijing time). The epicenter was at 31.94 N°, 92.74 43 E°, and the focal depth was 10 km. A Sentinel-1 data-based automated seismic deformation monitoring system [38] was used to extract the interferograms of coseismic ground deformation caused by this earthquake. The interferograms demonstrated the spatial coverage of the coseismic deformation field and deformation intensity (Figure 1). There are two large faults 20~30 km in the south of the epicenter. The lithology of the nearby area is mainly dolomite, schist, limestone, and slate. The groundwater resources around the epicentral area are abundant, and groundwater flow out of the surface to form many rivers, streams, and lakes.
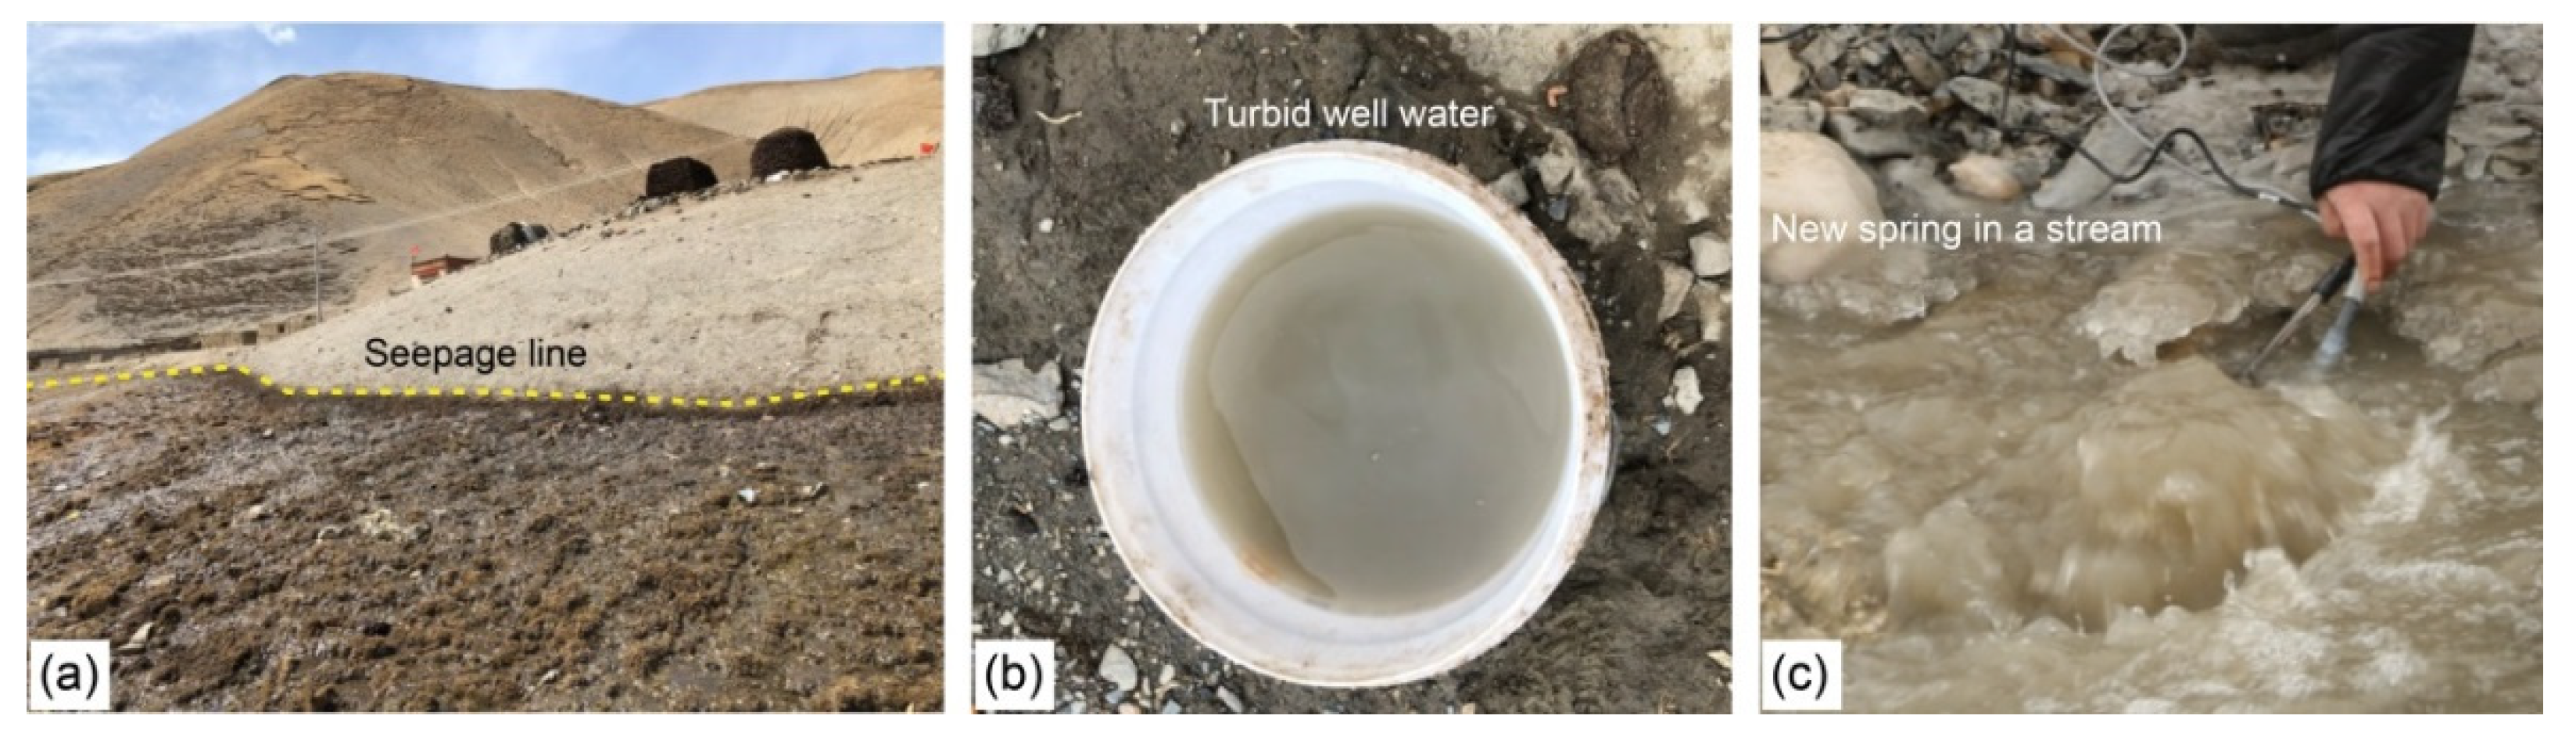
After the earthquake, we investigated the groundwater responses in areas around the epicenter of this earthquake between 27 and 29 March 2021. We found that, due to the topography and tectonic settings, the coseismic responses of groundwater were more intense in the hanging wall (the northwest side of the seismogenic fault) than in the footwall (the southeast side). These groundwater responses included (1) new seepage lines after the earthquake (Figure 2a); (2) turbid well water (Figure 2b); and (3) new spring outcrops (Figure 2c) or increased spring flow rate. All of these phenomena indicate that the earthquake affected the regional groundwater media and that the shallow crustal deformation triggered by the earthquake modified the groundwater flow paths.
2.2. Sample Collection and Analysis
We collected groundwater and surface water samples at the sites with apparent groundwater responses to analyze the hydrochemical characteristics of groundwater in the epicentral area. The sampling time was from 27 to 29 March 2021, and the weather in these three days was sunny, so the effect of precipitation on the sampling could be ignored. The spatial locations of the epicenter of the Biru M6.1 earthquake and the sampling sites for hydrochemical analysis are illustrated in Figure 1. The water samples were mostly taken from hot springs (temperature above 30 °C), cool springs (temperature lower than 10 °C), streams, lakes, and wells near the epicenter, with 23 samples in total (including 3 hot spring water, 5 cool spring water, 5 stream water, 3 lake water, and 7 well water samples). All the water samples were stored in portable bottles, and the pH, TDS, and temperature were measured at the same time as the sampling. The hydrochemical ion concentrations, hydrogen and oxygen isotope ratios, and SiO2 content of the samples were examined in the Laboratory of Crustal Dynamics, China Earthquake Administration. The pH was tested in situ using a portable multi-parameter monitor. The δ2H and δ18O values were measured with an LWIA 912–0008 liquid water isotope analyzer from Los Gatos Research. Na+, K+, Ca2+, Mg2+, SO42−, NO3−, and Cl− concentrations were measured by ion chromatography; HCO3− and CO32− concentrations were measured by traditional titration with HCl; and soluble SiO2 was measured using silicon molybdenum yellow spectrophotometry. According to the charge balance verification of all hydrochemical data, the ionic balance error was within the limit value of ±5%, indicating the accuracy of our data.
3. Results
3.1. Hydrochemical Types and Characteristics
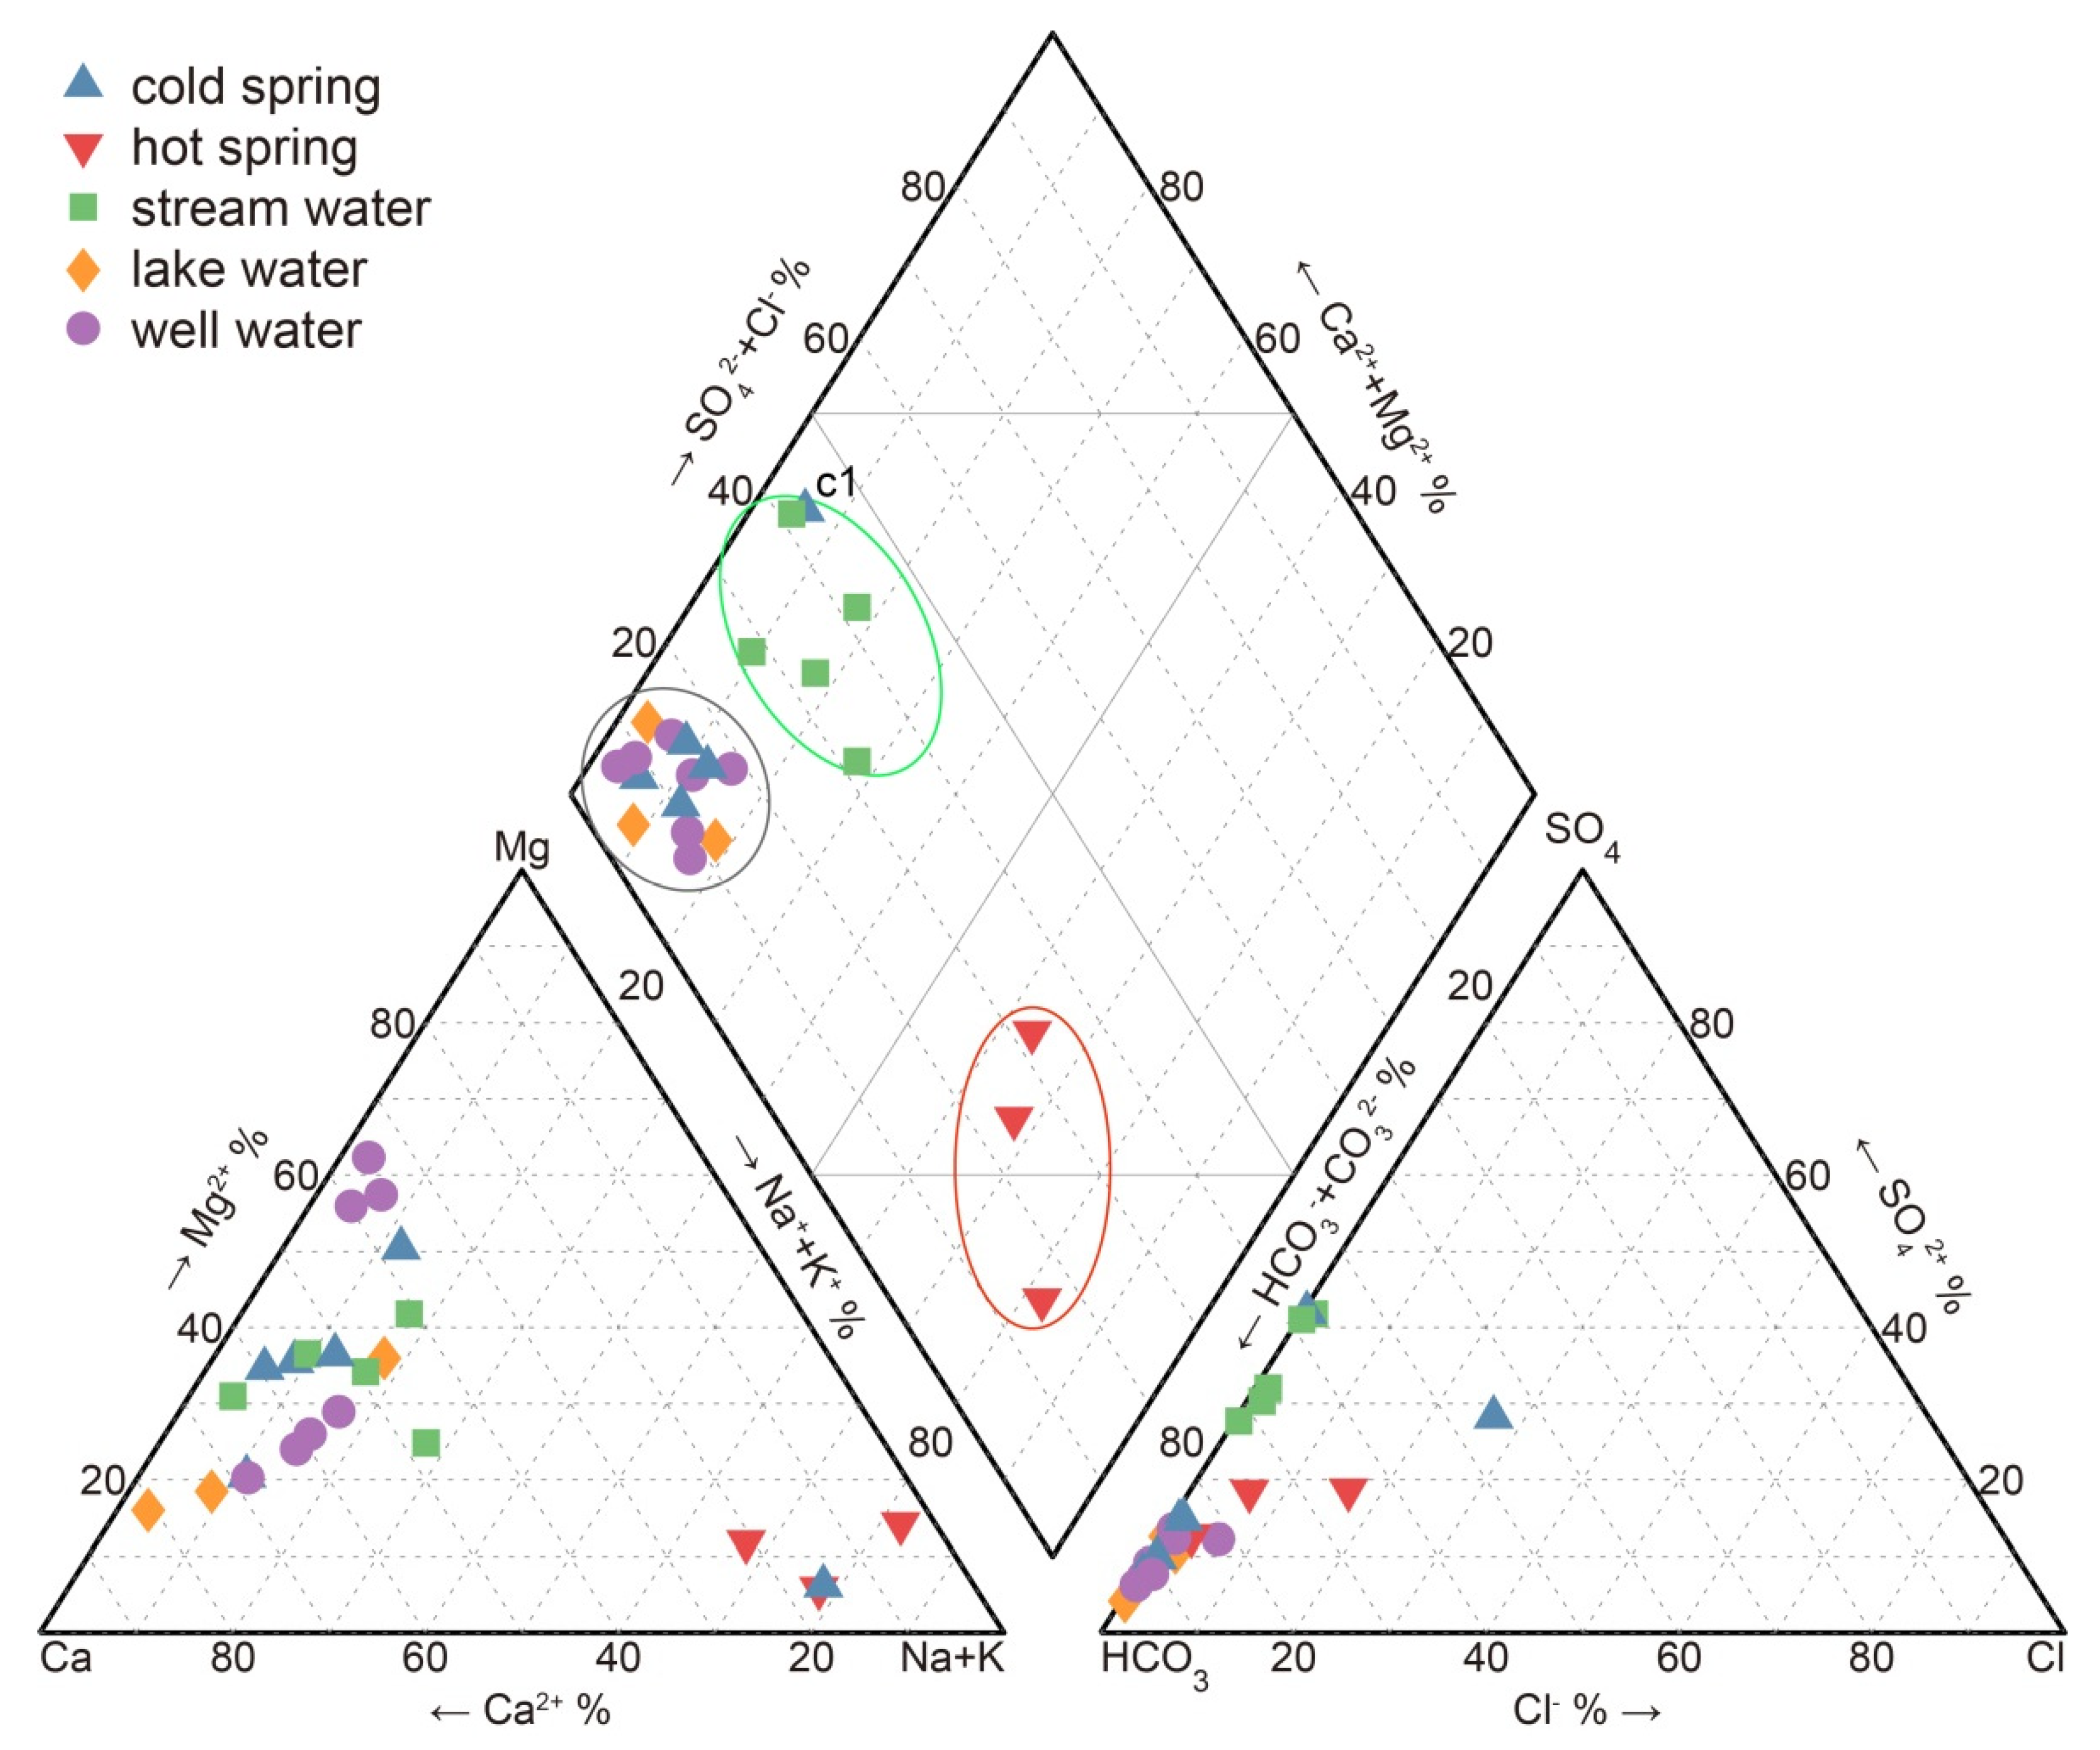
The results are shown in Table 1. The hydrochemical concentration data reveal that the hydrochemical characteristics of three hot springs (sites h1–h3) were significantly different from those of the water samples from other sites. These hot spring water samples had relatively higher Na+, K+, SO42+, and TDS levels and lower pH values. The Piper diagram is an important tool for comprehending the hydrochemical characteristics, types, and evolution of groundwater [31,32]. Figure 3 shows that the lake water, cool spring, and well water are characterized by the HCO3·SO4-Ca·Mg type, and the stream and hot spring water are characterized by the HCO3-Ca·Mg and HCO3-Na types, respectively. One exception is the c1 sample, which is characterized by the HCO3·SO4-Ca·Mg type, similar to stream water.
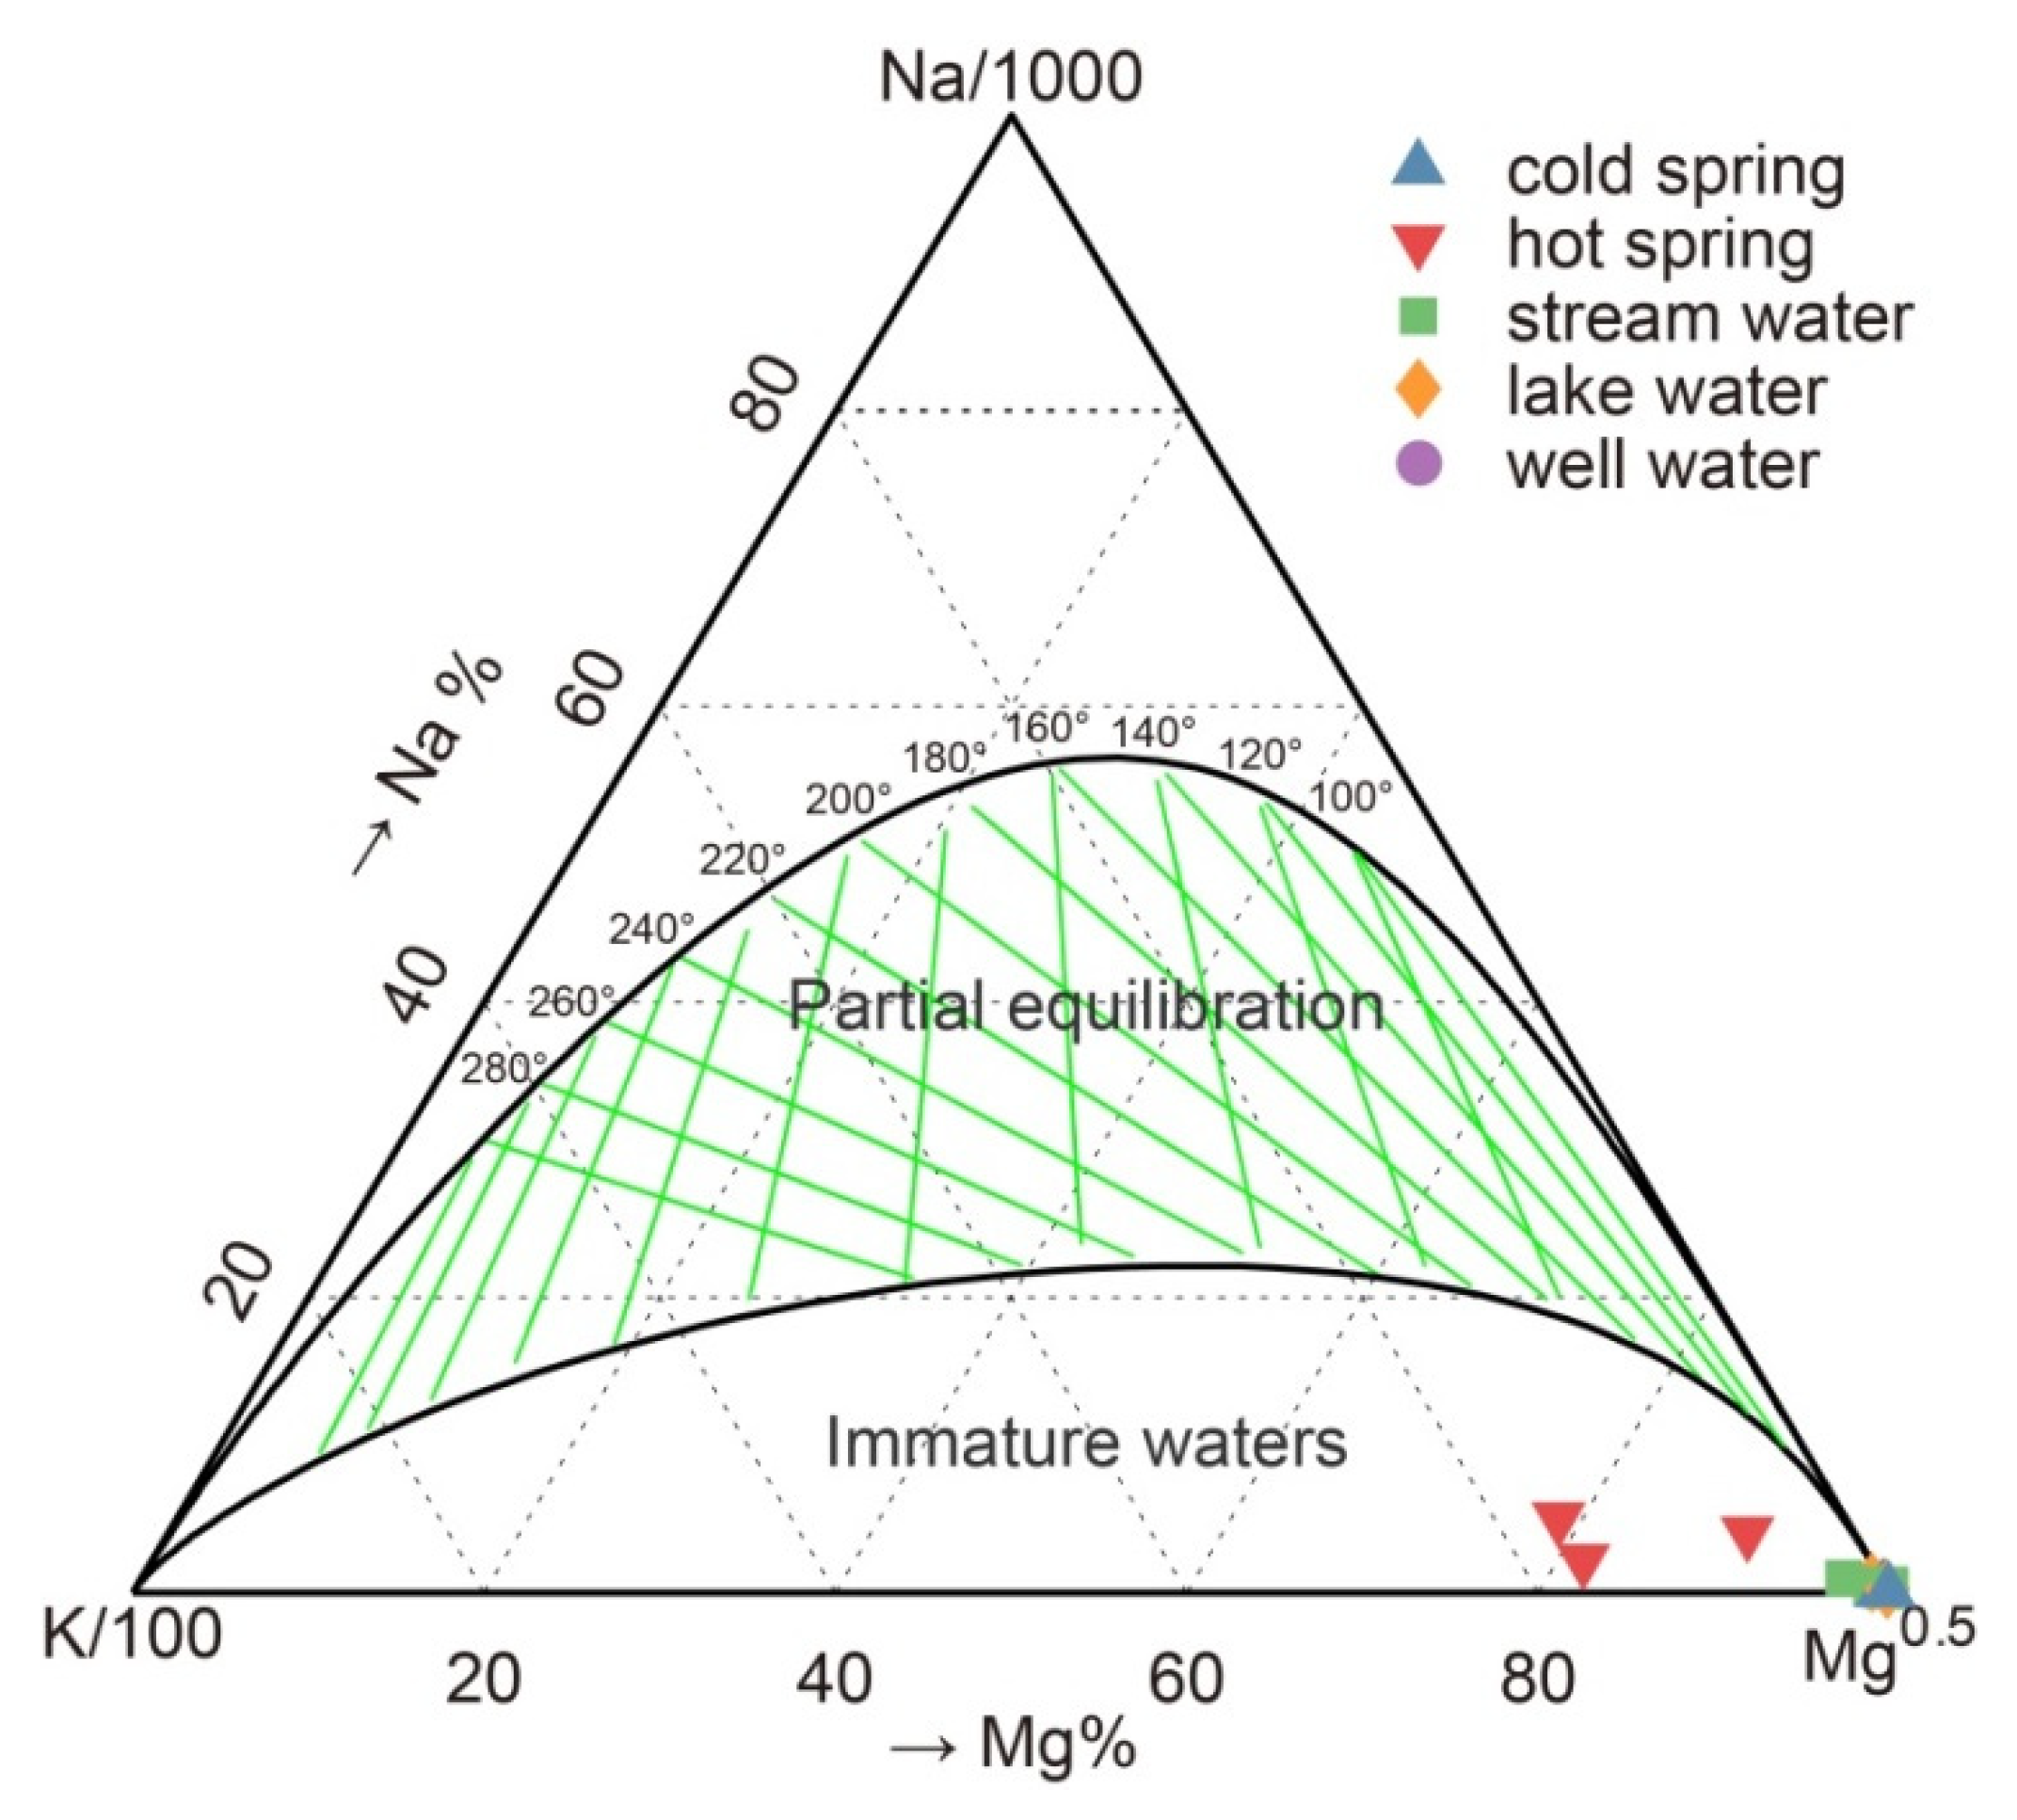
The Na-K-Mg ternary diagram gives an eyeball classification of whether thermal water has attained full equilibrium, partial equilibrium, or is immature with respect to rocks at a given temperature. It can be used to analyze the equilibrium of water–rock interactions, depth of groundwater circulation, and other data that is helpful for determining the open and closed conditions of a system, the timing, and the transport processes [33]. The apparently quite arbitrary line in the Na-K-Mg ternary diagram separating immature from partially equilibrated waters actually corresponds to a value of the maturity index (MI). The main value of the MI = 2.0 curve lies in its use in distinguishing waters suitable for the application of the K-Mg-Ca-geobarometer or not. Figure 4 shows that the water from all sampling sites in this study falls close to the Mg-corner in the ‘immature waters’ region, which means that those water samplings in this study are not suitable for the application of the K-Mg-Ca-geobarometer to estimate the temperature. In comparison, the groundwater at the three hot spring sites was slightly further away from the Mg-corner, indicating that the groundwater originated from deeper environments.
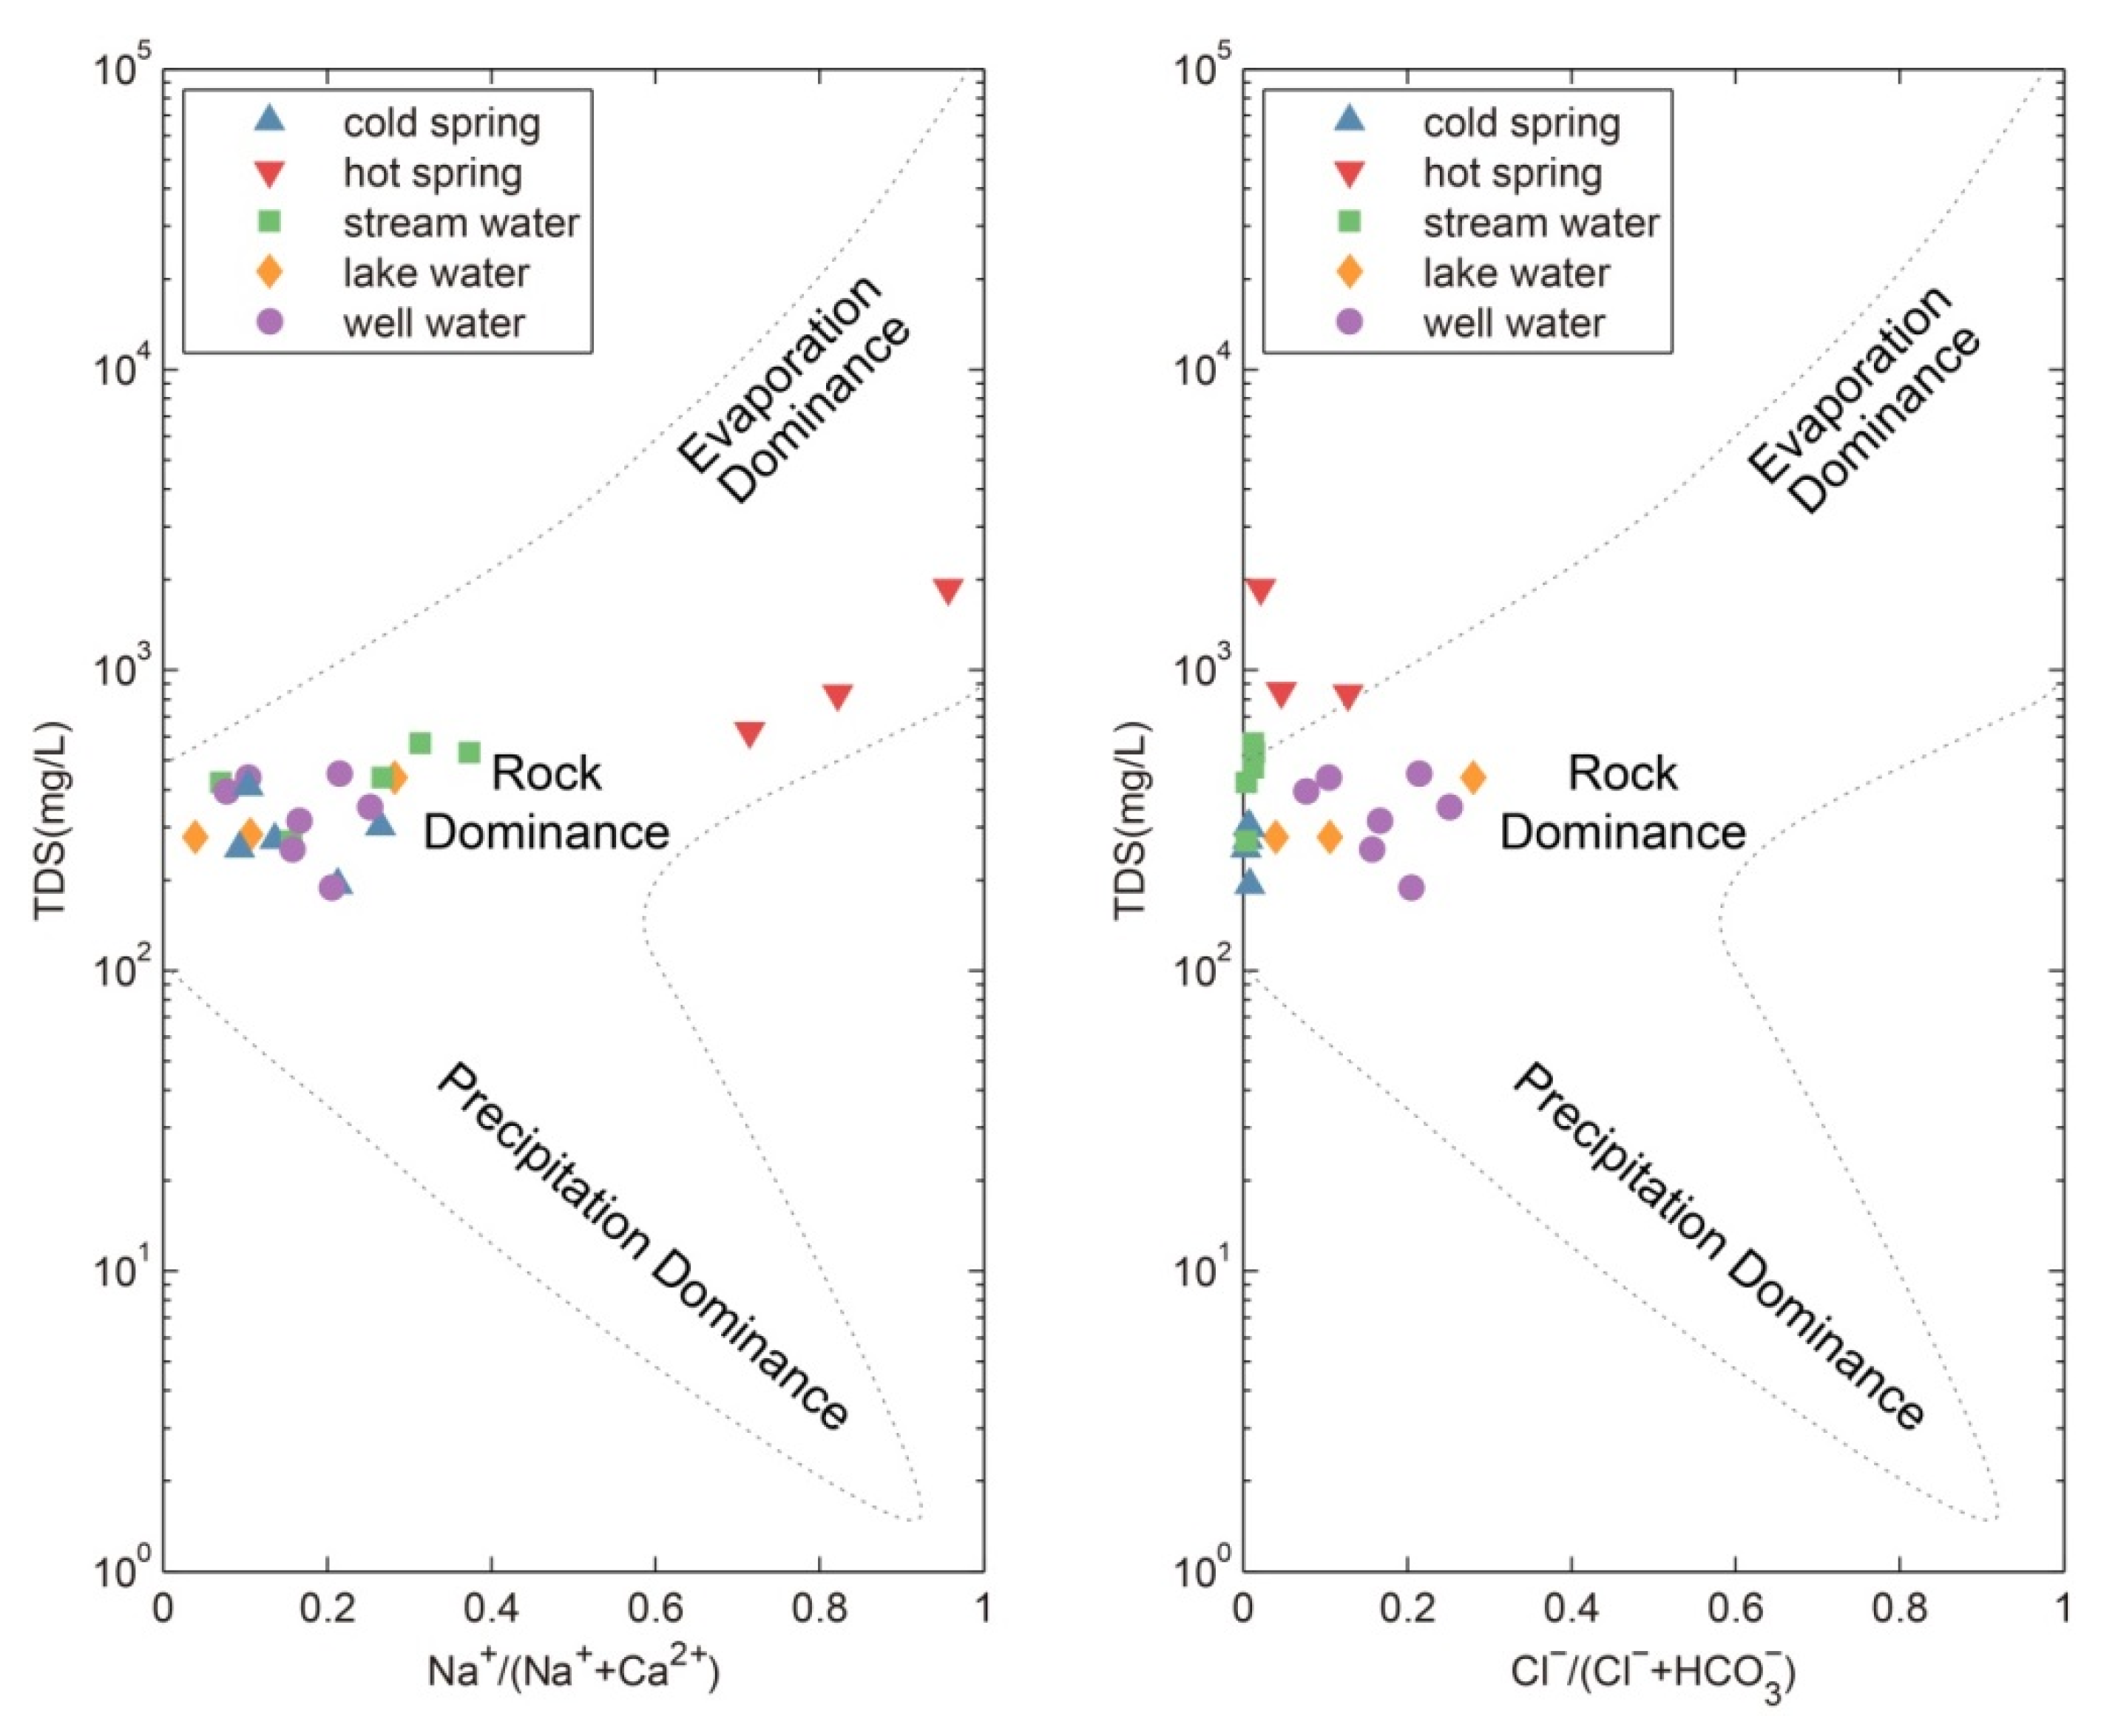
Gibbs diagrams were constructed by the equivalence ratios of Na+/(Na+ + Ca2+) and Cl−/(Cl− + HCO3−) versus TDS. This method has been widely used to identify hydrogeochemical evolution processes, which involve precipitation, rock weathering, and evaporation–crystallization [34]. As shown in Figure 5, except for three hot springs, all other water samples collected in this study lie in the rock-weathering dominance area, indicating that the main hydrochemical process of the local water is water–rock interaction. However, three samples collected from the hot springs fell within the transition region between evaporation and rock-weathering, suggesting that the water in the hot springs was influenced by both evaporation and water–rock interactions, possibly due to the high temperature.
3.2. Hydrogen and Oxygen Stable Isotopes
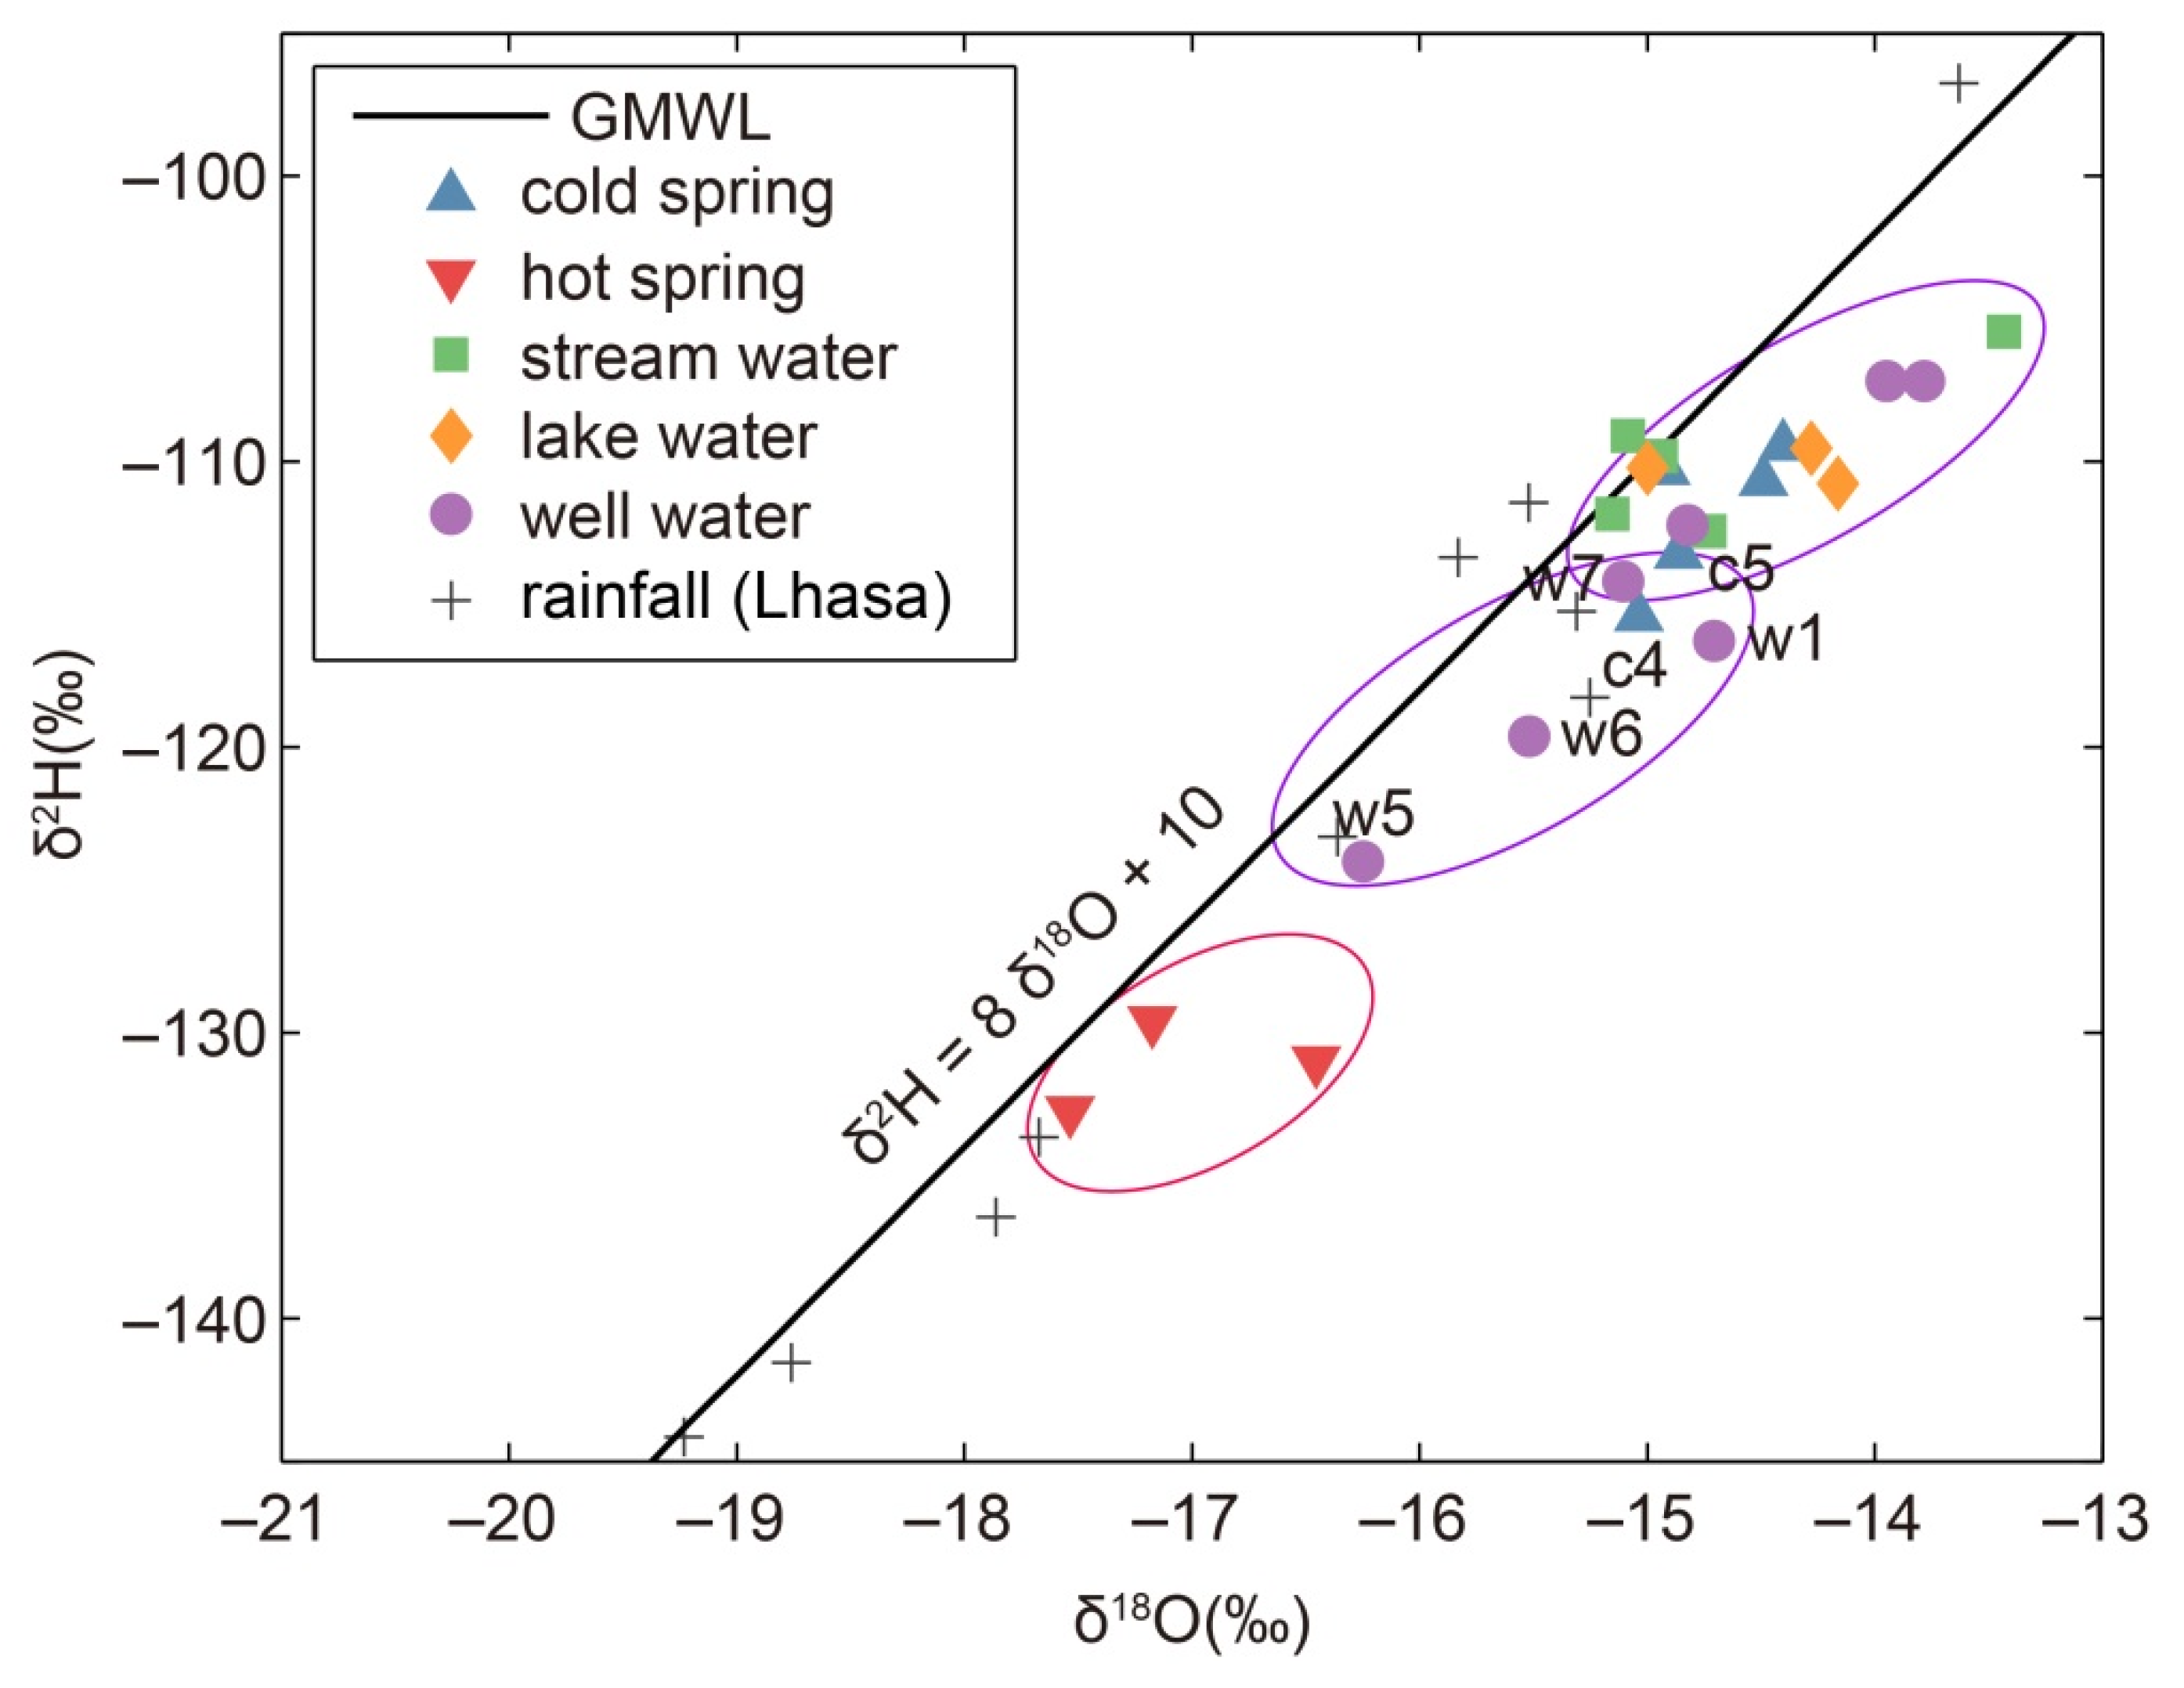
δ2H and δ18O are effective diagnostic tools for studying water sources and hydrological processes [36,37]. The values of δ2H and δ18O shown in Table 1 were compared with the global meteoric water line (GMWL), as shown in Figure 6. Although the hydrogen and oxygen isotope values of the water from all 23 sampling sites were close to the GMWL, three hot spring water samples (sites h1–h3) had relatively low δ2H and δ18O values, distributed from −129.60‰ to −132.73‰ and from −16.46‰ to −17.53‰, respectively. Based on the ranges of the δ2H and δ18O values, we divided the 23 water samples into three groups: hot spring water samples (h1–h3), epicenter samples (w1, w5–7, and c4–c5), and other samples (Figure 6). It is noteworthy that the hydrogen and oxygen isotope ratios of the water from the sampling sites near the epicenter of the Biru M6.1 earthquake lie between the values of the other samples and hot spring water samples, especially for the samples from sites w5 and w6.
3.3. SiO2 Concentration and Underground Temperature
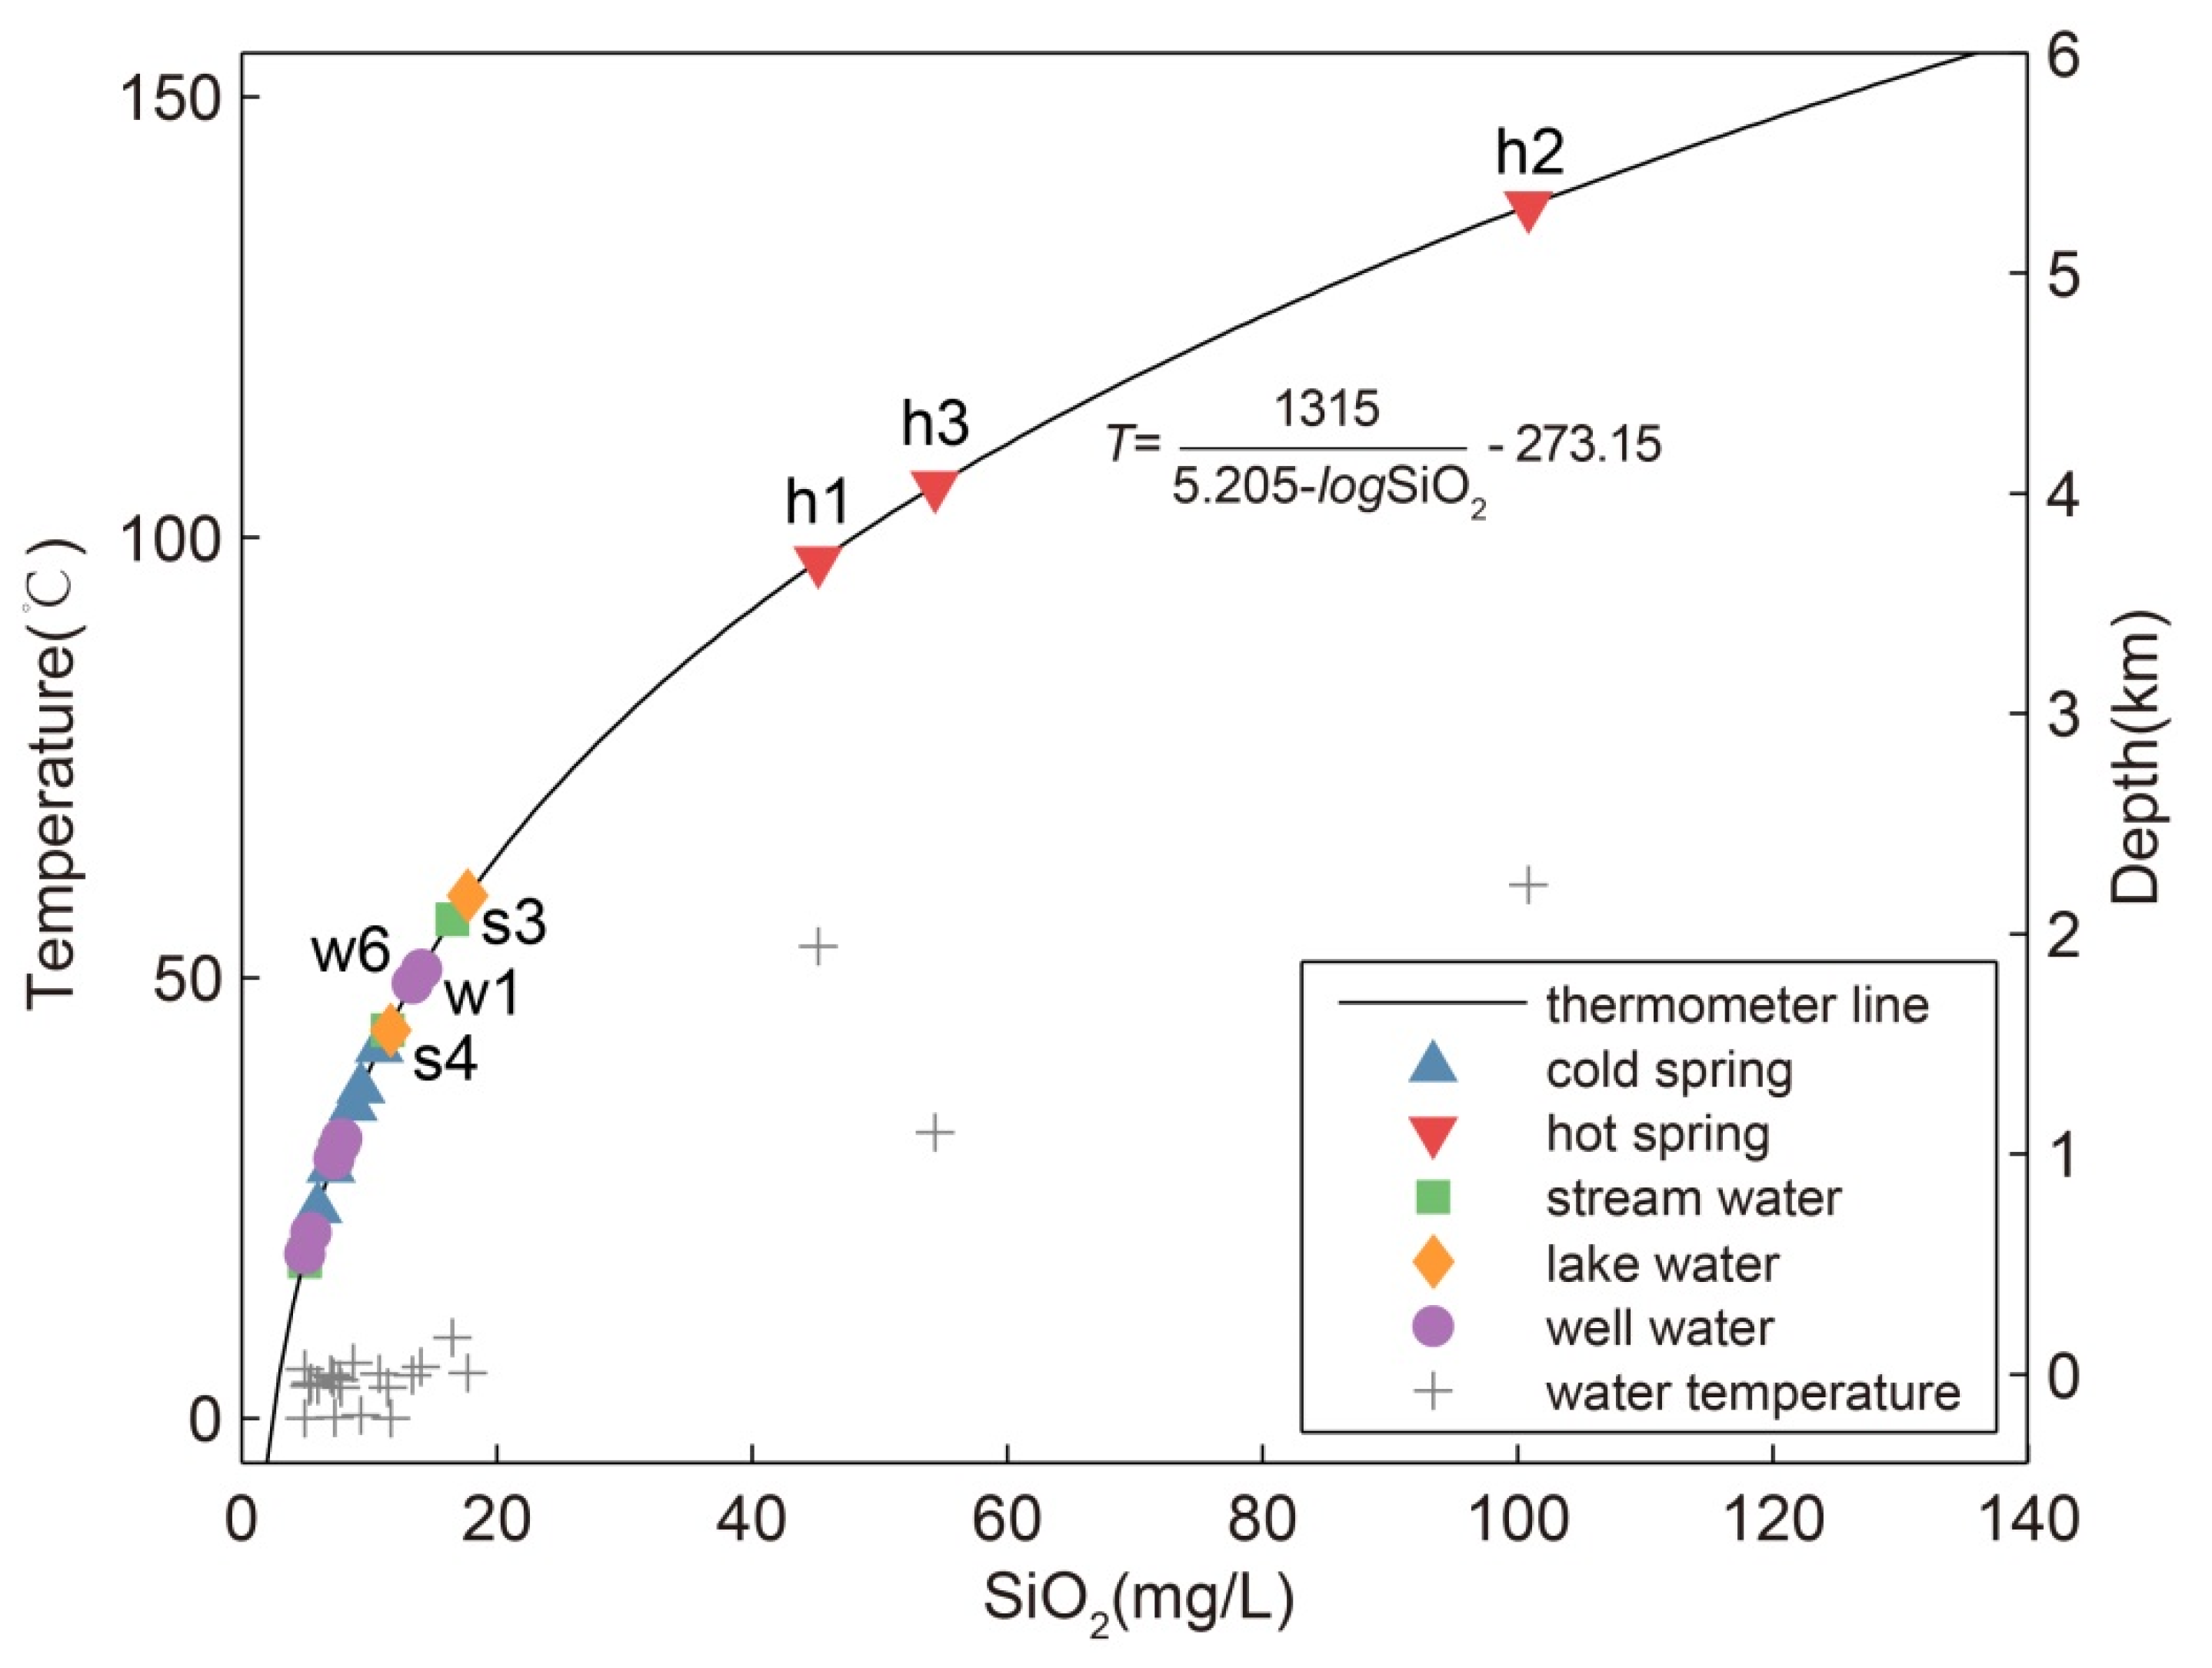
A silica geothermometer was applied to calculate the equilibrium temperature of the underground thermal fluid using the silica saturation concentration of geothermal fluid in the spring or wellhole [35]:
It can be seen from Table 1 that the water from the three hot spring sites had a significantly higher SiO2 content than that from other sampling sites, indicating a higher underground temperature of the last equilibrium with quartz and greater circulation depth. Based on the SiO2 content values in Table 1, we calculated the geothermal reservoir temperature for each sampling site using Equation (1) and estimated the circulation depth using a constant geothermal gradient of 25 °C/km. As shown in Figure 7, the three hot spring sites had higher geothermal reservoir temperatures and deeper circulation paths. Among them, the circulation depth at the site h5 exceeded 5 km. It is worth noting that the well waters from sites w1 and w6 in the epicentral area had higher SiO2 contents than other well water samples. Moreover, the higher SiO2 content of the stream water at s3 and s4 is probably because of mixing with water from nearby hot springs.
3.4. Factor Analysis of Hydrochemical Characteristics
Groundwater is constantly exchanging material with the surrounding environment in the process of circulation, and its component sources are mainly affected by the lithology of the strata through which groundwater flows. The chemical composition of groundwater is affected by water–rock interaction, human activities, and atmospheric factors. Here, we used the factor analysis method to identify groundwater sources and explain complicated relationships between the hydrochemical components in the study area.
Because the hydrochemical characteristics of three hot spring water samples are obviously different from other samples, only 20 other samples were considered in our factor analysis, and the results are shown in Table 2. Four common factors were extracted by factor analysis, which explained 90.81% of the variance. The first factor is highly correlated with Na+ and K+, the second factor is highly correlated with Cl− and NO3−, the third factor is highly correlated with Mg2+ and HCO3−, and the fourth factor is highly correlated with SO42−. The sum of the contribution rates of the first two factors is 52.09%, with components of Na+, K+, Cl−, and NO3−, which mainly originate from the dissolution of evaporite, human activity, or precipitation. The sum of the contribution rates of the last two factors is 38.72%, with components of Mg2+, HCO3−, and SO42−, which mainly originate from the dissolution of carbonatite. The previous analysis showed that the δ2H and δ18O values in the groundwater in the study area were close to the precipitation line. Therefore, we believe that the groundwater in the study area is mainly derived from meteoric water, which has subsequently undergone the water–rock interaction with surrounding evaporites and carbonates, such as Precambrian dolomite and Jurassic limestone (Figure 1).
4. Discussion
Groundwater mainly originates from atmospheric precipitation. After infiltration from the surface into the ground, water exhibits various hydrochemical characteristics after undergoing migration for various durations over different pathways. The hydrochemical type of the groundwater or surface water sample indicates the specific migration pathways and water–rock interactions experienced by the water body at the sampling site. The differences in hydrogen and oxygen isotope values suggest that the water bodies have different sources and have undergone different fractionation processes during migration. In this study, the hydrochemical anion and cation concentrations, hydrogen and oxygen isotope ratios, carbon dioxide content, TDS, pH, and temperature of the three hot spring sites were different from those at other sites. This is because the water at these sites migrated to the surface along deep faults and experienced relatively deep pathways in high-temperature regions. Water–rock interactions, ion exchange, and isotope fractionation were extensive during the migration of these water samples.
In a stable groundwater system, the groundwater’s chemical characteristics and isotope values at a certain point are relatively stable. However, once the system is disrupted or disturbed due to the formation of new fractures, changes in water flow pathways, enhanced permeability, mixing with other water bodies, etc., the hydrochemical characteristics of the water may vary accordingly. Such changes can be triggered by an earthquake, especially a near-field earthquake. Although water samples were not obtained before the Biru M6.1 earthquake in this study, and only the hydrochemical and isotopic data after the earthquake were collected, we can still capture or infer the effects of this earthquake on the regional groundwater environment from the investigated groundwater responses and available hydrochemical data. For example, new seepage lines appeared after the earthquake at c1, close to the seismogenic fault, a new spring appeared at s1, and the well water became turbid at w5, near the epicentral area.
The impacts of an earthquake on groundwater environments can not only be manifested in macroscopic physical phenomena, but also be inferred from the chemical characteristics of groundwater. For instance, the hydrochemical type of the water sample from c1, a spring flowing from a new fracture after the earthquake, is different from that of other cool springs or well water but similar to that of the newly emerged spring in the nearby stream (s1). This indicates that both new springs flow out of the surface from the new fracture generated by this earthquake and that the newly emerged seepage line and spring water are sourced from the same groundwater system. Moreover, the spatial locations of c1 and s1 are relatively close to the seismogenic fault of this earthquake, which further supports our assertion. According to the results of hydrogen and oxygen isotope analysis, the δ2H and δ18O ratios of the well water from sites around the epicenter, w5 and w6, fall between the values of other samples and hot spring water samples, indicating that the aquifer media where the wellholes are located are also mixed with groundwater from deeper horizons because of this earthquake. The deeper groundwater most probably flowed into the observation aquifer along the new fractures generated by the earthquake. Similarly, the SiO2 content of the well water from w1 and w6 near the epicenter was relatively high, suggesting that these well waters are also mixed with groundwater that migrates from a high-temperature (deep) environment into the wellholes along new fractures.
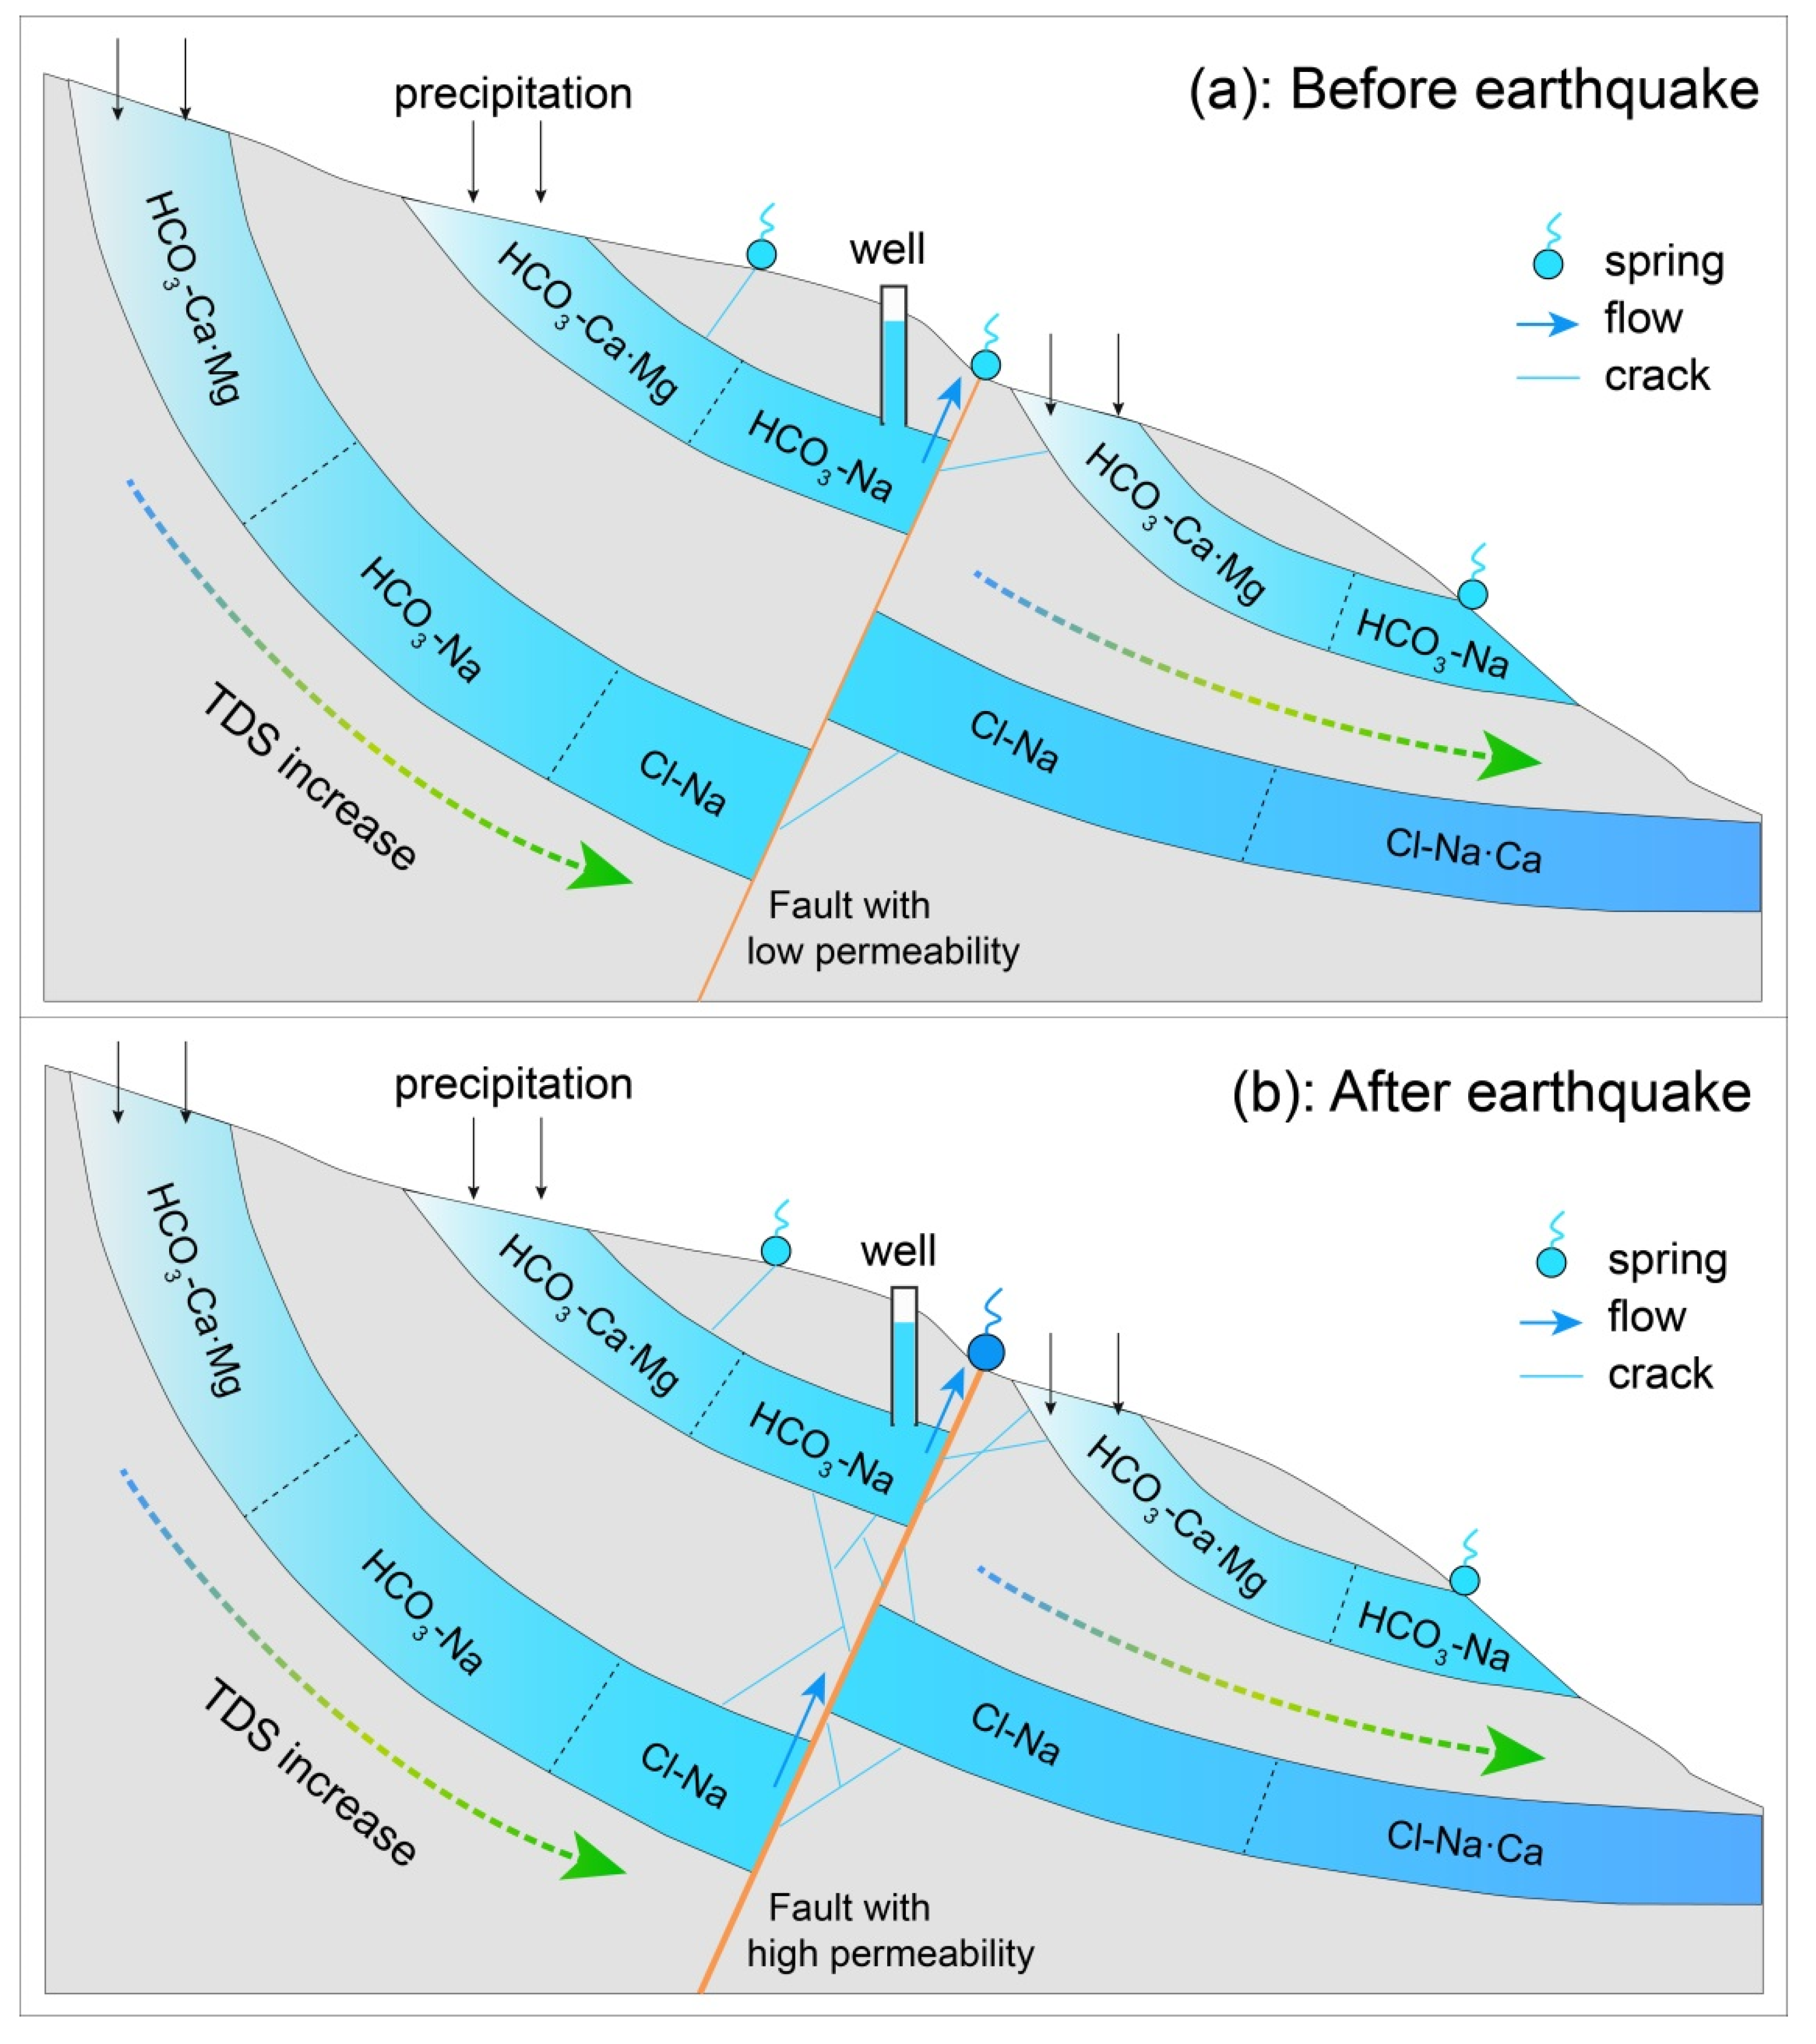
For confined aquifers in a drainage basin, the horizontal zonation of the groundwater chemical features depends on the degree of water circulation (degree of water exchange). The degree of groundwater circulation is determined by regional tectonics, compositions of the water-bearing rocks, elevation of the recharge area, and recharge conditions. As shown in Figure 8a, atmospheric precipitation infiltrates the subsurface and flows along the aquifer, partially or entirely displacing the highly mineralized connate water. A series of hydrochemical zones were formed due to the mixing of the original highly mineralized water with the infiltrated water and the physicochemical interactions between the infiltrated water and porewater in the aquifer. Along the groundwater flow direction, the hydrochemical zone alternates with a continuously increasing mineralization degree and decreasing δ2H and δ18O values.
The occurrence of an earthquake can increase the permeability or pore pressure of the fault zone [15,19,39]. One reason for this is the formation of new fractures or the flushing out of materials that filled the fault during the earthquake, which can cause various physicochemical changes in the groundwater. Figure 8b demonstrates that the earthquake triggered the formation of new fractures around the seismogenic fault, and the permeability of the fault also increased. Subsequently, the flow rate of the groundwater rising along the fault zone increased, and the flow rate of the spring water flowing out of the surface fault rupture also increased. As new fractures emerged near the fault, groundwater from deeper horizons could migrate upward along the fractures and mix with the shallow aquifers, which manifested as variations in the well water level or turbid well water. These phenomena lead to the exchange of hydrochemical compositions between groundwater and the surrounding rocks and can weaken or strengthen water–rock interactions, followed by changes in hydrochemical anion and cation concentrations and stable isotope values. Moreover, even though the subsurface media are anisotropic and inhomogeneous, and their hydrochemical characteristics are different at each site, new fractures are more likely to form in areas closer to the epicenter or the seismogenic fault after the earthquake. Thus, the possibility of the occurrence of physical responses and hydrochemical characteristic there is also higher. The mechanisms behind these phenomena are currently under discussion or being quantitatively analyzed, so their details are currently unclear. To obtain a better understanding, further observation data should be collected in future studies.
It should be noted that there is some inevitable forecast deviation due to the uncertainties of the input data and setting parameters, and some methods or models have their own applicability. As pointed by Giggenbach, before applying the K-Mg-Ca-geobarometer (Figure 4), the suavity of a water should be checked or by determining its maturity index (MI), and the main value of the MI = 2.0 curve lies in its use in distinguishing waters suitable for the application of the K-Mg-Ca-geobarometer or not [33]. When the flow rate of a hot spring is large and fast and the liquid phase is maintained, it is better to calculate the deep heat storage temperature by using the concentration of SiO2. The silica geothermometer used in this study (Figure 7) is suitable for the water cooled by heat conduction and no steam loss [35]. On the other hand, the geothermal gradient in the crust is not uniform as we assumed in this study. As a result, there is some inevitable deviation in the estimated temperature and depth by using the concentration of SiO2. Although there may be some uncertainties or errors in a single method due to its limitation, the results would be more reliable by combining different methods to determine the hydrochemical characteristics of groundwater in one study area.
As is well known, the geochemical characterization of groundwater is affected by aquifer lithology and geological structures. Factor analysis shows that the groundwater in the epicentral area of Biru M6.1 earthquake is mainly derived from meteoric water, which has subsequently undergone water–rock interaction with surrounding evaporites and carbonates, such as dolomite and limestone. As a result, the hydrochemical types of shallow groundwater are mainly HCO3-Ca·Mg and HCO3·SO4-Ca·Mg, except for three hot springs that are typed as HCO3-Na. Combining the results of hydrochemistry and stable isotopes (δ2H and δ18O) analysis, we speculate that the occurrence of an earthquake results in the local groundwater system changing in the epicentral area. There was little research on the hydrochemical characteristics of groundwater in the area before the Biru M6.1 earthquake. Our studies identified the key factors controlling the chemical evolution of groundwater and ascertained the effect of the earthquake on the groundwater system. In addition to obtaining first-hand field data, our findings will have scientific implications for groundwater sustainable management in the study area.
5. Conclusions
A comprehensive analysis of the hydrochemical data of 23 water samples at the epicenter of the 2021 Biru M6.1 earthquake, SW China, was conducted to provide a basis for understanding the hydrochemical characteristics of groundwater at the epicenter and the associated influence of the earthquake on groundwater environments. The results obtained were as follows: (1) the hydrochemical type of the three hot spring sites in the study area was HCO3-Na, while those of other sites were HCO3-Ca·Mg and HCO3·SO4-Ca·Mg. The results of the hydrogen and oxygen isotopes and SiO2 content analysis indicated that, compared with other sampling sites, the hot spring water originates from deeper geothermal reservoirs and has undergone more distant migration with longer fractionation processes. (2) The hydrochemical characteristics of the groundwater samples from the sites in the epicentral area are significantly different from those of other shallow groundwater or surface water samples. Anomalies include the anion and cation concentrations of the c1 water sample, the δ2H and δ18O ratios of the well water samples from w5 and w6, and the SiO2 content of the well water from w1, which suggest that the groundwater environment in the epicentral area has been affected by the earthquake. (3) After the earthquake, new fractures are more likely to occur in areas closer to the epicenter or seismogenic fault, which leads to macroscopic responses and chemical characteristic variations of groundwater. The results of this study provide references for further understanding the groundwater geochemical evolution processes in this area and in other similar areas. In addition, the data on hydrochemical characteristics contribute to a better understanding of the seismic risk in the area.
Author Contributions
Conceptualization, X.S. and P.Y.; methodology, D.L. and Z.H.; software, X.S. and Y.L.; validation, X.S.; formal analysis, X.S.; investigation, X.S., P.Y., D.L. and Z.H.; resources, X.S.; data curation, P.Y.; writing—original draft preparation, X.S.; writing—review and editing, X.S.; visualization, X.S.; supervision, P.Y.; project administration, X.S.; funding acquisition, X.S. All authors have read and agreed to the published version of the manuscript.
Funding
This research was funded by National Natural Science Foundation of China (41972253), National Key R&D Program of China (2017YFC1500502) and a research grant from the National Institute of Natural Hazards, Ministry of Emergency Management of China (ZDJ2019-06).
Institutional Review Board Statement
Not applicable.
Informed Consent Statement
Not applicable.
Data Availability Statement
All data can be obtained from the corresponding author by request.
Acknowledgments
The authors thank Nagqu County Emergency Management Bureau for its help in the field investigation. We are grateful to anonymous reviewers for their helpful comments and suggestions.
Conflicts of Interest
The authors declare no conflict of interest.
References
- Moral, F.; Cruz-Sanjulián, J.; Olías, M. Geochemical evolution of groundwater in the carbonate aquifers of Sierra de Segura (Betic Cordillera, southern Spain). J. Hydrol. 2008, 360, 281–296. [Google Scholar] [CrossRef]
- Gastmans, D.; Chang, H.K.; Hutcheon, I. Groundwater geochemical evolution in the northern portion of the Guarani Aquifer System (Brazil) and its relationship to diagenetic features. Appl. Geochem. 2010, 25, 16–33. [Google Scholar] [CrossRef]
- Li, X.; Huang, X.; Liao, X.; Zhang, Y. Hydrogeochemical Characteristics and Conceptual Model of the Geothermal Waters in the Xianshuihe Fault Zone, Southwestern China. Int. J. Environ. Res. Public Health 2020, 17, 500. [Google Scholar] [CrossRef] [PubMed] [Green Version]
- Li, B.; Shi, Z.; Wang, G.; Liu, C. Earthquake-related hydrochemical changes in thermal springs in the Xianshuihe Fault zone, Western China. J. Hydrol. 2019, 579, 124175. [Google Scholar] [CrossRef]
- Fronzi, D.; Mirabella, F.; Cardellini, C.; Caliro, S.; Palpacelli, S.; Cambi, C.; Valigi, D.; Tazioli, A. The Role of Faults in Groundwater Circulation before and after Seismic Events: Insights from Tracers, Water Isotopes and Geochemistry. Water 2021, 13, 1499. [Google Scholar] [CrossRef]
- Du, J.G.; Si, X.Y.; Chen, Y.X.; Fu, H.; Jian, C.L.; Guo, W.S. Geochemical Anomalies Connected with Great Earthquakes in China, Geochemistry Research Advances; Nova Science Publishers Inc.: New York, NY, USA, 2008; pp. 57–92. [Google Scholar]
- Barberio, M.D.; Barbieri, M.; Billi, A.; Doglioni, C.; Petitta, M. Hydrogeochemical changes before and during the 2016 Ama-trice-Norcia seismic sequence (central Italy). Sci. Rep. 2017, 7, 1–12. [Google Scholar]
- Rosen, M.R.; Binda, G.; Archer, C.; Pozzi, A.; Michetti, A.M.; Noble, P.J. Mechanisms of earthquake-induced chemical and fluid transport to carbonate groundwater springs after earthquakes. Water Resour. Res. 2018, 54, 5225–5244. [Google Scholar] [CrossRef]
- Shi, Z.; Zhang, H.; Wang, G. Groundwater trace elements change induced by M5.0 earthquake in Yunnan. J. Hydrol. 2020, 581, 124424. [Google Scholar] [CrossRef]
- Chen, L.; Wang, G. Hydrochemical changes of a spring due to the May 30, 2014 Ms 6.1 Yingjiang earthquake, southwest China. Environ. Pollut. 2021, 284, 117125. [Google Scholar] [CrossRef]
- Skelton, A.; Andrén, M.; Kristmannsdóttir, H.; Stockmann, G.; Mörth, C.M.; Sveinbjörnsdóttir, Á.; Jónsson, S.; Sturkell, E.; Guðrúnardóttir, H.R.; Hjartarson, H.; et al. Changes in groundwater chemistry before two consecutive earthquakes in Iceland. Nat. Geosci. 2014, 7, 752–756. [Google Scholar] [CrossRef] [Green Version]
- Wang, C.-Y.; Manga, M. New streams and springs after the 2014 Mw6.0 South Napa earthquake. Nat. Commun. 2015, 6, 1–6. [Google Scholar] [CrossRef] [Green Version]
- Onda, S.; Sano, Y.; Takahata, N.; Kagoshima, T.; Miyajima, T.; Shibata, T.; Pinti, D.L.; Lan, T.; Kim, N.K.; Kusakabe, M.; et al. Groundwater oxygen isotope anomaly before the M6.6 Tottori earthquake in Southwest Japan. Sci. Rep. 2018, 8, 4800. [Google Scholar] [CrossRef] [PubMed] [Green Version]
- Hosono, T.; Yamada, C.Y.; Manga, M.; Wang, C.; Tanimizu, M. Stable isotopes show that earthquakes enhance permeability and release water from mountains. Nat. Commun. 2020, 11, 2776. [Google Scholar] [CrossRef]
- Shi, Z.; Wang, G.; Manga, M.; Wang, C.Y. Mechanism of co-seismic water level change following four great earthquakes—Insights from co-seismic responses throughout the Chinese mainland. Earth Planet. Sci. Lett. 2015, 430, 66–74. [Google Scholar] [CrossRef] [Green Version]
- Singh, P.; Mukherjee, S. Chemical signature detection of groundwater and geothermal waters for evidence of crustal de-formation along fault zones. J. Hydrol. 2020, 582, 124459. [Google Scholar] [CrossRef]
- Tsunogai, U.; Wakita, H. Anomalous changes in groundwater chemistry. Possible precursors of the 1995 Hyogo-ken Nanbu Earthquake. Japan J. Phys. Earth 1996, 44, 381–390. [Google Scholar] [CrossRef] [Green Version]
- Claesson, L.; Skelton, A.; Graham, C.; Dietl, C.; Mörth, M.; Torssander, P.; Kockum, I. Hydrogeochemical changes before and after a major earthquake. Geology 2004, 32, 641–644. [Google Scholar] [CrossRef]
- Wang, C.Y.; Manga, M. Hydrologic responses to earthquakes and a general metric. Front Geofluids 2010, 10, 206–216. [Google Scholar]
- Cox, S.; Rutter, H.; Sims, A.; Manga, M.; Weir, J.; Ezzy, T.; White, P.; Horton, T.; Scott, D. Hydrological effects of the M W 7.1 Darfield (Canterbury) earthquake, 4 September 2010, New Zealand. N. Z. J. Geol. Geophys. 2012, 55, 231–247. [Google Scholar] [CrossRef] [Green Version]
- Kim, J.; Joun, W.-T.; Lee, S.; Kaown, D.; Lee, K.-K. Hydrogeochemical evidence of earthquake-induced anomalies in response to the 2017 MW 5.5 Pohang earthquake in Korea. Geochem. Geophys. Geosyst. 2020, 21, e2020GC009532. [Google Scholar] [CrossRef]
- Capecchiacci, F.; Tassi, F.; Vaselli, O.; Bicocchi, G.; Cabassi, J.; Giannini, L.; Nisi, B.; Chiocciora, G. A combined geochemical and isotopic study of the fluids discharged from the Montecatini thermal system (NW Tuscany, Italy). Appl. Geochem. 2015, 59, 33–46. [Google Scholar] [CrossRef] [Green Version]
- Qi, J.H.; Xu, M.; An, C.J.; Wu, M.L.; Zhang, Y.H.; Li, X.; Zhang, Q.; Lu, G.P. Characterizations of geothermal springs along the Moxi deep fault in the western Sichuan plateau, China. Phys. Earth Planet Inter. 2017, 263, 12–22. [Google Scholar] [CrossRef]
- Kennedy, B.M.; Kharaka, Y.K.; Evans, W.C.; Ellwood, A.; DePaolo, D.J.; Thordsen, J.; Ambats, G.; Mariner, R.H. Mantle fluids in the San Andreas fault system. Calif. Sci. 1997, 278, 1278–1281. [Google Scholar] [CrossRef]
- Lin, A.; Tanaka, N.; Uda, S.; Satish-Kumar, M. Repeated coseismic infiltration of meteoric and seawater into deep fault zones: A case study of the Nojima fault zone, Japan. Chem. Geol. 2003, 202, 139–153. [Google Scholar] [CrossRef]
- Tatsuo, M.; Kentaro, O.; Ryuji, I. Fracture-zone conditions on a recently active fault: Insights from mineralogical and geo-chemical analyses of the Hirabayashi NIED drill core on the Nojima fault, southwest Japan, which ruptured in the 1995 Kobe earthquake. Tectonophysics 2004, 378, 143–163. [Google Scholar]
- Bagheri, R.; Nadri, A.; Raeisi, E.; Eggenkamp, H.G.M.; Kazemi, G.A.; Montaseri, A. Hydrochemical and isotopic (δ18O, δ2H, 87Sr/86Sr, δ37Cl and δ81Br) evidence for the origin of saline formation water in a gas reservoir. Chem. Geol. 2014, 384, 62–75. [Google Scholar] [CrossRef]
- Gaagai, A.; Boudoukha, A.; Boumezbeur, A.; Benaabidate, L. Hydrochemical characterization of surface water in the Babar wa-tershed (Algeria) using environmetric techniques and time series analysis. Intl. J. River Basin Manag. 2017, 15, 361–372. [Google Scholar] [CrossRef]
- Woith, H.; Wang, R.; Maiwald, U.; Pekdeger, A.; Zschau, J. On the origin of geochemical anomalies in groundwaters induced by the Adana 1998 earthquake. Chem. Geol. 2013, 339, 177–186. [Google Scholar] [CrossRef]
- Liu, H. Geochemical characterization of shallow groundwater using multivariate statistical analysis and geochemical mod-eling in an irrigated region along the upper Yellow River, Northwestern China. J. Geochem. Explor. 2020, 215, 106565. [Google Scholar] [CrossRef]
- Piper, A.M. A graphic procedure in the geochemical interpretation of water analysis. Eos. Trans. Am. Geophys. Union 1944, 25, 914–928. [Google Scholar] [CrossRef]
- Subrahmanyam, K.; Yadaiah, P. Assessment of the impact of industrial effluents on water quality in Patancheru and environs, Medak district, Andhra Pradesh, India. Hydrogeol. J. 2001, 9, 297–312. [Google Scholar] [CrossRef]
- Giggenbach, W.F. Geothermal solute equilibria: Derivation of Na-K-Mg-Ca geoindicators. Geochim. Cosmochim. Acta 1988, 52, 2749–2765. [Google Scholar] [CrossRef]
- Gibbs, R.J. Mechanisms controlling world water chemistry. Science 1970, 170, 1088–1090. [Google Scholar] [CrossRef] [PubMed]
- Fournier, R.O.; Truesdell, A.H. Geochemical indicators of subsurface temperature, Part 2: Estimation of temperature and fraction of hot water mixed with cold water. J. Res. U S Ceol. Surv. 1974, 2, 263–270. [Google Scholar]
- Craig, H. Isotopic Variations in Meteoric Waters. Science 1961, 133, 1702–1703. [Google Scholar] [CrossRef] [PubMed]
- Pang, Z.; Kong, Y.; Li, J.; Tian, J. An Isotopic Geoindicator in the Hydrological Cycle. Procedia Earth Planet. Sci. 2017, 17, 534–537. [Google Scholar] [CrossRef]
- Li, Y.; Jiang, W.; Zhang, J.; Li, B.; Yan, R.; Wang, X. Sentinel-1 SAR-based coseismic deformation monitoring service for rapid ge-odetic imaging of global earthquakes. Nat. Hazard Res. 2021, 1, 11–19. [Google Scholar] [CrossRef]
- Manga, M.; Brodsky, E.E.; Boone, M. Response of streamflow to multiple earthquakes. Geophys. Res. Lett. 2003, 30, 1214. [Google Scholar] [CrossRef]
Figure 1.
Epicenter of the 2021 Biru M6.1 earthquake and distribution of hydrochemical sampling sites. The color-filled areas show the interferograms of coseismic ground deformation. The red dotted line shows the speculative seismogenic fault of this earthquake. The lithology of the strata in the geological map legend is as follows, 1: Precambrian dolomite; 2: Permian schist; 3: Jurassic schist; 4: Jurassic limestone and slate; 5: Late Cretaceous quartz diorite; 6: Late Cretaceous granites; 7: Cretaceous sandstone; 8: Cenozoic sandstone; 9: Pleistocene clay; 10: Holocene clay.

Figure 2.
Groundwater responses to the Biru M6.1 earthquake. (a) New seepage line (c1), (b) water in the well (w6) that became turbid, and (c) a new spring (s1) after the earthquake.
Figure 2.
Groundwater responses to the Biru M6.1 earthquake. (a) New seepage line (c1), (b) water in the well (w6) that became turbid, and (c) a new spring (s1) after the earthquake.

Figure 3.
Piper diagram for all water samples.

Figure 4.
Na-K-Mg ternary diagram for all water samples.

Figure 5.
Gibbs diagrams for the major ion compositions of the 23 water samples.

Figure 6.
δ18O vs. δ2H values of the 23 water samples and their correlations with GMWL. The data of Lhasa rainfall (1986~1992) available in this study are generated under the IAEA Water Resources Programme’s monitoring networks: the Global Network of Isotopes in Precipitation (GNIP).
Figure 6.
δ18O vs. δ2H values of the 23 water samples and their correlations with GMWL. The data of Lhasa rainfall (1986~1992) available in this study are generated under the IAEA Water Resources Programme’s monitoring networks: the Global Network of Isotopes in Precipitation (GNIP).

Figure 7.
SiO2 concentrations of 23 water samples and their estimated underground temperature and circulation depth.
Figure 7.
SiO2 concentrations of 23 water samples and their estimated underground temperature and circulation depth.

Figure 8.
Schematic diagram of groundwater hydrochemical zonation and fracture variations before and after an earthquake. (a) before the earthquake, the hydrochemical composition of groundwater was in equilibrium, and the permeability in the fault zone was low; (b) earthquake triggered the formation of new fractures around the seismogenic fault, and the permeability of the fault also increased.


Table 1.
Hydrochemical data from the study area.
| ID | Water Type | Na+ mg/L | K+ mg/L | Mg2+ mg/L | Ca2+ mg/L | Cl− mg/L | SO42− mg/L | NO3− mg/L | HCO3− + CO32− mg/L | T °C | TDS mg/L | pH | δD ‰ | δ18O ‰ | SiO2 μg/mL |
|---|---|---|---|---|---|---|---|---|---|---|---|---|---|---|---|
| c1 | Cool spring | 9.85 | 2.10 | 26.04 | 85.16 | 1.51 | 156.57 | 5.21 | 260.14 | 0.40 | 309.00 | 7.43 | −110.30 | −14.92 | 9.35 |
| c2 | Cool spring | 9.74 | 2.30 | 23.58 | 61.85 | 1.52 | 34.69 | 10.70 | 256.27 | 5.00 | 262.67 | 7.85 | −109.44 | −14.40 | 7.00 |
| c3 | Cool spring | 6.60 | 1.53 | 22.55 | 64.58 | 0.96 | 18.03 | 3.15 | 274.58 | 3.80 | 247.67 | 7.65 | −110.68 | −14.49 | 5.99 |
| c4 | Cool spring | 17.76 | 1.42 | 39.94 | 49.34 | 1.95 | 26.28 | 12.18 | 305.09 | 5.10 | 273.33 | 7.89 | −115.43 | −15.04 | 10.81 |
| c5 | Cool spring | 10.94 | 0.63 | 17.28 | 40.44 | 1.53 | 25.45 | 4.30 | 183.05 | 6.30 | 184.70 | 7.94 | −113.23 | −14.86 | 8.79 |
| h1 | Hot spring | 77.39 | 60.24 | 8.43 | 40.53 | 87.28 | 116.69 | 0.49 | 601.24 | 53.60 | 780.33 | 6.72 | −129.60 | −17.18 | 45.20 |
| h2 | Hot spring | 205.79 | 30.35 | 20.33 | 60.26 | 34.71 | 136.95 | 0.89 | 713.90 | 60.60 | 802.67 | 6.91 | −130.98 | −16.46 | 100.88 |
| h3 | Hot spring | 506.30 | 155.14 | 53.69 | 23.09 | 37.79 | 208.02 | 2.53 | 1765.00 | 32.50 | 1692.67 | 6.67 | −132.73 | −17.53 | 54.39 |
| l1 | Lake | 3.55 | 0.81 | 10.19 | 86.63 | 0.82 | 31.83 | 2.56 | 286.78 | 3.70 | 269.33 | 7.42 | −110.13 | −15.00 | 5.32 |
| l2 | Lake | 9.90 | 2.42 | 12.63 | 83.85 | 1.92 | 9.38 | 1.03 | 323.39 | 0.00 | 251.67 | 7.20 | −109.52 | −14.28 | 11.70 |
| l3 | Lake | 33.59 | 7.27 | 40.03 | 86.33 | 6.09 | 39.04 | 10.20 | 451.53 | 5.20 | 408.67 | 8.55 | −110.83 | −14.16 | 17.75 |
| s1 | Steam | 7.77 | 0.98 | 29.44 | 102.35 | 1.04 | 144.31 | 4.48 | 262.37 | 0.10 | 373.33 | 7.98 | −109.81 | −14.94 | 7.33 |
| s2 | Steam | 10.67 | 1.66 | 23.23 | 57.44 | 0.88 | 64.65 | 4.80 | 213.56 | 0.00 | 253.00 | 8.64 | −105.45 | −13.43 | 4.98 |
| s3 | Steam | 42.01 | 5.61 | 56.44 | 92.05 | 5.08 | 156.55 | 5.96 | 414.92 | 9.20 | 511.33 | 7.55 | −112.43 | −14.73 | 16.52 |
| s4 | Steam | 56.95 | 12.05 | 29.99 | 95.77 | 5.25 | 134.39 | 3.79 | 384.41 | 3.50 | 482.67 | 7.77 | −109.08 | −15.09 | 11.48 |
| s5 | Steam | 24.49 | 4.02 | 28.79 | 68.80 | 4.01 | 157.90 | 4.13 | 268.35 | 3.00 | 673.67 | 8.28 | −112.42 | −15.15 | 8.68 |
| w1 | Well (38 m) | 9.84 | 1.17 | 47.15 | 49.37 | 1.78 | 40.62 | 0.05 | 329.49 | 4.90 | 310.33 | 7.78 | −116.28 | −14.71 | 13.38 |
| w2 | Well (50 m) | 11.60 | 1.21 | 10.50 | 45.02 | 0.74 | 14.74 | 9.22 | 189.15 | 4.40 | 181.47 | 8.10 | −107.20 | −13.95 | 7.67 |
| w3 | Well (35 m) | 27.06 | 3.66 | 26.02 | 99.13 | 15.91 | 42.99 | 54.46 | 366.10 | 3.50 | 418.67 | 7.55 | −112.23 | −14.83 | 7.78 |
| w4 | Well (45 m) | 27.29 | 1.88 | 25.66 | 81.06 | 1.74 | 22.88 | 4.36 | 366.10 | 4.60 | 321.67 | 7.53 | −107.18 | −13.78 | 7.22 |
| w5 | Well (40 m) | 5.06 | 1.89 | 65.02 | 60.74 | 1.64 | 24.33 | 0.12 | 469.83 | 4.00 | 390.00 | 7.55 | −124.03 | −16.25 | 5.43 |
| w6 | Well (40 m) | 12.18 | 0.64 | 11.56 | 65.25 | 2.70 | 28.80 | 2.88 | 256.27 | 5.90 | 243.67 | 7.80 | −119.64 | −15.52 | 14.06 |
| w7 | Well (30 m) | 8.66 | 1.54 | 62.93 | 74.86 | 5.16 | 32.46 | 1.66 | 500.34 | 5.60 | 419.33 | 7.48 | −114.22 | −15.11 | 4.98 |
Table 2.
Factor analysis results of the hydrochemical components.
| Variate | First Factor | Second Factor | Third Factor | Fourth Factor |
|---|---|---|---|---|
| Na+ | 0.892 | 0.247 | 0.112 | 0.232 |
| K+ | 0.888 | 0.146 | 0.185 | 0.225 |
| Mg2+ | 0.035 | −0.020 | 0.836 | 0.159 |
| Ca2+ | 0.296 | 0.325 | 0.350 | 0.444 |
| Cl− | 0.272 | 0.877 | 0.254 | 0.070 |
| SO42− | 0.263 | −0.047 | 0.009 | 0.961 |
| NO3− | −0.005 | 0.993 | −0.094 | −0.021 |
| HCO3− | 0.291 | 0.144 | 0.939 | −0.088 |
| SO2 | 0.548 | −0.015 | 0.074 | 0.061 |
| Contribute | 27.502% | 24.589% | 22.875% | 15.842% |
Publisher’s Note: MDPI stays neutral with regard to jurisdictional claims in published maps and institutional affiliations. |
© 2021 by the authors. Licensee MDPI, Basel, Switzerland. This article is an open access article distributed under the terms and conditions of the Creative Commons Attribution (CC BY) license (https://creativecommons.org/licenses/by/4.0/).
Share and Cite
MDPI and ACS Style
Yang, P.; Sun, X.; Liu, D.; He, Z.; Li, Y. Hydrochemical Characteristics of Groundwater at the Epicenter of the 2021 Biru M6.1 Earthquake in Central Tibet. Water 2021, 13, 3111. https://doi.org/10.3390/w13213111
AMA Style
Yang P, Sun X, Liu D, He Z, Li Y. Hydrochemical Characteristics of Groundwater at the Epicenter of the 2021 Biru M6.1 Earthquake in Central Tibet. Water. 2021; 13(21):3111. https://doi.org/10.3390/w13213111
Chicago/Turabian StyleYang, Pengtao, Xiaolong Sun, Dongying Liu, Zhongtai He, and Yongsheng Li. 2021. "Hydrochemical Characteristics of Groundwater at the Epicenter of the 2021 Biru M6.1 Earthquake in Central Tibet" Water 13, no. 21: 3111. https://doi.org/10.3390/w13213111
Note that from the first issue of 2016, this journal uses article numbers instead of page numbers. See further details here.