Article

Community Flood Impacts and Infrastructure: Examining National Flood Impacts Using a High Precision Assessment Tool in the United States

1
Quantitative Methods in the Social Sciences, City University of New York, New York, NY 10016, USA
2
First Street Foundation, Brooklyn, NY 11201, USA
*
Author to whom correspondence should be addressed.
Water 2021, 13(21), 3125; https://doi.org/10.3390/w13213125
Submission received: 28 September 2021 / Revised: 26 October 2021 / Accepted: 29 October 2021 / Published: 5 November 2021
(This article belongs to the Section Water and Climate Change)

Abstract

:
Changing environmental conditions are driving worsening flood events, with consequences for counties, cities, towns, and local communities. To understand individual flood risk within this changing climate, local community resiliency and infrastructure impacts must also be considered. Past research has attempted to capture this but has faced several limitations. This study provides a nation-wide model of community flooding impacts within the United States currently and in 30 years through the use of high-resolution input data (parcel-level), multi-source flood hazard information (four major flood types), multi-return period hazard information (six return periods), operational threshold integration, and future-facing projections. Impacts are quantified here as the level of flooding relative to operational thresholds. This study finds that over the next 30 years, millions of additional properties will be impacted, as aspects of risk are expected to increase for residential properties by 10%, roads by 3%, commercial properties by 7%, critical infrastructure facilities by 6%, and social infrastructure facilities by 9%. Additionally, certain counties and cities persistently display impact patterns. A high-resolution model capturing aspects of flood risk as related to community infrastructure is important for an understanding of overall community risk.

Graphical Abstract

1. Introduction

Reliable infrastructure is essential to the economic prosperity, sustainability, and security of communities across the United States [1,2]. Infrastructure in this respect encompasses a wide range of public and private facilities including roads, utilities, emergency services, public services, social/cultural institutions, and various property level land use types. According to the American Society of Civil Engineers (ASCE), U.S. infrastructure is in mediocre condition, showing signs of deterioration and increasing vulnerability [3]. For example, ASCE estimates that more than 21,000 bridges are susceptible to “overtopping or having their foundations undermined during extreme storm events” and that over 40% of the American road system is in poor or mediocre condition [3]. As a changing climate alters the frequency and severity of extreme weather events, deteriorating infrastructure and the communities they serve will be especially vulnerable. Therefore, it is essential that critical infrastructure systems are maintained to the highest standards and that disaster preparedness, response, and recovery are top priorities for risk managers and policymakers.
In the United States, many infrastructure discussions over the past 20 years have been centered around possible physical attacks, energy crises, and terrorism, but climate change has a higher probability of significant impact on the Nation’s infrastructure [4]. With an increasing number of flooding events making U.S. headlines, there is a greater awareness of the economic and human cost that flood-damaged infrastructure can produce. For instance, Hurricane Sandy flooded hospitals, crippled electrical substations, overwhelmed wastewater treatment centers, and shut down power and water to tens of millions of people [5]. In August 2021, the impact of Hurricane Ida stretched across the country crippling the electrical grid in southern Louisiana, flooding the transportation infrastructure in the NYC metro area, and killing nearly 100 people. It is clear, now more than ever, that the ways and places in which we live are likely to continue to be impacted by our changing environment. That being said, no high-precision infrastructure analysis has been undertaken across the entire country. In studies that do aim to assess national level resilience and vulnerability, infrastructure vulnerability is often included as an important factor [6]. Only with a comprehensive assessment of flood risk as related to infrastructure—especially critical infrastructure essential to human health and economic activity—and targeted investment and improvements can the U.S. hope to avoid significant economic loss.
The objective of this study is to explore the development of a model for the assessment of aspects of flood risk to U.S. infrastructure, focusing on holistic impacts to communities such as through residential properties, roads, commercial properties, critical infrastructure, and social facilities. This was made possible by taking advantage of newly available parcel-level flood hazard information from the First Street Foundation (FSF) Flood Model [7,8,9], including the integration of a first-of-its-kind national database of over 20,000 unique flood adaptation measures. The First Street data provides parcel-level flood hazard information for the four major flood types (tidal, pluvial, fluvial, and surge) at six explicitly modeled return periods while accounting for the mitigating effects of levees, dams, open spaces, and other flood adaptation measures. With high-resolution data at the property level, this study is able to estimate flood impacts to each infrastructure element from its joined parcel or building footprint.
There are a number of important implications associated with these results that center around a community’s ability to assess current levels of resilience, plan for future resource allocation around infrastructure and development, and inform individuals of risks that may not be immediate to their specific properties (but rather to the surrounding community resources). In all cases, a multi-dimensional approach to measuring and assessing risk is important in order to gain a more complete understanding of flooding risk today and into the future as well as to better assess a community’s needs in order to address the issue at a collective level. Making this information publicly available to elected officials and policymakers allows for a better understanding of risk, informed by high-quality risk models which are often inaccessible for most communities. This may help facilitate collaboration within and across communities, better funding for adaptation and mitigation strategies, streamlined permitting, and higher levels of civic engagement.
More specifically, at the center of this work is a focus on quantifying and understanding the changes that are occurring in the environment and planning in such a way that local communities may be resilient to those changes. Climate resilience planning requires a rigorous method for the estimation of how risk levels and critical facility vulnerability changes over time. Many previous efforts assessing current day risk are not suitable for proper resilience planning as they do not include quantified risk under true current or future climate conditions, or with a high precision indicator of risk.
At a more practical level, planning and development in local communities may be immensely improved through the use of proper tools and risk models. The use of these tools to identify all infrastructure at risk in an area (including in varying return periods) allows for the determination of appropriate levels of protection needed for future conditions as well as helping to inform decisions around future development. Additionally, identifying areas with higher amounts of risk than others allows for appropriate allocation of resources to provide protection where it is most needed, meaning a more efficient use of capital in protecting the most vulnerable areas of the community while not repeating development practices that have led to the location of populations and infrastructure in high-risk areas.
Quantified information about community flood risk allows for improved planning and development within and between local communities, as well as across levels of government, allowing for greater efficiency of resource allocation at various levels. Quantifying risk under current and future climate conditions is particularly important to ensure funding is allocated to the projects and areas most in need, as funding decisions usually occur at a different level of government than at the level at which they are implemented. Publicly available information regarding flood risk for communities that are shared across a given area also provides a common knowledge base to facilitate collaboration. Not only is this important for the allocation of resources, but also for collaboration between different communities in order to address vulnerability and adaptation interdependencies. Vulnerability interdependence is when the vulnerability of one area spills over into a surrounding area. For example, flooding in one community that causes the primary hospital to become inoperable may result in patient relocation to the hospital of a neighboring community. Adaptation interdependence operates similarly, where the adaptation efforts of a community may impact a nearby community. For example, if a community constructs a seawall, the water may be relocated to increase flooding in the neighboring area. A common platform for sharing knowledge about community flood risk allows for a better understanding of individual community risk as well as risk in neighboring localities, which allows for increased collaboration.
Finally, there is a strong need for individual consumers to understand what is at risk in their immediate area and plan accordingly for service disruptions in the event of a flood. Community-level flood risk is much more than an individual problem and affects everyone, regardless of the risk of their own specific property. Understanding one’s risk is a combination of both individual property risk, which is acutely important to those at risk, in combination with the risk of their local community. Homeowners and renters may feel a false sense of security if their specific property is not at risk of flooding directly, however, the indirect effects of living in a community with high levels of risk can be just as impactful. In fact, road closures, school closures, utility issues, and lack of access to emergency services and hospitals can arguably have more dire consequences than the economic losses that come with floodwaters entering a home. If local communities do not properly plan to be resilient in these areas, indirect consequences of population out-migration decrease muni-bond ratings, and the increased likelihood of catastrophic outcomes associated with the observed risk is all more likely and will affect the entire population of a community, not just the properties that are at risk of flooding directly.

2. Literature Review

According to the International Panel on Climate Change (IPCC) framework, flood risk can be expressed as a function of flood hazard (H), exposure (E), and vulnerability (V) [10]. Flood hazard (H) can be further divided into location, probability, frequency, and seasonality of flooding events as a result of climate change. Flood exposure (E) refers to the existence of resources within an area with hazards [11]. That is, risk only exists when population and/or economic resources are located within these hazard areas (and thus are exposed). The final component of risk is vulnerability (V), which is recently related to characteristics of social and environmental processes and the likelihood that exposed elements will suffer adverse effects [11,12].
Cardona et al. [11] provide an example of how it is possible to be exposed but not vulnerable, where a building may be located within a floodplain but there are adequate resources allowing for the modification of the structure to mitigate losses. While a key component of vulnerability here is the ability to adapt, adaptation in the provided example is through engineering characteristics of the structure itself. There is growing recognition within the scientific community that vulnerability includes both internal components, such as those related to adaptive and coping capacity, and external components, such as those which determine exposure to hazards [13]. Luers et al. [12] propose an approach for the quantification of vulnerability that integrates concepts such as the state of a system relative to a threshold of damage, sensitivity, exposure, and adaptive capacity. Additionally, Luers et al. [12] argue that assessments on vulnerability should focus on selected variables rather than on a place as a whole.
Wing et al. [14] clarify that exposure does not account for factors such as the structural damage that a flood may cause and that these such factors reflecting susceptibility to experiencing loss are instead more so broadly related to vulnerability. This illustrates the distinction between flood exposure and flood risk [14]. It is important to note that while this study goes beyond a simple measure of the exposure of infrastructures to flood hazard through the integration of variables related to vulnerability, such as the state of infrastructures relative to a threshold of damage, this model does not provide a complete picture of community infrastructure vulnerability. For example, there is room for the additional consideration of adaptive capacity and for improvements related to damage thresholds and sensitivity. This is especially true when considering sensitivities related to social processes, such as how sensitive a community is to a specific hospital losing functionality (if it is one of many hospitals, a community may be less sensitive to this impact compared to if it is the community’s only hospital). However, the design and outputs of this model will be conducive to future research delving deeper into vulnerability assessments related to these community infrastructures. For the purposes of this paper, the terminology “flood risk” will be utilized (for lack of a better word) considering the inclusion of hazard, exposure, and some aspects of vulnerability in this model, but it should be noted that in this paper it refers only to the limited aspects described and does not attempt to argue that a full picture of risk is captured here.
National level flood risk assessments focused on infrastructure are relatively rare. In 2007, the Federal Emergency Management Agency (FEMA)—the federal agency tasked with managing the nation’s disaster risk—announced a design guide for improving critical facility safety from Flooding and High Wind [15]. Globally, some studies estimate the flood risk of infrastructure focused on specific cities and regions [16,17,18], but such assessments are not as common in the U.S. [19].
Flood risk as—well as its components—are assessed and understood in multiple ways. In the U.S. context, such assessments tend to focus on the threat that residential properties face from a 1% annual chance flood event. This is due to the fact that flood hazard mapping is dominated by FEMA—the federal agency tasked with mapping the nation’s flood risk. These maps, known as Flood Insurance Rate Maps or FIRMs, focus only on the 1% and 0.2% annual chance floods and are created primarily to guide federal floodplain management regulations and to price flood insurance. The limitations of FEMA’s mapping process are well-documented (e.g., Technical Mapping Advisory Council [20]). For example, ref. [14] find that FEMA’s current maps only identify one-third of the US population at risk of flooding in the 1% annual-chance event. Despite their prevalence, FEMA maps do not provide sufficiently detailed flood hazard information to understand exposure and risk as related to individual buildings or complex infrastructure systems.
Other researchers have aimed to understand flood risk in a more detailed manner, with an eye toward infrastructure. In one recent study, ref. [19] uses FEMA maps to assess the flood exposure of critical infrastructure (CI) facilities at the county level across the US. Qiang derives an exposure ratio defined by the number of CI facilities in the 1% annual chance floodplain. While useful, this study does not assess the potential future exposure of individual facilities and does not consider floods of various return periods. The analyses by [19] indicate that Louisiana and Florida have high flood exposure to their critical infrastructures. In another study, Koks et al. [21] carry out a global multi-hazard risk analysis of road and infrastructure assets. They find that approximately 7.5% of all global assets are exposed to a 1% annual chance flood event. Importantly, this study estimates physical damages with flood fragility curves that use newly developed flood risk data from Fathom—a UK-based flood modeling firm that played a key role in the development of the First Street Foundation Flood Model.
In one analysis, Pant et al. [17] put forward an integrated framework for critical infrastructure flood impact assessment using spatial network models. This study is unique in that it aims to quantify the number of people in the United Kingdom that would be affected (directly and indirectly) by widespread flooding to various infrastructure facilities including airports, electric utilities, waste treatment, and telecommunications. This framework, the authors contend, can help risk managers prioritize investments in flood protection more effectively. Importantly, this illustrates a framework for improving spatial understandings of vulnerability as related to infrastructure flooding.
Similarly, Dong et al. [22] utilize a spatial network model to assess community vulnerability. An additional advancement this study makes is to highlight how tolerance to disruptions of access to critical facilities and community services caused by flooding varies by population characteristics. In order to create community-level vulnerability assessments, social vulnerability must be assessed in conjunction with physical vulnerability. The physical vulnerability model utilized by Dong et al. [22] is limited to roadway network performance, the functionality of critical facilities as determined through exposure, and connectivity to critical facilities during flood events. Additionally, the flood inputs used are constructed by limited contributing factors (primarily relying on roadway distance to floodways). While the Dong et al. [22] paper provides important insights regarding the use of spatial network models and the integration of physical and social analyses in order to increase understanding of community vulnerability, a more complete, higher resolution, and larger spanning model for physical risk would allow for further developments.
Critical infrastructure includes sectors such as emergency services, transportation, energy, water and wastewater, and healthcare. However, it also includes sectors such as critical manufacturing, agriculture, and defense industrial base (amongst others) which are typically of larger-scale importance (as opposed to community-level impacts only). Infrastructure related to emergency services, utilities, community buildings, and transportation which may be visibly important at a community level are utilized in this paper to construct infrastructure, social, roads, residential, and commercial risk scores. Reliable transportation infrastructure is essential for the health of an economy [23]. A case study by Karami et al. [24] which analyzed Twitter data surrounding the South Carolina flooding caused by Hurricane Joaquin found some of the most frequently discussed topics included drinking water, road damage, bridge damage, and power lost. Similar lines of research are emerging to analyze social media activity in order to understand consumer concerns and sentiment regarding the impacts of disaster events [24]. However, to our knowledge, no large-scale study has been conducted previously to gauge consumer concerns specifically about flooding events outside of the limited time period immediately following a specific event.

3. Materials and Methods
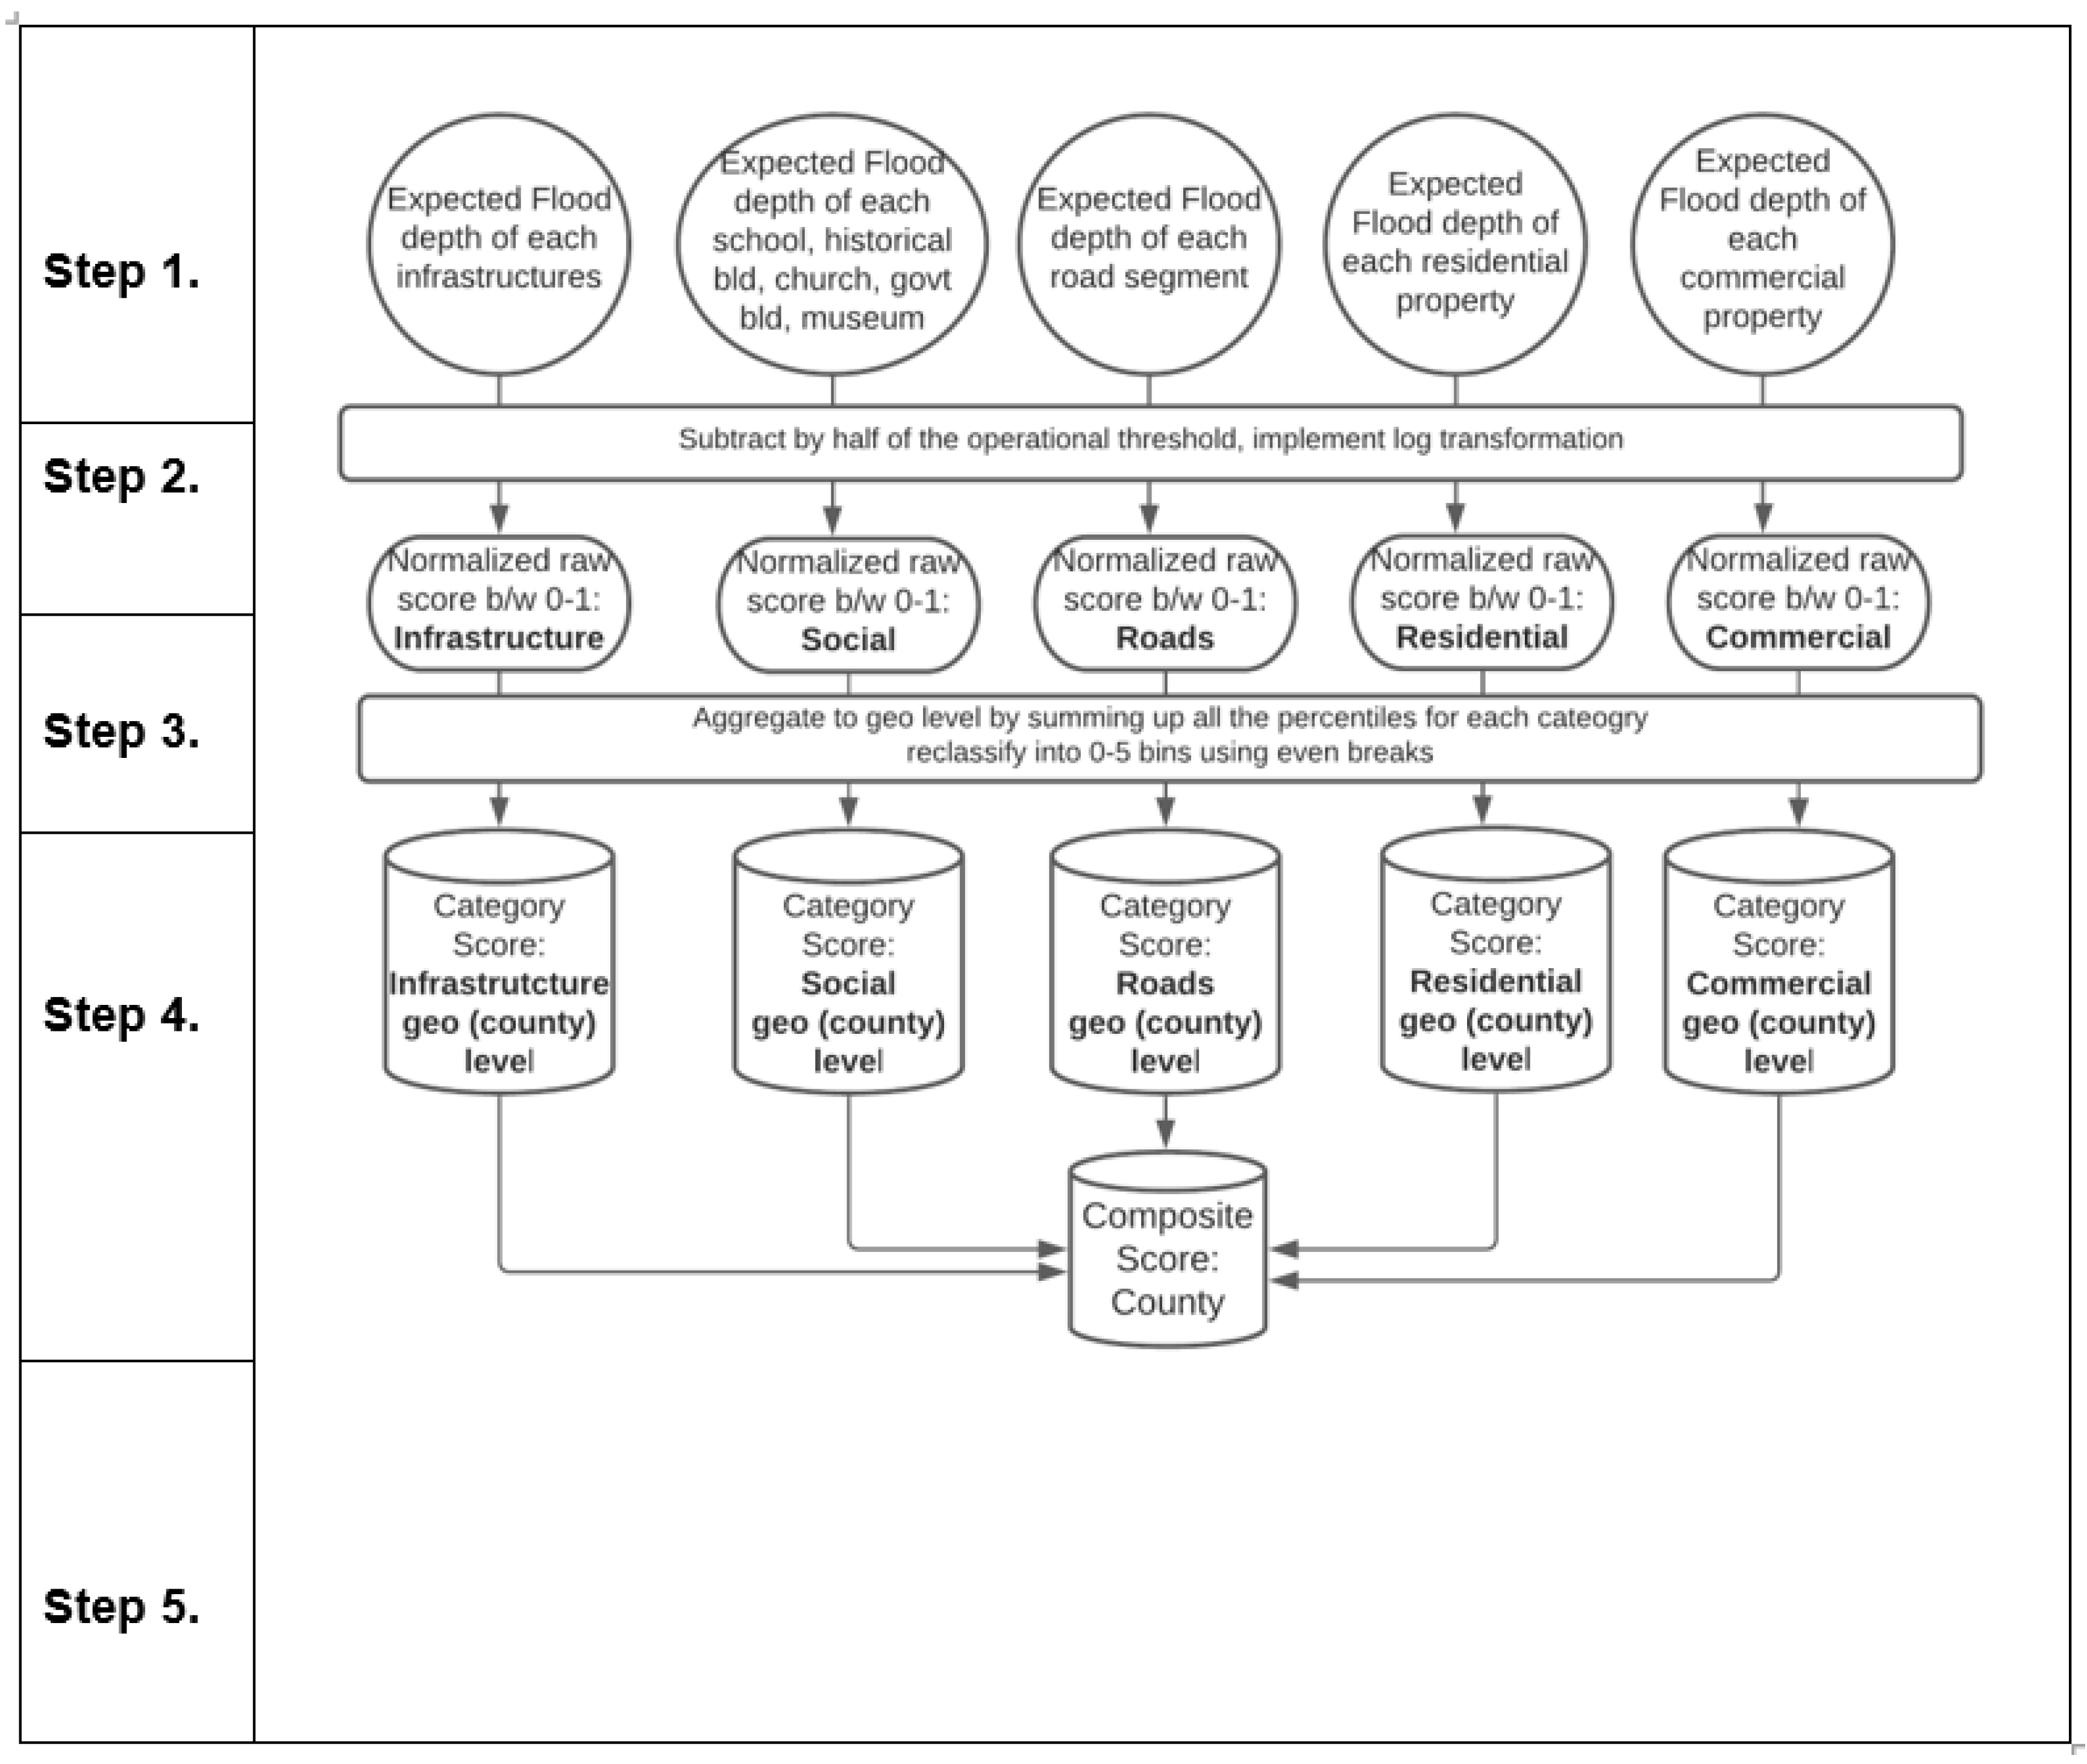
For this study’s purposes, aspects of flood risk are estimated through the application of the First Street Foundation Flood Model (FSF-FM) [8], to the five dimensions of interest: residential properties, roads, commercial properties, critical infrastructure, and social infrastructure. Data identifying roads, critical infrastructure, and social infrastructure were obtained from publicly available data sources (listed in Table 1). Residential and commercial property data were obtained through a third-party provider (https://www.lightboxre.com/, accessed on 11 January 2019). These five dimensions are made up of individual infrastructure types (for example, hospitals, power stations, and government buildings), termed “Points of Interest” (POI). For more information on the underlying FSF-FM and the climate adjustments used to estimate future flooding conditions, see Bates et al. [25]. Bates and colleagues outline the underlying hydro-dynamic processes at play in the development of their flood estimates. Most important to this research is the fact that community development, including the placement and planning of infrastructure, often happens in floodplains and the risk of flooding must be taken into account when those decisions are being made. It is, in fact, the intersection of the geomorphology of an area and the human development which intersect to produce the risk of any given community to flooding.

Data Processing

In order to obtain measurements for each POI, all features must be assigned to a spatial location. Much of the data was already spatial in the form of points, road networks, or parcel boundaries (see Table 1). Data that contained a spatial component were spatially joined to parcels in the national parcel file. For non-spatial data, address matching tied each POI to a spatial parcel in the national level parcel data set. Following the spatial join and address matching, measurements of risk may be taken using different techniques based on the POI type and operational threshold. The Python GeoPandas project was utilized to create the maps for this study.
  • Step 1: Expected Depth Calculation
In the data development of the Community Risk level, to quantify the flooding impacts to POIs for 2-year, 5-year, 20-year, 100-year, 250-year, and 500-year flood events in 2021 and 2051 (data processing takes place in five steps that are detailed in Figure 1 below), the expected depth is collected for each POI or the centerline of disaggregated spatial segments in the case of roads. The expected annualized depth in each year is the sum of the probabilities that relate to each flood magnitude multiplied by the flood depth using the equation presented here:
E x p e c t e d   D e p t h = A v g ( D i ,   D i + 1 ) × ( P i + 1 P i )
In the above equation, D and P show the depth and probability, respectively, and i is the numerator for different return period scenarios.
  • Step 2: Integration Operational Depth
The Community Risk level incorporates the loss of operational functionality for each POI through the identification of operational thresholds. Table 2 specifies the operational thresholds utilized for each POI with sources noted below. The level of flooding the POI type is generally built to withstand based on federal and local building standards is considered to calculate a meaningful impact depth. To identify the impact depth, the difference between the individual expected depth (produced in Step 1) and half of the operational threshold is analyzed. When the calculated value of the impact depth is less than the value of the operational threshold, this indicates that the infrastructure would bear some risk to functionality but would not stop operation. This is important as past research shows that flooding to the surrounding areas also begins to limit access and operation of infrastructure before the structure itself is completely non-operational [26].
  • Step 3: Standardization of Functional Depths
The community risk level requires a data transformation given the highly right-skewed nature of the flood depths since many POIs have zero or very little flooding. In order to transform skewed data to approximately conform to a normal distribution for further analysis, a log transformation may be performed on the continuous outcome of the difference in expected depth over half of the operational threshold. Min-max scaling is then used, which is a common normalization technique in social indicators research [27] to normalize the logged transformed variable into a 0 to 1 standardized scale.
Zik = LN(SDFi)
where: Standardized Functional Depth (SFDi) = (Zi—Zmin)/(Zmax—Zmin).
In this standardized scale, Zik represents the standardized functional depth (SDF) and the natural log of the scaling process by which each observation is differenced from the minimum expected depth (Zi—Zmin) and that result is divided by the range of all possible values (Zmax—Zmin) across each of the five dimensions in this analysis (k). From this process, a 0 represents those with no risk of flooding, while a 1 represents those with the most risk. Upper and lower bounds were applied to remove outliers. The lower bound was 0.01 and the upper bound was 100, or −2 and 2 after the log transformation. These represent practical values for a minimum and maximum. This transformation is completed for both current and future expected flood depths (2021 and 2051, respectively). Individual facilities are assigned a distinct score based on the average of their normalized current and future expected flood depths, assigned based on five bins of equal width from 0 to 1, with a sixth classification for those with no flooding.
  • Step 4: Dimensional Risk level Calculation
The Community Risk Level aggregates the standardized scales to various localities (j). In all, the indicators contained in the POI scales were aggregated to a total of four community levels (including the neighborhood (n = 71,786), zip code (n = 41,692), city/place (n = 19,495), and county levels (n = 3006).
Community Risk Level (CRLjk) = ∑ijk (Zik)
In this process, CRLjk represents the summed Community Risk Level for each of the different levels of geography-dimension combinations (j) and is simply a summation of the five dimensions (k). The process of aggregation to each geographic level was preceded in this step where a dimensional risk score was calculated for each of the five categories (residential properties, roads, commercial properties, critical infrastructure, and social infrastructure) and by year (2021 and 2051). That is, the dimensional community risk score was calculated by computing the sum of the percentiles of normalized expected depths from 0 to 100 at intervals of five for each dimension, across all POIs in that dimension and in that location. For a visualization of this process at the county level, refer to Figure 1.
  • Step 5: Overall Community Risk Score Calculation
The Community Risk level presents the combination of the five dimensional scores created in Step 4 in a single overall indicator of standardized local impacts, referred to as the Overall Community Flood Risk. These scores were created for all four community aggregation levels and provide an overall view of community infrastructure impacts for each.
Overall Community Risk Level (OCRLj) = ∑jk (CRLjk)
where the category scores that were created as a product of the percentile summation, at each geo level and for 2021 and 2051, were classified using natural breaks into six qualitatively more meaningful categories associated with relative flood risk as (0) minimal, (1) minor, (2) moderate, (3) major, (4) severe and (5) extreme. This final composite score at each geo level is computed using the same method as each of the five dimensional categories but using the average of the sum of all of the percentiles for each category.

4. Results

In the development and analysis of the Community Risk level, it was found that there are significant differences at the county and city level in the amount of risk that exists today and into the future. Most importantly, there are a group of counties and cities that have persistent patterns in these aspects of risk from flooding across multiple dimensions. These areas tend to be in regions with well-established flood hazards, such as coastal flood plains along the Gulf and Southeastern coasts of the U.S., but also in less well-known flood zones, such as in the Appalachian mountain regions of West Virginia and Kentucky. To that point, 17 of the top 20 counties in the U.S. which are most at “risk” (85%) are in the states of Louisiana, Florida, West Virginia, and Kentucky (Table 3). Additionally, the top cities at risk of flooding persistently show up in the states of Louisiana, Florida, Texas, and South Carolina (Table 4). The analysis further uncovered a high degree of vulnerability in some of the major population centers in the U.S., including New Orleans, Miami, Tampa, Charleston, Chicago, and Los Angeles.
At a high level, impacts to residential properties are expected to increase by 10% over the next 30 years with 12.4 million properties exposed today (14%) and 13.6 million at risk of flooding in 2051 (16%). Additionally, 2.0 million miles of road (23%) are at risk today and are expected to increase by 3% over the next 30 years. Commercial properties are expected to see a 7% increase in the risk of flooding from 2021 to 2051, with 918,540 at risk today (20%) and 984,591 at risk of flooding in 30 years (21%). Currently, 35,776 critical infrastructure facilities are at risk today (25%), increasing to 37,786 facilities by 2051 (26% with a 6% increase in risk). 71,717 pieces of social infrastructure facilities are at risk today (17%), increasing to 77,843 by 2051 (19% and an increase of 9% over that time period).

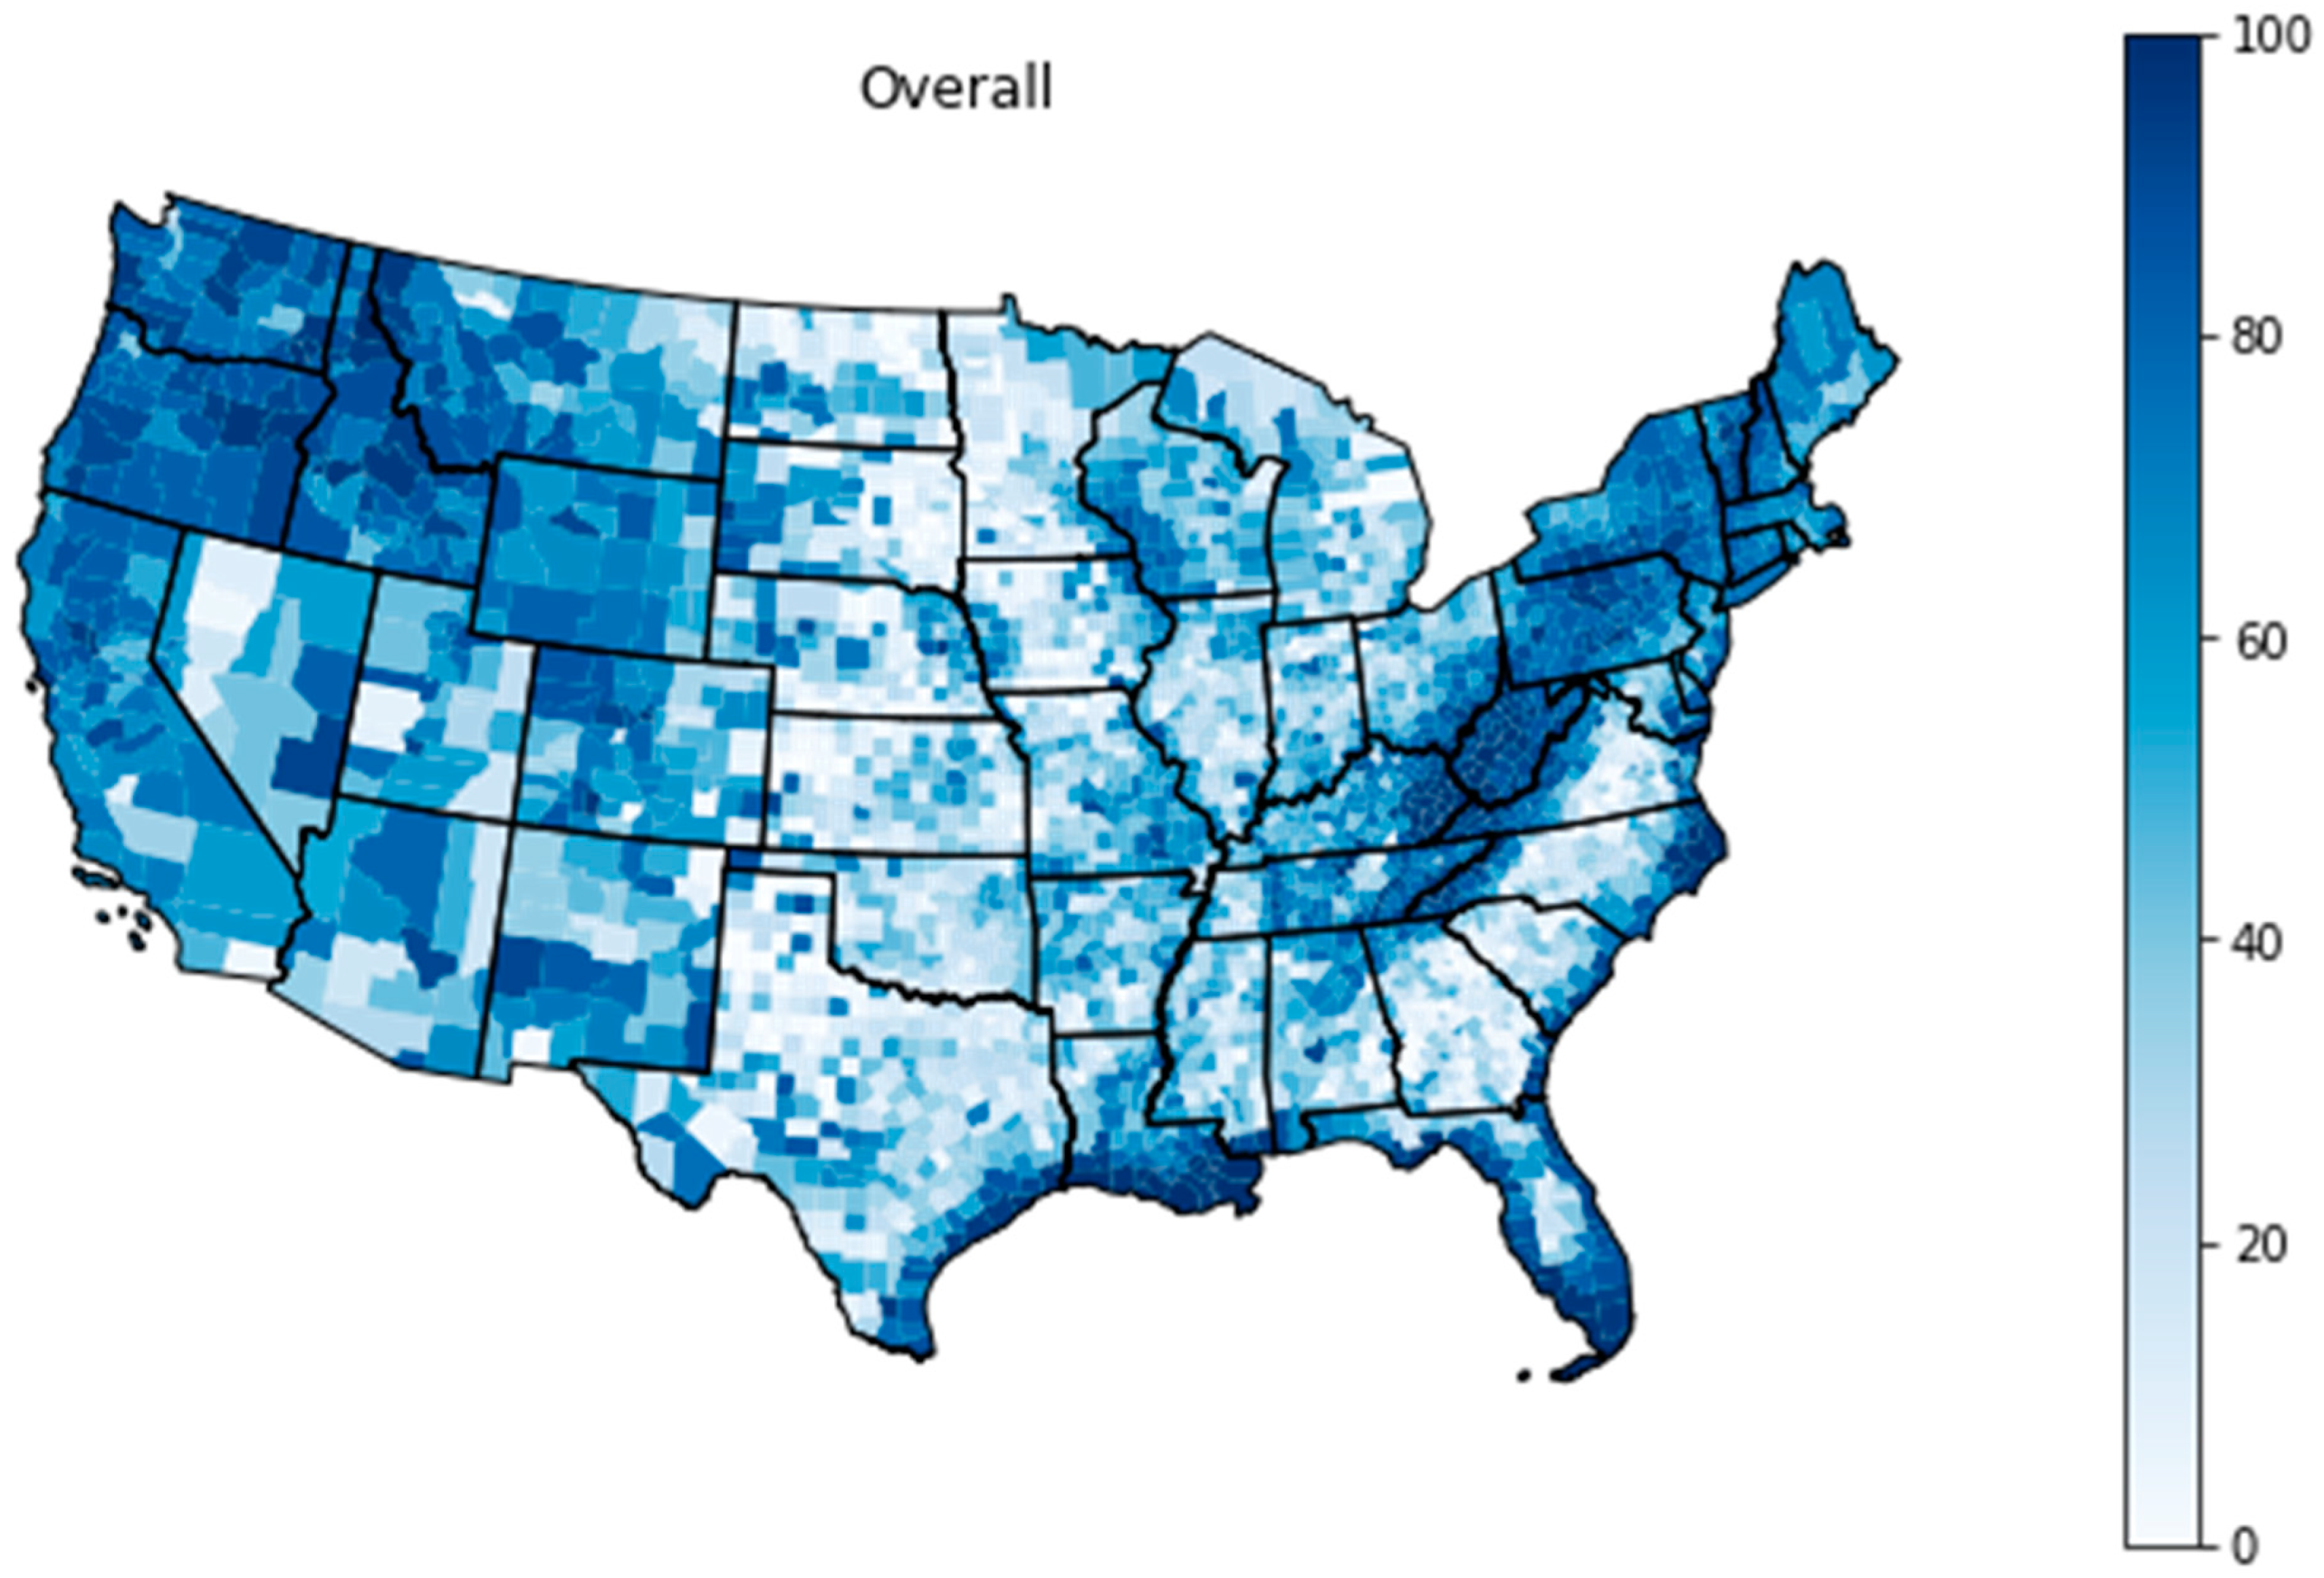
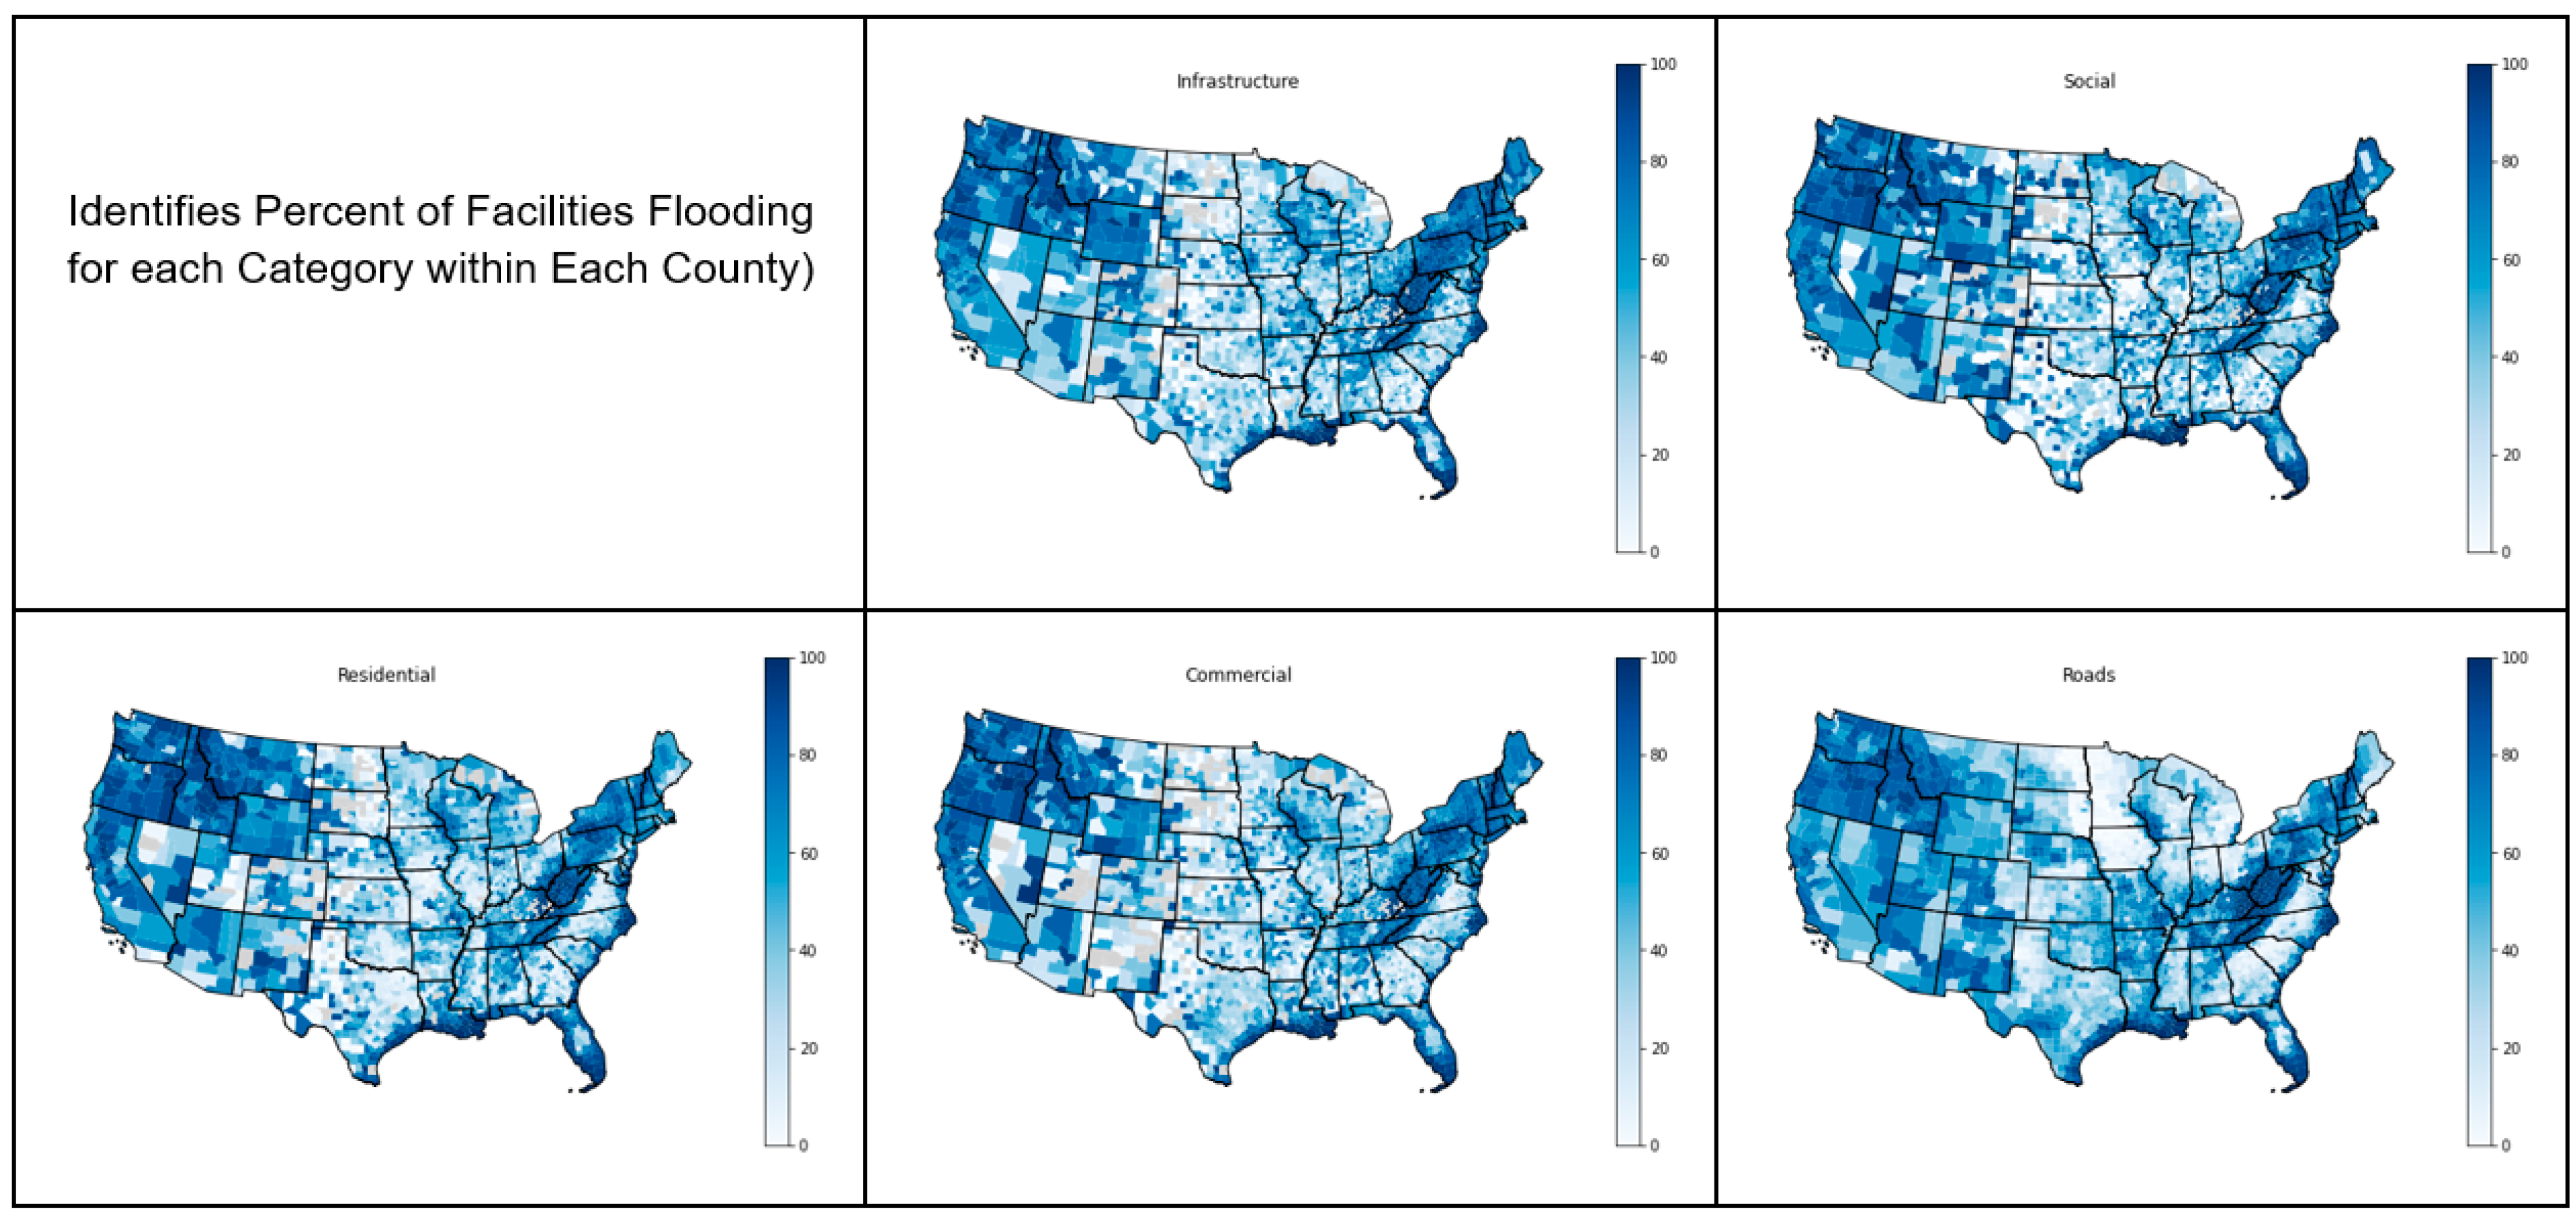
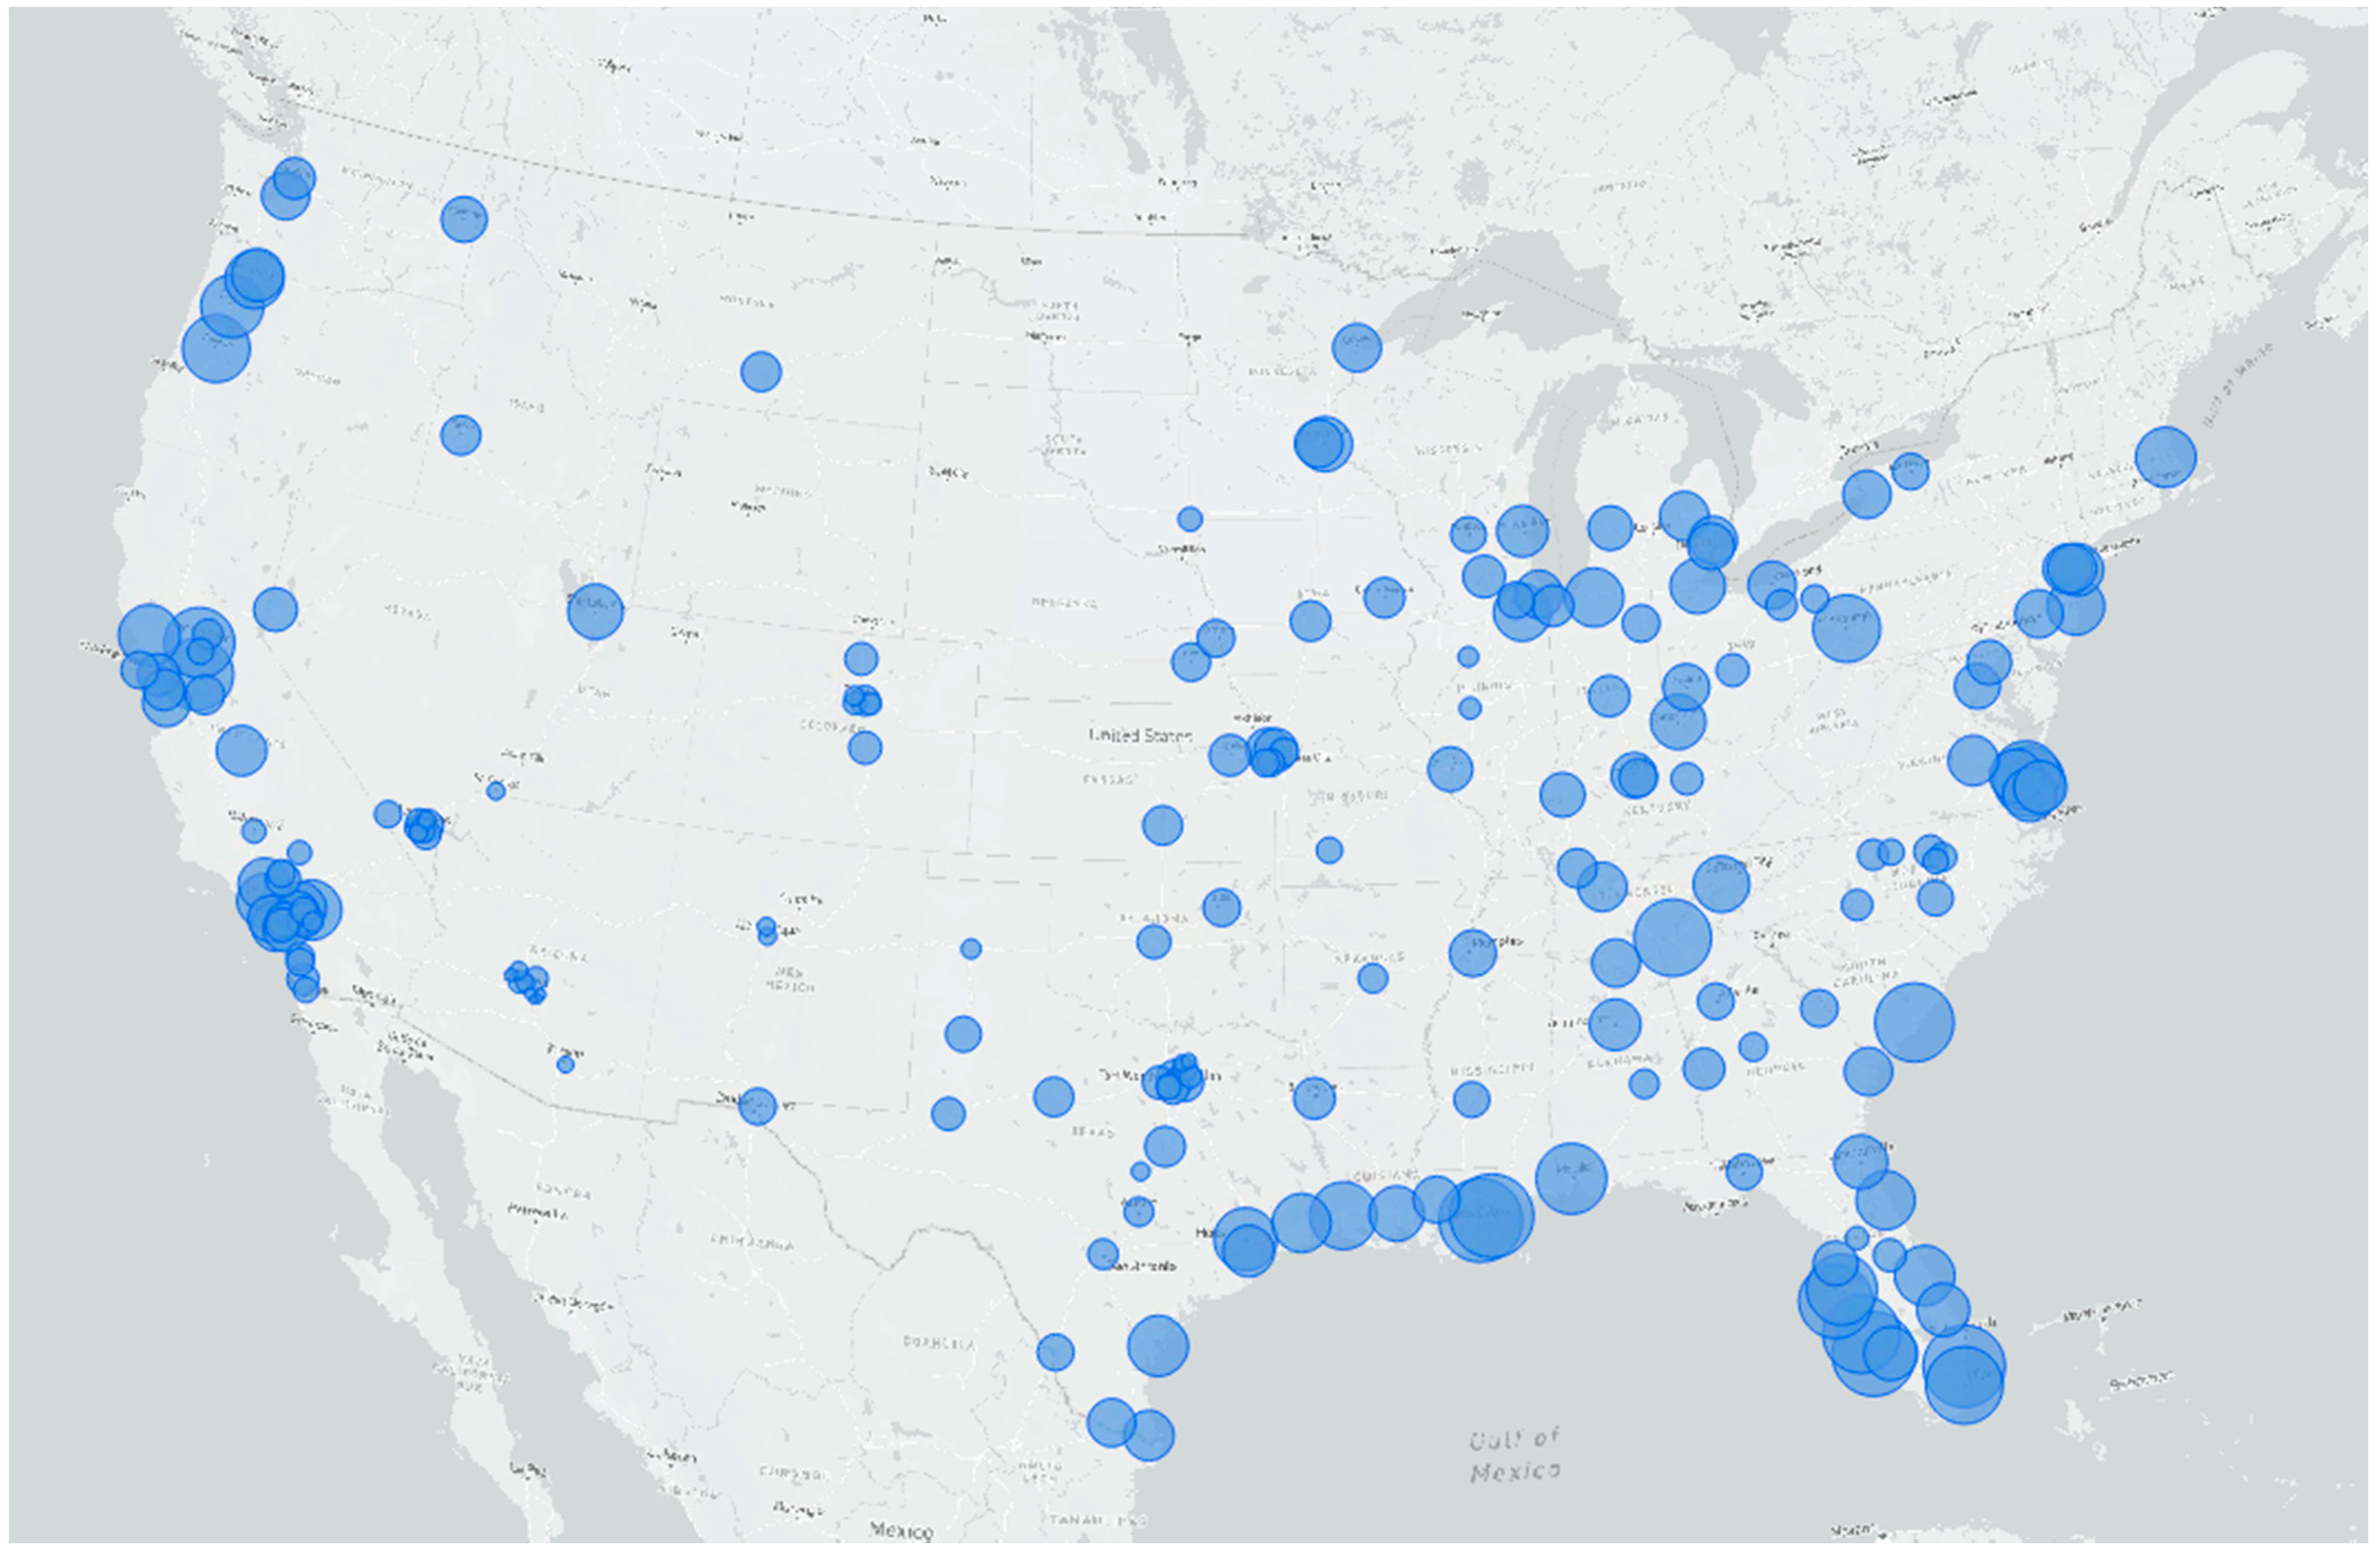
4.1. County Level Analysis

The distribution of the physical impacts, relative to the dimensions used in the development of the Community Risk level, vary widely across the U.S. (See Figure 2 for a visualization). However, predominant patterns of high impacts exist persistently in the coastal areas of the Southeastern U.S. and along the Appalachian Mountain region of the country. Specifically, the highest concentration of community impact exists in the states of Louisiana, Florida, Kentucky, and West Virginia. To that point, 17 of the top 20 most at-risk counties in the U.S. (85%) are in these four states. Louisiana alone accounts for 6 of the top 20 most at-risk counties (30%) and is home to the most at-risk county in the country, Cameron Parish. (2) Monroe County, FL, (3) Terrebonne Parish, LA, (4) Hyde County, NC, and (5) McDowell County, WV round out the top 5 counties in regards to having the most impacts on physical infrastructure. See Table 3 for additional details on the top 20 counties with the highest percentage of impacts in 2021. Similar patterns exist for each of the five dimensions that make up the overall Community Risk level, which can be seen in the paneled maps in Figure 3.
Table 3 lists the top 20 counties by overall risk across the U.S. inclusive of risk across dimensional impacts associated with residential properties, roads, commercial properties, critical infrastructure, and social infrastructure. These 5 dimensions are combined to produce the overall risk ranking. However, the impacts to each dimension vary from county to county. For instance, the top 4 counties regarding infrastructure impacted are all in Louisiana but are spread throughout the top list presented in Table 3. Of those counties, Cameron (96.4%), Orleans (94.5%), Jefferson (95.4%), and St. Bernard (92.5%) all have over 90% of their physical infrastructure at risk of flooding today. Hyde County, NC (94.1%) rounds out the top 5 counties with relative infrastructure at risk. Outside of the top 20 list, Harris County, TX (Houston area); Miami-Dade County, FL; Broward County, FL; Lee County, FL; and Pinellas County, FL (Tampa area) all have over 50% of their critical infrastructure at risk of flooding today.
Similar results are found when examining the top 5 counties regarding social infrastructure, residential properties, commercial properties, and roads at risk among the top 20 list.
Regarding the percent of social infrastructure at risk, Cameron (100%), Orleans (100%), St. Bernard (100%), and Jefferson (100%) Parishes from Louisiana; and Hyde County, NC (100%) make up the top 5 most at-risk counties. Nine of the top 10 counties for the highest percentage of social infrastructure at risk are all located in the states of Florida and Louisiana. Again, Lee County, FL; Miami-Dade County, FL; and Fort Bend County, TX (Houston area) all fall outside of the top 20 but have over 50% of their social infrastructure at risk of flooding.
A similar pattern exists when looking at the distribution of impacts for residential and commercial properties from the top 20 list. Regarding residential properties, four of the top five in regards to the percent of residential properties at risk are again in the state of Louisiana, with the 5th located in North Carolina. Orleans (100%), Jefferson (100%), St. Bernard (99.9%), and Plaquemines (99.6%) top the list and are all located in the state of Louisiana, while Hyde County, NC (99.3%) rounds out the top 5. Regarding the percent of commercial properties impacted in the county, the top 5 from the list are all located in the state of Louisiana; Jefferson (100%), St. Bernard (100%), Cameron (100%), Orleans (99.9%), and Plaquemines (99.8%). Regarding both residential and commercial properties, Lee County, FL, and Miami-Dade County, FL both fall outside of the top 20 but have over 50% of those respective properties at risk of flooding.
In the final dimension of the percentage of roads at risk, the results again find that the top 5 are all located in the state of Louisiana. While the order is shuffled slightly, the top 5 counties are St. Bernard (98.8%), Orleans (98.5%), Cameron (98.3%), Jefferson (97.5%), and Plaquemines (96.4%). Outside of the top 20, counties with over 50% of their roads at risk of flooding are concentrated along the coast of FL (Miami-Dade, Lee, Broward, and Pinellas Counties) and in the Houston, TX, area (Harris and Fort Bend Counties).
The impact of these changes in risk on local communities has the potential to be devastating. For example, in Harris County, TX (Houston), there are 770 hospitals, public utilities, and water treatment plants at risk of flooding above their operational threshold this year. In Miami-Dade, FL, there are 1640 schools, churches, and museums at risk of being inoperable due to their flood risk. In Cook County, IL (Chicago), there are nearly a quarter of a million residential properties (225k) at risk of flooding. In Kings County, NY (Brooklyn), there are nearly 4k commercial properties at risk of being made inoperable due to flooding. Finally, in Orleans Parish, LA (New Orleans), nearly all (99%) of roads are at risk of being undrivable due to their estimated flood risk.

4.2. City Level Analysis

When examining risk within the city level, high-level patterns emerge that mimic those seen at the county level, but with more of a focus on population centers (Figure 4 illustrates these overall scores spatially). Again, a large percentage of the representation in the top 20 list (Table 4) is made up of cities from the states of Louisiana (3 cities) and Florida (6 cities). Among those cities, the major population centers of New Orleans, LA (ranked 2nd); Miami, FL (ranked 8th); St. Petersburg, FL (ranked 12th); and Tampa, FL (ranked 14th) all rank highly in the “most at risk” cities list. Topping the list is Metairie, LA, and New Orleans, LA (two adjacent cities in the New Orleans Metro Area), followed by Cape Coral, FL; Fort Lauderdale, FL; and Charleston, SC. It is notable that compared to the county list, the city list includes more representation from the mid-Atlantic, with Hampton, VA sitting outside the top 10 most at-risk cities, ranked 18th. The observed increase in the mid-Atlantic may be driven by warming sea-surface and atmospheric temperatures which fuel higher occurrences of tropical cyclones in the region. Tropical cyclone intensity is predicted to increase significantly along the mid-Atlantic [28]. Additionally, the cities of Sacramento, CA; Fresno, CA; and Eugene, OR highlight the risk in cities on the West Coast.
When examining the risk rankings by dimension (for a spatial visualization, see Figure 5), the highest percentage of critical infrastructure at risk among this list of cities are in Metairie, LA (100%) and New Orleans, LA (94.5%). This is particularly interesting as both of these cities are in the same Metro (New Orleans-Kenner-Metairie Metropolitan Area), meaning that there is a sizable concentration of population and risk in a small geographic area. Cape Coral, FL (87.5%); Fort Lauderdale, FL (83.6%); and Miami, FL (83.3%) round out the top 5 in regards to critical infrastructure at risk. The top cities at risk for social infrastructure look very similar with the exception of Stockton, CA (93.9%) and Charleston, SC (77.3%). Metairie, LA (100%), New Orleans, LA (100%), and Cape Coral, FL (94.1%) again highlights the persistent extreme physical risk to flooding that exists in these cities. Outside of the top 20, Houston, TX, and Jacksonville, FL, have over 50% of critical infrastructure at risk, and Chicago, IL, has nearly one-third (31.4%) of social infrastructure at risk of flooding.
Rankings of the relative residential properties, commercial properties, and roads impacted look very similar to the rankings for critical and social infrastructure. Regarding residential properties impacted, Metairie, LA (100%); New Orleans, LA (100%); Stockton, CA (92%); Cape Coral, FL (89.6%); and Fort Lauderdale, FL (79.6%) rank 1–5, respectively. When looking at commercial properties, the same cities make up the top 5 in a slightly different order, with Metairie, LA (100%); New Orleans, LA (99.9%); Stockton, CA (97.3%); Cape Coral, FL (95.6%); and Fort Lauderdale (78.7%) respectively. Again, Houston, TX and Chicago, IL both fall outside of the top 20 but have around 30% of their residential and commercial properties within their city boundaries at risk of flooding.
Finally, the top 5 for the percentage of roads at risk are Metairie, LA (99.8%); New Orleans, LA (98.5%); Cape Coral, FL (93.8%); Stockton, CA (85.7%); and North Port, FL (81.6%). Ultimately, these results indicate a consistency in risk associated with top cities impacted across the five dimensions. Of note, Houston, TX (64.4%); Miami, FL (61.4%); Charleston, SC (52.8%); and Pittsburgh, PA (33.7%) are all major cities that have significant percentages of their road infrastructure at risk of flooding. While road infrastructure is unique in this analysis due to the fact that it is not building specific, previous research has highlighted the disproportionate effect that flooding on the road network has on flood vulnerability, such as through its impact on property values and disruption of community activity [26].

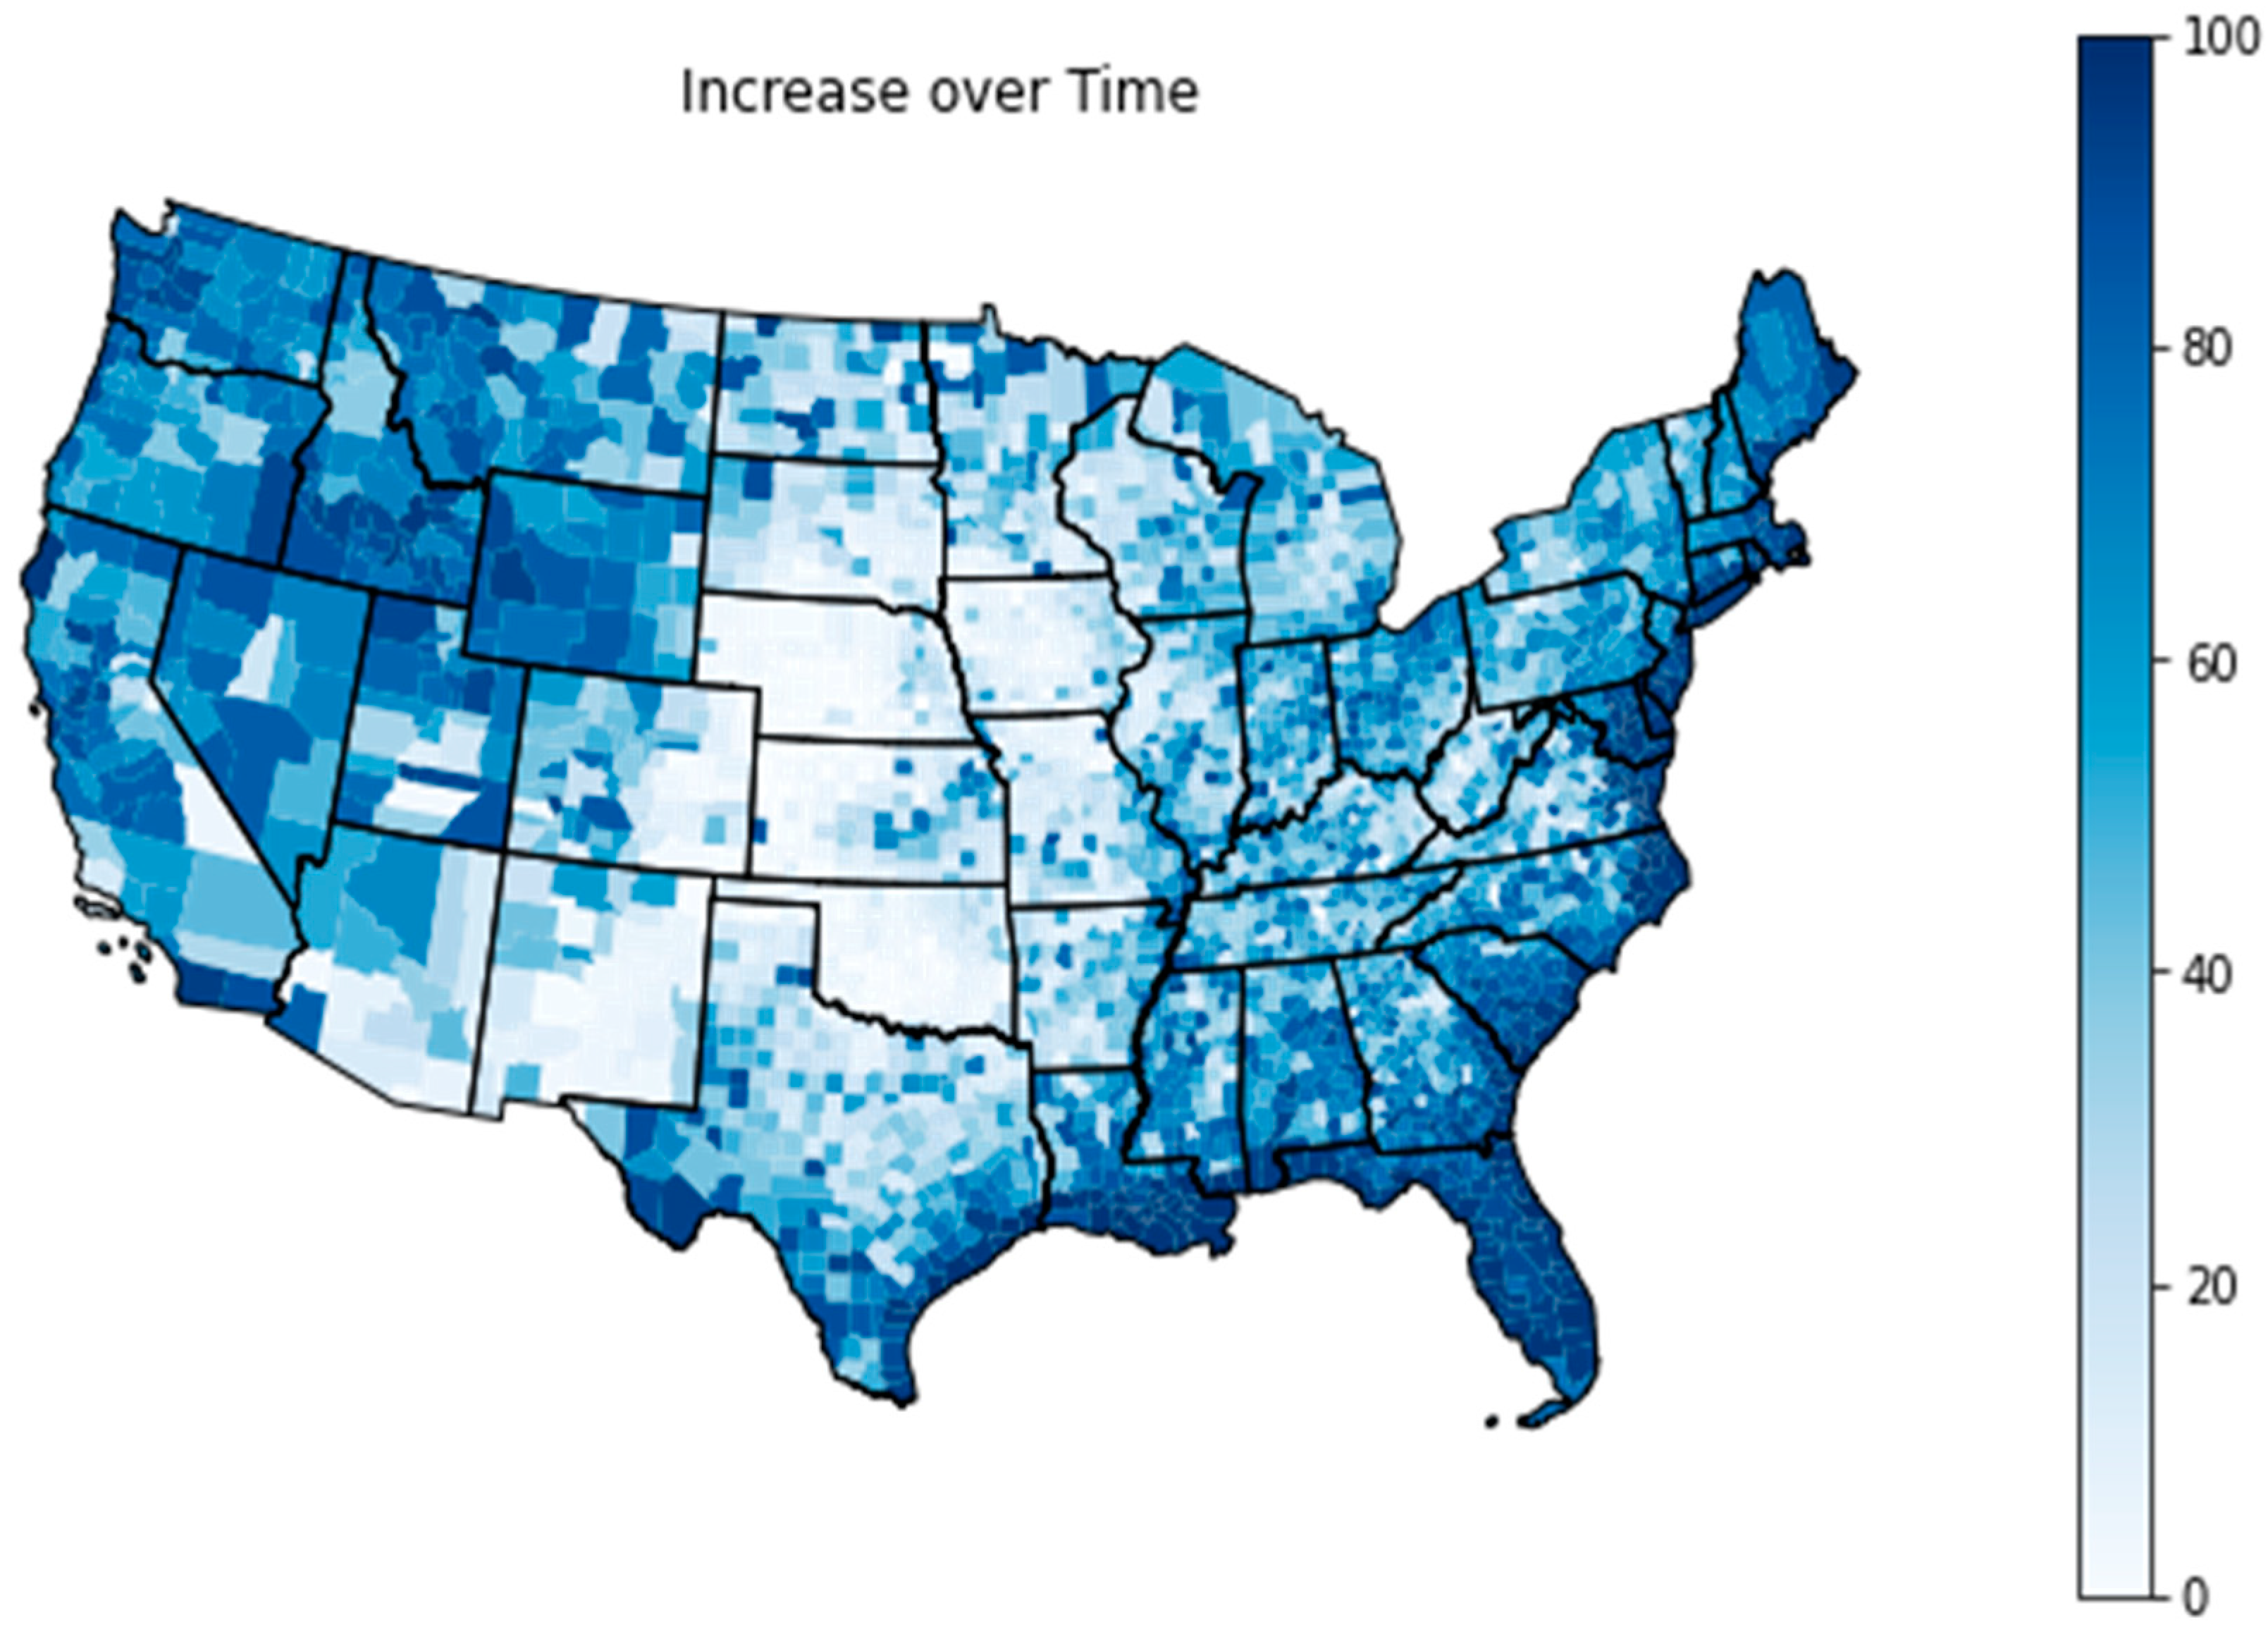
4.3. Change in Risk over the Next 30 Years

When examining county-level community risk in relation to its change from 2021 to 2051 (illustrated spatially in Figure 6), the most distinct patterns highlight significant increasing impacts along the Atlantic and Gulf Coasts, large increases in risk in the Northwest, and very little change in risk for the middle (non-coastal) portion of the country. The top 20 counties with the most overall percentage increase in impacts are detailed in Table 5 and a visual representation of these changes is provided in Figure 6. All of these patterns are driven by different environmental sources and predict a widely different experience in flood risk across the country.
Along the Atlantic and Gulf Coasts, risk increases almost universally due to associations with the forecasted increases in sea-level rise; increases in surge due to the forecasts of stronger coastal storm intensities; and increases in latitudinal reach of coastal storms due to a warming atmosphere and ocean. In the northwestern portion of the country, there are more moderate increases in flooding which are primarily driven by increased precipitation, storm runoff, and snowmelt in areas that feed the rivers in the region. In comparison, the landlocked interior portion of the country, stretching from New Mexico to Iowa, is estimated to have a minimal increase in risk. Additionally, isolated locales may see a decrease in risk due to projected decreases in rainfall over the study period.
The counties with the “most change” in community risk (Table 5) generally fall into this coastal region, with Norfolk, VA ranking first in the analysis with a 22.6% point increase in critical infrastructure flooding, a 55.3% point increase in the flooding of residential properties, a 43.7% point increase in the risk of flooding of commercial properties, and a 43.5% point increase in the flooding of roads up to the year 2051. Other notable counties in this analysis include Beaufort County, SC (Charleston) which is projected to see increases in the risk of flooding of 25.5% points for social infrastructure, 21.6% point increase in residential property flooding, 24.2% point increase in commercial property flooding, and 25.7% point increase in road flooding over the time period. Additionally, Suffolk County, MA (Boston); Virginia Beach, VA; and a number of counties in the state of Louisiana all make the top 20 list for the largest increase in risk and are expected to see increases in flood risk over this time period.

5. Discussion

While the type of properties examined (all properties provided by the NSI), the flood hazard information used, and the quantified feature for risk (value of assets) measured by Wing et al. [14] differs from this study, the pattern of the percentage of infrastructure impacts is similar. Wing et al. [14] find high levels of asset exposure in the states of Louisiana (32%), Florida (28%), Arizona (26%), and West Virginia (25%). The states identified in the Wing et al. [14] study for having high percentages of infrastructure impacts are similar to the states identified here, with the exception of Arizona. This is likely due to a difference in the flood hazard models utilized, where the hazard model in this study integrates a unique advancement from other flood hazard models of the consideration of adaptation measures. In Arizona, the relatively homogenous topography of the region makes modeling water flows difficult. Additionally, Arizona has an extensive canal system where floodwater is diverted from populations and assets. As a result, hazard models which do not account for these types of adaptation measures will obtain different results when investigating exposure.
The analysis by Qiang [19] examined the exposure ratios of critical infrastructure (CI) through their designations within the 100-year-flood-zone maps provided by FEMA. While this study also differs in the utilized flood hazard information, the types of infrastructures examined, and the nature of the outcome of interest, Qiang [19] similarly finds that Louisiana, Florida, and West Virginia have relatively high levels of exposure for the majority of the CI sectors examined.
Flood risk models within the United States, as well as worldwide, are often limited by problematic hazard data. For example, hazard data may be low resolution, outdated, and/or not consider the extensive role of mitigation projects. Additionally, low-resolution and incomplete input data for infrastructures examined often provide a challenge, especially for data covering large geographical areas. In some areas globally, hazard and exposure data sets may also not exist at all and would have to be constructed [29,30]. Many flood risk models do not integrate operational thresholds but several have instead looked only at asset exposure as an indicator of vulnerability. With these opportunities for improvement in mind, the model developed in this study includes the following advancements:
(1)
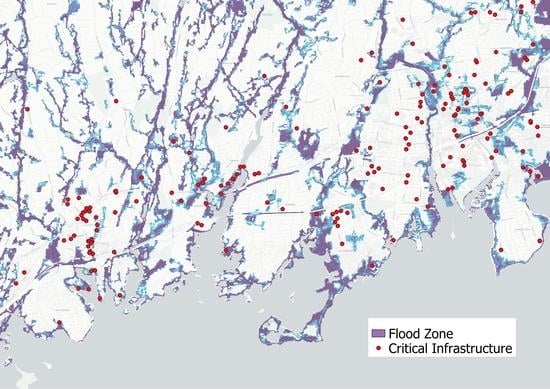
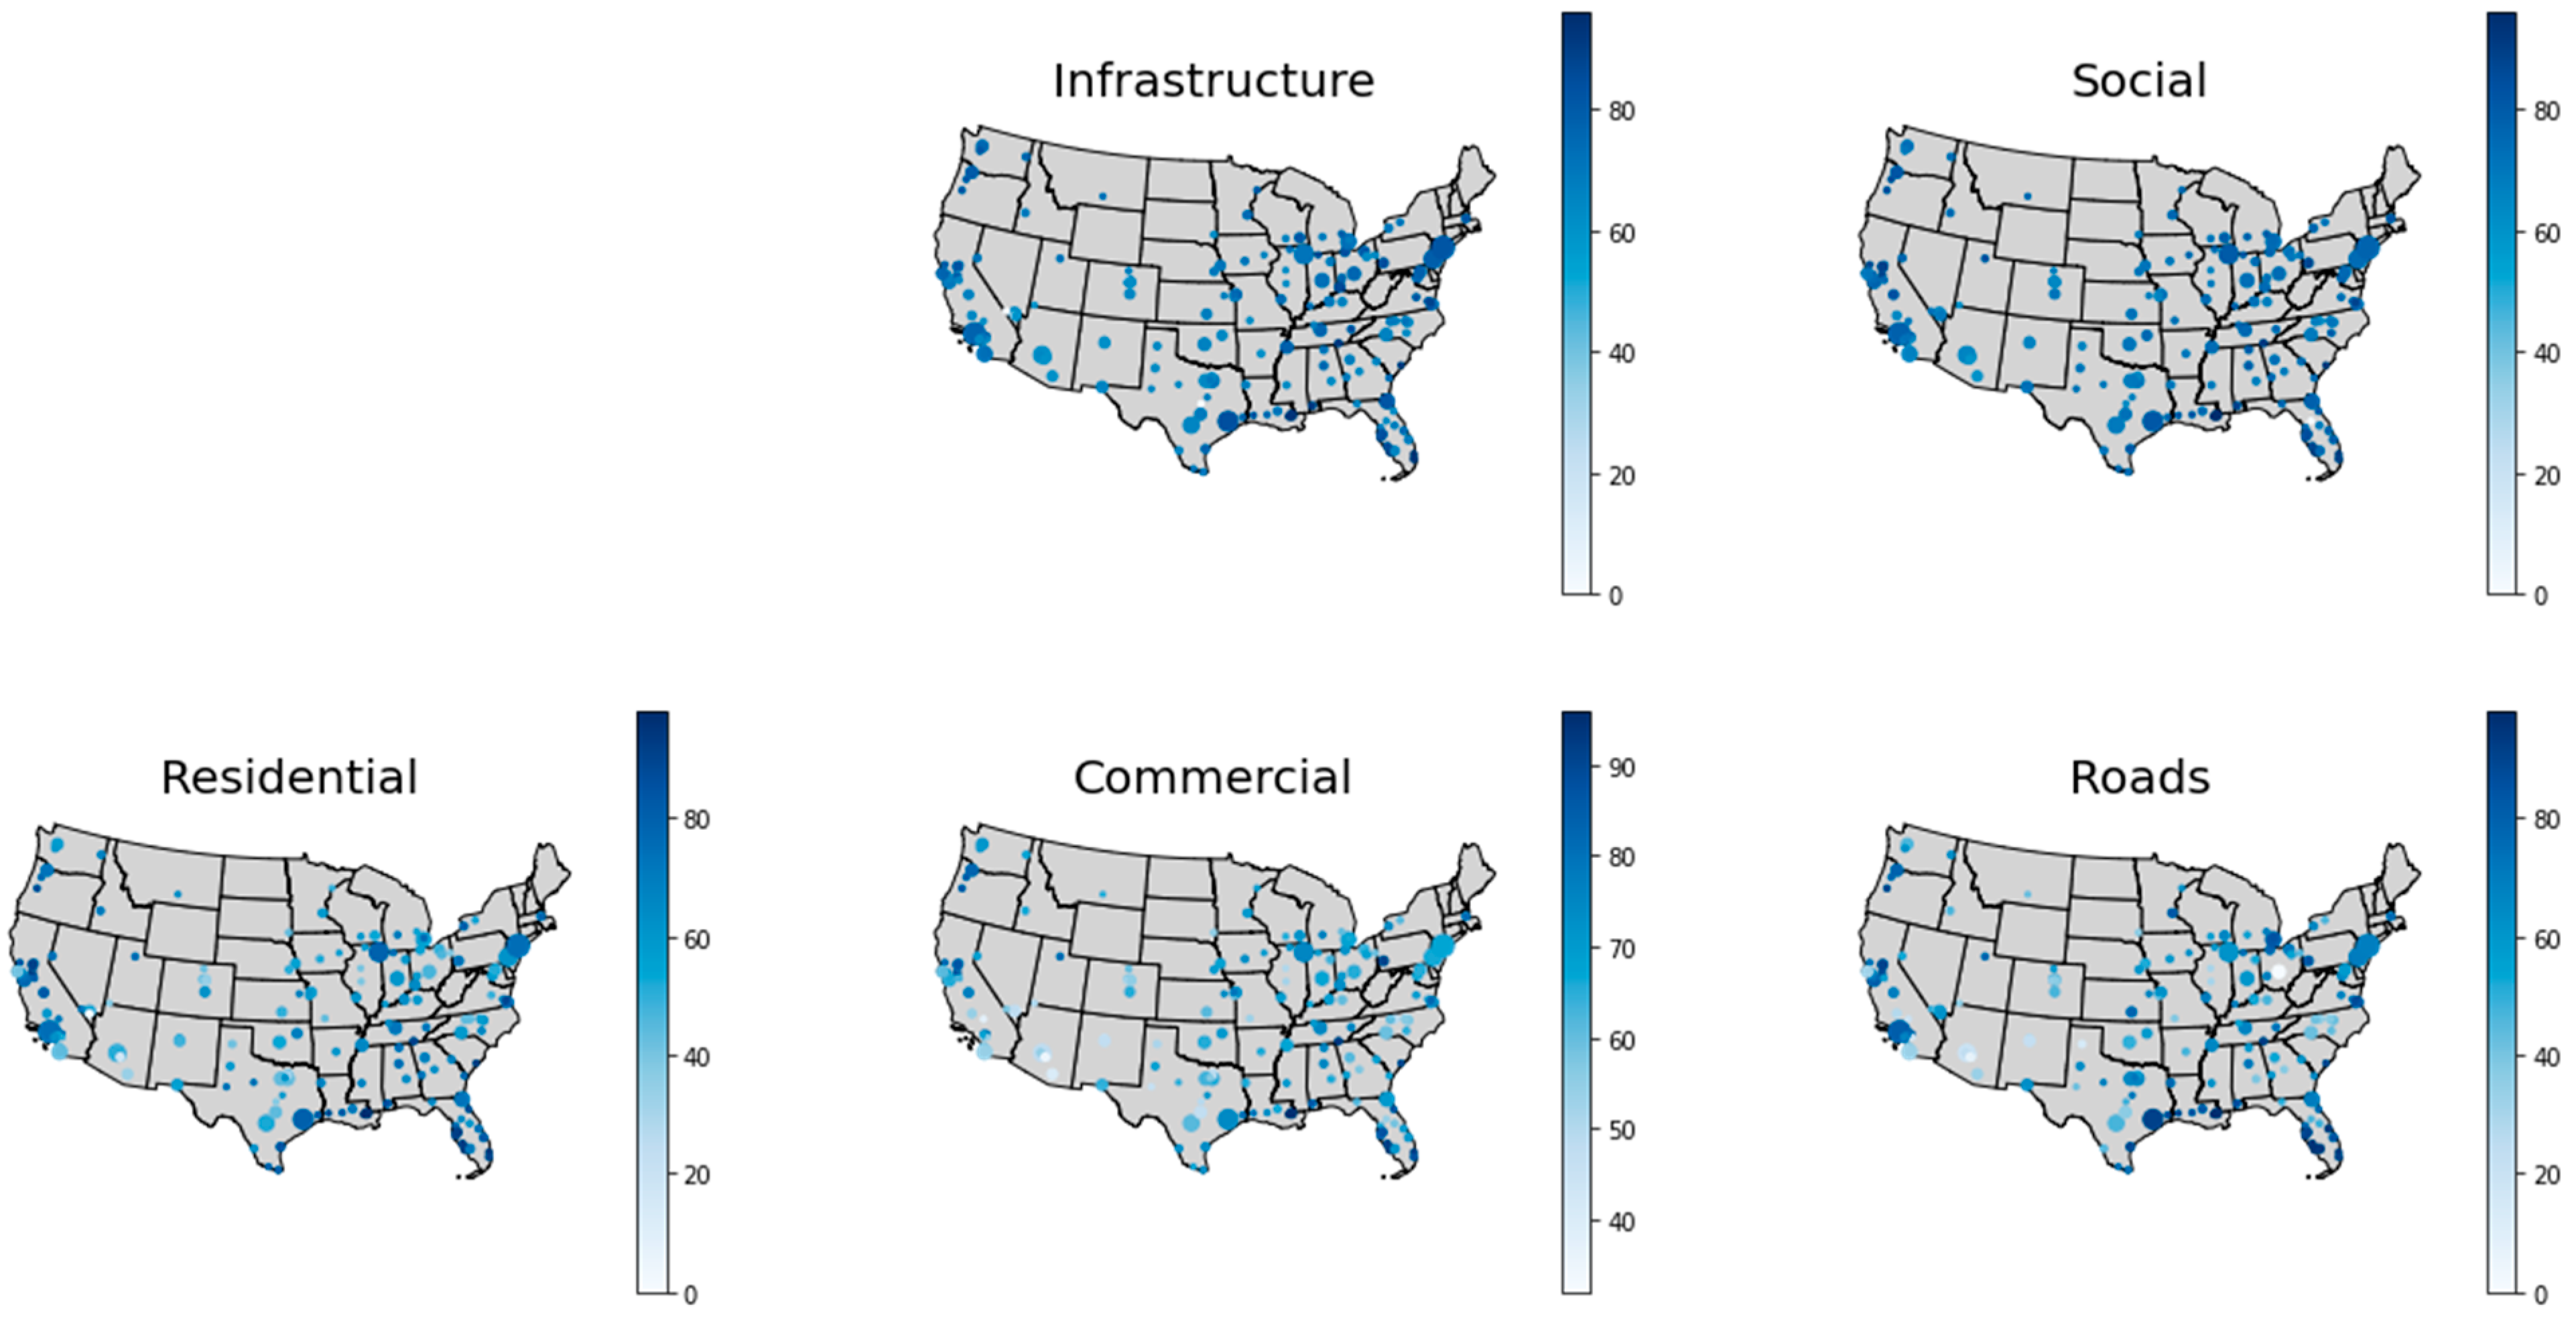
High Resolution Input Data: The development of a national scale impact assessment indicator created with high resolution data. This high-resolution data comes in the form of both the flood hazard data, which is sourced from the First Street Foundation Flood Model [7,25]; and property-specific spatial parcel data sourced from county-level property assessment records, which were collected and standardized by a 3rd party data provider. This high-resolution data adds additional precision to the model that other hazard layers do not allow for at a national scale. Additionally, the availability of the parcel-level data provides the ability to explicitly assign information about flooding to properties on a property-by-property basis that are categorized as residential property, roads, commercial property, critical infrastructure, and social infrastructure.
(2)
Multi-Source Flood Hazard Information: The integration of multiple sources of flooding in the creation of a high resolution, nationally consistent, flood hazard estimate. In the absence of a fully integrated flood hazard tool, previous risk score development efforts have had to rely on single-source national hazard layers (surge, riverine, rainfall, or tidal), or some combination of these sources, leading to lower levels of model fidelity. The FSF-FM hazard estimate used in this analysis is a fully integrated flood hazard assessment indicator that includes flooding from fluvial, pluvial, and coastal sources, enabling a more accurate understanding of physical vulnerability to flood risk across the country.
(3)
Multi-Return Period Hazard Information: The integration of a probabilistic approach associated with the magnitude of expected flooding and the probability of the occurrence of that flooding. This approach allows for a consistent view of flood hazard that varies by location based on the unique flood profile of the local area, as opposed to alternative approaches which focus on a single probabilistic layer (for example, 1 in 100-year return period) or do not have the consistency to measure the probability of hazard occurrence at a national scale. This FSF-FM integrates multiple return periods in the model, including the 2-year, 5-year, 20-year, 100-year, 250-year, and 500-year return periods.
(4)
Operational Threshold Integration: The integration of empirically derived thresholds identified by the federal government (like FEMA and NOAA) and authoritative bodies (such as the American Society of Civil Engineers) to determine the levels of flooding at which various infrastructure types become inoperable. To date, where national-level physical risk is assessed in the development of community risk indices, it only accounts for the inclusion of infrastructure inside of flood zone extents, which themselves are usually problematic (see point 3). The inclusion of operational thresholds, along with the use of high-precision probabilistic flood layers, allows for a more detailed and meaningful assessment of risk in a way that most impacts the local populations through the measurement of inoperability. By relying on government and authoritative definitions of inoperability thresholds, risk can further be standardized for community-to-community comparisons.
(5)
Future Facing Impacts: The integration of the FSF-FM further allows for the analysis of impacts today and 30 years into the future. By employing the same flood modeling methodology in the development of current and future flood impact layers, this analysis is able to isolate the effect of a changing environment and its impact on a community holding all development, population shifts, and adaptation efforts constant. In essence, this integration allows for the identification of areas, and infrastructure, that are most susceptible to flooding today and into the future. By presenting risk in this way to reveal potential vulnerabilities, local communities are able to make better-informed decisions about where to allocate resources and planning initiatives for their unique climate and topography.
This study has several limitations, many of which are due to limited data availability, as all of the infrastructure data used here is publicly available data that may not be complete. One such limitation is caused by the existence of some areas which have no parcel or infrastructure feature data. Additionally, a lack of precedent for similar models also serves as a limitation here. For example, there is ambiguity about what types of infrastructures should be prioritized for consideration within the model, which is especially important in light of differences in data availability and quality for different infrastructure types and between geographical areas. Additionally, the quantification of vulnerability has a wide variety of approaches and appropriate approaches will likely vary significantly by area and over time. While operational thresholds are likely necessary for a complete picture of vulnerability regardless of geographical area and over time, it is not sufficient. Additionally, the calculation of impact depths utilized here is likely too simplistic to capture the true nature of functionality in relation to operational thresholds. Additional research is needed for the development of a more accurate equation here and additional property-specific data is necessary to serve as inputs. This is likely to be most feasible on a smaller scale, as additional information about specific buildings is likely to be required.
In order to further increase understanding of community vulnerability, network performance and connectivity between community infrastructures should also be assessed. Pant et al. [17] and Dong et al. [22]) both provide important insights into how spatial network models may be used to identify and measure direct and indirect impacts. In this paper, network connectivity was not taken into account in the development of the community risk assessment as this study’s focus was primarily on the quantification of risk (outcome oriented) rather than vulnerability (susceptibility oriented). However, researchers and decision-makers looking to increase their understanding of community physical vulnerability would benefit from the integration of the high-precision risk assessment tools developed here in conjunction with considerations of network connectivity.
Additionally, for a more comprehensive understanding of community vulnerability, social vulnerability should be considered in addition to physical vulnerability (as addressed by [22]). Integration of network connectivity considerations and social vulnerability would allow for the establishment of a useful counterfactual economic scenario (such as GDP or on a smaller scale), proving useful for cost–benefit analyses. This highlights an additional opportunity for future research, where social vulnerability models gauging consumer concern for impacted infrastructures may be used to inform the weighting and integration of specific infrastructures. In this study, dimensions were selected that were judged to likely be the most visible impacts at the community level, but for different geographic levels (such as for government) and across different communities, prioritization may require analyses of different infrastructure types than those used here.
A related key point here is the associated uncertainty at each step in the calculation of impacts. For example, in addition to the uncertainty in hazard layers, there is also uncertainty in the location and description of infrastructures and in the calculation of their impact depths. As there is uncertainty at each layer within this process, uncertainty accumulates throughout the progression of hazard to risk estimates. Additionally, these uncertainties are uniquely amplified when considering future impacts.
The future-facing predictions generated within this study also operate on the assumption that settlement patterns will not change over time. For the purposes of this study, this was not taken into account as it would limit future prediction confidence and decrease the level of detail at which outcomes may be reported. However, this is an obvious opportunity for the integration of additional models predicting future built infrastructure patterns. Future research here may take into account settlement patterns from urban-rural redistribution and climate gentrification (among others). While this will limit the confidence of predictions for community-specific impacts, it may be useful for governments and planning agencies to understand for decision-making purposes, such as regarding investment. For example, estimates of investment costs in future adaptation may be too low if they do not consider changes in population and settlement patterns.

6. Conclusions

In this paper, an integrated framework for flood impact assessment of community-relevant infrastructures—specifically, residential properties, roads, commercial properties, critical infrastructure, and social facilities—is employed across the United States. The main objective of this study is to create a methodology for estimating key aspects of flood risk at a high resolution now and with climate change to community-relevant infrastructures. A key development presented in this paper is the integration of operational thresholds and the calculation of impact depths for the estimation of infrastructure risk from probabilistic exposure to flood hazards in 2021 and 2051. The impact depth metric provides a common measure that is broadly related to vulnerability and which will be useful in developing more robust risk assessments, especially those integrating network connectivity and social sensitivity across large geographical areas. This study should be followed by and integrated into additional research for the development of common metrics measuring other aspects of vulnerability for a better assessment of flood risk related to community infrastructure.
Additionally, the development of the framework used here may be applied in other geographical locations globally or on smaller scales within the United States for areas that wish to better gauge their infrastructure-related flood risk utilizing the higher quality data inputs that are typically better available on smaller scales. Limitations for other areas globally may be the lack of high-quality data on flood hazards (especially those which are high-resolution, integrate the impact of mitigation projects, utilize multi-return period and multi-source information, and have future-facing estimations), infrastructure characteristics and locations, and infrastructure-specific operational thresholds for the calculation of impact depths.
The estimates and the methodology provided by this study will be useful for screening and prioritizing investment into mitigation and adaptation measures. Individuals whose homes were spared the impact of a particular flood event are increasingly likely to find their local roads, businesses, critical infrastructure, utilities, or emergency services affected by flooding, indirectly threatening their quality of life, safety, and wellbeing. Providing a holistic understanding of flood risk at both the individual property level and broader community level allows homeowners, community leaders, and local governments a wide-angle lens through which to assess flooding and its physical, economic, and social impacts. It further serves to expand the conceptual framework within which communities analyze and understand flood risk, from risk to individual homes and properties to entire neighborhoods, cities, zip codes, and counties. Arming leaders and individuals with this information provide the insights necessary to take mitigating actions.

Author Contributions

Conceptualization, M.A., J.R.P. and N.F.; methodology, N.F. and M.A.; software, N.F.; validation, N.F., J.R.P. and H.H.; formal analysis, M.A. and Z.C.; investigation, J.R.P. and E.S.; data curation, N.F.; writing—original draft preparation, J.R.P. and E.S.; writing—review and editing, J.R.P. and E.S.; visualization, M.A.; supervision, J.R.P.; project administration, J.R.P. All authors have read and agreed to the published version of the manuscript.

Funding

This research received no external funding.

Institutional Review Board Statement

Not applicable.

Informed Consent Statement

Not applicable.

Data Availability Statement

The data presented in this study are available on request from the corresponding author. The data are not publicly available due to proprietary nature of some of the data.

Acknowledgments

The authors would like to acknowledge the immensely helpful contributions of Sara Chadwick, Michael Lopes, Shannon Keane, Matthew Eby, and Ed Kearns in the development of the model and for feedback on early drafts of this manuscript.

Conflicts of Interest

The authors declare no conflict of interest.

References

  1. Puentes, R. Why Infrastructure Matters: Rotten Roads, Bum Economy. Brookings. 2015. Available online: https://www.brookings.edu/opinions/why-infrastructure-matters-rotten-roads-bum-economy/ (accessed on 1 January 2021).
  2. Cybersecurity and Infrastructure Security Agency. A Guide to Critical Infrastructure Security and Resilience; Department of Homeland Security: Washington, DC, USA, 2019.
  3. American Society of Civil Engineers. A Comprehensive Assessment of America’s Infrastructure: 2021 Report Card; American Society of Civil Engineers: Reston, VA, USA, 2021. [Google Scholar]
  4. U.S. Global Change Research Program. Fourth National Climate Assessment (NCA4); U.S. Global Change Research Program: Washington, DC, USA, 2014.
  5. US Senate Testimony. Superstorm Sandy: The Devastating Impact on the Nation’s Largest Transportation Systems, Hearing before the Subcommittee on Surface Transportation and Merchant Marine Infrastructure, Safety, and Security of the Committee on Commerce, Science, and Transportation United States Senate; US Senate Testimony: Washington, DC, USA, 2012; pp. 112–792.
  6. Organization for Economic Co-Operation and Development. Climate-Resilient Infrastructure: Policy Perspectives; OECD Environment Policy Paper No. 14; Organization for Economic Co-Operation and Development: Washington, DC, USA, 2018. [Google Scholar]
  7. First Street Foundation. First Street Foundation Flood Model 2020 Methodology Overview; First Street Foundation: Brooklyn, NY, USA, 2020; Available online: https://firststreet.org/research-lab/published-research/flood-model-methodology_overview/ (accessed on 1 January 2021).
  8. First Street Foundation. The First National Flood Risk Assessment: Defining America’s Growing Risk; First Street Foundation: Brooklyn, NY, USA, 2020. [Google Scholar]
  9. First Street Foundation. Highlights from ‘the Cost of Climate: America’s Growing Flood Risk’; First Street Foundation: Brooklyn, NY, USA, 2021; Available online: https://firststreet.org/research-lab/published-research/highlights-from-the-cost-of-climate-americas-growing-flood-risk/ (accessed on 1 January 2021).
  10. Reisinger, A.; Howden, M.; Vera, C.; Garschagen, M.; Hurlbert, M.; Kreibiehl, S.; Mach, K.J.; Mintenbeck, K.; O’neill, B.; Pathak, M.; et al. The Concept of Risk in the IPCC Sixth Assessment Report: A Summary of Cross-Working Group Discussions; Intergovernmental Panel on Climate Change: Geneva, Switzerland, 2020. [Google Scholar]
  11. Cardona, O.D.; Van Aalst, M.K.; Birkmann, J.; Fordham, M.; Mc Gregor, G.; Rosa, P.; Pulwarty, R.S.; Schipper, E.L.F.; Sinh, B.T.; Décamps, H.; et al. Determinants of risk: Exposure and vulnerability. In Managing the Risks of Extreme Events and Disasters to Advance Climate Change Adaptation: Special Report of the Intergovernmental Panel on Climate Change; Cambridge University Press: Cambridge, UK, 2012; pp. 65–108. [Google Scholar]
  12. Luers, A.L.; Lobell, D.B.; Sklar, L.S.; Addams, C.L.; Matson, P.A. A method for quantifying vulnerability, applied to the agricultural system of the Yaqui Valley, Mexico. Glob. Environ. Chang. 2003, 13, 255–267. [Google Scholar]
  13. Brklacich, M.; Bohle, H.G. Assessing human vulnerability to global climatic change. In Earth System Science in the Anthropocene; Springer: Berlin/Heidelberg, Germany, 2006; pp. 51–61. [Google Scholar]
  14. Wing, O.E.; Bates, P.D.; Smith, A.M.; Sampson, C.C.; Johnson, K.A.; Fargione, J.; Morefield, P. Estimates of present and future flood risk in the conterminous United States. Environ. Res. Lett. 2018, 13, 034023. [Google Scholar] [CrossRef]
  15. Federal Emergency Management Agency. Design Guide for Improving Critical Facility Safety from Flooding and High Winds. Risk Management Series; Federal Emergency Management Agency: Washington, DC, USA, 2007.
  16. Thacker, S.; Barr, S.; Pant, R.; Hall, J.W.; Alderson, D. Geographic hotspots of critical national infrastructure. Risk Anal. 2017, 37, 2490–2505. [Google Scholar] [PubMed]
  17. Pant, R.; Thacker, S.; Hall, J.W.; Alderson, D.; Barr, S. Critical infrastructure impact assessment due to flood exposure. J. Flood Risk Manag. 2018, 11, 22–33. [Google Scholar]
  18. Hu, X.; Hall, J.W.; Shi, P.; Lim, W.H. The spatial exposure of the Chinese infrastructure system to flooding and drought hazards. Nat. Hazards 2016, 80, 1083–1118. [Google Scholar] [CrossRef]
  19. Qiang, Y. Flood exposure of critical infrastructures in the United States. Int. J. Disaster Risk Reduct. 2019, 39, 101240. [Google Scholar] [CrossRef]
  20. Technical Mapping Advisory Council. TMAC 2015 Annual Report; Federal Emergency Management Agency: Washington, DC, USA, 2015.
  21. Koks, E.E.; Rozenberg, J.; Zorn, C.; Tariverdi, M.; Vousdoukas, M.; Fraser, S.A.; Hall, J.W.; Hallegatte, S. A global multi-hazard risk analysis of road and railway infrastructure assets. Nat. Commun. 2019, 10, 1–11. [Google Scholar]
  22. Dong, S.; Esmalian, A.; Farahmand, H.; Mostafavi, A. An integrated physical-social analysis of disrupted access to critical facilities and community service-loss tolerance in urban flooding. Comput. Environ. Urban Syst. 2020, 80, 101443. [Google Scholar]
  23. Limao, N.; Venables, A.J. Infrastructure, geographical disadvantage, transport costs, and trade. World Bank Econ. Rev. 2001, 15, 451–479. [Google Scholar] [CrossRef]
  24. Karami, A.; Shah, V.; Vaezi, R.; Bansal, A. Twitter speaks: A case of national disaster situational awareness. J. Inf. Sci. 2020, 46, 313–324. [Google Scholar] [CrossRef] [Green Version]
  25. Bates, P.D.; Quinn, N.; Sampson, C.; Smith, A.; Wing, O.; Sosa, J.; Savage, J.; Olcese, G.; Neal, J.; Schumann, G.; et al. Combined modeling of US fluvial, pluvial, and coastal flood hazard under current and future climates. Water Resour. Res. 2021, 57, e2020WR028673. [Google Scholar] [CrossRef]
  26. McAlpine, S.A.; Porter, J.R. Estimating recent local impacts of sea-level rise on current real-estate losses: A housing market case study in Miami-Dade, Florida. Popul. Res. Policy Rev. 2018, 37, 871–895. [Google Scholar] [CrossRef] [PubMed] [Green Version]
  27. Tarabusi, E.C.; Guarini, G. An unbalance adjustment method for development indicators. Soc. Indic. Res. 2013, 112, 19–45. [Google Scholar] [CrossRef]
  28. Gori, A.; Lin, N.; Xi, D.; Emanuel, K. Tropical Cyclone Climatology Change Greatly Exacerbates US Joint Rainfall-Surge Hazard. 2021. Available online: https://www.researchsquare.com/article/rs-805581/v1 (accessed on 1 January 2021).
  29. Quesada-Román, A.; Villalobos-Chacón, A. Flash flood impacts of Hurricane Otto and hydrometeorological risk mapping in Costa Rica. Geogr. Tidsskr.-Dan. J. Geogr. 2020, 120, 142–155. [Google Scholar] [CrossRef]
  30. Quesada-Román, A.; Villalobos-Portilla, E.; Campos-Durán, D. Hydrometeorological disasters in urban areas of Costa Rica, Central America. Environ. Hazards 2021, 20, 264–278. [Google Scholar] [CrossRef]
Figure 1. Data processing workflow.
Water 13 03125 g001
Figure 2. Overall risk by county (percent of infrastructure with operational risk).
Water 13 03125 g002
Figure 3. County comparison for each dimension (percent of infrastructure with operational risk).
Water 13 03125 g003
Figure 4. Overall risk by city (percent of infrastructure with operational risk).
Water 13 03125 g004
Figure 5. City comparison for each dimension (Percent of infrastructure with operational risk).
Water 13 03125 g005
Figure 6. Overall risk change from 2021 to 2051 by county (change in percent of infrastructure with operational risk).
Water 13 03125 g006
Table 1. Data sources used to analyze the impact of infrastructures and roads.
CategoryDataset Location (All Accessed on 1 January 2021)
Roads
Roads (100 m line segments)https://www.census.gov/geographies/mapping-files/time-series/geo/tiger-line-file.html
Critical Infrastructure
Airport: Point locationshttps://ais-faa.opendata.arcgis.com/datasets/e747ab91a11045e8b3f8a3efd093d3b5_0
Fire station: Point locationshttps://hifld-geoplatform.opendata.arcgis.com/datasets/0ccaf0c53b794eb8ac3d3de6afdb3286_0
Hospital: Point locationshttps://hifld-geoplatform.opendata.arcgis.com/datasets/6ac5e325468c4cb9b905f1728d6fbf0f_0
Police station: Point locationshttps://hub.arcgis.com/datasets/c8403fea013f44b8a7bb0074495beda8_0
Ports: Point locationshttps://hifld-geoplatform.opendata.arcgis.com/datasets/major-us-port-facilities
Power station: Point locationshttps://hifld-geoplatform.opendata.arcgis.com/datasets/ee0263bd105d41599be22d46107341c3_0
Hazardous waste: Polygon (property outline)https://sedac.ciesin.columbia.edu/data/set/superfund-atsdr-hazardous-waste-site-v2
water outfall point locationshttps://echo.epa.gov/tools/data-downloads
Wastewater treatment Plants: Point locationshttps://catalog.data.gov/dataset/environmental-protection-agency-epa-facility-registry-service-frs-wastewater-treatment-pla
Social Infrastructure
Government building: Point locationshttps://hifld-geoplatform.opendata.arcgis.com/datasets/major-state-government-buildings
Historic building: Point locationshttps://www.nps.gov/subjects/nationalregister/data-downloads.htm
Worship: Point locationshttps://hifld-geoplatform.opendata.arcgis.com/datasets/all-places-of-worship
Museum: Point locationshttps://university-museums-and-collections.net/
School: Point locationshttps://hub.arcgis.com/datasets/geoplatform::public-schools
Table 2. Operational thresholds used.
Infrastructure TypeInfrastructure CategoryOperational Threshold (ft)
Residential parcelsResidential0
RoadsRoads0.5
Commercial parcelsCommercial0
AirportInfrastructure1
Fire stationInfrastructure2
HospitalInfrastructure3.5
Police stationInfrastructure1
PortInfrastructure1
Power stationInfrastructure2
Superfund siteInfrastructure1
Water outfallsInfrastructure0
Wastewater treatment plantInfrastructure0
Government buildingSocial0
Historic buildingSocial0
House of worshipSocial0
MuseumSocial0
SchoolSocial1
HAZUS (https://www.fema.gov/flood-maps/products-tools/hazus, accessed on 1 January 2021) thresholds are used for fire stations, hospitals, police stations, and power stations.; ASCE (https://ascelibrary.org/page/books/s-standards, accessed on 1 January 2021) thresholds are used for superfund sites and schools; FAA (https://www.faa.gov/, accessed on 1 January 2021) threshold is used for airports; FEMA (https://www.fema.gov/sites/default/files/2020-09/fema_hazus_flood-model_technical-manual_2.1.pdf, accessed on 1 January 2021) thresholds are used for wastewater treatment plants.; UNCTAD (https://unctad.org/system/files/non-official-document/CBhat_ICF_SLUWorkshop_p13.en.pdf, accessed on 1 January 2021) threshold is used for ports; Weather.gov (https://www.weather.gov/tsa/hydro_tadd accessed on 1 January 2021) threshold is used for roads.
Table 3. Top 20 “most at risk” counties in the U.S.
% of Properties with Operational Risk Today
RankCounty NameStateResidential RoadsCommercial InfrastructureSocial
1Cameron ParishLA99.298.310096.4100
2Orleans ParishLA10098.599.994.5100
3Jefferson ParishLA10097.510095.4100
4St. Bernard ParishLA99.998.810092.5100
5Hyde CountyNC99.394.896.694.1100
6Plaquemines ParishLA99.696.499.885.495.5
7Terrebonne ParishLA96.792.696.593.294.6
8Monroe CountyFL98.589.497.582.597.5
9St. Charles ParishLA9787.598.368.695.7
10Charlotte CountyFL87.78286.876.692.9
11Sutter CountyCA92.676.886.964.493.7
12Galveston CountyTX798380.980.584.8
13Franklin CountyFL86.777.293.368.282.1
14Tyrrell CountyNC81.379.584.566.787.5
15St. John the Baptist ParishLA92.672.695.655.280.9
16Poquoson cityVA78.484.27266.784.6
17Glynn CountyGA7960.786.38475.2
18Logan CountyWV70.369.788.978.473.9
19McDowell CountyWV64.160.487.985.471.2
20Johnson CountyKY70.67477.366.779.7
Table 4. Top 20 “most at risk” cities in the U.S.
% of Properties with Operational Risk Today
RankCity NameStateResidential RoadsCommercial InfrastructureSocial
1MetairieLA10099.8100100100
2New OrleansLA10098.599.994.5100
3Cape CoralFL89.693.895.687.594.1
4StocktonCA9285.797.375.493.9
5Fort LauderdaleFL79.579.678.783.674.3
6SacramentoCA68.973.266.867.670.6
7CharlestonSC6052.868.582.677.3
8MiamiFL50.761.455.483.355.4
9North PortFL50.981.666.55037.3
10ChattanoogaTN38.85167.969.757.6
11EugeneOR48.360.457.96049
12St. PetersburgFL48.264.736.665.644.4
13Santa RosaCA36.737.354.35053.8
14TampaFL44.350.544.345.535.2
15MobileAL25.941.440.671.740.2
16HoustonTX3264.433.35533.5
17Lake CharlesLA39.650.334.652.825.8
18HamptonVA33.447.928.761.131.5
19FresnoCA3839.447.624.251.7
20Palm CoastFL45.636.762.215.433.9
Table 5. Top 20 “greatest change” in risk from 2021 to 2051 by county.
% Increase of Facilities with Operational Risk over the Next 30 Years
RankCounty NameStateResidential RoadsCommercial InfrastructureSocial
1Norfolk cityVA55.343.543.722.647.7
2Portsmouth cityVA36.232.14116.233.9
3St. Mary ParishLA27.832.928.115.738.7
4Hampton cityVA33.728.327.213.930.9
5Calhoun CountyTX23.518.232.120.936.7
6Beaufort CountySC20.725.724.221.625.5
7Poquoson cityVA21.215.727.133.315.4
8Mathews CountyVA25.723.923.8929.2
9Iberia ParishLA27.1181612.537.4
10Camden CountyNC12.511.117.233.335.7
11Wakulla CountyFL17.311.518.916.736.2
12Currituck CountyNC1120.713.739.213.9
13Vermilion ParishLA18.912.322.75.327.8
14Suffolk CountyMA7.713.622.319.817.5
15Salem CountyNJ19.69.412.414.124.6
16Talbot CountyMD15.619.38.717.716.9
17Washington CountyNC14.914.218.622.87.7
18Chambers CountyTX15.810.89.87.832.4
19Virginia Beach cityVA15.217.71614.313.4
20Volusia CountyFL15.312.2201315.7
Publisher’s Note: MDPI stays neutral with regard to jurisdictional claims in published maps and institutional affiliations.

