
Water Quality Evaluation Method Based on a T-S Fuzzy Neural Network—Application in Water Environment Trend Analysis of Taihu Lake Basin

1
Tianjin Research Institute for Water Transport Engineering, M.O.T., Tianjin 300456, China
2
Key Laboratory of Agricultural Soil and Water Engineering in Arid and Semiarid Areas of Ministry of Education, Northwest A & F University, Yangling 712100, China
3
College of Water Resources and Architecture Engineering, Northwest A & F University, Yangling 712100, China
*
Author to whom correspondence should be addressed.
Water 2021, 13(21), 3127; https://doi.org/10.3390/w13213127
Submission received: 24 August 2021
/
Revised: 20 October 2021
/
Accepted: 30 October 2021
/
Published: 5 November 2021
(This article belongs to the Section Water Quality and Contamination)
Abstract
:In response to the problems of large computational volume and tedious computational process of fuzzy integrated evaluation, and general neural network models without clear water quality training criteria, this paper organically combines fuzzy rules, affiliation function, and neural network, and proposes a comprehensive method for the evaluation of water quality based on a T-S fuzzy neural network. On the three water quality monitoring data of six national key monitoring stations in Taihu Lake Basin, three evaluation methods—the one-factor evaluation method, the fuzzy integrated evaluation method, and the T-S fuzzy neural network evaluation method—were used to comprehensively evaluate water environment quality, and the results showed that the T-S fuzzy neural network method has the advantages of convenient calculation, strong applicability, and scientific results.
1. Introduction
The prevention and control of water pollution is the main work of water ecological and environmental protection. How to accurately evaluate the degree of water pollution, identify the evolution pattern of the water environmental system, and propose scientific and effective water environmental protection measures are the main tasks of managers and scientific researchers [1].
In 1965, the American scholar R.K. Horton first proposed the use of quality indicators in the evaluation of water environmental quality, marking the formal beginning of the study of water environmental quality evaluation [2]. Puckett et al. used principal component analysis to evaluate the water quality of some rivers in Virginia, USA, and obtained the main pollution factors from many water quality monitoring data in 2004 [3]. William Ocampo-Duque et al. used an FIS (fuzzy inference system) to evaluate the fuzzy water quality index of the Ebro River in Spain in 2006, effectively solving the problem of insufficient parameters for monitoring water quality, and achieving a comprehensive evaluation of water quality [4]. Using principal component analysis and correlation analysis, R. Noori et al. (2011) investigated the use of gamma tests and forward selection techniques to evaluate monthly river flow predictions, and concluded that correlation analysis can deal well with the relationship between physical and chemical parameters [5]. Zhang Yu et al. used fuzzy integrated evaluation and multivariate statistical methods to illustrate that the water quality of the main channel of the Qiantang River was better than that of the tributaries in 2012 [6]. P. Liu et al. studied a complex multilayered groundwater system in the North China coal mining area in 2017, using multivariate statistical methods including hierarchical cluster analysis (HCA) and principal component analysis (PCA), by combining HCA and PCA with hydrogeochemical correlation analysis [7]. J.O. Fatoba et al. studied the spatial variability of water quality data in some parts of southwest Nigeria using factor analysis (FA), cluster analysis (CA), and correlation analysis in 2017, which showed the ability of multivariate statistical methods to analyze massive amounts of water quality data and explain the spatial variability patterns of water quality [8]. Cong Ming et al. evaluated the groundwater quality of the Minqin Basin with a T-S fuzzy neural network and SVM model, and the evaluation results of both methods were essentially consistent, while the convergence speed of the T-S fuzzy neural network was faster [9].
According to the results of previous research, the T-S fuzzy neural network has strong advantages in groundwater quality evaluation. In this paper, a T-S fuzzy neural network evaluation method was introduced for surface water quality evaluation, and the weekly concentration data of three water quality factors—DO, CODMn, and NH3-N—were evaluated via a single-factor evaluation method, fuzzy integrated evaluation method, and T-S fuzzy neural network evaluation method for the period of 2009–2018 at six water quality sampling stations in Taihu Lake Basin and, by comparing the results of different evaluation methods, we aimed to determine: (1) whether the T-S fuzzy neural network evaluation method can easily calculate and obtain clear results in the evaluation process; and (2) whether the results of T-S fuzzy neural network evaluation can comprehensively and objectively reflect the water quality of the evaluated water bodies.
2. Materials and Methods
The results of this paper’s research contribute to the wide application of T-S fuzzy neural networks for surface water quality evaluation.
2.1. Study Area
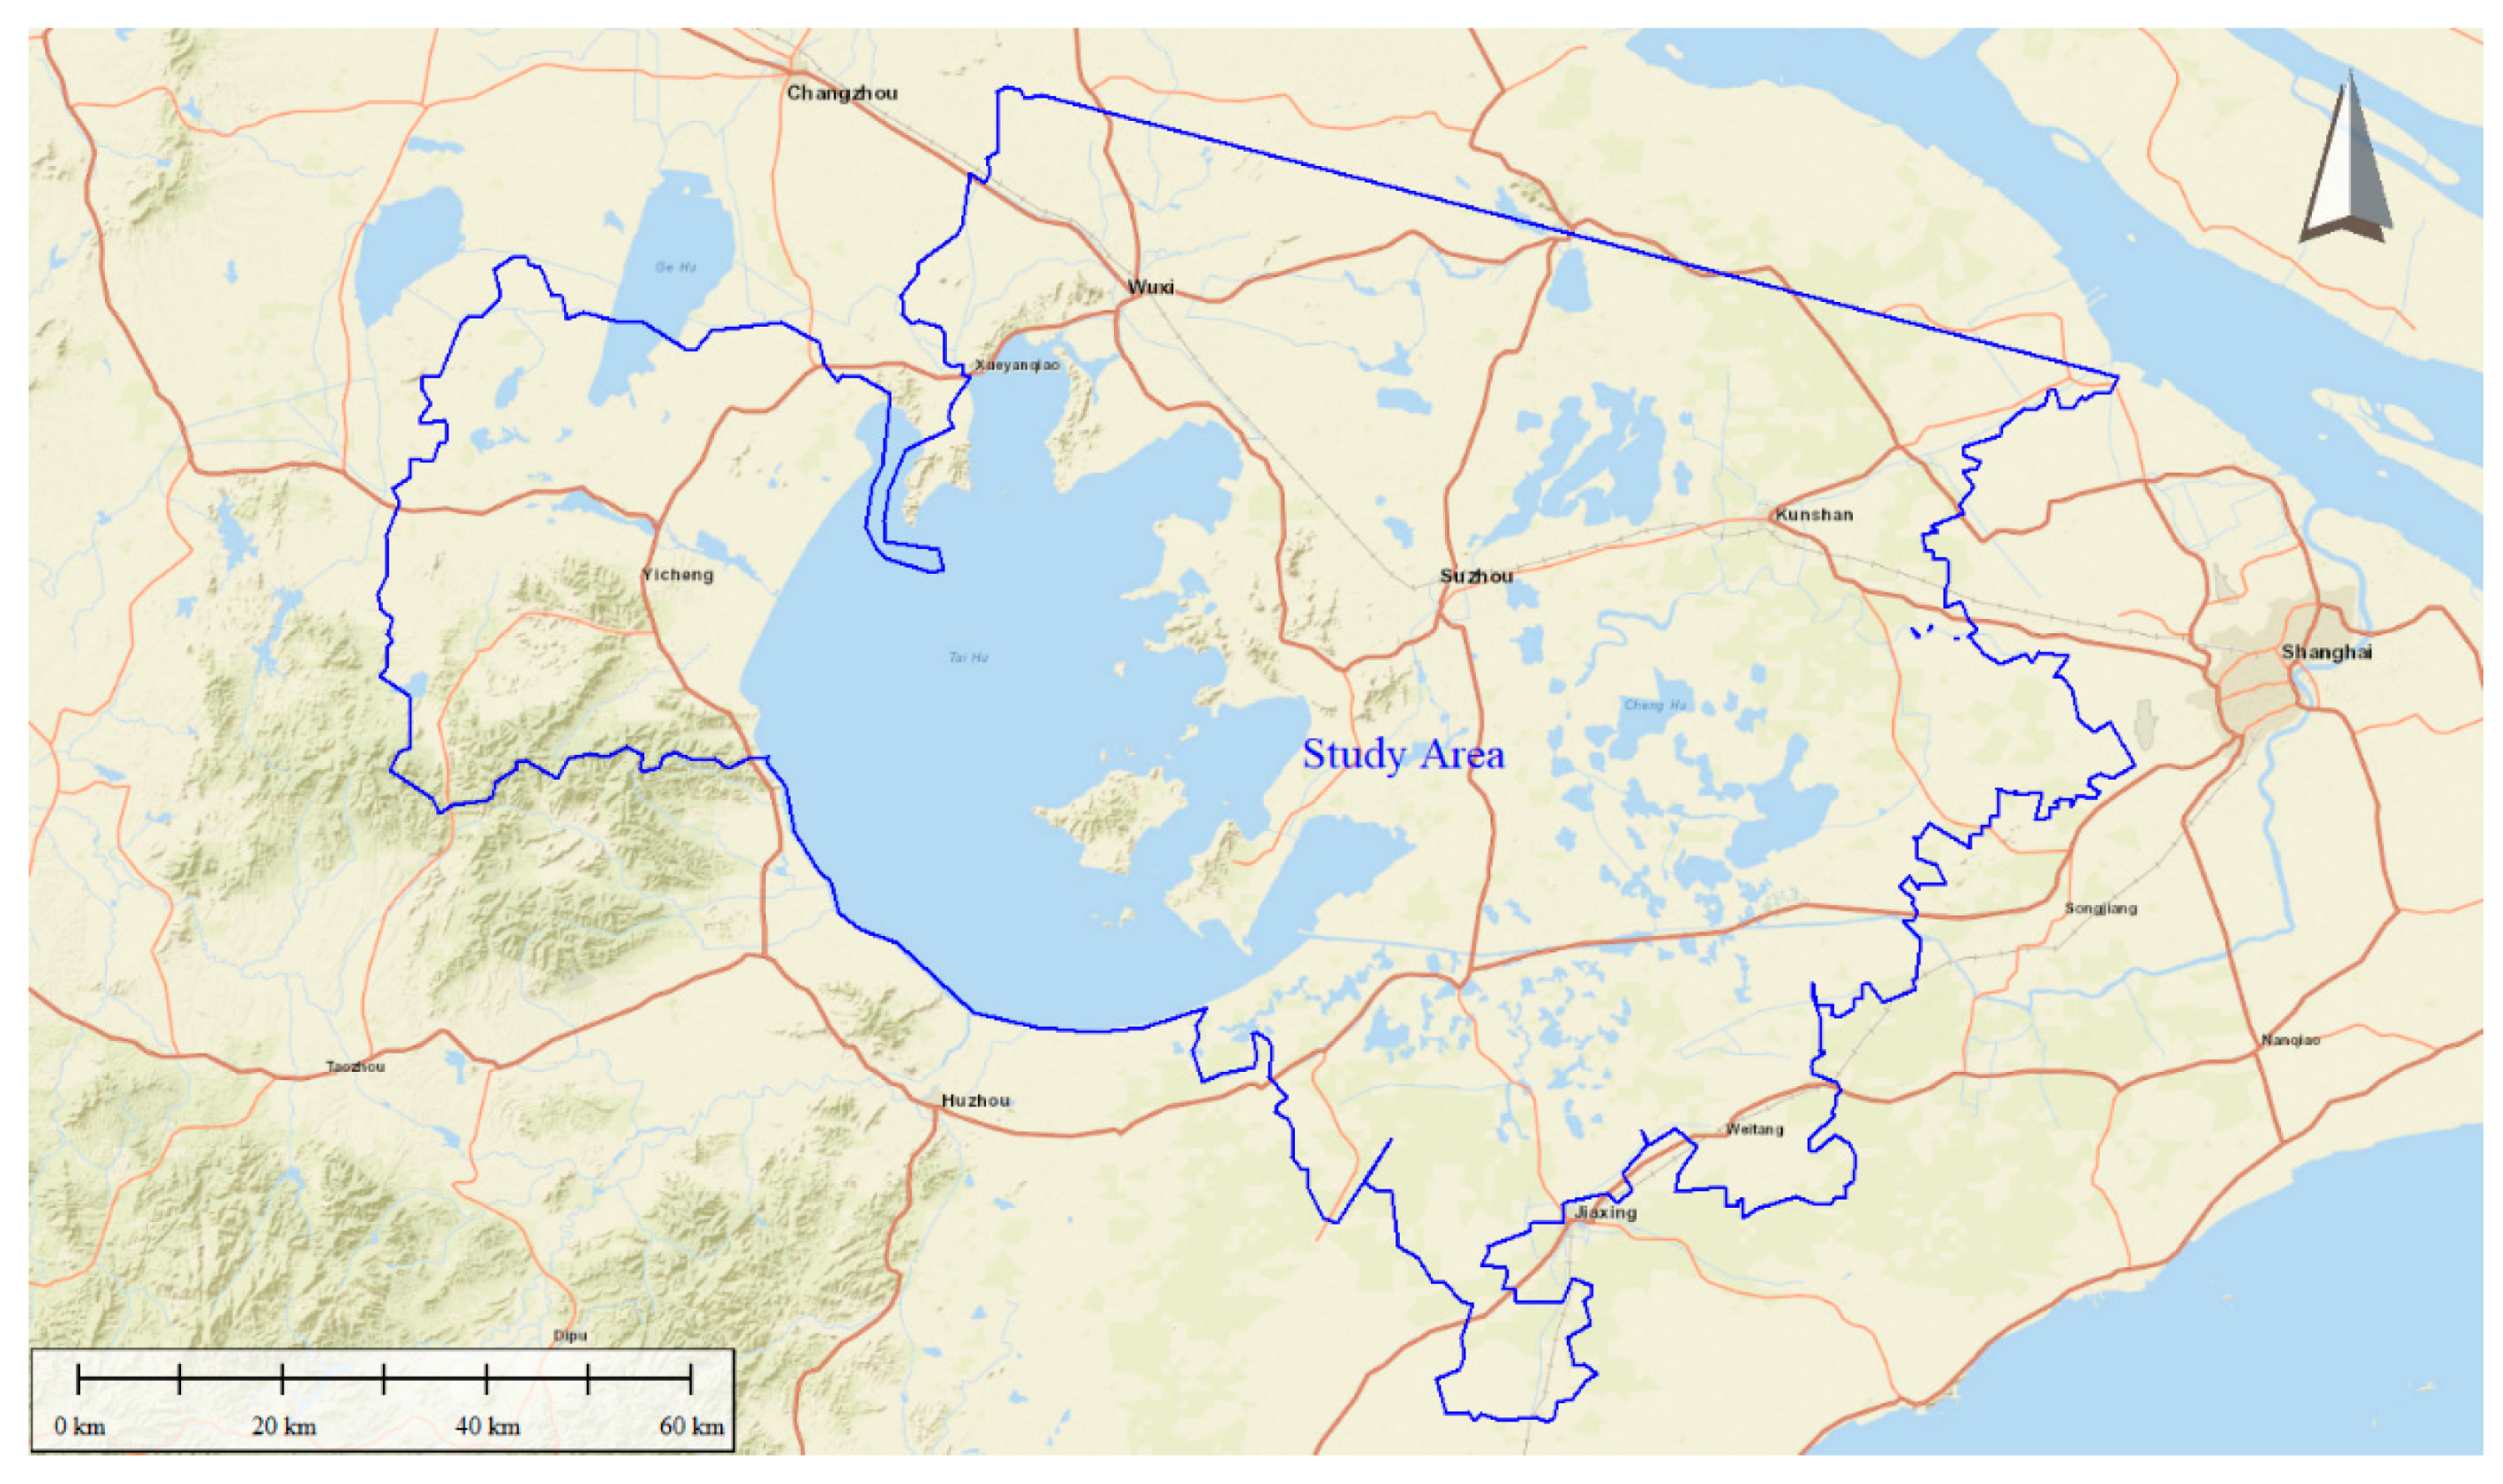
The Taihu Lake Basin is located in the south of the Yangtze River Delta, with the Yangtze River directly to the north, the Qiantang River bordering the south, the East Sea near the east, the Tianmu Mountains and part of the Maoshan Mountains to the west, and the plains, river networks, and depressions centered on Taihu Lake in the middle, with a total basin area of 36,900 km2. The east, south, and north sides are relatively high due to the influence of sedimentation from the mouth of the Yangtze River and Hangzhou Bay [10]. The location of the study area is shown in Figure 1.
2.2. Monitoring Data
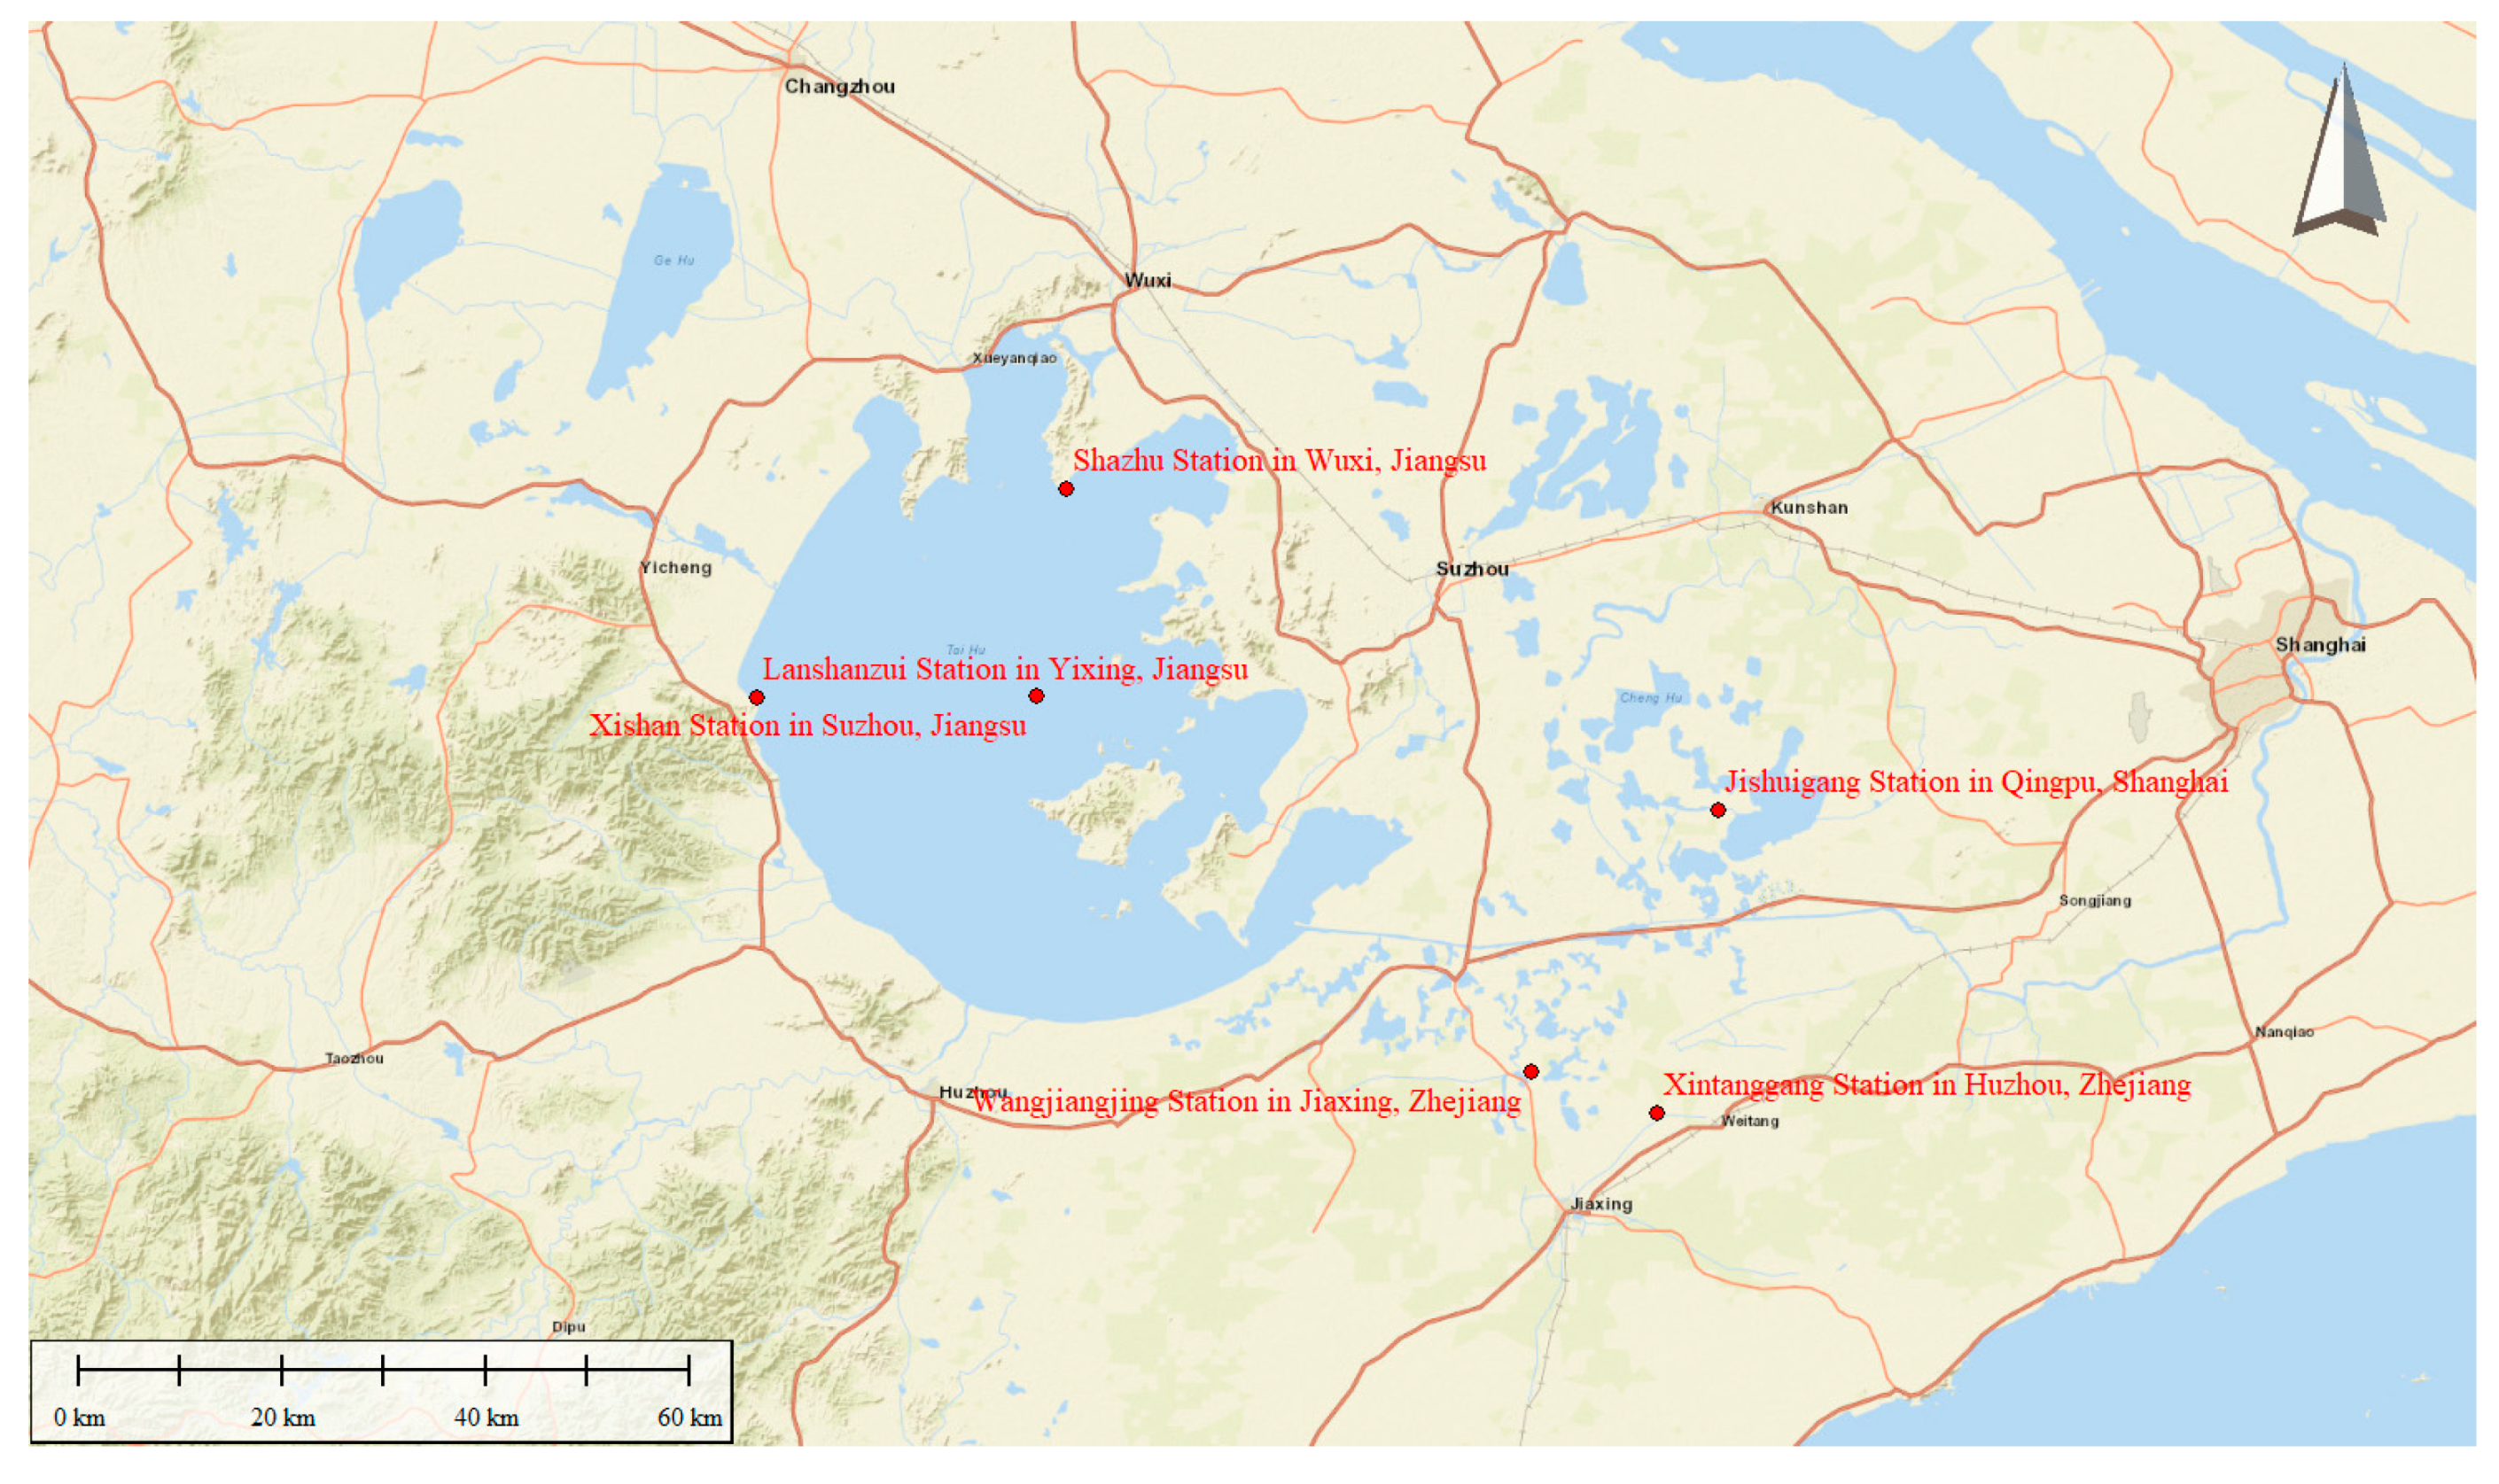
DO, CODMn, and NH3-N weekly concentration data were collected from the National Environmental Monitoring Network (NEMN) for six water quality sampling stations in the Lake Taihu basin from 2009–2018, and the specific station distribution is shown in Figure 2.
2.3. Water Environment Evaluation Methods
2.3.1. One-Factor Evaluation Method
The measured concentrations of pollutants in the water were compared with their permissible concentrations in water environmental standards (evaluation criteria) to obtain the pollution index of a single parameter [11]. The arithmetic mean method is often used, i.e.,:
where is the relative pollution value of a pollutant; is the measured concentration value of a pollutant; is the evaluation standard of a pollutant; is the pollution index of a pollutant; and is the measured number of a pollutant.
When , it means that the pollutant exceeds the evaluation standard, and cannot meet the environmental quality requirements. When , it means that the pollutant can meet the environmental quality requirements.
Equation (1) is applied to pollutants with upper limits. For pollutants with lower limits—e.g., DO—the following equation is used:
For pollutants with maximum and minimum criteria, such as pH, the following equation is used:
2.3.2. Fuzzy Integrated Evaluation Method
The fuzzy integrated evaluation method is used to quantify the evaluation indices by constructing a fuzzy subset of evaluation index levels, and then deriving the evaluation levels reflecting the superior and inferior change evaluation indices according to fuzzy composite operations [1]. Its evaluation steps are as follows:
- (1)
- Construct a set of evaluation indices based on the selected evaluation indices.
; there are i evaluation indexes;
- (2)
- Determine the set of evaluation index judging criteria based on the corresponding evaluation criteria of the evaluation indices.
, representing the set of evaluation levels (with j levels), and each level can correspond to a fuzzy subset;
- (3)
- Establishment of the affiliation function.
The affiliation degree is the degree to which the measured concentration values of the evaluation indices are affiliated with different evaluation levels in the set of evaluation criteria, which can be obtained by the affiliation function according to the water quality level criteria, to construct the affiliation function as follows:
When j = 1, the affiliation function is:
When 1 < j < n, the affiliation function is:
When j = n, the affiliation function is:
where is the measured concentration value of a pollutant; and is the evaluation standard of a pollutant;
- (4)
- Establish the fuzzy relationship matrix R.
- (5)
- Calculation of evaluation factor weight value W.
The weight given to each parameter can be calculated according to the exceedance of each sub-index, and the more exceedance, the greater the weight. The weight value is:
where is the i th pollutant’s measured concentration value; and is the arithmetic mean of the water quality standard values of the i th pollutant at all levels.
For the fuzzy calculation, the individual weights are normalized; that is:
giving weights to each index in the above set to form a row matrix;
- (6)
- Fuzzy composite operation.
- (7)
- To determine the comprehensive affiliation of the water body via composite operations of the above matrices. For the fuzzy matrix, the smaller of the two numbers multiplied is the “product”, and the larger of the numbers added together is the “sum”;
- (8)
- To determine the water quality level via the principle of maximum affiliation—that is, from the comprehensive affiliation matrix to select the maximum value, its serial number represents the evaluation of the water quality level. If there are two equal maximum values in the matrix, then the water quality level can be determined according to the principle of the adjacent number “greater than smaller” [11].
2.3.3. T-S Fuzzy Neural Network Evaluation Method
- (1)
- T-S fuzzy model
T-S fuzzy theoretical systems are able to use some fuzzy mathematical rules to obtain more complicated nonlinear functions, thus ensuring the superiority of the system by reducing the exact number of fuzzy rules when dealing with problems containing multiple variables [12]. The T-S fuzzy theoretical system is usually defined in the logical form of “if-then”, and the fuzzy inference of the theoretical system is expressed as follows [13]:
where: is the fuzzy set of the fuzzy system; represents the fuzzy system parameters; and is the output value obtained according to the fuzzy rule; the input part (i.e., the part) is fuzzy and the output part (i.e., the part) is deterministic; this fuzzy inference indicates that the output is a linear combination of the inputs.
Supposing that for the input , the affiliation degree of each input variable is first calculated according to the fuzzy rule:
where and are the center and width of the affiliation function, respectively; is the input parameter; and is the number of fuzzy subsets.
Fuzzy operations are performed on each of the above affiliation degrees, and the fuzzy operator is used as a concatenated multiplicative operator:
Based on the results of the fuzzy calculation, the output value of the model is obtained:
- (2)
- T-S fuzzy neural network
The T-S fuzzy network model generally has four layers, which are the input layer, fuzzification layer, fuzzy rule calculation layer, and output layer [13]. The input layers of the model network are linked through the vector , so the number of nodes of the model network is consistent with the dimensionality of the input vector. The fuzzification layer uses the affiliation function Equation (14) to fuzzify the input values in order to obtain the affiliation value . The in the fuzzy computation layer is obtained using the successive phase multiplication Equation (15), and then the output value of the output layer in this fuzzy model system is obtained by Equation (16). The learning algorithm of the fuzzy neural network is as follows:
- ①
- Error calculation:
- ②
- Coefficient correction:
- ③
- Parameter correction:
- (3)
- Modeling
A total of 100 samples were obtained randomly and equally spaced in the interval of each standard water quality class [14], and 500 sample datasets were obtained. The training set of the neural network was generated by randomly selecting 450 samples from the dataset, and the remaining 50 samples were used as the test set. Before starting the neural network training, the normalization function was used to turn all dataset samples into sample data between 0 and 1 [15]. Because there are three water quality indicators as input data, and unique water quality levels as output data, the topology of this neural network model is 3-6-1, and the model has six affiliation functions. The number of evolutions is 1000, and the training accuracy is 10-4. The output of this network model and the actual grade difference fluctuate up and down in the range of [−0.5, 0.5], and the model output value and the water quality grade represented are shown in Table 1.
3. Results
3.1. Water Quality Evaluation Results Based on One-Factor Evaluation
Using Equations (1)–(3), the one-factor water quality evaluation results of each key monitoring station in the Taihu Lake Basin were calculated through the water quality monitoring data, as shown in Table A1. The water quality evaluation results of each station during the study period are shown in Table 2.
3.2. Water Quality Evaluation Results Based on the Fuzzy Integrated Evaluation Method
We used MATLAB software to program calculations in order to obtain the affiliation matrix and its normalization results; see Table A2, Table A3, Table A4, Table A5, Table A6, Table A7, Table A8 and Table A9. Then, fuzzy composite operations were carried out to obtain the comprehensive affiliation matrix for water quality evaluation of key monitoring stations in the Taihu Lake Basin (see Table A10, Table A11, Table A12, Table A13, Table A14 and Table A15), so as to derive the surface water quality level of the basin, as shown in Table 3.
3.3. Water Quality Evaluation Results Based on the T-S Fuzzy Neural Network Evaluation Method
The final output results of the T-S fuzzy neural network evaluation method, along with the results of the water quality class corresponding to the output results, are shown in Table A16 and Table 4. From the output results, it can be seen that the overall water environment quality of the Taihu Lake Basin has become better, and the basin has been of the surface water class III water quality standard since 2014. At the same time, the water environmental quality in the upper part of the basin is significantly better than that in the lower part.
4. Discussion
The one-factor evaluation method is one of the more widely used water quality evaluation methods in China, to select the worst evaluation index criteria as the final water quality grade of the water body. The main advantage of this method is that the calculation is simple, and can identify the main pollutants of the water body. However, the water environment is a multifactor coupled complex dynamic system, and its pollution level is a fuzzy concept, so the evaluation of the pollution level of the classification boundary is also fuzzy, based only on the worst individual pollution index to define the water level, and often produces “overprotective”, one-sided evaluation [9].
The water environment is a socio-ecological structure system with multilevel and multifactor complex influences. In order to conduct a comprehensive and systematic evaluation of this complex water environment system, regardless of the method used, has its limitations. As one of the more successful methods used in the evaluation of water quality, the fuzzy integrated evaluation method takes into account both the fuzzy and hierarchical nature of the evaluation object, so that qualitative and quantitative evaluation can be combined to expand the amount of information on the evaluation object and improve the evaluation accuracy. However, fuzzy integrated evaluation also has its disadvantages—the calculation is large, and the determination of the weight of the indices is highly subjective. When there are too many water quality indices involved in the evaluation, under the condition that the sum of index weights is 1, the relative weight of each index tends to be small, and the weight vector does not match well with the fuzzy matrix R [1], resulting in poor resolution of evaluation results, or even evaluation failure.
The T-S fuzzy neural network method, combining the advantages of T-S fuzzy rule theory and artificial neural networks with one another, effectively eliminates the influence of the fuzzy rule affiliation function due to subjective factors. The randomness, fuzziness, and grayness of the water environmental system are considered, and the reasonable evaluation of water quality levels can be achieved [6]. With the use of current computer technology, this method can quickly complete the calculation and get the results. According to the characteristics of neural networks, the more water quality indices, the smaller the time scale, the more accurate the model established, and the more accurate the water quality evaluation results obtained. At the same time, according to different research areas and water quality indices, it is only necessary to modify part of the code to complete the calculation task, with strong applicability.
Comparing Table 2, Table 3 and Table 4, it can be seen that the trends of the three water quality evaluation results are consistent—that is, the water environmental quality of the whole Taihu Lake Basin tended to be better in the study period. However, the evaluation results of the one-factor evaluation method have obvious differences with the results of the other two water quality evaluation methods. The evaluation results based on the fuzzy integrated evaluation method and the T-S fuzzy neural network evaluation method are consistent; both meet the requirements of water quality evaluation, and can qualitatively and quantitatively reflect the quality of the water environment in a comprehensive and scientific manner. However, in contrast, the calculation of the fuzzy integrated evaluation method is larger, and when the number of water quality indices involved in the evaluation is large, there will be inaccurate evaluation, or even evaluation failure.
For the T-S fuzzy neural network evaluation method, its calculation is convenient and applicable, and the results are scientific. At present, countries have fixed water quality monitoring stations on major rivers and their watershed systems, and regularly (weekly, quarterly, or annually) collect water samples and test relevant factors. Some stations have accumulated more than a decade, or even several decades, of water quality monitoring data. Using the method proposed in this paper, we can use a computer to quickly calculate and analyze the historical water quality monitoring data of all water quality stations involved in a watershed, and review the evolution pattern of water quality in the watershed. Therefore, the T-S fuzzy neural network evaluation method is expected to play an important and positive role in the evaluation of water environmental quality in the future.
5. Conclusions
Fuzzy integrated evaluation is a computationally intensive, tedious computational process, and general neural network models do not have clear water quality training criteria, among other problems. The organic combination of fuzzy rules, affiliation functions, and neural networks complement one another’s strengths and weaknesses; fuzzy rules give the model a strong logical reasoning ability, grant it the ability to deal with higher order problems, and at the same time enable it to solve the accurate information and some uncertainty of fuzzy information. The neural network automates the fuzzy rule refinement and affiliation function generation in the model, thus making the fuzzy system a self-processing system, obtaining the T-S fuzzy neural network model, and using this model to make a comprehensive evaluation of the water environmental quality in the basin.
In this paper, three methods—the one-factor evaluation method, the fuzzy integrated evaluation method, and the evaluation based on a T-S fuzzy neural network—were used to analyze and evaluate the water quality environment of data from six water quality sampling stations in Taihu Lake Basin from 2009 to 2018. Comparing the three evaluation results, the T-S fuzzy neural network has the best evaluation effect, and its easy calculation, high applicability, and scientific results are expected to play an important and positive role in the subsequent evaluation of water environmental quality.
Author Contributions
Conceptualization, W.Y. and C.-F.C.; methodology, W.Y. and W.S.; software, W.Y. and J.-H.W.; validation, W.Y., C.-F.C., and W.S.; formal analysis, W.Y.; investigation, W.Y. and C.-F.C.; data curation, J.-H.W.; writing—original draft preparation, W.Y.; writing—review and editing, W.Y., C.-F.C., W.S., and J.-H.W.; visualization, J.-H.W.; All authors have read and agreed to the published version of the manuscript.
Funding
This research was funded by The Research of Two-phase migration, diffusion and decomposition mechanism of light hazardous chemicals, grant number TKS20210302.
Institutional Review Board Statement
Not applicable.
Informed Consent Statement
Not applicable.
Data Availability Statement
Not applicable.
Conflicts of Interest
The authors declare no conflict of interest.
Appendix A

Table A1.
Water quality evaluation results of each water quality factor based on one-factor evaluation.
Table A1.
Water quality evaluation results of each water quality factor based on one-factor evaluation.
| Station Name | Factor | Year | |||||||||
|---|---|---|---|---|---|---|---|---|---|---|---|
| 2009 | 2010 | 2011 | 2012 | 2013 | 2014 | 2015 | 2016 | 2017 | 2018 | ||
| Shazhu Station | CODMn | II | II | II | II | III | II | II | II | II | II |
| NH3-N | II | II | II | II | I | I | II | II | II | II | |
| DO | I | I | I | I | I | I | I | I | I | I | |
| Lanshanzui Station | CODMn | III | III | III | III | IV | IV | IV | IV | III | III |
| NH3-N | III | III | III | II | II | II | II | II | II | II | |
| DO | II | I | I | I | I | I | I | II | I | I | |
| Xishan Station | CODMn | II | II | III | III | III | II | II | II | III | II |
| NH3-N | II | I | II | I | II | II | II | I | II | II | |
| DO | I | I | II | II | II | I | I | II | I | I | |
| Xintang Port Station | CODMn | II | II | III | III | III | II | II | II | II | II |
| NH3-N | II | II | II | II | II | II | II | II | II | II | |
| DO | I | I | I | I | I | I | I | I | I | II | |
| Jishui Port Station | CODMn | III | III | II | III | II | III | II | II | II | III |
| NH3-N | Poor V | V | V | IV | III | III | IV | IV | III | II | |
| DO | II | II | II | III | II | III | II | II | II | II | |
| Wangjiangjing Station | CODMn | III | III | IV | IV | IV | IV | III | III | IV | III |
| NH3-N | IV | IV | V | V | IV | IV | III | III | III | III | |
| DO | IV | IV | IV | IV | IV | IV | IV | IV | III | III | |
Table A2.
Normalized results of water quality evaluation index weights.
| Year Station | Shazhu Station in Wuxi | Lanshanzui Station in Yixing | Xishan Station in Suzhou | ||||||
|---|---|---|---|---|---|---|---|---|---|
| Factor | CODMn | NH3-N | DO | CODMn | NH3-N | DO | CODMn | NH3-N | DO |
| 2009 | 0.17 | 0.11 | 0.72 | 0.25 | 0.20 | 0.55 | 0.18 | 0.08 | 0.74 |
| 2010 | 0.18 | 0.08 | 0.74 | 0.24 | 0.18 | 0.58 | 0.18 | 0.05 | 0.76 |
| 2011 | 0.17 | 0.09 | 0.74 | 0.18 | 0.27 | 0.55 | 0.25 | 0.07 | 0.68 |
| 2012 | 0.16 | 0.09 | 0.74 | 0.21 | 0.16 | 0.63 | 0.25 | 0.06 | 0.69 |
| 2013 | 0.22 | 0.06 | 0.72 | 0.32 | 0.10 | 0.59 | 0.25 | 0.08 | 0.67 |
| 2014 | 0.20 | 0.05 | 0.75 | 0.31 | 0.12 | 0.58 | 0.21 | 0.06 | 0.72 |
| 2015 | 0.19 | 0.07 | 0.74 | 0.33 | 0.12 | 0.55 | 0.21 | 0.07 | 0.72 |
| 2016 | 0.18 | 0.08 | 0.74 | 0.35 | 0.09 | 0.57 | 0.23 | 0.06 | 0.70 |
| 2017 | 0.18 | 0.06 | 0.76 | 0.21 | 0.09 | 0.70 | 0.19 | 0.07 | 0.74 |
| 2018 | 0.16 | 0.08 | 0.76 | 0.26 | 0.12 | 0.62 | 0.15 | 0.10 | 0.76 |
Table A3.
Normalized results of water quality evaluation index weights.
| Year Station | Xintanggang Station in Huzhou | Jishuigang Station in Qingpu | Wangjiangjing Station in Jiaxing | ||||||
|---|---|---|---|---|---|---|---|---|---|
| Factor | CODMn | NH3-N | DO | CODMn | NH3-N | DO | CODMn | NH3-N | DO |
| 2009 | 0.19 | 0.13 | 0.68 | 0.15 | 0.51 | 0.34 | 0.27 | 0.41 | 0.32 |
| 2010 | 0.19 | 0.11 | 0.70 | 0.17 | 0.44 | 0.39 | 0.28 | 0.46 | 0.27 |
| 2011 | 0.20 | 0.14 | 0.67 | 0.14 | 0.46 | 0.40 | 0.25 | 0.48 | 0.28 |
| 2012 | 0.20 | 0.13 | 0.67 | 0.19 | 0.44 | 0.37 | 0.27 | 0.48 | 0.24 |
| 2013 | 0.24 | 0.08 | 0.68 | 0.19 | 0.31 | 0.51 | 0.30 | 0.45 | 0.25 |
| 2014 | 0.20 | 0.12 | 0.68 | 0.22 | 0.27 | 0.51 | 0.32 | 0.39 | 0.29 |
| 2015 | 0.17 | 0.15 | 0.67 | 0.17 | 0.38 | 0.45 | 0.33 | 0.30 | 0.37 |
| 2016 | 0.18 | 0.14 | 0.67 | 0.16 | 0.33 | 0.50 | 0.30 | 0.30 | 0.40 |
| 2017 | 0.19 | 0.14 | 0.67 | 0.21 | 0.22 | 0.57 | 0.28 | 0.32 | 0.40 |
| 2018 | 0.19 | 0.12 | 0.69 | 0.23 | 0.13 | 0.63 | 0.30 | 0.29 | 0.42 |
Table A4.
Fuzzy matrix of Shazhu Station in Wuxi, Jiangsu.
| Year | Factor | Grade I | Grade II | Grade III | Grade IV | Grade V |
|---|---|---|---|---|---|---|
| 2009 | CODMn | 0.30 | 0.70 | 0 | 0 | 0 |
| NH3-N | 0.57 | 0.43 | 0 | 0 | 0 | |
| DO | 1.00 | 0 | 0 | 0 | 0 | |
| 2010 | CODMn | 0.21 | 0.79 | 0 | 0 | 0 |
| NH3-N | 0.80 | 0.20 | 0 | 0 | 0 | |
| DO | 1.00 | 0 | 0 | 0 | 0 | |
| 2011 | CODMn | 0.24 | 0.76 | 0 | 0 | 0 |
| NH3-N | 0.63 | 0.37 | 0 | 0 | 0 | |
| DO | 1.00 | 0 | 0 | 0 | 0 | |
| 2012 | CODMn | 0.90 | 0.10 | 0 | 0 | 0 |
| NH3-N | 1.00 | 0 | 0 | 0 | 0 | |
| DO | 1.00 | 0 | 0 | 0 | 0 | |
| 2013 | CODMn | 0.17 | 0.83 | 0 | 0 | 0 |
| NH3-N | 1.00 | 0 | 0 | 0 | 0 | |
| DO | 1.00 | 0 | 0 | 0 | 0 | |
| 2014 | CODMn | 0.17 | 0.83 | 0 | 0 | 0 |
| NH3-N | 1.00 | 0 | 0 | 0 | 0 | |
| DO | 1.00 | 0 | 0 | 0 | 0 | |
| 2015 | CODMn | 0.17 | 0.83 | 0 | 0 | 0 |
| NH3-N | 0.89 | 0.11 | 0 | 0 | 0 | |
| DO | 1.00 | 0 | 0 | 0 | 0 | |
| 2016 | CODMn | 0.13 | 0.87 | 0 | 0 | 0 |
| NH3-N | 0.80 | 0.20 | 0 | 0 | 0 | |
| DO | 1.00 | 0 | 0 | 0 | 0 | |
| 2017 | CODMn | 0.20 | 0.80 | 0 | 0 | 0 |
| NH3-N | 0.91 | 0.09 | 0 | 0 | 0 | |
| DO | 1.00 | 0 | 0 | 0 | 0 | |
| 2018 | CODMn | 0.47 | 0.53 | 0 | 0 | 0 |
| NH3-N | 0.83 | 0.17 | 0 | 0 | 0 | |
| DO | 1.00 | 0 | 0 | 0 | 0 |
Table A5.
Fuzzy matrix of Lanshanzui Station in Yixing, Jiangsu.
| Year | Factor | Grade I | Grade II | Grade III | Grade IV | Grade V |
|---|---|---|---|---|---|---|
| 2009 | CODMn | 0 | 0.36 | 0.64 | 0 | 0 |
| NH3-N | 0.78 | 0.22 | 0 | 0 | 0 | |
| DO | 0.99 | 0.01 | 0 | 0 | 0 | |
| 2010 | CODMn | 0 | 0.34 | 0.66 | 0 | 0 |
| NH3-N | 0 | 0.92 | 0.08 | 0 | 0 | |
| DO | 1.00 | 0 | 0 | 0 | 0 | |
| 2011 | CODMn | 0 | 0.87 | 0.13 | 0 | 0 |
| NH3-N | 0 | 0.26 | 0.74 | 0 | 0 | |
| DO | 1.00 | 0 | 0 | 0 | 0 | |
| 2012 | CODMn | 0 | 0.94 | 0.06 | 0 | 0 |
| NH3-N | 0.20 | 0.80 | 0 | 0 | 0 | |
| DO | 1.00 | 0 | 0 | 0 | 0 | |
| 2013 | CODMn | 0 | 0 | 0.75 | 0.25 | 0 |
| NH3-N | 0.60 | 0.40 | 0 | 0 | 0 | |
| DO | 1.00 | 0 | 0 | 0 | 0 | |
| 2014 | CODMn | 0 | 0 | 0.77 | 0.23 | 0 |
| NH3-N | 0.40 | 0.60 | 0 | 0 | 0 | |
| DO | 1.00 | 0 | 0 | 0 | 0 | |
| 2015 | CODMn | 0 | 0 | 0.67 | 0.33 | 0 |
| NH3-N | 0.40 | 0.60 | 0 | 0 | 0 | |
| DO | 1.00 | 0 | 0 | 0 | 0 | |
| 2016 | CODMn | 0 | 0 | 0.69 | 0.31 | 0 |
| NH3-N | 0.72 | 0.28 | 0 | 0 | 0 | |
| DO | 0.98 | 0.02 | 0 | 0 | 0 | |
| 2017 | CODMn | 0 | 0.78 | 0.22 | 0 | 0 |
| NH3-N | 0.66 | 0.34 | 0 | 0 | 0 | |
| DO | 1.00 | 0 | 0 | 0 | 0 | |
| 2018 | CODMn | 0.10 | 0.90 | 0 | 0 | 0 |
| NH3-N | 0.43 | 0.57 | 0 | 0 | 0 | |
| DO | 1.00 | 0 | 0 | 0 | 0 |
Table A6.
Fuzzy matrix of Xishan Station in Suzhou, Jiangsu.
| Year | Factor | Grade I | Grade II | Grade III | Grade IV | Grade V |
|---|---|---|---|---|---|---|
| 2009 | CODMn | 0.34 | 0.66 | 0 | 0 | 0 |
| NH3-N | 0.83 | 0.17 | 0 | 0 | 0 | |
| DO | 1.00 | 0 | 0 | 0 | 0 | |
| 2010 | CODMn | 0.45 | 0.55 | 0 | 0 | 0 |
| NH3-N | 1.00 | 0 | 0 | 0 | 0 | |
| DO | 1.00 | 0 | 0 | 0 | 0 | |
| 2011 | CODMn | 0 | 0.94 | 0.06 | 0 | 0 |
| NH3-N | 0.94 | 0.06 | 0 | 0 | 0 | |
| DO | 0.81 | 0.19 | 0 | 0 | 0 | |
| 2012 | CODMn | 0.90 | 0.10 | 0 | 0 | 0 |
| NH3-N | 1.00 | 0 | 0 | 0 | 0 | |
| DO | 0.89 | 0.11 | 0 | 0 | 0 | |
| 2013 | CODMn | 0 | 0.84 | 0.16 | 0 | 0 |
| NH3-N | 0.89 | 0.11 | 0 | 0 | 0 | |
| DO | 0.89 | 0.11 | 0 | 0 | 0 | |
| 2014 | CODMn | 0.04 | 0.96 | 0 | 0 | 0 |
| NH3-N | 0.97 | 0.03 | 0 | 0 | 0 | |
| DO | 1.00 | 0 | 0 | 0 | 0 | |
| 2015 | CODMn | 0.04 | 0.96 | 0 | 0 | 0 |
| NH3-N | 0.94 | 0.06 | 0 | 0 | 0 | |
| DO | 1.00 | 0 | 0 | 0 | 0 | |
| 2016 | CODMn | 0.17 | 0.83 | 0 | 0 | 0 |
| NH3-N | 1.00 | 0 | 0 | 0 | 0 | |
| DO | 0.69 | 0.31 | 0 | 0 | 0 | |
| 2017 | CODMn | 0 | 0.99 | 0.01 | 0 | 0 |
| NH3-N | 0.80 | 0.20 | 0 | 0 | 0 | |
| DO | 1.00 | 0 | 0 | 0 | 0 | |
| 2018 | CODMn | 0.48 | 0 | 0 | 0 | 0 |
| NH3-N | 0.66 | 0.34 | 0 | 0 | 0 | |
| DO | 1.00 | 0 | 0 | 0 | 0 |
Table A7.
Fuzzy matrix of Xintanggang Station in Hu-zhou, Zhejiang.
| Year | Factor | Grade I | Grade II | Grade III | Grade IV | Grade V |
|---|---|---|---|---|---|---|
| 2009 | CODMn | 0.04 | 0.96 | 0 | 0 | 0 |
| NH3-N | 0.37 | 0.63 | 0 | 0 | 0 | |
| DO | 1.00 | 0 | 0 | 0 | 0 | |
| 2010 | CODMn | 0.02 | 0.98 | 0 | 0 | 0 |
| NH3-N | 0.51 | 0.49 | 0 | 0 | 0 | |
| DO | 1.00 | 0 | 0 | 0 | 0 | |
| 2011 | CODMn | 0 | 0.80 | 0.20 | 0 | 0 |
| NH3-N | 0.23 | 0.77 | 0 | 0 | 0 | |
| DO | 1.00 | 0 | 0 | 0 | 0 | |
| 2012 | CODMn | 0 | 0.66 | 0.34 | 0 | 0 |
| NH3-N | 0.26 | 0.74 | 0 | 0 | 0 | |
| DO | 1.00 | 0 | 0 | 0 | 0 | |
| 2013 | CODMn | 0 | 0.66 | 0.34 | 0 | 0 |
| NH3-N | 0.80 | 0.20 | 0 | 0 | 0 | |
| DO | 1.00 | 0 | 0 | 0 | 0 | |
| 2014 | CODMn | 0 | 1.00 | 0 | 0 | 0 |
| NH3-N | 0.49 | 0.51 | 0 | 0 | 0 | |
| DO | 1.00 | 0 | 0 | 0 | 0 | |
| 2015 | CODMn | 0.42 | 0.58 | 0 | 0 | 0 |
| NH3-N | 0.31 | 0.69 | 0 | 0 | 0 | |
| DO | 1.0 | 0 | 0 | 0 | 0 | |
| 2016 | CODMn | 0.22 | 0.78 | 0 | 0 | 0 |
| NH3-N | 0.31 | 0.69 | 0 | 0 | 0 | |
| DO | 1.00 | 0 | 0 | 0 | 0 | |
| 2017 | CODMn | 0.20 | 0.80 | 0 | 0 | 0 |
| NH3-N | 0.31 | 0.69 | 0 | 0 | 0 | |
| DO | 1.00 | 0 | 0 | 0 | 0 | |
| 2018 | CODMn | 0.42 | 0.58 | 0 | 0 | 0 |
| NH3-N | 0.63 | 0.37 | 0 | 0 | 0 | |
| DO | 0.99 | 0.01 | 0 | 0 | 0 |
Table A8.
Fuzzy matrix of Jishuigang Station in Qingpu, Shanghai.
| Year | Factor | Grade I | Grade II | Grade III | Grade IV | Grade V |
|---|---|---|---|---|---|---|
| 2009 | CODMn | 0 | 0.76 | 0.34 | 0 | 0 |
| NH3-N | 0 | 0 | 0 | 0 | 1.00 | |
| DO | 0.40 | 0.6 | 0 | 0 | 0 | |
| 2010 | CODMn | 0 | 0.72 | 0.28 | 0 | 0 |
| NH3-N | 0 | 0 | 0 | 0.64 | 0.36 | |
| DO | 0.53 | 0.47 | 0 | 0 | 0 | |
| 2011 | CODMn | 0.04 | 0.96 | 0 | 0 | 0 |
| NH3-N | 0 | 0 | 0 | 0.46 | 0.54 | |
| DO | 0.69 | 0.31 | 0 | 0 | 0 | |
| 2012 | CODMn | 0 | 0.76 | 0.24 | 0 | 0 |
| NH3-N | 0 | 0 | 0.18 | 0.82 | 0 | |
| DO | 0 | 0.44 | 0.56 | 0 | 0 | |
| 2013 | CODMn | 0.08 | 0.92 | 0 | 0 | 0 |
| NH3-N | 0 | 0.24 | 0.76 | 0 | 0 | |
| DO | 0.45 | 0.55 | 0 | 0 | 0 | |
| 2014 | CODMn | 0 | 0.98 | 0.02 | 0 | 0 |
| NH3-N | 0 | 0.6 | 0.4 | 0 | 0 | |
| DO | 0 | 0.89 | 0.11 | 0 | 0 | |
| 2015 | CODMn | 0.22 | 0.78 | 0 | 0 | 0 |
| NH3-N | 0 | 0 | 0.74 | 0.26 | 0 | |
| DO | 0.03 | 0.97 | 0 | 0 | 0 | |
| 2016 | CODMn | 0 | 1 | 0 | 0 | 0 |
| NH3-N | 0 | 0 | 0.74 | 0.26 | 0 | |
| DO | 1.00 | 0 | 0 | 0 | 0 | |
| 2017 | CODMn | 0 | 1.00 | 0 | 0 | 0 |
| NH3-N | 0 | 0.86 | 0.14 | 0 | 0 | |
| DO | 0.62 | 0.38 | 0 | 0 | 0 | |
| 2018 | CODMn | 0 | 0.88 | 0.12 | 0 | 0 |
| NH3-N | 0.46 | 0.54 | 0 | 0 | 0 | |
| DO | 0.89 | 0.11 | 0 | 0 | 0 |
Table A9.
Fuzzy matrix of Wangjiangjing Station in Jiaxing, Zhejiang.
| Year | Factor | Grade I | Grade II | Grade III | Grade IV | Grade V |
|---|---|---|---|---|---|---|
| 2009 | CODMn | 0 | 0.30 | 0.70 | 0 | 0 |
| NH3-N | 0 | 0 | 0.70 | 0.30 | 0 | |
| DO | 0 | 0 | 0.55 | 0.45 | 0 | |
| 2010 | CODMn | 0 | 0.01 | 0.99 | 0 | 0 |
| NH3-N | 0 | 0 | 0.22 | 0.78 | 0 | |
| DO | 0 | 0 | 0.33 | 0.67 | 0 | |
| 2011 | CODMn | 0 | 0 | 0.98 | 0.02 | 0 |
| NH3-N | 0 | 0 | 0 | 0.70 | 0.30 | |
| DO | 0 | 0 | 0.68 | 0.32 | 0 | |
| 2012 | CODMn | 0 | 0 | 0.92 | 0.08 | 0 |
| NH3-N | 0 | 0 | 0 | 0.90 | 0.10 | |
| DO | 0 | 0 | 0.28 | 0.72 | 0 | |
| 2013 | CODMn | 0 | 0 | 0.87 | 0.13 | 0 |
| NH3-N | 0 | 0 | 0.26 | 0.74 | 0 | |
| DO | 0 | 0 | 0.22 | 0.78 | 0 | |
| 2014 | CODMn | 0 | 0 | 0.86 | 0.14 | 0 |
| NH3-N | 0 | 0 | 0.82 | 0.18 | 0 | |
| DO | 0 | 0 | 0.36 | 0.64 | 0 | |
| 2015 | CODMn | 0 | 0.20 | 0.80 | 0 | 0 |
| NH3-N | 0 | 0.62 | 0.38 | 0 | 0 | |
| DO | 0 | 0 | 0.47 | 0.53 | 0 | |
| 2016 | CODMn | 0 | 0.24 | 0.76 | 0 | 0 |
| NH3-N | 0 | 0.42 | 0.58 | 0 | 0 | |
| DO | 0 | 0 | 0.88 | 0.12 | 0 | |
| 2017 | CODMn | 0 | 0 | 1.00 | 0 | 0 |
| NH3-N | 0 | 0.04 | 0.96 | 0 | 0 | |
| DO | 0 | 0.77 | 0.23 | 0 | 0 | |
| 2018 | CODMn | 0 | 0.18 | 0.82 | 0 | 0 |
| NH3-N | 0 | 0.46 | 0.54 | 0 | 0 | |
| DO | 0 | 0.02 | 0.98 | 0 | 0 |
Table A10.
Fuzzy integrated evaluation results of Shazhu Station in Wuxi, Jiangsu.
| Year | Grade I | Grade II | Grade III | Grade IV | Grade V | WQ Grade 1 |
|---|---|---|---|---|---|---|
| 2009 | 0.73 | 0.17 | 0 | 0 | 0 | I |
| 2010 | 0.74 | 0.18 | 0 | 0 | 0 | I |
| 2011 | 0.74 | 0.17 | 0 | 0 | 0 | I |
| 2012 | 0.74 | 0.16 | 0 | 0 | 0 | I |
| 2013 | 0.72 | 0.10 | 0 | 0 | 0 | I |
| 2014 | 0.75 | 0.20 | 0 | 0 | 0 | I |
| 2015 | 0.74 | 0.19 | 0 | 0 | 0 | I |
| 2016 | 0.74 | 0.18 | 0 | 0 | 0 | I |
| 2017 | 0.76 | 0.18 | 0 | 0 | 0 | I |
| 2018 | 0.76 | 0.16 | 0 | 0 | 0 | I |
1 WQ Grade: water quality grade.
Table A11.
Fuzzy integrated evaluation results of Lanshanzui Station in Yixing, Jiangsu.
| Year | Grade I | Grade II | Grade III | Grade IV | Grade V | WQ Grade |
|---|---|---|---|---|---|---|
| 2009 | 0.55 | 0.25 | 0.25 | 0 | 0 | I |
| 2010 | 0.58 | 0.24 | 0.24 | 0 | 0 | I |
| 2011 | 0.55 | 0.26 | 0.27 | 0 | 0 | I |
| 2012 | 0.63 | 0.21 | 0.06 | 0 | 0 | I |
| 2013 | 0.59 | 0.10 | 0.32 | 0.25 | 0 | I |
| 2014 | 0.58 | 0.12 | 0.31 | 0.23 | 0 | I |
| 2015 | 0.55 | 0.12 | 0.33 | 0.33 | 0 | I |
| 2016 | 0.57 | 0.09 | 0.35 | 0.31 | 0 | I |
| 2017 | 0.70 | 0.21 | 0.21 | 0 | 0 | I |
| 2018 | 0.62 | 0.26 | 0 | 0 | 0 | I |
Table A12.
Fuzzy integrated evaluation results of Xishan Station in Suzhou, Jiangsu.
| Year | Grade I | Grade II | Grade III | Grade IV | Grade V | WQ Grade |
|---|---|---|---|---|---|---|
| 2009 | 0.74 | 0.18 | 0 | 0 | 0 | I |
| 2010 | 0.76 | 0.18 | 0 | 0 | 0 | I |
| 2011 | 0.68 | 0.25 | 0.06 | 0 | 0 | I |
| 2012 | 0.69 | 0.11 | 0 | 0 | 0 | I |
| 2013 | 0.67 | 0.25 | 0.16 | 0 | 0 | I |
| 2014 | 0.72 | 0.21 | 0 | 0 | 0 | I |
| 2015 | 0.72 | 0.21 | 0 | 0 | 0 | I |
| 2016 | 0.70 | 0.31 | 0 | 0 | 0 | I |
| 2017 | 0.74 | 0.19 | 0.01 | 0 | 0 | I |
| 2018 | 0.76 | 0.15 | 0 | 0 | 0 | I |
Table A13.
Fuzzy integrated evaluation results of Xintanggang Station in Hu-zhou, Zhejiang.
| Year | Grade I | Grade II | Grade III | Grade IV | Grade V | WQ Grade |
|---|---|---|---|---|---|---|
| 2009 | 0.68 | 0.19 | 0 | 0 | 0 | I |
| 2010 | 0.70 | 0.19 | 0 | 0 | 0 | I |
| 2011 | 0.67 | 0.20 | 0 | 0 | 0 | I |
| 2012 | 0.67 | 0.20 | 0 | 0 | 0 | I |
| 2013 | 0.68 | 0.24 | 0.24 | 0 | 0 | I |
| 2014 | 0.68 | 0.20 | 0 | 0 | 0 | I |
| 2015 | 0.67 | 0.17 | 0 | 0 | 0 | I |
| 2016 | 0.67 | 0.18 | 0 | 0 | 0 | I |
| 2017 | 0.67 | 0.19 | 0 | 0 | 0 | I |
| 2018 | 0.69 | 0.19 | 0 | 0 | 0 | I |
Table A14.
Fuzzy integrated evaluation results of Jishuigang Station in Qingpu, Shanghai.
| Year | Grade I | Grade II | Grade III | Grade IV | Grade V | WQ Grade |
|---|---|---|---|---|---|---|
| 2009 | 0.34 | 0.34 | 0.15 | 0 | 0.51 | V |
| 2010 | 0.39 | 0.39 | 0.17 | 0.44 | 0.36 | IV |
| 2011 | 0.40 | 0.31 | 0 | 0.46 | 0.46 | V |
| 2012 | 0 | 0.37 | 0.37 | 0.44 | 0 | IV |
| 2013 | 0.45 | 0.45 | 0.38 | 0.26 | 0 | II |
| 2014 | 0 | 0.51 | 0.27 | 0 | 0 | II |
| 2015 | 0.17 | 0.45 | 0.38 | 0.26 | 0 | II |
| 2016 | 0.50 | 0.16 | 0.33 | 0.26 | 0 | I |
| 2017 | 0.57 | 0.38 | 0.14 | 0 | 0 | I |
| 2018 | 0.63 | 0.23 | 0.12 | 0 | 0 | I |
Table A15.
Fuzzy integrated evaluation results of Wangjiangjing Station in Jiaxing, Zhejiang.
| Year | Grade I | Grade II | Grade III | Grade IV | Grade V | WQ Grade |
|---|---|---|---|---|---|---|
| 2009 | 0 | 0.27 | 0.41 | 0.32 | 0 | III |
| 2010 | 0 | 0.01 | 0.28 | 0.46 | 0 | IV |
| 2011 | 0 | 0 | 0.28 | 0.48 | 0.30 | IV |
| 2012 | 0 | 0 | 0.27 | 0.48 | 0 | IV |
| 2013 | 0 | 0 | 0.30 | 0.45 | 0 | IV |
| 2014 | 0 | 0 | 0.39 | 0.29 | 0 | III |
| 2015 | 0 | 0.30 | 0.37 | 0.37 | 0 | IV |
| 2016 | 0 | 0.30 | 0.40 | 0.12 | 0 | III |
| 2017 | 0 | 0.40 | 0.32 | 0 | 0 | II |
| 2018 | 0 | 0.29 | 0.42 | 0 | 0 | III |
Table A16.
Output values of T-S fuzzy neural network water quality evaluation.
| Station Name | Year | |||||||||
|---|---|---|---|---|---|---|---|---|---|---|
| 2009 | 2010 | 2011 | 2012 | 2013 | 2014 | 2015 | 2016 | 2017 | 2018 | |
| Shazhu Station | 1.45 | 1.38 | 1.38 | 1.39 | 1.47 | 1.33 | 1.37 | 1.38 | 1.29 | 1.27 |
| Lanshanzui Station | 2.28 | 2.19 | 2.36 | 1.82 | 2.25 | 2.30 | 2.41 | 2.29 | 1.60 | 2.01 |
| Xishan Station | 1.33 | 1.22 | 1.55 | 1.51 | 1.61 | 1.43 | 1.43 | 1.43 | 1.43 | 1.29 |
| Xintang Port Station | 1.65 | 1.59 | 1.78 | 1.79 | 1.67 | 1.64 | 1.58 | 1.62 | 1.63 | 1.47 |
| Jishui Port Station | 4.00 | 3.44 | 3.44 | 3.17 | 2.36 | 2.23 | 2.64 | 2.61 | 2.01 | 1.77 |
| Wangjiangjing Station | 3.07 | 3.46 | 3.77 | 3.72 | 3.52 | 3.18 | 2.59 | 2.65 | 2.91 | 2.64 |
References
- Feng, X.Y. Study on Environmental Quality Assessment of Surface Water in Ya’an Section of Qingyi River Basin. Masters’s Thesis, Sichuan Agricultural University, Ya’an, China, 2019. [Google Scholar]
- Horton, R.K. An index-number system for rating water quality. Water Pollut. Control. Fed. 1965, 37, 300–306. [Google Scholar]
- Puckett, L.J. Hydrogeologic controls on the transport and fate of nitrate in ground water beneath riparian buffer zones: Results from thirteen studies across the United States. Water Sci. Technol. A J. Int. Assoc. Water Pollut. Res. 2004, 49, 47–53. [Google Scholar] [CrossRef]
- Ocampo-Duque, W.; Ferré-Huguet, N.; Domingo, J.L.; Schuhmacher, M. Assessing water quality in rivers with fuzzy inference systems: A case study. Environ. Int. 2006, 32, 733–742. [Google Scholar] [CrossRef] [PubMed]
- Noori, R.; Karbassi, A.R.; Moghaddamnia, A.; Han, D.; Zokaei-Ashtian, M.H.; Farokhnia, A.; Ghafari Gousheh, M. Assessment of input variables determination on the SVM model performance using PCA, Gamma test, and forward selection techniques for monthly stream flow prediction. J. Hydrol. 2011, 401, 177–189. [Google Scholar] [CrossRef]
- Zhang, Y.; Lu, W.-X.; Chen, S.-M.; Gong, L. Groundwater Quality Evaluation based on TSFNN. Water Sav. Irrig. 2012, 7, 35–38. [Google Scholar]
- Liu, P.; Hoth, N.; Drebenstedt, C.; Sun, Y.; Xu, Z. Hydro-geochemical paths of multi-layer groundwater system in coal mining regions—Using multivariate statistics and geochemical modeling approaches. Sci. Total Environ. 2017, 601–602, 1–14. [Google Scholar]
- Fatoba, J.O.; Sanuade, O.A.; Hammed, O.S.; Igboama, W.W. The use of multivariate statistical analysis in the assessment of groundwater hydrochemistry in some parts of southwestern Nigeria. Arab. J. Geosci. 2017, 10, 1–11. [Google Scholar] [CrossRef]
- Ming, C.; Hui, Y. Comprehensive Assessment of Groundwater Quality in Minqin Basin based on T-S Fuzzy Neural Network. South North Water Transf. Water Sci. Technol. 2013, in press. [Google Scholar]
- Ke, F. Research and Counter Measure on the Comprehensive Management in Taihu Lake Basin Water Pollution. Master’s Thesis, East China University of Political Science and Law, Shanghai, China, 2015. [Google Scholar]
- Shao-Yuan, B.F. Environmental Hydrology, 2nd ed.; China Agricultural Press: Beijing, China, 2016; pp. 72–77. [Google Scholar]
- Zhou, Z. The Application of Fuzzy Neural Network Based on T-S Model in Water Quality Evaluation. Master’s Thesis, East China University of Political Science and Law, Nanjing, China, 2007. [Google Scholar]
- Wang, X. MATLAB Neural Networks 43 Case Studies, 1st ed.; Beijing University of Aeronautics and Astronautics Press: Beijing, China, 2013; pp. 288–289. [Google Scholar]
- Wang, X.-B.; Su, X.-L. Comprehensive Assessment of Groundwater Quality in Minqin Basin based on T-S Fuzzy Neural Network. Agric. Res. Arid. Areas 2013, 31, 188–198. [Google Scholar]
- Bai, Y.-L.; Cui, C.-F.; Tong, S.-L. Projection Pursuit Model for Assessment of Taihu Lake Water Quality Based on Improved Firefly Algorithm. Water Sav. Irrig. 2017, 79, 72–76. [Google Scholar]
Figure 1.
Geographical location map of the study area.

Figure 2.
Geographical location map of monitoring stations.

Table 1.
Water quality levels and corresponding output values.
| Water Quality Level | I | II | III | IV | V |
|---|---|---|---|---|---|
| Output value | [0, 1.5] | [1.5, 2.5] | [2.5, 3.5] | [3.5, 4.5] | [4.5, ∞] |
Table 2.
Water quality evaluation results based on the one-factor evaluation method.
| Station Name | Year | |||||||||
|---|---|---|---|---|---|---|---|---|---|---|
| 2009 | 2010 | 2011 | 2012 | 2013 | 2014 | 2015 | 2016 | 2017 | 2018 | |
| Shazhu Station | II | II | II | II | III | II | II | II | II | II |
| Lanshanzui Station | III | III | III | III | IV | IV | IV | IV | III | III |
| Xishan Station | II | II | III | III | III | II | II | II | III | II |
| Xintang Port Station | II | II | III | III | III | II | II | II | II | II |
| Jishui Port Station | Poor V | V | V | IV | III | III | IV | IV | III | III |
| Wangjiangjing Station | IV | IV | V | V | IV | IV | IV | IV | IV | III |
Table 3.
Water quality evaluation results based on the fuzzy integrated evaluation method.
| Station Name | Year | |||||||||
|---|---|---|---|---|---|---|---|---|---|---|
| 2009 | 2010 | 2011 | 2012 | 2013 | 2014 | 2015 | 2016 | 2017 | 2018 | |
| Shazhu Station | I | I | I | I | I | I | I | I | I | I |
| Lanshanzui Station | I | I | I | I | I | I | I | I | I | I |
| Xishan Station | I | I | I | I | I | I | I | I | I | I |
| Xintang Port Station | I | I | I | I | I | I | I | I | I | I |
| Jishui Port Station | V | IV | V | IV | II | II | II | I | I | I |
| Wangjiangjing Station | III | IV | IV | IV | IV | III | IV | III | II | III |
Table 4.
Water quality evaluation results based on the T-S fuzzy neural network evaluation method.
| Station Name | Year | |||||||||
|---|---|---|---|---|---|---|---|---|---|---|
| 2009 | 2010 | 2011 | 2012 | 2013 | 2014 | 2015 | 2016 | 2017 | 2018 | |
| Shazhu Station | I | I | I | I | I | I | I | I | I | I |
| Lanshanzui Station | II | II | II | II | II | II | II | II | II | II |
| Xishan Station | I | I | II | II | II | I | I | I | I | I |
| Xintang Port Station | II | II | II | II | II | II | II | II | II | I |
| Jishui Port Station | IV | III | III | III | II | II | III | III | II | II |
| Wangjiangjing Station | III | III | IV | IV | IV | III | III | III | III | III |
Publisher’s Note: MDPI stays neutral with regard to jurisdictional claims in published maps and institutional affiliations. |
© 2021 by the authors. Licensee MDPI, Basel, Switzerland. This article is an open access article distributed under the terms and conditions of the Creative Commons Attribution (CC BY) license (https://creativecommons.org/licenses/by/4.0/).
Share and Cite
MDPI and ACS Style
Ye, W.; Song, W.; Cui, C.-F.; Wen, J.-H. Water Quality Evaluation Method Based on a T-S Fuzzy Neural Network—Application in Water Environment Trend Analysis of Taihu Lake Basin. Water 2021, 13, 3127. https://doi.org/10.3390/w13213127
AMA Style
Ye W, Song W, Cui C-F, Wen J-H. Water Quality Evaluation Method Based on a T-S Fuzzy Neural Network—Application in Water Environment Trend Analysis of Taihu Lake Basin. Water. 2021; 13(21):3127. https://doi.org/10.3390/w13213127
Chicago/Turabian StyleYe, Wei, Wei Song, Chen-Feng Cui, and Jia-Hao Wen. 2021. "Water Quality Evaluation Method Based on a T-S Fuzzy Neural Network—Application in Water Environment Trend Analysis of Taihu Lake Basin" Water 13, no. 21: 3127. https://doi.org/10.3390/w13213127
Note that from the first issue of 2016, this journal uses article numbers instead of page numbers. See further details here.