
The Impact of the Changes in Climate, Land Use and Direct Human Activity on the Discharge in Qingshui River Basin, China

1
College of Water Sciences, Beijing Normal University, No. 19th Xinjiekouwai St., Haidian District, Beijing 100875, China
2
College of Life and Environmental Sciences, Minzu University of China, 27 Zhongguancun South Avenue, Beijing 100081, China
3
The Faculty of Environmental Engineering and Geodesy, Wroclaw University of Environmental and Life Sciences, Grunwaldzka 55, 50-357 Wroclaw, Poland
*
Author to whom correspondence should be addressed.
Water 2021, 13(21), 3147; https://doi.org/10.3390/w13213147
Submission received: 25 July 2021
/
Revised: 21 October 2021
/
Accepted: 30 October 2021
/
Published: 8 November 2021
(This article belongs to the Special Issue Response Mechanism of Non-point Source Nitrogen Output in Farmland)
Abstract
:Climate, land use and human activity have an impact on the Qingshui River in Chongli County. The Soil and Water Assessment Tool (SWAT) was used to separately analyze the contributions of climate, land use and direct human activity on the discharge variations. The results indicated that human activity had been the dominant factor for the discharge decrease, while climate and land use change had a positive influence on the discharge increase. The contributions of these three factors were −56.24%, 38.59% and 5.17%, respectively. Moreover, on the seasonal scale, the impact of those factors was consistent with their impact on the annual scale. Human activity was the main factor for discharge decrease in the summer, the contribution accounting for −77.13%. Due to the over-extraction of groundwater for irrigation and use in the mining industry, the discharge showed a decreasing tendency, which has the potential to place stress on sustainable water use in the future. The result of the study may contribute to the optimization of water resource allocation and management.
1. Introduction
Understanding the watershed hydrological process and its main driving factor is essential for water management. Due to climate change and human activity, watershed runoff has changed significantly in recent years [1,2,3,4,5,6,7]. Through the redistribution of precipitation and changes in temperature, climate variation may have a direct influence on runoff [8,9,10]. The human activities factor concerns not only land cover but also direct human activity [11]. As regards the impact of human activities on runoff, many studies simply focus on land cover and land change [4,12]. Generally, the decreasing use of land for cultivation and the expansion of urbanization are the main reasons for land use change. Land use cover and change impact the characteristics of the underlying surface in basins, which can affect the water cycle [13]. With the development of urbanization and population growth, increasing numbers of hydropower construction and agriculture irrigation projects have been built in some areas. These kinds of water projects have a direct impact on the amount of runoff. Therefore, it is essential to consider both land use change and direct human activity in the human activities factor [11,14].
According to a water resource vulnerability assessment conducted for the city of Zhangjiakou [15], water resources in Chongli County were vulnerable, especially for the hydrological and eco-environmental system. Groundwater in the study area was extracted for irrigation annually, taking up 54% of the whole water resource. Apart from that, groundwater is also extracted for industrial purposes. In 2022, skiing games will be carried out in the study area. An event of this type threatens to seriously exacerbate water shortages [16,17]. Considering the importance of water resources within the study area, it is crucial to implement water management. The analysis of discharge change indicates valuable evidence-based information of watershed response to past changes in climate, land use change and human activity separately, which is important for water resources management [18].
The approaches to be applied in this field can be classified into three parts: a statistical analysis, elasticity-based methods and hydrological simulation. Through analyzing the linear relationship between meteorological data and runoff [4,19], the statistical method does not consider the physical processes of the hydrological cycle [20,21]. The Budyko framework is widely used as an elasticity-based method for considering the changes in precipitation (P), potential evapotranspiration (E0) and the n (a parameter presenting catchment characteristics) on runoff (Q) [22,23]. However, it neglects the difference on the spatial scale. Watershed models are powerful tools for simulating the effect of watershed processes on soil and water resources [13]. Moreover, hydrological models can simulate water cycles under different scenarios, such as climate change and human activity, on both time and spatial scales [24]. Among watershed models, the Soil and Water Assessment Tool (SWAT) can be used to simulate the impacts of alternative data items, such as changes in land use, land management practice and climate [25,26,27]. The model is highly rated for its computational efficiency and long term continuous simulations [28].
The objectives of this study are as follows: (1) to analyze the precipitation trend and then to compare the relationship between precipitation and discharge change at the Qingshui station (the whole basin outlet); (2) to separate the contributions of climate change, land use change and direct human activity on the discharge variation on annual and seasonal scales; (3) to discuss how these three factors bring a change in the runoff.
2. Materials and Methods
2.1. Study Area
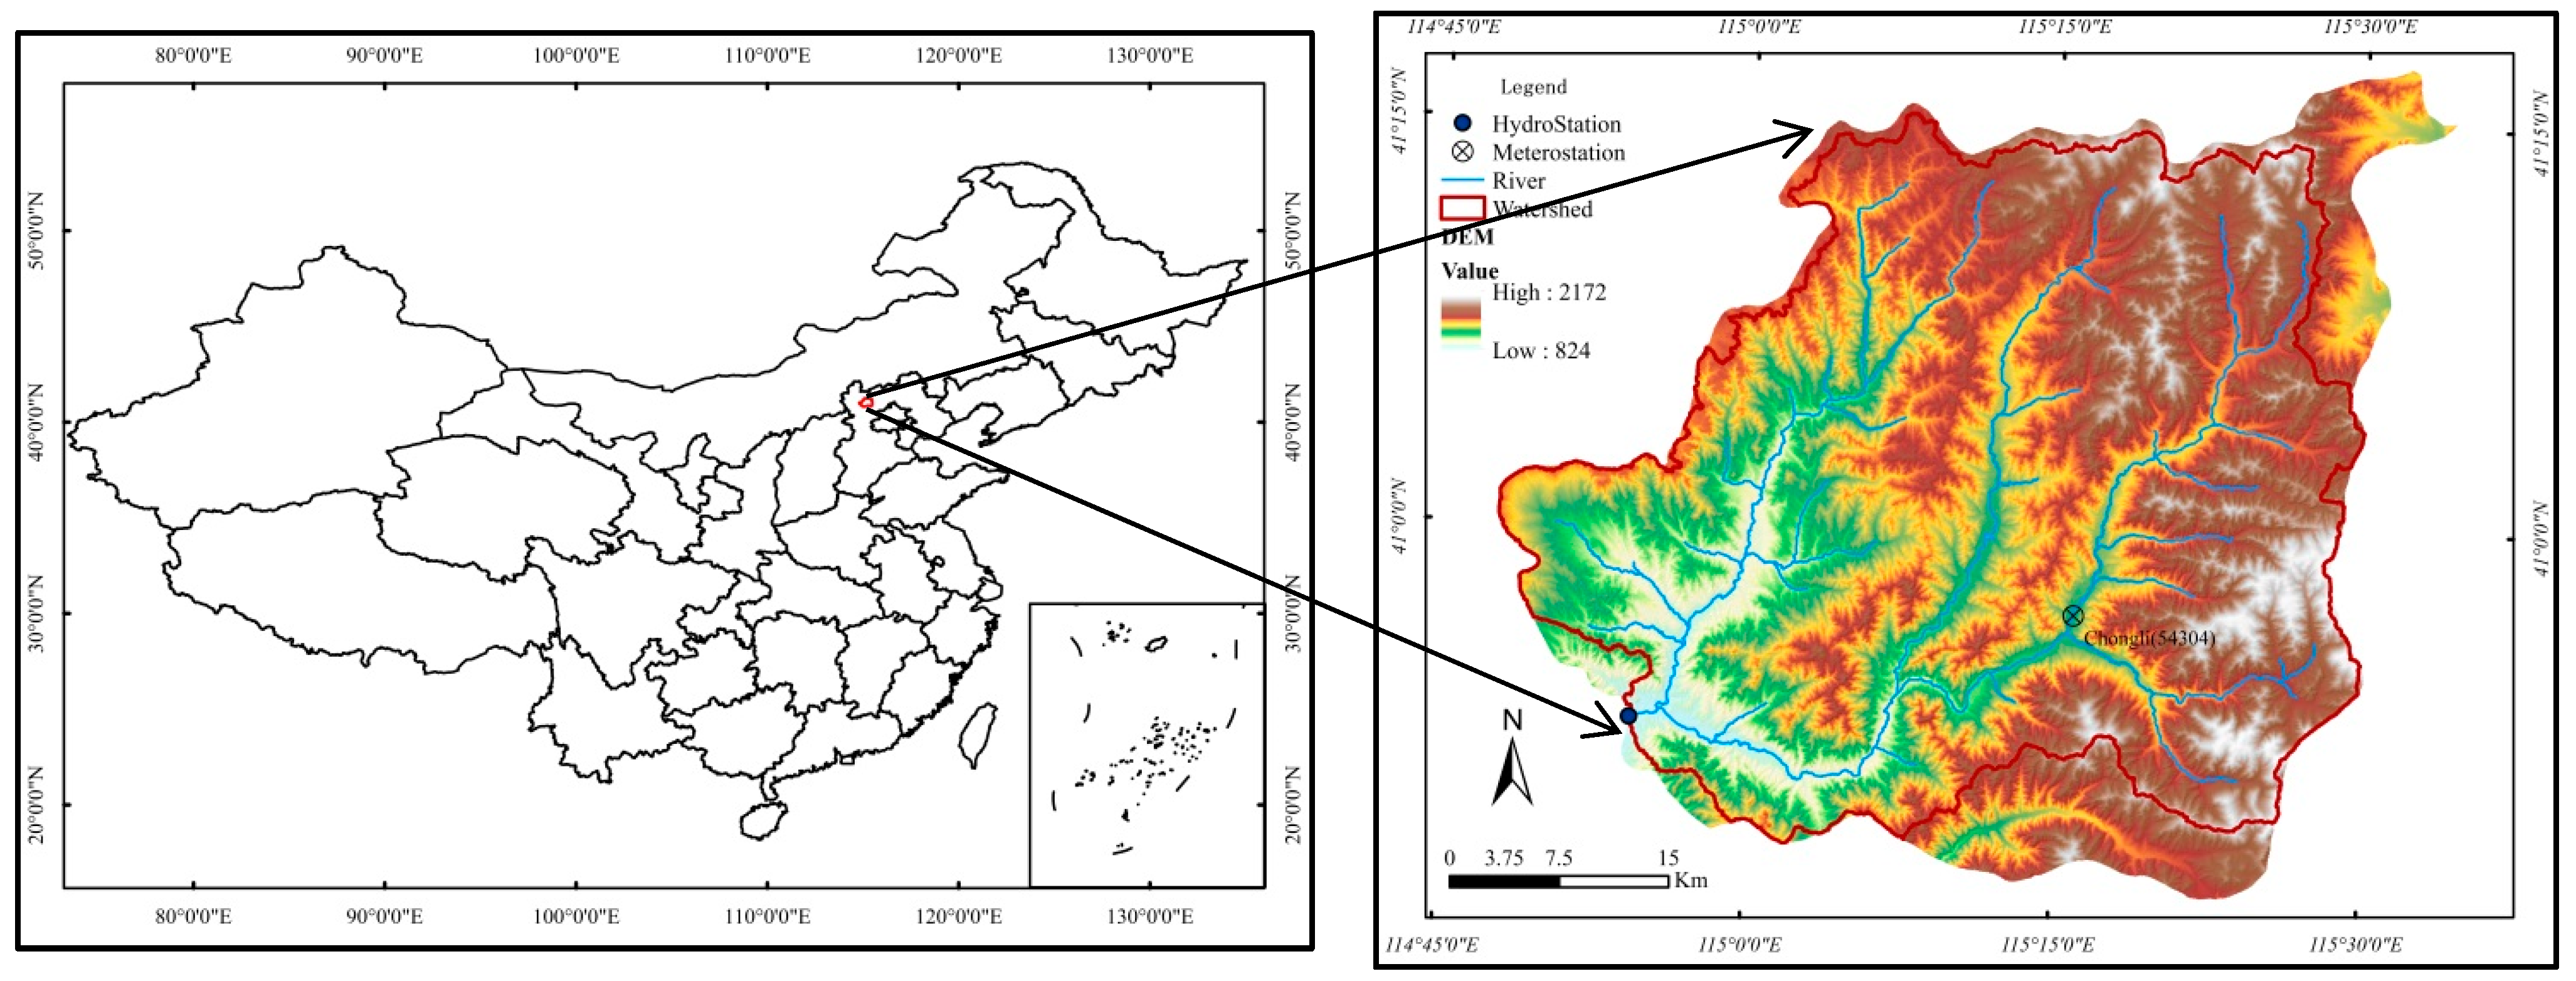
Chongli County, with a total area of 2334 km2 and a population of 0.126 million, is located in the northwest of Hebei Province as a transition zone between the Inner Mongolia plateau and the North China Plain. Generally, the precipitation annual average is 466.05 mm and it varies seasonally, specifically in the flood season, which is concentrated from June to September. The rainfall in this period amounts to approximately 91%. The upper reaches of Qingshui hydrological station, covering 2100 km2, were chosen to perform the study. The climate station (Chongli station) is located in the eastern sub-basin (Donggou) (Figure 1). The main land uses were cultivated land, forest and grassland.
2.2. Materials
Climate data at Chongli meteorological stations from 1980 to 2016 were provided by the National Climate Center of China. These include daily precipitation, temperature, solar radiation and relative humidity data. Monthly flow data from the Qingshui station (1980–1989, 2001, 2003, 2007–2016) were gathered from the Hydrological Yearbook of China, but data were missing in some years (1990–2000, 2002, 2004–2006). The digital elevation model (DEM) was provided by the Geospatial Data Cloud site, Computer Network Information Center, Chinese Academy of Sciences (http://www.gscloud.cn (accessed on 5 November 2021)), with a resolution ratio of 30 m. The land use data with 30 m resolution from 1990 to 2015 were provided by Data Center for Resources and Environmental Sciences, Chinese Academy of Science (RESDC). The soil data (1:1,000,000) was provided by National Tibetan Plateau Data Center (http://data.tpdc.ac.cn (accessed on 6 November 2021)), obtained from the Harmonized World Soil Database version 1.1 (HWSD). The data regarding water supply and demand were available from the water resources bureau in Chongli County.
2.3. Methods
2.3.1. The Mann–Kendall Test Method
This analysis involved the application of the nonparametric Mann–Kendall test, which detects trends in temporal sequences. The test is widely used to determine temporal trends of hydrological and meteorological data [29,30]. Statistic Z of the Mann–Kendall rank trend test is based on Equations (1) and (2).
If the sample size n is large enough (n > 10), the standard normal variable Z can be used to evaluate the trend of the time series:
where , are the sequential data values, is the length of the data set and Σ denotes the summation over all ties. is the expected value and variance of .
This time series has increasing trends if the value of Z is greater than zero; otherwise, the time series has decreasing trends. If |Z| ≥ Z_(1 − (α/2)), the null hypothesis of no trend is rejected at the significance level α. The null hypothesis can be tested at the 5% significance level. The value of Z_(1 − (α/2)) at the 5% significance level is 1.96 [31].
2.3.2. The Double Mass Curve Method
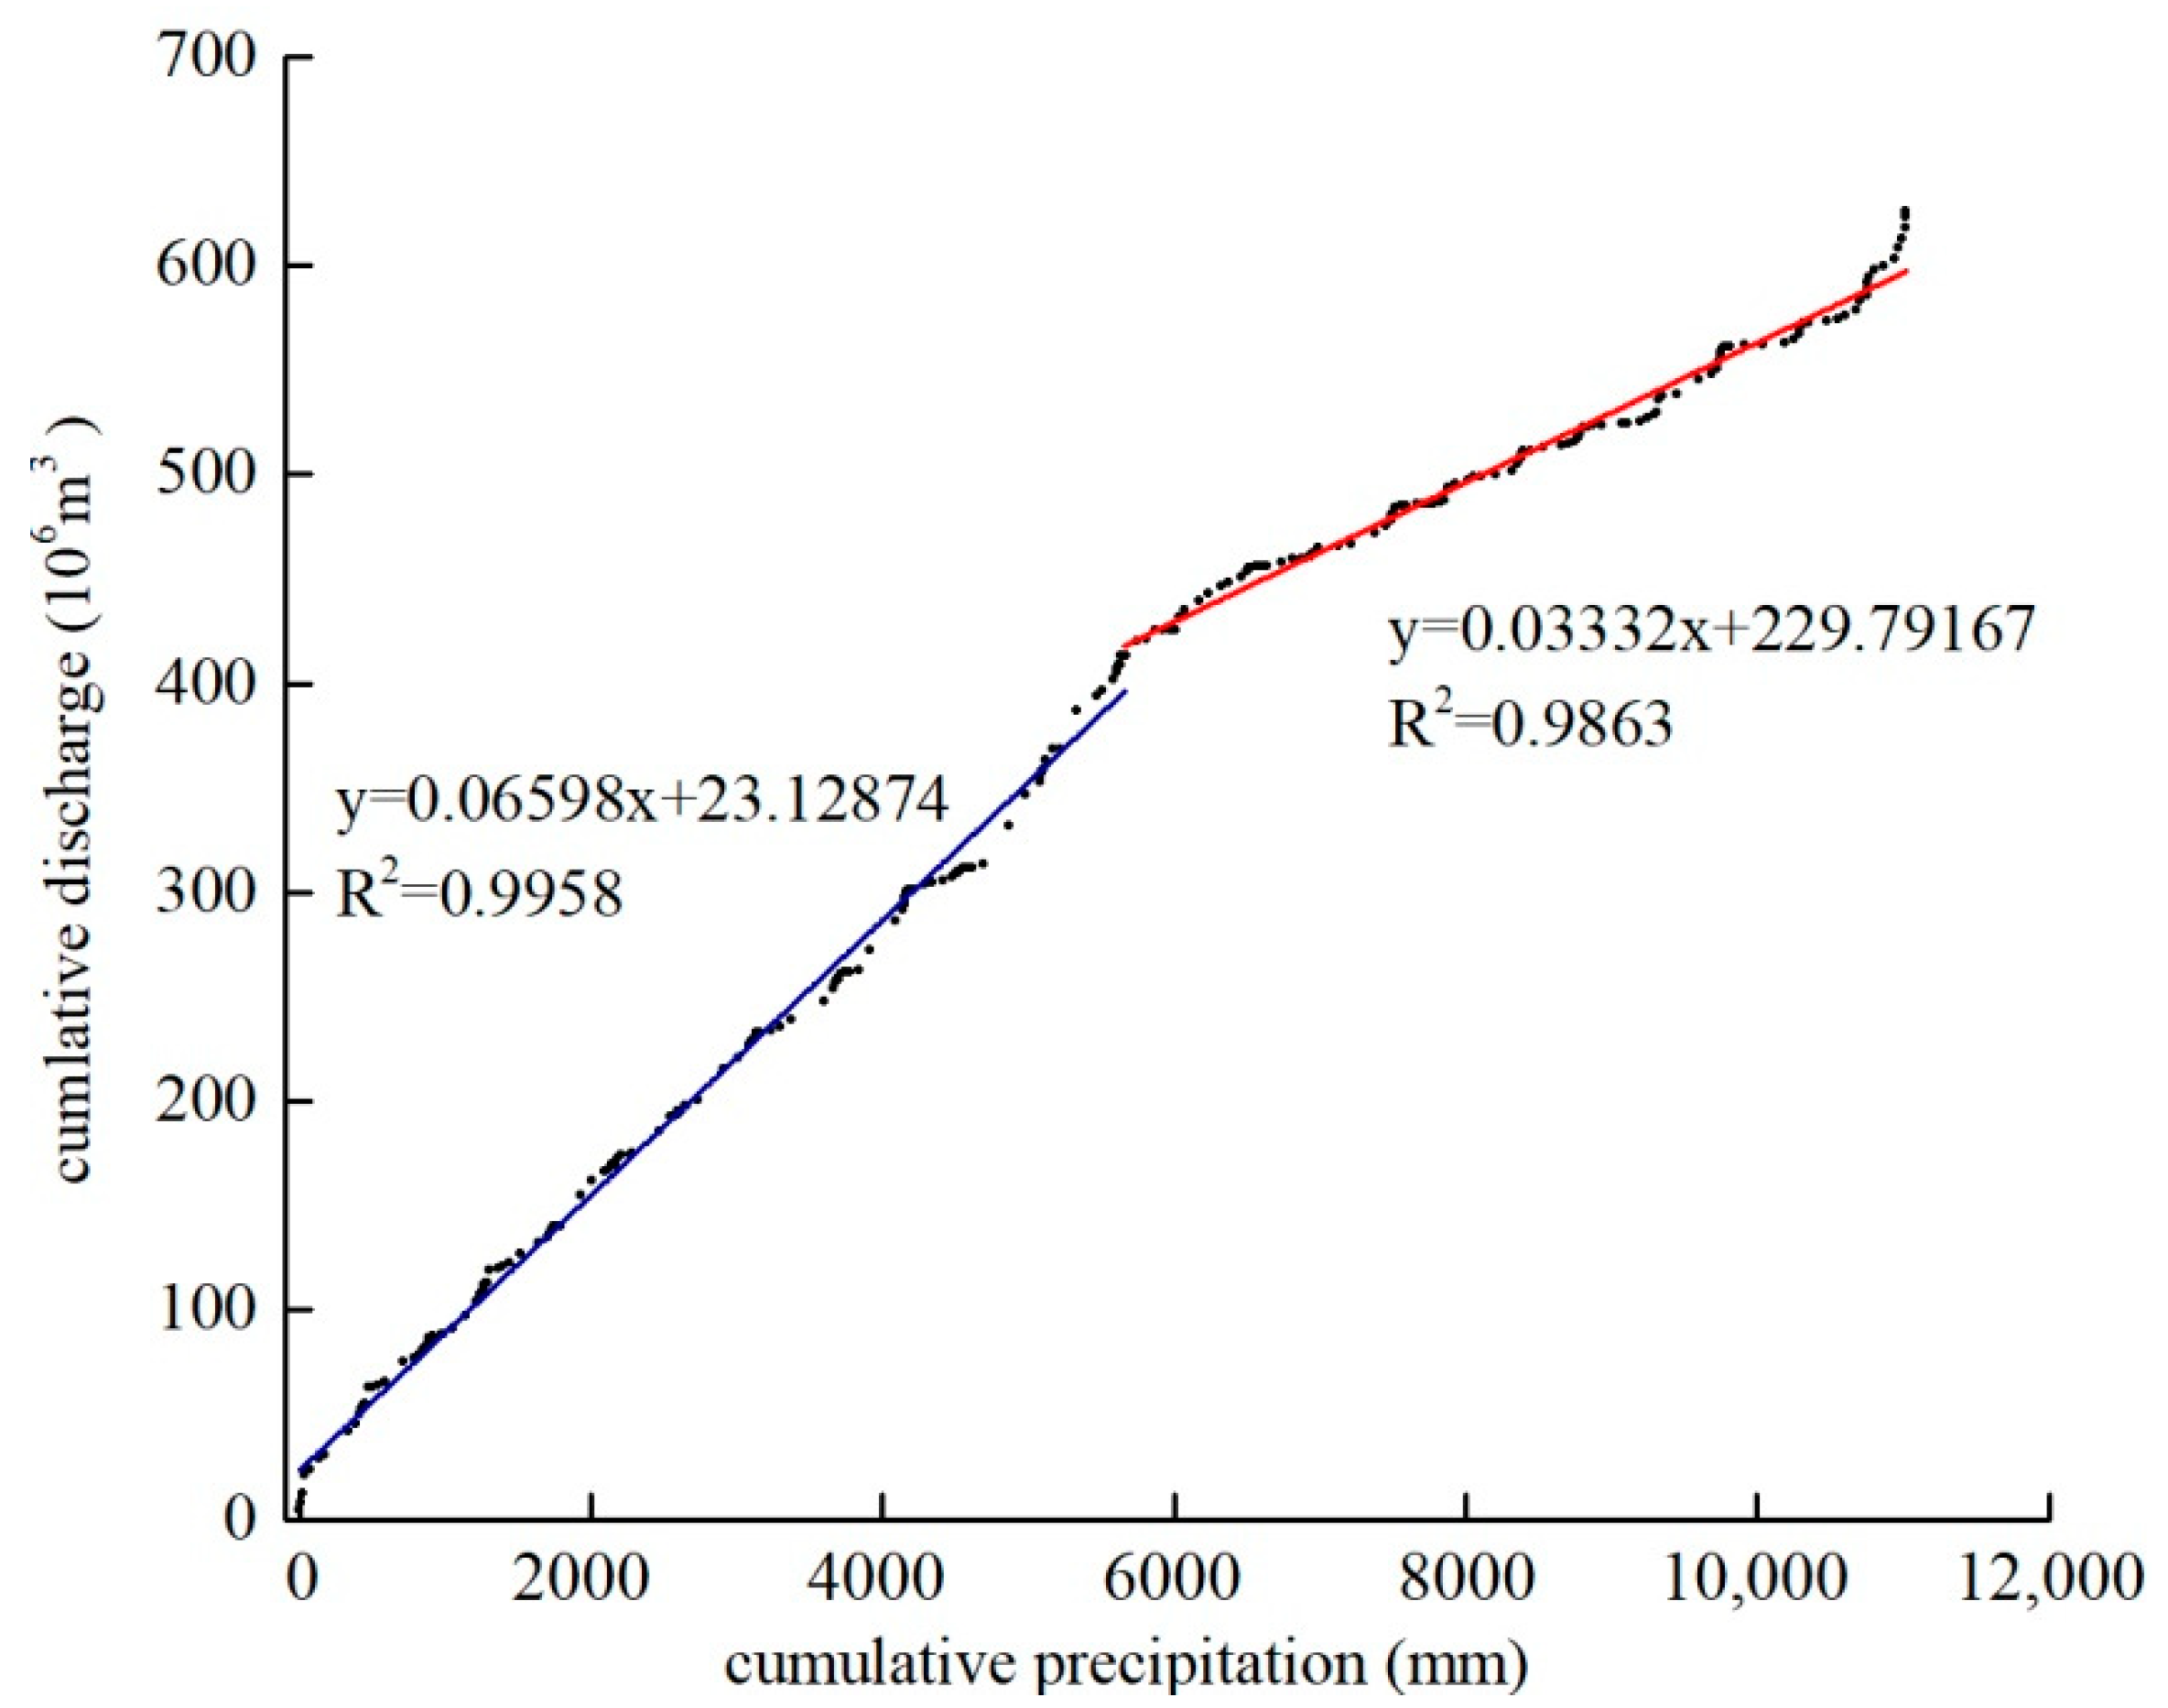
The double mass curve method was used for investigating the homogeneity of the data. For this purpose, cumulative values of annual precipitation were plotted against cumulative values of annual discharge. The double mass curve is a simple, visual and practical method, widely applied to study the consistency of hydro-climatic data [32]. This method is based on the direct relationship between precipitation and discharge, in which a straight line is plotted on the cumulative values of these two parameters.
The lack of deviation from the line shows that human activities have not made noticeable contributions to the changes of stream flow and it is only influenced by precipitation [33]. A significant deviation from the straight line plotted on cumulative values of precipitation and discharge indicates that human activities, such as land use change, irrigation or the mining industry, could change the runoff.
2.3.3. Soil and Water Assessment Tool (SWAT) Model
SWAT is a semi-distributed river basin scale model developed by the United States Development of Agriculture (USDA) to assess the impact of management on water supplies and nonpoint source pollution [34]. The hydrologic cycle of the SWAT model is based on the water balance equation related to land and water routing sections of the hydrological cycle [28,35]:
where is the final soil water content (mm), is the initial soil water content on day (mm), is the time (days), is the amount of precipitation on day (mm), is the amount of surface runoff on day (mm), is the amount of evapotranspiration on day (mm), is the amount of water entering the vadose zone from the soil profile on day (mm), and is the amount of return flow on day (mm).
The processes simulated by the SWAT include precipitation, runoff, infiltration, evaporation and percolation to shallow and deep aquifers. The input data include spatial data and attribute data, comprised of the Digital Elevation Model, land use, soil parameters for hydrological characteristics, daily climate attributes and monthly runoff. Based on the topography, the whole basin was divided into different sub-basins and then into different hydrologic response units (HRU) with distinct combinations of land use, soil and slope qualities. The runoff was predicted separately for each HRU and routed to obtain the total runoff based on the watershed.
2.3.4. Model Calibration and Validation
Parameter sensitivity analysis determines which inputs contribute the most to output variations, which parameters are most highly correlated with the output [36], and also helps simulation data to best match observation data. In addition, sensitivity analysis, model calibration and validation were performed using the algorithm for Sequential Uncertainty Fitting (SUFI-2) [37,38] and it was implemented in the SWAT-CUP [38]. In addition to automated calibration, SWAT-CUP also ranks the parameters based on their sensitivity to the flow regime [27]. The suitable ranges for Nash–Sutcliffe efficiency coefficient () (Nash and Sutcliffe, 1970) and coefficient of determination () (Equations (6) and (7)) were chosen to measure the matching between the simulated runoff and the observation. changes from to 0 and it is acceptable when the value varies from 0 to 1, especially when it is showing a satisfactory rating up to 0.5 [39]. is a complementary statistical criterion for efficiency statistics [37]. means the correlation between the two variables. The performance of the SWAT model on the monthly scale can be considered satisfactory if > 0.5, > 0.6 [14].
where is the observed value, is the simulated value, is the mean of the observed data, is the mean of the simulated data, is the total number of observations.
2.3.5. Calculating the Impact of Changes
To make a comparison, there were two periods used for the whole time of the study: a benchmark and a study period. The model was simulated and calibrated by the benchmark period. Through keeping one factor stable and changing another, the simulated runoff in the study period can be used to compare with the runoff in the benchmark period [40]. The change scenarios using the SWAT simulation are as follows:
- S1: climate data in the study period and land use in the baseline;
- S2: climate data in the baseline and land use in the study period;
- S3: both climate data and land use in the study period.
The simulated runoff after applying the SWAT model was affected by the climate and land use. The formulas of the impact of the climate change and land use are as follows:
where , represent the relative discharge change due to the climate and land use change under scenario 1 and scenario 2 respectively, means the relative discharge change due to the direct human activity, , and mean the runoff from scenarios 1, 2 and 3, respectively, , mean the runoff in the baseline and the study area, respectively.
The relative contributions of climate change, land use and the direct human activity, respectively, can be calculated as follows:
where and are the impact of climate change, land use change and direct human activity, respectively.
3. Results
3.1. Trend Analysis of Discharge
The M–K test Z–index is −2.01 for annual runoff, which indicates that the annual runoff showed a decreasing trend, occurring from 1980 to 2016. The M–K test Z–index results for annual precipitation and temperature are 0.03 and 2.67 respectively, indicating an increasing trend. The value of cumulative precipitation and discharge during the period of 1980–2016 is shown in Figure 2. This deviation strongly suggests that, in addition to precipitation, human activity has also contributed to runoff changes since 2002. The results show that the data were not homogeneous. It is evident that runoff deviation in the years 2001–2016 was more significant than the deviation in 1980–2001, indicating that human activity resulted in a considerable reduction in runoff during the period after 2001. Looking at the trend lines from the period 1980–2001, it can be stated that at the end of 2016, the deviation of the cumulative curve of runoff reached 17%.
3.2. Model Calibration and Validation
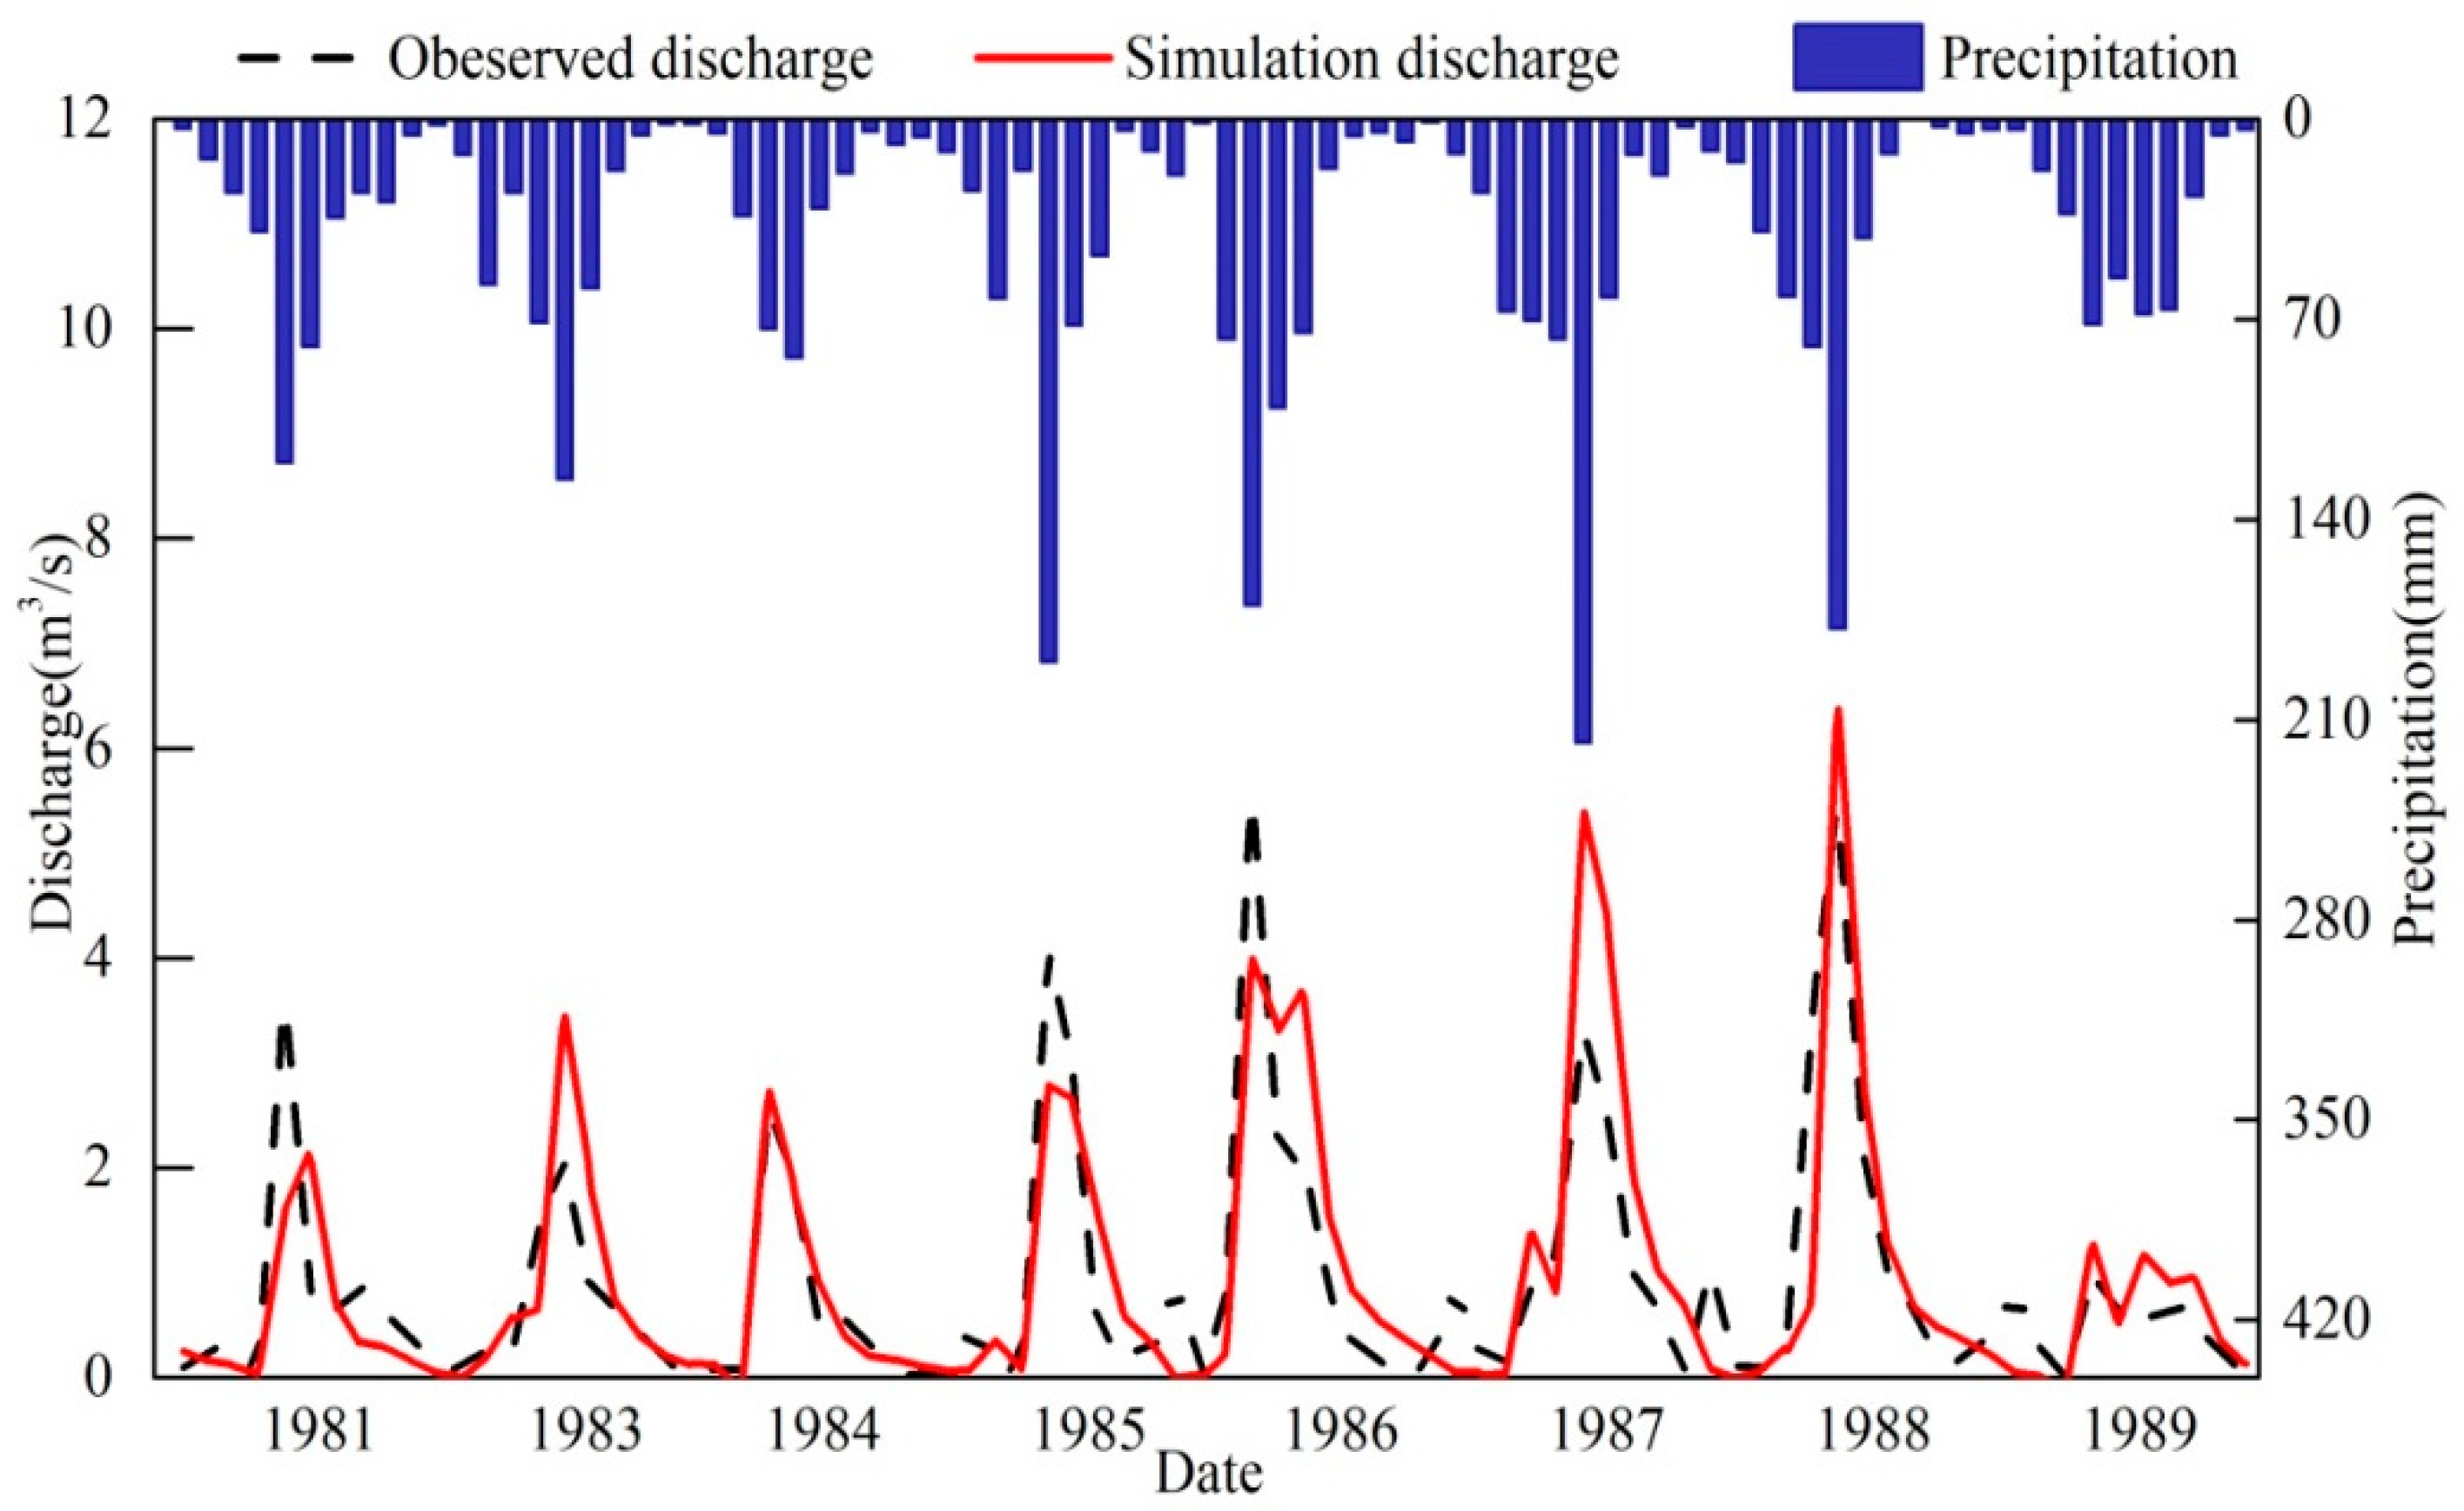
Having considered the results of statistical analysis and the limitation of available data, the baseline was selected from 1980 to 1989 and the study period was from 2008 to 2016. Furthermore, the baseline was divided into three parts: first, a one-year period (1980) was selected to warm up the model, next, calibration was performed during the period of 1981 to 1985 and finally, the period of validation was from 1986 to 1989. The data from 1982 were removed because of a monitoring problem. The time step was monthly.
Figure 3 shows a close match between the simulated and observed discharge data during the period, which indicates the validity of the model. What is more, the trend of the rainfall is consistent with the runoff in the simulation. The NSE and R2 during the calibration period were 0.65 and 0.67, respectively. Moreover, the two indicators were separately 0.59 and 0.72 during the validation period. In general, the monthly simulation for the Qingshui station works well for the two periods, which means that the SWAT model can be used in this study area.
In the sensitivity analysis, eight parameters were found to be the most sensitive to the stream runoff changes (Table 1). GWQMN is the most sensitive parameter, and it means that the groundwater flow to the reach is allowed only if the depth of water in the shallow aquifer is equal to or greater than GWQMN, pointing to the importance of the relationship between the shallow aquifer and the main channel. What is more, the second and third parameters are SOIL_BD and SOIL_AWC, which are related to the amount of water stored in the soil layer, affecting the process of water transpiration and altering the amount of the precipitation flowing to the runoff.
3.3. Contribution of Different Factors to Runoff Change
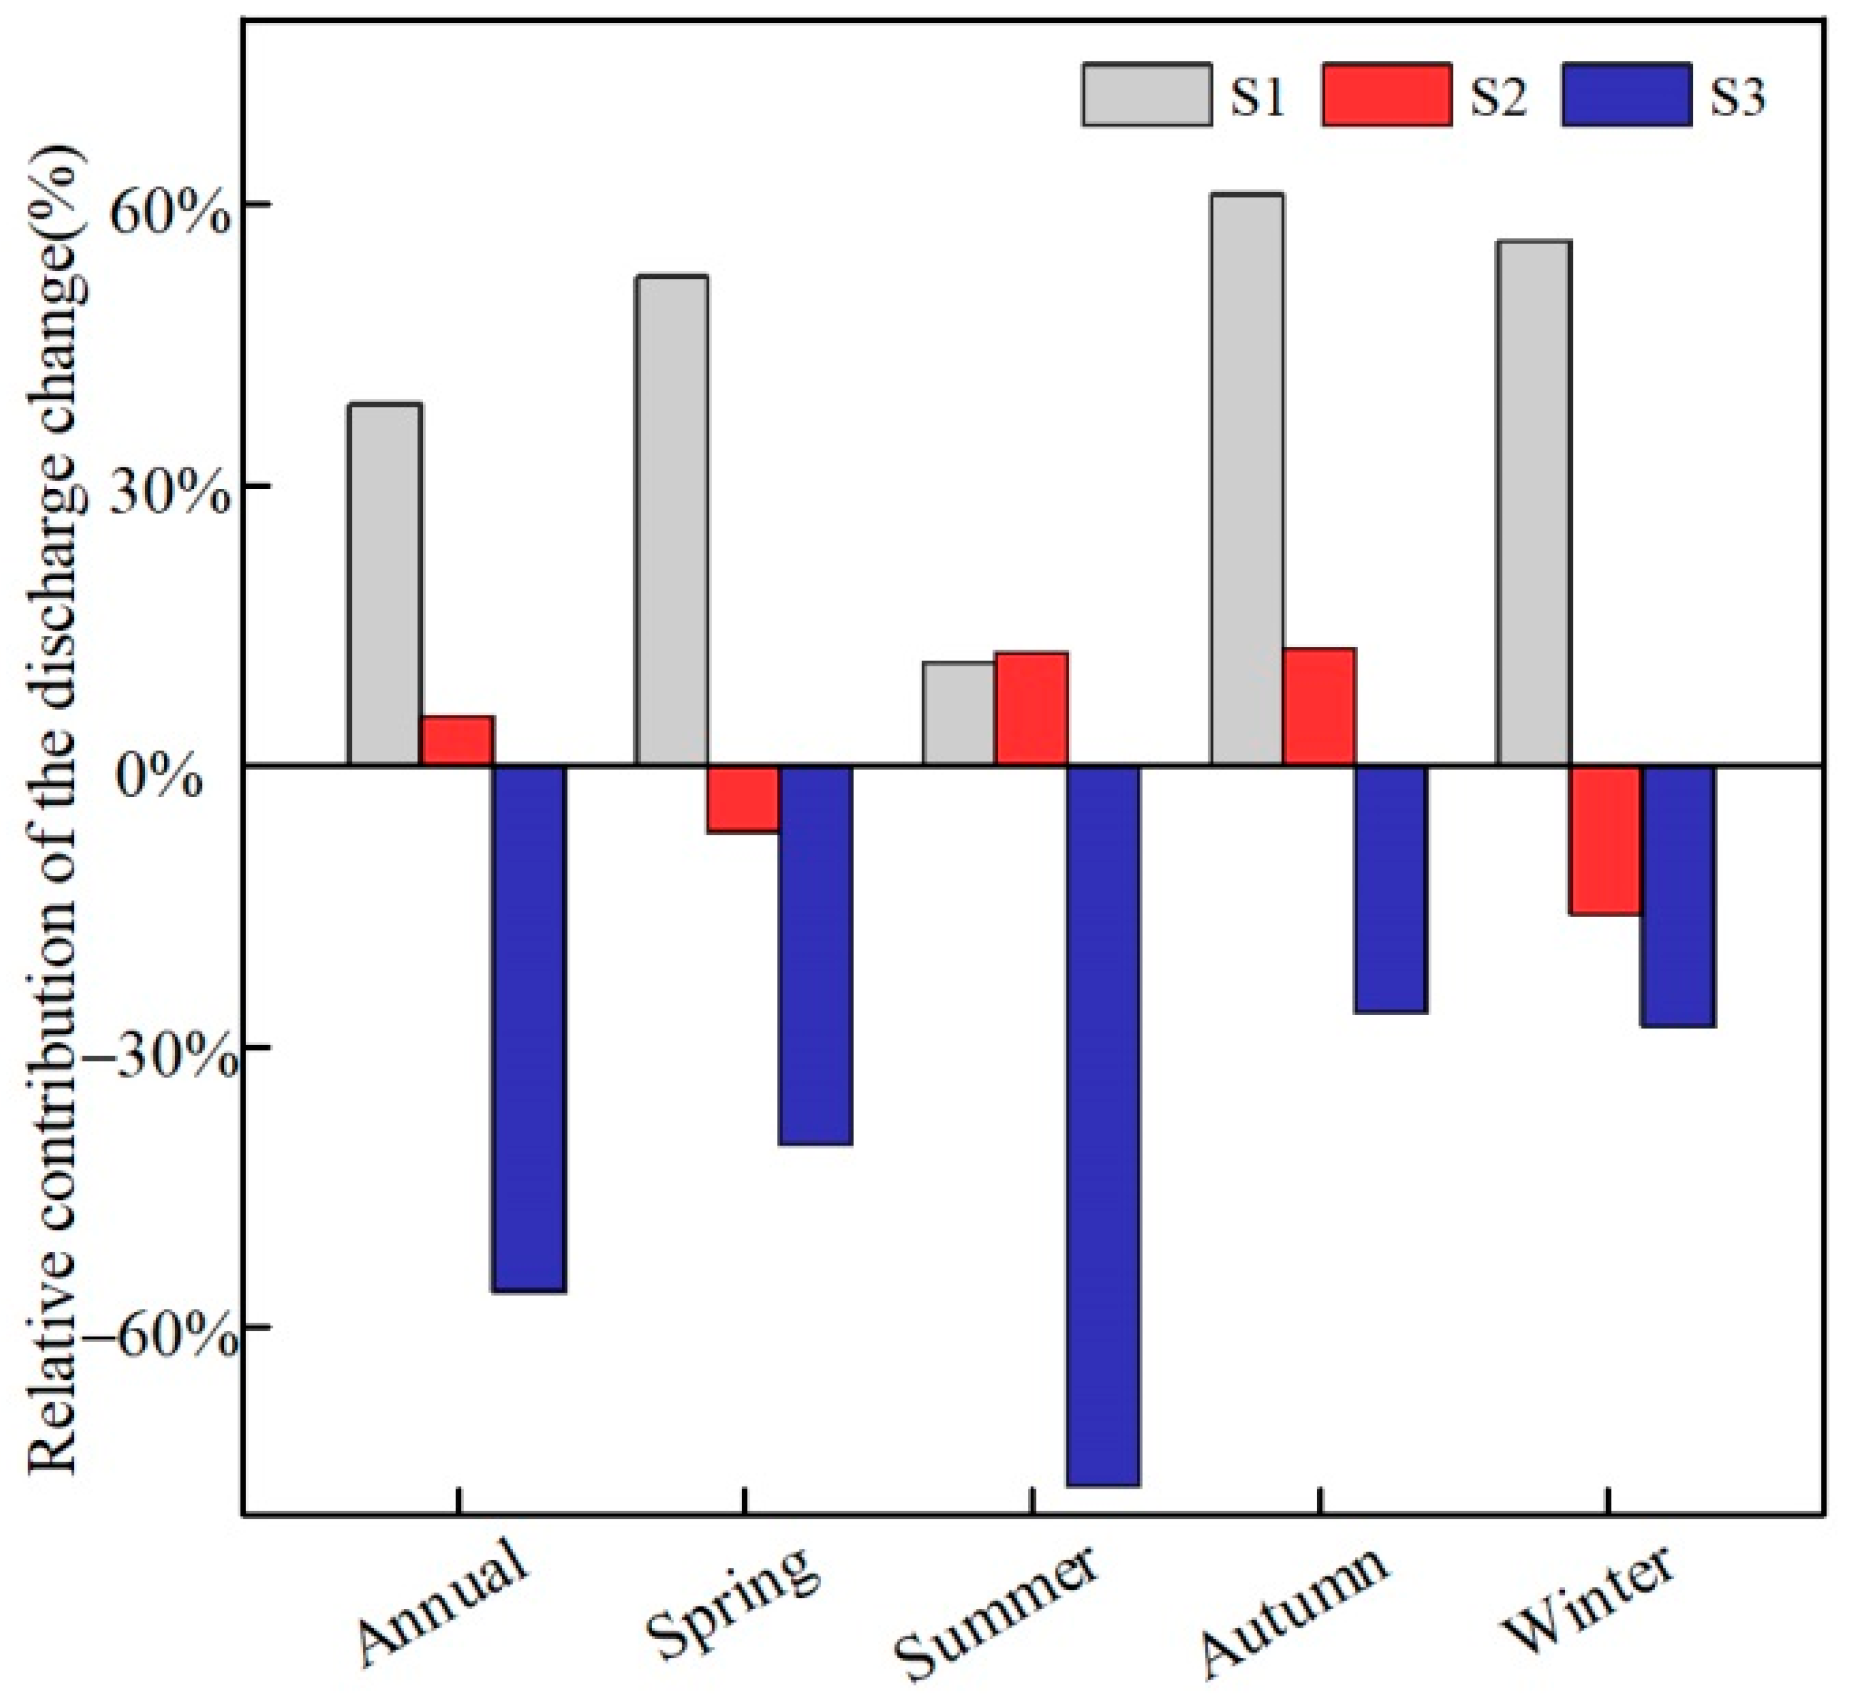
Through model simulation, discharges in different scenarios at the annual and seasonal scale were noted and are shown in Table 2, and the contributions of three factors during the study period are shown in Figure 4. Compared with the runoff in the base period, it may be noted that climate and land use changes increase the discharge, while human activity has the opposite impact at the annual scale. Human activity is the main factor decreasing the discharge, accounting for 56.24%. Climate contributes to discharge increasing, accounting for 38.59%, and land use makes a slight impact, accounting for just 5.17%. Calculating the contribution at the seasonal scale shows that climate makes the main positive contribution to the increasing runoff in spring, autumn and winter, at 52.26%, 61.02% and 55.92%, respectively. Human activity is the dominant factor for the decreasing runoff in summer with a contribution of 77.13%. The contributions of land use are −7.12%, 11.97%, 12.44% and −16.05%, respectively, in different seasons.
4. Discussion
4.1. Limitations and Uncertainties
The results have a low representativeness as they are based on rainfall and flow data from only one measuring station in such a large catchment area as the Qingshui River catchment. However, this catchment was chosen to assess the hydrological conditions of the water balance in the location of the Olympic Games arena, hence, it is necessary to recognize the size of the runoff and the impact of human activity on its size. The Winter Olympic Games will be held in the east part of the basin, which may make use of water from the whole Qingshui river in the Chongli District. Besides this, the Chongli District will improve its social utilities and economic development by making use of the Winter Olympic Games in the future.
The analyzed catchment area, despite its considerable size, is not properly represented by meteorological stations. However, this is not an isolated situation with the problem of insufficient spatial coverage of the hydro meteorological monitoring network. This is a typical situation in many areas (especially mountain areas). Based on the observation sequence from the one meteorological station present in this area, this article tries to ensure the proper quality of the presented data, using for this purpose an M–K analysis to examine the homogeneity of the observations.
It can also be assumed that the performed calibration and verification of the results of hydrological modeling allow, to some extent, the influence of the uncertainty of the input data on the results to be limited.
4.2. Assessment of the Impacts of the Three Factors
The hydrological components under different scenarios were simulated by the SWAT model (Table 3). Under the climate scenario and combined with the M–K analysis, the precipitation and temperature both show an increasing trend (Figure 5). What is more, according to Table 3, the precipitation and evaporation increased by 2.87% and 3.32%, respectively, while the ration about E/P decreased from 87% to 83%. The surface and lateral runoffs both show an increasing trend of 2.51 mm and 2.12 mm, respectively.
The land use from 1990 to 2015 changed slightly (Table 4). Under the land use change scenario, precipitation and ET are nearly the same as the data in the baseline period. In addition, the hydrological components were nearly the same as those during the base period.
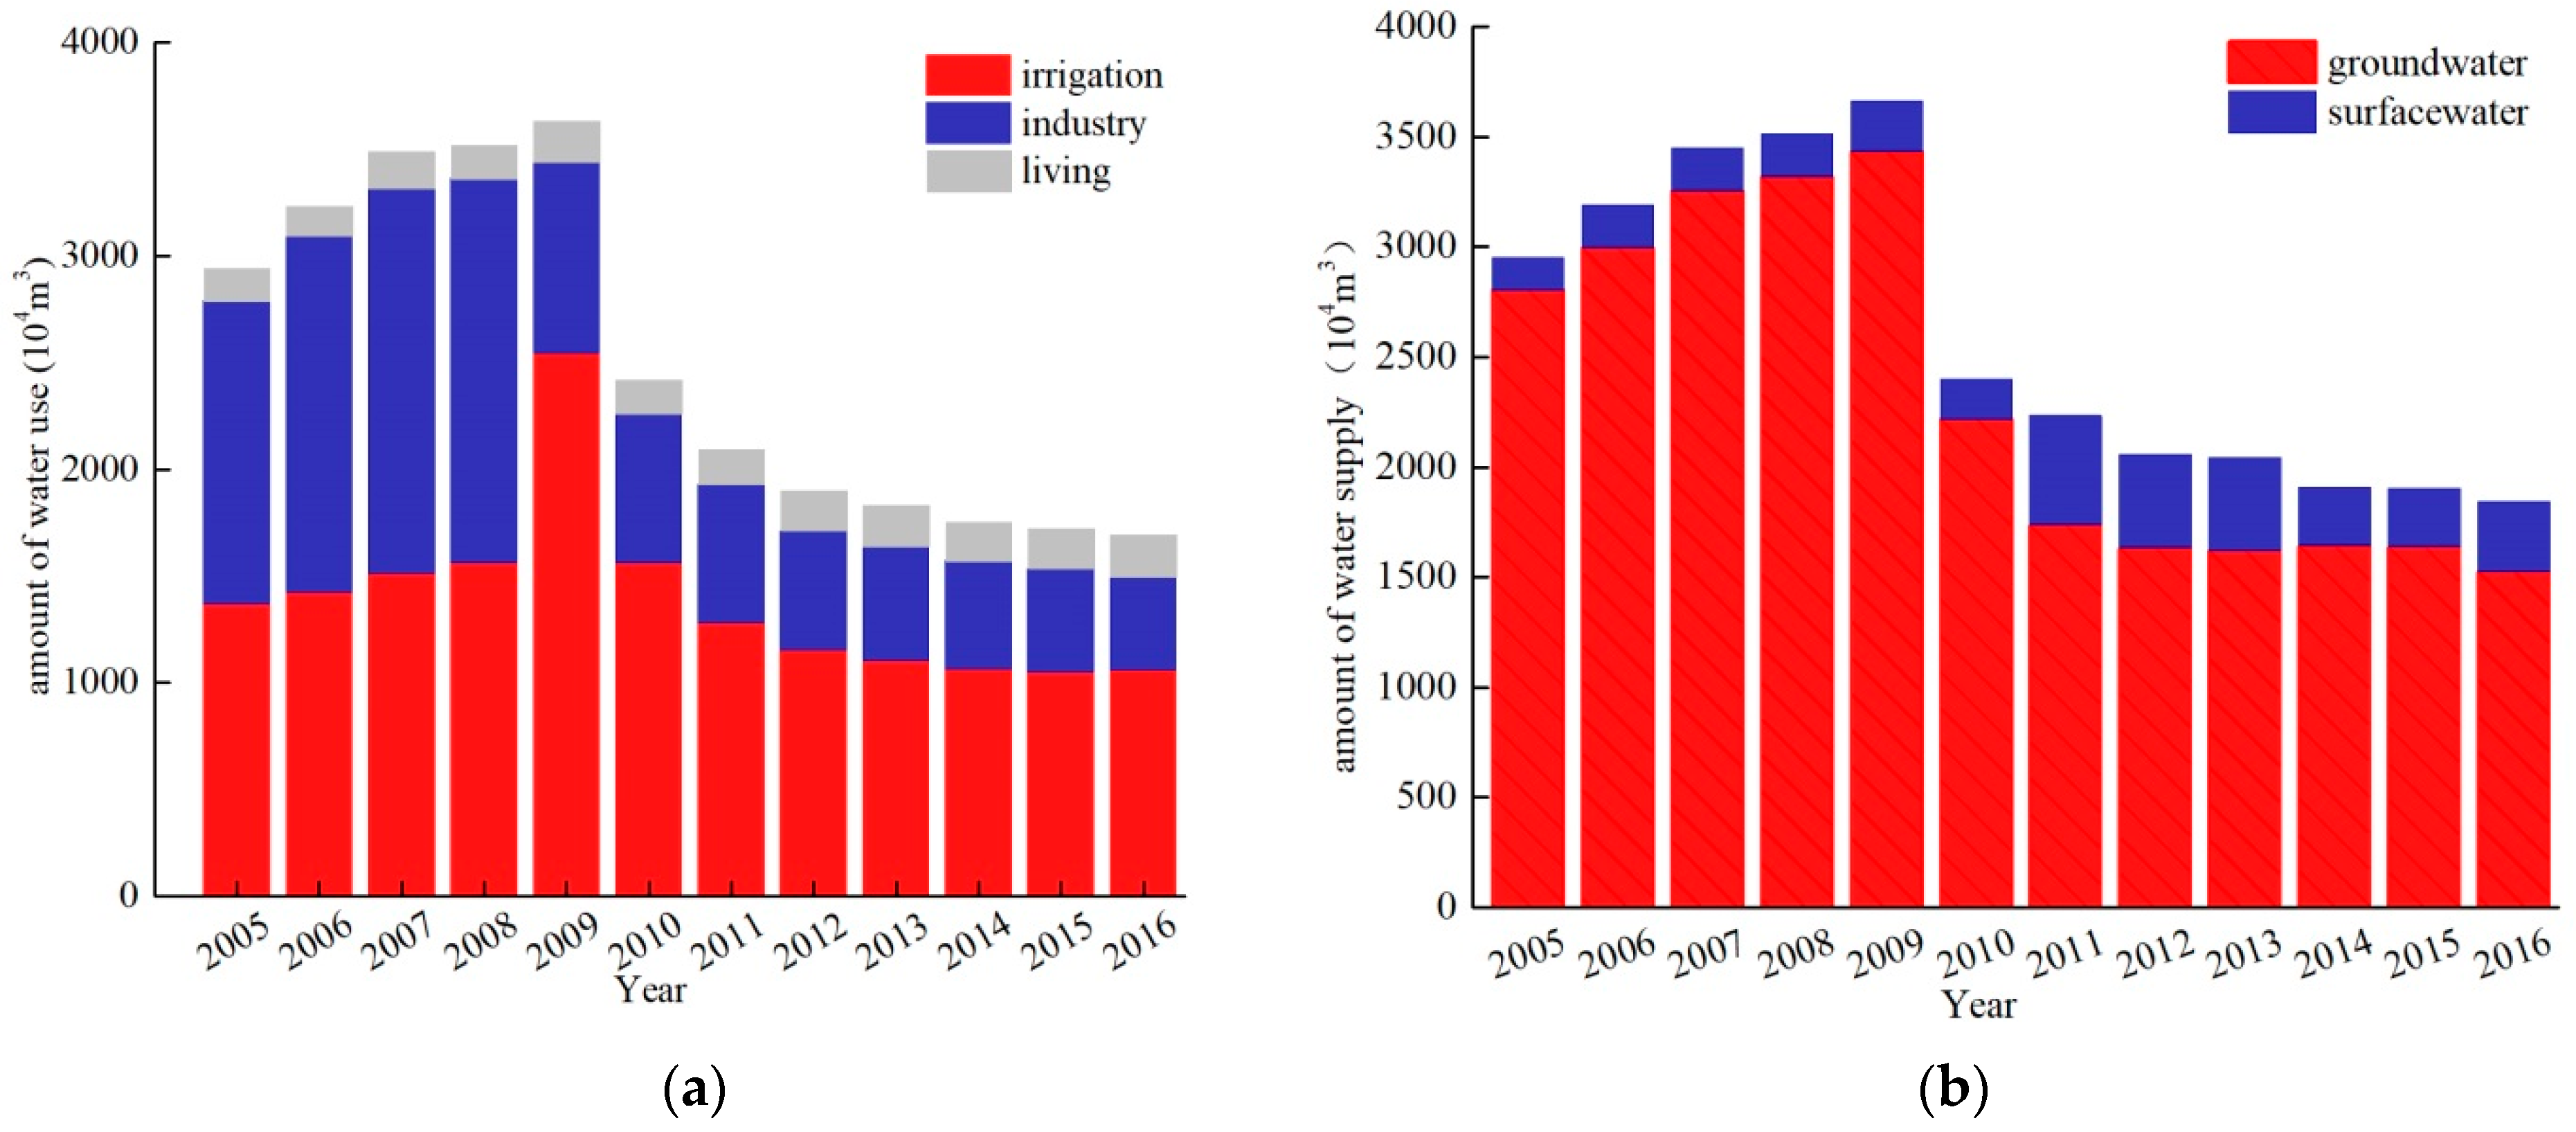
Human activity was the main factor for the discharge change. Owing to intensive human activity, natural single water circulation was disrupted and transformed into a dual combination of natural and social water circulation, which clearly increased water consumption. As shown in Figure 6, from 2005 to 2016, the main use of water was for the purpose of irrigation. The structure of water supply is single, with nearly 80% of the water supply coming from ground water. It is mostly used for agricultural irrigation and in the mining industry, which are the main vehicles for economic development.
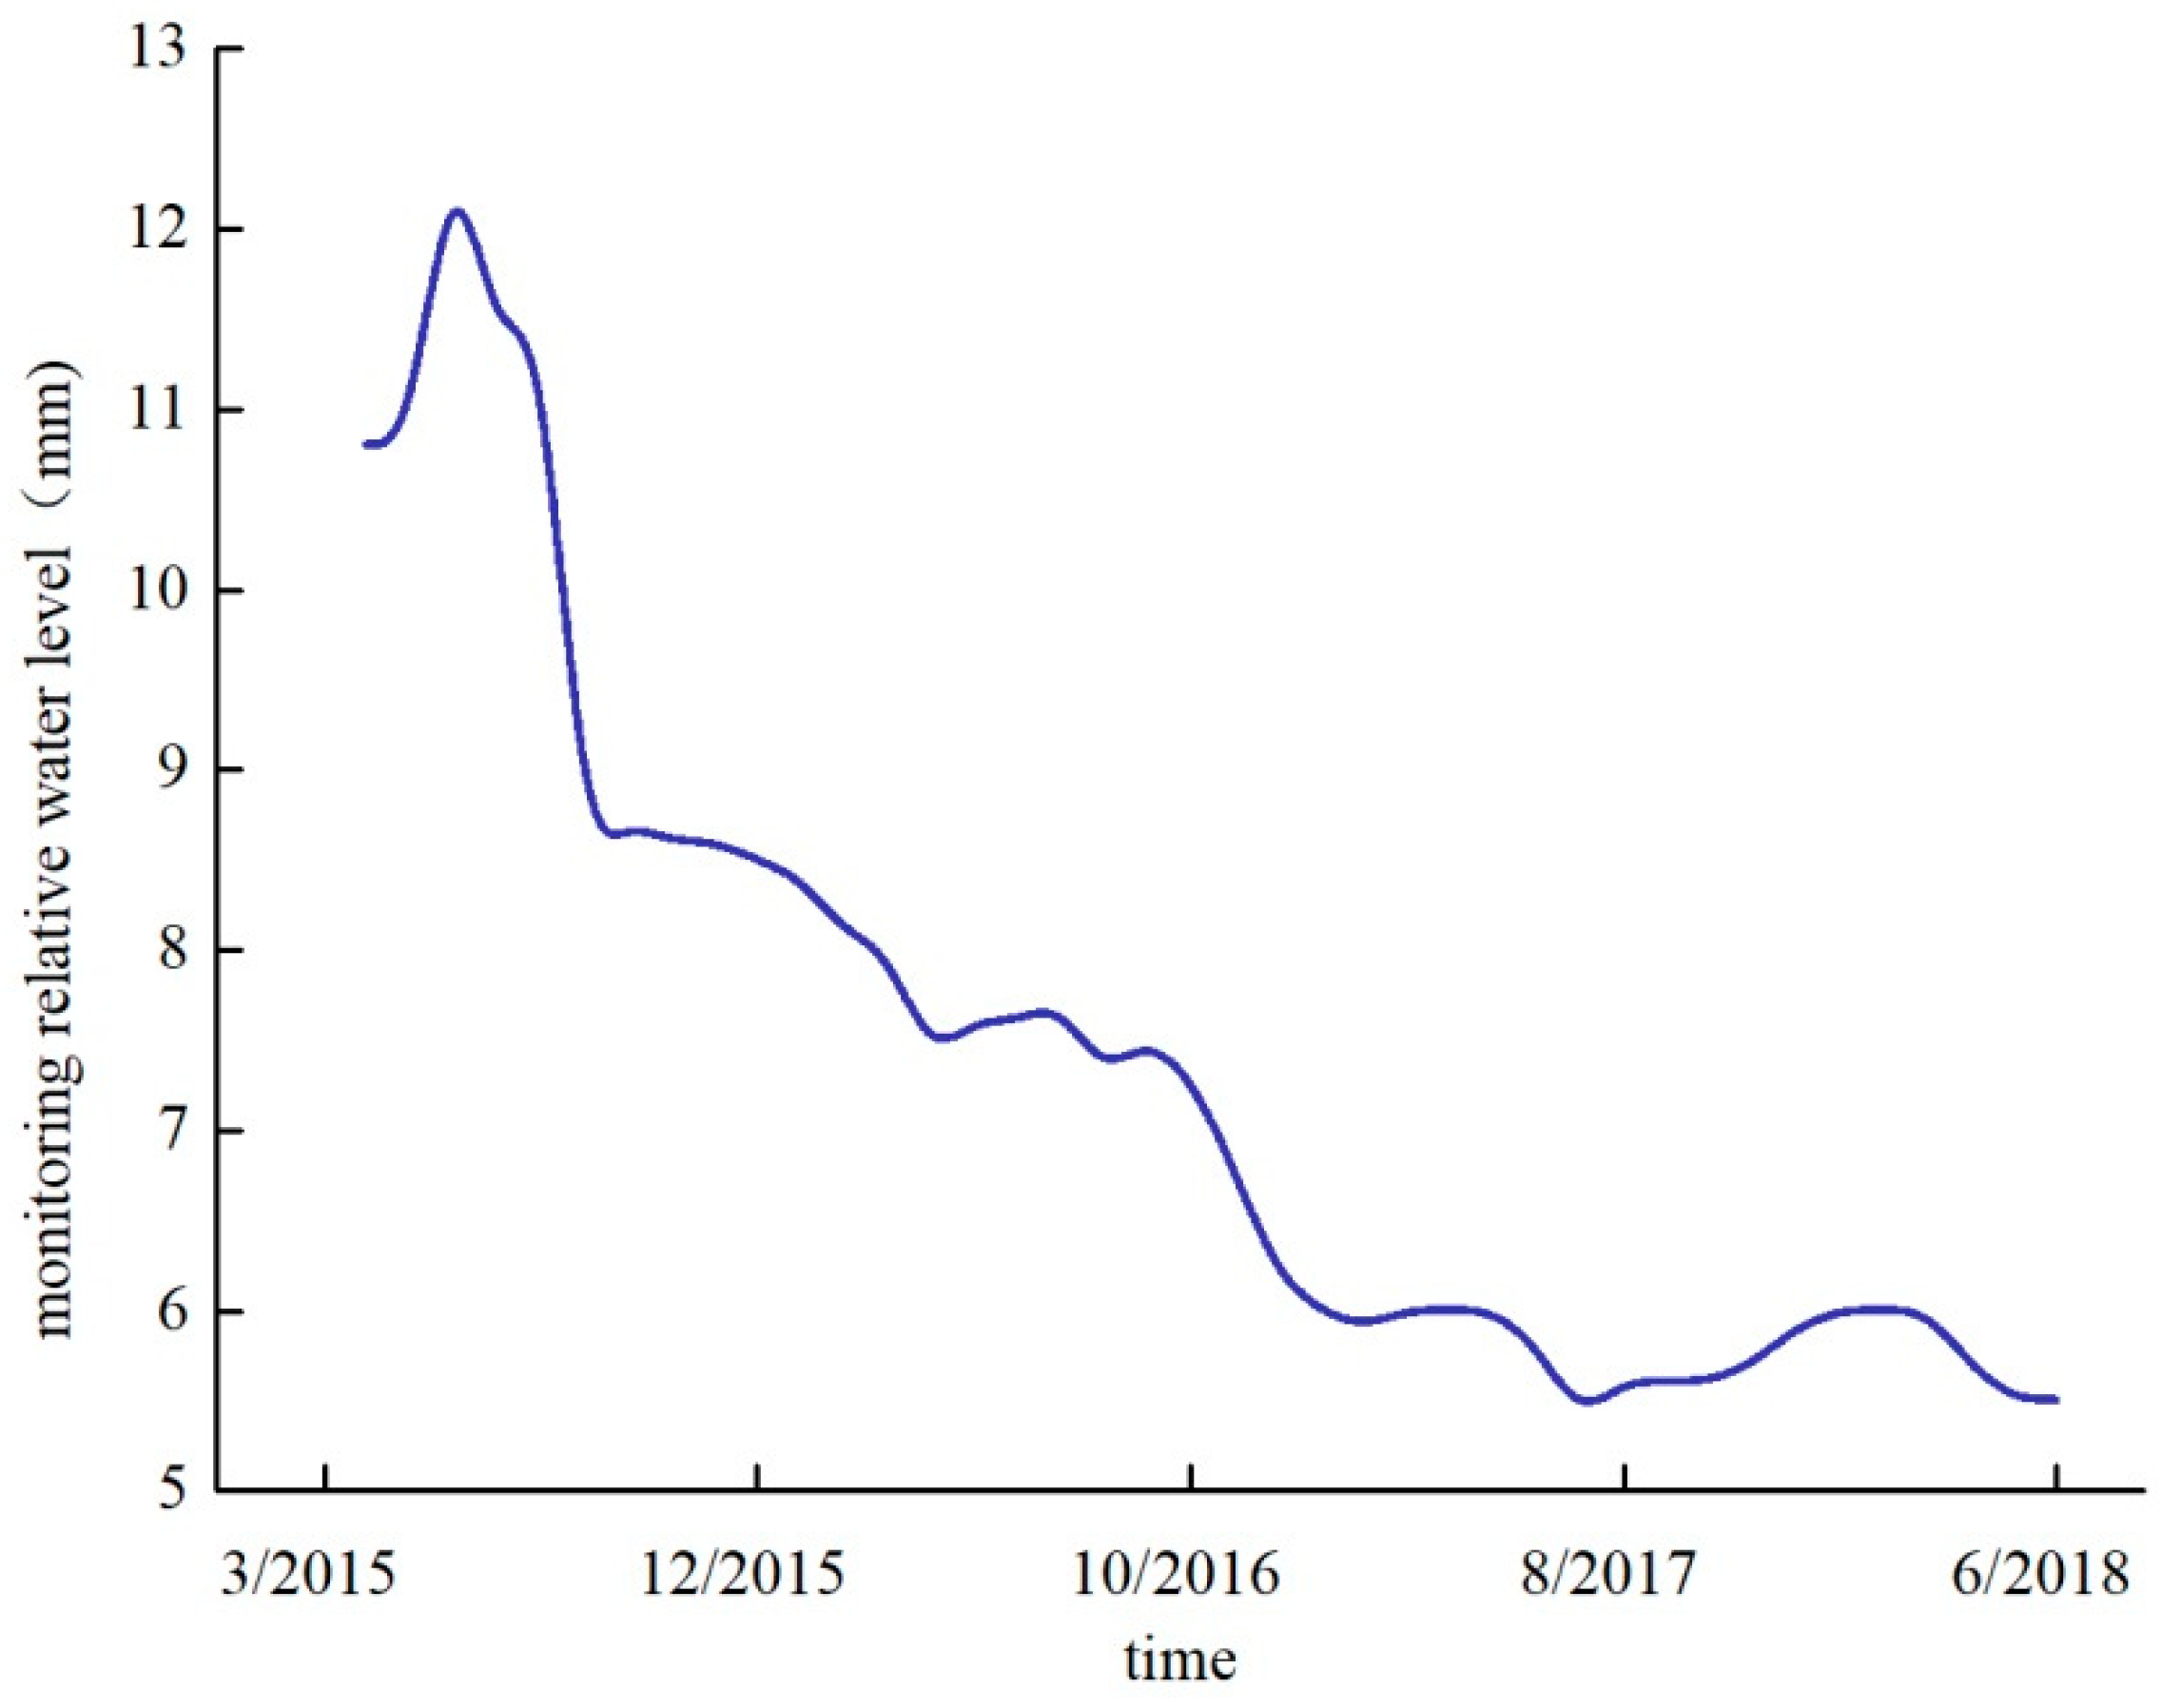
Because of the increasing water demand and the low-efficiency irrigation method (furrow irrigation), there is an overexploitation of the groundwater, which decreased the ground water level in agricultural and mining areas. As shown in Figure 7, according to the available monitoring groundwater data from March 2015 to June 2018, the groundwater level in the vegetable planting area showed a tendency to decline. Thus, further research regarding water resource allocation should be carried out to increase water use efficiency and decrease the strain on water resources.
5. Conclusions
The purpose of this paper is to quantify the contribution of climate, land use and direct human activities on discharge variations on annual and seasonal scales, as simulated by the SWAT model. It may be helpful in identifying the driving factor for runoff change and optimizing water allocation and management throughout different seasons. The main conclusions are as follows:
In the study period, the surface runoff showed a decreasing tendency. Direct human activity was the dominant factor for the discharge decrease, while climate and land use change made a positive contribution to the discharge increase. On the annual scale, the contributions of climate, land use and human activity were 38.59%, 5.17% and −56.24%, respectively. On the seasonal scale, human activity was the main factor for the reduction in the discharge in summer, accounting for −77.13%. The climate had an important influence on the discharge increase, except for during the summer. The contribution of land use was slight.
Human activity, such as the construction of irrigation, impacted the discharge decrease. The climate showed a positive contribution to the discharge variation due to increasing precipitation and temperature during the study period. The reason that land use had a slight impact on the discharge increase was due to a minor land cover change.
Author Contributions
Conceptualization, J.X.; Formal analysis, M.Z. and R.S.; Funding acquisition, J.X., R.S.; Investigation, M.Z. and J.X.; Methodology, M.Z. and R.S.; Project administration, J.X.; Resources, J.X.; Software, M.Z.; Supervision, J.X.; Validation, M.Z.; Visualization, M.Z.; Writing—original draft, M.Z. and R.S.; Writing—review and editing, M.Z. and R.S. All authors have read and agreed to the published version of the manuscript.
Funding
This study was funded by National Major Science and Technology Program for Water Pollution Control and Treatment (No. 2017ZX07101002).
Institutional Review Board Statement
Not applicable.
Informed Consent Statement
Not applicable.
Data Availability Statement
The data that support the findings of this study are available on request from the corresponding author.
Conflicts of Interest
The authors declare no conflict of interest.
References
- Liu, D.; Chen, X.; Lian, Y.; Lou, Z. Impacts of climate change and human activities on surface runoff in the Dongjiang River basin of China. Hydrol. Process. Int. J. 2010, 24, 1487–1495. [Google Scholar] [CrossRef]
- Milliman, J.D.; Farnsworth, K.L.; Jones, P.D.; Xu, K.H.; Smith, L.C. Climatic and anthropogenic factors affecting river discharge to the global ocean, 1951–2000. Glob. Planet. Chang. 2008, 62, 187–194. [Google Scholar] [CrossRef]
- Yuan, Y.; Zhang, C.; Zeng, G.; Liang, J.; Guo, S.; Huang, L.; Wu, H.; Hua, S. Quantitative assessment of the contribution of climate variability and human activity to streamflow alteration in Dongting Lake, China. Hydrol. Process. 2016, 30, 1929–1939. [Google Scholar] [CrossRef]
- Hou, J.; Ye, A.; You, J.; Ma, F.; Duan, Q. An estimate of human and natural contributions to changes in water resources in the upper reaches of the Minjiang River. Sci. Total Environ. 2018, 635, 901–912. [Google Scholar] [CrossRef]
- Šípek, V. The influence of large-scale climatic patterns on precipitation, temperature, and discharge in Czech river basins. J. Hydrol. Hydromech. 2013, 61, 278–285. [Google Scholar] [CrossRef] [Green Version]
- Bernsteinová, J.; Bässler, C.; Zimmermann, L.; Langhammer, J.; Beudert, B. Changes in runoff in two neighbouring catchments in the Bohemian Forest related to climate and land cover changes. J. Hydrol. Hydromech. 2015, 63, 342. [Google Scholar] [CrossRef] [Green Version]
- Horvát, O.; Hlavčová, K.; Kohnová, S.; Danko, M. Application of the Frier Distributed Model for Estimating the Impact of Land use Changes on the Water Balance in Selected Basins in Slovakia. J. Hydrol. Hydromech. 2009, 57, 213. [Google Scholar] [CrossRef]
- Vano, J.A.; Nijssen, B.; Lettenmaier, D.P. Seasonal hydrologic responses to climate change in the P acific N orthwest. Water Resour. Res. 2015, 51, 1959–1976. [Google Scholar] [CrossRef]
- Holm, T.M.; Koinig, K.A.; Andersen, T.; Donali, E.; Hormes, A.; Klaveness, D.; Psenner, R. Rapid physicochemical changes in the high Arctic Lake Kongressvatn caused by recent climate change. Aquat. Sci. 2012, 74, 385–395. [Google Scholar] [CrossRef]
- Hanel, M.; Vizina, A.; Máca, P.; Pavlásek, J. A Multi-Model Assessment of Climate Change Impact on Hydrological Regime in the Czech Republic. J. Hydrol. Hydromech. 2012, 60, 152. [Google Scholar] [CrossRef] [Green Version]
- Bu, J.; Lu, C.; Niu, J.; Gao, Y. Attribution of Runoff Reduction in the Juma River Basin to Climate Variation, Direct Human Intervention, and Land Use Change. Water 2018, 10, 1775. [Google Scholar] [CrossRef] [Green Version]
- Li, B.; Li, C.; Liu, J.; Zhang, Q.; Duan, L. Decreased Streamflow in the Yellow River Basin, China: Climate Change or Human—Induced? Water 2017, 9, 116. [Google Scholar] [CrossRef]
- Sajikumar, N.; Remya, R.S. Impact of land cover and land use change on runoff characteristics. J. Environ. Manag. 2015, 161, 460–468. [Google Scholar] [CrossRef]
- Li, Y.; Chang, J.; Wang, Y.; Jin, W.; Guo, A. Spatiotemporal Impacts of Climate, Land Cover Change and Direct Human Activities on Runoff Variations in the Wei River Basin, China. Water 2016, 8, 220. [Google Scholar] [CrossRef] [Green Version]
- Wang, X.; Ma, F.; Li, J. Water resources vulnerability assessment based on the parametric-system method: A case study of the Zhangjiakou Region of Guanting Reservoir Basin, North China. Procedia Environ. Sci. 2012, 13, 1204–1212. [Google Scholar] [CrossRef] [Green Version]
- Song, S.; Zhang, S.; Wang, T.; Meng, J.; Zhou, Y.; Zhang, H. Balancing conservation and development in Winter Olympic construction: Evidence from a multi-scale ecological suitability assessment. Sci. Rep. 2018, 8, 14083. [Google Scholar] [CrossRef]
- Yang, H.; Thompson, J.R.; Flower, R.J. Olympics will make water scarcity worse. Nature 2015, 525, 455. [Google Scholar] [CrossRef] [PubMed] [Green Version]
- Mwangi, H.M.; Julich, S.; Patil, S.D.; McDonald, M.A.; Feger, K.-H. Relative contribution of land use change and climate variability on discharge of upper Mara River, Kenya. J. Hydrol. Reg. Stud. 2016, 5, 244–260. [Google Scholar] [CrossRef] [Green Version]
- Wei, X.; Zhang, M. Quantifying streamflow change caused by forest disturbance at a large spatial scale: A single watershed study. Water Resour. Res. 2010, 46. [Google Scholar] [CrossRef]
- Tan, M.L.; Ibrahim, A.L.; Yusop, Z.; Duan, Z.; Ling, L. Impacts of land-use and climate variability on hydrological components in the Johor River basin, Malaysia. Hydrol. Sci. J. 2015, 60, 873–889. [Google Scholar] [CrossRef]
- Huo, Z.; Feng, S.; Kang, S.; Li, W.; Chen, S. Effect of climate changes and water-related human activities on annual stream flows of the Shiyang river basin in arid north-west China. Hydrol. Process. 2008, 22, 3155–3167. [Google Scholar] [CrossRef]
- Liang, W.; Bai, D.; Wang, F.; Fu, B.; Yan, J.; Wang, S.; Yang, Y.; Long, D.; Feng, M. Quantifying the impacts of climate change and ecological restoration on streamflow changes based on a Budyko hydrological model in China’s Loess Plateau. Water Resour. Res. 2015, 51, 6500–6519. [Google Scholar] [CrossRef]
- Gao, G.; Fu, B.; Wang, S.; Liang, W.; Jiang, X. Determining the hydrological responses to climate variability and land use/cover change in the Loess Plateau with the Budyko framework. Sci. Total Environ. 2016, 557–558, 331–342. [Google Scholar] [CrossRef] [PubMed]
- Ma, X.; Lu, X.X.; van Noordwijk, M.; Li, J.T.; Xu, J.C. Attribution of climate change, vegetation restoration, and engineering measures to the reduction of suspended sediment in the Kejie catchment, southwest China. Hydrol. Earth Syst. Sci. 2014, 18, 1979–1994. [Google Scholar] [CrossRef] [Green Version]
- Neitsch, S.L.; Arnold, J.G.; Kiniry, J.R.; Williams, J.R. Soil and water assessment tool theoretical documentation version 2009; Grassland Soil and Water Research Laboratory, Blackland Research Center, Texas A&M university, College of Agriculture and Life Sciences: College Station, TX, USA, 2009. [Google Scholar]
- Mango, L.M.; Melesse, A.M.; McClain, M.E.; Gann, D.; Setegn, S. Land use and climate change impacts on the hydrology of the upper Mara River Basin, Kenya: Results of a modeling study to support better resource management. Hydrol. Earth Syst. Sci. 2011, 15, 2245–2258. [Google Scholar] [CrossRef] [Green Version]
- Bhatta, B.; Shrestha, S.; Shrestha, P.K.; Talchabhadel, R. Evaluation and application of a SWAT model to assess the climate change impact on the hydrology of the Himalayan River Basin. Catena 2019, 181, 104082. [Google Scholar] [CrossRef]
- Osei, M.A.; Amekudzi, L.K.; Wemegah, D.D.; Preko, K.; Gyawu, E.S.; Obiri-Danso, K. The impact of climate and land-use changes on the hydrological processes of Owabi catchment from SWAT analysis. J. Hydrol. Reg. Stud. 2019, 25, 100620. [Google Scholar] [CrossRef]
- Zarenistanak, M.; Dhorde, A.; Kripalani, R. Trend analysis and change point detection of annual and seasonal precipitation and temperature series over southwest Iran. J. Earth Syst. Sci. 2014, 123, 281–295. [Google Scholar] [CrossRef]
- Xu, C.; Li, J.; Zhao, J.; Gao, S.; Chen, Y. Climate variations in northern Xinjiang of China over the past 50 years under global warming. Quat. Int. 2015, 358, 83–92. [Google Scholar] [CrossRef]
- Mayowa, O.O.; Pour, S.H.; Shahid, S.; Mohsenipour, M.; Harun, S.B.; Heryansyah, A.; Ismail, T. Trends in rainfall and rainfall-related extremes in the east coast of peninsular Malaysia. J. Earth Syst. Sci. 2015, 124, 1609–1622. [Google Scholar] [CrossRef] [Green Version]
- Gao, P.; Geissen, V.; Ritsema, C.; Mu, X.-M.; Wang, F. Impact of climate change and anthropogenic activities on stream flow and sediment discharge in the Wei River basin, China. Hydrol. Earth Syst. Sci. 2013, 17, 961. [Google Scholar] [CrossRef] [Green Version]
- Pirnia, A.; Golshan, M.; Darabi, H.; Adamowski, J.; Rozbeh, S. Using the Mann–Kendall test and double mass curve method to explore stream flow changes in response to climate and human activities. J. Water Clim. Chang. 2019, 10, 725–742. [Google Scholar] [CrossRef]
- Arnold, J.G.; Srinivasan, R.; Muttiah, R.S.; Williams, J.R. Large Area Hydrologic Modeling and Assessment Part I: Model Development1. JAWRA J. Am. Water Resour. Assoc. 1998, 34, 73–89. [Google Scholar] [CrossRef]
- Ghoraba, S.M. Hydrological modeling of the Simly Dam watershed (Pakistan) using GIS and SWAT model. Alex. Eng. J. 2015, 54, 583–594. [Google Scholar] [CrossRef] [Green Version]
- Xu, Z.; Pang, J.; Liu, C.; Li, J. Assessment of runoff and sediment yield in the Miyun Reservoir catchment by using SWAT model. Hydrol. Process. Int. J. 2009, 23, 3619–3630. [Google Scholar] [CrossRef]
- Rivas-Tabares, D.; Tarquis, A.M.; Willaarts, B.; De Miguel, Á. An accurate evaluation of water availability in sub-arid Mediterranean watersheds through SWAT: Cega-Eresma-Adaja. Agric. Water Manag. 2019, 212, 211–225. [Google Scholar] [CrossRef] [Green Version]
- Ang, R.; Oeurng, C. Simulating streamflow in an ungauged catchment of Tonlesap Lake Basin in Cambodia using Soil and Water Assessment Tool (SWAT) model. Water Sci. 2018, 32, 89–101. [Google Scholar] [CrossRef] [Green Version]
- Moriasi, D.N.; Arnold, J.G.; Van Liew, M.W.; Bingner, R.L.; Harmel, R.D.; Veith, T.L. Model evaluation guidelines for systematic quantification of accuracy in watershed simulations. Trans. ASABE 2007, 50, 885–900. [Google Scholar] [CrossRef]
- Khoi, D.N.; Suetsugi, T. Impact of climate and land-use changes on hydrological processes and sediment yield—a case study of the Be River catchment, Vietnam. Hydrol. Sci. J. 2014, 59, 1095–1108. [Google Scholar] [CrossRef]
Figure 1.
Location of the Qingshui River in Chongli County, hydrological station and climate station.
Figure 1.
Location of the Qingshui River in Chongli County, hydrological station and climate station.

Figure 2.
The double mass curve for period 1980–2016 in Chongli station.

Figure 3.
Monthly hydrographs for the calibration period (1981–1985) and the variation period (1986–1989) at Qingshui station.
Figure 3.
Monthly hydrographs for the calibration period (1981–1985) and the variation period (1986–1989) at Qingshui station.

Figure 4.
Contributions of climate, land use and human activity to discharge change on the annual and seasonal scale in the three scenarios.
Figure 4.
Contributions of climate, land use and human activity to discharge change on the annual and seasonal scale in the three scenarios.

Figure 5.
Trends of precipitation (a) and temperature (b) from 1980 to 2016.

Figure 6.
Water use (a) and supply (b) from 2005 to 2016.

Figure 7.
Groundwater depth level change from 2015.03 to 2018.06.


Table 1.
Summary of calibration parameters implemented with SUFI2.
| Parameter | Definition | Units | Sensitive Ranking | Fitted Value |
|---|---|---|---|---|
| v_GWQMN | Threshold depth of water in the shallow aquifer required for return flow to occur | mm | 1 | 1543.7500 |
| v_CANMX. | Maximum canopy storage | mm | 2 | 11.875000 |
| r_SOL_BD. | Moist bulk density | n/a | 3 | −0.356250 |
| r_SOL_AWC | Available water capacity of the soil layer | n/a | 4 | −0.431250 |
| r_ESCO | Soil evaporation compensation factor | n/a | 5 | −0.462500 |
| r_CN2 | SCS runoff curve number for moisture condition 2 | n/a | 6 | −0.374375 |
| r_REVAPMN | Threshold depth of water in the shallow aquifer for “REVAP” to occur | n/a | 7 | 0.042047 |
Notes: “v_”: parameter should be replaced by a given value; “r_”: parameter should be multiplied by (1+ given value).
Table 2.
Runoff in different scenarios (104 m3).
| Time | Base Period | Study Period | ||||||
|---|---|---|---|---|---|---|---|---|
| Spring | 271.52 | 301.54 | 403.13 | 131.61 | 253.6 | −17.92 | 403.87 | −102.33 |
| Summer | 1529.18 | 542.42 | 1692.02 | 162.84 | 1707.83 | 178.65 | 1693.94 | −1151.52 |
| Autumn | 311.21 | 574.13 | 776.32 | 465.11 | 406.05 | 94.84 | 776.45 | −202.32 |
| Winter | 200.89 | 383.07 | 566.13 | 365.24 | 96.04 | −104.85 | 566.08 | −183.01 |
| SUM | 2312.8 | 1801.16 | 3437.6 | 1124.8 | 2463.52 | 150.72 | 3440.34 | −1639.18 |
Table 3.
Hydrological components in different scenarios (mm).
| Components | Baseline | S1 | S2 | S3 |
|---|---|---|---|---|
| Precipitation | 453.5 | 484.5 | 453.5 | 484.5 |
| ET | 392.5 | 405.3 | 392.6 | 405.3 |
| Surface Q | 0.19 | 2.7 | 0.23 | 2.7 |
| Lateral Q | 13.65 | 15.77 | 13.56 | 15.78 |
Table 4.
Land use change from 1990 to 2015 (km2).
| Land Use Type | Year | ||||
|---|---|---|---|---|---|
| 1990 | 2000 | 2005 | 2010 | 2015 | |
| Cultivated land | 679.36 | 679.86 | 679.36 | 724.55 | 724.46 |
| Forest | 769.35 | 768.2 | 767.88 | 762.95 | 762.64 |
| Grassland | 886.06 | 886.66 | 887.19 | 818.74 | 818.09 |
| Water | 15.46 | 15.51 | 15.46 | 15.7 | 15.7 |
| Residential land | 8.97 | 8.97 | 9.3 | 37.23 | 38.27 |
| Bare land | 0.22 | 0.22 | 0.22 | 0.23 | 0.23 |
Publisher’s Note: MDPI stays neutral with regard to jurisdictional claims in published maps and institutional affiliations. |
© 2021 by the authors. Licensee MDPI, Basel, Switzerland. This article is an open access article distributed under the terms and conditions of the Creative Commons Attribution (CC BY) license (https://creativecommons.org/licenses/by/4.0/).
Share and Cite
MDPI and ACS Style
Zhang, M.; Stodolak, R.; Xia, J. The Impact of the Changes in Climate, Land Use and Direct Human Activity on the Discharge in Qingshui River Basin, China. Water 2021, 13, 3147. https://doi.org/10.3390/w13213147
AMA Style
Zhang M, Stodolak R, Xia J. The Impact of the Changes in Climate, Land Use and Direct Human Activity on the Discharge in Qingshui River Basin, China. Water. 2021; 13(21):3147. https://doi.org/10.3390/w13213147
Chicago/Turabian StyleZhang, Mengxue, Radosław Stodolak, and Jianxin Xia. 2021. "The Impact of the Changes in Climate, Land Use and Direct Human Activity on the Discharge in Qingshui River Basin, China" Water 13, no. 21: 3147. https://doi.org/10.3390/w13213147
Note that from the first issue of 2016, this journal uses article numbers instead of page numbers. See further details here.