
Temporal and Spatial Variation of NDVI and Its Driving Factors in Qinling Mountain

1
College of Tourist (Institute of Human Geography), Xi’an International Studies University, Xi’an 710127, China
2
College of Urban and Environment Sciences, Northwest University, Xi’an 710127, China
3
Institute of Geological & Mineral Resources Survey of Henan, Luoyang 471000, China
*
Author to whom correspondence should be addressed.
Water 2021, 13(22), 3154; https://doi.org/10.3390/w13223154
Submission received: 8 October 2021
/
Revised: 2 November 2021
/
Accepted: 5 November 2021
/
Published: 9 November 2021
(This article belongs to the Section Hydrology)
Abstract
:Qinling Mountains is the north–south boundary of China’s geography; the vegetation changes are of great significance to the survival of wildlife and the protection of species habitats. Based on Landsat products in the Google Earth Engine (GEE) platform, Pearson’s correlation coefficient method, and classification and regression models, this study analyzed the changes in NDVI (Normalized Difference Vegetation Index) in the Qinling Mountains in the past 38 years and the sensitivity of its driving factors. Finally, residual analysis method and accumulate slope change rate are used to identify the impact of human activities and climate change on NDVI. The research results show the following: (1) The NDVI value in most areas of Qinling Mountains is at a medium-to-high level, and 99.76% of the areas correspond to an increasing trend of NDVI, and the significantly increased area accounts for more than 20%. (2) From 1981 to 2019, the NDVI of the Qinling Mountains increased from 0.63 to 0.78, showing an overall upward trend, and it increased significantly after 2006. (3) Sensitivity analysis results show that the western high-altitude area of Qinling Mountain area dominated by grassland is mainly affected by precipitation. The central and southeastern parts of the Qinling Mountains are significantly affected by temperature, and they are mainly distributed in areas dominated by forest. (4) The contribution rates of climate change and human activities to NDVI are 36.04% and 63.96%, respectively. Among them, the positive impact of human activities on the NDVI of the Qinling Mountains accounted for 99.85% of the area. The area with significant positive effect accounted for 36.49%. The significant negative effect area accounts for only 0.006%, mainly distributed in urban areas and coal mining areas.
1. Introduction
Vegetation is an important indicator that affects biodiversity and ecological processes; it is also an important medium for water and energy balance, carbon cycle, etc. At the same time, vegetation coverage is also one of the most sensitive elements of global land cover affected by climate change and human activities [1,2]. Some important ecological function areas play an important role in maintaining ecological security and regulating regional human–land relationship [3]. As the north–south boundary of China’s geography, the Qinling Mountains are a hotspot and key area for vegetation coverage research.
Remote sensing observation data based on remote sensing images provide an opportunity for accurate and real-time monitoring of the temporal and spatial changes of vegetation coverage [4]. The Normalized Difference Vegetation Index (NDVI) is the most commonly used remote sensing vegetation index for measuring vegetation coverage [5]. Most studies use GIMMS and MODIS product to calculate NDVI; however, the former has a long time series but low resolution, and the latter has medium resolution but cannot provide data before 2000. The Landsat data product can make up for the shortcomings of the above two products (30m resolution, time span from 1975 to present) and is the most ideal data product for monitoring the dynamic changes of vegetation under a long-term sequence. However, the processing method relative to Landsat data is more complex, and it has high requirements for computer performance; thus, it is rarely used in large-scale area research. With the development of cloud platform applications, the Google search engine (Google Earth Engine, GEE) provides a large amount of satellite data for geography related research and provides online visualization and spatial analysis and processing functions [6]. At present, GEE has been successfully applied to national scale vegetation dynamic monitoring [7], forest carbon sequestration capacity assessment [8], high-resolution mapping of global surface water and its long-term changes [9], intercontinental-scale farmland mapping [10], and other fields.
Previous studies have shown that there is a good linear relationship between NDVI and climate factors. There is a good correlation between precipitation and NDVI during the vegetation growth period on the northern slope of the Qinghai–Tibet Plateau [11]. In eastern China, the influence of temperature on NDVI is greater than that of precipitation [12]. Research in Xinjiang found that precipitation and evapotranspiration are two key factors affecting NDVI [13]. On the pixel scale, Sheng used statistical methods to study the spatial development trend of vegetation coverage and the influence of meteorological factors [14]. In addition to climate factors, terrain and human activities also affect NDVI. Zhu used pixel-by-pixel analysis and found that the main factors affecting vegetation coverage of the Qaidam Basin include precipitation, altitude, and human activities [15]. On the basis of analyzing the difference of NDVI changes, Zhang added elevation as NDVI driving factors and quantitatively analyzed the relationship between NDVI and various influencing factors in the study area [16]. However, most of the above studies are only based on average data analysis or based on simple correlation coefficient analysis. The question of how to establish the spatial relationship between NDVI and multiple climatic factors and topographic factors, so as to study the sensitivity of driving factors such as climate and topography, is still a scientific issue to be studied. The machine learning method can build a more stable model between NDVI and related climate and terrain factors by using a large amount of sample data and analyze the degree of influence of the changes of each driving factor on NDVI.
In this paper, we analyzed spatial distribution and change trends of medium and high resolution NDVI in the Qinling Mountains during 38 years from 1981 to 2019. By constructing a random forest and CART model, we spatially analyzed the impact of climate factors and topographic factors on NDVI. Finally, the residual analysis method and the accumulative slope change rate are used to identify the impact of human activities on vegetation coverage in the Qinling Mountains over the years.
2. Materials and Methods
2.1. Study Area
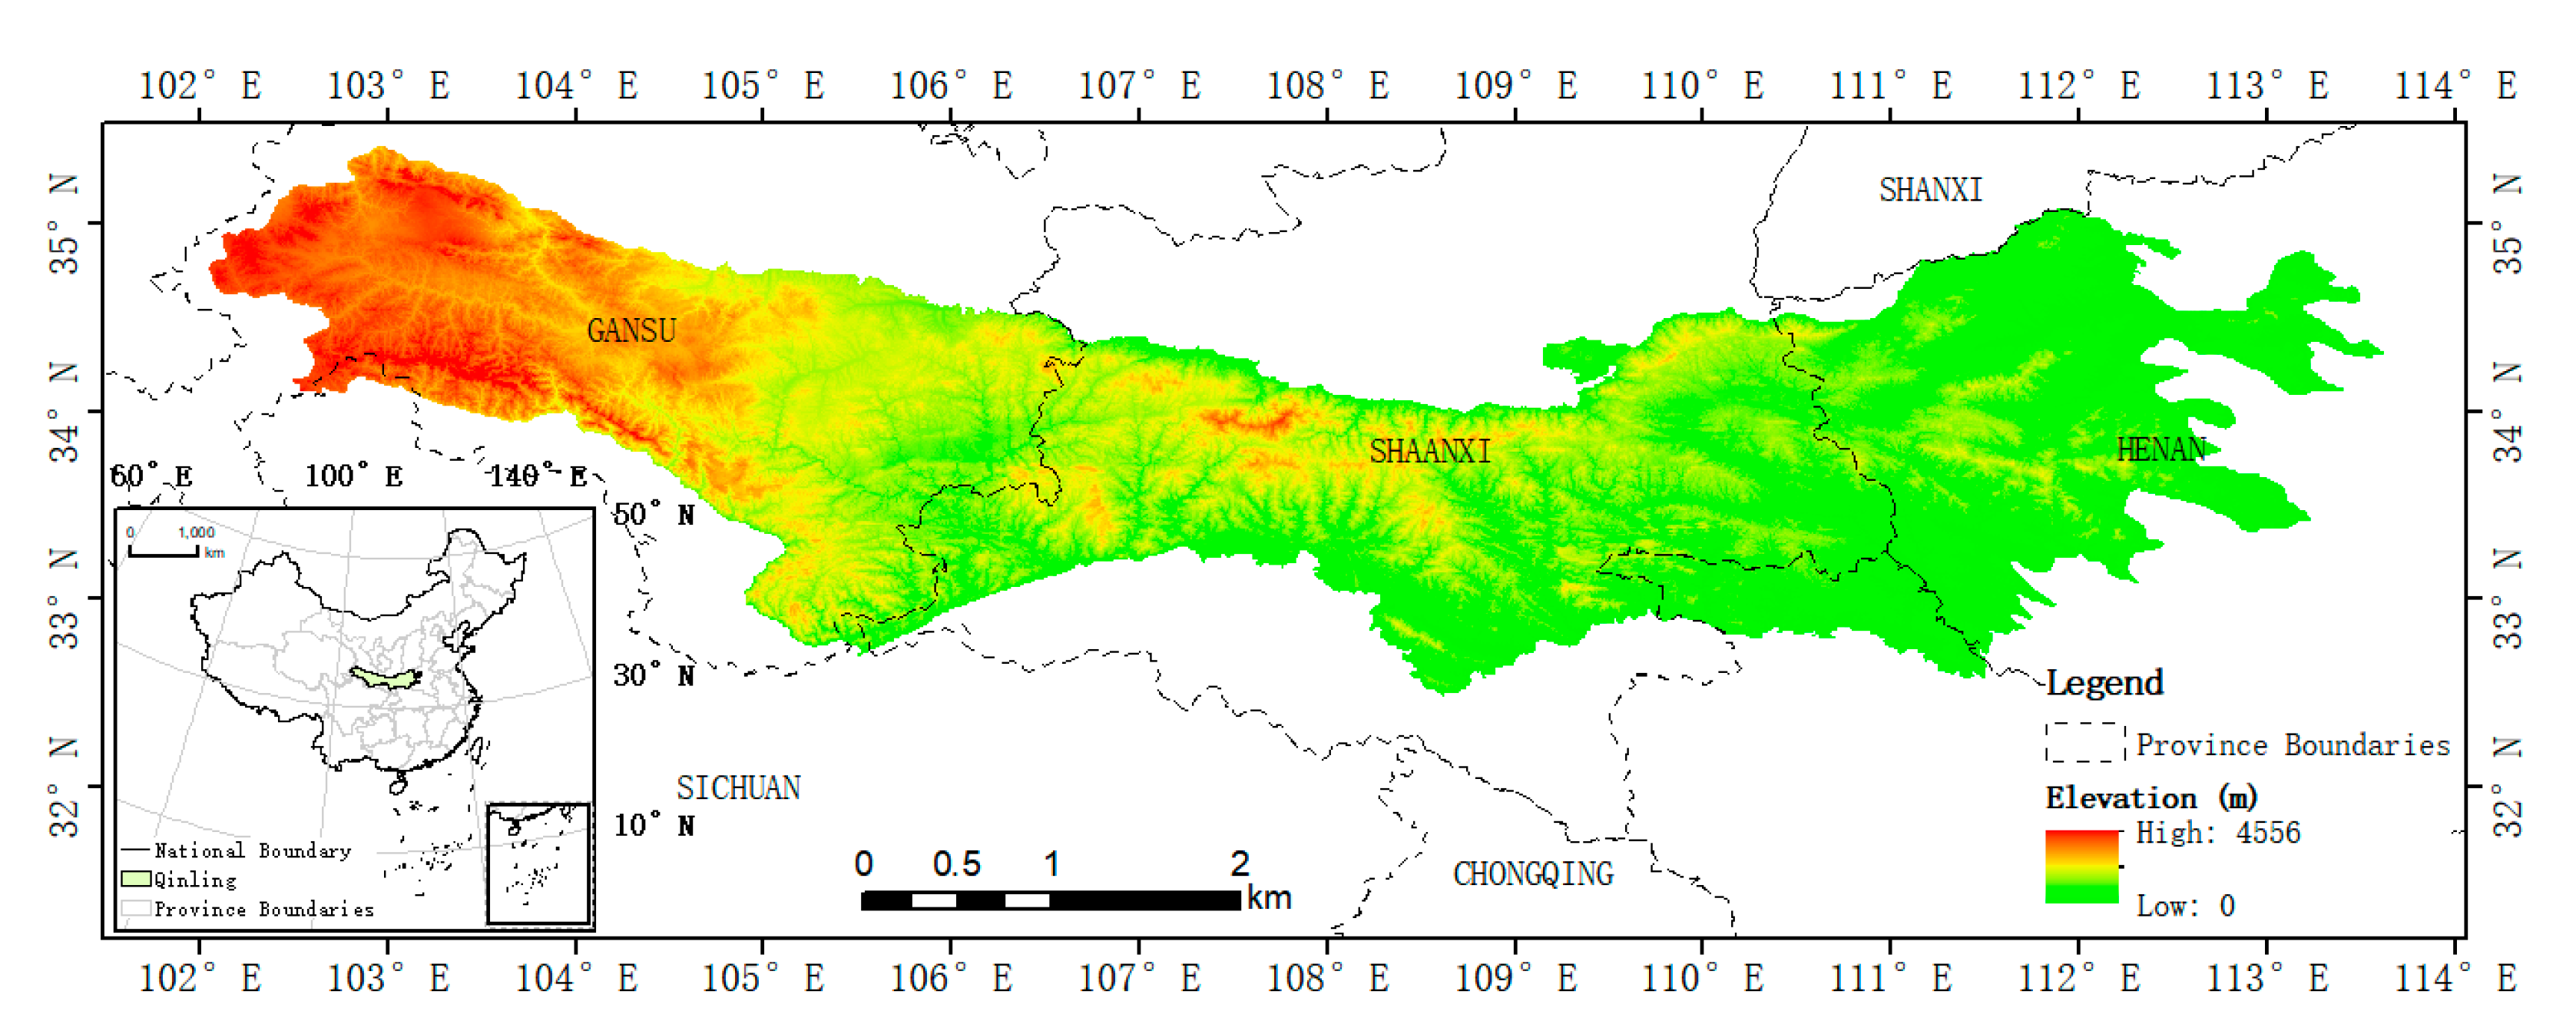
This paper takes the Qinling Mountains in a broad sense as the research area, with an area of 155,900 km2 and an altitude ranging from 95 m to 4591 m. In a broad sense, the Qinling Mountains are the watershed between the Yangtze River and the Yellow River. The climate to the south of the Qinling Mountains is subtropical, with a southern type of natural conditions, and the north experiences a warm temperate climate, with a northern type of natural conditions, and the precipitation is usually less than 750 mm. The Qinling area is dominated by farmland and temperate deciduous broad-leaved forests. There are also significant differences in the characteristics of agricultural production between the north and the south. Therefore, for a long period of time, people have regarded the Qinling Mountains as the geographical dividing line between China’s “South” and “North”. The geographical distribution of the Qinling Mountains is shown in Figure 1.
2.2. Data
2.2.1. Satellite Data
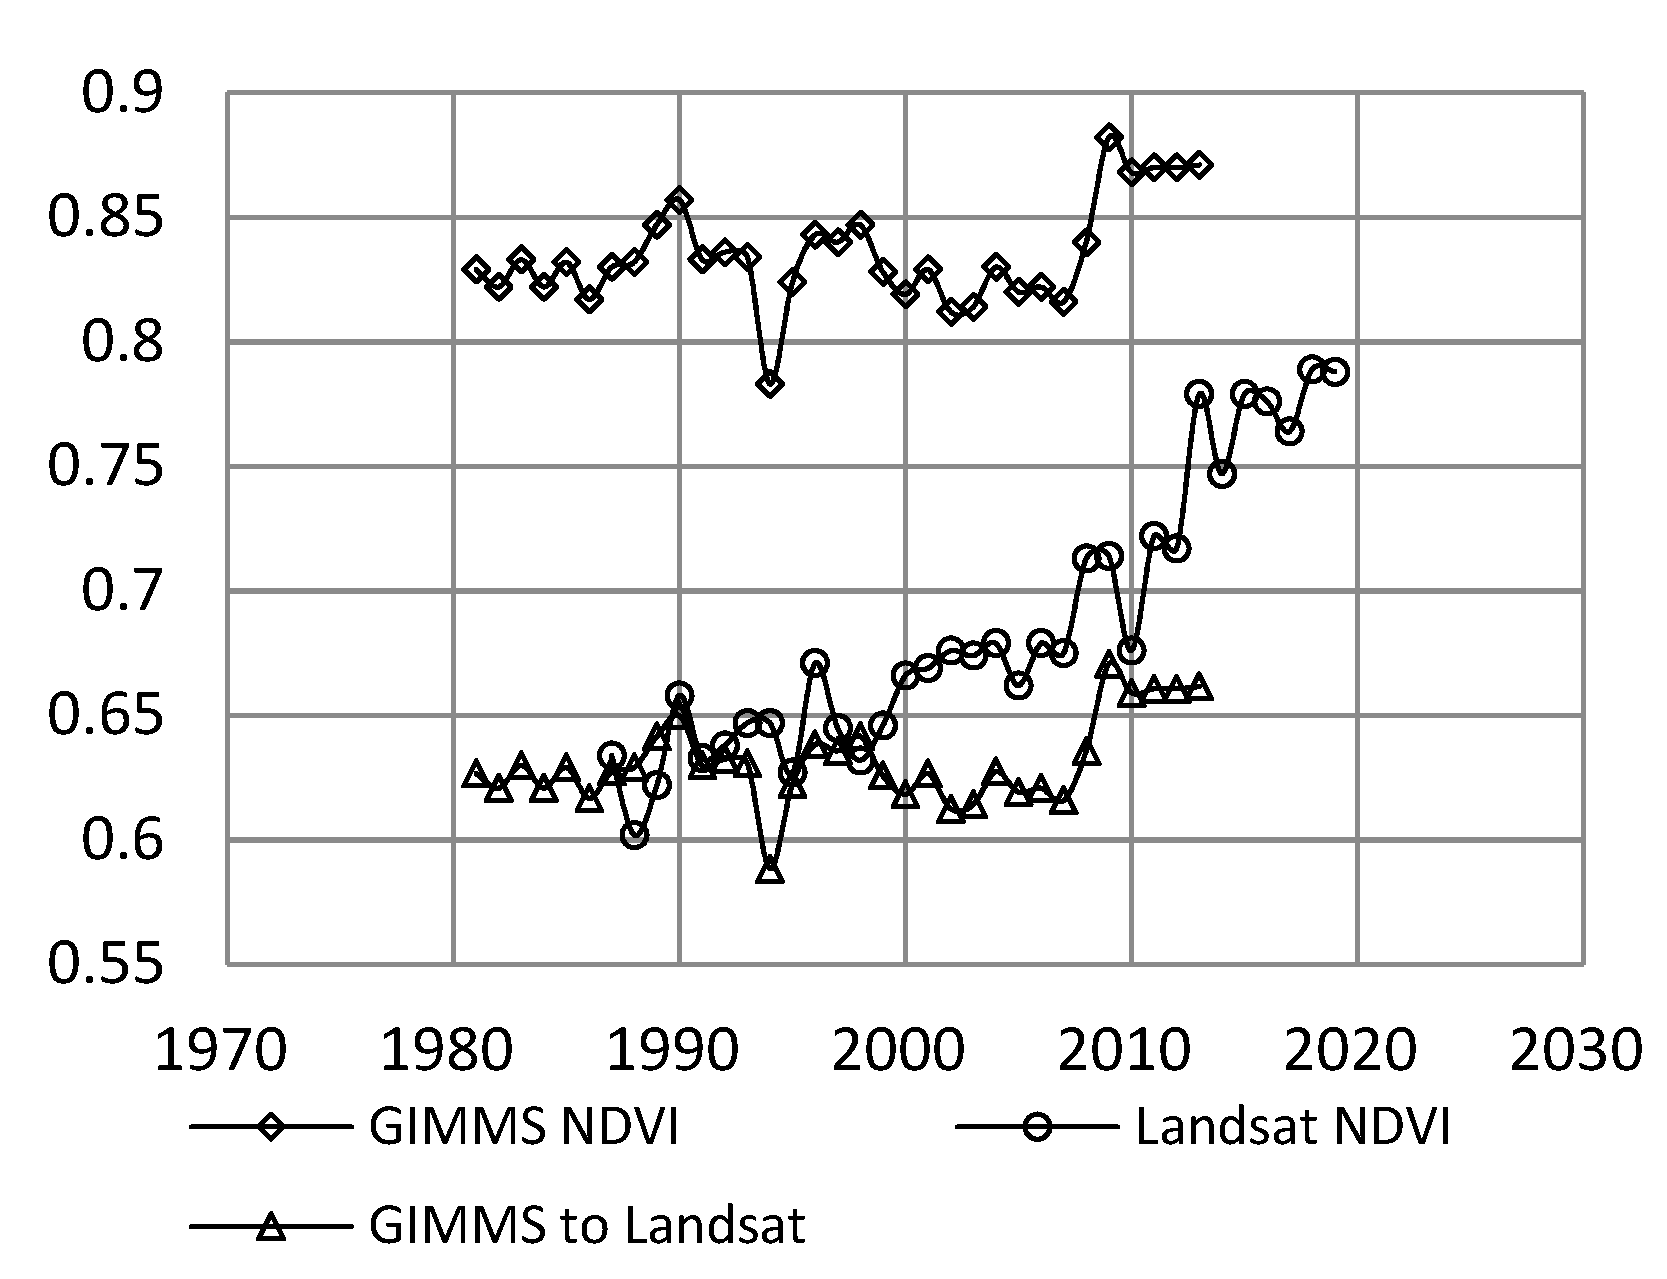
The remote sensing data used in this paper include Landsat surface reflectance data (Landsat surface reflectance, including Landsat 5 ETM, Landsat 7 ETM+ and Landsat 8 OLI/TIRS). The advantage of using the surface reflectance is that the quality attributes of the pixels, such as cloud or cloud shadow coverage, water, and ice and snow cover, can help users filter out suitable images for research. Currently, the available years of surface reflectance data are 1987–2019 in the Qinling Mountain area. In order to roughly estimate the NDVI value before 1987, we have selected GIMMS NDVI (Global Inventory Modeling and Mapping Studies; resolution: 1000 km; time range: 1981–2014) and established the correlation between GIMMS NDVI and Landsat NDVI in the same time period (Landsat = 0.830727 * GIMMS-0.028479396); furthermore, we adjusted the GIMMS NDVI value to the Landsat NDVI value [5] (see Figure 2).
2.2.2. Digital Elevation Model
2.2.3. Climate Data
Climate-related data are mainly based on the TerraClimate dataset in the GEE platform, with a resolution of about 5 km. This dataset is generated by WorldClim high-resolution dataset and long time series CRU Ts4.0 and JRA55 data interpolation [18]. This study selected precipitation (P), temperature (T), soil moisture (SOIL), drought index (PSDI), and AET as the basic data.
2.2.4. Landcover Data
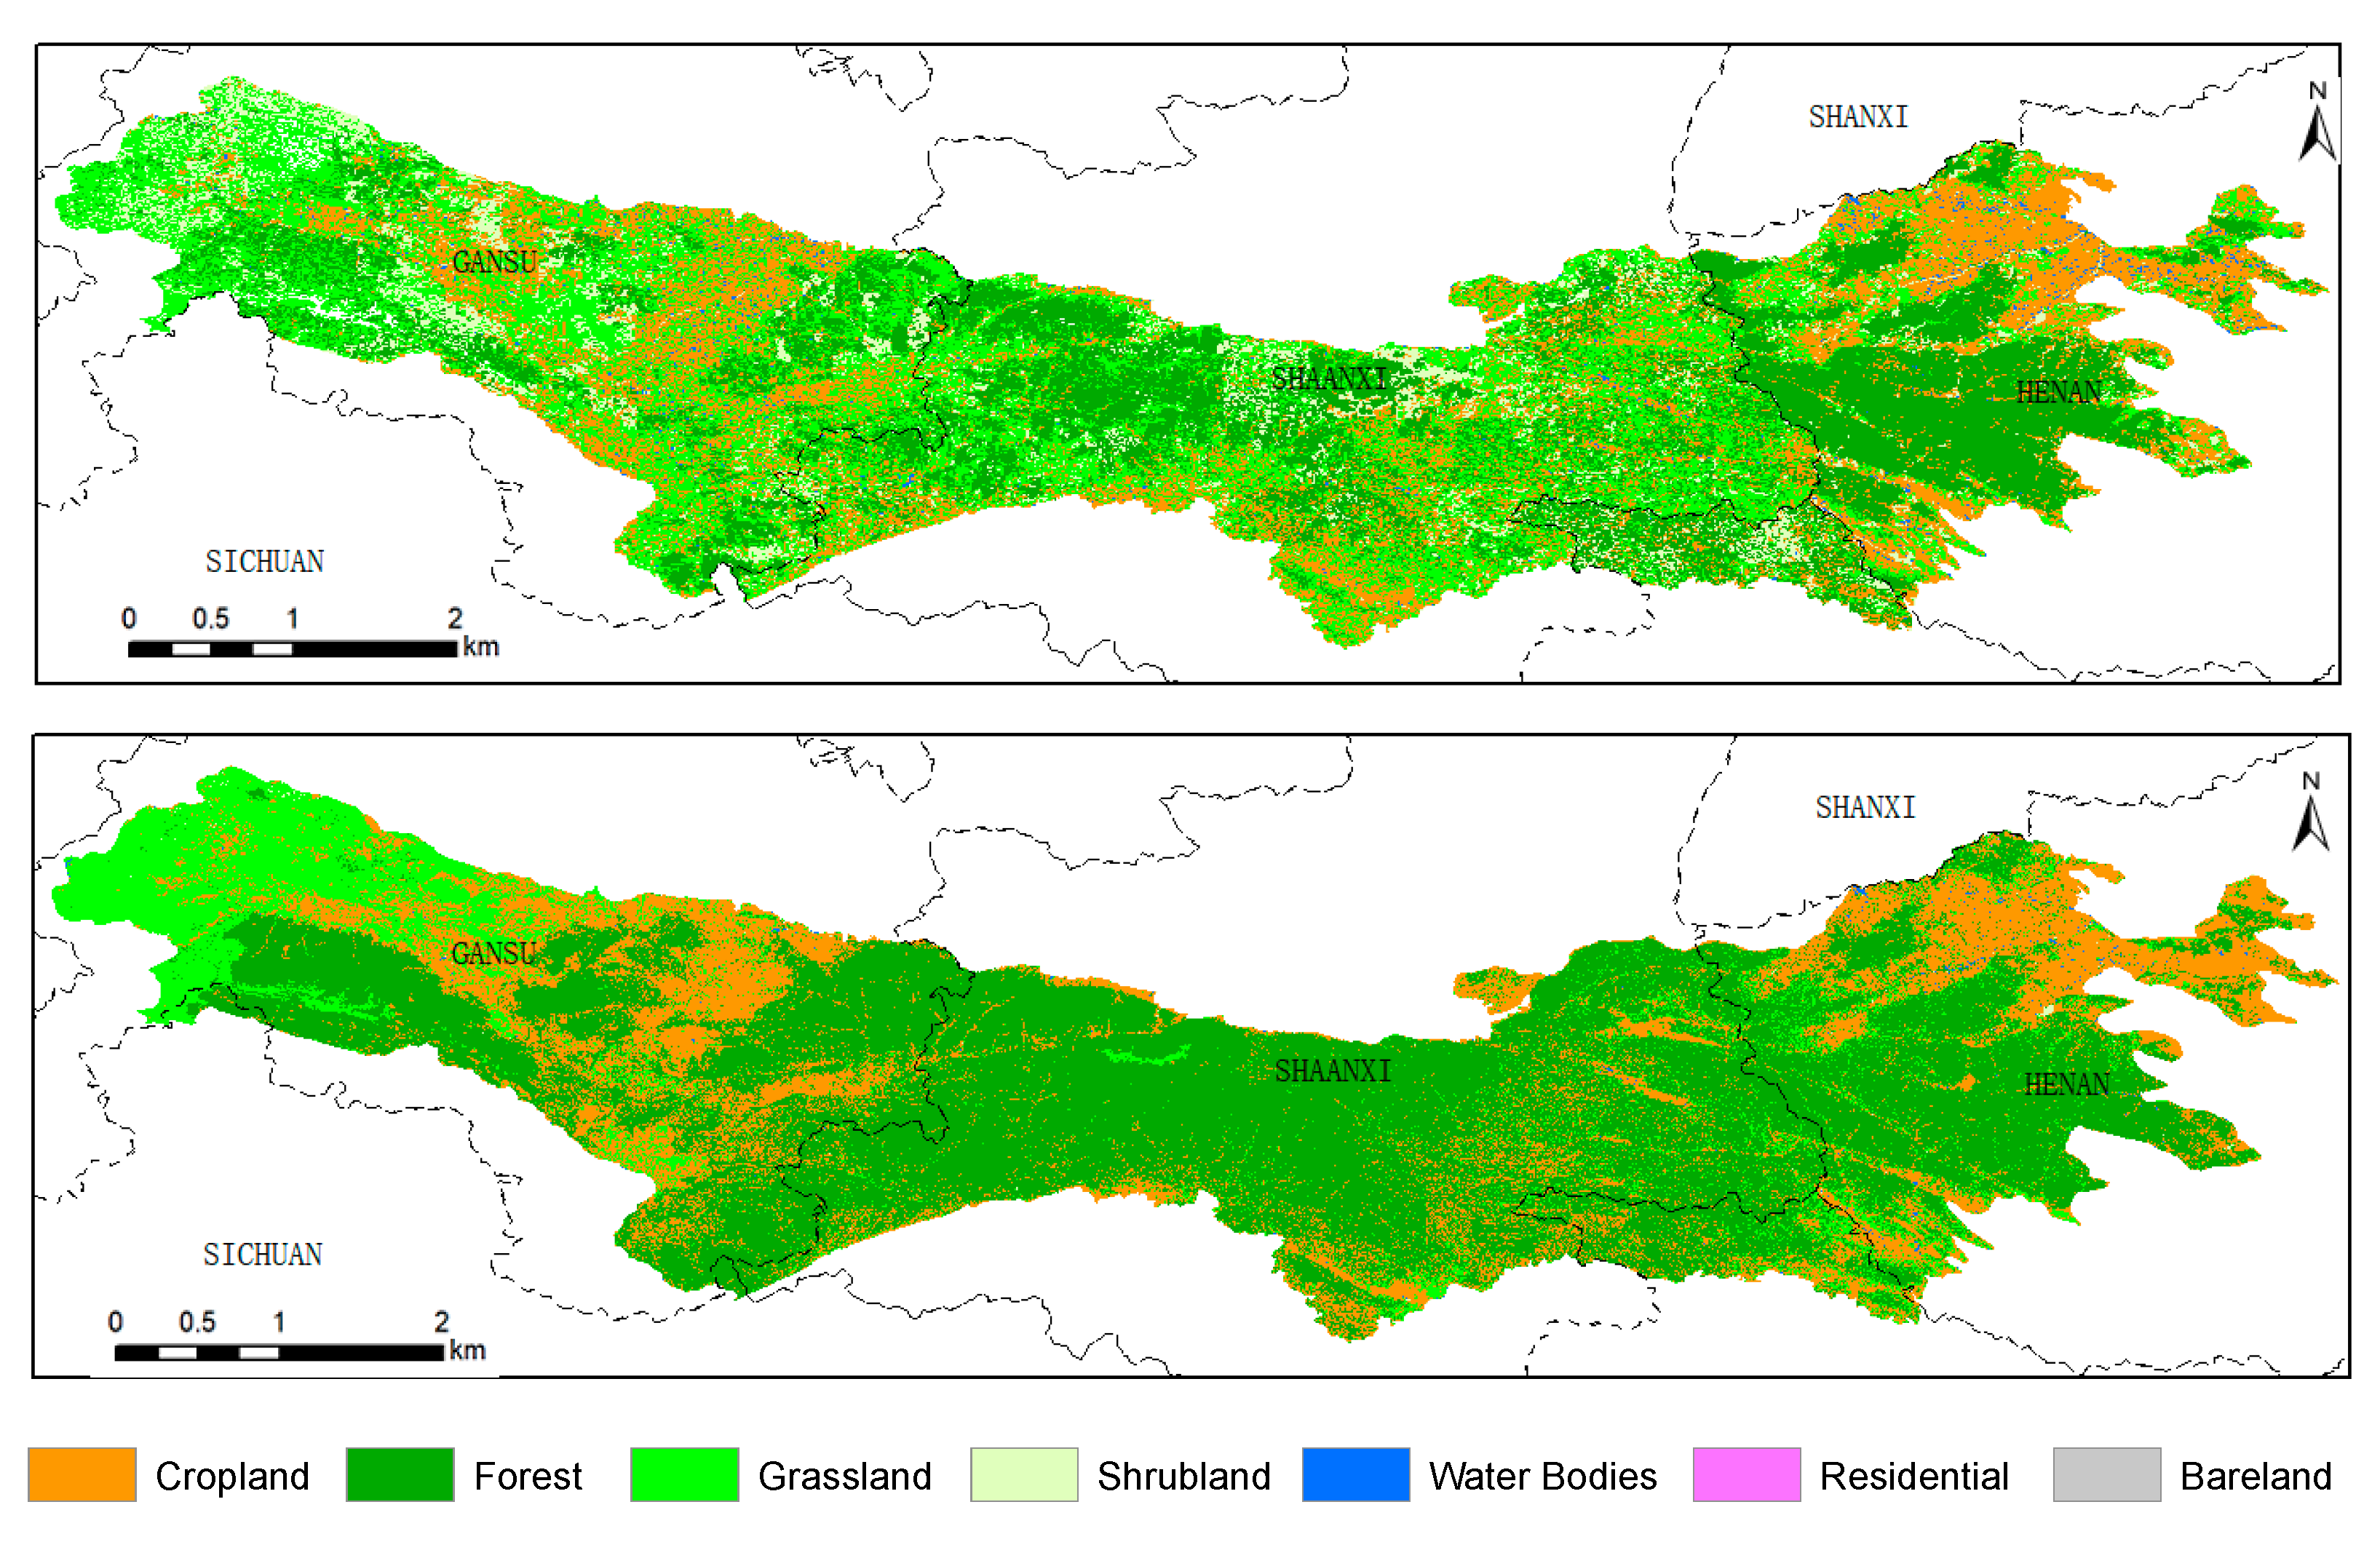
The two periods of landcover data used in this paper (Figure 3) include the following: (1) the remote sensing monitoring database of China’s landcover status in 1990 (available at http://www.resdc.cn/, accessed on 12 October 2020). (2) Global land cover data includes the spatial distribution of land cover in 2017 (available at http://data.ess.tsinghua.edu.cn/, accessed on 12 October 2020). The landuse types mainly include farmland, forest, grassland, and shrubland [19].
2.3. Methods
This study is mainly based on GEE and machine learning methods for analyzing temporal and spatial distributions and change characteristics of long-term series, high-resolution vegetation index NDVI, and its driving factors.
2.3.1. Remote Sensing Image Processing
Landsat surface reflectance (Landsat SR) images are obtained from the GEE platform, and there are a total of 8827 images in the Qinling Mountains. The Landsat SR images are removed from clouds, cloud shadows, ice and snow cover, and water bodies, and the NDVI band is added to each image according to Formula (1).
NIR and RED are near-infrared and infrared bands, respectively. Among them, the near-infrared and infrared bands of Landsat 5 and 7 correspond to band 4 and band 3, respectively, and Landsat 8 corresponds to band 5 and band 4, respectively. (3) We chose the appropriate image according to the research area and research time series. In order to correctly reflect the vegetation coverage level in the study area, this paper chooses the average NDVI in the growing season from April to September as the vegetation index.
2.3.2. Trend Analysis
Mann–Kendall, a method for identifying mutation points in hydro-meteorological sequences, was proposed by Sneyers (1975) and Goossens (1986). The hyperbola of the statistic U was obtained by using the sequence reversal method, and the intersection of the two curves is the mutation point [20]
2.3.3. Sensitivity Analysis
Sensitivity Analysis (SA) refers to a method that affects the output of the model after some parameters in a mathematical model are changed [23]. Classification and Regression Tree (CART) [24] is used for sensitivity analysis in this study [25]. Climatic factors, including precipitation, soil moisture, evapotranspiration, temperature, and drought index, are extracted from the TerraClimate dataset based on GEE, and then climate factors and slope, aspect, and altitude are used as auxiliary factors to construct the model. The precipitation is the annual total of the growing season, and the rest of the climate factors are the annual averages of the growing season. Since the resolution of the climate factor is 5 km and the resolution of the terrain factor is 30 m, in order to make the results more accurate, this paper converts the raster layers with 5 km resolution to points (one grid corresponds to one point) and uses the point data to read the corresponding values of NDVI, various climate factors, and terrain factors as a model input data.
2.3.4. Residual Analysis
The main idea of residual analysis is to establish a multiple linear regression model between the NDVI value and the climatic factors in the base period as the predicted value of NDVI, which is regarded as the NDVI only affected by climatic factors. The difference between the actual value and the predicted value is the residual value, which is the impact of human activities on NDVI [26].
The in Formula (2) is the residual value. When < 0, human activity has a negative impact; when < 0, human activity has a positive impact, and if 0, human activity has a weak impact.
In order to analyze the spatial change trend of the residual value, the Pearson correlation method is used in GEE to establish the correlation between the residual value and time series in order to determine the change trend and significance of the NDVI residual value.
2.3.5. Cumulative Slope Change Rate
The residual analysis cannot provide the contribution rates of climate change and human activities, because this method has a premise that the predicted value of the regression model is only affected by climate change; that is, the residual value can only estimate the impact of human activities. Therefore, we used the cumulative slope change rate method, which is most commonly used in hydrology to distinguish between human activities and climate change. This method has also been used in the analysis of vegetation coverage on the Loess Plateau [27].
The main idea is to establish a multiple linear regression equation between the NDVI and the climatic factor in the 1987–2006. This equation is used to reconstruct the NDVI (fitting NDVI) from 1987 to 2019, that is, the NDVI sequence that is only affected by climate change. Then, the contribution rate of human activities and climate change to NDVI change can be calculated by the following formula.
Among them, R1 is the slope change rate (%), and are the values of NDVI measured by remote sensing before and after the mutation year.
In Formula (4), R2 is the slope change rate (%) of the cumulative fitting NDVI, and and are the NDVI values fitted by the multivariate linear model before and after the mutation year.
In Formula (5), is the contribution rate of climate change to NDVI change.
In Formula (6), is the contribution rate of human activity to NDVI change.
3. Results
3.1. Spatial Distribution and Changing Trend of NDVI
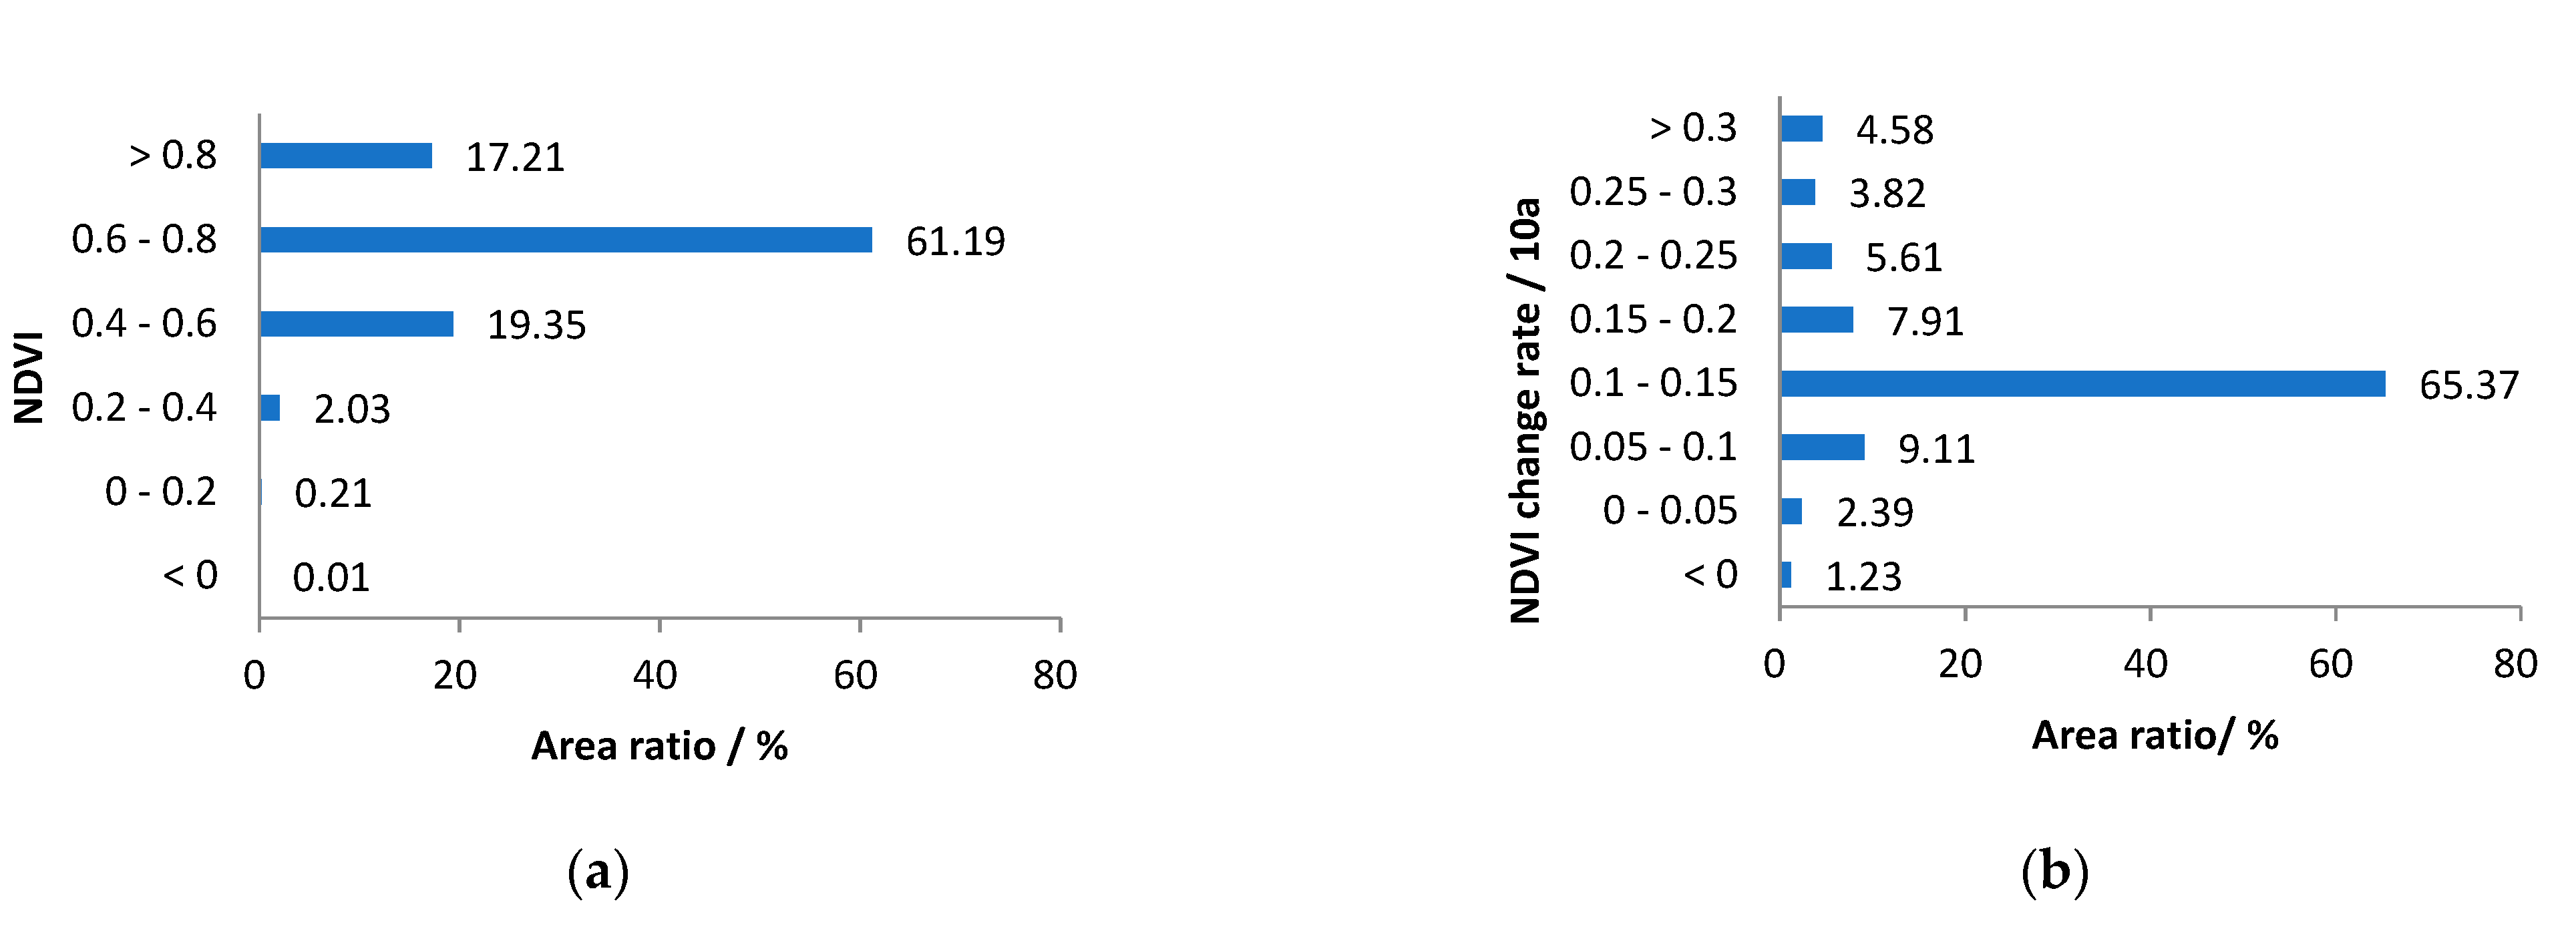
The spatial distribution of the average NDVI in the growing season from 1987 to 2019 in the Qinling Mountains (Figure 4) shows that the NDVI value in most areas of the Qinling Mountains is at a medium-to-high level, and the area of NDVI is the highest in the range of 0.6–0.8, which account for 61.19%. The areas with NDVI less than 0.4 accounted for only 2.25% of the area, which are mainly distributed in central part of Gansu Province and the northern part of Henan Province.
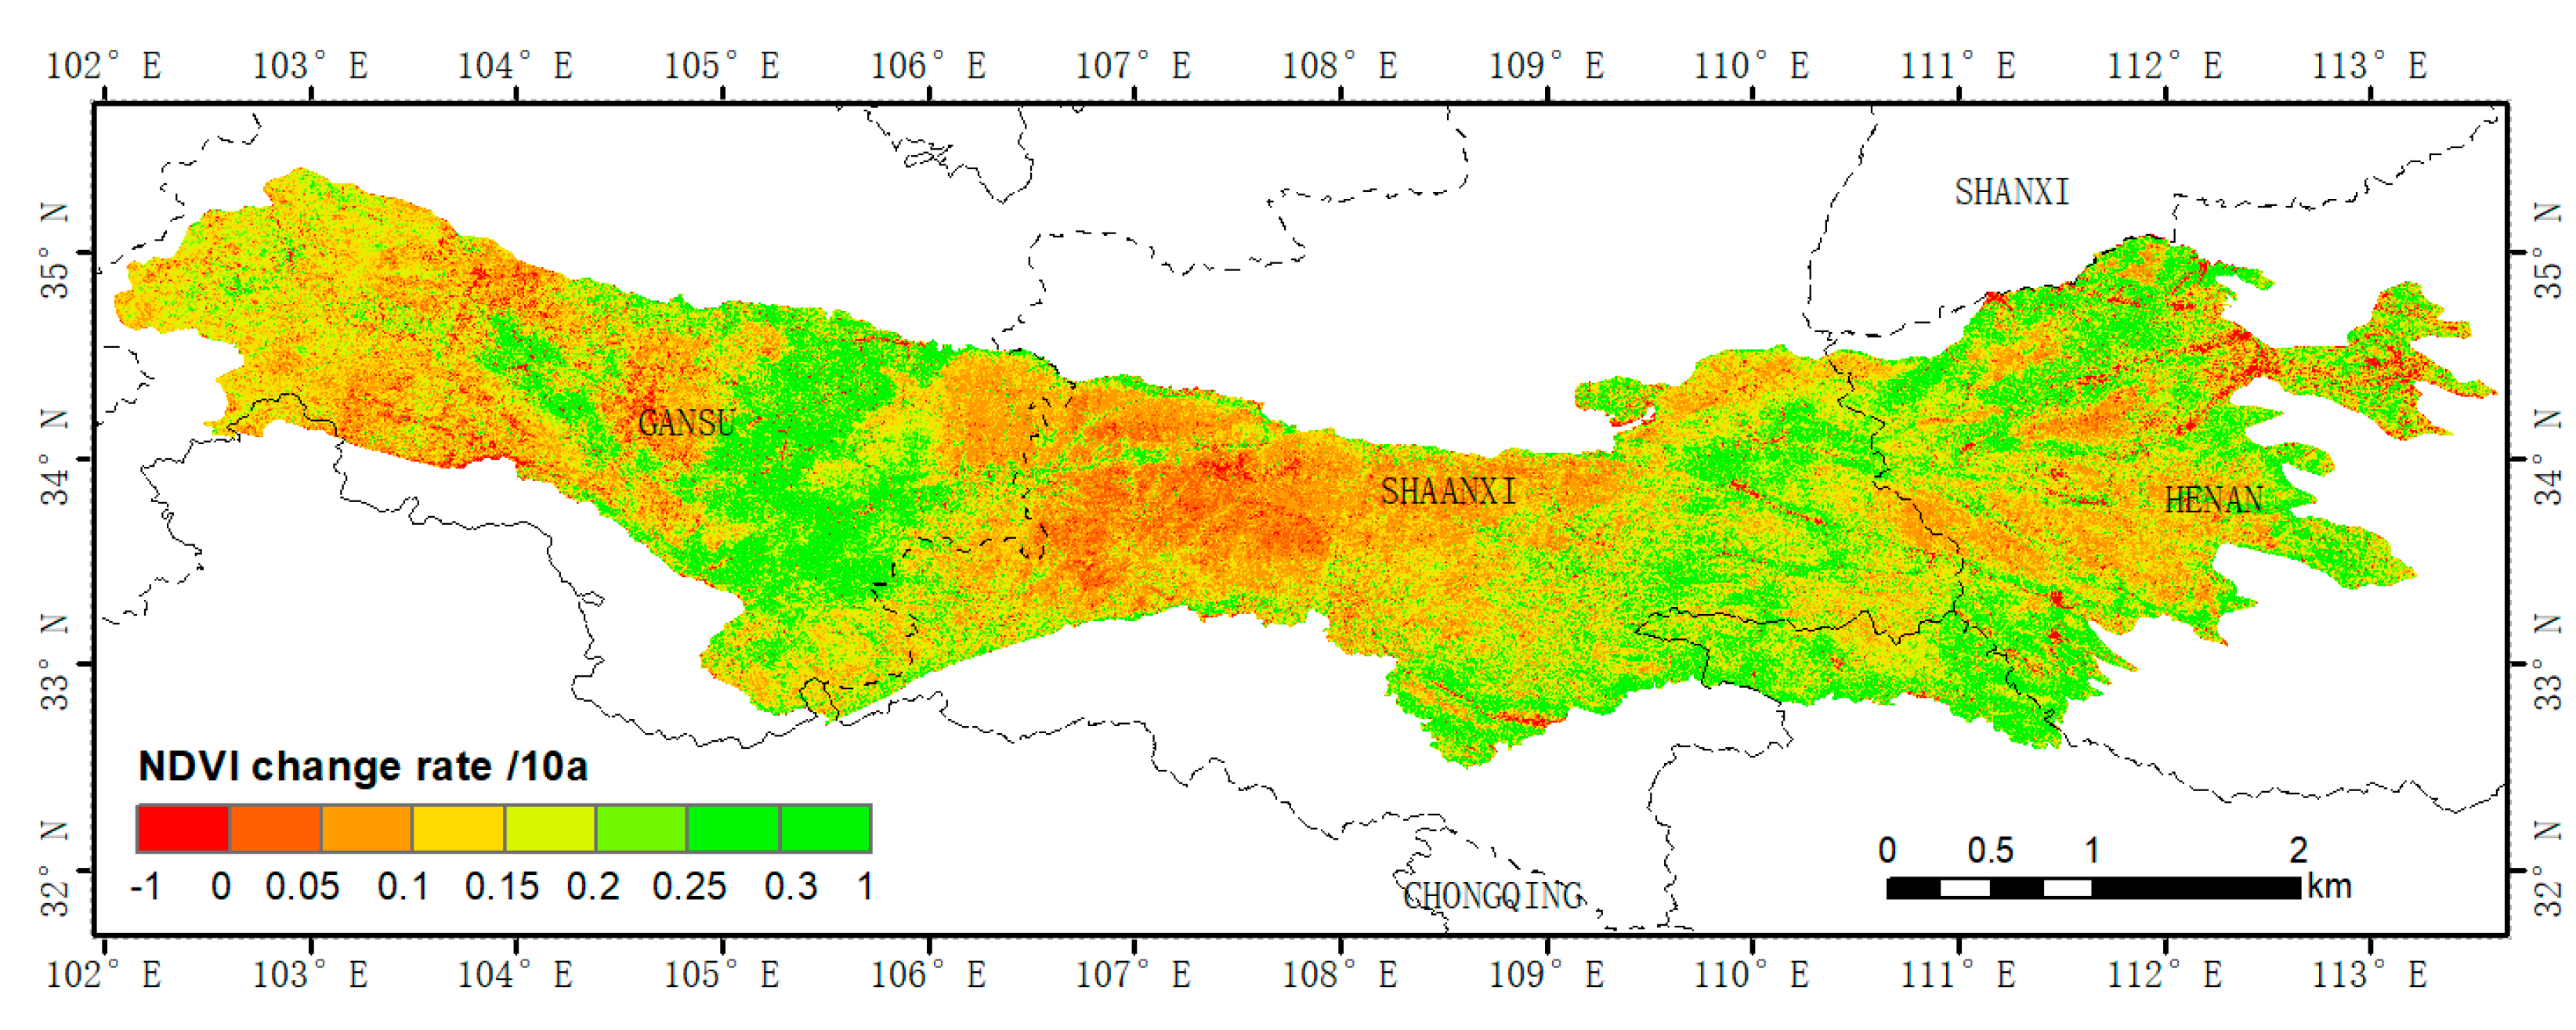
From the perspective of spatial change trends and pixel statistics (Figure 5 and Figure 6), 99.76% of the NDVI area in the study area is increasing. The area with a growth rate greater than 0.2/10a accounts for about 20%, mainly occurring in the area with low NDVI values, such as central part of the Gansu province, the southeastern part of Shaanxi Province, and parts of Henan Province. This is because a large number of artificial forests appeared after the afforestation activities after 1999, which significantly improved vegetation coverage in certain areas.
3.2. NDVI Change Trend
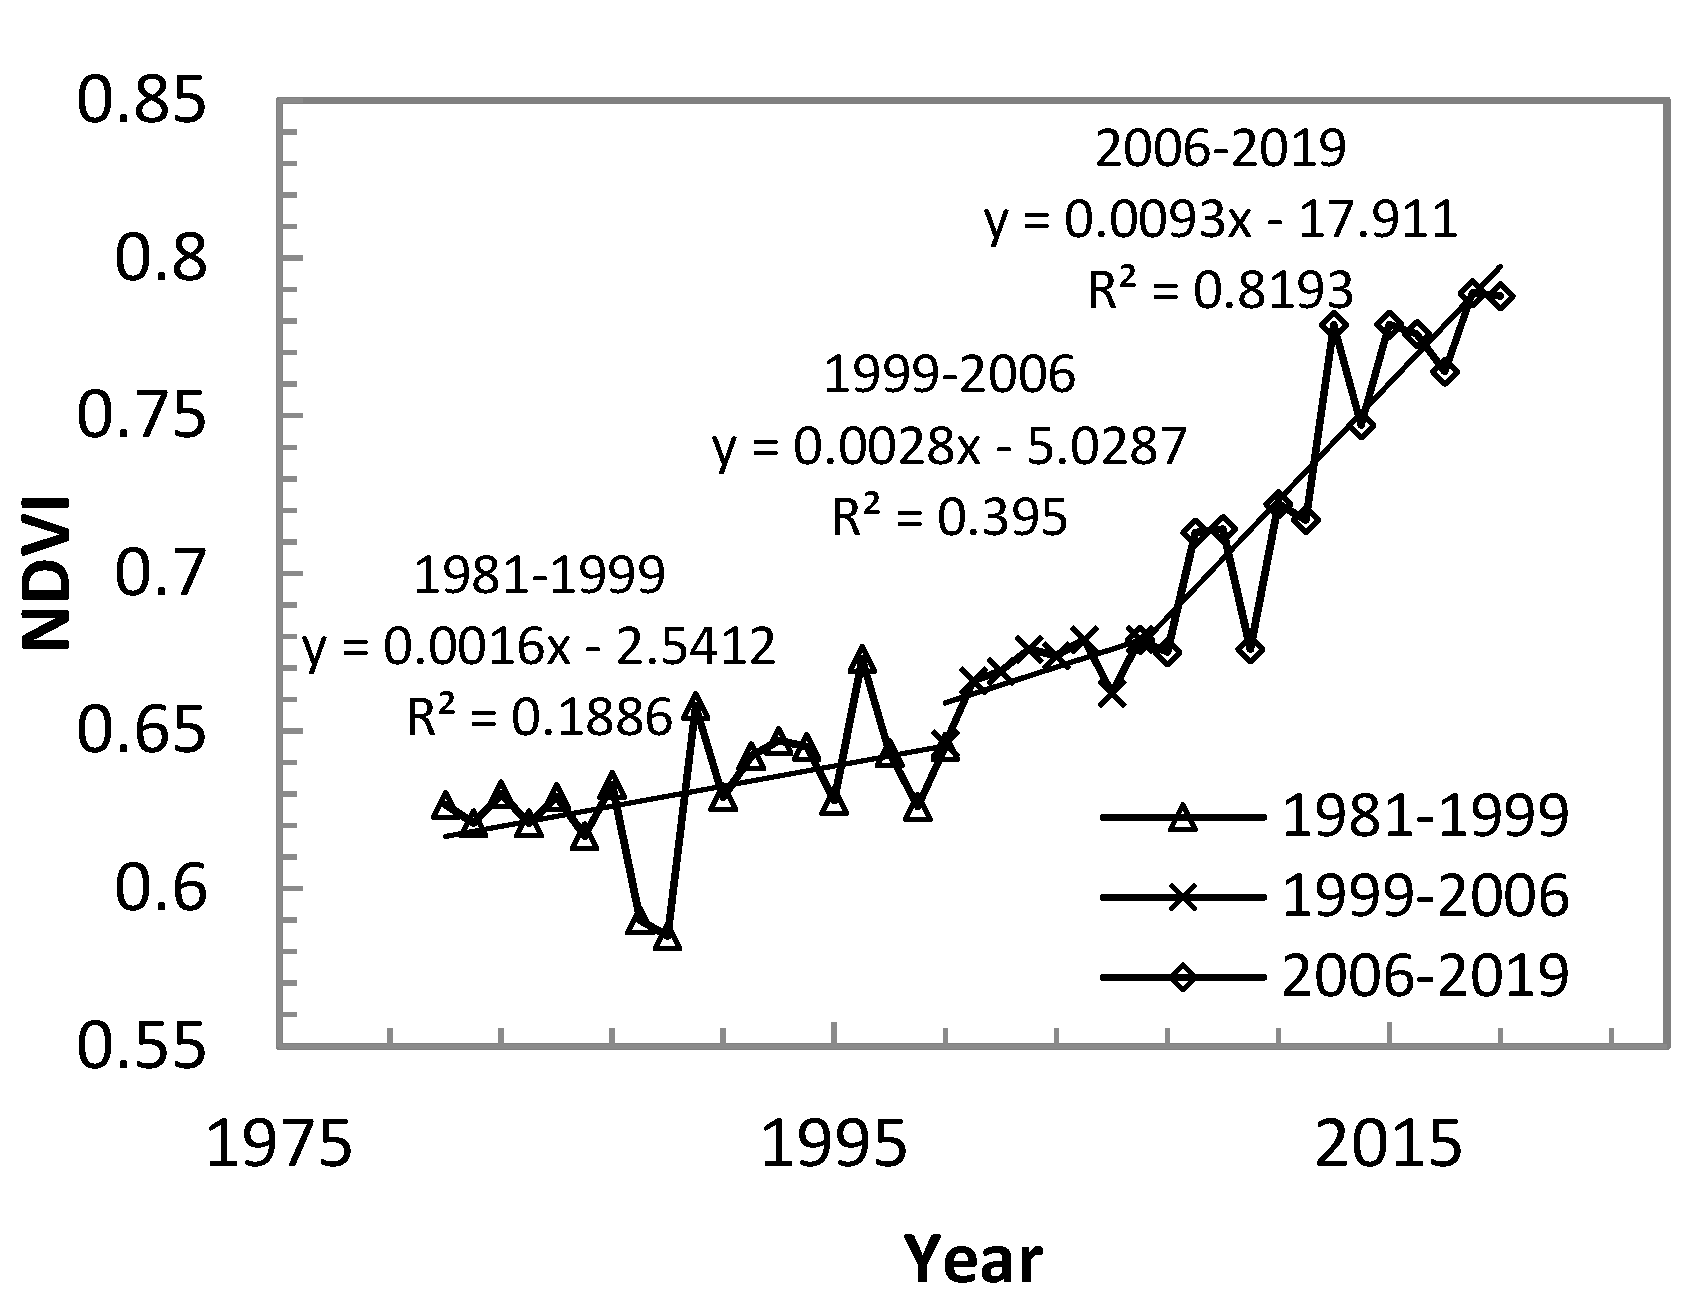
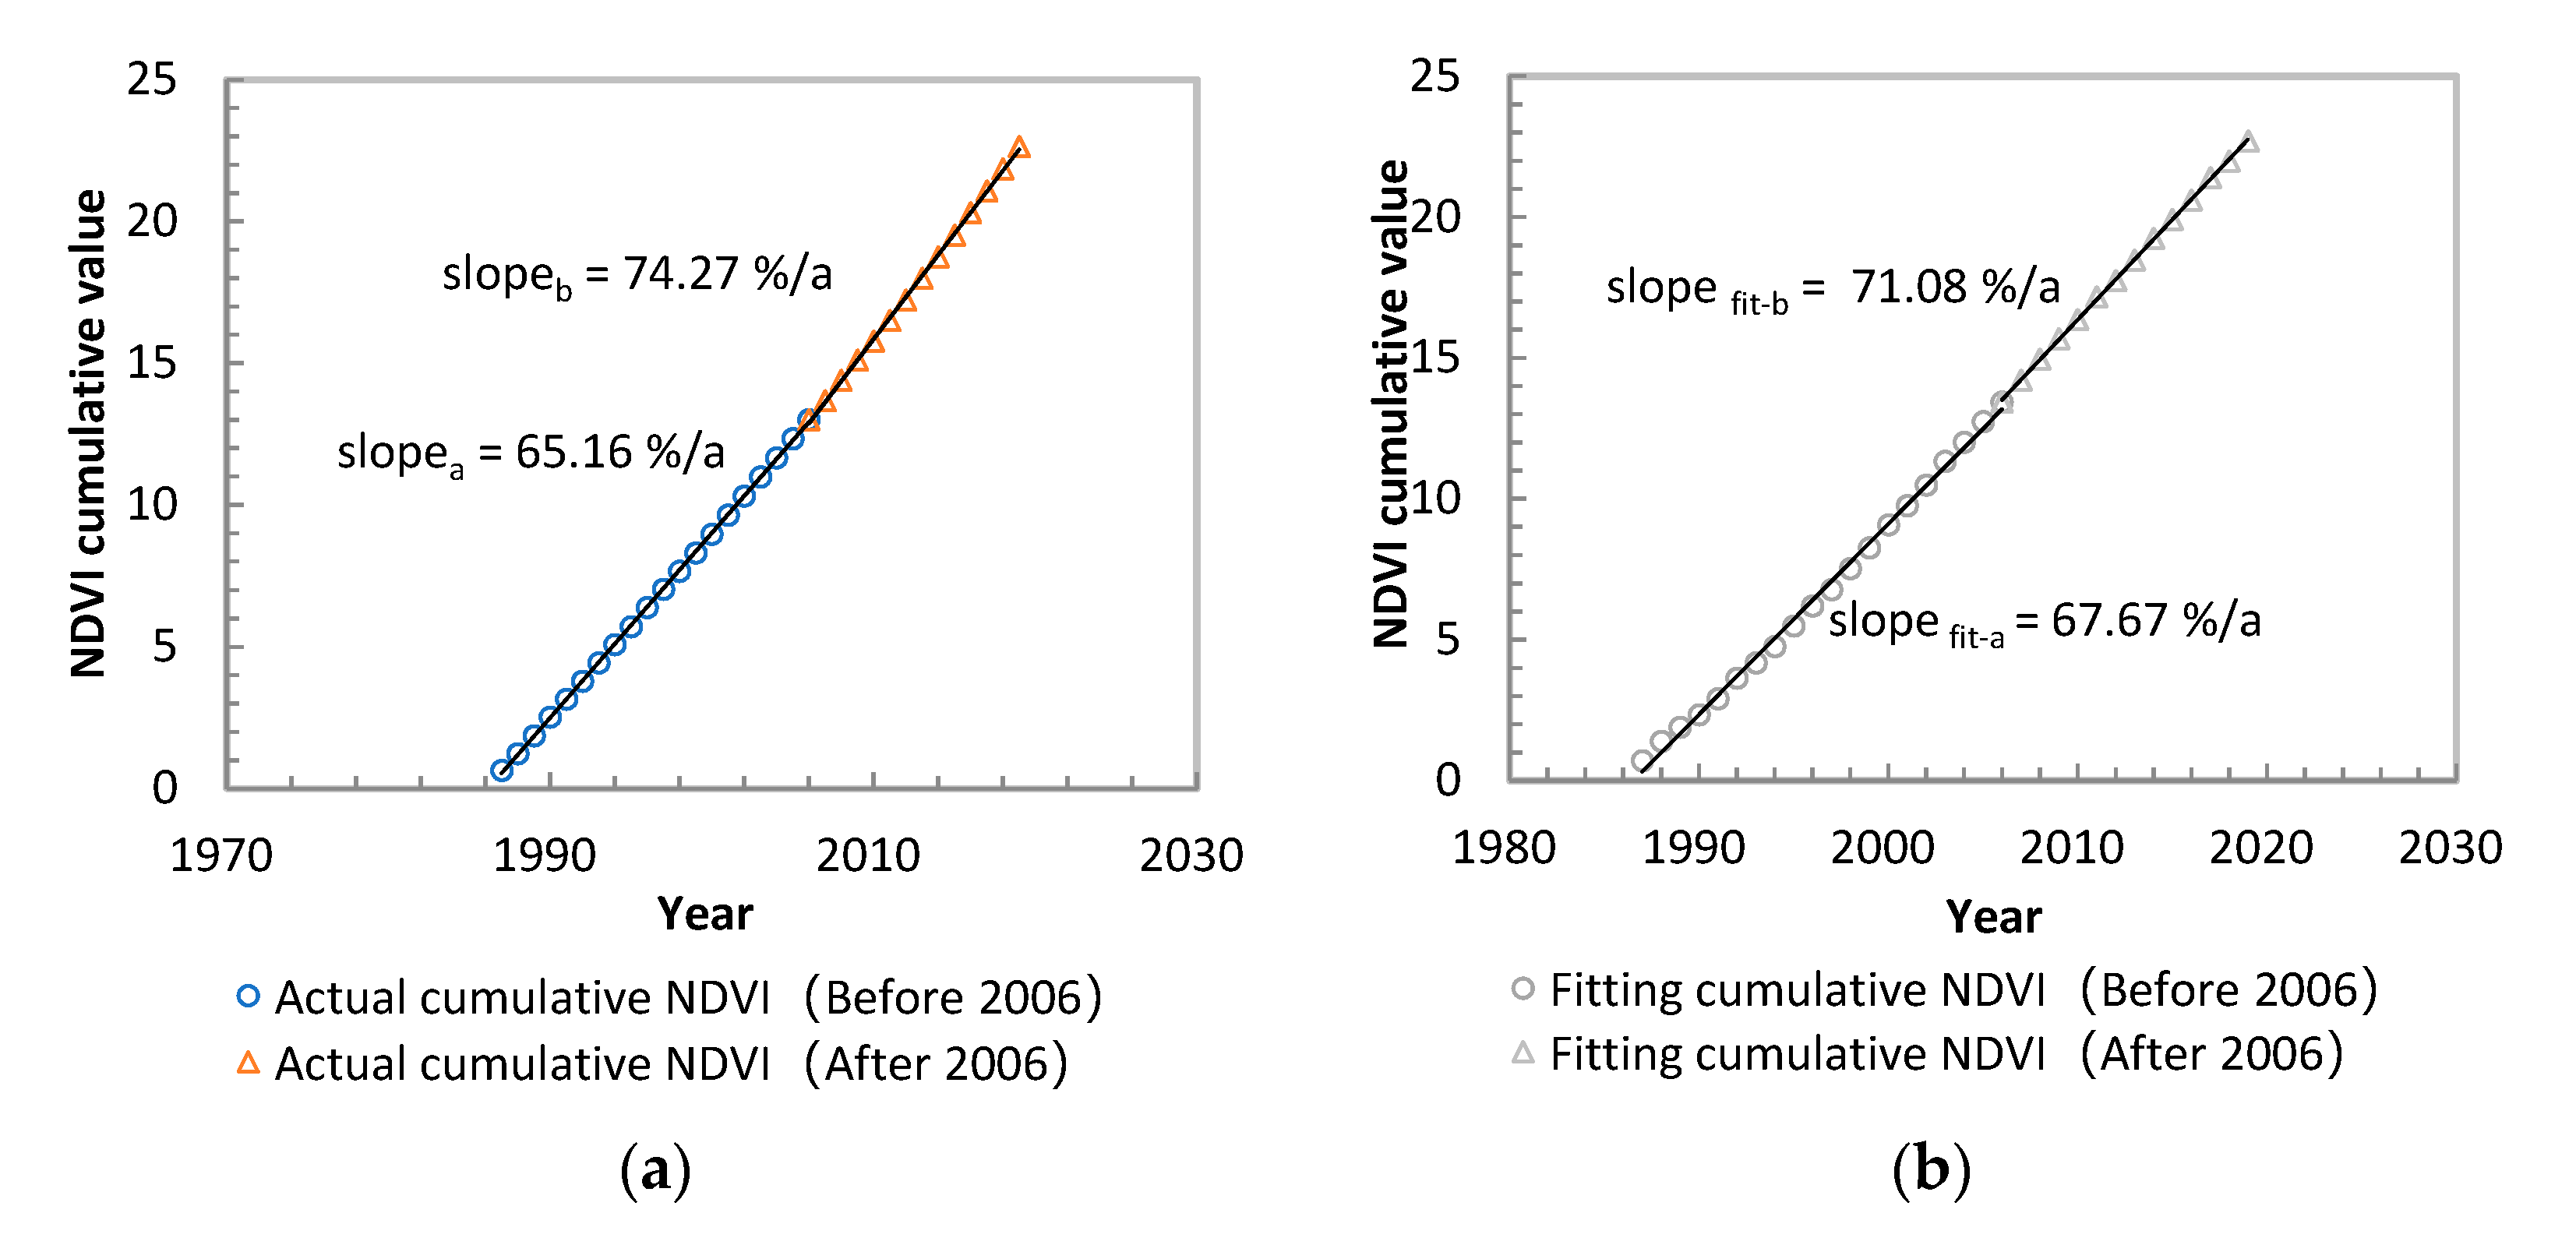
The analysis of the time series of average NDVI during the growing season in the Qinling Mountains from 1981 to 2019 (Figure 7) shows that NDVI in the Qinling Mountains has shown a continuous upward trend from 0.63 in 1981 to 0.78 in 2019. After the implementation of afforestation measures in 1999, the rate of increase in NDVI increased from 0.0016/a in 1981–1999 to 0.0028/a in 1999–2006. After the 2006 mutation year, the NDVI in the Qinling Mountains increased rapidly, and the growth rate of NDVI was 0.0093/a, which was much higher than the growth rate of NDVI in 1981–1999 and 1999–2006 (0.0016/a and 0.0028/a, respectively).
3.3. Climatic Factor Sensitivity Characteristics
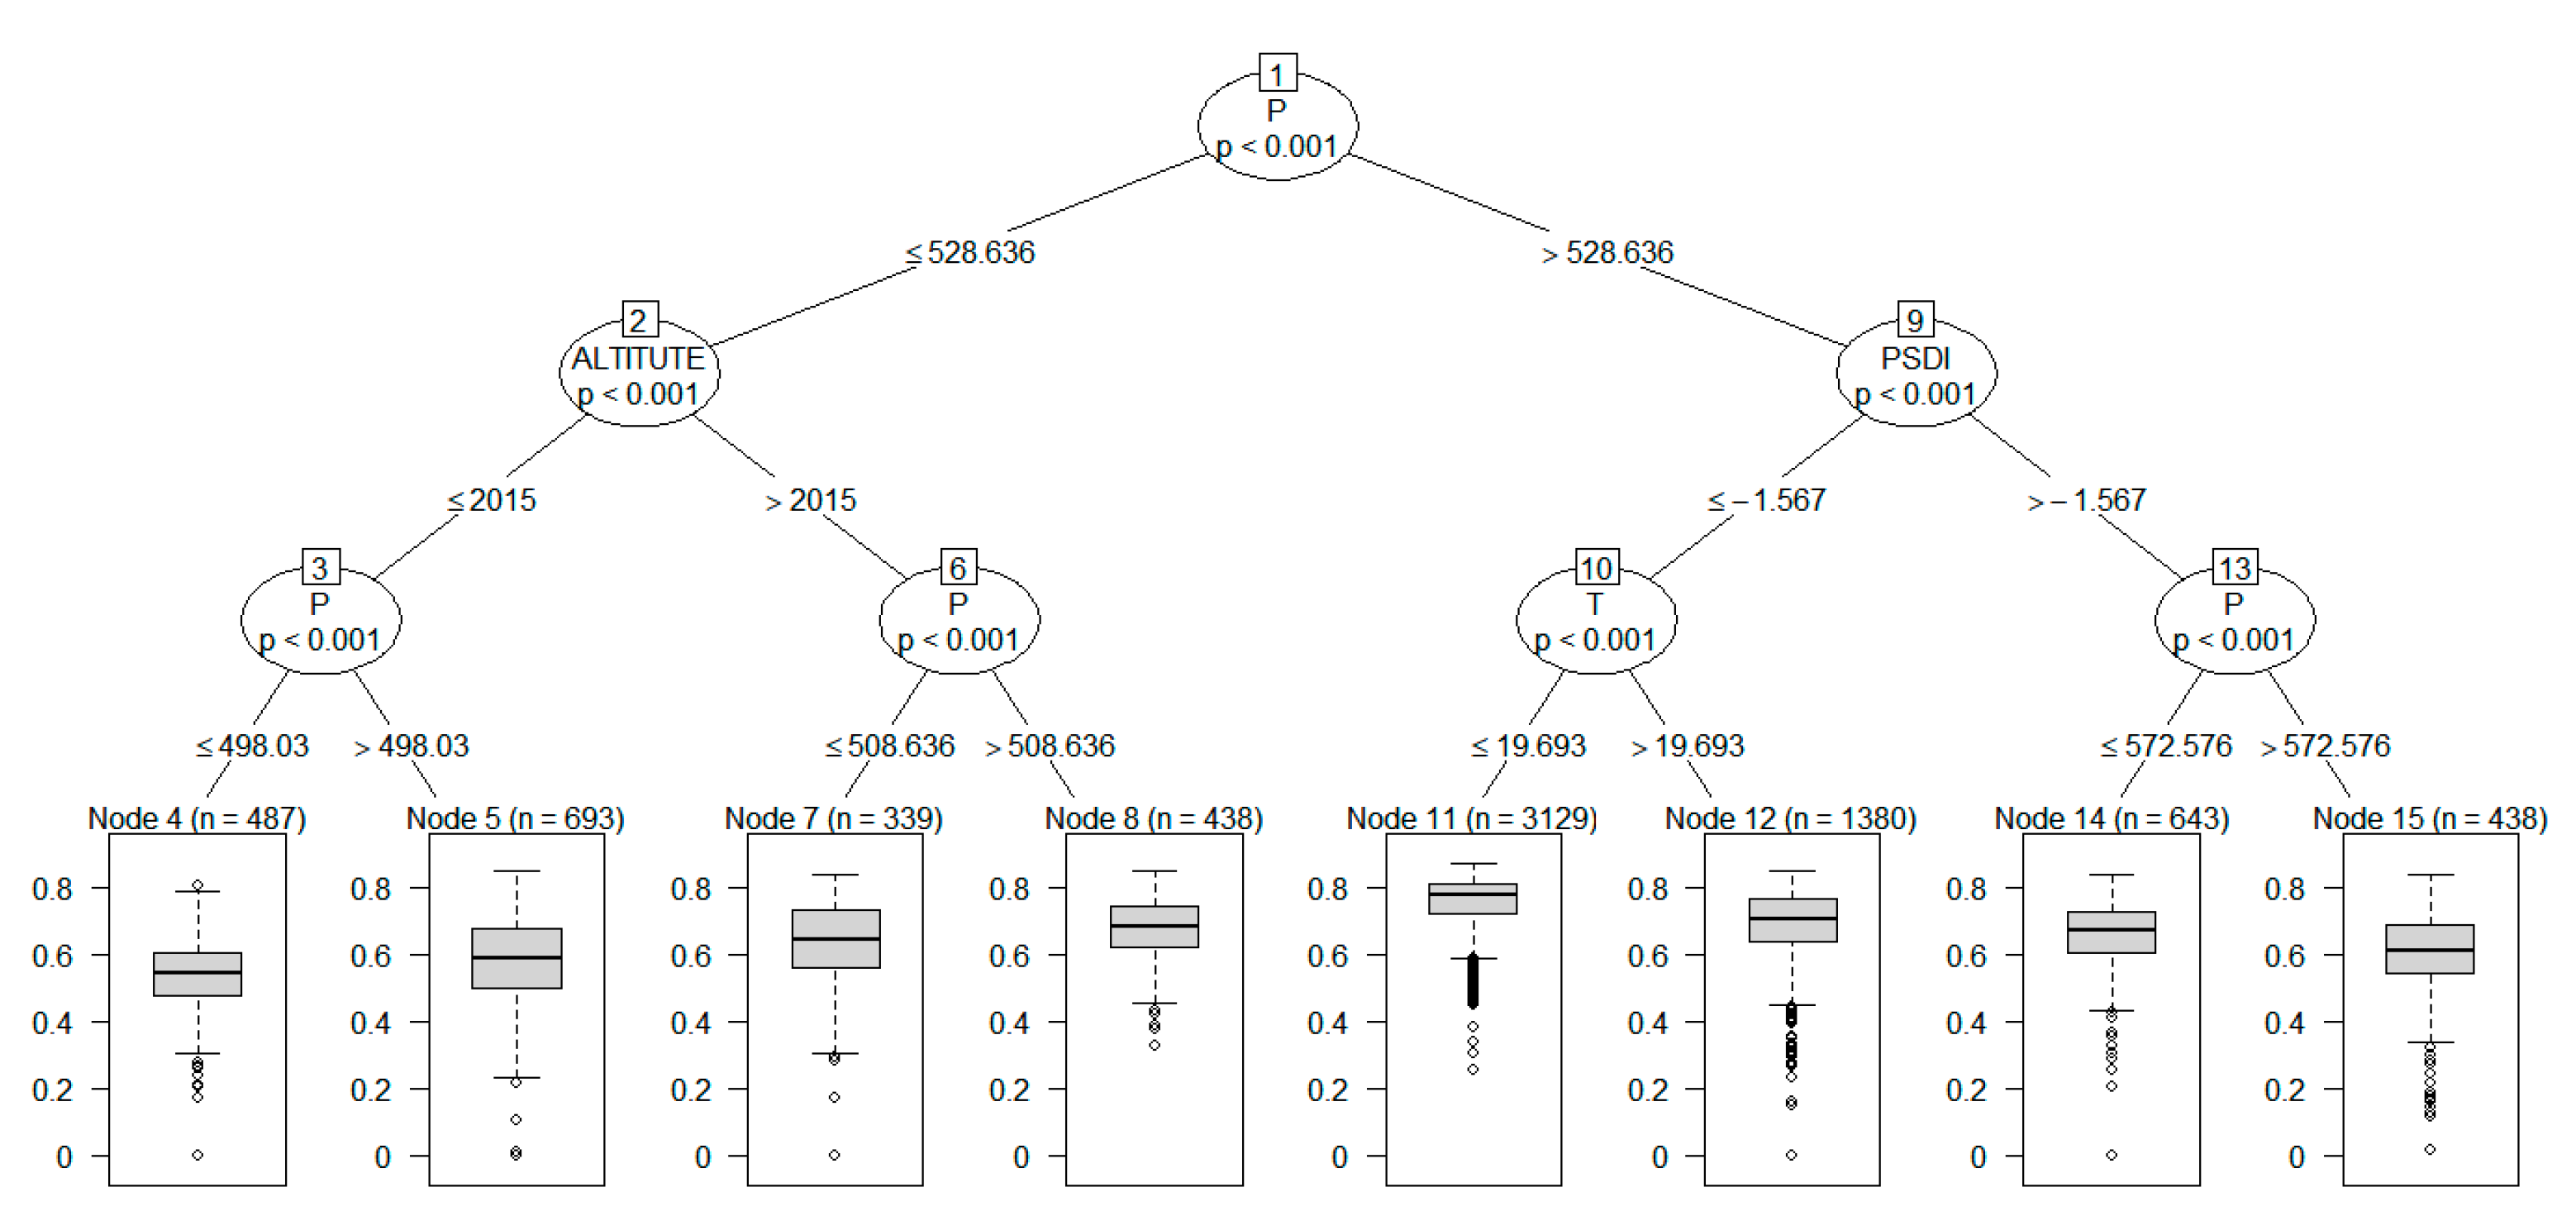
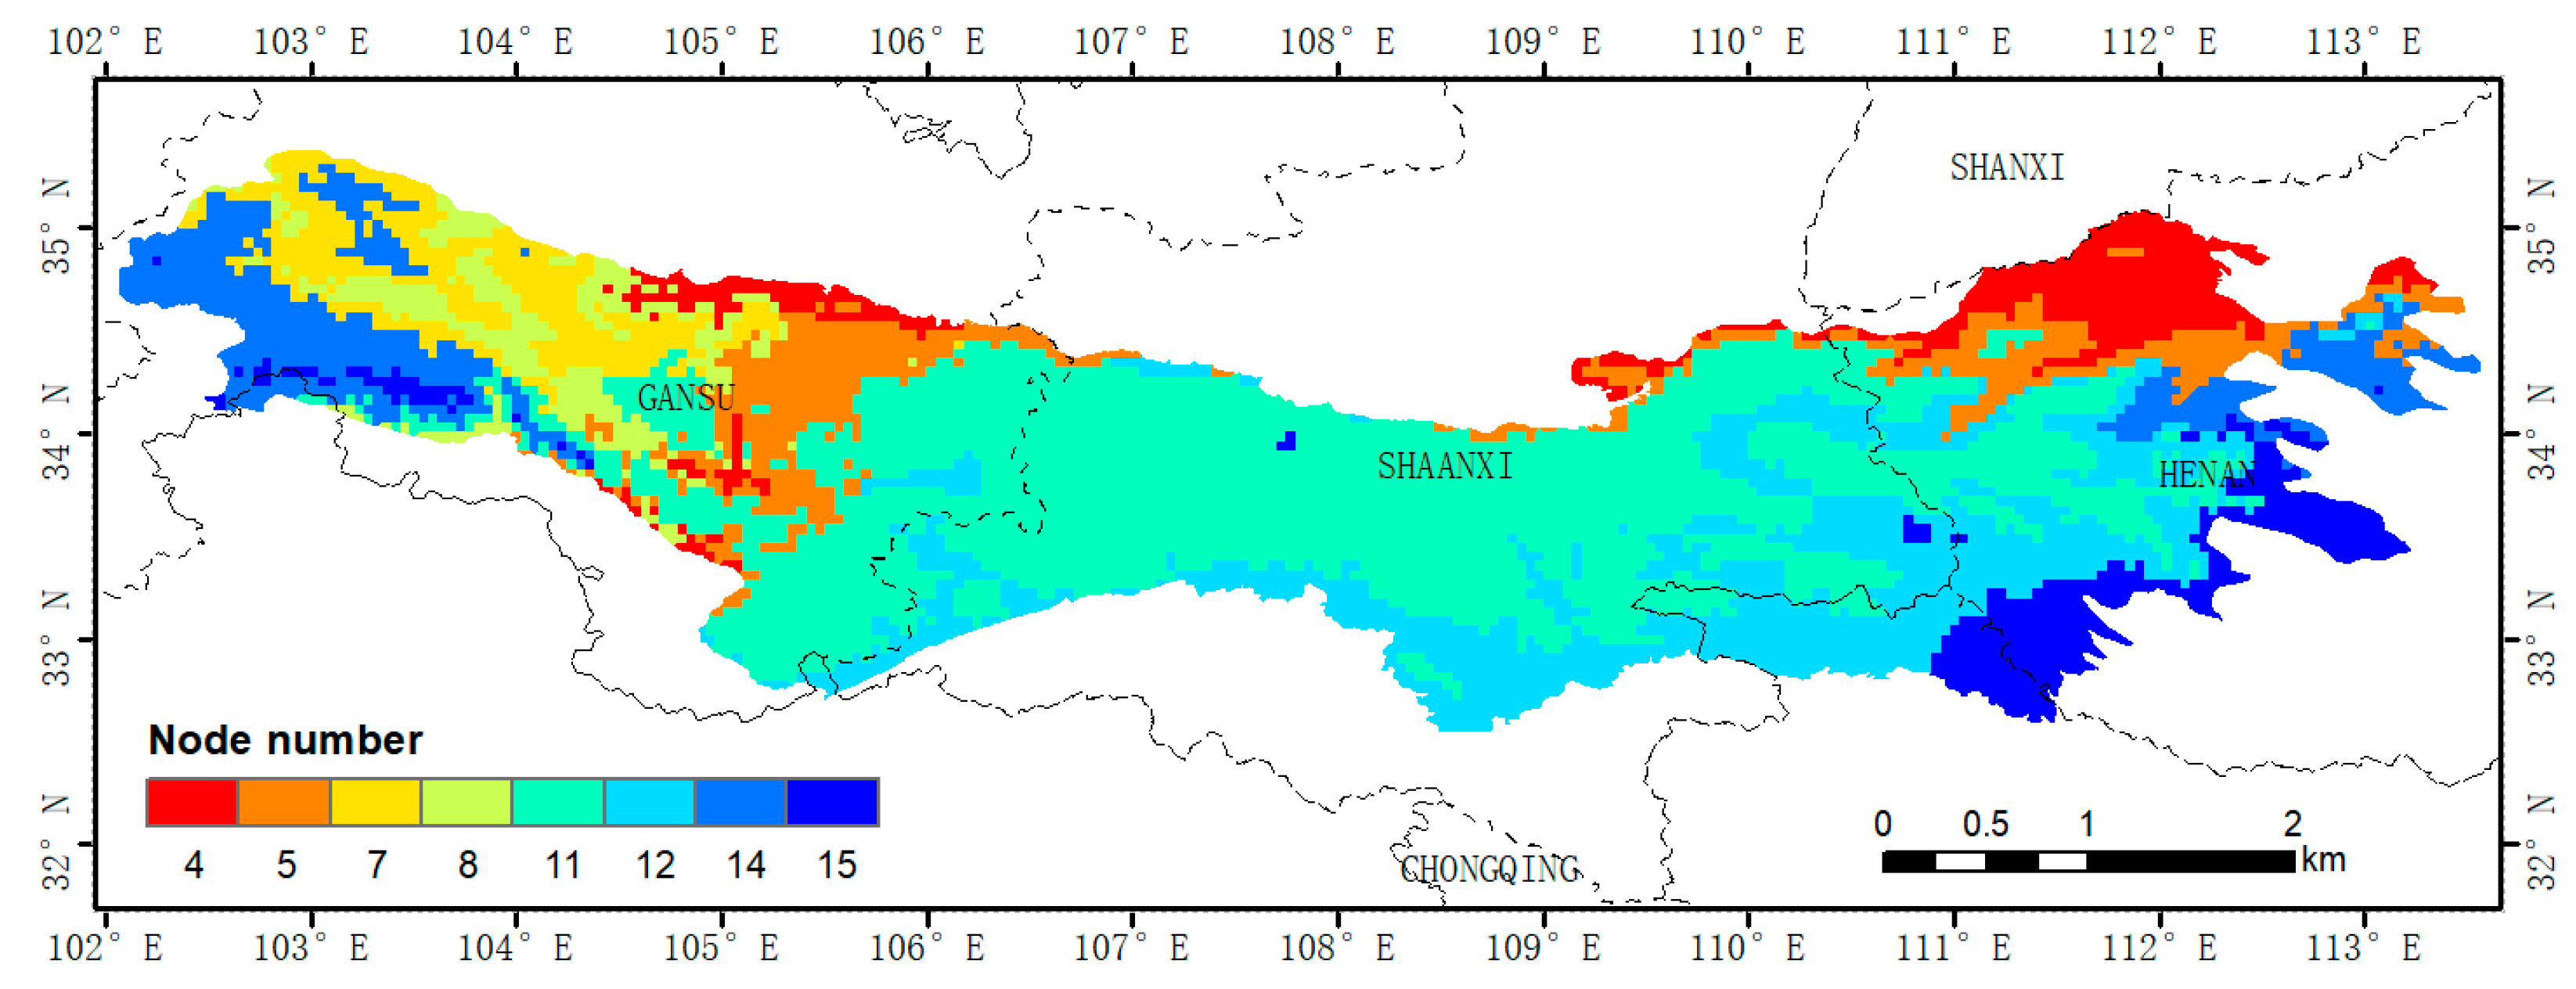
Figure 8 and Figure 9 include NDVI driving factors, Classification and Regression Trees (CART), and the spatial distribution diagrams of the corresponding tree nodes. The results show that the entire study area is significantly affected by precipitation. When precipitation is ≤528.6 mm (node 4, 5, 7, and 8), NDVI in the Northern Qinling Mountains is significantly affected by precipitation and altitude. When precipitation >528.6 mm (node 11, 12, 14, and15), the change of drought index has a significant impact on NDVI. In areas with drought index ≤ −1.57 (node 11 and 12), such as the central part of the study area (southeast of Gansu Province, the entire Shaanxi Province, and central Henan Province), NDVI is obviously affected by temperature. Due to the fact that these areas are drier than the southeastern part of the study area, increases in temperature increased NDVI. When the drought index > −1.567 (node 14 and 15), NDVI is significantly affected by precipitation, which is mainly manifested in the high-altitude area in the western part of the study area and the southern and southeastern areas of the study area; those areas are covered by the grassland, which is significantly affected by precipitation.
3.4. The Relative Contribution of Climate Change and Human Activities to NDVI Changes
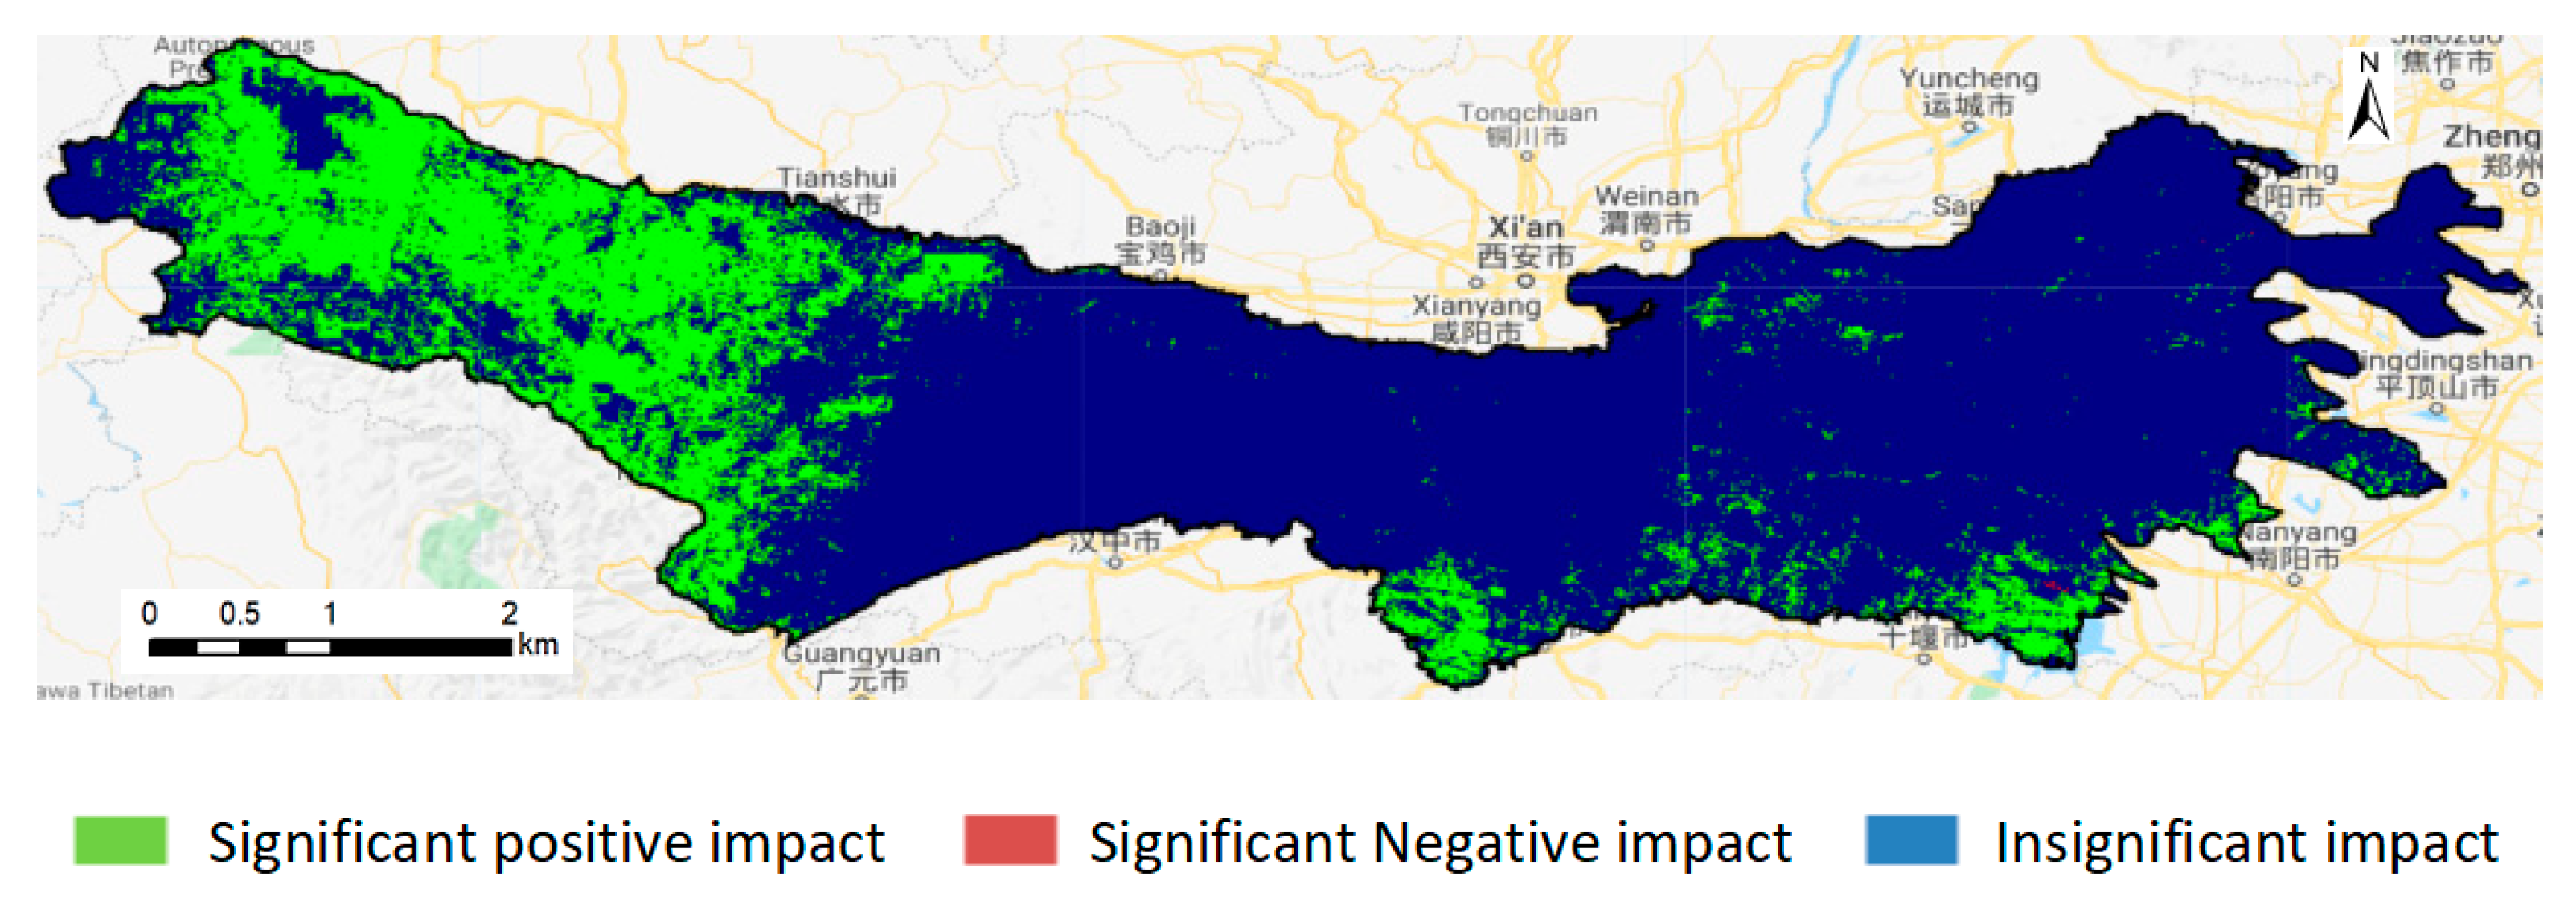
By using the spatial distribution map of residual trend (Figure 10) and the area percentage statistics table (Table 1), it was observed that human activities have played an obvious positive role in the increase in NDVI in the Qinling Mountains. The positive impact area of human activities reached 99.85%, of which the area with significant positive effect (p < 0.001) accounted for 36.49%, mainly distributed in Gansu Province and Southern Henan Province in the Qinling Mountains. The significant negative effect area accounted for only 0.006%, mainly distributed in urban areas and coal mining areas. This shows that human activities have played a positive role in the growth of vegetation in the Qinling Mountains.
Climate change and human activities contributed 36.04% and 63.96% to the change of NDVI, respectively (Figure 11); that is, human activities are the main factors causing NDVI changes.
4. Discussion
4.1. The Relationship between NDVI and Climate in Qinling Mountains
The greening trend of vegetation coverage can be explained by climate change and land cover changes [28]. The impact of various driving factors on vegetation growth at different regional scales is different [29,30]. The sensitivity analysis results of this study show that with the increase in drought and altitude, precipitation has become the main limiting factor for vegetation growth. In view of spatial distribution and change trends of precipitation (Figure 12a,b), precipitation in the Qinling Mountains showed a gradual increase trend from north to south. From the perspective of the change trend, precipitation in the western part of the Qinling Mountains increased significantly, which is a high-altitude area dominated by grassland, and the obvious increase in precipitation is the main reason for the change in NDVI [31]. Some areas of the Qinling Mountains are significantly affected by temperature, and they are mainly distributed in areas dominated by forest, such as the central and southeastern parts of the Qinling Mountains. Combining the spatial distribution and change trends of temperature in the Qinling Mountains (Figure 12c,d), it was observed that the average temperature in these areas for many years was higher, and the temperature increase rate is large, which is the main reason for the increase in NDVI, which is consistent with the results of previous studies [31].
4.2. The Relationship between NDVI and Land Use in Qinling Mountains
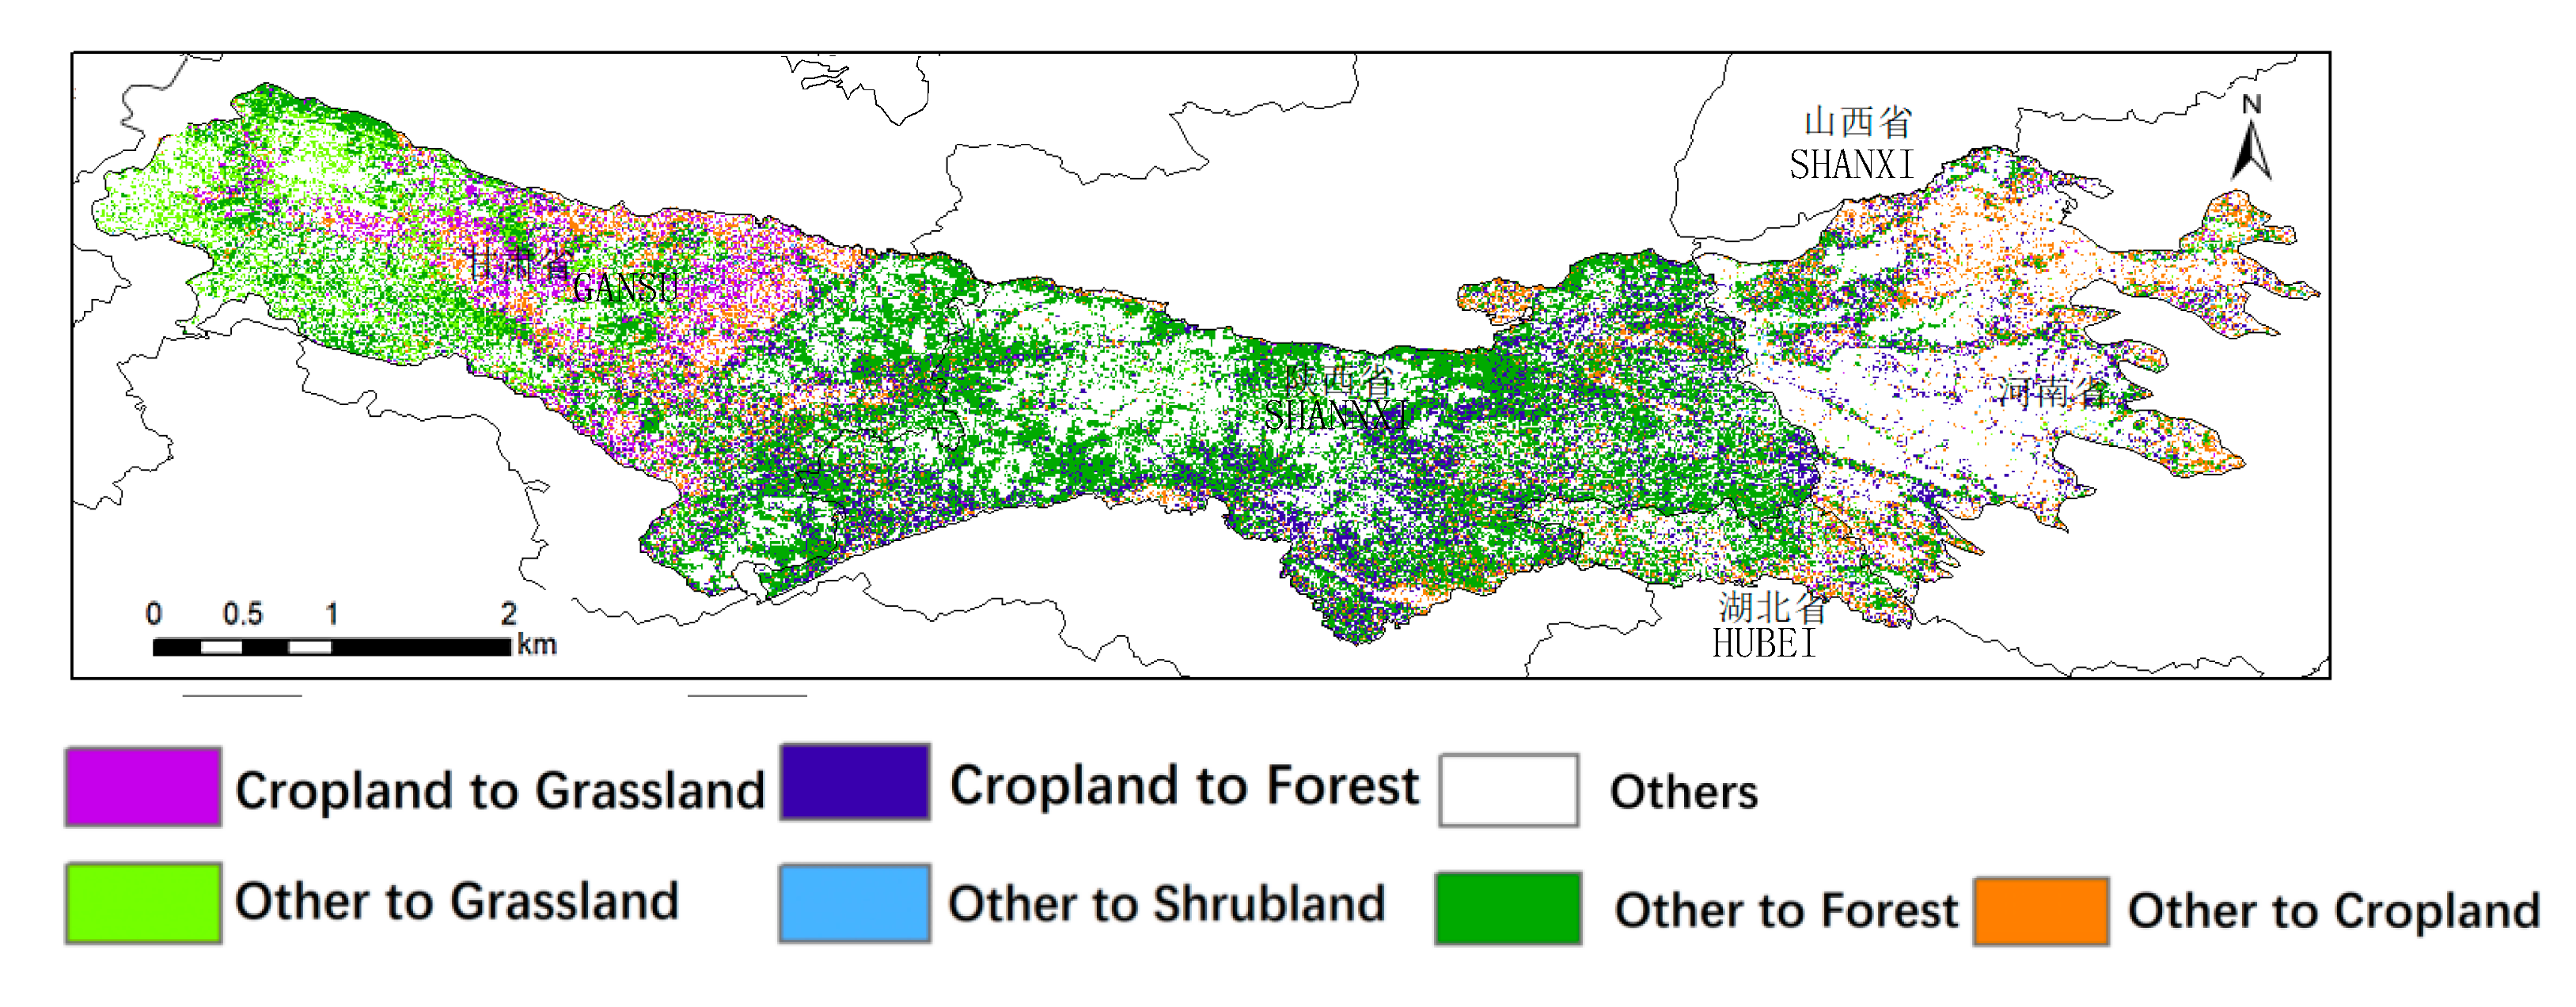
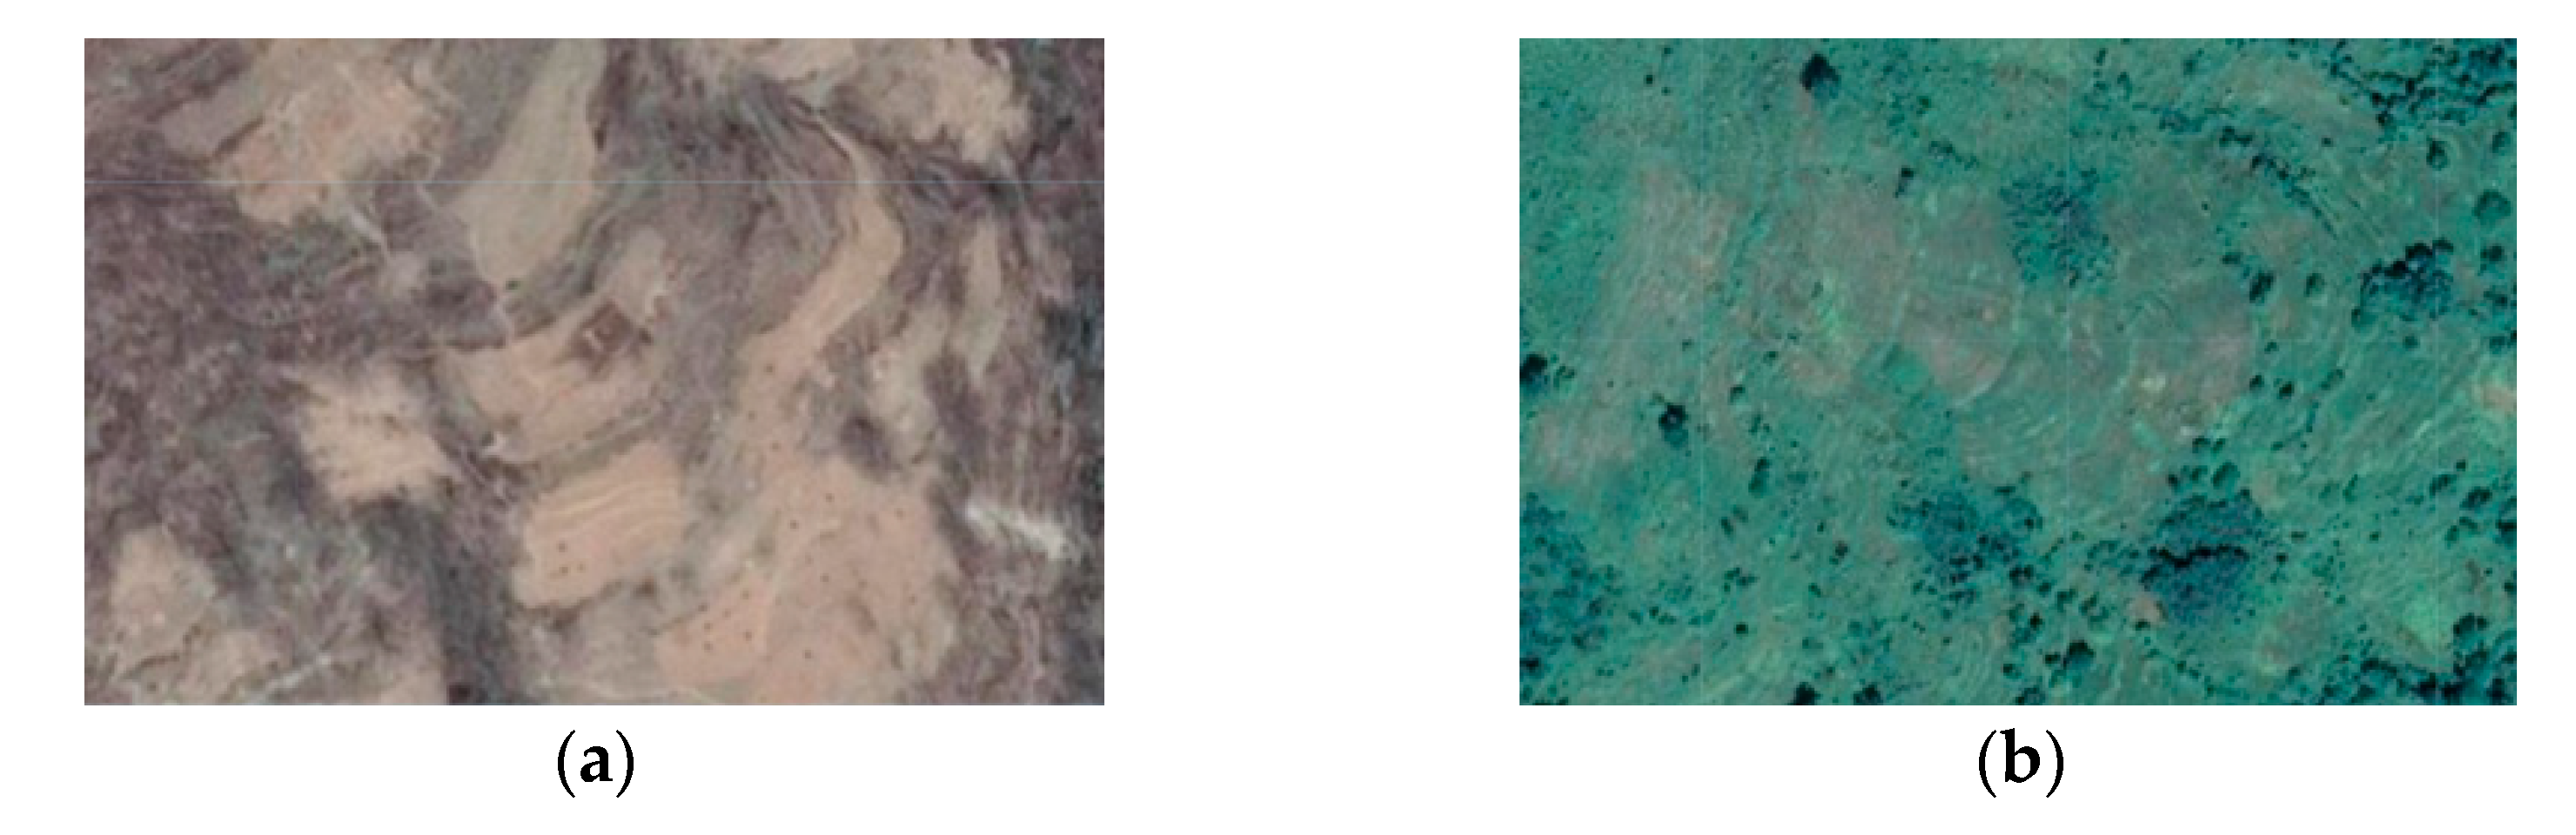
After afforestation in 1999, NDVI in the Qinling Mountains increased significantly, especially in the areas where the low-altitude conversion of farmland to forests was implemented [32]. From the perspective of land use transformation (Figure 13), the land use transition types corresponding to the areas where NDVI has increased significantly mainly include the following: “other land features converted to forest land” and “other land features converted to grassland,” with an area ratio of 38.15% and 6.60%, respectively. “Farmland to forest” and “farmland to grassland” account for 10.15% and 2.94% of the study area, respectively. Combined with Google remote sensing image monitoring, it was found that in the Qinling Mountains in Northern Gansu Province, Northern Henan Province, and parts of Southern and Southeastern Shaanxi Province, these areas have a large number of slope farmland and terraces. After the implementation of soil and water conservation measures, a large number of artificial forests and orchard have appeared, which resulted in an increase in NDVI in the past 32 years (Figure 14). It further explains that after the implementation of afforestation measures, human activities (soil and water conservation measures and changes in land use) have become a key factor affecting the improvement of vegetation in the Qinling Mountains.
4.3. Significance of Research on NDVI Changes in Qinling Mountain
Vegetation coverage affects the conversion of carbon, water, and energy between the atmosphere and the surface, and its level is related to the health of the surface ecosystem [33]. In the critical period of the country’s implementation of Yangtze River protection, Yellow River Basin ecological protection, and high-quality development strategies, the Qinling Mountains, as the watershed and important water conservation area of the two major river basins, have increasingly received widespread attention from society. This paper is based on the Landsat NDVI obtained by GEE, which has a higher resolution than MODIS NDVI and GIMMS NDVI, and can more accurately reflect spatial distribution and changes of vegetation coverage over the years in the Qinling Mountains after returning farmland to forest and grassland.
5. Conclusions
- (1)
- In the past 38 years, the vegetation in the Qinling Mountains has improved significantly. Particularly after 2006, that is, 7–8 years after afforestation measures, NDVI increased rapidly with a growth rate of 0.0093/a, which is much higher than the two time periods of 1987–1999 and 1999–2006;
- (2)
- The NDVI corresponding to areas with a multi-year average NDVI ≤ 0.6 increased significantly from 1987 to 2019, and the growth rate was greater than 0.25/10a. For example, in the southeastern part of Gansu Province, Northern Henan Province, and Southeastern Shaanxi Province, the key reason for the increase in NDVI was the conversion of farmland to forest and grassland. However, in areas where NDVI > 0.6, such as central Shaanxi Province, Gansu Province, and central Henan Province, most of the land use types in these regions have not changed, and the corresponding NDVI growth rate is not large.
- (3)
- NDVI in the central part of Qinling Mountains was significantly affected by precipitation, drought index, and temperature, while NDVI in the west and east was significantly affected by changes in precipitation and altitude. After the implementation of afforestation, human activities have become an important factor in the increase in NDVI, with a contribution rate of 63.96%. From a spatial point of view, the area of the study area that was significantly positively affected by human activities reached 36.49%, mainly distributed in most areas of Gansu Province and Southern Shaanxi Province. The corresponding land use in these areas was transformed from farmland to grassland and forest.
Author Contributions
Data curation, C.H. and Q.Y.; formal analysis, C.H. and H.Z.; resources, Q.Y.; supervision, Q.Y.; validation, C.H. and Q.Y.; visualization, C.H. and H.Z.; writing—original draft, C.H.; writing—review and editing, C.H., H.Z., and Q.Y. All authors have read and agreed to the published version of the manuscript.
Funding
This study was supported by the sub-project of “Pan-Third Pole Environmental Changes and the Construction of Green Silk Road,” a strategic pilot science and technology project of the Chinese Academy of Sciences, “Quantitative Evaluation of Soil Erosion and Regional Prevention and Control Countermeasures” (XDA20040202).
Institutional Review Board Statement
Not applicable.
Informed Consent Statement
Not applicable.
Data Availability Statement
All data, models, and code that support the findings of this study are available from the corresponding author upon reasonable request.
Acknowledgments
The author is grateful to the editor and anonymous reviewers for spending their valuable time on constructive comments and suggestions that improved the quality of the manuscript considerably.
Conflicts of Interest
The authors declare no conflict of interest.
References
- Wu, X.; Sun, X.; Wang, Z.; Zhang, Y.; Liu, Q.; Zhang, B.; Paudel, B.; Xie, F. Vegetation changes and their response to global change based on NDVI in the Koshi river Basin of central Himalayas since 2000. Sustainability 2020, 12, 6644. [Google Scholar] [CrossRef]
- Fang, W.; Huang, S.; Huang, Q.; Huang, G.; Meng, E.; Luan, J. Reference evapotranspiration forecasting based on local meteorological and global climate information screened by partial mutual information. J. Hydrol. 2018, 561, 764–779. [Google Scholar] [CrossRef]
- Kong, D.; Miao, C.; Borthwick, A.G.L.; Lei, X.; Li, H. Spatiotemporal variations in vegetation cover on the Loess Plateau, China, between 1982 and 2013: Possible causes and potential impacts. Environ. Sci. Pollut. Res. 2018, 25, 13633–13644. [Google Scholar] [CrossRef] [Green Version]
- Piao, S.; Fang, J.; Zhou, L.; Guo, Q.; Henderson, M.; Ji, W.; Li, Y.; Tao, S. Interannual variations of monthly and seasonal normalized difference vegetation index (NDVI) in China from 1982 to 1999. J. Geophys. Res. Atmos. 2003, 108, 1–13. [Google Scholar] [CrossRef]
- Robinson, N.P.; Allred, B.W.; Jones, M.O.; Moreno, A.; Kimball, J.S.; Naugle, D.E.; Erickson, T.A.; Richardson, A.D. A dynamic landsat derived normalized difference vegetation index (NDVI) product for the conterminous United States. Remote Sens. 2017, 9, 863. [Google Scholar] [CrossRef] [Green Version]
- Kumar, L.; Mutanga, O. Google Earth Engine applications since inception: Usage, trends, and potential. Remote Sens. 2018, 10, 1509. [Google Scholar] [CrossRef] [Green Version]
- Langner, A.; Miettinen, J.; Kukkonen, M.; Vancutsem, C.; Simonetti, D.; Vieilledent, G.; Verhegghen, A.; Gallego, J.; Stibig, H.J. Towards operational monitoring of forest canopy disturbance in evergreen rain forests: A test case in continental Southeast Asia. Remote Sens. 2018, 10, 544. [Google Scholar] [CrossRef] [Green Version]
- Wang, Y.; Ziv, G.; Adami, M.; Mitchard, E.; Batterman, S.A.; Buermann, W.; Schwantes Marimon, B.; Marimon Junior, B.H.; Matias Reis, S.; Rodrigues, D.; et al. Mapping tropical disturbed forests using multi-decadal 30 m optical satellite imagery. Remote Sens. Environ. 2019, 221, 474–488. [Google Scholar] [CrossRef]
- Pekel, J.-F.; Cottam, A.; Gorelick, N.; Belward, A.S. High-resolution mapping of global surface water and its long-term changes. Nature 2016, 540, 418–422. [Google Scholar] [CrossRef]
- Johnson, D.M. Using the Landsat archive to map crop cover history across the United States. Remote Sens. Environ. 2019, 232, 111–286. [Google Scholar] [CrossRef]
- Ding, M.; Zhang, Y.; Liu, L.; Zhang, W.; Wang, Z.; Bai, W. The relationship between NDVI and precipitation on the Tibetan Plateau. J. Geogr. Sci. 2007, 17, 259–268. [Google Scholar] [CrossRef]
- Gao, Z.Q.; Dennis, O. The temporal and spatial relationship between NDVI and climatological parameters in Colorado. J. Geogr. Sci. 2001, 11, 411–419. [Google Scholar]
- Zhao, X.; Tan, K.; Zhao, S.; Fang, J. Changing climate affects vegetation growth in the arid region of the northwestern China. J. Arid Environ. 2011, 75, 946–952. [Google Scholar] [CrossRef]
- Sheng, R.; Wan, L. Evolution of vegetation coverage and its response to abrupt climate change in the Wuyi Mountains National Nature Reserve. Shengtai Xuebao Acta Ecol. Sin. 2019, 39, 3243–3256. [Google Scholar]
- Zhu, W.B.; Lv, A.F.; Jia, S.F. Study on Spatial Distribution of Vegetation Coverage and Its Affecting Factors in the Qaidam Basin Based on NDVI. Arid. Zone Res. 2010, 27, 691–698. [Google Scholar]
- Zhang, Y.; Xu, G.; Li, P.; Li, Z.; Wang, Y.; Wang, B.; Jia, L.; Cheng, Y.; Zhang, J.; Zhuang, S.; et al. Vegetation change and its relationship with climate factors and elevation on the tibetan plateau. Int. J. Environ. Res. Public Health 2019, 16, 4709. [Google Scholar] [CrossRef] [PubMed] [Green Version]
- Hennig, T.A.; Kretsch, J.L.; Pessagno, C.J.; Salamonowicz, P.H.; Stein, W.L. The shuttle radar topography mission. In Digital Earth Moving; Lecture Notes in Computer Science; Springer: Berlin/Heidelberg, Germany, 2001; Volume 2081, pp. 65–77. [Google Scholar]
- Abatzoglou, J.T.; Dobrowski, S.Z.; Parks, S.A.; Hegewisch, K.C. TerraClimate, a high-resolution global dataset of monthly climate and climatic water balance from 1958–2015. Sci. Data 2018, 5, 170–191. [Google Scholar] [CrossRef] [Green Version]
- Gong, P.; Liu, H.; Zhang, M.; Li, C.; Wang, J.; Huang, H.; Clinton, N.; Ji, L.; Li, W.; Bai, Y.; et al. Stable classification with limited sample: Transferring a 30-m resolution sample set collected in 2015 to mapping 10-m resolution global land cover in 2017. Sci. Bull. 2019, 64, 370–373. [Google Scholar] [CrossRef] [Green Version]
- Bandyopadhyay, A.; Bhadra, A.; Raghuwanshi, N.S.; Singh, R. Temporal trends in estimates of reference evapotranspiration over India. J. Hydrol. Eng. 2009, 14, 508–515. [Google Scholar] [CrossRef]
- Sen, P.K. Estimates of the Regression Coefficient Based on Kendall’s Tau. J. Am. Stat. Assoc. 1968, 63, 1379–1389. [Google Scholar] [CrossRef]
- Tabari, H.; Somee, B.S.; Zadeh, M.R. Testing for long-term trends in climatic variables in Iran. Atmos. Res. 2011, 100, 132–140. [Google Scholar] [CrossRef]
- Saltelli, A.; Tarantola, S.; Chan, K.P.S. A quantitative model-independent method for global sensitivity analysis of model output. Technometrics 1999, 41, 39–56. [Google Scholar] [CrossRef]
- De’ath, G.; Fabricius, K.E. Classification and Regression Trees: A Powerful Yet Simple Technique for Ecological Data Analysis. Ecology 2000, 81, 3178–3192. [Google Scholar] [CrossRef]
- Harper, E.B.; Stella, J.C.; Fremier, A.K. Global sensitivity analysis for complex ecological models: A case study of riparian cottonwood population dynamics. Ecol. Appl. 2011, 21, 1225–1240. [Google Scholar] [CrossRef] [PubMed]
- Evans, J.; Geerken, R. Discrimination between climate and human-induced dryland degradation. J. Arid Environ. 2004, 57, 535–554. [Google Scholar] [CrossRef]
- Guo, Y.Q.; Wang, N.J.; Chu, X.S. Analyzing vegetation coverage changes and its reasons on the Loess Plateau based on Google Earth Engine. China Environ. Sci. 2019, 39, 4804–4811. (In Chinese) [Google Scholar]
- Zhu, Z.; Piao, S.; Myneni, R.B.; Huang, M.; Zeng, Z.; Canadell, J.G.; Ciais, P.; Sitch, S.; Friedlingstein, P.; Arneth, A.; et al. Greening of the Earth and its drivers. Nat. Clim. Chang. 2016, 6, 791–795. [Google Scholar] [CrossRef]
- Song, Y.; Ma, M. A statistical analysis of the relationship between climatic factors and the normalized difference vegetation index in China. Int. J. Remote Sens. 2011, 32, 3947–3965. [Google Scholar] [CrossRef]
- Forzieri, G.; Alkama, R.; Miralles, D.G.; Cescatti, A. Satellites reveal contrasting responses of regional climate to the widespread greening of Earth. Science 2017, 356, 1180–1184. [Google Scholar] [CrossRef] [Green Version]
- Liu, Y.; Lei, H. Responses of natural vegetation dynamics to climate drivers in China from 1982 to 2011. Remote Sens. 2015, 7, 10243–10268. [Google Scholar] [CrossRef] [Green Version]
- Deng, C.H.; Bai, H.Y.; Gao, S.; Liu, R.J.; Ma, X.P.; Huang, X.Y.; Meng, Q. Spatial-temporal Variation of the Vegetation Coverage in Qinling Mountains and Its Dual Response to Climate Change and Human Activities. J. Nat. Resour. 2018, 33, 425–438. (In Chinese) [Google Scholar]
- Gu, Z.; Ju, W.; Li, L.; Li, D.; Liu, Y.; Fan, W. Using vegetation indices and texture measures to estimate vegetation fractional coverage (VFC) of planted and natural forests in Nanjing city, China. Adv. Space Res. 2013, 51, 1186–1194. [Google Scholar] [CrossRef]
Figure 1.
Geographic location of Qinling Mountains.

Figure 2.
Time change sequence diagram of GIMMS and Landsat NDVI in Qinling Mountains.

Figure 3.
Spatial distribution of landcover in the Qin Mountains in 1990 and 2017.

Figure 4.
Spatial distribution of NDVI in Qinling Mountains during 1987–2018.

Figure 5.
NDVI Change rate in Qinling Mountains during 1987–2018.

Figure 6.
The area ratio of NDVI (a) and NDVI changing trend (b) in Qin Mountains during 1987–2019.

Figure 7.
Change trend of NDVI in Qin Mountains (1981–2018).

Figure 8.
NDVI factor interactions derived from the Classification and Regression Trees (CART).

Figure 9.
Spatial representation of the node membership derived from the sensitive analysis.

Figure 10.
Figure10. The spatial distribution of NDVI residuals in Qin Mountains from 1987 to 2019.

Figure 11.
The relationship between the cumulative NDVI and the year. (a) Cumulative actual NDVI. (b) Cumulative fitting NDVI.
Figure 11.
The relationship between the cumulative NDVI and the year. (a) Cumulative actual NDVI. (b) Cumulative fitting NDVI.

Figure 12.
The spatial distribution and change trend of precipitation (a,b) and temperature (c,d) in Qin Mountains from 1987 to 2019. (a) Average precipitation. (b) Precipitation change trend. (c) Average temperature. (d) Temperature change trend.
Figure 12.
The spatial distribution and change trend of precipitation (a,b) and temperature (c,d) in Qin Mountains from 1987 to 2019. (a) Average precipitation. (b) Precipitation change trend. (c) Average temperature. (d) Temperature change trend.

Figure 13.
The distribution of land use transformation from 1990 to 2017 in the Qinling Mountains.

Figure 14.
The comparison figure of vegetation cover change before and after “Grain For Green” project (which obtained from the Google image). (a) Before “Grain For Green” project. (b) After “Grain For Green” project.
Figure 14.
The comparison figure of vegetation cover change before and after “Grain For Green” project (which obtained from the Google image). (a) Before “Grain For Green” project. (b) After “Grain For Green” project.


Table 1.
The Statistics of NDVI residuals in Qinling Mountains from 1987 to 2019 (%).
| Residuals Trend > 0 | Residuals Trend < 0 | Significant Positive | Significant Negative |
|---|---|---|---|
| 99.85 | 0.15 | 36.49 | 0.006 |
Publisher’s Note: MDPI stays neutral with regard to jurisdictional claims in published maps and institutional affiliations. |
© 2021 by the authors. Licensee MDPI, Basel, Switzerland. This article is an open access article distributed under the terms and conditions of the Creative Commons Attribution (CC BY) license (https://creativecommons.org/licenses/by/4.0/).
Share and Cite
MDPI and ACS Style
Huang, C.; Yang, Q.; Zhang, H. Temporal and Spatial Variation of NDVI and Its Driving Factors in Qinling Mountain. Water 2021, 13, 3154. https://doi.org/10.3390/w13223154
AMA Style
Huang C, Yang Q, Zhang H. Temporal and Spatial Variation of NDVI and Its Driving Factors in Qinling Mountain. Water. 2021; 13(22):3154. https://doi.org/10.3390/w13223154
Chicago/Turabian StyleHuang, Chenlu, Qinke Yang, and Hui Zhang. 2021. "Temporal and Spatial Variation of NDVI and Its Driving Factors in Qinling Mountain" Water 13, no. 22: 3154. https://doi.org/10.3390/w13223154
Note that from the first issue of 2016, this journal uses article numbers instead of page numbers. See further details here.