
The Relationship between the Community Structure and Function of Bacterioplankton and the Environmental Response in Qingcaosha Reservoir


1
College of Environmental Science and Engineering, Tongji University, Shanghai 200092, China
2
School of Business, Macau University of Science and Technology, Macau 999078, China
*
Author to whom correspondence should be addressed.
†
These authors contributed equally to this work and should be considered co-first authors.
Water 2021, 13(22), 3155; https://doi.org/10.3390/w13223155
Submission received: 3 October 2021
/
Revised: 4 November 2021
/
Accepted: 5 November 2021
/
Published: 9 November 2021
Abstract
:Phytoplankton and bacterioplankton play a vital role in the structure and function of aquatic ecosystems, and their activity is closely linked to water eutrophication. However, few researchers have considered the temporal and spatial succession of phytoplankton and bacterioplankton, and their responses to environmental factors. The temporal and spatial succession of bacterioplankton and their ecological interaction with phytoplankton and water quality were analyzed using 16S rDNA high-throughput sequencing for their identification, and the functions of bacterioplankton were predicted. The results showed that the dominant classes of bacterioplankton in the Qingcaosha Reservoir were Gammaproteobacteria, Alphaproteobacteria, Actinomycetes, Acidimicrobiia, and Cyanobacteria. In addition, the Shannon diversity indexes were compared, and the results showed significant temporal differences based on monthly averaged value, although no significant spatial difference. The community structure was found to be mainly influenced by phytoplankton density and biomass, dissolved oxygen, and electrical conductivity. The presence of Pseudomonas and Legionella was positively correlated with that of Pseudanabaena sp., and Sphingomonas and Paragonimus with Melosira granulata. On the contrary, the presence of Planctomycetes was negatively correlated with Melosira granulata, as was Deinococcus-Thermus with Cyclotella sp. The relative abundance of denitrifying bacteria decreased from April to December, while the abundance of nitrogen-fixing bacteria increased. This study provides a scientific basis for understanding the ecological interactions between bacteria, algae, and water quality in reservoir ecosystems.
1. Introduction
Qingcaosha Reservoir is the largest salt-avoidance freshwater reservoir in the world. It is an important drinking water source in Shanghai, representing around 50% of the total raw water consumed in this city. However, Qingcaosha Reservoir is located in the Yangtze River Delta, a densely populated area that is currently undergoing rapid economic development. Pollutants from urban development, industrial production, and domestic sewage flow into the Yangtze River estuary and adjacent sea areas [1,2]. The reservoir is prone to eutrophication [3], which increases risks that compromise the safety of the drinking water for residents [4]. It is therefore crucial to ensure good ecological quality and safety of the water for resident health. In recent years, the reservoir water quality has gradually been improved through hydrodynamic regulation, restoration of submerged plants, and biological manipulation through stocking silver carp and bighead carp. Much research has been conducted on the water quality [5], hydrodynamics [6], and zooplankton and phytoplankton [7] in the reservoir area. However, there has been little research on the bacterioplankton in the reservoir.
Water bacteria play an essential role in maintaining ecosystem function and health [8]. Bacteria are the main drivers of biogeochemical cycles [9], acting in concert as producers and decomposers in aquatic ecosystems [10,11], through participation in the circulation of essential elements [12], and facilitating the exchange of matter and energy between the water, plants, animals, and sediments [13]. Bacteria in the water are abundant and widely distributed, displaying a high level of metabolic activity, and their abundance is strongly related to environmental factors [14].
In recent years, the degree of freshwater eutrophication has been increasing. Harmful algae not only endanger aquatic biological safety [15], but also pose a threat to human health. Bacteria play an essential ecological role in the process of eutrophication [16,17]. Bacteria are the primary providers of inorganic nitrogen and phosphorus to phytoplankton, producing the necessary biological compounds that stimulate algal growth [18], and promote the aggregation and degradation of specific algal blooms [19]. At the same time, some bacteria have algae-killing characteristics [20]. Bacteria can regulate interactions between bacteria and algae through quorum sensing [21], and algal blooms can indirectly influence bacterial communities by influencing water quality through inter-species interactions [22].
The community structure of bacterioplankton results from the coupling effects of different factors at different spatial and temporal scales [23]. With the severe evolution of the water environment and the continuous implementation of ecological restoration measures, the bacterial abundance and community composition have gradually become a research hotspot. At present, the bacterioplankton in water that are the main subjects of research are mainly concentrated in the sea, large rivers and lakes, sediments, and riverside soil [24]. There are few studies on the coupling effect of algae, the bacterial community, and physical and chemical factors of the water, especially on the bacterioplankton in drinking water source reservoirs.
For the above reasons, in this research, we monitored the water quality, phytoplankton, and bacterioplankton of Qingcaosha Reservoir in during non-salt tide period. The interactions among water quality, phytoplankton, and bacterioplankton were analyzed through correlation analysis, with the aim of revealing the succession characteristics of phytoplankton and bacterioplankton, and the potential correlations between them. The primary purposes of the study were (1) to explore the temporal and spatial variations in reservoir water quality and phytoplankton; (2) to study the temporal and spatial succession rules of bacterioplankton by means of high-throughput sequencing technology; (3) to analyze the potential coupling of water quality, phytoplankton, and bacterioplankton using correlation analysis and multivariate statistical methods; and (4) to analyze bacterial metabolic changes in the reservoir area by bacterial function prediction. The results of this study will provide an interpretation of the structure and function of the reservoir biogeochemical system at the bacterial level, and lay a foundation for water source protection and ecological management.
2. Materials and Methods
2.1. Sampling Site
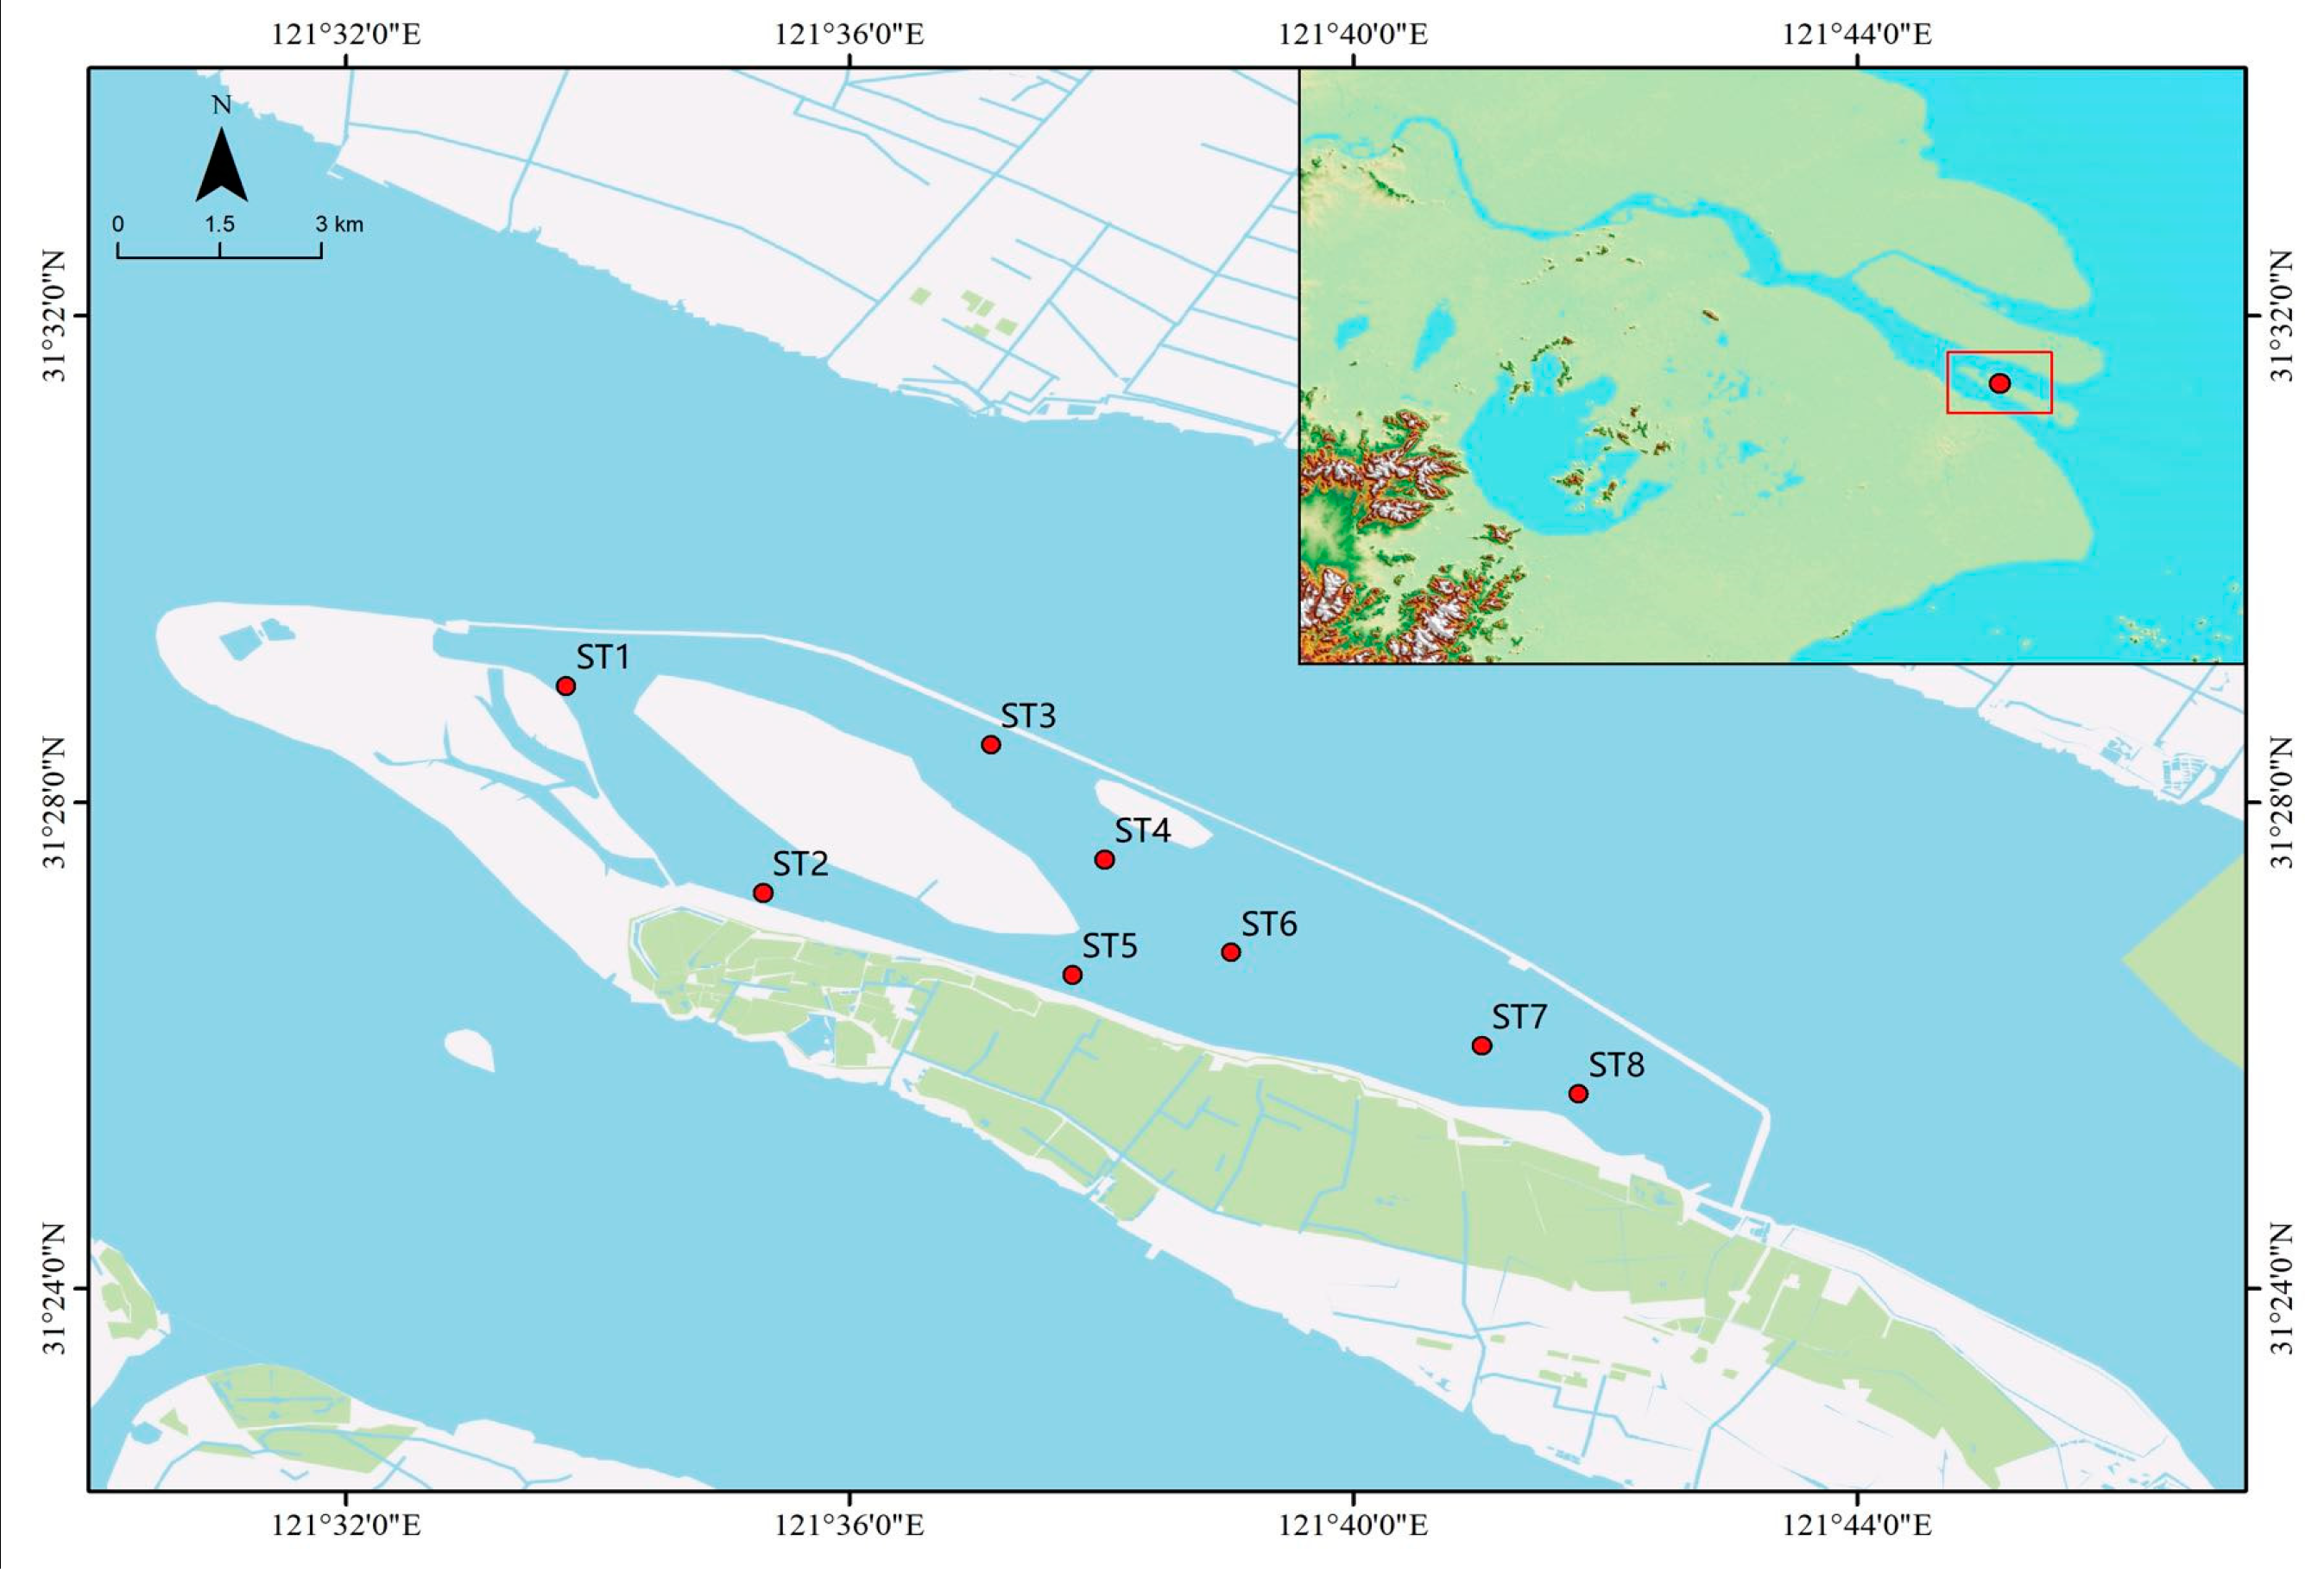
Qingcaosha Reservoir is located on the northwest side of Changxing Island, Chongming District, Shanghai, China. The total area of the reservoir is 66.15 km2, the total storage capacity is 527 million m3, and the designed daily water supply is 7.19 million m3. The reservoir is a light-storage and salt-avoidance reservoir, with water diversion and drainage of the reservoir area controlled by the gates on the northwest (upstream) and northeast (downstream) sides. In this study, eight stations (ST1–ST8) were set up in Qingcaosha Reservoir (Figure 1). Sampling was conducted mid-monthly in the period from April to December 2019.
2.2. Sample Collection and Determination of Physical and Chemical Indexes of Water Quality
A columnar water collector was used to collect 2 L water from the depth of 0–0.5 m, and each sample was taken three times in parallel. Dissolved oxygen (DO), electrical conductivity (Cond), and pH were measured using a multi-parameter water quality analyzer (YSI, EXO, Yellow Springs, Ohio, USA), and a SAN++ continuous flow analyzer (Skalar, SAN++, Breda, North Brabant, NL,) was used to determine the mass concentrations of total phosphorus (TP), total nitrogen (TN), ammonia nitrogen (NH4+-N), and nitrate nitrogen (NO3−-N). Chemical oxygen demand (COD) was determined by the potassium dichromate reflux method (SHIMADZU, UV 1900, Nakagyo-ku, JPN). Chlorophyll a (Chl-a) concentration was determined through spectrophotometry (SHIMADZU, UV 1900, Nakagyo-ku, JPN). The water transparency (SD) was measured using a Secchi disc.
2.3. Collection and Identification of Phytoplankton
A 100 mL water sample was fixed with Lugol’s solution and preserved for phytoplankton counting. The species of phytoplankton were identified and counted using an inverted microscope. After the concentrated sample was shaken evenly, 0.1 mL was taken, and added to a 0.1 mL counting box. A 22 mm × 22 mm cover glass was used. The number of algal cells was determined through observation in 100 fields of vision. For each species, the cell size, i.e., volume, was estimated based on the cell morphology and direct measurement of the main cell dimensions in more than 25 randomly selected individuals. When size differences were observed within a species, the individuals of that species were divided into several cell sizes to determine the cell volume. The biomass of each species was calculated assuming a wet weight density of 1 g·cm−3 (abundance × cell volume) [25], and the total biomass of phytoplankton was calculated as the total biomass of all present species.
2.4. DNA Extraction and High-Throughput Sequencing
The DNA extract was checked on 1% agarose gel, and DNA concentration and purity were determined using a NanoDrop 2000 UV–Vis spectrophotometer (Thermo Scientific, Wilmington, DE, USA). The hypervariable V3–V4 region of the bacterial 16S rRNA gene were amplified with primer pairs 338F (5’-ACTCCTACGGGAGGCAGCAG-3’) and 806R (5’-GGACTACHVGGGTWTCTAAT-3’), using an ABI GeneAmp® 9700 PCR thermocycler (ABI, Vernon, CA, USA). PCR reactions were performed in triplicate. Purified amplicons were pooled in equimolar amounts and paired-end sequenced on an Illumina MiSeq PE300 platform (Illumina, San Diego, CA, USA), according to the standard protocols by Majorbio Bio-Pharm Technology Co. Ltd. (Shanghai, China).
2.5. Data Analysis
2.5.1. Bioinformatics Analysis
The raw 16S rRNA gene sequencing reads were demultiplexed, quality-filtered by fastp (version 0.20.0) [26], and merged by FLASH (version 1.2.7) [27], according to the default criteria. Operational taxonomic units (OTUs) with 97% [28] similarity cutoff were clustered using UPARSE (version 7.1) [29], and chimeric sequences were identified and removed. The taxonomy of each OTU representative sequence was analyzed using RDP Classifier (version 2.2) [30] against the 16S rRNA database (Silva v138), with a confidence threshold of 0.7.
2.5.2. Biodiversity Analysis
The richness and diversity of microbial communities were reflected by alpha diversity analysis of a single sample. The Shannon index was chosen as the index of community diversity. The similarity or difference of community composition of samples from different groups was studied by beta diversity analysis of multiple samples, and was described using principal co-ordinates analysis (PCoA). A statistical analysis and mapping were carried out using R language (version 3.3.1). The dominant species of phytoplankton was determined based on the McNaughton dominance index (Y) [31], where Y > 0.02 indicated the species was dominant.
2.5.3. Statistical Analysis
The Student–Newman–Keuls (SNK-q) method was used to describe the differences in the physical and chemical factors of the assessed water. The Wilcoxon signed-rank test method was used for the non-parametric test of two groups of samples to evaluate the significance level of differences in species abundance between groups. The relationship between environmental factors and sample grouping was described using distance-based redundancy analysis (db-RDA). Correlation heatmap analysis was used to describe the relationship between environmental factors and specific species (genus level). The correlation analysis was based on the R (version 3.3.1) stats package, vegan package, and heatmap package. The species correlation network was constructed using Network software for two-factor network analysis, to describe the interspecies correlation.
2.5.4. Functional Predictive Analysis
PICRUSt (Phylogenetic Investigation of Communities by Reconstruction of Unobserved States) software was used to predict the function of bacterioplankton. The function and abundance information of bacteria in the samples were obtained by comparing the EggNOG database (Evolutionary Genealogy of Genes: Non-supervised Orthologous Groups) and KEGG database (Kyoto Encyclopedia of Genes and Genomes). By comparison with the FAPROTAX database, the specific metabolic or ecological functions of samples were described, especially regarding the sulfur, nitrogen, hydrogen, and carbon cycling functions in marine and lake biogeochemical processes.
3. Results and Analysis
3.1. Physical and Chemical Properties of Qingcaosha Reservoir Water
The average value and variation range of the physical and chemical environmental factors at eight sampling points in the reservoir from April to December 2019 were compared. Table 1 shows that the concentrations of total phosphorus (TP), total nitrogen (TN), ammonium nitrogen (NH4+-N), and nitrate nitrogen (NO3−-N) gradually decreased from the beginning to the end of the reservoir (ST1–ST8). The concentration range of total phosphorus (TP) was 0.08–0.43 mg/L, and the average concentration was 0.18 mg/L. The concentration range of total nitrogen (TN) was 0.64–2.46 mg/L, and the average concentration was 1.54 mg/L. The concentration range of nitrate nitrogen (NO3−-N) was 0.515–1.63 mg/L, and the average concentration was 1.1 mg/L. The concentration range of ammonia nitrogen (NH4+-N) was 0.02–0.064 mg/L, and the average concentration was 0.016 mg/L. Chlorophyll a (Chl-a) and transparency (SD) showed a gradual upward trend from the beginning to the end of the reservoir. The annual variation range of chlorophyll a (Chl-a) was 1.22–42.39 μg/L, and the variation range of transparency (SD) was 15–126 cm. There was no significant difference in environmental factors at other points (p > 0.05). The annual variation range of pH was 6.36–10.63, and there was little interannual variation. The interannual variation of COD was stable, with an average of 19 mg/L.
3.2. Community Structure of Phytoplankton
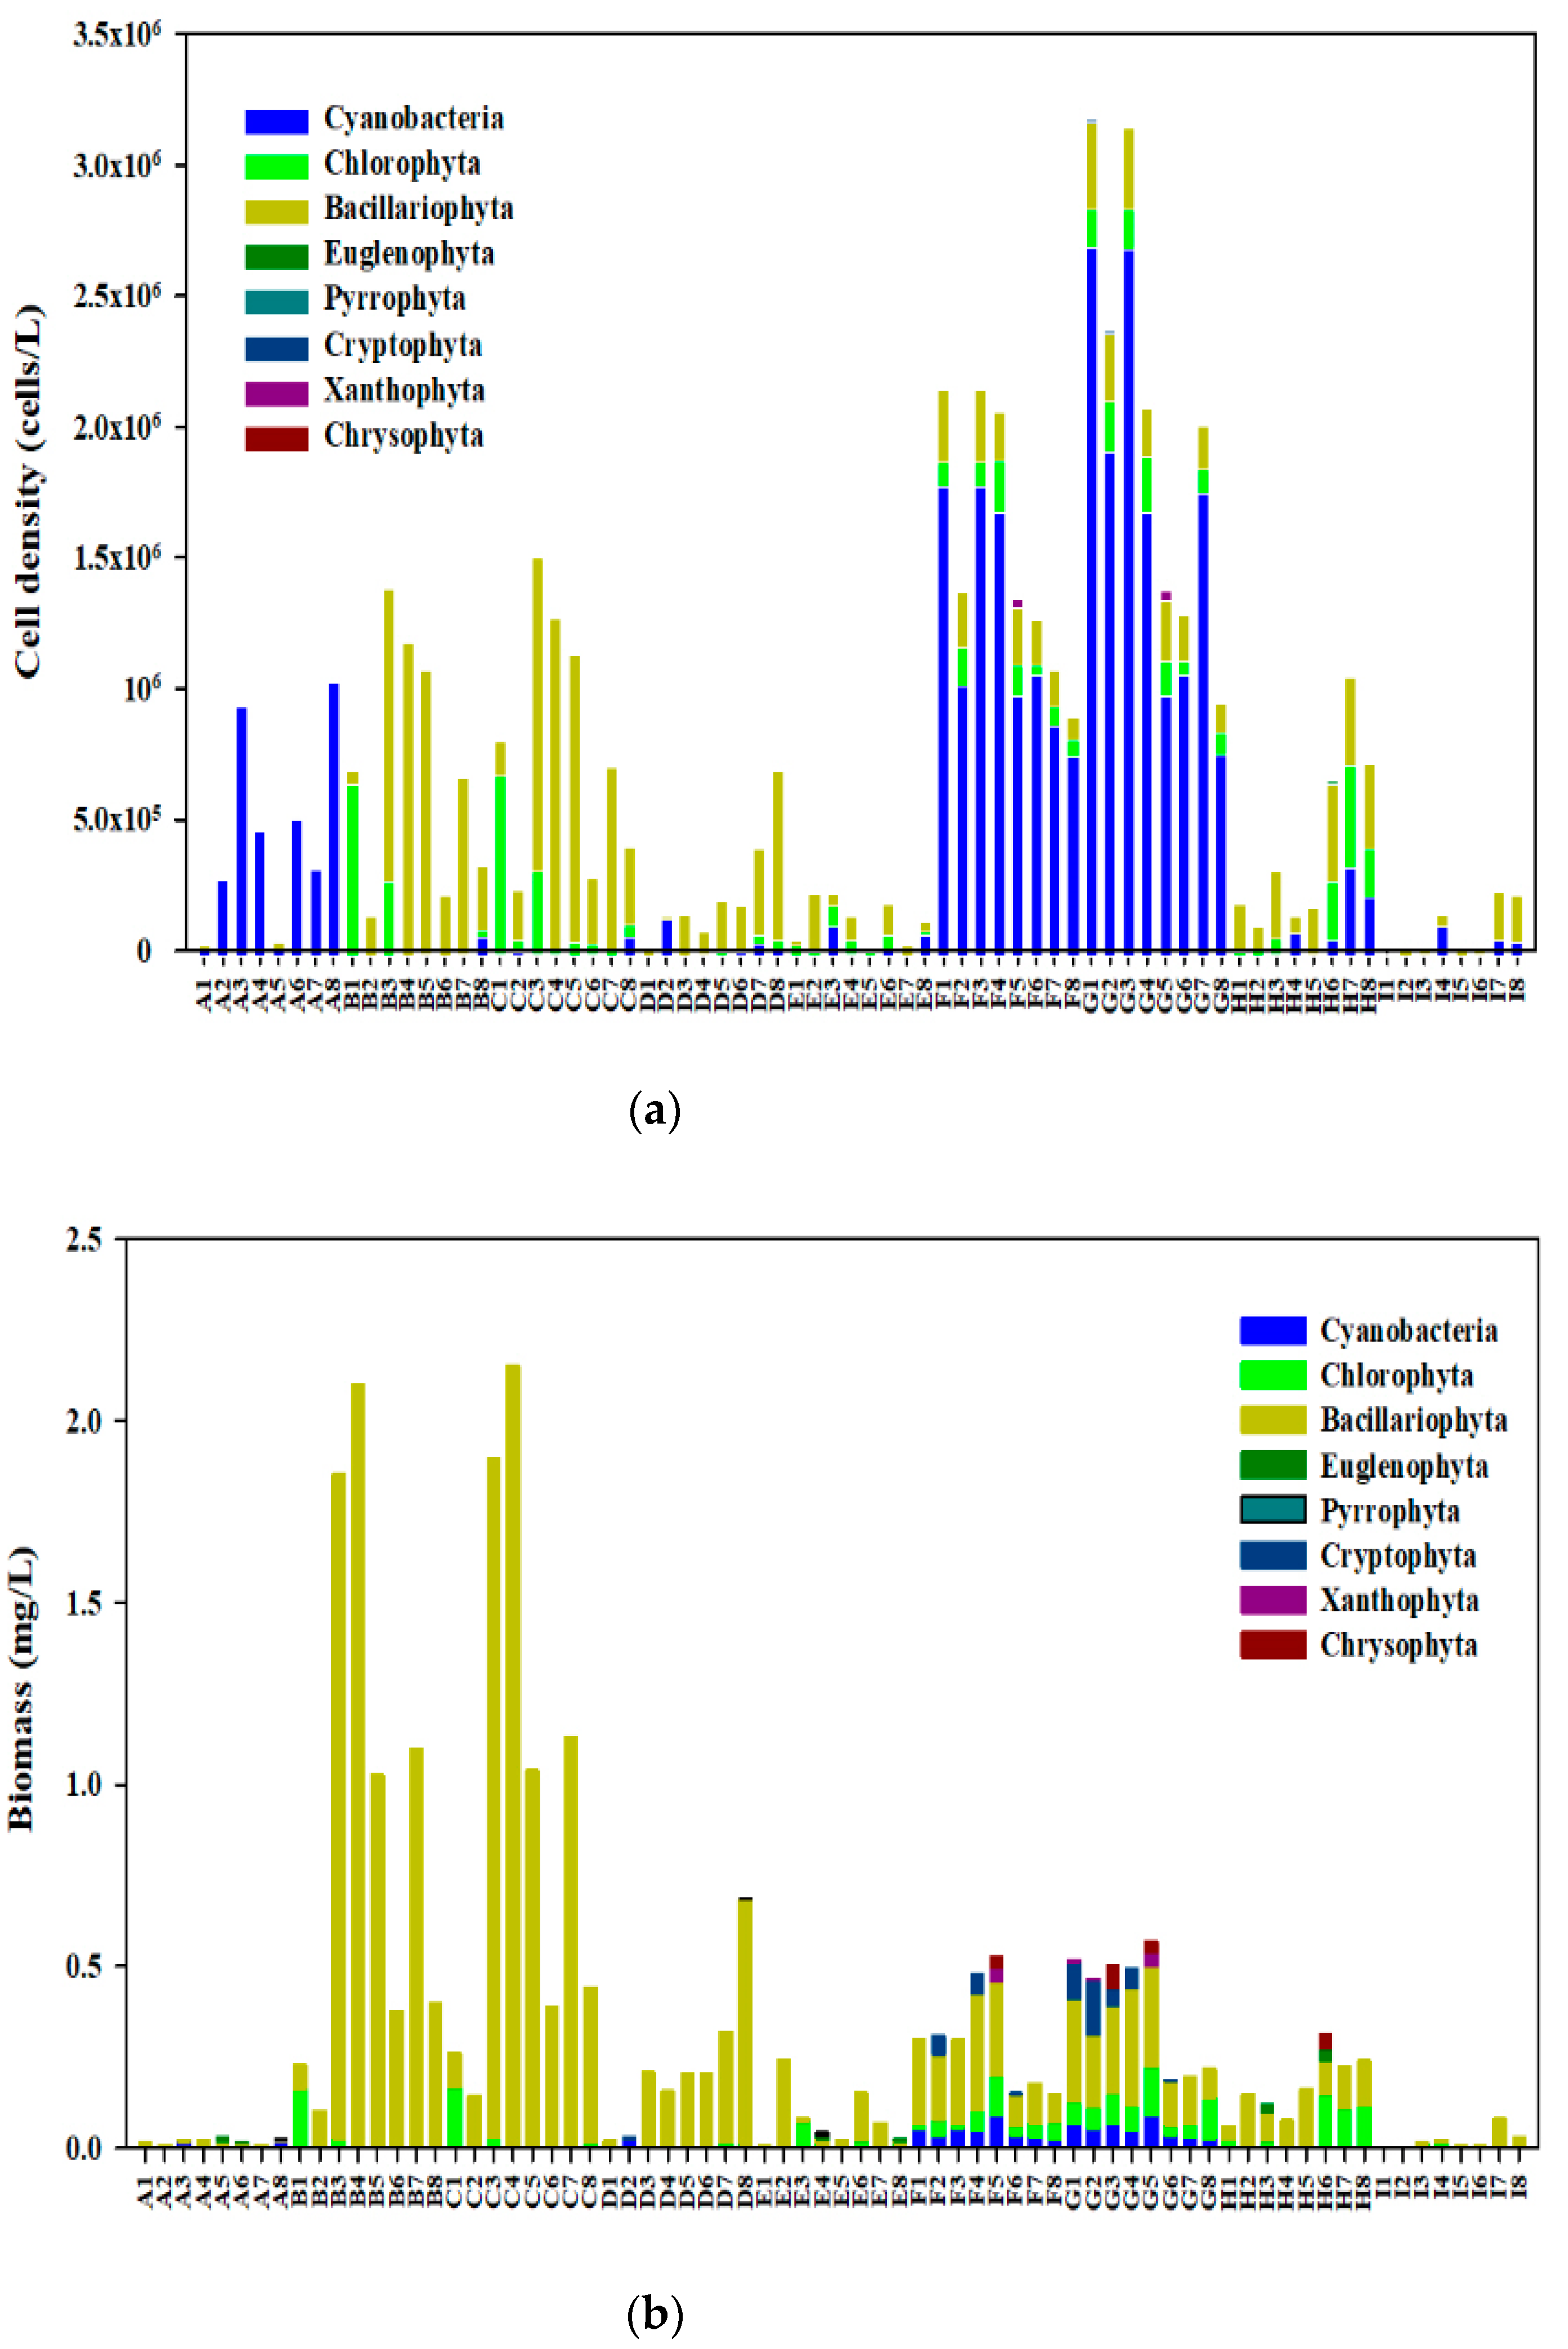
A total of 117 phytoplankton species belonging to eight phyla were identified in Qingcaosha Reservoir in 2019, including 55 species of Chlorophyta, 31 species of Bacillariophyta, 17 species of Cyanophyta, 6 species of Euglenophyta, 2 species of Pyrrophyta, 3 species of Cryptophyta, 2 species of Chrysophyta, and 1 species of Xanthophyta. Figure 2 shows that most of the species belonged to Chlorophyta (47.01%), followed by Bacillariophyta (26.49%), and then Xanthophyta (0.90%). The algae community structure in the non-salt tide period of the reservoir showed seasonal differences. The biological density of phytoplankton at each site of the Qingcaosha Reservoir from April to December was 1.5–319.8 × 10⁴ cell/L, and the average density was 73 × 104 cell/L (see Figure 2a). The phytoplankton biomass in the reservoir ranged 0.002–2.151 mg/L from April to December(see Figure 2b).
The dominance (Y) analysis of the dominant phytoplankton species showed that the dominant species changed throughout the period from April to December (Table 2). The dominant algae species mainly belonged to Cyanophyta, Bacillariophyta, and Chlorophyta, and the main dominant species were Pseudanabaena sp., Melosira granulata, Cyclotella sp., and Oedogonium sp. In general, the dominant species at each sampling point of the reservoir were the algae species commonly found in eutrophic water.
3.3. Community Structure of Bacterioplankton
3.3.1. Community Structure of Bacterioplankton
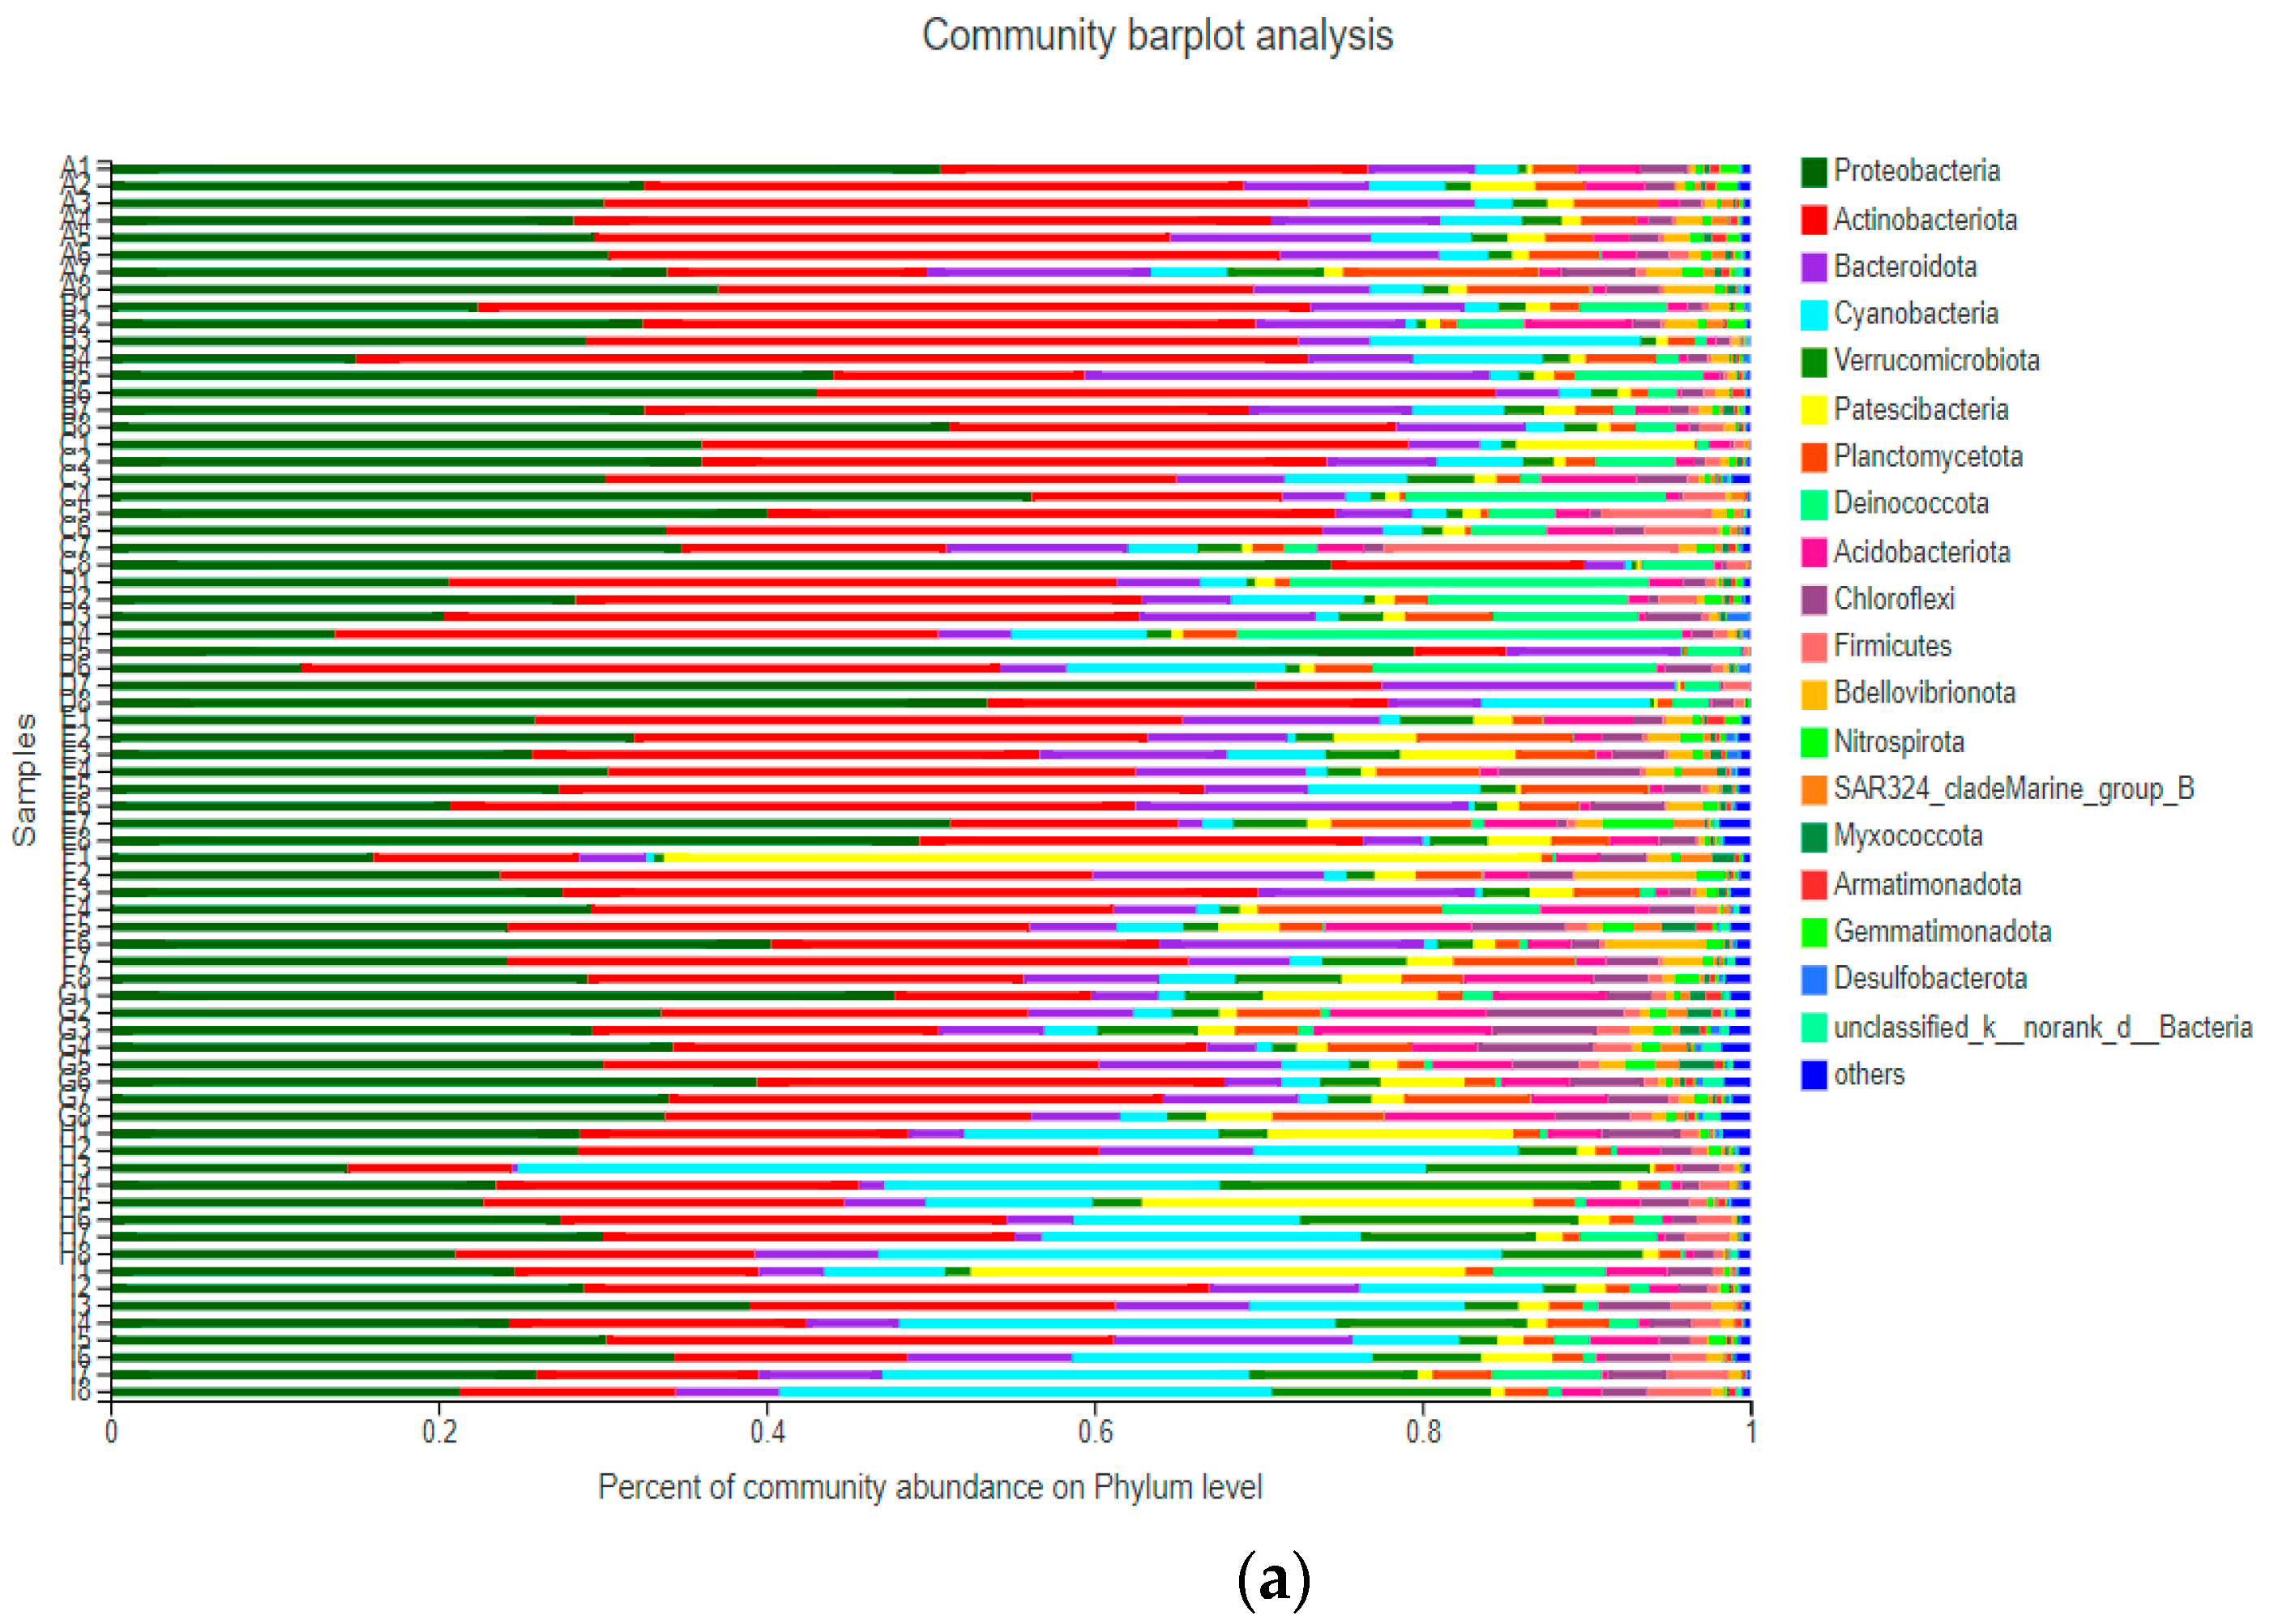
After sequencing 72 samples of bacterioplankton from Qingcaosha Reservoir in 2019, a total of 6827 OTUs were detected, which were distributed in 57 phyla, 161 classes, 408 orders, 654 families, 1238 genera, and 2543 species. At the phylum level (Figure 3), the relative abundance of Proteobacteria in the sampling period was higher than 10%, reaching a maximum of 79.49% in July. The relative abundance of Actinobacteria fluctuated from 5.62% to 58.03%. At the class level (Figure 3), the relative abundance of Gammaproteobacteria was higher than 3% during the sampling period, reaching a maximum of 56.81% in July. The relative abundance of Actinobacteria fluctuated in the range of 2.57–42.57%, and showed a decreasing trend from April to December. The relative abundance of Cyanobacteria fluctuated from 0.21% to 55.35%, and the abundance gradually increased from April to December.
3.3.2. Diversity and Abundance of Bacterioplankton
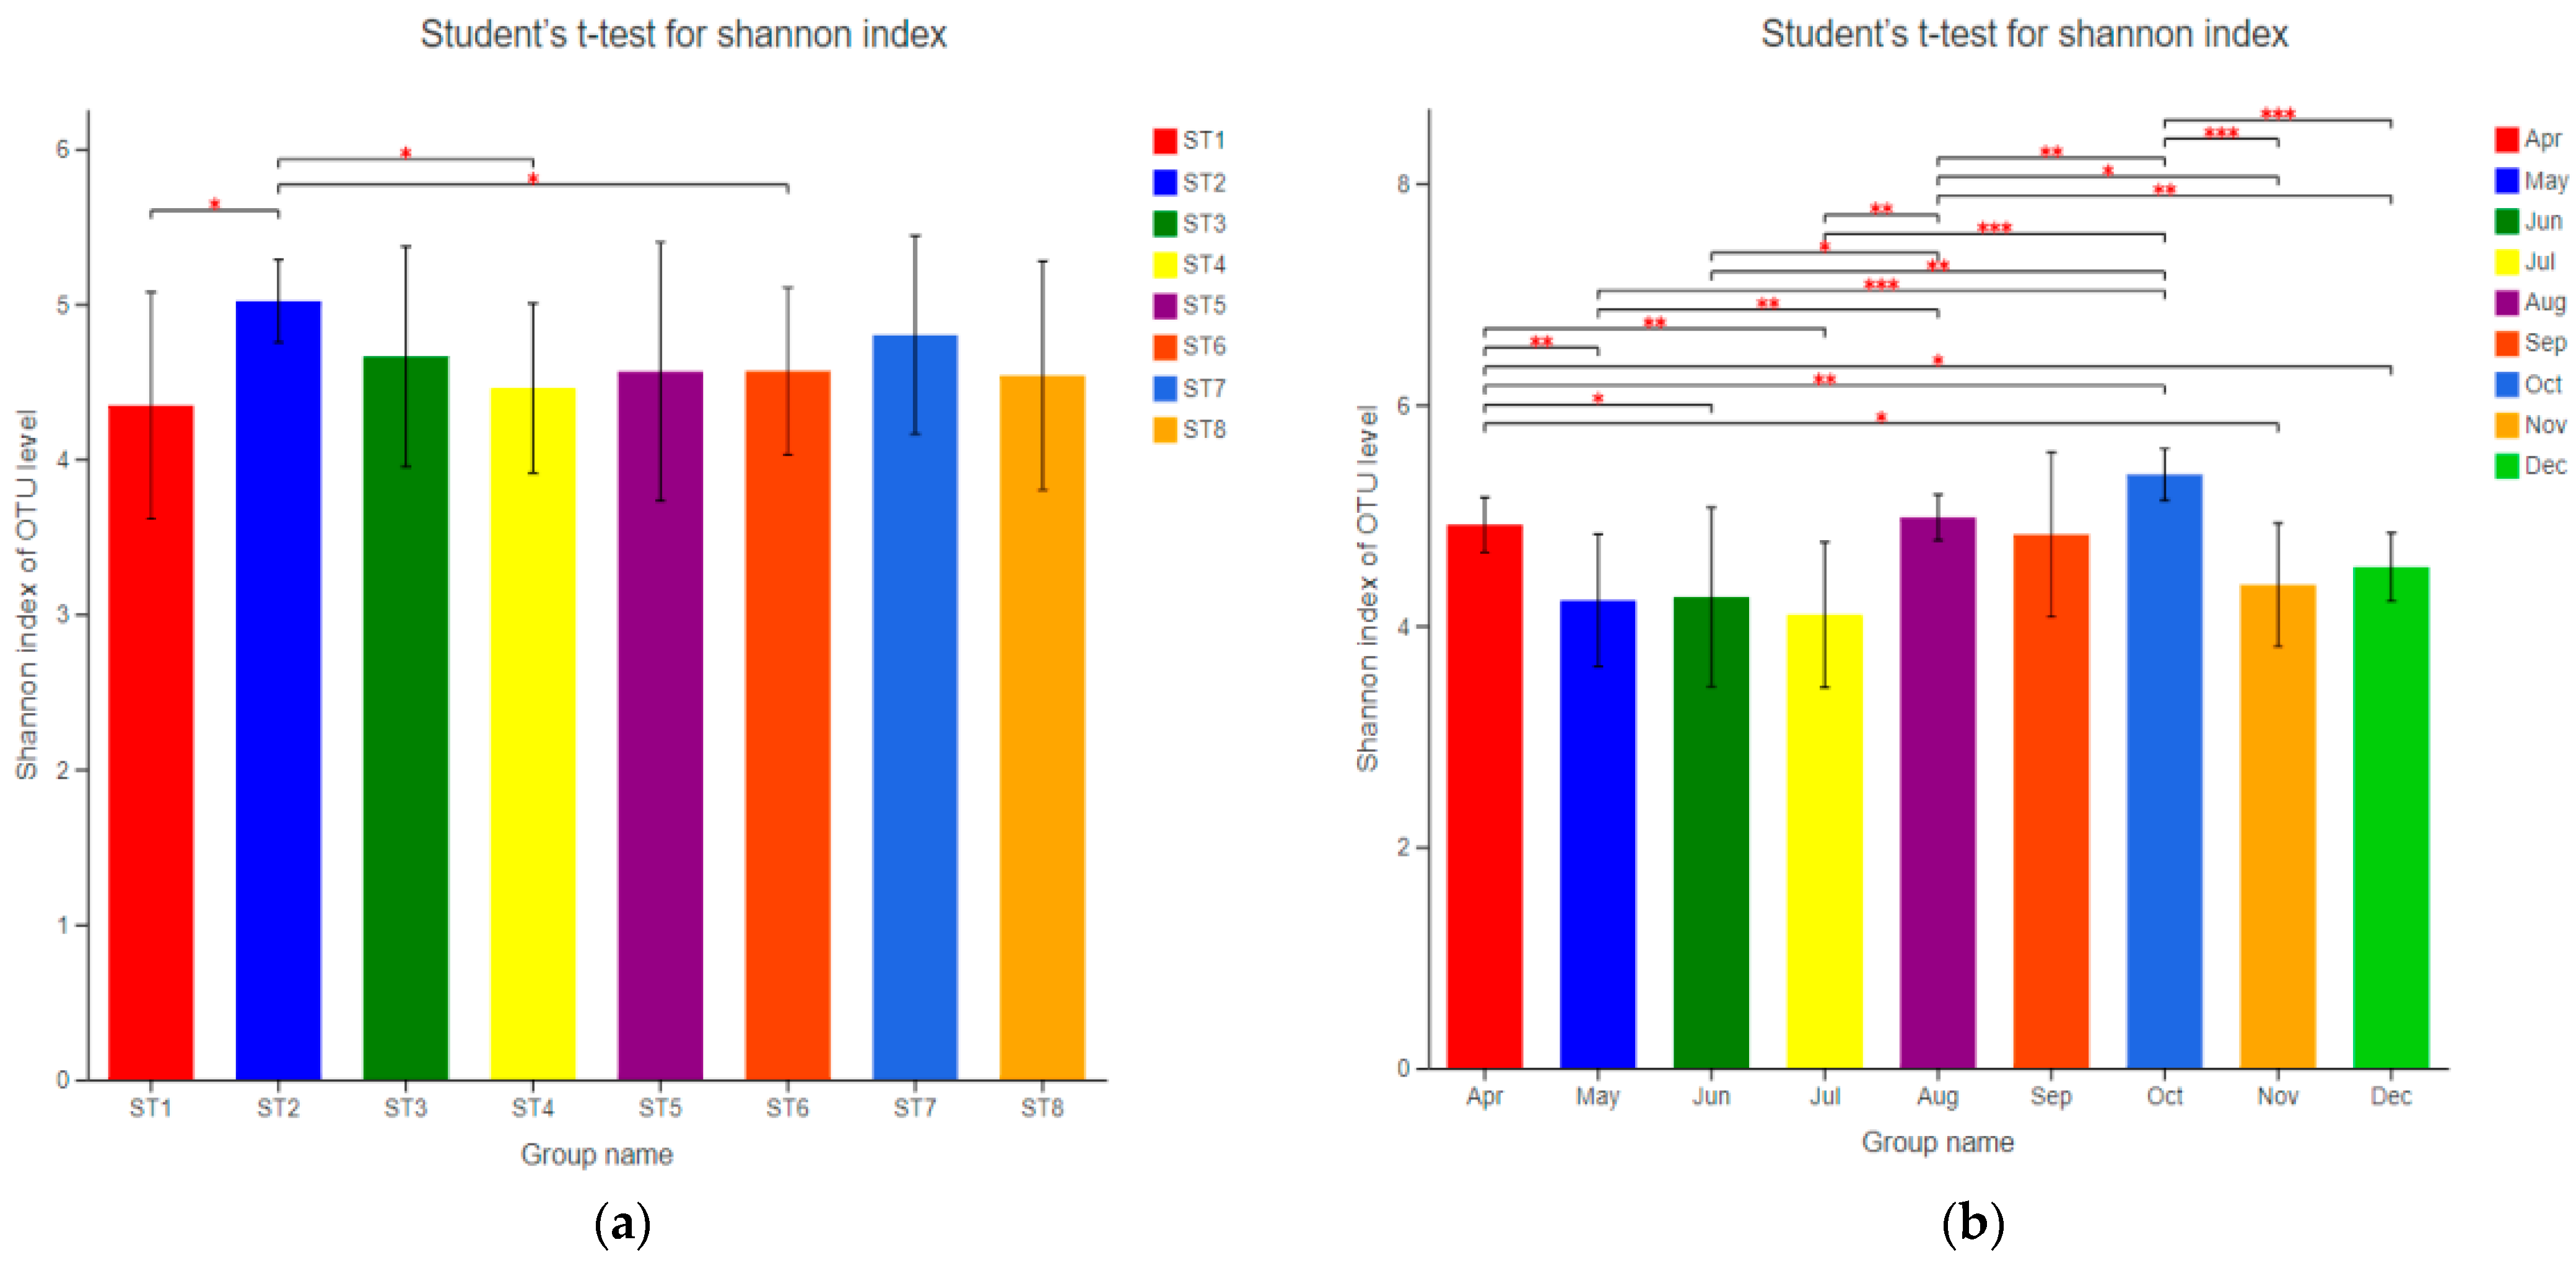
The alpha diversity of bacterioplankton in the samples was analyzed, and the Shannon index was selected to reflect community diversity (Table 3). The Shannon index of all samples was between 2.91 and 5.79; the Shannon index of ST2 varied from 4.72 to 5.55, and the Shannon index of each sampling point varied from 2.91 to 4.82 in July and 5.10 to 5.79 in October. The samples were grouped in time and space, and Student’s t-test was conducted to examine differences between groups (Figure 4). The results showed that the temporal difference of sample community diversity was significant, and the spatial difference was insignificant. Specifically, the diversity of ST2 was different from that of ST1, ST4, and ST6 (p < 0.05). There were significant differences in sample diversity between October and other months (p < 0.01), and the sample diversity decreased from June to July, then reached the highest value in October.
3.3.3. Temporal and Spatial Distribution Characteristics of Bacterioplankton
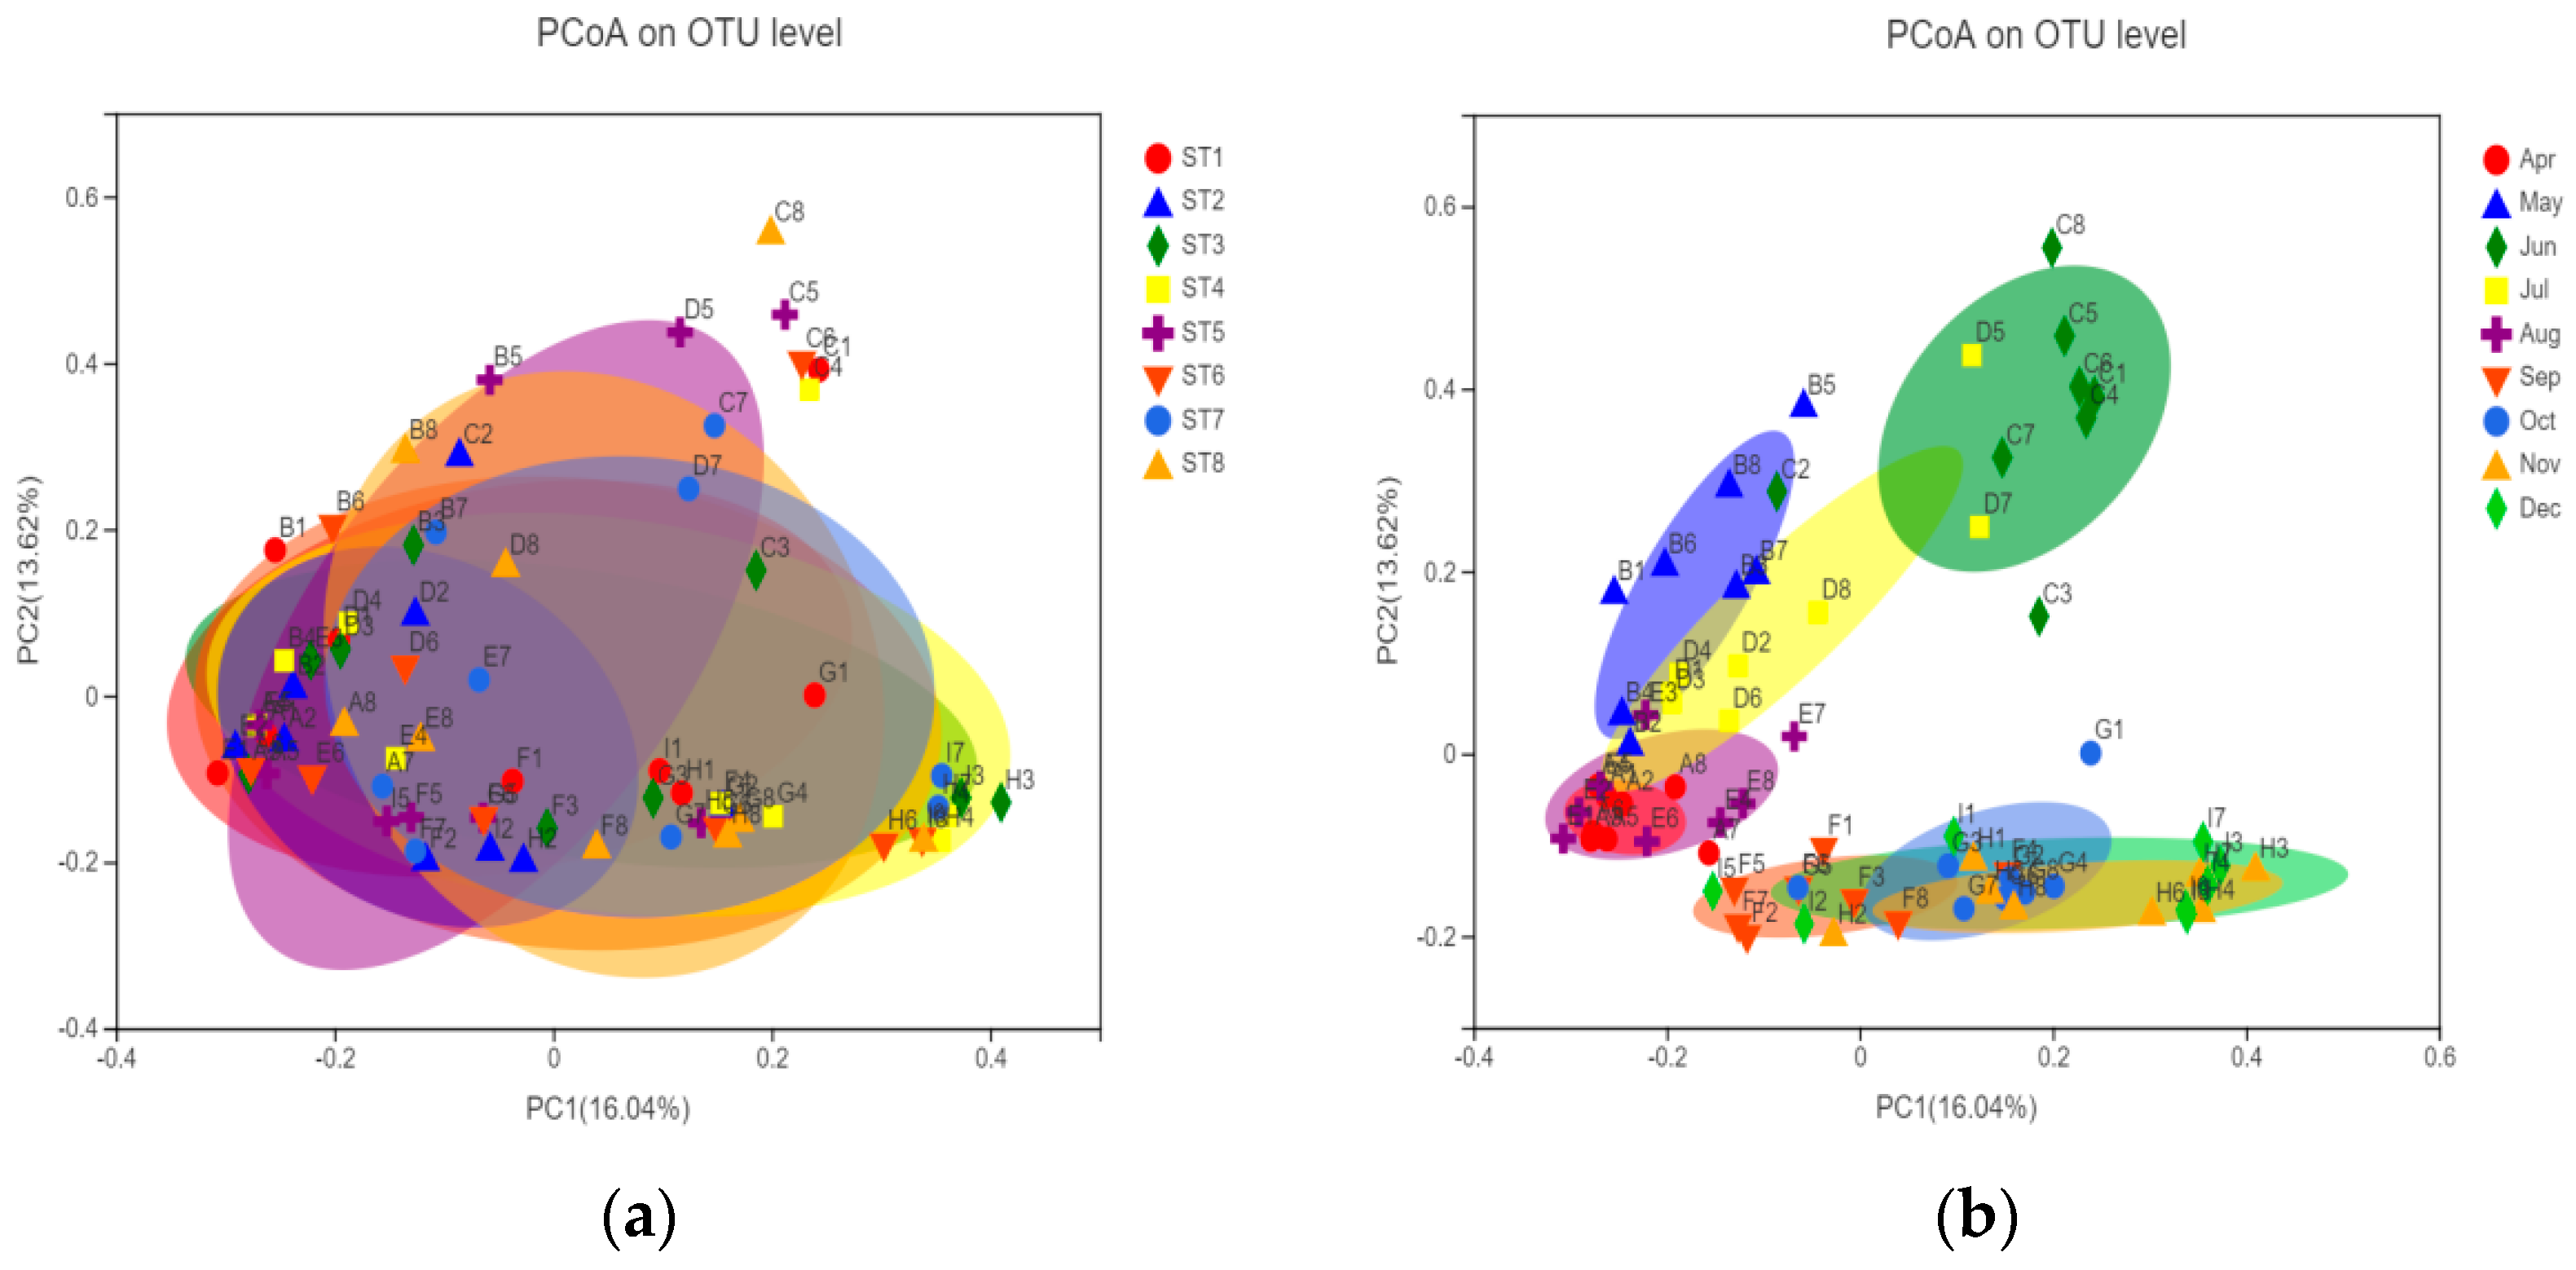
In order to describe the similarity or difference of the phytoplankton community composition in each group, beta diversity analysis was performed on the samples, and PCoA was used to analyze the samples at the OTU level. The explanatory values of the X-axis and Y-axis for the difference of sample composition were 16.04% and 13.62%, respectively. Figure 5 shows that the community structure of bacterioplankton had no significant difference on the spatial scale, and the community structure had a significant difference on the time scale, which can be divided into three groups. Specifically, the community composition (OTU level) was similar in April, May, July, and August; the composition (OTU level) was similar in September and December; and the bacterial community structure was quite different in June compared with other months.
3.4. Characteristics of the Environmental Response of the Bacterioplankton Community
3.4.1. Correlation between Bacterial Community Structure and Environmental Factors
The bacterial community and environmental factors were analyzed by db-RDA (based on the Bray-curtis distance). Figure 6 shows that the spatial and temporal effects of environmental factors on bacterial community structure were varied. Figure 6d shows that the bacterioplankton abundance (genus level) was positively correlated with SD and DO in April and August, and negatively correlated with TN, NO3−-N, and algal biomass. The bacterioplankton abundance (genus level) was positively correlated with TN, NO3−-N, and algae biomass in November and December, and negatively correlated with SD and DO. The bacterioplankton abundance (genus level) was positively correlated with DO, TP, and Cond, and negatively correlated with COD, Chl-a, NH4+-N, and algal density in September and October Figure 6b. In May, June, and July, they were positively correlated with COD, Chl-a, NH4+-N, and algal density, and negatively correlated with DO, TP, and Cond.
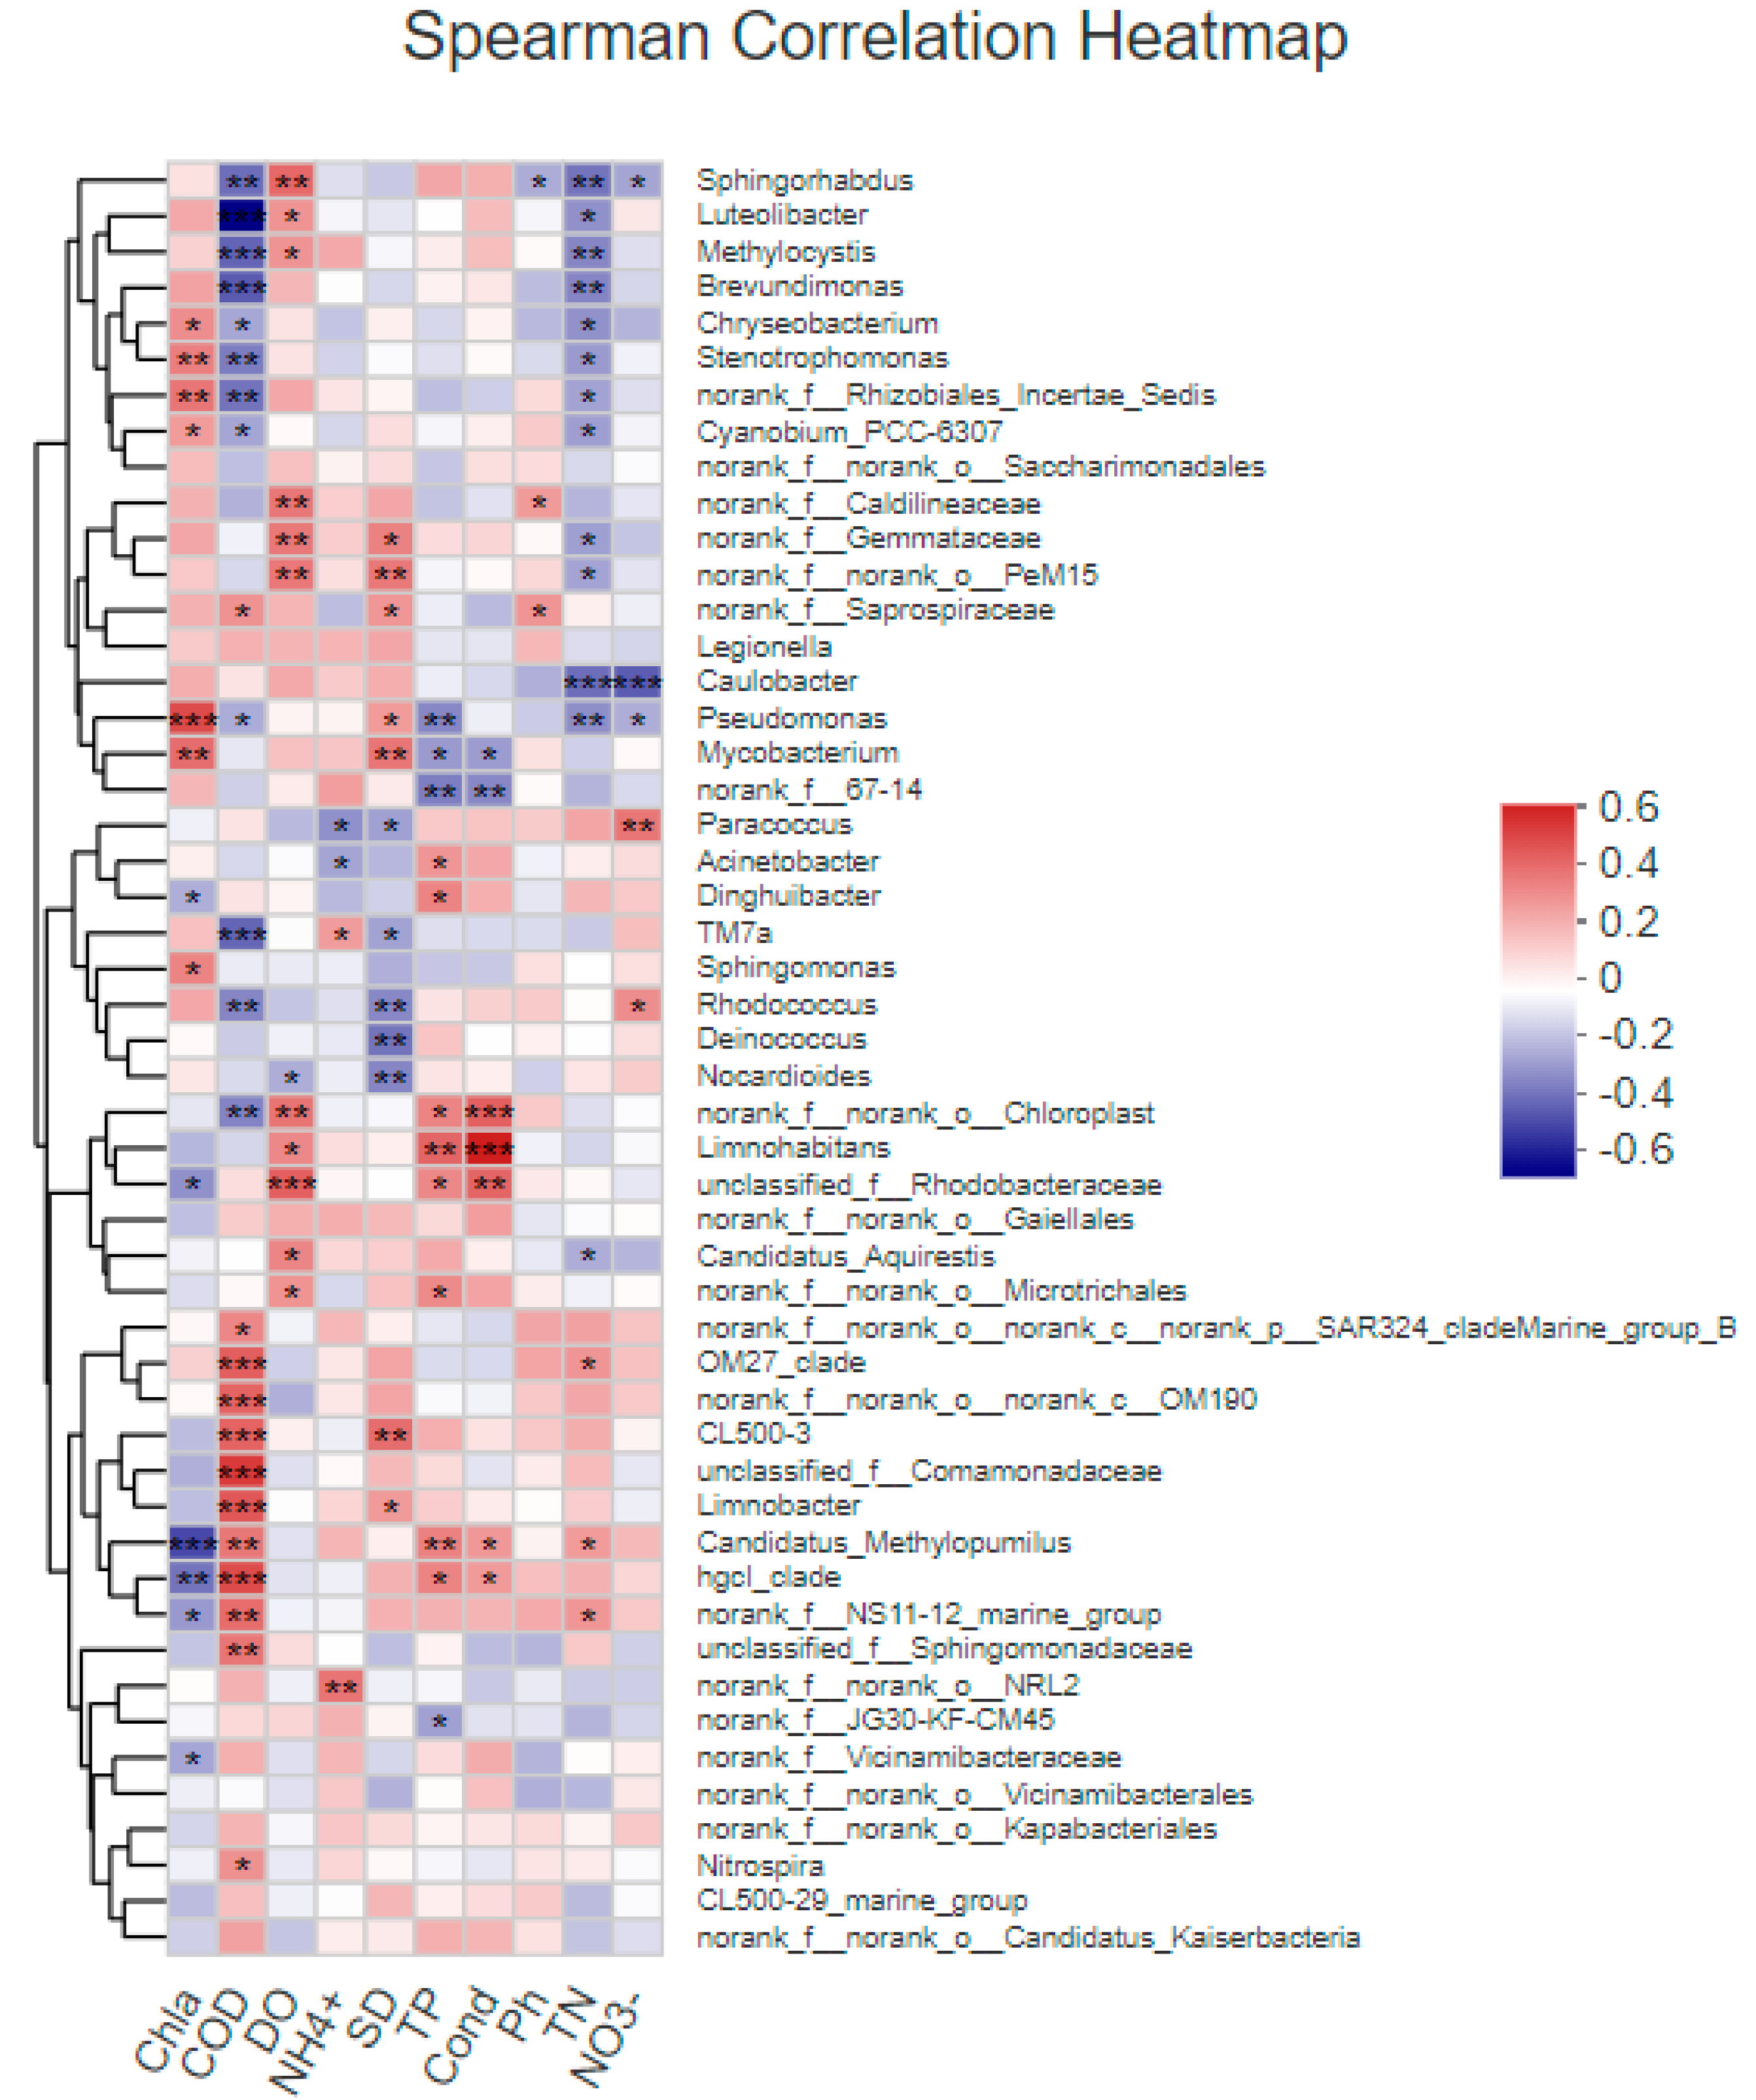
To further explore the relationship between bacterioplankton and environmental factors, the Spearman correlation analysis was used to calculate the correlation between environmental factors and bacterioplankton abundance (genus level) (Figure 7). The results show that Pseudomonadales was positively correlated with Chl-a, and Candidatus_Methylopumilus was negatively correlated with Chl-a. OM27_clade, OM190, CL500-3, unclassified_f_Comamonadaceae, and Limnobacter were positively correlated with COD, while Luteolibacter, Methylocystis, Brevundimonas, and TM7a were negatively correlated with COD. Unclassified_f_Rhodobacteraceae was positively correlated with DO. norank_f_norank_o_NRL2 was positively correlated with NH4+-N. CL500-3, Mycobacterium and PeM15 were positively correlated with SD, while Rhodococcus, Deinococcus, and Nocardioides were negatively correlated with SD. Limnohabitans and Candidatus_Methylopumilus were positively correlated with TP, and Pseudomonadales was negatively correlated with TP. Chloroplast and Limnohabitans were positively correlated with Cond. Caulobacter, Sphingomonadacea, Methylocystis, and Brevundimonas were negatively correlated with TN. Paracoccus was positively correlated with NO3−-N, which was negatively correlated with Caulobacteraceae.
3.4.2. Correlation between Bacterial Community and Phytoplankton
The coexistence relationship between bacterioplankton and phytoplankton in the non-salt tide period of the reservoir area was obtained by two-factor analysis. The interaction between in the top 500 bacterioplankton in terms of abundance and top 15 phytoplankton in terms of dominance was analyzed (Figure 8). The results show that Pseudanabaena sp. was positively correlated with Legionella, PeM15, Desulfobacterota, and UBA12409. Synedra acus was positively correlated with KD4-96. Pandorina morum was positively correlated with Arthrobacter. Cyclotella sp. was positively correlated with Subgroup_17 and negatively correlated with Deinococcus_sp. Melosira granulata was positively correlated with Sphingomonas. Melosira granulata var. angustissima was negatively correlated with Gemmataceae. Chlamydomonas was negatively correlated with Sporichthyaceae and Microtrichales.
3.5. Prediction of Bacterioplankton Function
3.5.1. PICRUSt Functional Gene Prediction
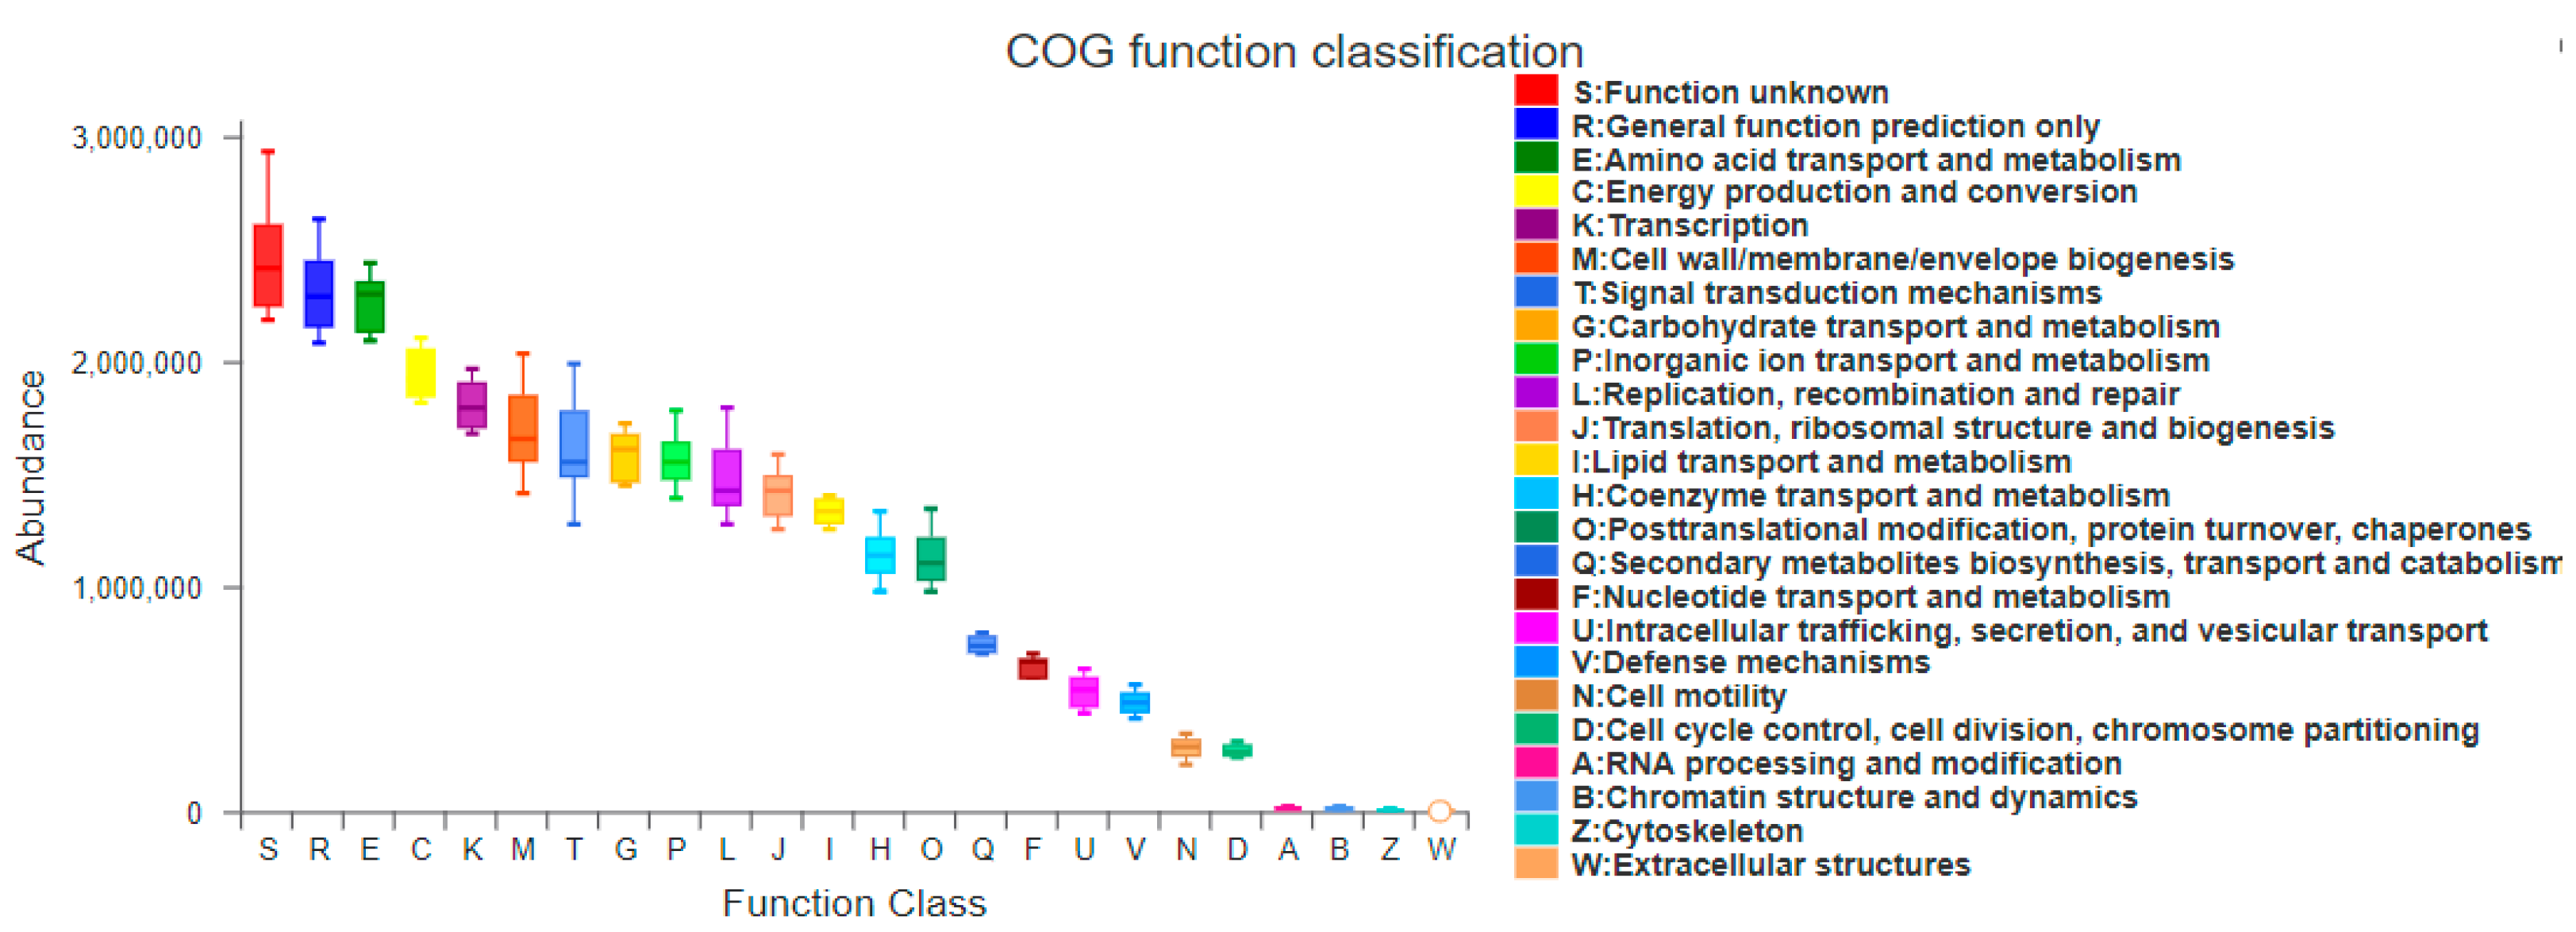
Based on PICRUSt, the result shows that amino acid transport and metabolism (E), energy production and conversion (C), transcription (K), cell wall/membrane/envelope biogenesis (M), signal transduction mechanisms (T), carbohydrate transport and metabolism (G), inorganic ion transport and metabolism (P), replication, recombination and repair (L), translation, ribosomal structure and biogenesis (J), lipid transport and metabolism (I), coenzyme transport and metabolism (H), post-translational modification, protein turnover, and chaperones (O) are the main gene functions, and their abundance accounts for 80% in each month. RNA processing and modification (A), chromatin structure and dynamics (B), extracellular structures (W), and cytoskeleton (Z) functional genes were absent in all sites.
The results of 16S amplification were compared with the KEGG database ( Figure 9), and based on the analysis of the biological metabolic pathway, the metabolic function of the bacterial community was inferred. In this study, seven KEGG modules related to nitrogen metabolism were found: dissimilatory nitrate reduction, nitrate ≥ ammonia; denitrification, nitrate ≥ nitrogen; assimilatory nitrate reduction, nitrate ≥ ammonia; nitrate assimilation, complete nitrification, comammox, ammonia ≥ nitrite ≥ nitrate; nitrogen fixation, nitrogen ≥ ammonia; and nitrification, ammonia ≥ nitrite.
3.5.2. FAPROTAX Function Prediction
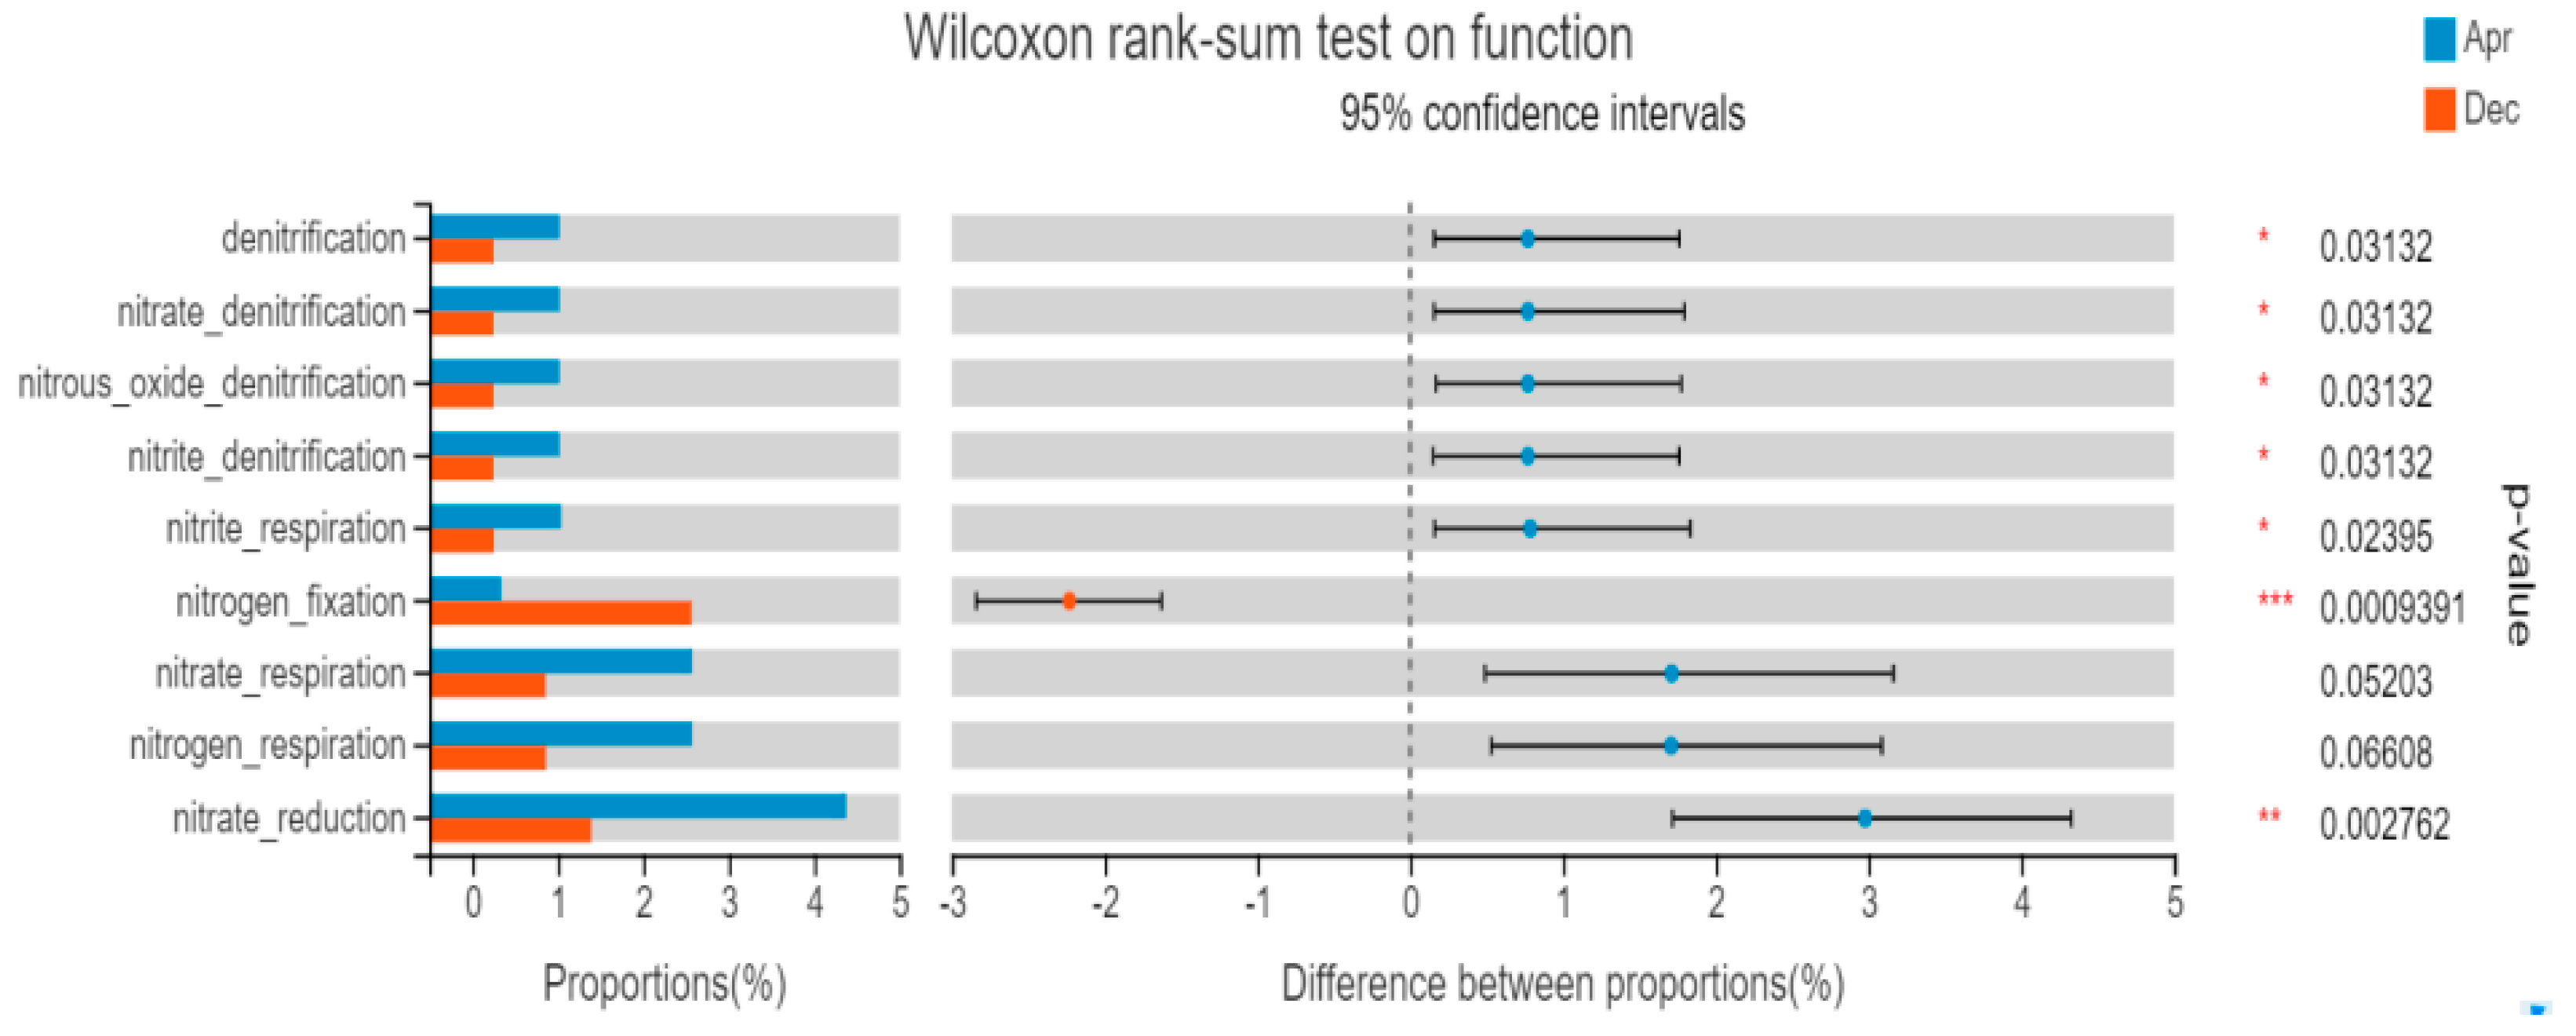
The FAPROTAX database was used to predict the function of the samples. Figure 10 shows that the main functions of the community were aerobic energy decomposition, photosynthetic nutrition-related functions, aromatic compound and carbohydrate degradation, and nitrogen nitrification and denitrification. The five functions of the bacterial abundance ranking were chemoheterotrophy, aerobic_chemoheterotrophy, animal_parasites_or_symbionts, human_pathogens_all, and aromatic_compound_degradation. The heatmap function prediction showed that the relative abundance of nitrogen respiration, nitrate respiration, nitrite respiration, nitrate denitrification, nitrite denitrification, and nitrous oxide denitrification decreased with time, and the relative abundance of the nitrogen fixation function increased. The abundance of anammox functional bacteria remained constant. By analyzing the FAPROTAX function prediction results in April and December, the abundance of bacterioplankton with a nitrogen fixation function in December was significantly higher than that in April (p < 0.01). The abundance of bacterioplankton with nitrite respiration, nitrate denitrification, nitrite denitrification, and nitrous oxide denitrification functions was significantly higher in April than in December (Figure 11), but the difference in the abundance of bacterioplankton with nitrate respiration and nitrogen respiration functions was not significant across two months.
4. Discussion
4.1. Bacterial Community Diversity and Species Composition during the Non-Salty Tide Period in the Reservoir
Proteobacteria was the dominant phyla of bacterioplankton in the non-salt tide period of Qingcaosha Reservoir, followed by Actinobacteria, Bacteroidetes, Cyanobacteria, and Verrucomicrobia. This is similar to the dominant species of bacterioplankton in typical oceans, lakes, and rivers identified by most previous studies [32,33].At the class level, the dominant classes of bacterioplankton, ranked in the top five, were Gammaproteobacteria, Alphaproteobacteria, Actinobacteria, Acidimicrobiia, and Cyanobacteria. β-Proteobacteria is demonstrated to be the dominant flora in freshwater environments in most studies [34,35], but the abundance of β-proteobacteria was low during this period. The Nitrosomonas, Nitrosospira, and Hydrogenophaga genera of β-proteobacteria are involved in the nitrogen metabolism of freshwater systems, and have the ability to degrade complex organic macromolecules, but are rarely found in the ocean [36], which may be related to the recharge of the salt tide in the reservoir.
The results of community diversity analysis in the reservoir area showed that there were significant differences at the time scale, but not at the spatial scale. The similarity analysis results of the PCoA community at the OTU level in the reservoir area distinguished bacterial communities in different months, while the bacterial community composition in other research areas was relatively stable and difficult to distinguish in the same period. The significant differences in diversity when considering the time scale are due to temperature changes that could significantly affect the diversity of bacterial communities in water [37]. At the spatial scale, due to the relatively narrow environmental gradient range and the short hydraulic cycle, the spatial differences were not enough to cause significant differences in community composition in different reservoir regions.
In addition, the free movement of bacteria, which occupy many habitats including water, sediment, and riverbank soil, play a key role in driving the biogeochemistry cycle. Bacterial functions in different habitats of ecosystems are closely related, and vary greatly [38]. Greater attention should be focused on studying the function and community exchange of bacterial communities in water, sediment, and riparian soil.
4.2. Relationship between Bacterioplankton and Physical and Chemical Environmental Factors
The bacterial community is affected by water type, organic matter content, the antagonistic effects of the bacterial community, rainwater scouring, industrial wastewater, and domestic sewage discharge. In this study, the relationship between bacteria and habitats in water was explored by measuring the physical and chemical factors of the water. The results show that the effects of environmental factors on the bacterial community differed in time and space, and that specific environmental factors had a weak correlation to the bacteria found at fixed sites and a strong correlation at a fixed time, and these same environmental factors had a different influence on the bacterial community in different months. The results of db-RDA analysis showed that changes in the bacterial community structure were significantly influenced by algae biomass and density, DO, TP, Cond, NO3−-N, and the effects of algae biomass and density, DO, and Cond, were the most significant. The results of previous studies on the key environmental impact factors of bacterioplankton communities implicated mainly T [39], Cond, algal density [40], DO, TOC [41], and TN [42], indicating that different environmental factors regulate different aquatic ecosystems.
At the same time, different bacteria are affected by water environmental factors in different ways. A variety of aerobic denitrifying bacteria were detected in the dominant genera in the reservoir area. Aerobic denitrifying bacteria can convert nitrate nitrogen into gaseous nitrogen in the aerobic environment [43], and include Paracoccus, Pseudomonas, Acinetobacter, Rhodococcus, and Stenotrophomonas. Although these bacteria have the same function, they have different degrees of tolerance to environmental factors. The exploration of the adaptability of different functional strains to the environment has significance in the treatment of polluted water.
In most studies, the physical and chemical factors of water play an important role in shaping the bacterial community [44], but the response relationship between them is extremely complex, including why they occur, and how to maintain specific bacterial community structural characteristics. No precise mechanism was identified in the research results, and further exploration is required.
4.3. Correlation between Bacterioplankton and Phytoplankton
The diversity of bacterioplankton was positively correlated with the density of phytoplankton. The alpha diversity analysis of the bacterial community showed that the diversity of the bacterioplankton community composition decreased in June and July. The density of algae in the reservoir was low in July, and algae belonging to Bacillariophyta were the dominant species. The bacterial diversity reached its peak in October, and the density of algae in the reservoir area reached its highest value in the detection range. Algae belonging to Cyanophyta were the dominant species, which was speculated to be related to the optimal growth temperature of phytoplankton and bacteria [45]. Studies have shown that there is a close relationship between bacteria and cyanobacterial blooms [46]. At the same time, Chl-a and algae density can affect the bacterial community structure [47,48]. Still, the synergistic succession of the two under the coexistence state needs to be further studied.
Algae-solubilizing bacteria are bacteria that can inhibit, kill, and lyse algae, either directly or indirectly. The community structure of algae-solubilizing bacteria is closely related to the processes by which algae blooms develop in water [49,50]. The dominant bacteria detected in this reservoir area were Bdellovibrio, Bacilli, Flavobacterium, Saprospira, Pseudomonas, and Sphingomonadales. Among them, Pseudomonas can alienate and reduce nitrate and its abundance is positively correlated with the abundance of Pseudanabaena. Sphingomonadales is responsible for ammonia oxidation and its abundance is positively correlated with the abundance of Melosira granulata, while the abundance of Gemmataceae in the reservoir is negatively correlated with it. Gemmataceae is closely related to Phytoplankton, and is mainly attached to Diatoms and Cyanobacteria [51]. Gemmataceae has a strong phosphorus accumulation ability [52] and is an important genus in the process of biological phosphorus removal from wastewater [53]. Bacteria can adhere to the surface of algae particles, and form community aggregates [54]. This phenomenon has been found on the surface of Microcystis [55], Aphanizomenon, Arthrospira [56], and Bacillariophyta [57]. Many studies have focused on the isolation and identification of algae-lysing bacteria and the description of algae-lysing mechanism and phenomenon, and practical applications are still in their infancy. The analysis of the correlation between bacteria and algae in the reservoir area may provide theoretical support for the development of algae-solubilizing bacteria, and the optimization of algae-solubilizing conditions.
Clostridia, Desulfuromonadia, and Comamonadaceae were found in the reservoir area. Studies have shown that the above bacteria occupy a high degree of dominance in the anaerobic decomposition of algae in algae-derived hypoxia. The above bacteria have strong adaptability to the environmental characteristics of low DO, low pH, and high organic matter content in areas of algae-derived hypoxia [58]. In addition, methanogenic bacteria and methane-oxidizing bacteria, which can rapidly decompose organic substances, play an essential role in algae-derived hypoxia areas [59]. Specific bacteria can rapidly decompose organic matter, produce odorous substances, and transform carbon and sulfur elements in algae-derived or grass-derived water bodies. This study provides a theoretical basis for ecosystem restoration in the late stages of algae-derived hypoxia.
4.4. Characteristics of Bacterioplankton Function Prediction
In general, Proteobacteria, Actinomycetes, Bacteroidetes, and Cyanobacteria were the dominant bacteria in the reservoir area. The dominant bacteria perform different metabolic functions. In this study, the function of bacterioplankton was predicted, especially for the bacteria with nitrogen and phosphorus conversion functions. The results showed that the abundance of the bacterial community with a nitrogen removal function decreased gradually from April to December in the reservoir, and the abundance of nitrogen fixation bacteria increased gradually. Interference can lead to a directional change of the community functional structure [60]. Understanding the effects of different driving factors on functional bacteria is conducive to screening functional colonies that are beneficial to the water environment, and effectively promoting the process of water protection and restoration.
Water bacteria are the key driving factors of the nitrogen and phosphorus cycle [61]. Gemmataceae has a strong phosphorus accumulating ability. Nitrospiria is the key bacteria of the nitrogen cycle [62]. Desulfobacterota can metabolize sulfur, and degrade chlorinated pollution [63]. Rhodobacter plays a role in the degradation of organic nitrogen compounds, and Limnohabitans plays a role in nitrate reduction. Sphingomonas paucimobilis can be used for the biodegradation of aromatic compounds. The above bacteria were all detected in the reservoir area. There are a variety of nifH genes in Proteobacteria [64], such as Rhodopseudomonas and nitrogen-fixing spirochetes, which are involved in the transformation of molecular nitrogen into ammonia nitrogen in the environment. Actinobacteria have the function of nitrogen fixation, organic phosphorus degradation, cellulose degradation, organic matter decomposition, and mineral fixation. Most Bacteroidetes can degrade cellulose into soluble sugars and participate in the carbon cycle of plant decomposition. The above strains are important core groups of biofilms in the nitrogen and phosphorus removal process of a biofilm reactor. They also play a role in nitrogen and phosphorus removal in wetland water purification.
At present, nitrogen cycle functional groups are widely studied, but this is limited by the maturity of the current research methods for functional communities related to carbon, and phosphorus and sulfur cycles are less studied. The above cycles play an essential role in the functional health and maintenance of aquatic ecosystems. Future research should pay more attention to these cycles and improving the related technologies.
5. Conclusions
The dominant classes of bacterioplankton in the reservoir were Gammaproteobacteria, Alphaproteobacteria, Actinobacteria, Acidimicrobiia, and Cyanobacteria, which are also typical freshwater ecosystem bacterioplankton classes. However, the abundance of β-proteobacteria was low, which was speculated to be related to the recharge of the salt tide in the reservoir. Bacterial community diversity was significantly different at the time, but not on the spatial scale. The changes of bacterial community structure in the non-salt tide period in the reservoir area were significantly affected by phytoplankton density and biomass, DO, TP, Cond, and NO3−-N, and the effects of phytoplankton density and biomass, DO, and Cond, were the most significant. The presence of Pseudomonas and Legionella was positively correlated with that of Pseudanabaena sp., and Sphingomonas and Paragonimus with Melosira granulata. On the contrary, Planctomycetes presence was negatively correlated with Melosira granulate. as was Deinococcus-Thermus with Cyclotella sp. The main functions of the community were aerobic chemical energy decomposition, photosynthetic nutrition-related functions, aromatic compound and carbohydrate degradation functions, and nitrification and denitrification of nitrogen. The relative abundance of nitrogen-removal functional bacteria decreased from April to December, while the abundance of nitrogen-fixing bacteria increased.
Author Contributions
Conceptualization, S.L. and F.Z.; methodology, S.L.; software, S.L.; validation, S.L., F.Z. and X.F.; formal analysis, S.L.; investigation, X.F.; resources, F.Z.; data curation, S.L.; writing—original draft preparation, S.L. and F.Z.; writing—review and editing, S.L. and F.Z; visualization, X.F.; supervision, X.F.; project administration, F.Z.; funding acquisition, F.Z. All authors have read and agreed to the published version of the manuscript.
Funding
This study was financially supported by the Science and Technology Committee of Shanghai (18DZ1206505).
Institutional Review Board Statement
Not applicable.
Informed Consent Statement
Not applicable.
Data Availability Statement
The data are not publicly available due to proprietary nature of some of the data.
Conflicts of Interest
The authors declare no conflict of interest.
References
- Cloern, J. Our evolving conceptual model of the coastal eutrophication problem. Mar. Ecol. Prog. Ser. 2001, 210, 223–253. [Google Scholar] [CrossRef]
- Chen, Y.; Liu, R.; Sun, C.; Zhang, P.; Feng, C.; Shen, Z. Spatial and temporal variations in nitrogen and phosphorous nutrients in the Yangtze River Estuary. Mar. Pollut. Bull. 2012, 64, 2083–2089. [Google Scholar] [CrossRef] [PubMed]
- Ho, J.C.; Michalak, A.M.; Pahlevan, N. Widespread global increase in intense lake phytoplankton blooms since the 1980s. Nature 2019, 574, 667–670. [Google Scholar] [CrossRef]
- Schindler, D.W. The dilemma of controlling cultural eutrophication of lakes. Proc. R. Soc. B Boil. Sci. 2012, 279, 4322–4333. [Google Scholar] [CrossRef] [PubMed] [Green Version]
- Jiang, Y.; Xu, C.; Wu, X.; Chen, Y.; Han, W.; Gin, K.Y.H.; He, Y. Occurrence, seasonal variation and risk assessment of antibi-otics in Qingcaosha reservoir. Water 2018, 10, 115. [Google Scholar] [CrossRef] [Green Version]
- Chen, Y.; Zhu, J. Reducing eutrophication risk of a reservoir by water replacement: A case study of the Qingcaosha reservoir in the Changjiang Estuary. Acta Oceanol. Sin. 2018, 37, 23–29. [Google Scholar] [CrossRef]
- Liu, X.P.; Zhang, W.; Wang, L.Q.; Jiang, Y.; Liu, C.; Zheng, X. Structure of phytoplankton community and its relationship with environmental factors in Qingcaosha Reservoir. J. Shanghai Ocean. Univ. 2015, 24, 532–543. [Google Scholar]
- Wagg, C.; Schlaeppi, K.; Banerjee, S.; Kuramae, E.E.; van der Heijden, M.G. Fungal-bacterial diversity and microbiome com-plexity predict ecosystem functioning. Nat. Commun. 2019, 10, 4841. [Google Scholar] [CrossRef]
- Cerro-Gálvez, E.; Sala, M.M.; Marrasé, C.; Gasol, J.M.; Dachs, J.; Vila-Costa, M. Modulation of microbial growth and enzy-matic activities in the marine environment due to exposure to organic contaminants of emerging concern and hydrocarbons. Sci. Total Environ. 2019, 678, 486–498. [Google Scholar] [CrossRef]
- Azam, F.; Fenchel, T.; Field, J.G.; Gray, J.; Meyer-Reil, L.; Thingstad, F. The Ecological Role of Water-Column Microbes in the Sea. Mar. Ecol. Prog. Ser. 1983, 10, 257–263. [Google Scholar] [CrossRef]
- Naeem, S.; Hahn, D.R.; Schuurman, G. Producer–decomposer co-dependency influences biodiversity effects. Nature 2000, 403, 762–764. [Google Scholar] [CrossRef] [PubMed]
- Burns, C.W.; Galbraith, L.M. Relating planktonic microbial food web structure in lentic freshwater ecosystems to water quality and land use. J. Plankton Res. 2007, 29, 127–139. [Google Scholar] [CrossRef]
- Comte, J.; Lovejoy, C.; Crevecoeur, S.; Vincent, W.F. Co-occurrence patterns in aquatic bacterial communities across chang-ing permafrost landscapes. Biogeosciences 2006, 13, 175–190. [Google Scholar] [CrossRef] [Green Version]
- Yu, S.-X.; Pang, Y.-L.; Wang, Y.-C.; Li, J.-L.; Qin, S. Distribution of bacterial communities along the spatial and environmental gradients from Bohai Sea to northern Yellow Sea. PeerJ 2018, 6, e4272. [Google Scholar] [CrossRef] [PubMed] [Green Version]
- Brooks, B.W.; Lazorchak, J.M.; Howard, M.D.; Johnson, M.V.V.; Morton, S.L.; Perkins, D.A.; Steevens, J.A. Are harmful algal blooms becoming the greatest inland water quality threat to public health and aquatic ecosystems? Environ. Toxicol. Chem. 2016, 35, 6–13. [Google Scholar] [CrossRef]
- Teeling, H.; Fuchs, B.M.; Becher, D.; Klockow, C.; Gardebrecht, A.; Bennke, C.M.; Kassabgy, M.; Huang, S.; Mann, A.J.; Waldmann, J.; et al. Substrate-Controlled Succession of Marine Bacterioplankton Populations Induced by a Phytoplankton Bloom. Science 2012, 336, 608–611. [Google Scholar] [CrossRef] [PubMed]
- McCarthy, M.J.; Lavrentyev, P.J.; Yang, L.; Zhang, L.; Chen, Y.; Qin, B.; Gardner, W.S. Nitrogen dynamics and microbial food web structure during a summer cyanobacterial bloom in a subtropical, shallow, well-mixed, eutrophic lake (Lake Taihu, China). Hydrobiologia 2007, 581, 195–207. [Google Scholar] [CrossRef]
- Zhou, J.; Zhang, B.-Y.; Yu, K.; Du, X.-P.; Zhu, J.-M.; Zeng, Y.-H.; Cai, Z.-H. Functional profiles of phycospheric microorganisms during a marine dinoflagellate bloom. Water Res. 2020, 173, 115554. [Google Scholar] [CrossRef]
- Parveen, B.; Ravet, V.; Djediat, C.; Mary, I.; Quiblier, C.; Debroas, D.; Humbert, J.F. Bacterial communities associated with M icrocystis colonies differ from free-living communities living in the same ecosystem. Environ. Microbiol. Rep. 2013, 5, 716–724. [Google Scholar]
- Meyer, N.; Bigalke, A.; Kaulfuß, A.; Pohnert, G. Strategies and ecological roles of algicidal bacteria. FEMS Microbiol. Rev. 2017, 41, 880–899. [Google Scholar] [CrossRef] [Green Version]
- Huang, X.; Zhu, J.; Cai, Z.; Lao, Y.; Jin, H.; Yu, K.; Zhang, B.; Zhou, J. Profiles of quorum sensing (QS)-related sequences in phycospheric microorganisms during a marine dinoflagellate bloom, as determined by a metagenomic approach. Microbiol. Res. 2018, 217, 1–13. [Google Scholar] [CrossRef]
- Shi, L.; Huang, Y.; Zhang, M.; Yu, Y.; Lu, Y.; Kong, F. Bacterial community dynamics and functional variation during the long-term decomposition of cyanobacterial blooms in-vitro. Sci. Total. Environ. 2017, 598, 77–86. [Google Scholar] [CrossRef]
- Bouvy, M.; Bettarel, Y.; Bouvier, C.; Domaizon, I.; Jacquet, S.; Le Floc’H, E.; Montanié, H.; Mostajir, B.; Sime-Ngando, T.; Torréton, J.P.; et al. Trophic interactions between viruses, bacteria and nanoflagellates under various nutrient conditions and simulated climate change. Environ. Microbiol. 2011, 13, 1842–1857. [Google Scholar] [CrossRef]
- Li, K.; Hu, J.; Li, T.; Liu, F.; Tao, J.; Liu, J.; Zhang, Z.; Luo, X.; Li, L.; Deng, Y.; et al. Microbial abundance and diversity investigations along rivers: Current knowledge and future directions. Wiley Interdiscip. Rev. Water 2021, 8, e1547. [Google Scholar] [CrossRef]
- Hillebrand, H.; Watermann, F.; Karez, R.; Berninger, U.-G. Differences in species richness patterns between unicellular and multicellular organisms. Oecologia 2001, 126, 114–124. [Google Scholar] [CrossRef]
- Chen, S.; Zhou, Y.; Chen, Y.; Gu, J. fastp: An ultra-fast all-in-one FASTQ preprocessor. Bioinformatics 2018, 34, i884–i890. [Google Scholar] [CrossRef] [PubMed]
- Magoč, T.; Salzberg, S. FLASH: Fast length adjustment of short reads to improve genome assemblies. Bioinformatics 2011, 27, 2957–2963. [Google Scholar] [CrossRef] [PubMed]
- Stackebrandt, E.; Goebel, B.M. Taxonomic Note: A Place for DNA-DNA Reassociation and 16S rRNA Sequence Analysis in the Present Species Definition in Bacteriology. Int. J. Syst. Evol. Microbiol. 1994, 44, 846–849. [Google Scholar] [CrossRef] [Green Version]
- Edgar, R.C. UPARSE: Highly accurate OTU sequences from microbial amplicon reads. Nat. Methods 2013, 10, 996–998. [Google Scholar] [CrossRef] [PubMed]
- Wang, Q.; Garrity, G.M.; Tiedje, J.M.; Cole, J.R. Naive Bayesian classifier for rapid assignment of rRNA sequences into the new bacterial taxonomy. Appl. Environ. Microbiol. 2007, 73, 5261–5267. [Google Scholar] [CrossRef] [PubMed] [Green Version]
- Austin, M.P. Relationships among Functional Properties of Californian Grassland. Nature 1968, 217, 1163. [Google Scholar] [CrossRef]
- Sunagawa, S.; Coelho, L.P.; Chaffron, S.; Kultima, J.R.; Labadie, K.; Salazar, G.; Djahanschiri, B.; Zeller, G.; Mende, D.R.; Alberti, A.; et al. Structure and function of the global ocean microbiome. Science 2015, 348, 1261359. [Google Scholar] [CrossRef] [PubMed] [Green Version]
- Han, M.; Gong, Y.; Zhou, C.; Zhang, J.; Wang, Z.; Ning, K. Comparison and interpretation of taxonomical structure of bacte-rial communities in two types of lakes on Yun-Gui plateau of China. Sci. Rep. 2016, 6, 30616. [Google Scholar] [CrossRef] [PubMed] [Green Version]
- Read, D.; Gweon, H.S.; Bowes, M.; Newbold, L.; Field, D.; Bailey, M.J.; Griffiths, R. Catchment-scale biogeography of riverine bacterioplankton. ISME J. 2014, 9, 516–526. [Google Scholar] [CrossRef] [PubMed] [Green Version]
- Zhang, H.-H.; Chen, S.-N.; Huang, T.-L.; Ma, W.-X.; Xu, J.-L.; Sun, X. Vertical Distribution of Bacterial Community Diversity and Water Quality during the Reservoir Thermal Stratification. Int. J. Environ. Res. Public Health 2015, 12, 6933–6945. [Google Scholar] [CrossRef] [PubMed] [Green Version]
- Rusch, D.B.; Halpern, A.L.; Sutton, G.; Heidelberg, K.; Williamson, S.; Yooseph, S.; Wu, D.; Eisen, J.A.; Hoffman, J.M.; Remington, K.; et al. The Sorcerer II Global Ocean Sampling Expedition: Northwest Atlantic through Eastern Tropical Pacific. PLoS Biol. 2007, 5, e77. [Google Scholar] [CrossRef] [PubMed]
- Staley, C.; Pongsilp, N.; Nimnoi, P.; Kaiser, T.; Sadowsky, M.J. Influence of Physicochemical Factors on Bacterial Communities Along the Lower Mekong River Assessed by Illumina Next-Generation Sequencing. Water Air Soil Pollut. 2018, 229, 321. [Google Scholar] [CrossRef]
- Mansour, I.; Heppell, C.M.; Ryo, M.; Rillig, M. Application of the microbial community coalescence concept to riverine networks. Biol. Rev. 2018, 93, 1832–1845. [Google Scholar] [CrossRef] [Green Version]
- Su, X.; Steinman, A.D.; Xue, Q.; Zhao, Y.; Tang, X.; Xie, L. Temporal patterns of phyto-and bacterioplankton and their rela-tionships with environmental factors in Lake Taihu, China. Chemosphere 2017, 184, 299–308. [Google Scholar] [CrossRef] [PubMed]
- Wei, G.; Li, J.; Wang, N.; Gao, Z. Spatial abundance and diversity of bacterioplankton in a typical stream-forming ecosystem, Huangqian Reservoir, China. J. Microbiol. Biotechnol. 2014, 24, 1308–1318. [Google Scholar] [CrossRef] [PubMed] [Green Version]
- Zhou, Z.; Huang, T.; Gong, W.; Li, Y.; Liu, Y.; Zhou, S. Field research on mixing aeration in a drinking water reservoir: Per-formance and microbial community structure. Int. J. Environ. Res. Public Health 2019, 16, 4221. [Google Scholar]
- Vrede, K. Nutrient and Temperature Limitation of Bacterioplankton Growth in Temperate Lakes. Microb. Ecol. 2005, 49, 245–256. [Google Scholar] [CrossRef]
- Ji, B.; Yang, K.; Zhu, L.; Jiang, Y.; Wang, H.; Zhou, J.; Zhang, H. Aerobic denitrification: A review of important advances of the last 30 years. Biotechnol. Bioprocess Eng. 2015, 20, 643–651. [Google Scholar] [CrossRef]
- Yang, Y.; Li, S.; Gao, Y.; Chen, Y.; Zhan, A. Environment-driven geographical distribution of bacterial communities and identification of indicator taxa in Songhua River. Ecol. Indic. 2019, 101, 62–70. [Google Scholar] [CrossRef]
- Dokulil, M.; Teubner, K. Cyanobacterial dominance in lakes. Hydrobiologia 2000, 438, 1–12. [Google Scholar] [CrossRef]
- Xing, P.; & Kong, F. Intra-habitat heterogeneity of environmental factors regulating bacterioplankton community composi-tion in Lake Taihu, China. Aquat. Microb. Ecol. 2007, 48, 113–122. [Google Scholar] [CrossRef]
- Zhu, C.; Zhang, J.; Nawaz, M.Z.; Mahboob, S.; Al-Ghanim, K.A.; Khan, I.A.; Chen, T. Seasonal succession and spatial distribu-tion of bacterial community structure in a eutrophic freshwater Lake, Lake Taihu. Sci. Total Environ. 2019, 669, 29–40. [Google Scholar] [CrossRef]
- Langer, U.; Bohme, L.; Bohme, F. Short communication classification of soil microorganisms based on growth properties: A critical view of some commonly used terms. Z. Pflanzen. Bodenk. 2004, 167, 267. [Google Scholar] [CrossRef]
- Xing, P.; Guo, L.; Tian, W.; Wu, Q.L. Novel Clostridium populations involved in the anaerobic degradation of Microcystis blooms. ISME J. 2010, 5, 792–800. [Google Scholar] [CrossRef] [Green Version]
- Li, H.; Xing, P.; Chen, M.; Bian, Y.; Wu, Q.L. Short-term bacterial community composition dynamics in response to accumula-tion and breakdown of Microcystis blooms. Water Res. 2011, 45, 1702–1710. [Google Scholar] [CrossRef]
- Mujakić, I.; Andrei, A.Ş.; Shabarova, T.; Fecskeová, L.K.; Salcher, M.M.; Piwosz, K.; Koblížek, M. Common Presence of Pho-totrophic Gemmatimonadota in Temperate Freshwater Lakes. mSystems 2021, 6, e01241-20. [Google Scholar] [CrossRef] [PubMed]
- Zhang, H.; Sekiguchi, Y.; Hanada, S.; Hugenholtz, P.; Kim, H.; Kamagata, Y.; Nakamura, K. Gemmatimonas aurantiaca gen. nov., sp. nov., a Gram-negative, aerobic, polyphosphate-accumulating micro-organism, the first cultured representative of the new bacterial phylum Gemmatimonadetes phyl. nov. Int. J. Syst. Evol. Microbiol. 2003, 53, 1155–1163. [Google Scholar] [CrossRef] [PubMed]
- Daims, H.; Taylor, M.; Wagner, M. Wastewater treatment: A model system for microbial ecology. Trends Biotechnol. 2006, 24, 483–489. [Google Scholar] [CrossRef] [PubMed]
- Niu, Y.; Shen, H.; Chen, J.; Xie, P.; Yang, X.; Tao, M.; Ma, Z.; Qi, M. Phytoplankton community succession shaping bacterioplankton community composition in Lake Taihu, China. Water Res. 2011, 45, 4169–4182. [Google Scholar] [CrossRef]
- Brunberg, A.K. Contribution of bacteria in the mucilage of microcystis spp. (Cyanobacteria) to benthic and pelagic bacterial production in a hypereutrophic lake. FEMS Microbiol. Ecol. 1999, 29, 13–22. [Google Scholar] [CrossRef]
- Salomon, P.S.; Janson, S.; Granéli, E. Molecular identification of bacteria associated with filaments of Nodularia spumigena and their effect on the cyanobacterial growth. Harmful Algae 2003, 2, 261–272. [Google Scholar] [CrossRef]
- Grossart, H.P.; Levold, F.; Allgaier, M.; Simon, M.; Brinkhoff, T. Marine diatom species harbour distinct bacterial communi-ties. Environ. Microbiol. 2005, 7, 860–873. [Google Scholar] [CrossRef]
- Li, H.; Xing, P.; Wu, Q.L. Characterization of the bacterial community composition in a hypoxic zone induced by Microcystis blooms in Lake Taihu, China. FEMS Microbiol. Ecol. 2012, 79, 773–784. [Google Scholar] [CrossRef]
- Xing, P.; Zheng, J.; Li, H.; Liu, Q. Methanogen genotypes involved in methane formation during anaerobic decomposition of Microcystis blooms at different temperatures. World J. Microbiol. Biotechnol. 2012, 29, 373–377. [Google Scholar] [CrossRef]
- Mouillot, D.; Graham, N.; Villéger, S.; Mason, N.W.; Bellwood, D.R. A functional approach reveals community responses to disturbances. Trends Ecol. Evol. 2013, 28, 167–177. [Google Scholar] [CrossRef]
- Beck, W.S.; Rugenski, A.T.; Poff, N.L. Influence of experimental, environmental, and geographic factors on nutrient-diffusing substrate experiments in running waters. Freshw. Biol. 2017, 62, 1667–1680. [Google Scholar] [CrossRef] [Green Version]
- Luo, J.; Liang, H.; Yan, L.; Ma, J.; Yang, Y.; Li, G. Microbial community structures in a closed raw water distribution system biofilm as revealed by 454-pyrosequencing analysis and the effect of microbial biofilm communities on raw water quality. Bioresour. Technol. 2013, 148, 189–195. [Google Scholar] [CrossRef] [PubMed]
- Suzuki, D.; Li, Z.; Cui, X.; Zhang, C.; Katayama, A. Reclassification of Desulfobacterium anilini as Desulfatiglans anilini comb. nov. within Desulfatiglans gen. nov., and description of a 4-chlorophenol-degrading sulfate-reducing bacterium, Desulfatiglans parachlorophenolica sp. nov. Int. J. Syst. Evol. Microbiol. 2014, 64, 3081–3086. [Google Scholar] [CrossRef]
- Huang, T.; Guo, L.; Zhang, H.; Su, J.; Wen, G.; Zhang, K. Nitrogen-removal efficiency of a novel aerobic denitrifying bacte-rium, Pseudomonas stutzeri strain ZF31, isolated from a drinking-water reservoir. Bioresour. Technol. 2015, 196, 209–216. [Google Scholar] [CrossRef] [PubMed]
Figure 1.
Distribution map of the reservoir sampling stations.

Figure 2.
Variation of algae density (a) and biomass (b) in the reservoir.

Figure 3.
Composition of the bacterial community in Qingcaosha Reservoir from April to December 2019 (phylum and class levels). The Y-axis is the name of the sample, the X-axis is the proportion of the species in the sample, the different colored columns represent different phylum (a) and class (b), and the length of the columns represents the proportion of the species.


Figure 4.
Inspection of differences in Shannon index values between various groups in the reservoir, spatial groups (a) and temporal groups (b). This diagram shows the significant differences between the selected two groups of samples, and the two groups of markers with significant differences (0.01 < p ≤ 0.05 marked *, 0.001 < p ≤ 0.01 marked **, p ≤ 0.001 marked ***). The X-axis is the grouping name, and Y-axis is the index average of each group.

Figure 5.
PCoA analysis of community composition (spatial groups (a) and temporal groups (b)). Points of different colors or shapes represent samples of different groups. The closer the two sample points are, the more similar the species composition is.
Figure 5.
PCoA analysis of community composition (spatial groups (a) and temporal groups (b)). Points of different colors or shapes represent samples of different groups. The closer the two sample points are, the more similar the species composition is.

Figure 6.
db-RDA analysis of the community structure and environmental factors of bacterioplankton in the reservoir based on spatial (a) and temporal (b) groups. db-RDA analysis of the ST1 bacterial community structure and environmental factors (c), db-RDA analysis of the bacterial community structure and environmental factors in April (d).

Figure 7.
The relationship between species (genus level) and environmental factors was analyzed by heatmap. The X-axis and Y-axis are environmental factors and species, respectively, and the correlation R value and p value are obtained by calculation. The R value is shown in different colors in the figure, and if p value is less than 0.05, it is indicated by *. * 0.01 < p ≤ 0.05, ** 0.001 < p ≤ 0.01, *** p ≤ 0.001.

Figure 8.
Correlation network analysis between bacterioplankton and phytoplankton. The node size in the figure indicates the species abundance, and different colors indicate different species. The color of the connection indicates positive and negative correlation, red indicates positive correlation, and green indicates negative correlation; the diameter of the line represents the size of the correlation coefficient.

Figure 9.
PICRUSt function abundance spectrum in the COG database. The X-axis represents the secondary function number of COG, and Y-axis represents the functional abundance.
Figure 9.
PICRUSt function abundance spectrum in the COG database. The X-axis represents the secondary function number of COG, and Y-axis represents the functional abundance.

Figure 10.
Heatmap of FAPROTAX function prediction. The X-axis is the sample name, and the Y-axis is the functional name. The abundance changes of different functions in the sample are shown by the color gradient of color blocks.
Figure 10.
Heatmap of FAPROTAX function prediction. The X-axis is the sample name, and the Y-axis is the functional name. The abundance changes of different functions in the sample are shown by the color gradient of color blocks.

Figure 11.
Test results for functional group differences (April and December). The X-axis represents the function name, the Y-axis represents the percentage value of a function abundance of the sample, and different colors represent different groups. * 0.01 < p ≤ 0.05, ** 0.001 < p ≤ 0.01, *** p ≤ 0.001.


Table 1.
The average values and ranges of physical and chemical factors of Qingcaosha Reservoir in 2019.
Table 1.
The average values and ranges of physical and chemical factors of Qingcaosha Reservoir in 2019.
| Environmental Factor | ST1 | ST2 | ST3 | ST4 | ST5 | ST6 | ST7 | ST8 |
|---|---|---|---|---|---|---|---|---|
| TP (mg/L) | 0.21 a | 0.22 ab | 0.21 a | 0.17 a | 0.23 a | 0.15 a | 0.17 a | 0.14 a |
| (0.14–0.39) | (0.1–0.4) | (0.09–0.41) | (0.11–0.33) | (0.14–0.43) | (0.08–0.27) | (0.10–0.29) | (0.10~0.20) | |
| TN (mg/L) | 2.10 b | 1.92 b | 1.36 a | 1.35 a | 1.55 a | 1.35 a | 1.25 a | 1.26 a |
| (1.50–2.46) | (1.4–2.31) | (1.19–1.74) | (1.00–1.79) | (1.10–2.12) | (0.99–1.67) | (0.64–1.92) | (0.90–2.03) | |
| NH4+-N (mg/L) | 0.02 a | 0.03 b | 0.02 a | 0.02 a | 0.01 a | 0.01 a | 0.01 a | 0.01 a |
| (0.004–0.031) | (0.013–0.053) | (0.009–0.064) | (0.01–0.024) | (0.004–0.021) | (0.005–0.015) | (0.009–0.017) | (0.002–0.012) | |
| NO3−-N (mg/L) | 1.29 b | 1.21 ab | 1.00 a | 1.08 a | 1.16 ab | 1.03 a | 0.99 a | 1.02 a |
| (1.07–1.63) | (0.93–1.56) | (0.75–1.23) | (0.89–1.41) | (0.91–1.55) | (0.91–1.32) | (0.51–1.3) | (0.92–1.24) | |
| COD (mg/L) | 22 a | 24 a | 19 a | 19 a | 21 a | 19 a | 11 a | 15 a |
| (10–36) | (10–39) | (12–31) | (8–32) | (11–36) | (12–37) | (3–21) | (3–22) | |
| Chl a (μg/L) | 12.00 a | 14.38 ab | 16.06 ab | 21.98 b | 16.38 ab | 20.71 b | 32.95 c | 28.39 c |
| (1.22–24.79) | (8.22–28.22) | (13.36–23.69) | (16.71–29.37) | (4.11–24.11) | (20.25–21.22) | (22.47–42.39) | (25.88–36.57) | |
| SD (cm) | 0.29 a | 0.47 a | 0.76 b | 0.78 b | 0.49 a | 0.77 b | 0.79 b | 0.83 b |
| (0.15–0.50) | (0.15–0.91) | (0.45–1.26) | (0.40–1.25) | (0.20–0.90) | (0.43–1.09) | (0.50–0.93) | (0.49–1.07) | |
| pH | 8.11 a | 8.15 a | 9.15 a | 9.26 a | 9.12 a | 8.92 a | 8.58 a | 8.62 a |
| (6.36–9.19) | (7.46–8.59) | (8.60–10.27) | (8.56–10.04) | (8.37–10.63) | (8.38–10.08) | (7.39–9.75) | (6.63–10.01) | |
| DO (mg/L) | 8.33 a | 9.52 a | 10.24 a | 10.09 a | 9.49 a | 9.84 a | 9.31 a | 9.21 a |
| (5.3–10.77) | (8.0–10.63) | (9.37–11.95) | (9.11–11.7) | (5.3–12.66) | (8.48–12.04) | (6.87–11.90) | (6.76–12.12) | |
| Cond (μs/cm) | 330.24 a | 313.68 a | 302.87 a | 302.46 a | 323.11 a | 305.44 a | 306.90 a | 306.40 a |
| (254.30–469.50) | (261.30–383.10) | (247.20–352.10) | (247.90–351.90) | (274.60–400.70) | (260.40–357.10) | (258.40–353.20) | (253.60–351.50) |
abc represents data from small to large. Noting the same letter indicates no significant difference between groups. Tag ab indicates between two sets of data.
Table 2.
Dominant species of phytoplankton in the reservoir from April to December.
| Phylum | Dominant Species | Apr. | May | Jun. | Jul. | Aug. | Sep. | Oct. | Nov. | Dec. |
|---|---|---|---|---|---|---|---|---|---|---|
| Cyanophyta | Synechococcus bigranulatus | 0.471 | - | - | - | - | - | - | - | - |
| Pseudanabaena sp. | - | - | - | 0.080 | 0.171 | 0.692 | 0.522 | 0.173 | ||
| Scenedesmus quadricauda | - | - | - | - | 0.024 | - | - | - | - | |
| Merismopedia minima | - | - | - | - | - | - | 0.115 | - | 0.050 | |
| Aphanocapsa delicatissima | - | - | - | - | - | - | 0.082 | - | - | |
| Bacillariophyta | Melosira granulata | - | 0.644 | 0.578 | 0.459 | 0.195 | 0.038 | 0.029 | 0.103 | 0.050 |
| Cyclotella sp. | - | 0.020 | 0.027 | 0.103 | 0.047 | 0.035 | 0.318 | 0.540 | ||
| Melosira granulata var. angustissima | - | 0.101 | 0.092 | 0.335 | 0.169 | |||||
| Cyclotella meneghiniana | - | - | - | - | - | - | - | 0.077 | 0.062 | |
| Synedra acus | 0.121 | - | - | - | - | - | - | - | - | |
| Chlorophyta | Oedogonium sp. | - | 0.113 | 0.105 | - | - | - | - | - | - |
| Pandorina morum | - | - | 0.037 | - | - | - | - | - | - | |
| Chlorella sp. | - | - | - | - | 0.055 | 0.022 | - | 0.101 | 0.149 | |
| Scenedesmus quadricauda | - | - | 0.048 | - | - | - | - | - | 0.050 | |
| Chlamydomonas sp. | - | 0.063 | 0.025 | - | - | - | - | 0.042 | 0.023 |
Note: - represents that species were not dominant during the period.
Table 3.
Alpha diversity analysis of the bacterioplankton community in Qingcaosha Reservoir.
| Shannon | Apr. | May | Jun. | Jul. | Sep. | Aug. | Oct. | Nov. | Dec. |
|---|---|---|---|---|---|---|---|---|---|
| ST1 | 5.05522 | 4.327022 | 3.271228 | 4.320451 | 4.746119 | 3.167453 | 5.104217 | 5.051481 | 4.195682 |
| ST2 | 5.20597 | 4.930877 | 4.724719 | 4.823673 | 5.199873 | 4.879845 | 5.552623 | 5.168004 | 4.839735 |
| ST3 | 4.706655 | 3.876587 | 5.130286 | 4.736654 | 5.164861 | 4.87874 | 5.797169 | 3.441698 | 4.333132 |
| ST4 | 4.532297 | 4.413602 | 3.883676 | 4.082314 | 5.189498 | 4.594758 | 5.462392 | 3.929142 | 4.153756 |
| ST5 | 4.932523 | 3.714345 | 4.279125 | 2.913335 | 4.766668 | 5.57698 | 5.439537 | 4.635082 | 5.015866 |
| ST6 | 4.83352 | 3.521203 | 4.548778 | 4.052488 | 4.936798 | 5.134269 | 5.119537 | 4.229695 | 4.801377 |
| ST7 | 5.28414 | 5.215375 | 5.28474 | 3.400411 | 5.128758 | 4.986939 | 5.268078 | 4.335306 | 4.450574 |
| ST8 | 4.917163 | 3.918191 | 3.08248 | 4.515715 | 4.766734 | 5.534643 | 5.327223 | 4.298399 | 4.610231 |
Publisher’s Note: MDPI stays neutral with regard to jurisdictional claims in published maps and institutional affiliations. |
© 2021 by the authors. Licensee MDPI, Basel, Switzerland. This article is an open access article distributed under the terms and conditions of the Creative Commons Attribution (CC BY) license (https://creativecommons.org/licenses/by/4.0/).
Share and Cite
MDPI and ACS Style
Liu, S.; Zhao, F.; Fang, X. The Relationship between the Community Structure and Function of Bacterioplankton and the Environmental Response in Qingcaosha Reservoir. Water 2021, 13, 3155. https://doi.org/10.3390/w13223155
AMA Style
Liu S, Zhao F, Fang X. The Relationship between the Community Structure and Function of Bacterioplankton and the Environmental Response in Qingcaosha Reservoir. Water. 2021; 13(22):3155. https://doi.org/10.3390/w13223155
Chicago/Turabian StyleLiu, Shumin, Fengbin Zhao, and Xin Fang. 2021. "The Relationship between the Community Structure and Function of Bacterioplankton and the Environmental Response in Qingcaosha Reservoir" Water 13, no. 22: 3155. https://doi.org/10.3390/w13223155
Note that from the first issue of 2016, this journal uses article numbers instead of page numbers. See further details here.