
Development and Assessment of a New Framework for Agricultural Nonpoint Source Pollution Control

Research Center for Environment, Ecology Strategic Planning and Regional Development, Ministry of Ecology and Environment of the People’s Republic of China, Beijing 100029, China
*
Author to whom correspondence should be addressed.
Water 2021, 13(22), 3156; https://doi.org/10.3390/w13223156
Submission received: 12 August 2021
/
Revised: 29 October 2021
/
Accepted: 29 October 2021
/
Published: 9 November 2021
(This article belongs to the Special Issue Point-Source and Diffuse Water Pollution)
Abstract
:The transport of agricultural nonpoint source (NPS) pollutants in water pathways is affected by various factors such as precipitation, terrain, soil erosion, surface and subsurface flows, soil texture, land management, and vegetation coverage. In this study, based on the transmission mechanism of NPS pollutants, we constructed a five-factor model for predicting the path-through rate of NPS pollutants. The five indices of the hydrological processes, namely the precipitation index (α), terrain index (β), runoff index (TI), subsurface runoff index (LI), and buffer strip retention index (RI), are integrated with the pollution source data, including the rural living, livestock and farmland data, obtained from the national pollution source census. The proposed model was applied to the headwater of the Miyun Reservoir watershed for identifying the areas with high path-through rates of agricultural NPS pollutants. The results demonstrated the following. (1) The simulation accuracy of the model is acceptable in mesoscale watersheds. The total nitrogen (TN) and total phosphorus (TP) agriculture loads were determined as 705.11 t and 3.16 t in 2014, with the relative errors of the simulations being 19.62% and 24.45%, respectively. (2) From the spatial distribution of the agricultural NPS, the TN and TP resource loads were mainly distributed among the upstream of Dage and downstream of Taishitun, as well as the towns of Bakshiying and Gaoling. The major source of TN was found to be farmland, accounting for 47.6%, followed by livestock, accounting for 37.4%. However, the path-through rates of TP were different from those of TN; rural living was the main TP source (65%). (3) The path-through rates of agricultural NPS were the highest for the towns of Wudaoying, Dage, Tuchengzi, Anchungoumen, and Huodoushan, where the path-through rate of TN ranged from 0.17 to 0.26. As for TP, it was highest in Wudaoying, Kulongshan, Dage, and Tuchengzi, with values ranging from 0.012 to 0.019. (4) A comprehensive analysis of the distribution of the NPS pollution load and the path-through rate revealed the towns of Dage, Wudaoying, and Tuchengzi as the critical source areas of agricultural NPS pollutants. Therefore, these towns should be seriously considered for effective watershed management. In addition, compared with field monitoring, the export coefficient model, and the physical-based model, the proposed five-factor model, which is based on the path-through rate and the mechanism of agricultural NPS pollutant transfer, cannot only obtain the spatial distribution characteristics of the path-through rate on a field scale but also be applicable to large-scale watersheds for estimating the path-through rates of NPS pollutants.
1. Introduction
The second national census of pollution sources indicated that agriculture is the leading cause of nonpoint source (NPS) pollution in China [1]. Sustainable agriculture depends on a delicate balance between economic stability (achieved through the increase in agricultural productivity to meet national food demands), reduction in the use of finite natural resources, and reduction of NPSs, which have detrimental effects on the environment [2,3]. Contrary to point source pollution, NPS pollution is characterized by random and intermittent occurrences, complex mechanisms and processes, uncertain discharge channels and amounts, variable spatial and temporal pollution loads, and difficulties in monitoring, simulation, and control [4]. These characteristics cause challenges in the simulation and evaluation of the transport processes of NPS pollutants from agricultural sources to sinks [5].
Many studies have indicated that NPS pollution is closely related to watershed runoff and confluence, while it is not evidently related to watershed-scale loading and concentration [6]. In general, the migration of NPS pollutants and their transport process can be divided into two hydrological processes: the generation of pollutants and their transfer to waterbodies [7]. The path-through rate is an all-new concept and a comprehensive parameter that can describe the NPS pollution transfer process, starting from pollutant generation to transfer to waterbodies [8]. Based on this concept, risk assessment can be performed for NPS pollutants from each grid to the receiving waterbodies in the watershed scale by determining the risk grade according to the water criteria of different water environmental function zones. Although some scholars have also conducted similar studies through point monitoring (based on the coefficient of NPSs into the river), their results cannot be extended to the watershed scale. In particular, the pollutants generated and accumulated in watersheds are derived, transmitted, and intercepted by precipitation, slope, and other surface and terrain factors, expressed as a scaling factor, which is obtained by dividing the part of the pollutant load transferred to waterbodies by the total pollutant load.
Currently, there are approximately three types of estimation methods for calculating the path-through rate of watershed agricultural NPS pollutants: field monitoring, the traditional empirical model, and physical-based models [9]. Field monitoring has several advantages such as high accuracy and the ability to monitor the entire migration process of NPS pollutants. However, owing to its high cost and time requirement [10], it is more applicable to small-scale watersheds or fields rather than to large-scale watersheds on a national scale.
The traditional empirical model involves the export coefficient mode (ECM), hydrologic curve partitioning, the soil conservation service curve number (SCN-CN), and so on. [11]. This model integrates the transport process as a “black box” or “gray box” model, completely ignoring the migration mechanism and the transformation of NPS pollutants at the watershed scale [12]. In addition, the export coefficients are inherently highly variable and reflect particular site conditions for each study. Physical-based models include SWAT, HSPF, and AnnAGNPS, which are integrated with a large number of parameters and functional formulas for simulating the whole process of NPS pollutant transfer from sources to sinks and are more commonly applied for mesoscale watersheds. However, there are uncertainties with regard to their practical application because of differences in input data, insufficient localization of parameters, and lack of operator experience [13].
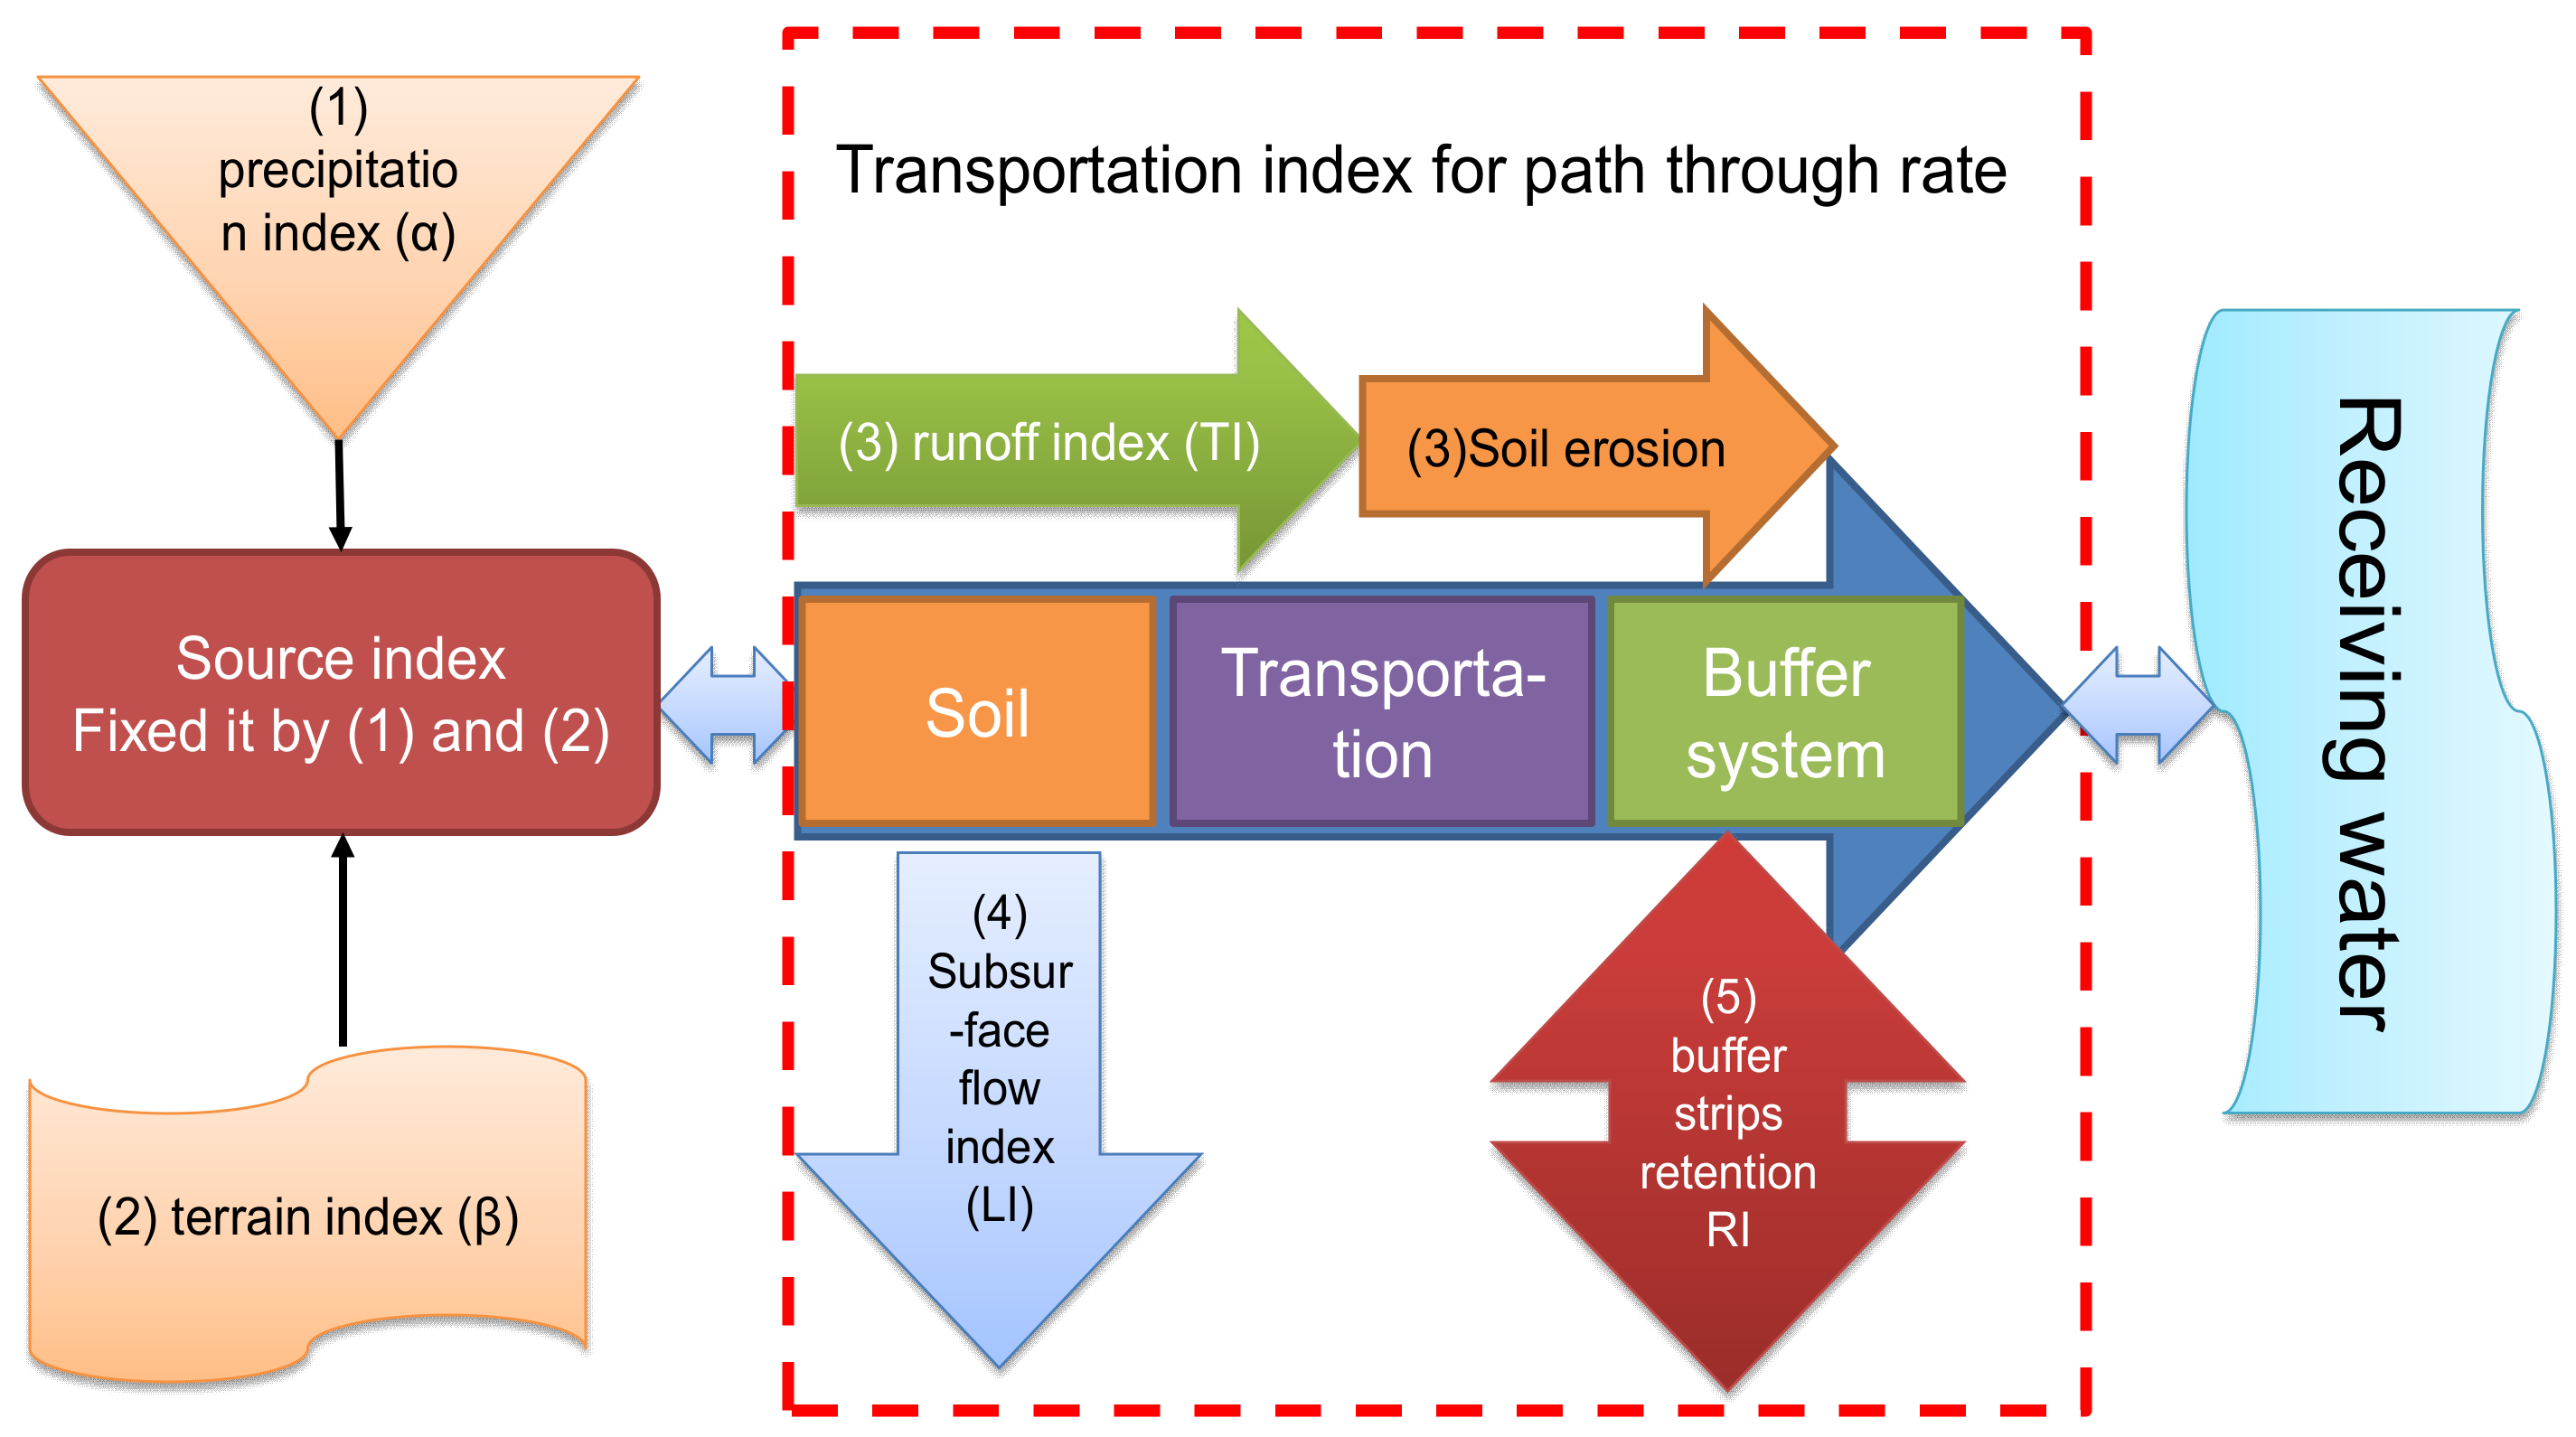
To overcome these weaknesses and to fully leverage the advantages of the existing physical-based and empirical models, two hypotheses were proposed. First, it is possible to generalize the major process of transfer of pollutants from sources to sinks, and second, the generalized process can be integrated into a new model on the watershed and administrative scales. In this study, a novel path-through rate model of NPS pollutants is developed using five major factors, namely the precipitation index (α), terrain index (β), runoff index (LI), subsurface runoff index (TI), and buffer strip retention index (RI). Hereafter, the model is referred to as the path-through rate five-factor model (or PTRFFM). The technical framework of the PTRFFM is illustrated in Figure 1. To check the reliability of the PTRFFM, a case study is conducted in a headwater watershed of a prominent drinking water supply in the Beijing-Tianjin-Hebei region. Overall, the objective of this study is to establish the PTRFFM to predict the path-through rate of NPS pollutants jointly on the watershed and administrative scales and estimate the resources, load, and distribution of agricultural NPS pollutants. The study also aims to verify the reliability of the PTRFFM through the assessment of the pollution load, critical source areas, and spatial distribution.
2. Methods and Materials
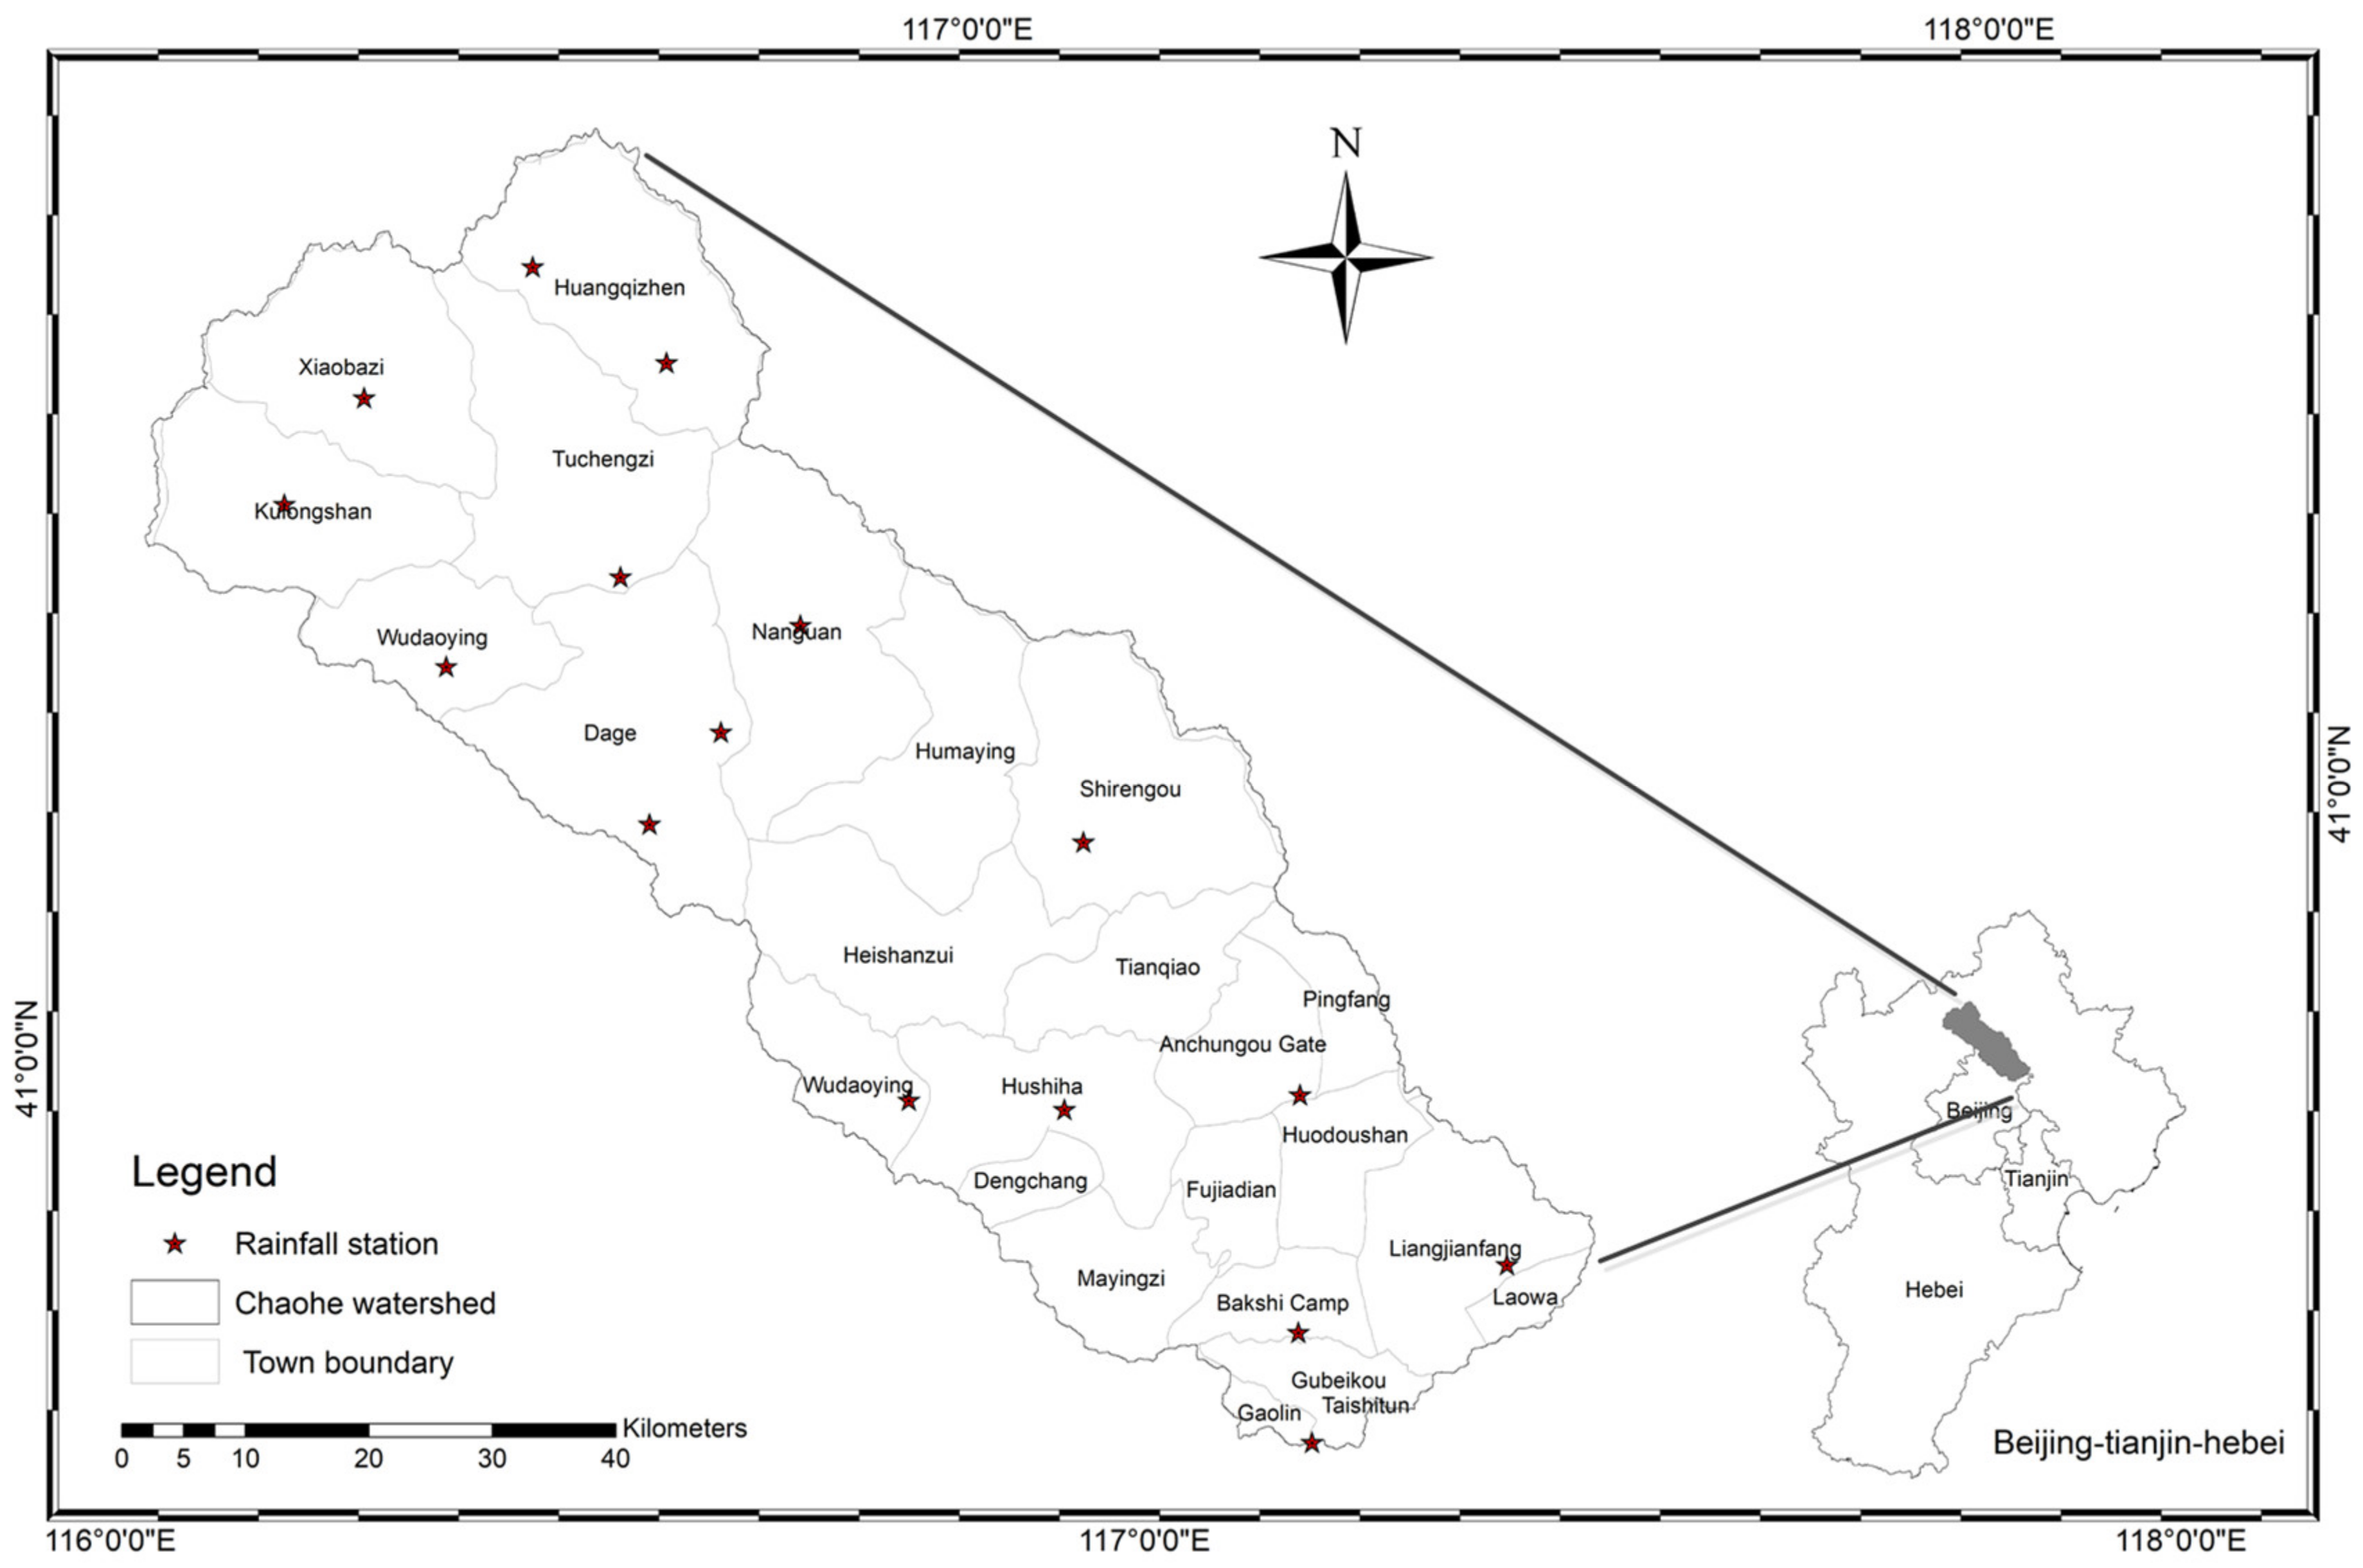
2.1. Study Area
The Miyun Reservoir is the most important source of drinking water in the Beijing-Tianjin-Hebei region (Figure 2). The Chaohe watershed is the upper watershed of the Miyun Reservoir, and it covers a drainage area of 4888 km2, consisting of 16 rainfall stations and 3 hydrology stations. The average annual precipitation is between 350 mm and 630 mm, where approximately 70% of the precipitation occurs from June to September, during which the region frequently receives heavy rainfalls.
The watershed governs 24 towns, which are mainly composed of agricultural populations (~390,000). Livestock, poultry farming, and agriculture are more developed in the area compared with other industries, and the main crops are wheat, corn, and soybean. In the recent two decades, agricultural NPS pollution has become the dominant factor affecting the water quality of the Miyun Reservoir, where nitrogen and phosphorus predominantly limit the eutrophication of water bodies. Consequently, forecasting the critical source areas of the upper watershed is highly significant for ensuring the safety of the water environments and promoting sustainable development in this area.
2.2. Construction of the PTRFFM
2.2.1. Conceptualization of Five Major Parameters
Considering the effects of precipitation, terrain, runoff, surface runoff, and buffer strip retention on NPS pollution, the five-factor model is described by Equation (1).
where is the path-through rate, is the precipitation index, is the terrain index, is the surface index (mm), is the subsurface runoff index (mm), and is the buffer strip retention index. These five indices are correlated with the spatial unit (grid cell), which was set to be 30 m × 30 m based on the digital elevation model (DEM), precipitation, slope, land use, and vegetation coverage map using ArcGIS 10.2.
Precipitation index. The precipitation index (α) is determined by multiplying the impact factors of the spatial and temporal changes in annual precipitation, denoted by and , respectively. In this paper, the spatial changes in precipitation are obtained from the rainfall data of 16 stations based on the inverse distance weighting interpolate method. The NPS pollution load delivered to a river is positively correlated with precipitation; therefore, the NPS pollutant loss can be identified as a function of rainfall [14].
where is the annual loss of NPS pollutants that drain into rivers with runoff (kg), which can be obtained by observing the outlets, and r is the annual rainfall in the entire study watershed for a given year (mm). According to hydrology and water quality data, monitored by 16 hydrological stations near the Chaohe River watershed from 1991 to 2018, the correlation equation between the watershed annual rainfall and the load of the NPS pollutants discharged into rivers can be realized as follows:
In addition, the spatial variation impact factor , is obtained as, where is the annual rainfall in a grid cell for a given year (mm) and
is the average rainfall of the entire watershed for a given year (mm).
Terrain index. The terrain index (β) is used to describe the terrain heterogeneity effect on NPS pollutant loads. Many studies have demonstrated that the slope has a profound impact on parameters such as runoff flux and velocity. Since runoff is the primary carrier of nutrients, nutrient loss is also greatly impacted by the slope [15]. The relationship between the runoff and slope can be established as shown below [16]:
where is the slope for grid j (30 m × 30 m), and is the average slope of the entire study watershed. The temporal variation of the terrain is not remarkable in short time periods; therefore, the value varies for different grid cells. In a specific grid cell, the value does not change over the year.
The runoff index (TI) was used for the calculation of the runoff index using the Soil Conservation Services Curve Number method (Soil conservation service curve number, SCS-CN) [17].
where is the runoff depth (mm); CN is the curve number, which is a function of land use, soil, management, and hydrologic condition; P is the rainfall of the watershed (mm/a); S is the potential maximum retention (mm/a). In SCS models, soils are defined by groups based on their runoff potential-low, moderately low, moderately high, and high.
Subsurface flow index. In China, NPS pollution by nitrate leaching is not exclusively limited to intensively used agricultural ecosystems, but it has also been reported for forest ecosystems exposed to high loads of atmospheric N deposition. LI is a widespread method for evaluating the soil water infiltration capacity with regard to the impact on the losses of nitrogen and phosphorus, through which hydrological soil groups are based on the soil type, land use, and previous soil moisture condition. LI is determined by multiplying the rainfall spatial distribution index (PI) and seasonal distribution index (SI), where the PI represents the maximum theoretical rainfall that can be used for the infiltration of watershed units and SI represents the effect of seasonal rainfall changes on the soil moisture infiltration [18,19]. The specific calculation formula is as follows:
where prec is the annual precipitation (mm/a), S is the annual potential maximum retention (mm/a), and prec(ls) is the total precipitation in non-flood seasons (November to May of the following year).
Buffer strip retention. Runoff rates have spatial patterns controlled by loading and filtering along with the flow paths from the upslope contributing area and downslope dispersal area [20]. RI values are a relative estimate of high to low buffering, and they represent a relative buffering likelihood. RI can be expressed as follows:
where is the cumulative trapping efficiency within a dispersal area, and is the average slope of a dispersal area.
Soil erosion index. Phosphorus is lost in the form of particles in water reservoirs owing to soil erosion. The universal soil loss equation is applied to evaluate the path-through rate of total phosphorus in this study [21].
where A is the estimated average soil loss in tons per acre per year, R is the rainfall-runoff erosivity factor, K is the soil erodibility factor, L is the slope length factor, S is the slope steepness factor, C is the cover management factor, and P is the support practice factor.
2.2.2. Data Standardization of the PTRFFM
The five-factor raster data are standardized to unify the calculation unit. After the normality test, the standardization of the normal and skewed distribution data is calculated as follows:
where X and NX are standardization factors, is the value of each factor for grid i, is the minimum grid value for each factor, is the maximum grid value for each factor, is the maximum value for factor i, and is the median for factor i.
The precipitation and terrain indices are both dimensionless quantities; therefore, α and β do not need to be standardized. TI, LI, RI, and A have dimensions to ensure that the NPS pollutant load to water bodies is less than the pollutant source load; therefore, they need to be standardized, and then a spatial overlay operation needs to be performed for each of the standardized results. The standardization method of total nitrogen (TN) and total phosphorus (TP) is as follows:
2.3. Data Source
The input data include a DEM, land use, soil type, vegetation map, weather data, hydrological data, and socioeconomic data of the study area (Table 1). The land-use types are classified into five types: farmland, grassland, forest, residential land, and unused land. The NPS of the study watershed is categorized into three types: rural living, livestock, and land use.
2.4. Estimation of the Agricultural NPS Pollutant Loads
The ECM is used to estimate the NPS loads when the path-through rate is obtained using the PTRFFM. The calculation method is as follows:
where L is the loss of nutrients (kg), is the export coefficient of the nutrient source i (kg·ca−1·a−1 or kg·km−2·a−1) (see Table 2 for details), is the area of the watershed occupied by the land use type i (km2), or the number of livestock type I, or of people, is the nutrient input to the source i (kg), and p is the path-through rate of each grid.
3. Results and Discussion
3.1. Major Parameters of the Spatial Distribution from the PTRFFM
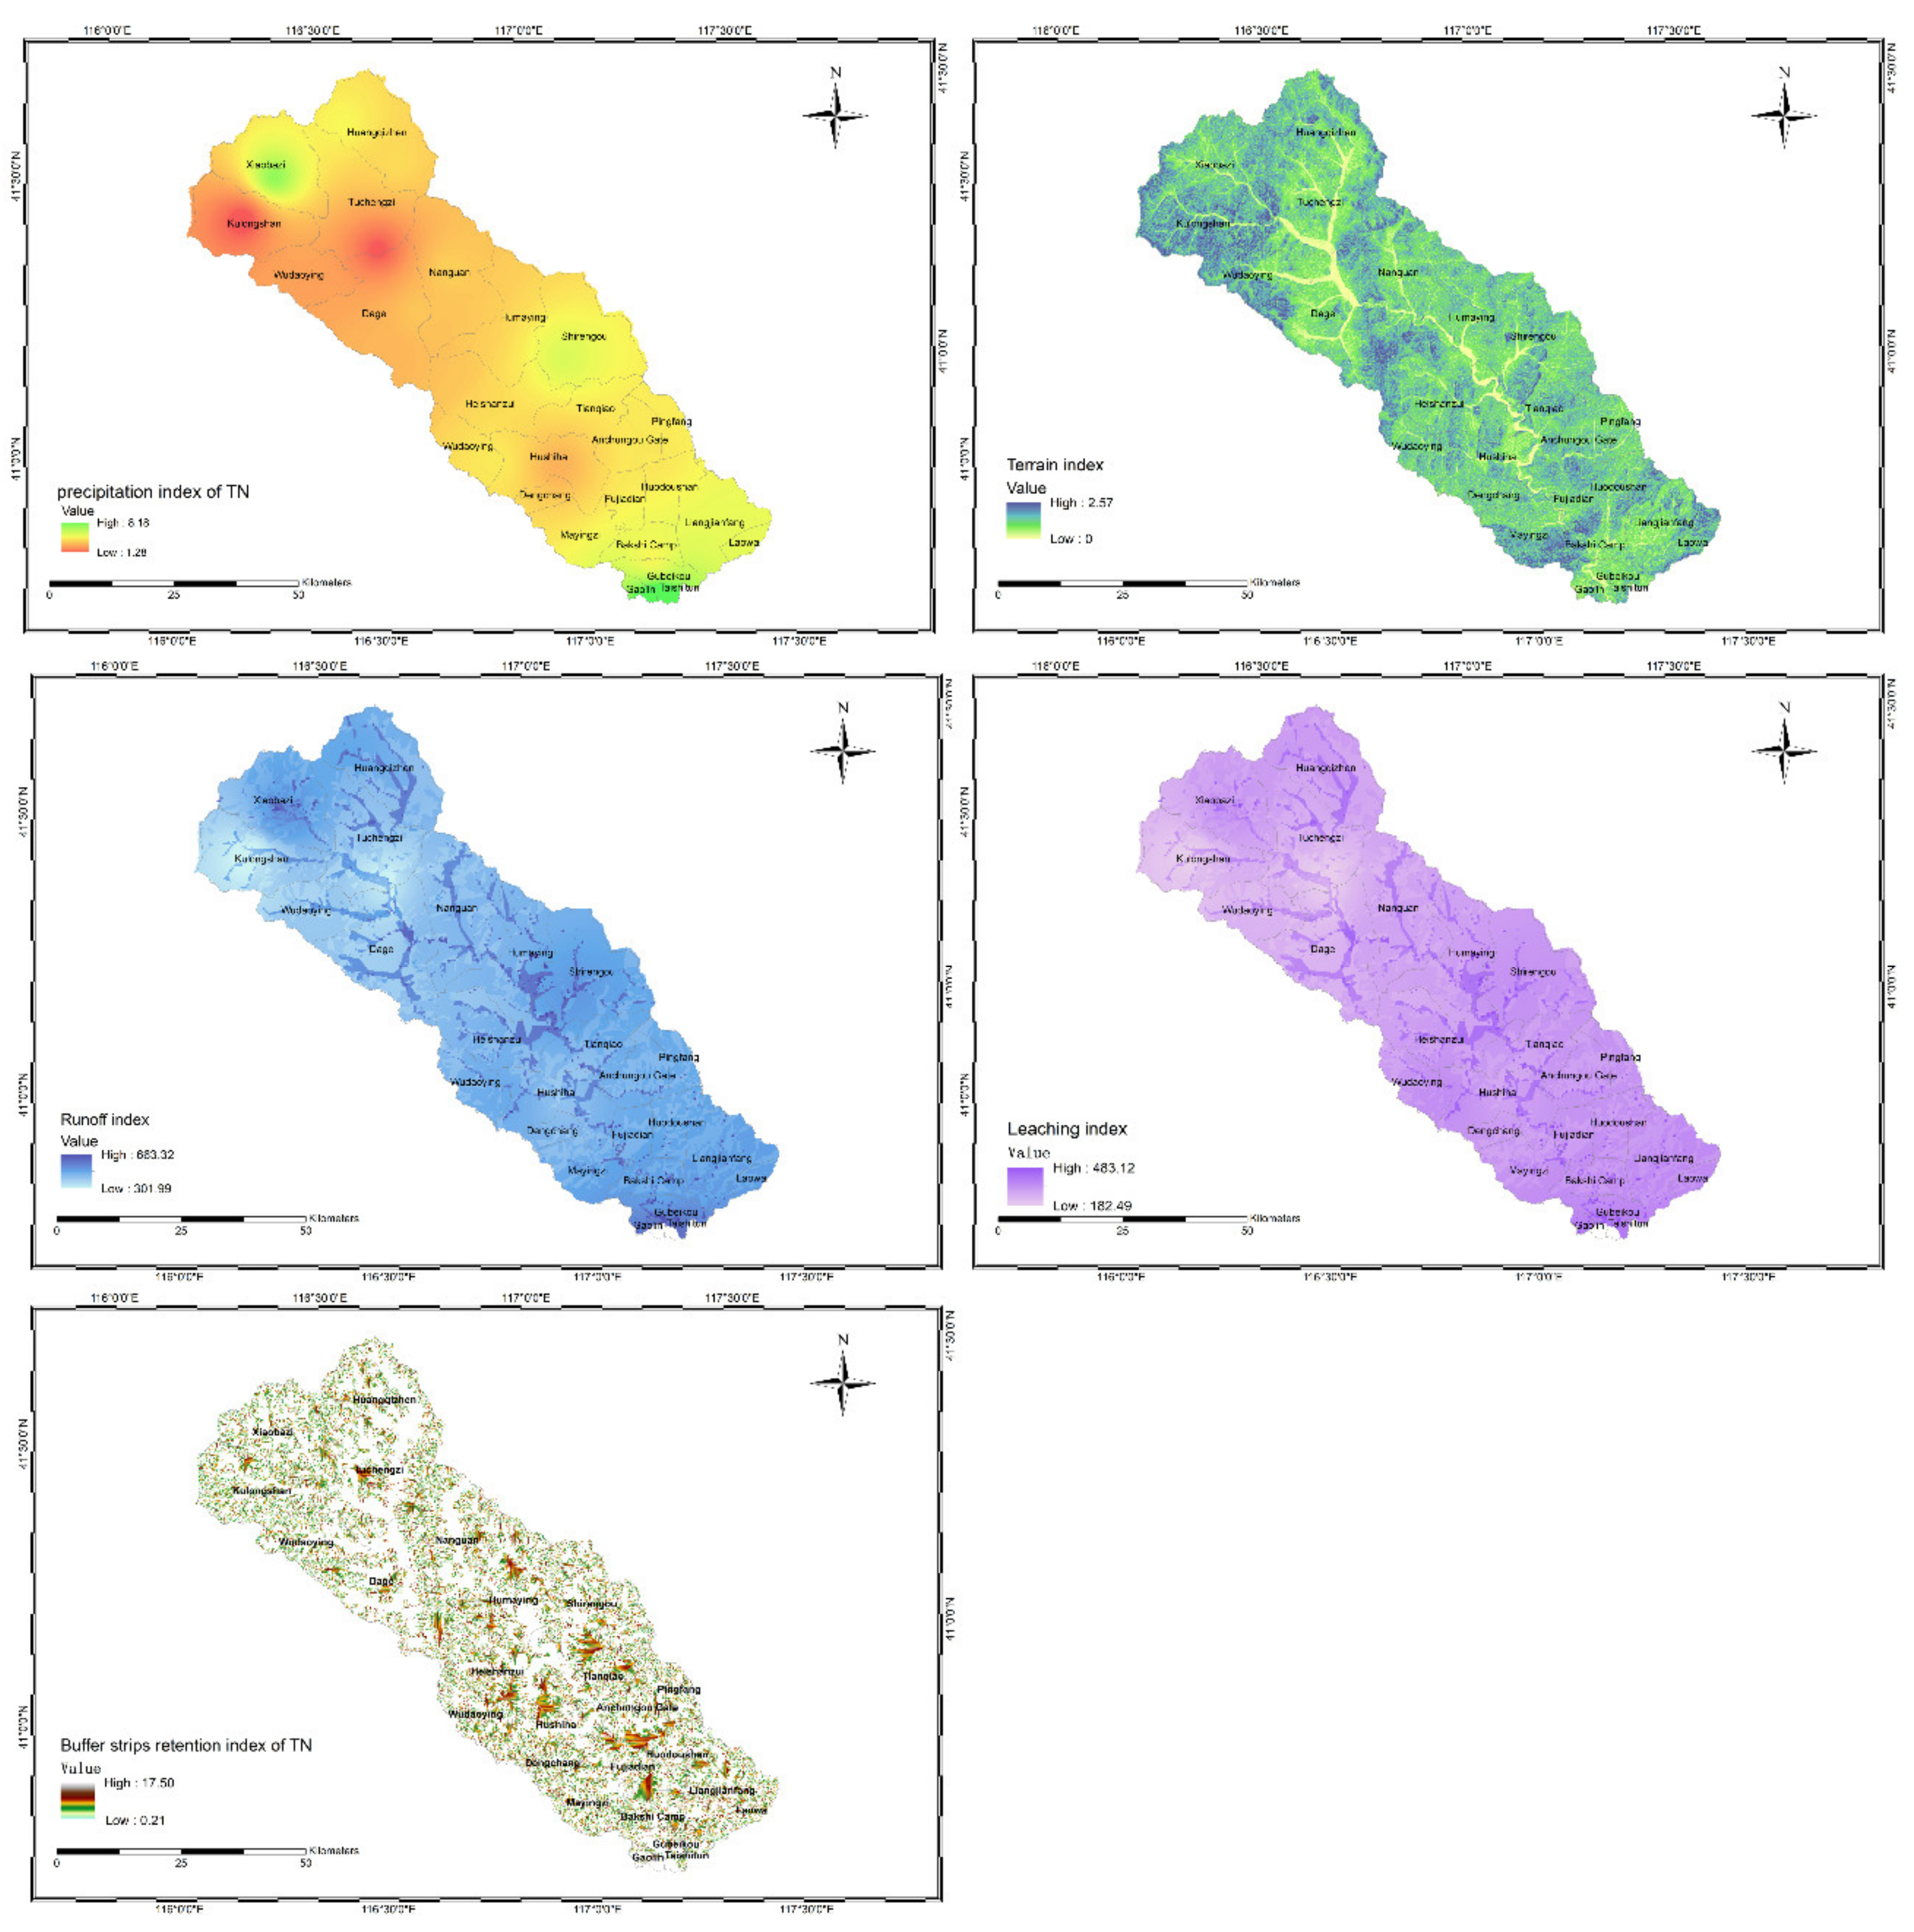
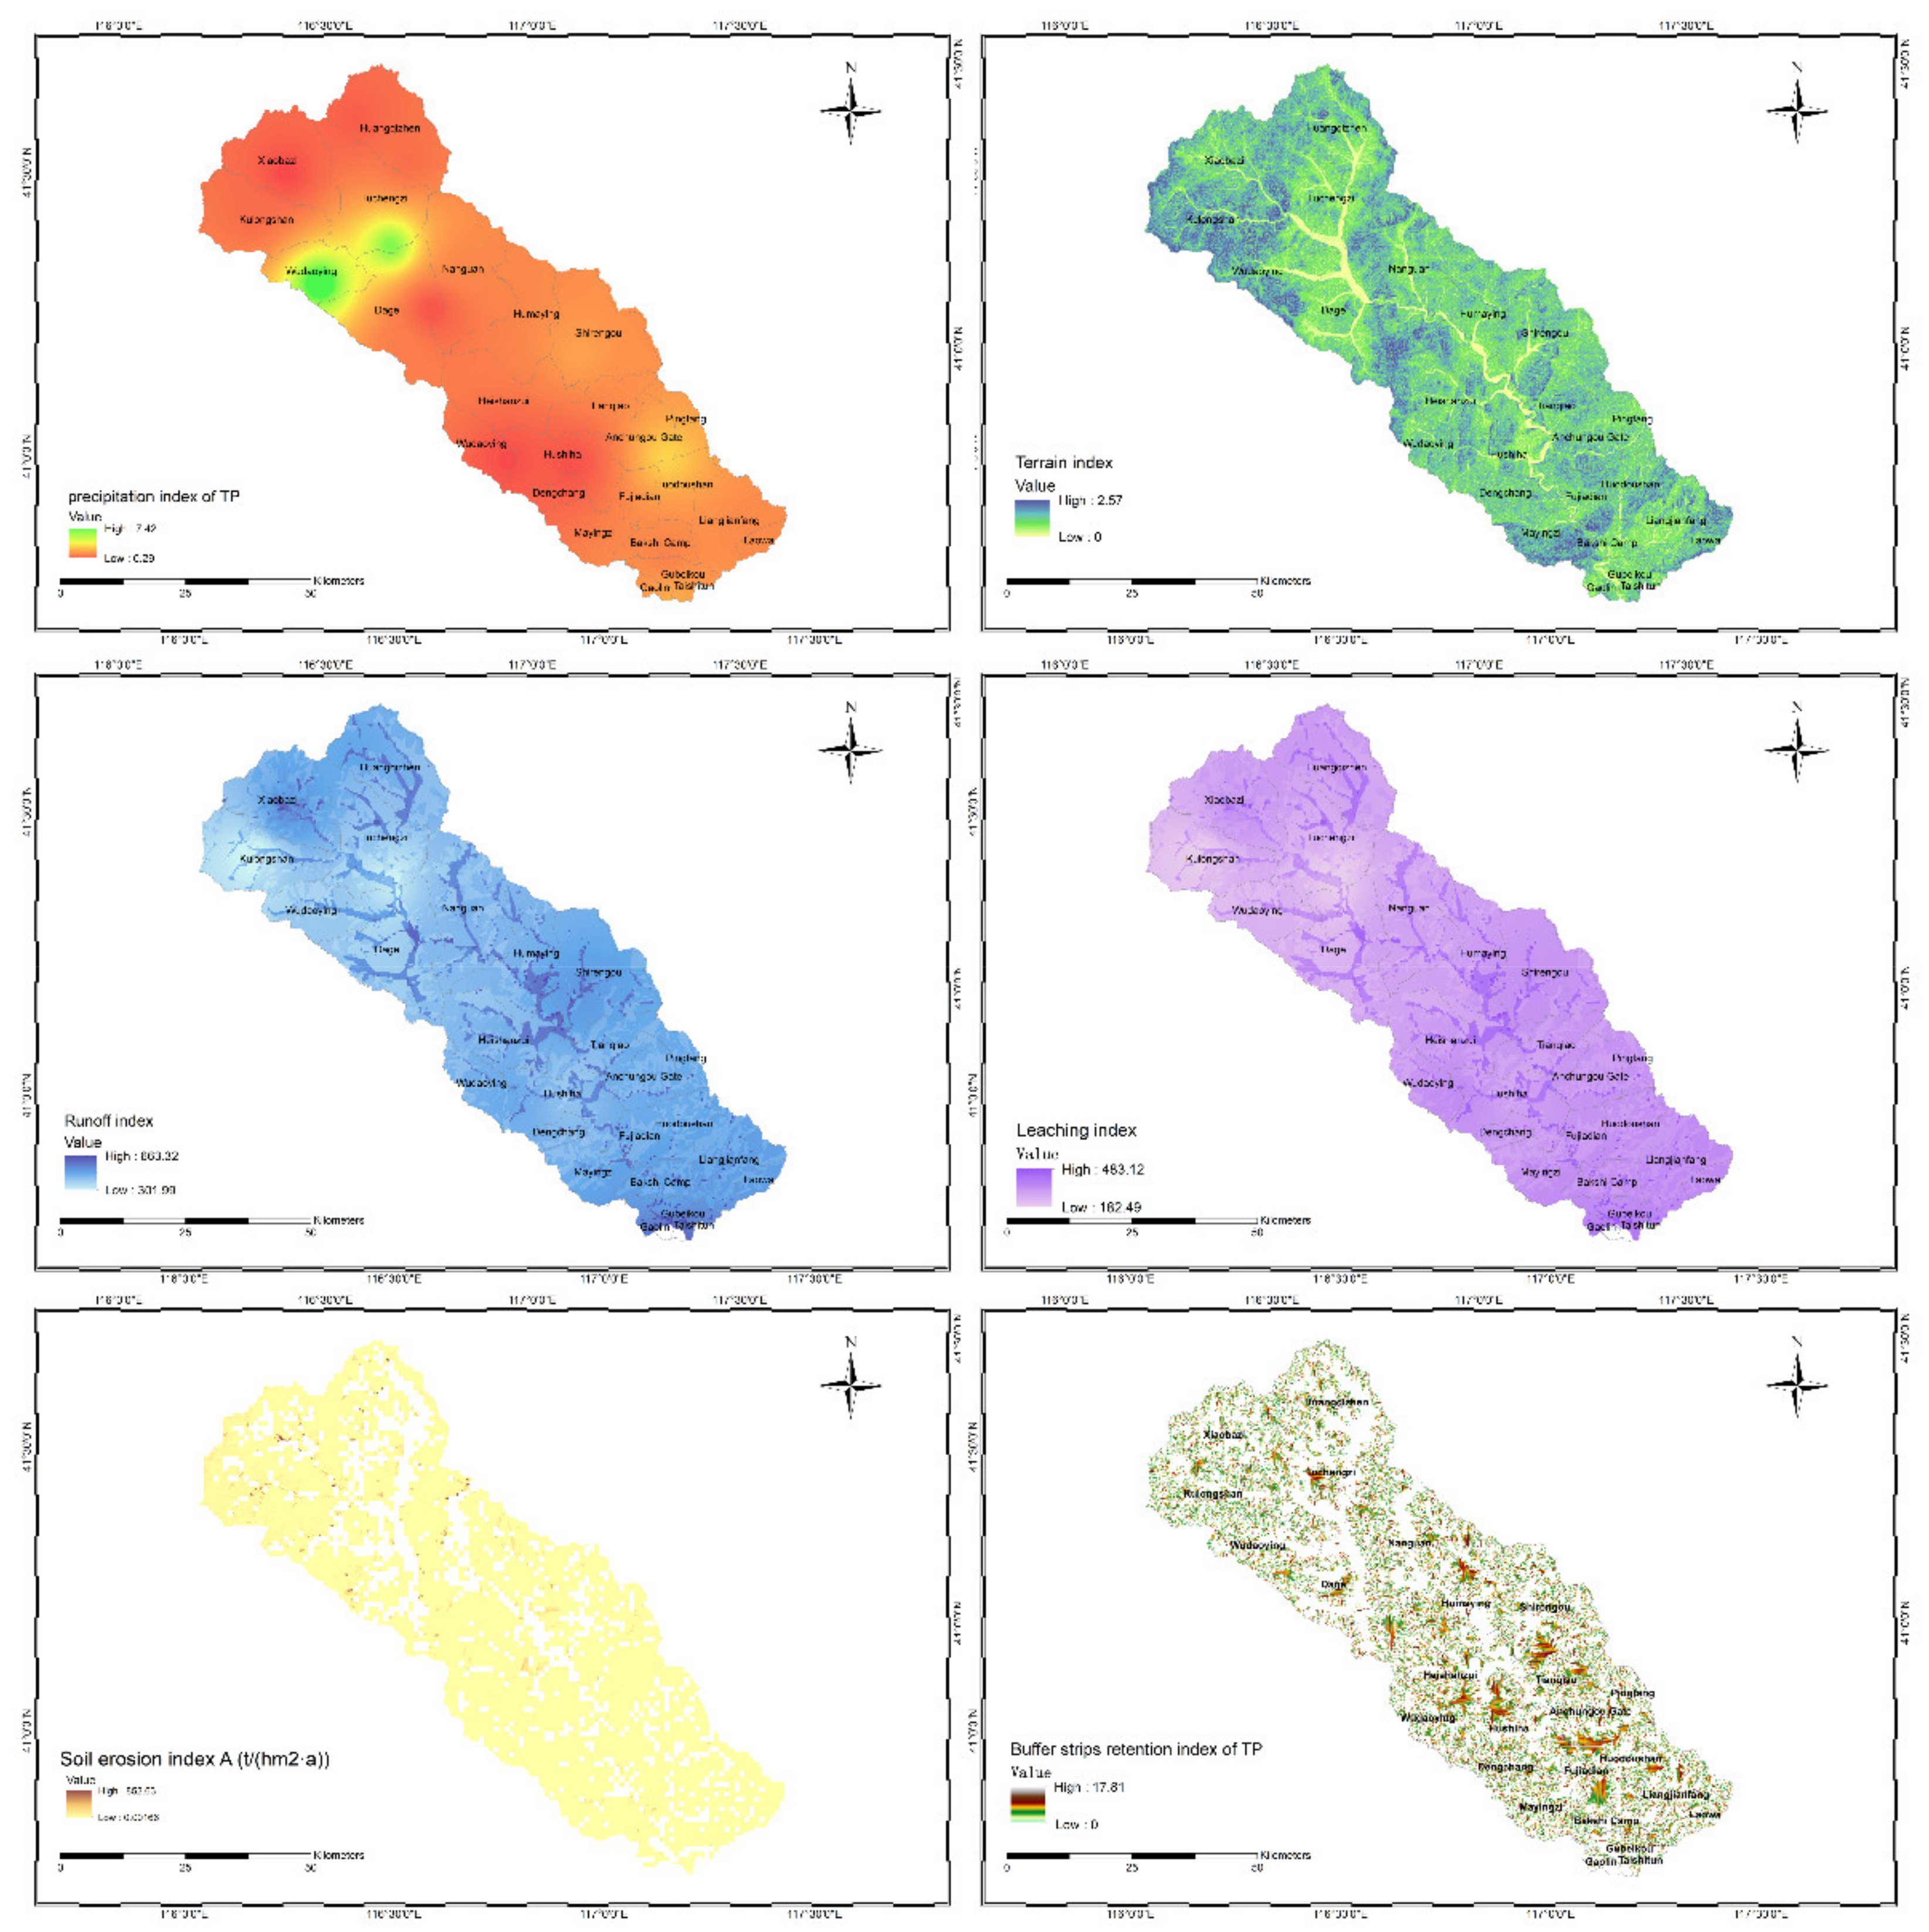
The results show that αTN and αTP were 1.28–8.18 and 0.29–7.42, respectively. β, LI, and TI were the same for TN and TP, that is, 0–2.57, 301.99–663.32 mm, and 182.49–483.12 mm, respectively. In addition, RITN and RITP were 0.21–17.5 and 0–17.81, respectively, and ATP was 0.00166–852.63 (t/(hm2·a)).
A comprehensive analysis of the spatial distribution of the five factors (Figure 3 and Figure 4), TN, TP, α, LI, and TI was performed; the results show a high similarity of the spatial distribution characteristics with the rainfall map. Specifically, the areas with high rainfall (upstream Wudaoying, Tuchengzi, Dage, Anchungoumen, and downstream Tuchengzi) also had high α, LI, and TI because these three indices were mainly calculated on the basis of rainfall. The terrain index β is proportional to the watershed slope, showing a high trend in some parts northwest and a low trend in the cultivated land in the valley. From the perspective of the impact degree of the land use, the cultivated land area was characterized by high LI and TI and low β and RI. The likely reason for this trend is that the CN value of the cultivated land was larger than those of other types of land use, which promoted the generation of surface and subsurface runoffs. In addition, β of the cultivated land in the valley was lowest because of the gentle slope in the area. Low RI is possibly because of interception by forest grass and the water surface buffer system. Thus, cultivated land has no intercepting effect on NPS pollution.
3.2. Spatial Distribution Characteristics of the Path-through Rate
For a field of scale (Figure 5), the path-through rate of TN was mainly distributed in the farmland of the towns of Wudaoying, Dage, Tuchengzi, Anchungoumen, and Huodoushan; this is similar to the spatial distribution characteristics for TP.
For the town scale (Figure 5), the primary spatial distribution of the path-through rate of TN was in towns such as the upper reaches of Wudaoying, Dage, and Tuchengzi and the lower reaches of Anchungou Gate and Huodoushan; the rates ranged from 0.17 to 0.26. However, the upper reaches of the basin and the west side of the middle reaches, including Wudaoying, Kulongshan, Dage, and Tuchengzi, were the primary distribution areas for the path–through rate of TP, with the rates ranging from 0.012 to 0.019.
3.3. NPS Pollution Load and Source Analysis
The TN and TP loads of the research area in 2014 were obtained according to the ECM and coefficient models. The simulation results indicate that the TN load was 13.87 times that of the TP load, which were 7505.0 t and 540.95 t, respectively.
As shown in Table 3, for different pollution sources, the pollution loads of TN were 1118.2 t, 2815.3 t, and 3616.5 t, for rural living, livestock, and land use, correspondingly accounting for 15%, 37.4%, and 47.6% of the TN loads, respectively. Among all the pollution sources, farmland was the major contributor (2258.9 t·a−1.), mainly owing to the unreasonable fertilizer rate and long-term conventional tillage [22]. Among the four types of livestock, big livestock was the primary contributor (1404.9 t), followed by poultry (1187.7 t), because of the improper management of animal feed and livestock manure. The major TP pollution sources differed from the major TN pollution sources. The main contributors of TP loads were rural living (351.65 t·a−1), followed by livestock (156.6 t·a−1) and land use (32.7 t·a−1), which account for 65%, 28.95%, and 6.05% of the TP loads, respectively. In recent years, the urbanization level in most parts of the studied watershed gradually increased, and the living standards of people continued to increase, resulting in rural living becoming the major contributor to the TP load.
3.4. Validation of the Results from the PTRFFM
Comparison with the monitoring data. The water quality monthly data of TN and TP, C (mg/L), as well as the monthly average runoff data, Q (mg/l), monitored by the Xiahui hydrological station at the watershed outlet, were utilized to estimate the TN and TP fluxes of the watershed . The pollutant flux data obtained from the Xiahui hydrological station were calibrated and validated by multiplying with water quality and runoff, based on the following calculation formula:. The relative error Re was analyzed by comparing the simulated value L with the monitored value to assess the accuracy of the PTRFFM.
The results demonstrated the effectiveness of the five-factor model based on the mechanism of the transport pathways of agricultural NPS pollutants (Table 4). In 2014, the fluxes of the TN and TP of the studied watershed were 570.86 t and 2.54 t, and the simulated values were 705.11 t and 3.16 t, respectively. The relative errors were less than 25%, 19.62% and 24.45%. The simulated values for TN and TP were both overestimated, probably because the interception, retardation, and attenuation effects of the pollutants after entering the watercourse were not considered in the PTRFFM.
Comparison with other relevant studies. To further verify the reliability of the model simulation results, some typical results from the literature on the NPS pollution path-through rate of China were reviewed (Table 5). For instance, according to Zhou et al., the path-through rates of N and P in the Haihe watershed were 0.2 and 0.1, respectively. A field monitoring evaluation conducted in the Xinanjiang River Basin showed that the point source path-through rate was approximately 2–3 times that of the NPS path-through rate; the TN and TP path-through rates were 0.2 and 0.21, respectively [23]. Deng et al. studied the path-through rates of different NPS pollution sources in the Changle River Basin using the SWAT model and demonstrated that the atmospheric deposition of the NPS path-through rate of TN was 0.17, followed by nitrogen fertilizers (0.15), rural living (0.12), and livestock (0.03) [24]. Ma et al. utilized the pollutant load estimation method in the Laizhou Bay of the Yellow River Basin and discovered that the NPS path-through rate of TN for rural living was 0.17, followed by farmland (0.1) and livestock (0.07) [25]. Based on the analyses mentioned above, the results of the NPS path-through rate of TN in this study are similar to those of other studies. The NPS path-through rate of TP is lower compared with those of the other studies. This is probably because the studied watershed is in the North of China, which is characterized by inadequate annual rainfall. Moreover, phosphorus is mainly lost in the particulate form by soil erosion, and in the North of China, scarce rainfall leads to less soil erosion compared with other research areas with abundant rainfall.
3.5. Identification of the Critical Source Area of NPS Pollution
A comprehensive analysis of the distribution of the NPS pollution load and the path-through rate was performed, and the critical source areas (CSA) with high risks of NPS pollution and high path-through rates were identified (Figure 6). The results demonstrated that Dage, Wudaoying, and Tuchengzi were critical TN source areas with path-through load intensities of 4.31 kg/ha, 4.23 kg/ha, and 2.95 kg/ha, respectively. From the perspective of the path-through pollutant load, Dage, Wudaoying, and Tuchengzi only accounted for 22.09% of the studied area. Nevertheless, they contributed 57.16% of the TN amount discharged into water bodies.
The upper and middle reaches of the studied watershed, namely Dage, Wudaoying, Heishanzui, and Tuchengzi, were CSAs of TP, where the path-through load intensity was 0.03–0.008 kg/ha. These four towns contributed 1.37 t, 0.24 t, 0.25 t, and 0.28 t in 2014, accounting for 67.69% of the path-through pollutant load of TP.
In summary, Dage, Wudaoying, and Tuchengzi should be considered for the placement of conservation practices for the effective and efficient implementation of watershed management.
4. Conclusions
(1) The simulation accuracy of the PTRFFM model was acceptable. On the watershed scale, the TN and TP NPS pollutant loads from agriculture were 705.11 t and 3.16 t, respectively, in 2014. Meanwhile, the relative errors of the simulations were 19.62% and 24.45%, respectively. From the spatial distribution of the agricultural NPS, the TN and TP resource loads were mainly distributed among the upper reach towns of Dage, and lower reaches of Taishitun, Bakshiying, and Gaoling. The major source of TN load was farmland, which accounted for 47.6% of the TN load, followed by livestock (37.4%). As for the TP load, rural living was the primary source (65%). The path-through rate of the agricultural NPS pollutants was primarily distributed in Wudaoying, Dage, Tuchengzi, Anchungoumen, and Huodoushan, where the path-through rate of TN ranged from 0.17 to 0.26. However, the priority areas for the path-through rate of TP were distributed among Wudaoying, Kulongshan, Dage, and Tuchengzi, ranging from 0.012 to 0.019. A comprehensive analysis of the distribution of the NPS pollution load and the path-through rate was performed. The results indicated that Dage, Wudaoying, and Tuchengzi were the CSA of agricultural NPS pollution; therefore, they should be considered for effective watershed management.
(2) The spatial distribution characteristics of the path-through rate in the field scale could be obtained. Compared with other methods of estimating the path-through rate for NPS pollutants, such as field monitoring, the ECM, and the physical-based model, the PTRFFM could assess the path-through rates of NPS pollutants in the whole field, watershed, or sub-watershed. It was also able to accurately estimate the watershed path-through rate per unit area of spatial coordinates in the field scale.
(3) The results can be scaled to watersheds with larger scales. Unlike the “black box” or “gray box” models, which facilitate the increase or decrease of the measurement parameters to reflect regional differences when applied to different regions, the five-factor model regards the transport pathways of NPS pollutants by obtaining a functional relationship between the corresponding typical, natural, and geographic parameters of the locations. Thus, the results of the five-factor model can be scaled to obtain the path-through rates for larger watersheds.
In this study, the PTRFFM was developed by considering the pollutant production, surface runoff generation, leaching potential of soil moisture, and landscape interception in the given watershed. The model can be used as an effective tool to identify critical paths for NPS contamination transportation. In the future, to expand this method further, supplementary field monitoring should be performed. For example, the saturated water holding capacity of different soil types should be monitored to decrease the uncertainty of soil infiltration capacity differences among different areas.
Future research is also required to establish new criteria and more efficient optimization techniques to identify the key parameters of NPS pollutants, such as the time lag index [26], and incorporate them into the PTRFFM to realize a better representation of the whole process of NPS pollutant transfer.
Author Contributions
Conceptualization, R.G.; methodology, R.G.; software, L.Z.; writing-original draft preparation, L.Z.; writing-review and editing, R.G.; supervision, R.G.; project administration, R.G. All authors have read and agreed to the published version of the manuscript.
Funding
National Natural Science Foundation of China (NO. 42077347, 41601551), The project of the Second National Census of Pollution Sources of China (NO. 2110399).
Institutional Review Board Statement
Not applicable.
Informed Consent Statement
Not applicable.
Data Availability Statement
All analyzed data in this study has been included in the manuscript.
Conflicts of Interest
The authors declare no conflict of interest.
References
- MEE. Bulletin of the Second National Census of Pollution Sources; MEE: Beijing, China, 2020.
- Adu, J.T.; Kumarasamy, M.V. Assessing Non-Point Source Pollution Models: A Review. Pol. J. Environ. Stud. 2018, 27, 1913–1922. [Google Scholar] [CrossRef]
- Zou, L.; Liu, Y.; Wang, Y.; Hu, X. Assessment and analysis of agricultural non-point source pollution loads in China: 1978–2017. J. Environ. Manag. 2020, 263, 110400. [Google Scholar] [CrossRef] [PubMed]
- Shen, Z.; Liao, Q.; Hong, Q.; Gong, Y. An overview of research on agricultural non-point source pollution modelling in China. Sep. Purif. Technol. 2012, 84, 104–111. [Google Scholar] [CrossRef]
- Kaushal, S.S.; Groffman, P.M.; Band, L.E.; Elliott, E.M.; Shields, C.A.; Kendall, C. Tracking Nonpoint Source Nitrogen Pollution in Human-Impacted Watersheds. Environ. Sci. Technol. 2011, 45, 8225–8232. [Google Scholar] [CrossRef]
- Wang, W.; Chen, L.; Shen, Z. Dynamic export coefficient model for evaluating the effects of environmental changes on non-point source pollution. Sci. Total Environ. 2020, 747, 141164. [Google Scholar] [CrossRef]
- Srinivas, R.; Singh, A.P.; Dhadse, K.; Garg, C. An evidence based integrated watershed modelling system to assess the impact of non-point source pollu-tion in the riverine ecosystem. J. Clean. Prod. 2020, 246, 118963. [Google Scholar] [CrossRef]
- Wu, S.; Yin, P.; Wang, M.; Zhou, L.; Geng, R. A new watershed eco-zoning scheme for evaluate agricultural nonpoint source pollution at national scale. J. Clean. Prod. 2020, 273, 123033. [Google Scholar] [CrossRef]
- Yuan, L.; Sinshaw, T.; Forshay, K.J. Review of Watershed-Scale Water Quality and Nonpoint Source Pollution Models. Geosciences 2020, 10, 25. [Google Scholar] [CrossRef] [Green Version]
- Daniels, M.; Sharpley, A.; Harmel, R.; Anderson, K. The utilization of edge-of-field monitoring of agricultural runoff in addressing nonpoint source pollution. J. Soil Water Conserv. 2018, 73, 1–8. [Google Scholar] [CrossRef] [Green Version]
- Wang, F.; Sun, Z.; Zheng, S.; Yu, J.; Liang, X. An integrated approach to identify critical source areas of agricultural nonpoint-source pollution at the wa-tershed scale. J. Environ. Qual. 2018, 47, 922–929. [Google Scholar] [CrossRef]
- Johnes, P. Evaluation and management of the impact of land use change on the nitrogen and phosphorus load delivered to surface waters: The export coefficient modelling approach. J. Hydrol. 1996, 183, 323–349. [Google Scholar] [CrossRef]
- Xueman, Y.; Wenxi, L.; Yongkai, A.; Weihong, D. Assessment of parameter uncertainty for non-point source pollution mechanism modeling: A Bayesi-an-based approach. Environ. Pollut. 2020, 263, 114570. [Google Scholar] [CrossRef]
- Ding, X.; Shen, Z.; Hong, Q.; Yang, Z.; Wu, X.; Liu, R. Development and test of the Export Coefficient Model in the Upper Reach of the Yangtze River. J. Hydrol. 2010, 383, 233–244. [Google Scholar] [CrossRef]
- Aschmann, S.G.; Anderson, D.P.; Croft, R.J.; Cassell, E.A. Using a watershed nutrient dynamics model, WEND, to address watershed-scale nutrient management challenges. J. Soil Water Conserv. 1999, 54, 630–635. [Google Scholar]
- Buchanan, B.P.; Archibald, J.A.; Easton, Z.M.; Shaw, S.B.; Schneider, R.L.; Walter, M.T. A phosphorus index that combines critical source areas and transport pathways using a travel time approach. J. Hydrol. 2013, 486, 123–135. [Google Scholar] [CrossRef]
- Walega, A.; Amatya, D.M.; Caldwell, P.; Marion, D.; Panda, S. Assessment of storm direct runoff and peak flow rates using improved SCS-CN models for selected forest-ed watersheds in the Southeastern United States. J. Hydrol. Reg. Stud. 2020, 27, 100645. [Google Scholar] [CrossRef]
- Van Es, H.; Czymmek, K.; Ketterings, Q. Management effects on nitrogen leaching and guidelines for a nitrogen leaching index in New York. J. Soil Water Conserv. 2002, 57, 499–504. [Google Scholar]
- Kiese, R.; Heinzeller, C.; Werner, C.; Wochele, S.; Grote, R.; Butterbach-Bahl, K. Quantification of nitrate leaching from German forest ecosystems by use of a process oriented biogeochemical model. Environ. Pollut. 2011, 159, 3204–3214. [Google Scholar] [CrossRef]
- Endreny, T.A.; Wood, E.F. Watershed Weighting of Export Coefficients to Map Critical Phosphorous Loading Areas. JAWRA J. Am. Water Resour. Assoc. 2003, 39, 165–181. [Google Scholar] [CrossRef]
- Kruk, E. Use of Chosen Methods for Determination of the USLE Soil Erodibility Factor on the Example of Loess Slope. J. Ecol. Eng. 2021, 22, 151–161. [Google Scholar] [CrossRef]
- Geng, R. Optimizing Best Management Practices Using a Multi-Objective Optimization Tool to Improve Water Quality Goals under Different Spatial Scales; Capital Normal University: Beijing, China, 2015. [Google Scholar]
- Yang, D.H. Analysis on aquatic environment of Anhui Province in Xinanjiang River watershed. Water Resour. Prot. 2006, 5, 77–80. [Google Scholar]
- Deng, O.-P.; Sun, S.-Y.; Lü, J. [Nitrogen non-point source pollution identification based on ArcSWAT in Changle River]. Huan Jing Ke Xue Huanjing Kexue 2013, 34, 1284–1290. [Google Scholar]
- Ma, D.; Shi, H.; Feng, A. Estimation of agricultural non-point source pollution based on watershed unit: A case study of Laizhou Bay. Acta Ecol. Sin. 2014, 34, 173–181. [Google Scholar]
- Kim, H.; Surdyk, N.; Møller, I.; Graversgaard, M.; Blicher-Mathiesen, G.; Henriot, A.; Dalgaard, T.; Hansen, B. Lag Time as an Indicator of the Link between Agricultural Pressure and Drinking Water Quality State. Water 2020, 12, 2385. [Google Scholar] [CrossRef]
Figure 1.
Technical framework of the PTRFFM.

Figure 2.
Map of the study area.

Figure 3.
Spatial distribution of the five factors of NPS with respect to TN.

Figure 4.
Spatial distribution of the five factors of NPS with respect to TP.

Figure 5.
Spatial distribution of path-through rate for the NPS pollution of field and town scales.

Figure 6.
Spatial distribution characteristics of the path-through rate load of NPS pollutants.


Table 1.
Source and description of basic data.
| Type | Scale | Resolution | Description | Source |
|---|---|---|---|---|
| DEM | 1:1,000,000 | 30 × 30 m | Elevation, overland and channel slopes and lengths | National Geomatics Center of China |
| Land use | 1:50,000 | 30 × 30 m | Land use classifications | Institute of Geographical and Natural Resources Research, Chinese |
| Livestock | _ | Village | Breeding number of cow, pig, sheep, and poultry | National pollution source census |
| Soil type | 1:1,000,000 | 30 × 30 m | Soil type classifications | Institute of Soil Science, Chinese Academy of Sciences |
| Administrative division | 1:1,000,000 | 1 × 1 km | Towns and municipalities of the study area | National Geomatics Center of China |
| Vegetation coverage | 1 × 1 km | |||
| Precipitation | 2001–2014 | Daily step | 16 stations in the study area | China Meteorological Administration |
| Hydrological data | 2001–2014 | Monthly step | Calibration and validation of the five-factor model | China Meteorological Administration |
| Water quality data | 2001–2014 | Monthly step | Calibration and validation of the five-factor model | Miyun Reservoir Management Office Xiahui Hydrological Station |
| Social economics | 24 towns | Township level | Population, livestock rearing, fertilizer application | Field investigation; Statistics year-book |
| Export coefficient | Different sources | Losses of various nutrient sources | Statistical data and field monitoring |
Table 2.
Export coefficients for different pollution sources.
| Pollution Source | TN | TP | |
|---|---|---|---|
| Land use (kg·ha−1·a−1) | Farm land | 2.97 | 0.041 |
| Forest | 0.24 | 0.0071 | |
| Grassland | 1.57 | 0.013 | |
| Unused land | 5.00 | 0.008 | |
| Residential land | 2.00 | 0.003 | |
| Rural living (kg·ca−1·a−1) | rural resident | 2.83 | 0.89 |
| Livestock | Big livestock | 7.36 | 0.31 |
| Pig | 0.41 | 0.15 | |
| Sheep | 1.4 | 0.045 | |
| Poultry | 0.071 | 0.004 |
Table 3.
NPS pollution load from various sources in 2014.
| Pollution Source | Total NPS Pollution Load of 2014 | ||||||
|---|---|---|---|---|---|---|---|
| TN (t/a) | Percent | Total | TP (t/a) | Percent | Total | ||
| Rural living | 1118.2 | 15.0 | 15.0 | 351.65 | 65.00 | 65.00 | |
| Livestock | Big stock | 1404.9 | 18.7 | 37.4 | 59.17 | 10.94 | 28.95 |
| Pig | 70.0 | 0.9 | 25.61 | 4.73 | |||
| Sheep | 152.7 | 2.0 | 4.91 | 0.09 | |||
| Poultry | 1187.7 | 15.8 | 66.91 | 12.37 | |||
| Land use | Farmland | 2258.9 | 30.1 | 47.6 | 22 | 4.07 | 6.05 |
| Forest | 412.8 | 5.5 | 3.1 | 0.57 | |||
| Grassland | 878.1 | 11.7 | 6.4 | 1.18 | |||
| Unused land | 43.3 | 0.6 | 0.7 | 0.13 | |||
| Residential land | 23.4 | 0.03 | 0.5 | 0.09 | |||
| Total | 7505.0 | 100% | 100% | 540.95 | 100% | 100% | |
Table 4.
Validation results of the five-factor model.
| NPS Pollutants | Simulated | Re % | |
|---|---|---|---|
| TN | 705.11 | 570.86 | 19.62 |
| TP | 2.54 | 3.16 | 24.45 |
Table 5.
Results of the other studies on the path-through rate of NPS pollutants in China.
| Watershed | Study Area | Scale | Method | Reference | ||
|---|---|---|---|---|---|---|
| Haihe Basin | Chaohe River watershed | Mesoscale | PTRFFM | 0.17–0.26 | 0.012–0.019 | This study |
| Haihe Basin | Haihe Basin | Large scale | ECM | 0.20 | 0.10 | Zhou et al., 2004 |
| Yangtze River Basin | Xinanjiang River Basin | Large scale | Investigation and monitoring | 0.20 | 0.21 | Yang et al., 2006 |
| Songhua River Basin | Harbin Section of Songhua River | Middle scale | Pollutant load estimation method | 0.10 | _ | Fu et al., 2010 |
| Yangtze River Basin | Changle River Basin | Middle scale | SWAT | 0.17 (Atmospheric deposition) | _ | Deng et al., 2012 |
| 0.12 (Rural living) | _ | |||||
| 0.03 (Livestock) | _ | |||||
| 0.15 (nitrogen fertilizer) | _ | |||||
| Yellow River Basin | Laizhou Bay | Large scale | Pollutant load estimation method | 0.1 (Farmland) | 0.1 (Farmland) | Ma et al., 2012 |
| 0.25 (Rural living) | 0.25 (Rural living) | |||||
| 0.07 (Livestock) | 0.07 (Livestock) |
Publisher’s Note: MDPI stays neutral with regard to jurisdictional claims in published maps and institutional affiliations. |
© 2021 by the authors. Licensee MDPI, Basel, Switzerland. This article is an open access article distributed under the terms and conditions of the Creative Commons Attribution (CC BY) license (https://creativecommons.org/licenses/by/4.0/).
Share and Cite
MDPI and ACS Style
Zhou, L.; Geng, R. Development and Assessment of a New Framework for Agricultural Nonpoint Source Pollution Control. Water 2021, 13, 3156. https://doi.org/10.3390/w13223156
AMA Style
Zhou L, Geng R. Development and Assessment of a New Framework for Agricultural Nonpoint Source Pollution Control. Water. 2021; 13(22):3156. https://doi.org/10.3390/w13223156
Chicago/Turabian StyleZhou, Lili, and Runzhe Geng. 2021. "Development and Assessment of a New Framework for Agricultural Nonpoint Source Pollution Control" Water 13, no. 22: 3156. https://doi.org/10.3390/w13223156
Note that from the first issue of 2016, this journal uses article numbers instead of page numbers. See further details here.