Article

Knowledge Management and Operational Capacity in Water Utilities, a Balance between Human Resources and Digital Maturity—The Case of AGS

AGS–Administração e Gestão de Sistemas de Salubridade, S.A., Quinta da Fonte Office Park–Edifício Q54 D. José–Piso 2, 2770-203 Paço de Arcos, Portugal
*
Author to whom correspondence should be addressed.
Water 2021, 13(22), 3159; https://doi.org/10.3390/w13223159
Submission received: 27 September 2021 / Revised: 27 October 2021 / Accepted: 2 November 2021 / Published: 9 November 2021
(This article belongs to the Special Issue Infrastructure Asset Management of Urban Water Systems)

Abstract

:
Digitalization and knowledge management in the water sector, and their impacts on performance, greatly depend on two factors: human capacity and digital maturity. To understand the link between performance, human capacity, and digital maturity, six AGS water retail utilities were compared with all Portuguese utilities using Portuguese benchmark data (2011–2019). AGS utilities achieved better results, including in compound performance indicators, which are assumed to be surrogates for digital maturity. These compound indicators were also found to correlate positively with better performance. In fact, AGS utilities show levels of non-revenue water (NRW) (<25%) below the national median (30–40%), with network replacement values similar to the national median (<0.5%). These results seem to imply that higher digital maturity can offset relatively low network replacement levels and guarantee NRW levels below the national average. Furthermore, regarding personnel aging index and digital maturity—two internally developed indicators—there was an increase in the digital maturity and aging of the staff, which, again, raises questions about long-term sustainability. The growing performance and the slight increase in digital maturity can be attributed to group-wide capacity building and digitalization programs that bring together staff from all AGS utilities in year-long activities.

1. Introduction

Water utilities worldwide face the challenge of supplying water in an increasingly complex market [1]: while the population and demand are increasing, infrastructure is aging, sources are dwindling [2,3], prices are expected to stay low [4,5,6,7], and the sector’s carbon footprint must be further reduced in the context of climate change [8]. It is thus crucial for water utilities to improve knowledge management and to implement smart and innovative water solutions to collect and analyze data in a more efficient and coherent manner [5,9,10], in order to optimize the efficiency of operational and administrative processes.
From the perspective of a water utility, this complex context includes three complementary areas: (i) knowledge management; (ii) staff capacity; and (iii) data/knowledge digitization and service digitalization [5,11,12,13]. These three aspects complement each other, and their optimization will result in a water utility that has the capacity to more easily thrive in this complex context.
Water utilities worldwide already make extensive use of digital services, for example for billing, customer relationship management, geographic cadastre, supervisory control and data acquisition. The implementation of these tools has been shown to increase a utility’s performance [5]. However, data quality is an issue [14] and only a fraction of the data collected are used, that is, it is a process that is data-rich in terms of quantity but poor in terms of information [11,15], and these data are not shared in corporate systems, greatly limiting deeper understanding [15]. Furthermore, there are more advanced techniques that are yet to be fully exploited by the sector, including Internet of Things (IoT) [16], real-time monitoring and sensorization [17,18,19], digital twinning [20,21,22] and artificial intelligence [23,24,25]. These techniques will produce large datasets—big data—that will have to be checked, analyzed, and interpreted, a process that is regarded as a vehicle for the improvement of processes and efficiency [4]. However, this data-driven decision-making process will require the availability of highly trained staff, in a process entitled Water 4.0 by the German Water Partnership [4,26]. Furthermore, infrastructure investment costs [27,28] and cyber-threats to critical infrastructure, such as water supply, must be carefully considered in the path towards digitalization [29,30,31], for example with the widespread deployment of IoT [32,33], since water utilities are considered as “one of the most sensitive components in smart cities” [34]. In fact, the digitalization of urban water systems is typically left behind when compared to other utilities, particularly gas and telecommunications, probably due to a combination of the fear of new vulnerabilities in a sector that is essential to human life [5] and financial constraints. However, the fact that this is a slow-moving sector can be seen as an opportunity, since lessons can be learned from other sectors, and risks can be mitigated [35].
All this points to the complementarity between knowledge management and process digitalization. Currently, many utilities in the West are still in the process of digitizing their processes, and large parts of utilities knowledge, for example, the location of the network, is tacit (in the head of the staff), or kept in physical form (physical registries of water produced). In fact, much of the knowledge of utilities’ staff is tacit and not systematized in an accessible way that can be fully exploited by the utility either now or after the staff’s retirement [5,12]. If not tackled, the latter will translate into the loss of critical and gathered knowledge [36]. Therefore, knowledge management will be paramount for water utilities, ahead of digitalization, to thrive in the coming years, as many utilities: (i) must systematize and register tacit knowledge, and (ii) make space for incoming big data processes. However, this process may be undermined by aging staff in utilities [13,37,38].
Therefore, water utilities managers must keep a balance between the systematization of tacit knowledge, the deployment of new and innovative tools, and the hiring of younger and more highly skilled staff to complement the existing staff.
However, there is very limited information available regarding metrics used to assess a utility’s digitization and digitalization, as well as staff seniority. Regarding staff management, there are performance indicators for water utilities that deal with the amount of staff allocated to specific tasks in the utilities, such as the breakdown of utilities’ staff or outsourced staff [39]. To complement this information, an indicator entitled the Personnel Aging Index (PAI) was developed [12]. Regarding digitization and digitalization, IWA proposed a qualitative framework to qualitatively assess water utilities [11], which is parametrized in this article. Furthermore, to the knowledge of the authors, this is the first time that a quantitative link between digital maturity, staff maturity level and utility performance/sustainability has been studied using nationwide benchmark data.

2. Materials and Methods

2.1. Context

Water retail utilities in Portugal follow one of three possible management models: direct management, delegated management, and concessions [40]. The service is regulated by Portugal’s water and waste services regulation authority (ERSAR, www.ersar.pt/en, (accessed on 3 July 2021)), which is also responsible for the Portuguese water and waste sector’s benchmarking. AGS, owned by Marubeni, is a privately held company responsible for the operation and maintenance of several water and wastewater treatment facilities and for the management of 13 utilities in Portugal and Brazil under concession agreements, public-private partnerships, and for the provision of engineering services to water utilities in Europe, South America and Asia [41]. Since 2005, AGS has been actively participating in various European and Portuguese studies and capacity building initiatives, including Care-W [42], Aware-P [43] and LNEC’s Asset Management’s initiative [44]. Building on this experience, AGS has developed several in-house initiatives (with its utilities) covering various topics, such as asset management, non-revenue water reduction, the implementation of benchmarking methodologies (e.g., AquaRating’s [45]), customer meter management and cybersecurity, with the initiatives contributing to the utilities’ overall performance improvement.
This article analyzes the performances of six water supply retail utilities managed by AGS. Other utilities, e.g., bulk suppliers of drinking water and wastewater-related services, were not considered. To qualitatively evaluate the impact of digitalization and the deployment of innovative management tools, the performance of these utilities was compared to the performance of all Portuguese water supply retail utilities using public data made available by ERSAR. Afterwards, AGS’s utilities were further analyzed in terms of its human resources age maturity and its digital maturity.

2.2. Water Utilities Performance Assessment

The data used for benchmarking in this article are public data freely available from ERSAR’s webpage [46]. ERSAR data are available for the period of 2011–2019 and cover all Portuguese water, wastewater and solid waste utilities. Due to ERSAR’s very comprehensive questionnaire, which must be filled-in by each utility, it is possible to use this information to compare utilities’ performances and as surrogate indicators for digital maturity. Thus, the results presented in the article can be easily validated and reproduced. The performance indicators used to evaluate the water utilities (Table 1) were selected based on the available information to characterize the performance of the water distribution network. Non-revenue water was selected to characterize the current condition of a distribution network, a common performance indicator mentioned in the literature [47,48,49,50]. Network rehabilitation is a common research subject within the context of strategic asset management [51,52] that assumes that limited resources have to be invested [53] in order to guarantee the maintenance of the level of service. Therefore, network rehabilitation was selected, as it allows for characterizing the long-term infrastructural sustainability of a utility. Furthermore, the flow measuring index and infrastructure knowledge index were selected as they are indicators linked to the various facets of digital maturity in water utilities, since they take into consideration the availability of databases and information systems that are intimately linked with digital maturity.
Additionally, this study only considered retail water utilities (256 for 2019), as all AGS utilities considered for this study are retail. Therefore, all bulk water utilities were disregarded in the analysis (10 for 2019). The AGS utilities included in this work participated in AGS’s internal capacity building initiatives (see Section 2.1 Context). In 2019, of the six AGS utilities surveyed in this article, one followed a delegated management model, whereas the remaining five were concessions. The breakdown for ERSAR utilities is the following: 202 utilities under direct management, 26 under delegated management and 28 under concessions. It can be hypothesized that the management model plays a role in utility performance [54,55].

2.3. PAI

In order to evaluate each utility’s team maturity levels and the corresponding knowledge loss risk, a Personnel Aging Index (PAI) [12] was developed, which describes staff’s average working career as the ratio between the sum of the remaining useful professional life and total lifetime career for each employee. Briefly, the PAI can be computed for the entire organization or a single department. It can also be determined per professional category, since each implies a different useful professional lifespan according to graduation level and/or the period needed to acquire specific skills through working experience and/or training in the organization. For example, graduate employees begin their careers later than undergraduates and coordination responsibilities should only be assumed by technicians with some level of work experience. These differences are translated into different useful professional lives and total lifetime careers. The PAI can be determined according to the following equation:
P A I ( t ) = i = 1 n R U p l i , t i = 1 n C l i
where PAI(t) is the Personnel Aging Index at time t (dimensionless); n is the total number of employees; R U p l i , t is the remaining useful professional life of employee i at time t (years); and C l i is the maximum career length of employee i (years).

2.4. Digital Maturity Index

The concept of a digital maturity index was developed internally at AGS since a need was felt to homogenize the digital characterization of the water utilities and systematize the needs for improvement (Table 2). This index took as a starting point the qualitative assessment framework proposed by IWA [11]. For each water utility, digital maturity was evaluated at seven different levels, ranked by increasing complexity. Each level is divided into several sub levels, which are evaluated in terms of both availability and usability, with grades from 1 to 3. Finally, the digital maturity of a utility is calculated using Equations (2) and (3) as a ratio between the total number of points per water utility and the maximum number of points across the seven levels. To remove bias from the self-evaluation, Table 2 was filled in by the authors for each of the utilities surveyed in this article, in particular, the grades for the availability of the system and its usability.
Digital maturity for utility A is calculated using Equation (2):
D i g i t a l   m a t u r i t y u t i l i t y   A = i = 1 n P o i n t s i t e m   i U t i l i t y   A i = 1 n P o i n t s i t e m   i m a x
where i = 1 n P o i n t s i t e m   i U t i l i t y   A is the summation of points, per item i, for Utility A (Equation (3)); i = 1 n P o i n t s i t e m   i m a x is the maximum number of points for all items.
P o i n t s i t e m   i U t i l i t y   A = P o i n t s i t e m   i m a x × ( G r a d e a v a i l i t e m   i + G r a d e u s a b i l i t e m   i ) ( G r a d e a v a i l m a x ,   i t e m   i + G r a d e u s a b i l m a x ,   i t e m   i )
where P o i n t s i t e m   i m a x is the maximum number of points possible for item i (Table 2); G r a d e a v a i l i t e m   i + G r a d e u s a b i l i t e m   i is the grade obtained for the availability (avail) and usability (usabil) of item i’s system; G r a d e a v a i l m a x ,   i t e m   i + G r a d e u s a b i l m a x ,   i t e m   i are the maximum grades (=3) for the availability (avail) and usability (usabil) of item i’s system.

2.5. Data Handling and Visualization

All analyses were performed using R 4.0.5 [56]. The data visualization employed ggplot2 [57]. The correlation plots were produced using R package GGally [58].

3. Results and Discussion

3.1. Characterization of the Water Utilities

An overall characterization of the surveyed utilities for the year 2019 is given in Table 3. Across all the variables, AGS utilities have higher mean and minimum values, but lower maximum values.

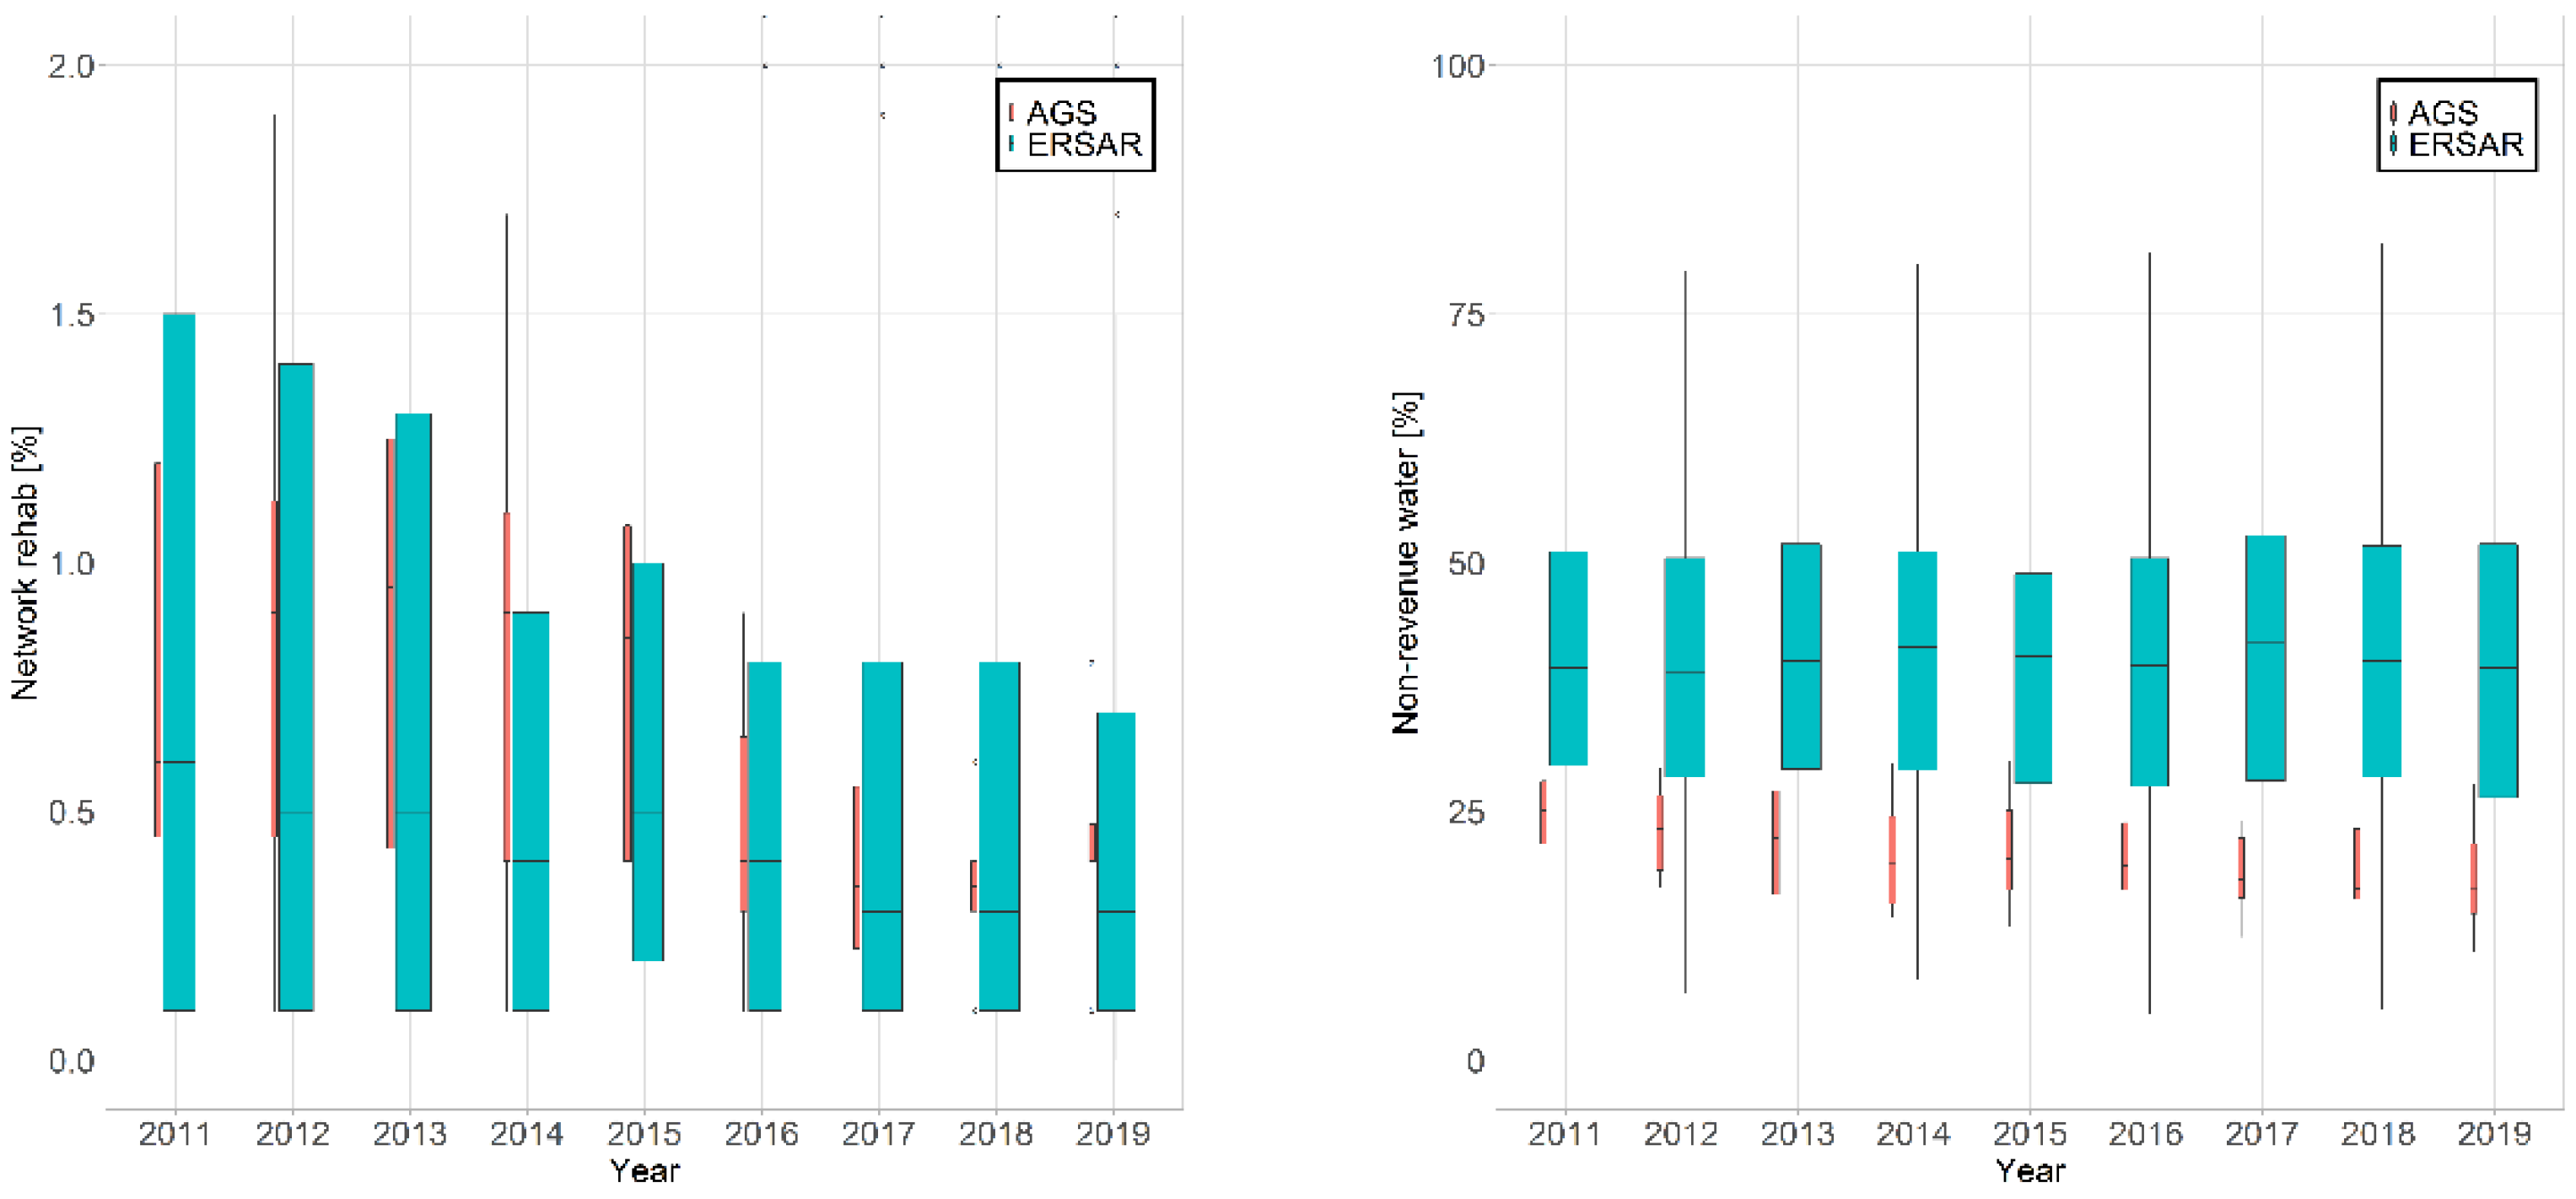
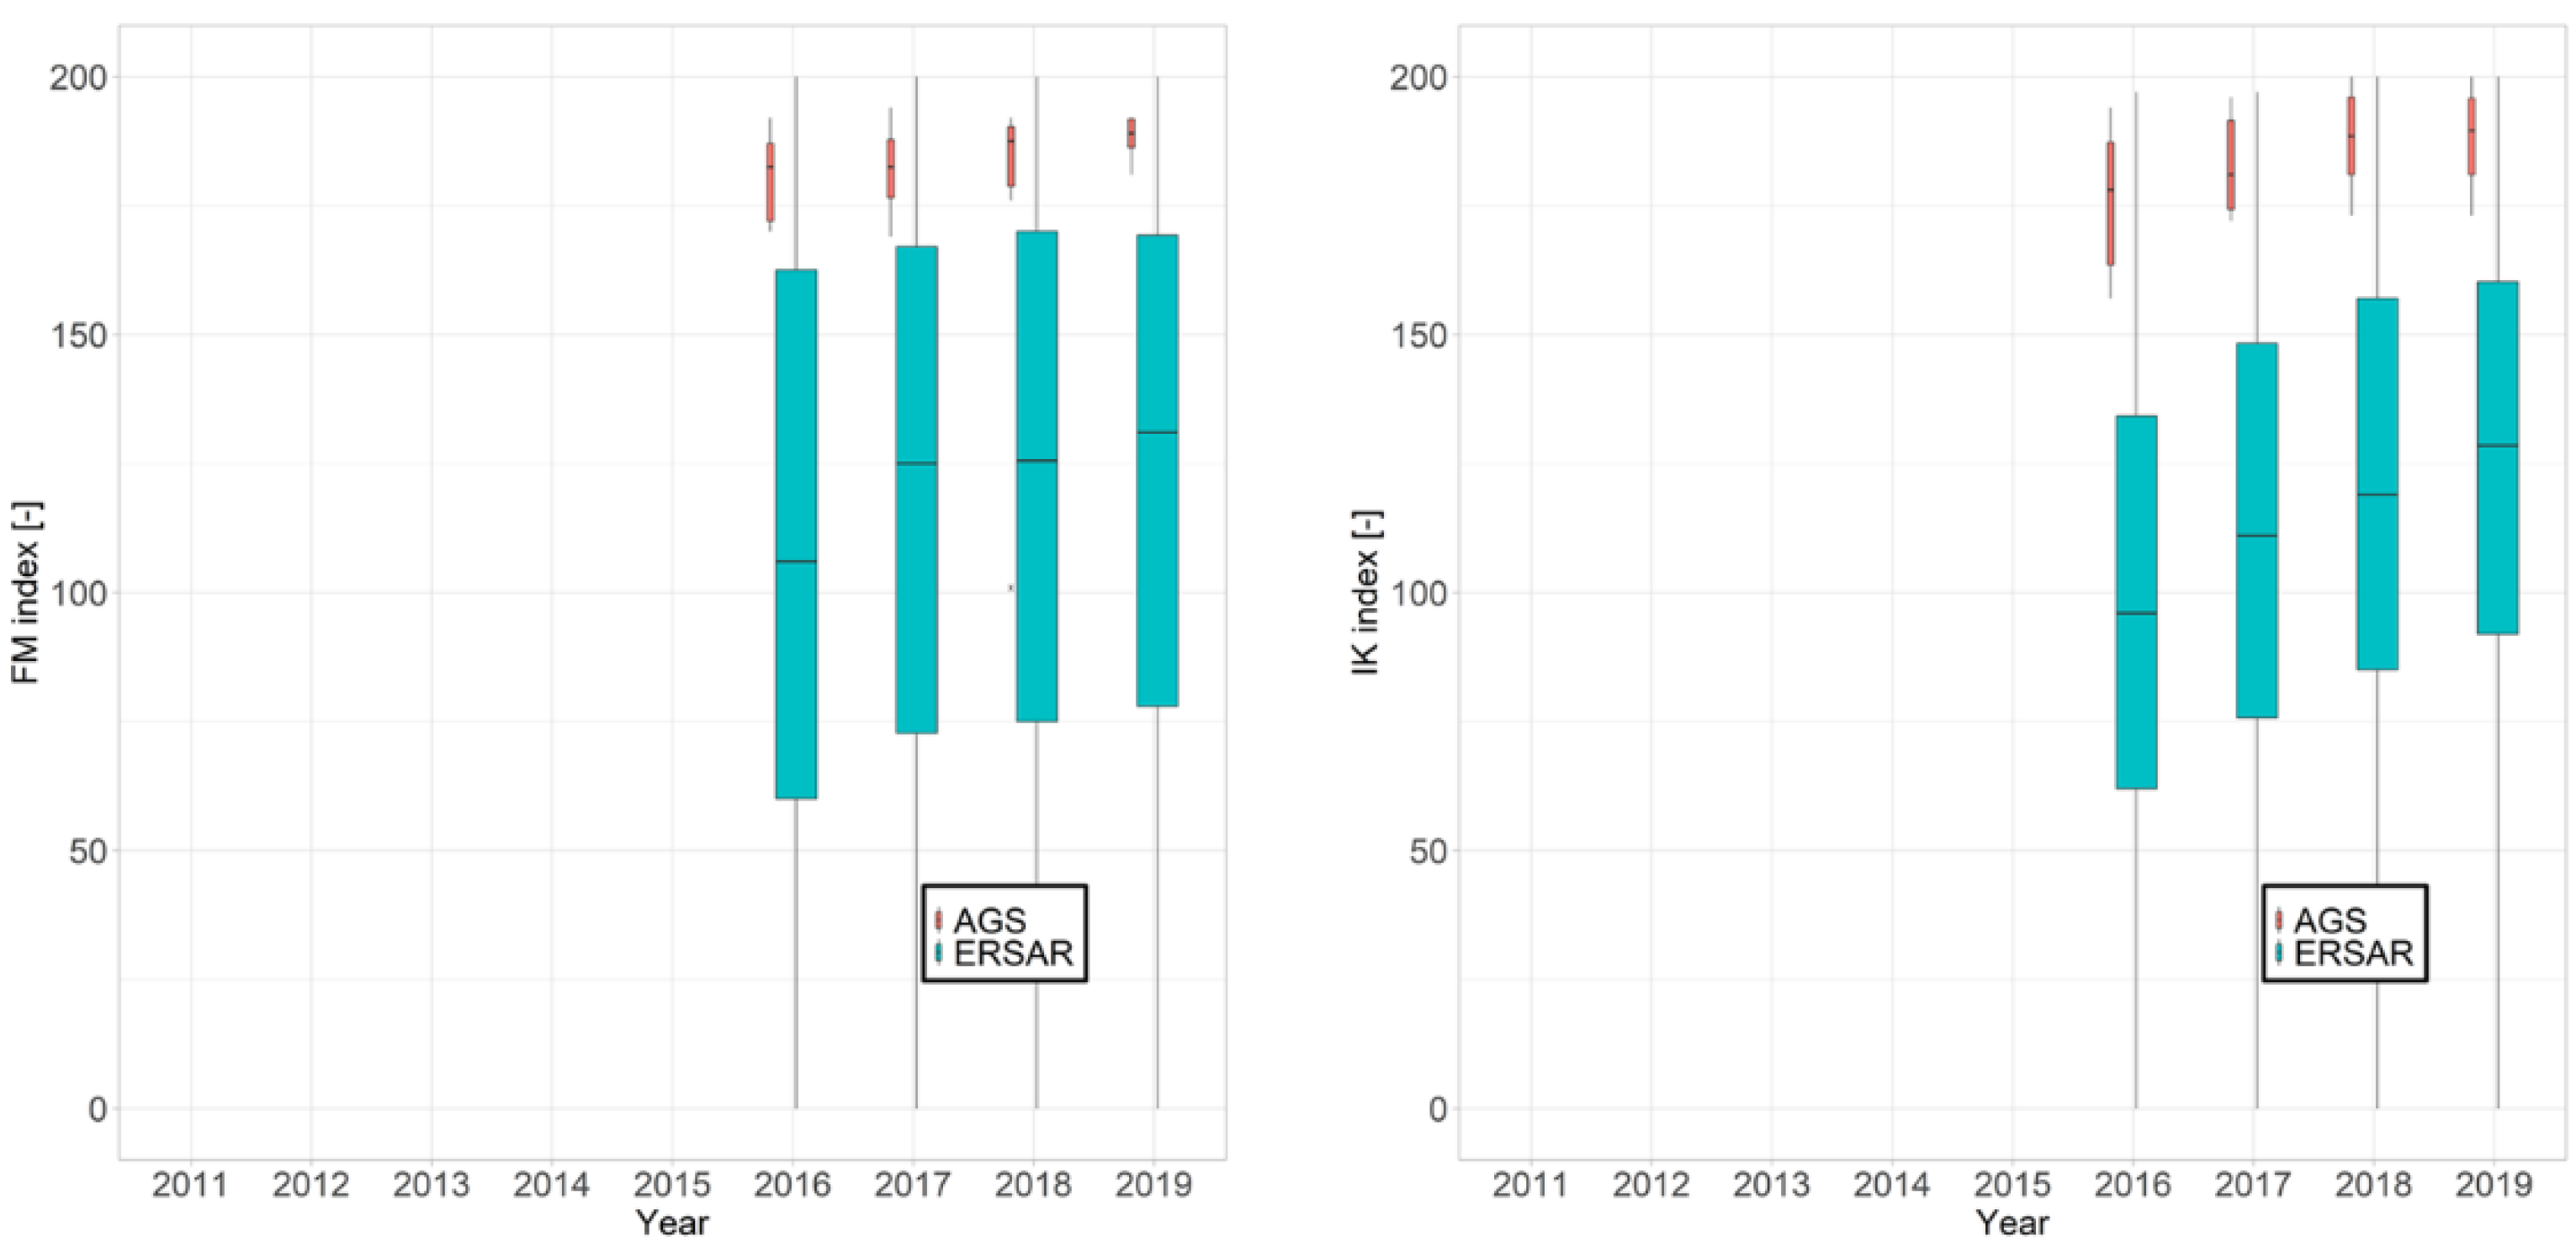
3.2. Performance Assessment and Benchmarking

Benchmarking, in addition to sometimes being a pre-requisite on the side of a regulatory body, can also assist utilities in delivering better services [59]. An evaluation of the performance of AGS’s utilities and a comparison with all Portuguese water retail utilities, including those of AGS, can be seen in the figures below using the indicators described in Table 1.
Overall, service and operational performance within AGS’ utilities increased significantly after 2011, and has stayed stable or increased slightly in the period of 2016–2019. By 2019, AGS’s performance was in the range of 20–30% for NRW and below 0.8% for network rehabilitation. It should be mentioned that such low levels of network rehabilitation, at a national level, pose serious questions about service sustainability in the coming years and decades.
AGS’s utilities have performed better than most of the utilities benchmarked by ERSAR (Figure 1), with levels below average for NRW and slightly higher levels for network rehabilitation. This indicates that even though the rehabilitation rates are below the optimal range defined by ERSAR (Table 1), AGS utilities present lower NRW losses, which can be hypothesized as being a result of optimized operational programs using systematized methodologies and software, which are often developed in-house. In fact, it has been shown that the implementation of digital, real-time monitoring tools can lead to tangible performance improvements, such as reductions in NRW [5].
Furthermore, for the flow-measuring index, the infrastructure asset management index and the infrastructure knowledge index, AGS utilities perform better than ERSAR’s evaluated utilities (Figure 2). For all the indices, the utilities were asked to fill in very detailed surveys, and some information is given in Table 1 [39]. For the flow-measuring index, the survey covers increasingly finer sampling points—abstraction wells, water treatment plants, network reservoirs, pumping stations, DMAs, and the measuring of consumption for (non-)domestic clients. For the infrastructure knowledge index, the survey poses detailed questions regarding the existence of GIS (or other format) maps of the network, which include treatment plants, reservoirs, pumping stations, pipes, and house connections.
The level of detail and scope of the two indicators mean that to perform well in these indicators, i.e., to collect all necessary data, utilities are expected to have deployed, and made extensive use of, (digital) management support tools; in other words, better network knowledge.
Additionally, there is a negative correlation (statistically significant, with p-value < 0.001) between NRW and both the flow-measuring index and the infrastructure knowledge index, which means that more network knowledge can be translated into lower NRW, i.e., better service performance (Figure 3). This performance can only be maintained through the hiring of staff and by deploying digital tools, i.e., increasing a utility’s digital maturity. In fact, in a previous study, implementing digital tools was shown to assist two water utilities in reducing NRW, respectively, from 35.8% to 27.6% and from 42.8% to 36.1% [5].
Both staff management and service digitalization will now be evaluated in detail, solely for AGS utilities, as there are not enough available data to accurately extend this analysis to all ERSAR’s utilities.

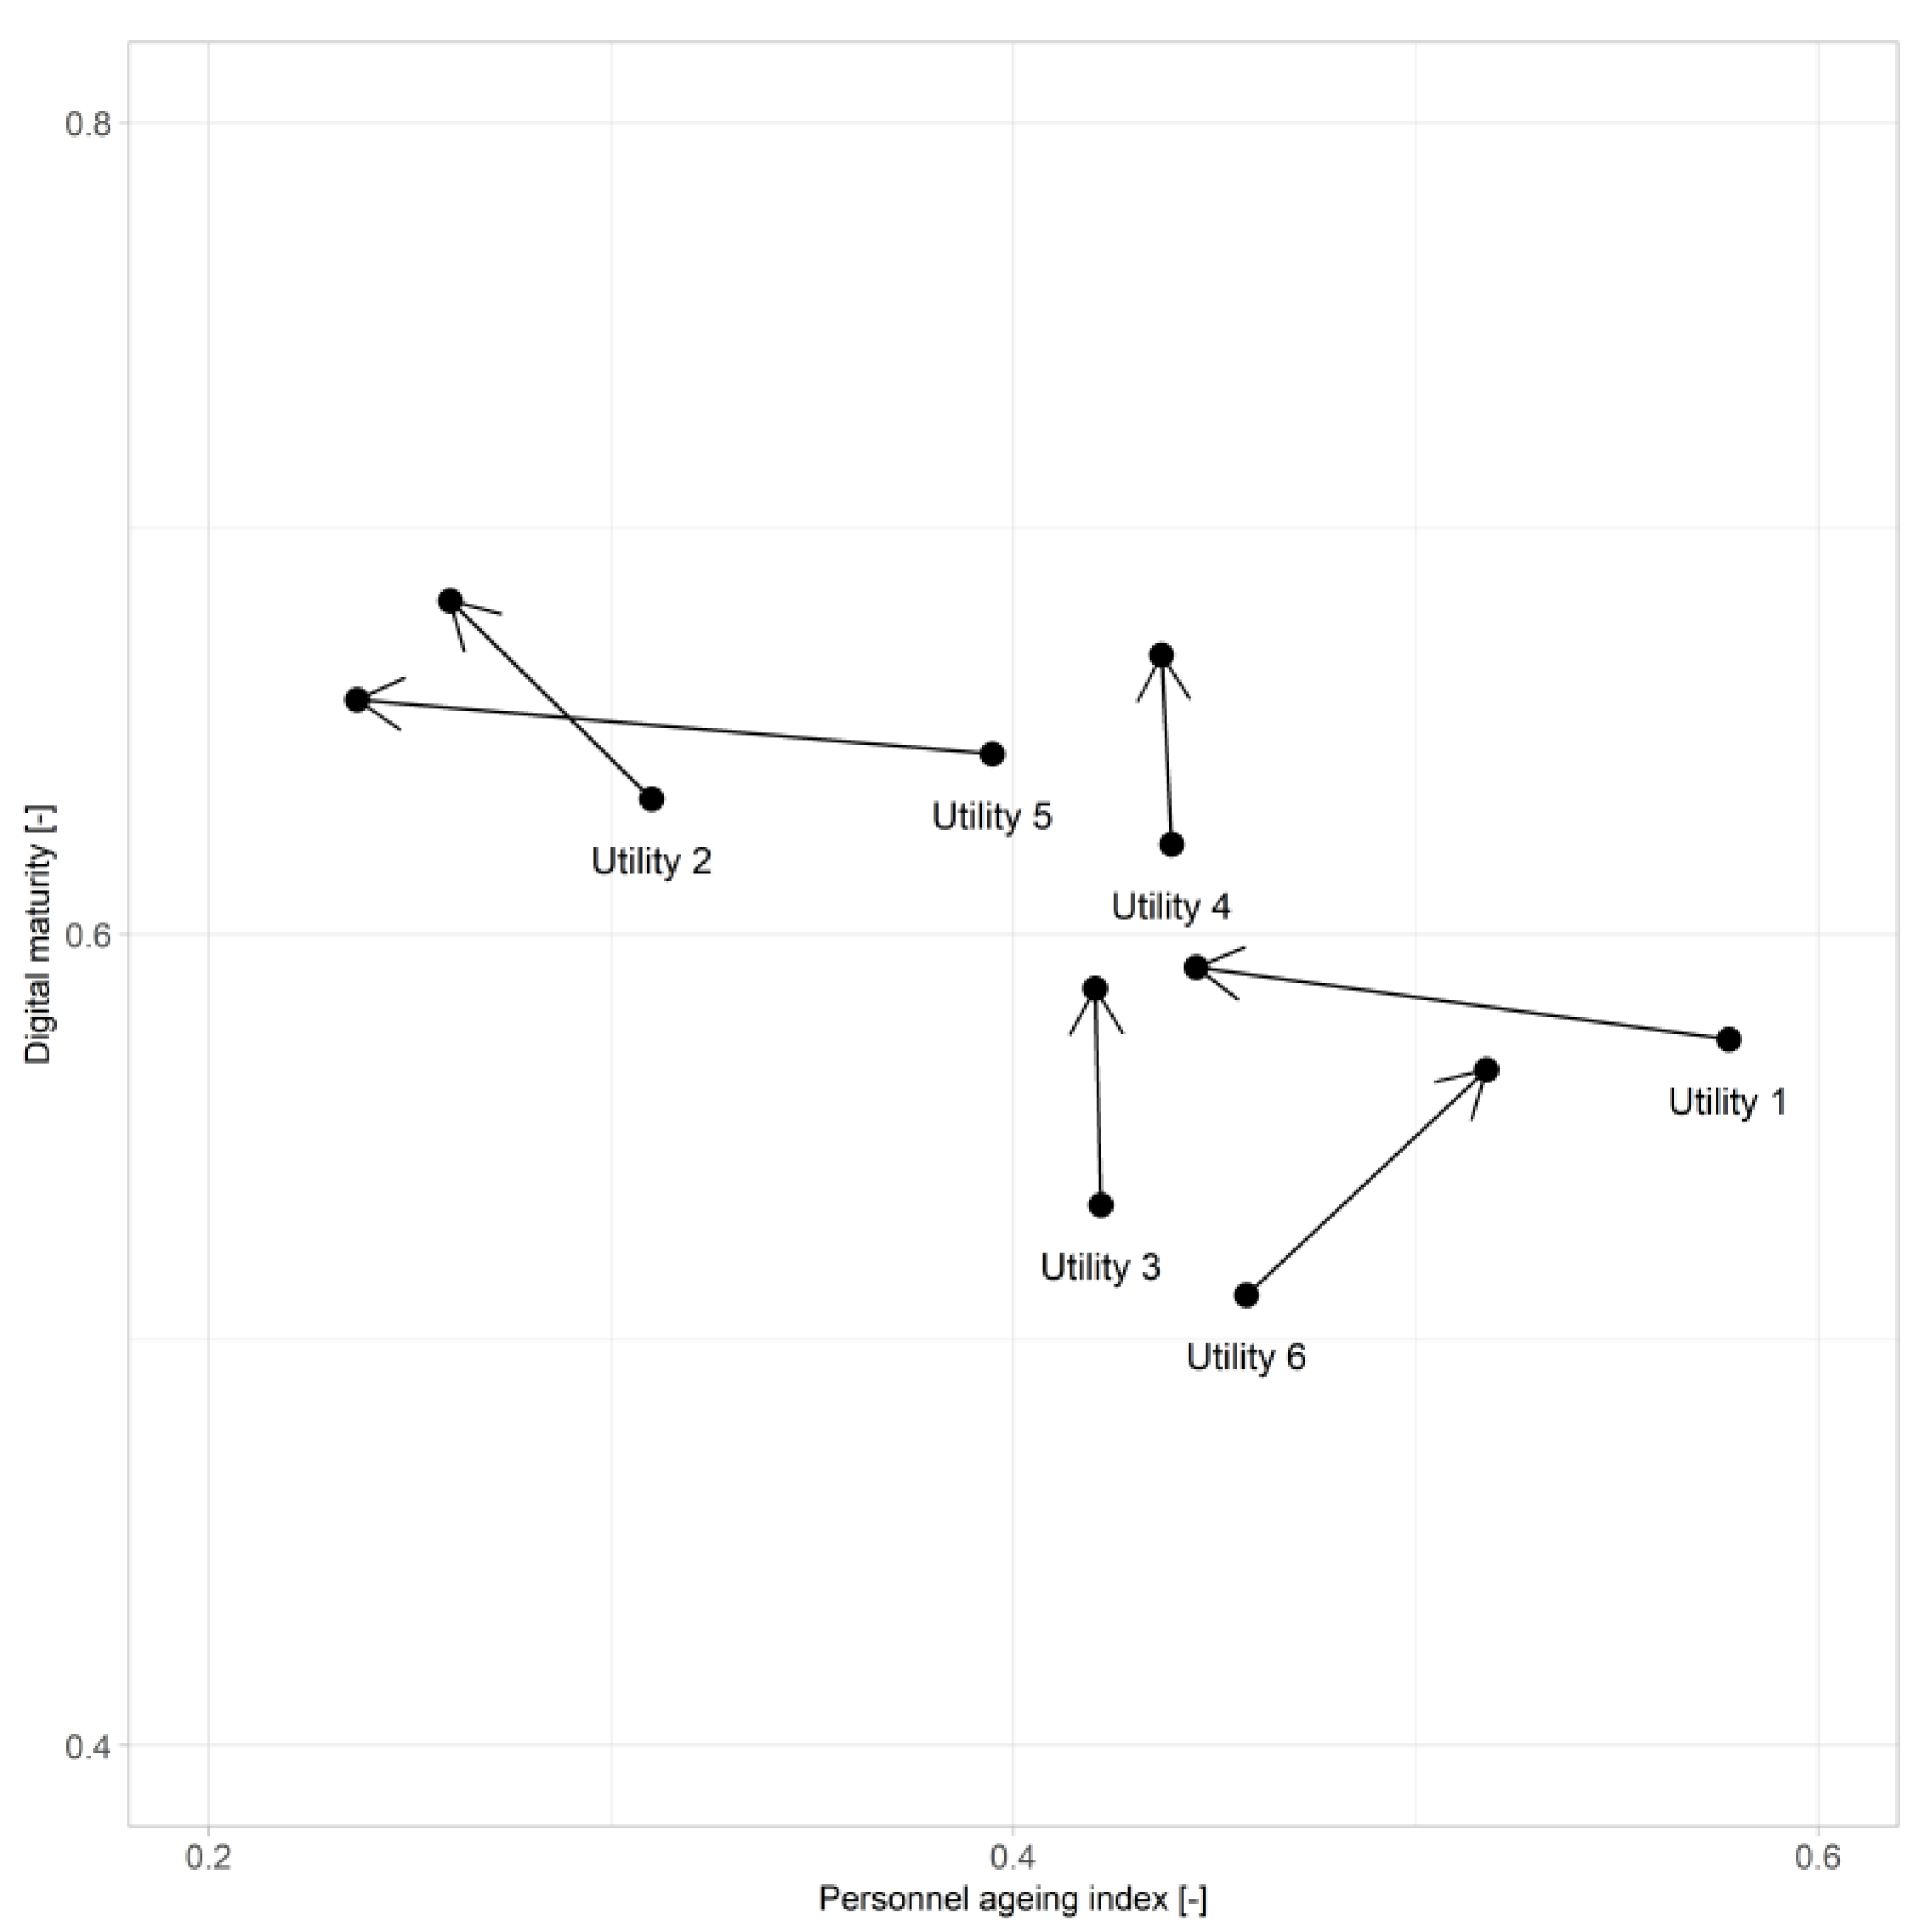
3.3. Internal Assessment for Digital Maturity and Human Resources

To be able to further optimize planning in the long term, and understand and evaluate knowledge creation, transfer, and retention, AGS has created two maturity indicators. These indicators measure digital maturity and human resources, and were calculated for the six AGS utilities surveyed in this article (Figure 4). PAI decreased for three utilities, remained stable for two, and increased slightly for one. A lower PAI indicates that, in general, the staff are closer to retirement age, and that the natural aging of the staff was not offset by the hiring of younger staff [12].
Utility 1 was still at acceptable values for PAI (ideally 0.4–0.6). However, it showed a significant decrease in the 5-year period under analysis. Utility 2 had the higher digital maturity level but a low PAI. Utilities 3 and 4 were evolving in digital maturity and ensuring human resources renovation, maintaining acceptable values for this indicator. Utility 5 had the lowest growth in digital maturity and, similar to Utility 2, had a very low PAI that underwent a significant drop in this period. Finally, Utility 6 was the only one with increased PAI, and was also increasing digital maturity. The greatest threat to maintaining a stable PAI with knowledge retention is to compensate staff retirement with the utility’s ability to attract younger employees [7,60]. In some utilities, this process is hindered by the reduction in active population, either due to aging or dislocation to other municipalities, and particularly from rural areas to cities [61]. As such, utilities must, in parallel, make use of other tools to guarantee knowledge management and to maintain the provision of the best service to their customers. For the six AGS utilities, the increase in digital maturity was the chosen strategy, and each utility presented different levels of digital maturity due to the specific characteristics of each utility. In fact, it is not possible to establish a recognizable pattern in technology adoption across the sector in many countries [62]. Nevertheless, digital maturity increased for the six AGS utilities in the period of 2016–2021 (Figure 4 and Table 4), and simultaneously, the performances of all utilities also increased. This seems to indicate that a balance between PAI and digital maturity leads to improved performance. However, due to the absence of a control group—utilities for which we can quantify digital maturity that are not part of AGS—it is not possible to prove causality, only correlation. From Table 4, it can be concluded that this increase in digital maturity occurred due to the deployment of cybersecurity systems (for all utilities except Utility 6 and in Levels 4 to 6), particularly in flow-measuring technology and flow-monitoring software. None of the utilities surveyed made use of Level 7 technologies at the time of the study. However, with the sustained increase in digital maturity, AGS utilities are expected to reach this level in the coming 5–10 years, mostly through capacity building initiative that will lead to the interaction of the various utilities with innovative digital tools, and increases in technology affordability and access [63]. However, staff aging, although not extreme, is a reality across the utilities, and must be managed adequately in the coming 5–10 years, assuming that there is an intangible risk of the retiring of older staff, i.e., loss of knowledge [13,37,64].

4. Conclusions

Digitalization is expected to play a major role in the coming decades for decision support by exploiting big data, Internet of Things, real-time sensorization and artificial intelligence. Within water utilities, this process is still in its infancy in various utilities, in Portugal and across the world, and is still lagging in the process of converting information in physical format into a digital one (information digitization), which is a first step towards digitalization. The shift towards digitalization—and, we assume, towards improved performance—will require a balance with more human capacity and more digital maturity. It should be mentioned that given the importance of public infrastructure, such as water distribution networks, the path towards full service digitalization also entails risks, e.g., cyber threats and privacy issues. A full analysis and quantification of these risks should be carefully considered when drafting the roadmap.
Looking at performance, AGS improved in the analyzed period and performed better than ERSAR’s average. Regarding network rehabilitation, AGS’s performance was in line with that of ERSAR’s evaluated utilities, and below ideal levels (>2% per year), which poses serious questions regarding service performance in the coming years and decades. Nevertheless, it can also be hypothesized that higher rehabilitation rates are not necessarily linked to low NRW, and that low rehabilitation rates can be compensated for by raising digitalization and data-driven decision support. This point will require further work. Furthermore, regarding PAI and digital maturity—two internally developed indicators—there was an increase in digital maturity and aging of the staff, which, again, raises questions about long-term sustainability. The improving performance and slight increase in digital maturity can be attributed to group-wide capacity-building and digitalization programs that bring together staff from all AGS utilities in year-long activities. In fact, by implementing collaborative projects within AGS’s utilities, knowledge management with the systematization of methodologies and increases in digital maturity have resulted in a sustained and continuous operation and the provision of water services.
This article shows that both PAI and the digital maturity indicator are strong tools for internal analysis, and they allow for identifying and highlighting frailties, at the utility level, that can support knowledge management and the roadmap towards digitalization.

Author Contributions

Conceptualization, A.M.A., J.C., A.R.S., A.G. and J.F.F.; methodology, A.M.A., J.C. and A.R.S.; coding, A.M.A.; data analysis, A.M.A., J.C., A.R.S., A.G. and J.F.F.; writing—original draft preparation, A.M.A.; writing—review and editing, J.C., A.R.S., A.G. and J.F.F. All authors have read and agreed to the published version of the manuscript.

Funding

This research received no external funding.

Data Availability Statement

All benchmark data (in Portuguese) used in this article can be downloaded from ERSAR’s webpage: http://www.ersar.pt/pt/setor/factos-e-numeros/dados-de-base (accessed on 3 July 2021).

Acknowledgments

The authors would like to acknowledge the insightful comments made by the three anonymous reviewers.

Conflicts of Interest

The authors declare no conflict of interest.

References

  1. Ortega-Ballesteros, A.; Manzano-Agugliaro, F.; Perea-Moreno, A.-J. Water utilities challenges: A bibliometric analysis. Sustainability 2021, 13, 7726. [Google Scholar] [CrossRef]
  2. Akhtar, N.; Ishak, M.I.S.; Bhawani, S.A.; Umar, K. Various natural and anthropogenic factors responsible for water quality degradation: A review. Water 2021, 13, 2660. [Google Scholar] [CrossRef]
  3. Akhtar, N.; Ishak, M.; Ahmad, M.; Umar, K.; Yusuff, M.M.; Anees, M.; Qadir, A.; Almanasir, Y.A. Modification of the Water Quality Index (WQI) process for simple calculation using the Multi-Criteria Decision-Making (MCDM) method: A review. Water 2021, 13, 905. [Google Scholar] [CrossRef]
  4. German Water Partnership. WATER 4.0—An important element for the German water industry. In WATER 4.0; German Water Partnership: Berlin, Germany, 2017. [Google Scholar]
  5. Cassidy, J.; Barbosa, B.; Damião, M.; Ramalho, P.; Ganhão, A.; Santos, A.; Feliciano, J. Taking water efficiency to the next level: Digital tools to reduce non-revenue water. J. Hydroinformatics 2021, 23, 453–465. [Google Scholar] [CrossRef]
  6. Stankovic, M.; Hasanbeigi, A.; Neftenov, N. Use of 4IR Technologies in Water and Sanitation in Latin America and the Caribbean; Inter-American Development Bank: Washington, DC, USA, 2020. [Google Scholar]
  7. Sandelin, S.K.; Hukka, J.J.; Katko, T.S. Importance of knowledge management at water utilities. Public Work. Manag. Policy 2021, 26, 164–179. [Google Scholar] [CrossRef]
  8. Sala-Garrido, R.; Mocholí-Arce, M.; Molinos-Senante, M.; Maziotis, A. Comparing operational, environmental and eco-efficiency of water companies in England and Wales. Energies 2021, 14, 3635. [Google Scholar] [CrossRef]
  9. Alabi, M.O.; Telukdarie, A.; van Janse Rensburg, N. Industry 4.0: Innovative solutions for the water industry. In Proceedings of the 40th International Annual Conference of the American Society for Engineering Management (ASEM 2019): A Systems Approach to Engineering Management Solutions, Philadelphia, PA, USA, 23–26 October 2019; Schott, E., Ng, E.-H., Keathley, H., Krejci, C., Eds.; American Society for Engineering Management: Huntsville, AL, USA, 2020. [Google Scholar]
  10. Vacca, J. Smart utilities. In Solving Urban Infrastructure Problems Using Smart City Technologies; Elsevier: Amsterdam, The Netherlands, 2020. [Google Scholar]
  11. Sarni, W.; White, C.; Webb, R.; Cross, K.; Glotzbach, R. Digital Water—Industry Leaders Chart the Transformation Journey; The International Water Association: London, UK, 2019. [Google Scholar]
  12. Feliciano, J.; Almeida, R.; Santos, A.; Ramalho, P.; Ganhão, A.; Covas, D.I.C.; Alegre, H. Assessing human resources renovation needs in water utilities. Water Pract. Technol. 2016, 11, 728–735. [Google Scholar] [CrossRef] [Green Version]
  13. O’Berry, D. Use knowledge management to sustain workforce expertise. Opflow 2015, 41, 24–26. [Google Scholar] [CrossRef]
  14. Castro-Gama, M.; Agudelo-Vera, C.; Bouziotas, D. A Bird’s-eye view of data validation in the drinking water industry of The Netherlands. In ICT for Smart Water Systems: Measurements and Data Science; Scozzari, A., Mounce, S., Han, D., Soldovieri, F., Solomatine, D., Eds.; Springer Nature: Cham, Switzerland, 2020; pp. 65–110. [Google Scholar]
  15. Mounce, S.R. Data science trends and opportunities for smart water utilities. In ICT for Smart Water Systems: Measurements and Data Science; Scozzari, A., Mounce, S., Han, D., Soldovieri, F., Solomatine, D., Eds.; Springer Nature: Cham, Switzerland, 2020; pp. 1–26. [Google Scholar]
  16. Ramos, H.M.; McNabola, A.; López-Jiménez, P.A.; Pérez-Sánchez, M. Smart water management towards future water sustainable networks. Water 2020, 12, 58. [Google Scholar] [CrossRef] [Green Version]
  17. March, H.; Morote, Á.-F.; Rico, A.-M.; Saurí, D. Household smart water metering in Spain: Insights from the experience of remote meter reading in Alicante. Sustainability 2017, 9, 582. [Google Scholar] [CrossRef] [Green Version]
  18. Monks, I.; Stewart, R.A.; Sahin, O.; Keller, R.J. Taxonomy and model for valuing the contribution of digital water meters to sustainability objectives. J. Environ. Manag. 2021, 293, 112846. [Google Scholar] [CrossRef] [PubMed]
  19. Liu, A.; Mukheibir, P. Digital metering feedback and changes in water consumption—A review. Resour. Conserv. Recycl. 2018, 134, 136–148. [Google Scholar] [CrossRef]
  20. Bartos, M.; Kerkez, B. Pipedream: An interactive digital twin model for natural and urban drainage systems. Environ. Model. Softw. 2021, 144, 105120. [Google Scholar] [CrossRef]
  21. Savić, D. Digital water developments and lessons learned from automation in the car and aircraft industries. Engineering 2021. [Google Scholar] [CrossRef]
  22. Ranjbar, R.; Duviella, E.; Etienne, L.; Maestre, J.-M. Framework for a digital twin of the Canal of Calais. Procedia Comput. Sci. 2020, 178, 27–37. [Google Scholar] [CrossRef]
  23. Dawood, T.; Elwakil, E.; Novoa, H.M.; Delgado, J.F.G. Artificial intelligence for the modeling of water pipes deterioration mechanisms. Autom. Constr. 2020, 120, 103398. [Google Scholar] [CrossRef]
  24. Li, L.; Rong, S.; Wang, R.; Yu, S. Recent advances in artificial intelligence and machine learning for nonlinear relationship analysis and process control in drinking water treatment: A review. Chem. Eng. J. 2021, 405, 126673. [Google Scholar] [CrossRef]
  25. Romero, J.M.P.; Hallett, S.H.; Jude, S. Leveraging big data tools and technologies: Addressing the challenges of the water quality sector. Sustaiability 2017, 9, 2160. [Google Scholar] [CrossRef] [Green Version]
  26. German Water Partnership. Water 4.0—Made in Germany. In WATER 4.0; German Water Partnership: Berlin, Germany, 2017. [Google Scholar]
  27. Boyle, T.; Giurco, D.; Mukheibir, P.; Liu, A.; Moy, C.; White, S.; Stewart, R. Intelligent metering for urban water: A review. Water 2013, 5, 1052–1081. [Google Scholar] [CrossRef] [Green Version]
  28. Beal, C.; Flynn, J. Toward the digital water age: Survey and case studies of Australian water utility smart-metering programs. Util. Policy 2015, 32, 29–37. [Google Scholar] [CrossRef] [Green Version]
  29. Brashear, J.P. Managing risk to critical infrastructures, their interdependencies, and the region they serve: A risk management process. In Optimizing Community Infrastructure; Colker, R., Ed.; Butterworth–Heinemann: Oxford, UK, 2020; pp. 41–67. [Google Scholar]
  30. Lalle, Y.; Fourati, M.; Fourati, L.C.; Barraca, J.P. Communication technologies for smart water grid applications: Overview, opportunities, and research directions. Comput. Netw. 2021, 190, 107940. [Google Scholar] [CrossRef]
  31. Leszczyna, R. Cybersecurity and privacy in standards for smart grids—A comprehensive survey. Comput. Stand. Interfaces 2018, 56, 62–73. [Google Scholar] [CrossRef]
  32. Moazeni, F.; Khazaei, J. Sequential false data injection cyberattacks in water distribution systems targeting storage tanks; a bi-level optimization model. Sustain. Cities Soc. 2021, 70, 102895. [Google Scholar] [CrossRef]
  33. Ahmad, T.; Zhang, D. Using the internet of things in smart energy systems and networks. Sustain. Cities Soc. 2021, 68, 102783. [Google Scholar] [CrossRef]
  34. El-Latif, A.A.A.; Abd-El-Atty, B.; Mehmood, I.; Muhammad, K.; Venegas-Andraca, S.E.; Peng, J. Quantum-inspired blockchain-based cybersecurity: Securing smart edge utilities in IoT-based smart cities. Inf. Process. Manag. 2021, 58, 102549. [Google Scholar] [CrossRef]
  35. De Vitry, M.M.; Schneider, M.Y.; Wani, O.; Manny, L.; Leitão, J.P.; Eggimann, S. Smart urban water systems: What could possibly go wrong? Environ. Res. Lett. 2019, 14, 081001. [Google Scholar] [CrossRef]
  36. Phaladi, M.P. Knowledge Transfer and Retention: The Case of a Public Water Utility in South Africa. Master’s Thesis, University of Stellenbosch, Stellenbosch, South Africa, 2011. [Google Scholar]
  37. Isbell, M. Knowledge retention: Develop effective succession: Planning strategies. Opflow 2008, 34, 16–17. [Google Scholar] [CrossRef]
  38. Frigo, M. Knowledge retention: A guide for utilities. J. Am. Water Work. Assoc. 2006, 98, 81–84. [Google Scholar] [CrossRef]
  39. ERSAR. Guia de Avaliação da Qualidade dos Serviços de Águas e Resíduos Prestados aos Utilizadores; ERSAR: Lisbon, Portugal, 2021. [Google Scholar]
  40. ERSAR. Relatório Anual dos Serviços de Águas e Resíduos em Portugal. Caraterização do Setor de Águas e Resíduos; ERSAR: Lisbon, Portugal, 2020; Volume 1. [Google Scholar]
  41. Cassidy, J.; Silva, T.; Semião, N.; Ramalho, P.; Santos, A.; Feliciano, J. Improving wastewater treatment plants operational efficiency and effectiveness through an integrated performance assessment system. H2Open J. 2020, 3, 276–287. [Google Scholar] [CrossRef]
  42. Volta, M.; Poulton, M.; Røstum, J.; Sægrov, S.; Herrero, M. CARE-W WP-6—Testing and Validation of CARE-W Rehab Manager; SINTEF: Trondheim, Norway, 2004. [Google Scholar]
  43. Alegre, H. Infrastructure asset management of urban water systems. In Water Supply System Analysis—Selected Topics; Ostfeld, A., Ed.; InTech: London, UK, 2012. [Google Scholar]
  44. Leitão, J.P.; Coelho, S.T.; Alegre, H.; Cardoso, M.A.; Silva, M.S.; Ramalho, P.; Ribeiro, R.; Covas, D.; Poças, A.; Vitorino, D.; et al. Moving urban water infrastructure asset management from science into practice. Urban Water J. 2016, 13, 133–141. [Google Scholar] [CrossRef]
  45. International Water Association. AquaRating. Available online: https://iwa-network.org/projects/aquarating/ (accessed on 23 August 2021).
  46. ERSAR. Dados de Base. Available online: http://www.ersar.pt/pt/setor/factos-e-numeros/dados-de-base (accessed on 3 July 2021).
  47. Kalulu, K.; Hoko, Z. Assessment of the performance of a public water utility: A case study of Blantyre Water Board in Malawi. Phys. Chem. Earth, Parts A/B/C 2010, 35, 806–810. [Google Scholar] [CrossRef]
  48. Cetrulo, T.B.; Ferreira, D.F.; Marques, R.C.; Malheiros, T.F. Water utilities performance analysis in developing countries: On an adequate model for universal access. J. Environ. Manag. 2020, 268, 110662. [Google Scholar] [CrossRef]
  49. Andres, L.A.; Bahuguna, A. Overcoming missing data bias in water utility indicators by using nested balanced panels. Util. Policy 2020, 67, 101109. [Google Scholar] [CrossRef]
  50. Libey, A.; Adank, M.; Thomas, E. Who pays for water? Comparing life cycle costs of water services among several low, medium and high-income utilities. World Dev. 2020, 136, 105155. [Google Scholar] [CrossRef]
  51. Arsénio, A.M.; Dheenathayalan, P.; Hanssen, R.; Vreeburg, J.H.G.; Rietveld, L. Pipe failure predictions in drinking water systems using satellite observations. Struct. Infrastruct. Eng. 2015, 11, 1102–1111. [Google Scholar] [CrossRef]
  52. Arsénio, A.M.; Pieterse, I.; Vreeburg, J.; De Bont, R.; Rietveld, L. Failure mechanisms and condition assessment of PVC push-fit joints in drinking water networks. J. Water Supply: Res. Technol. 2013, 62, 78–85. [Google Scholar] [CrossRef]
  53. Arsénio, A.M. Lifetime Prediction of PVC Push-Fit Joints. Ph.D. Thesis, TU Delft, Delft, The Netherlands, 2013. [Google Scholar]
  54. Marques, R.C.; Simões, P. Revisiting the comparison of public and private water service provision: An empirical study in Portugal. Water 2020, 12, 1477. [Google Scholar] [CrossRef]
  55. Cetrulo, T.B.; Marques, R.C.; Malheiros, T.F. An analytical review of the efficiency of water and sanitation utilities in developing countries. Water Res. 2019, 161, 372–380. [Google Scholar] [CrossRef] [PubMed]
  56. R Core Team. R: A Language and Environment for Statistical Computing; R Foundation for Statistical Computing: Vienna, Austria, 2021. [Google Scholar]
  57. Wickham, H. ggplot2: Elegant Graphics for Data Analysis; Gentleman, R., Hornik, K., Parmigiani, G., Eds.; Springer: New York, NY, USA, 2009. [Google Scholar]
  58. Schloerke, B.; Cook, D.; Larmarange, J.; Briatte, F.; Marbach, M.; Thoen, E.; Elberg, A.; Crowley, J. GGally: Extension to ggplot2, Version 2.1.2. 2021. Available online: https://search.r-project.org/CRAN/refmans/GGally/html/GGally-package.html (accessed on 27 September 2021).
  59. Seppälä, O.T. Performance benchmarking in nordic water utilities. Procedia Econ. Financ. 2015, 21, 399–406. [Google Scholar] [CrossRef] [Green Version]
  60. Sandelin, S. Knowledge Management and Retention—A Case of a Water Utility in Finland. Ph.D. Thesis, Tampere University of Technology, Tampere, Finland, 2017. [Google Scholar]
  61. INE. Variação da População Residente 2011–2021. Available online: https://www.ine.pt/scripts/db_censos_2021.html (accessed on 27 September 2021).
  62. Tutusaus, M.; Schwartz, K.; Smit, S. The ambiguity of innovation drivers: The adoption of information and communication technologies by public water utilities. J. Clean. Prod. 2018, 171, S79–S85. [Google Scholar] [CrossRef]
  63. Garrido-Baserba, M.; Corominas, L.; Cortés, U.; Rosso, D.; Poch, M. The fourth-revolution in the water sector encounters the digital revolution. Environ. Sci. Technol. 2020, 54, 4698–4705. [Google Scholar] [CrossRef] [PubMed]
  64. Fahnestock, C.M.; Brethower, K.S. Can succession planning impact your utility’s performance? J. Am. Water Work. Assoc. 2004, 96, 22–27. [Google Scholar] [CrossRef]
Figure 1. Box–whisker plots depicting distribution of data points in the period of 2011 to 2019. The width of the boxes is proportional to the total number of data points. Outliers are depicted as crosses (x). (Left) Percentage of network rehabilitated per year. (Right) Non-revenue water.
Water 13 03159 g001
Figure 2. Box-whisker plots depicting the distribution of data points in the period of 2016 to 2019 (the indices were not implemented until 2016). The width of the boxes is proportional to the total number of data points. Outliers are depicted as crosses (x). (Left) Flow-measuring (FM) index. (Right) Infrastructure knowledge (IK) index.
Water 13 03159 g002
Figure 3. Correlation matrix for non-revenue water (NRW), network rehabilitation (Net. rehab.), infrastructure knowledge index (IK index) and flow-measuring index (FM index). The upper panel depicts the correlation between the continuous variables. The lower panels depict the scatter plots of the variables. The diagonal panels depict the density plots, similar to a histogram, of the variables. The stars (*) indicate the p-value of the correlation values, i.e., “***” if the p-value is <0.001, “**” if the p-value is <0.01, “*” if the p-value is <0.05, “.” if the p-value is <0.10, and “ ” otherwise.
Water 13 03159 g003
Figure 4. Digital maturity (0–1) versus Personnel Aging Index (0–1).
Water 13 03159 g004
Table 1. Indicators used to evaluate the performances of water utilities. More information can be found in ERSAR’s latest version of the quality evaluation guidelines [39].
DesignationUnitsFormulaQuality Reference Values
Non-revenue water (NRW)%100 × Volume of non-revenue water physical losses [m3/year]/Volume of water entering the system [m3/year]Good<20
Fair20–30
Poor>30
Network rehabilitated per year in the last 5 years%(100/5) × Length of network rehabilitated in the last five years [km]/Average network length [km]Good1–4
Fair0.8–1
Poor<0.8
Flow measuring (FM) index-Assess whether all locations considered relevant for optimizing the management of the system’s operation are equipped with flow meters. Determined by the sum of the scores of each class under analysis, with a predefined number of points being assigned to each question.From 0 to 200 with 200 being the maximum score
(without reference values)
Infrastructure knowledge (IK) index-Assess the entity’s knowledge of the existing water supply service infrastructure. Determined by the sum of the scores of each class under analysis, with a predefined number of points being assigned to each question. This index attributes points, for example, to the existence of a pipe burst database, and the interconnection between GIS and other utilities’ information systems.
Table 2. Matrix used to determine digital maturity for a water utility.
DescriptionNumber of PointsType of System in Place System Operation
Level 1Level 2Level 3Level 1Level 2Level 3
Level 1—Basic IT capabilities
Cybersecurity system10No system or methodology in placeGeneric approach or methodology followedDedicated system in placeEither:

1. No system or methodology in place

2. Existing system or methodology not in use
Only basic capabilities usedFull capabilities used
Customer relationship manager10
Level 2—Network sensorization and digitization
Flow gauges10/3System covering the most important sections of the networkMost of the network (>80% of consumption) covered, monitored, and automated
Pressure gauges10/3
Telemetry system10/3
Cadastre in digital format10
Level 3—SIG, automated data collection and modeling
Digitalized network model10Generic approach or methodology followedDedicated system in place
GIS system10
SCADA system10
Level 4—Operational management and maintenance systems
Work order management system10
Maintenance system10
Level 5—Optimization systems
Flow-monitoring system10
Optimization system10
Level 6—Planning systems
Domestic flow metering systems10
Integrated asset management system10
Level 7—Predictory systems
Digital twins10
AI systems10
Table 3. General characteristics of all Portuguese retail water utilities and AGS’ water utilities (all retail). Obtained for 2019 from [46].
ERSARAGS
VariableUnitsMeanMinMaxMeanMinMax
Staff supporting water supplyNumber3203927524138
Outsourced staff supporting water supplyNumber402886214
Network lengthkm449840258284171392
House connectionsNumber12,863571153,03721,43010,91733,887
Water entering the systemm35,804,197121,572221,836,2507,943,7172,605,20318,407,025
Tariff incomeEUR2,591,241097,486,9577,968,9453,174,87821,122,610
Table 4. Details of the digital maturity survey given to AGS utilities.
Utility 1Utility 2Utility 3Utility 4Utility 5Utility 6
201620212016202120162021201620212016202120162021
Level 1—Basic IT capabilities
Cybersecurity system363435353533
Customer relationship manager101010101010101010101010
Level 2—Network sensorization and digitization
Flow gauges333333333333
Pressure gauges222222222222
Telemetry system223333333333
Cadastre in digital format101010101010101010101010
Level 3—SIG, automated data collection and modeling
Digitalized network model33883310108822
GIS system101010101010101010101010
SCADA system101010101010101010101010
Level 4—Operational management and maintenance systems
Work order management system7778581010101055
Maintenance system55555555101055
Level 5—Optimization systems
Flow-monitoring system1010101037383338
Optimization system000000000000
Level 6—Planning systems
Domestic flow metering systems77710777777710
Integrated asset management system337855777733
Level 7—Prediction systems
Digital twins000000000000
AI systems000000000000
Total86899510280889310097997785
Total (%)57%59%63%68%53%59%62%67%64%66%51%57%
Publisher’s Note: MDPI stays neutral with regard to jurisdictional claims in published maps and institutional affiliations.

