Article

A Feasibility Assessment of Potential Artificial Recharge for Increasing Agricultural Areas in the Kerbala Desert in Iraq Using Numerical Groundwater Modeling

1
Civil Engineering, College of Engineering, University of Kerbala, Kerbala 56001, Iraq
2
Soil Physics and Land Management Group, Wageningen University & Research, 6708 PB Wageningen, The Netherlands
*
Author to whom correspondence should be addressed.
Water 2021, 13(22), 3167; https://doi.org/10.3390/w13223167
Submission received: 1 October 2021 / Revised: 5 November 2021 / Accepted: 8 November 2021 / Published: 10 November 2021
(This article belongs to the Special Issue Water Management for Climate Smart Agriculture)

Abstract

:
Groundwater in Iraq is considered to be an alternative water resource, especially for areas far away from surface water. Groundwater is affected by many factors including climate change, industrial activities, urbanization, and industrialization. In this study, the effect of artificial recharge on the quantity of groundwater in the Dibdibba unconfined aquifer in Iraq was simulated using a groundwater modeling system (GMS). The main raw water source used in the artificial recharge process was the reclaimed water output (tertiary treatment) from the main wastewater treatment plant (WWTP) in Kerbala, with 20 injection wells. After calibration and validation of the three-dimensional numerical model used in this study and taking wastewater recharge rates into account, two different scenarios were applied to obtain the expected behavior of the aquifer when the groundwater levels were augmented with 5% and 10% of the daily outflow production of the WWTP in Kerbala. The model matched the observed head elevations with R2 = 0.951 for steady state and R2= 0.894 for transient simulations. The results indicate that the injection of treated water through 20 wells raised the water table in more than 91 and 136 km2 for 5000 and 10,000 m3/day pumping rates, respectively. Moreover, increasing the volume of water added to the aquifer could lead to establishing new agricultural areas, spanning more than 62 km2, extending about 20 km along the river.

1. Introduction

Water and groundwater play a pivotal role in food security and economic evolution all over the world. Unfortunately, in recent decades, the ever-increasing demand for water due to urbanization, economic development, population growth, and climate change has caused water scarcity and restricted economic evolution in many countries. Groundwater is used as an alternative source of water when there is a shortage of surface water. Groundwater is the major source of irrigation water in countries with arid and semiarid climates. In some Middle Eastern countries, the domestic water supply depends completely on groundwater [1,2]. Efficient management of groundwater resources is necessary to meet the growing water demand. Climate change and global warming can influence groundwater resources in many ways, either directly or indirectly. Increasing temperatures and changing patterns of precipitation will directly impact groundwater recharge, discharge, water levels, and annual storage. Moreover, the rising level of the sea, increased demand for irrigation water, and changes in vegetation cover can indirectly affect the quality of groundwater resources. Global warming will lead to changes in plant transpiration and evaporation rates, which denote soil dryness, causing higher soil moisture losses and reducing natural groundwater recharge [3].
Overexploitation of groundwater has led to a rapid decline in groundwater levels in many parts of Iraq [4]. One way to control the drop in the groundwater table is to artificially recharge water using wells [5,6]. Many studies have shown an increasing trend in artificial recharge methods in numerous regions all over the world such as Finland, The Netherlands, Belgium, Greece, Denmark, and Spain. Other regions in which artificial recharge techniques are used include Iran, Tunisia, Morocco, and South Africa [7]. The concept of artificial groundwater recharge technology is gaining momentum day by day because groundwater is such a variable and precious natural resource. Artificial recharge not only provides an efficient method of water storage allowing better management of the available resources, but it can also affect water quality indexes [8].
The utilization of treated wastewater is an important part of a water management planning strategy, particularly for the artificial recharge of groundwater resources and agriculture. Consequently, reclaimed wastewater is used to improve the quantity and quality of groundwater in an aquifer. Several studies have proven that such alternatives are plausible when traditional fresh raw water sources become severely limited [9,10,11,12,13]. The use of artificial recharge techniques has already been recognized as a way of increasing groundwater levels and improving water quality in different groundwater aquifers [14,15]. For example, Bouri and Ben Dhia [16] reported that the groundwater level of the Teboulba aquifer located in Tunisia rose nearly 30 m after six years of artificial well recharge.
Iraq is located in a region that suffers from water scarcity with only a few special water resources of its own. It is facing considerable interdependent political, economic, environmental, and security challenges [17]. Among the most important of these challenges is the deterioration of the Euphrates and Tigris rivers, which are essential to agriculture and water security in Iraq. Both rivers originate outside Iraqi borders in Turkey and Iran. Iraq has no control or authority over them. The adverse impacts from the installation of hydraulic structures such as big dams upstream on the Euphrates and Tigris rivers coupled with climate change will further undermine the agricultural sector in Iraq, causing further environmental deterioration and increasing desertification.
The current study focuses primarily on the unconfined Dibdibba aquifer in south-eastern Iraq. Over the past 20 years in this aquifer, there has been a severe decline in both groundwater levels and water quality caused by the excessive use of groundwater for cultivation [18]. This problem has motivated numerous researchers to study hydrodynamic systems using numerical modeling [19,20,21] to obtain the spatial distribution of groundwater levels and the directions of groundwater flow or to identify the amount of re-usable recharge by rainfall. Unfortunately, there have been no previous studies regarding artificial recharge in the region, perhaps due to the lack of treated water or any water sources other than rain in the study area. The first wastewater treatment plant (WWTP) in Kerbala, which is within the boundaries of the aquifer formation, was opened in 2020.
Numerical models such as MODFLOW for simulating the flow of groundwater have been used in several previous studies over the last decade. These types of programs are connected to GIS technology and play a vital role in the management and evaluation of groundwater in many regions [22,23]. Numerical modeling investigations have been frequently used by researchers to predict the potential of an aquifer or to implement recovery of groundwater levels depending on numerical models with multi-scenario development [7,12,13,24,25,26,27]. In this paper, the impact of artificial recharge by wells on the groundwater level behavior in an unconfined aquifer (Dibdibba) was evaluated based on several scenarios using 3D calibrated numerical models constructed by the MODFLOW application using GMS 10.4 software. The main objective of the current study is to obtain the expected increase in groundwater levels and the range of the affected area as a result of applying artificial recharge by selected wells. The present study focuses on the range area near the Kerbala wastewater treatment plant (WWTP). It is the first scientific study dealing with the process of artificial recharge in the study area (Dibdibba unconfined aquifer) and one of the first studies in Iraq on the application and sustainability of treated water.

2. Materials and Methods
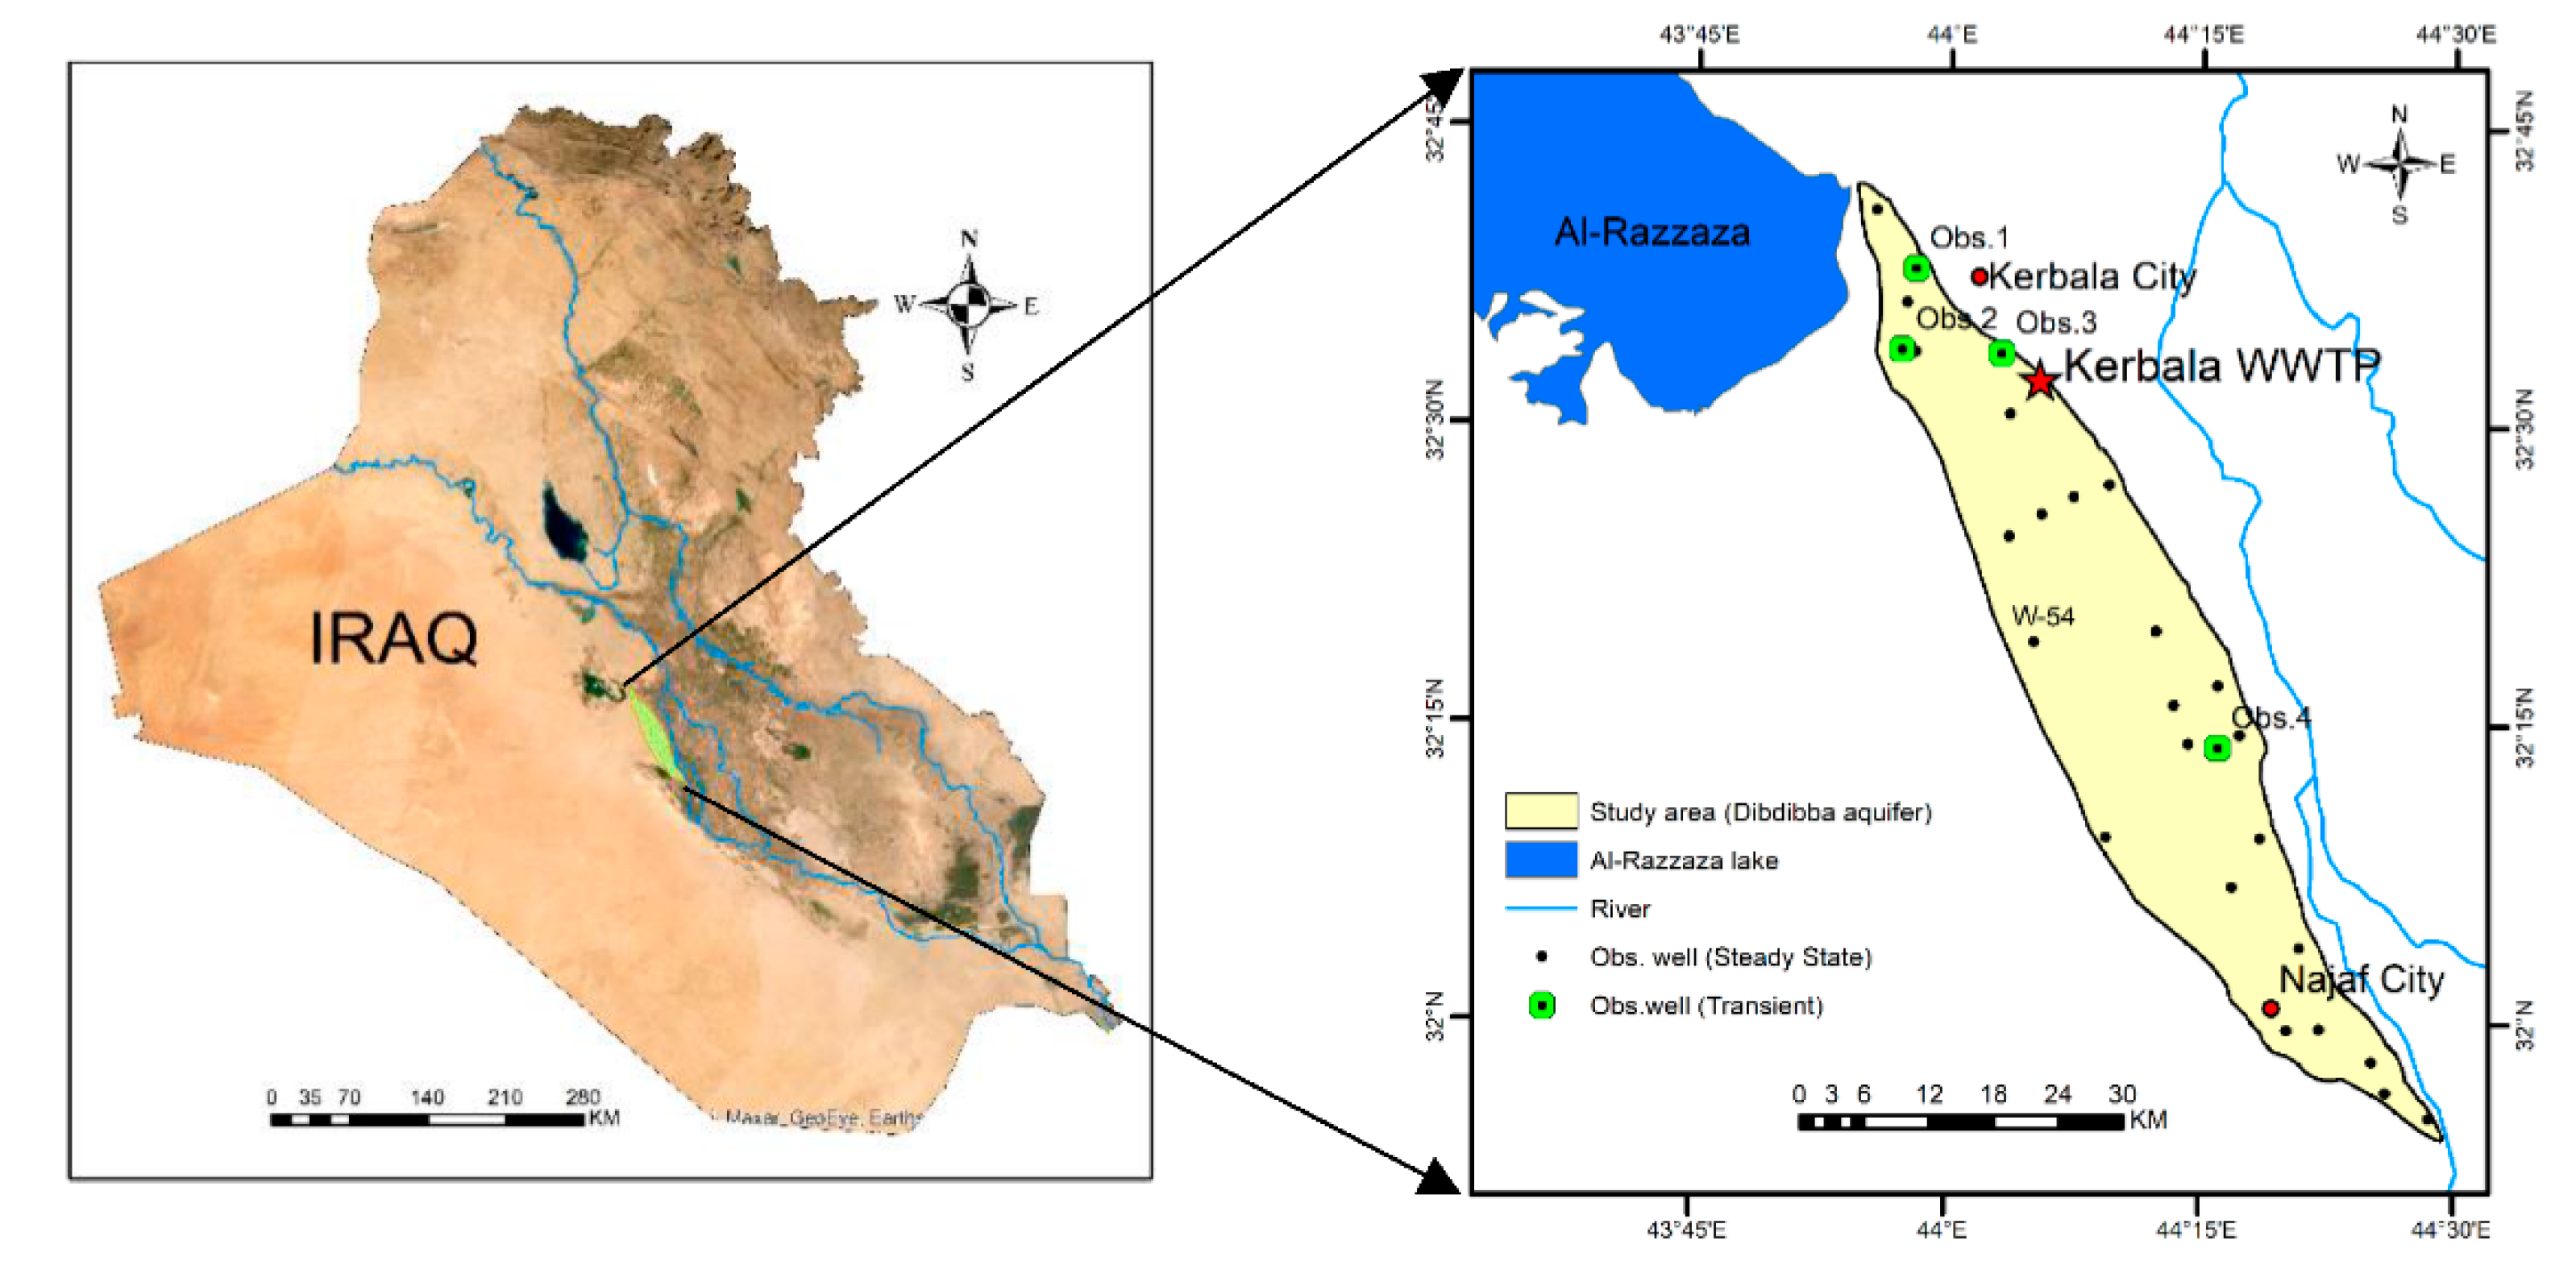
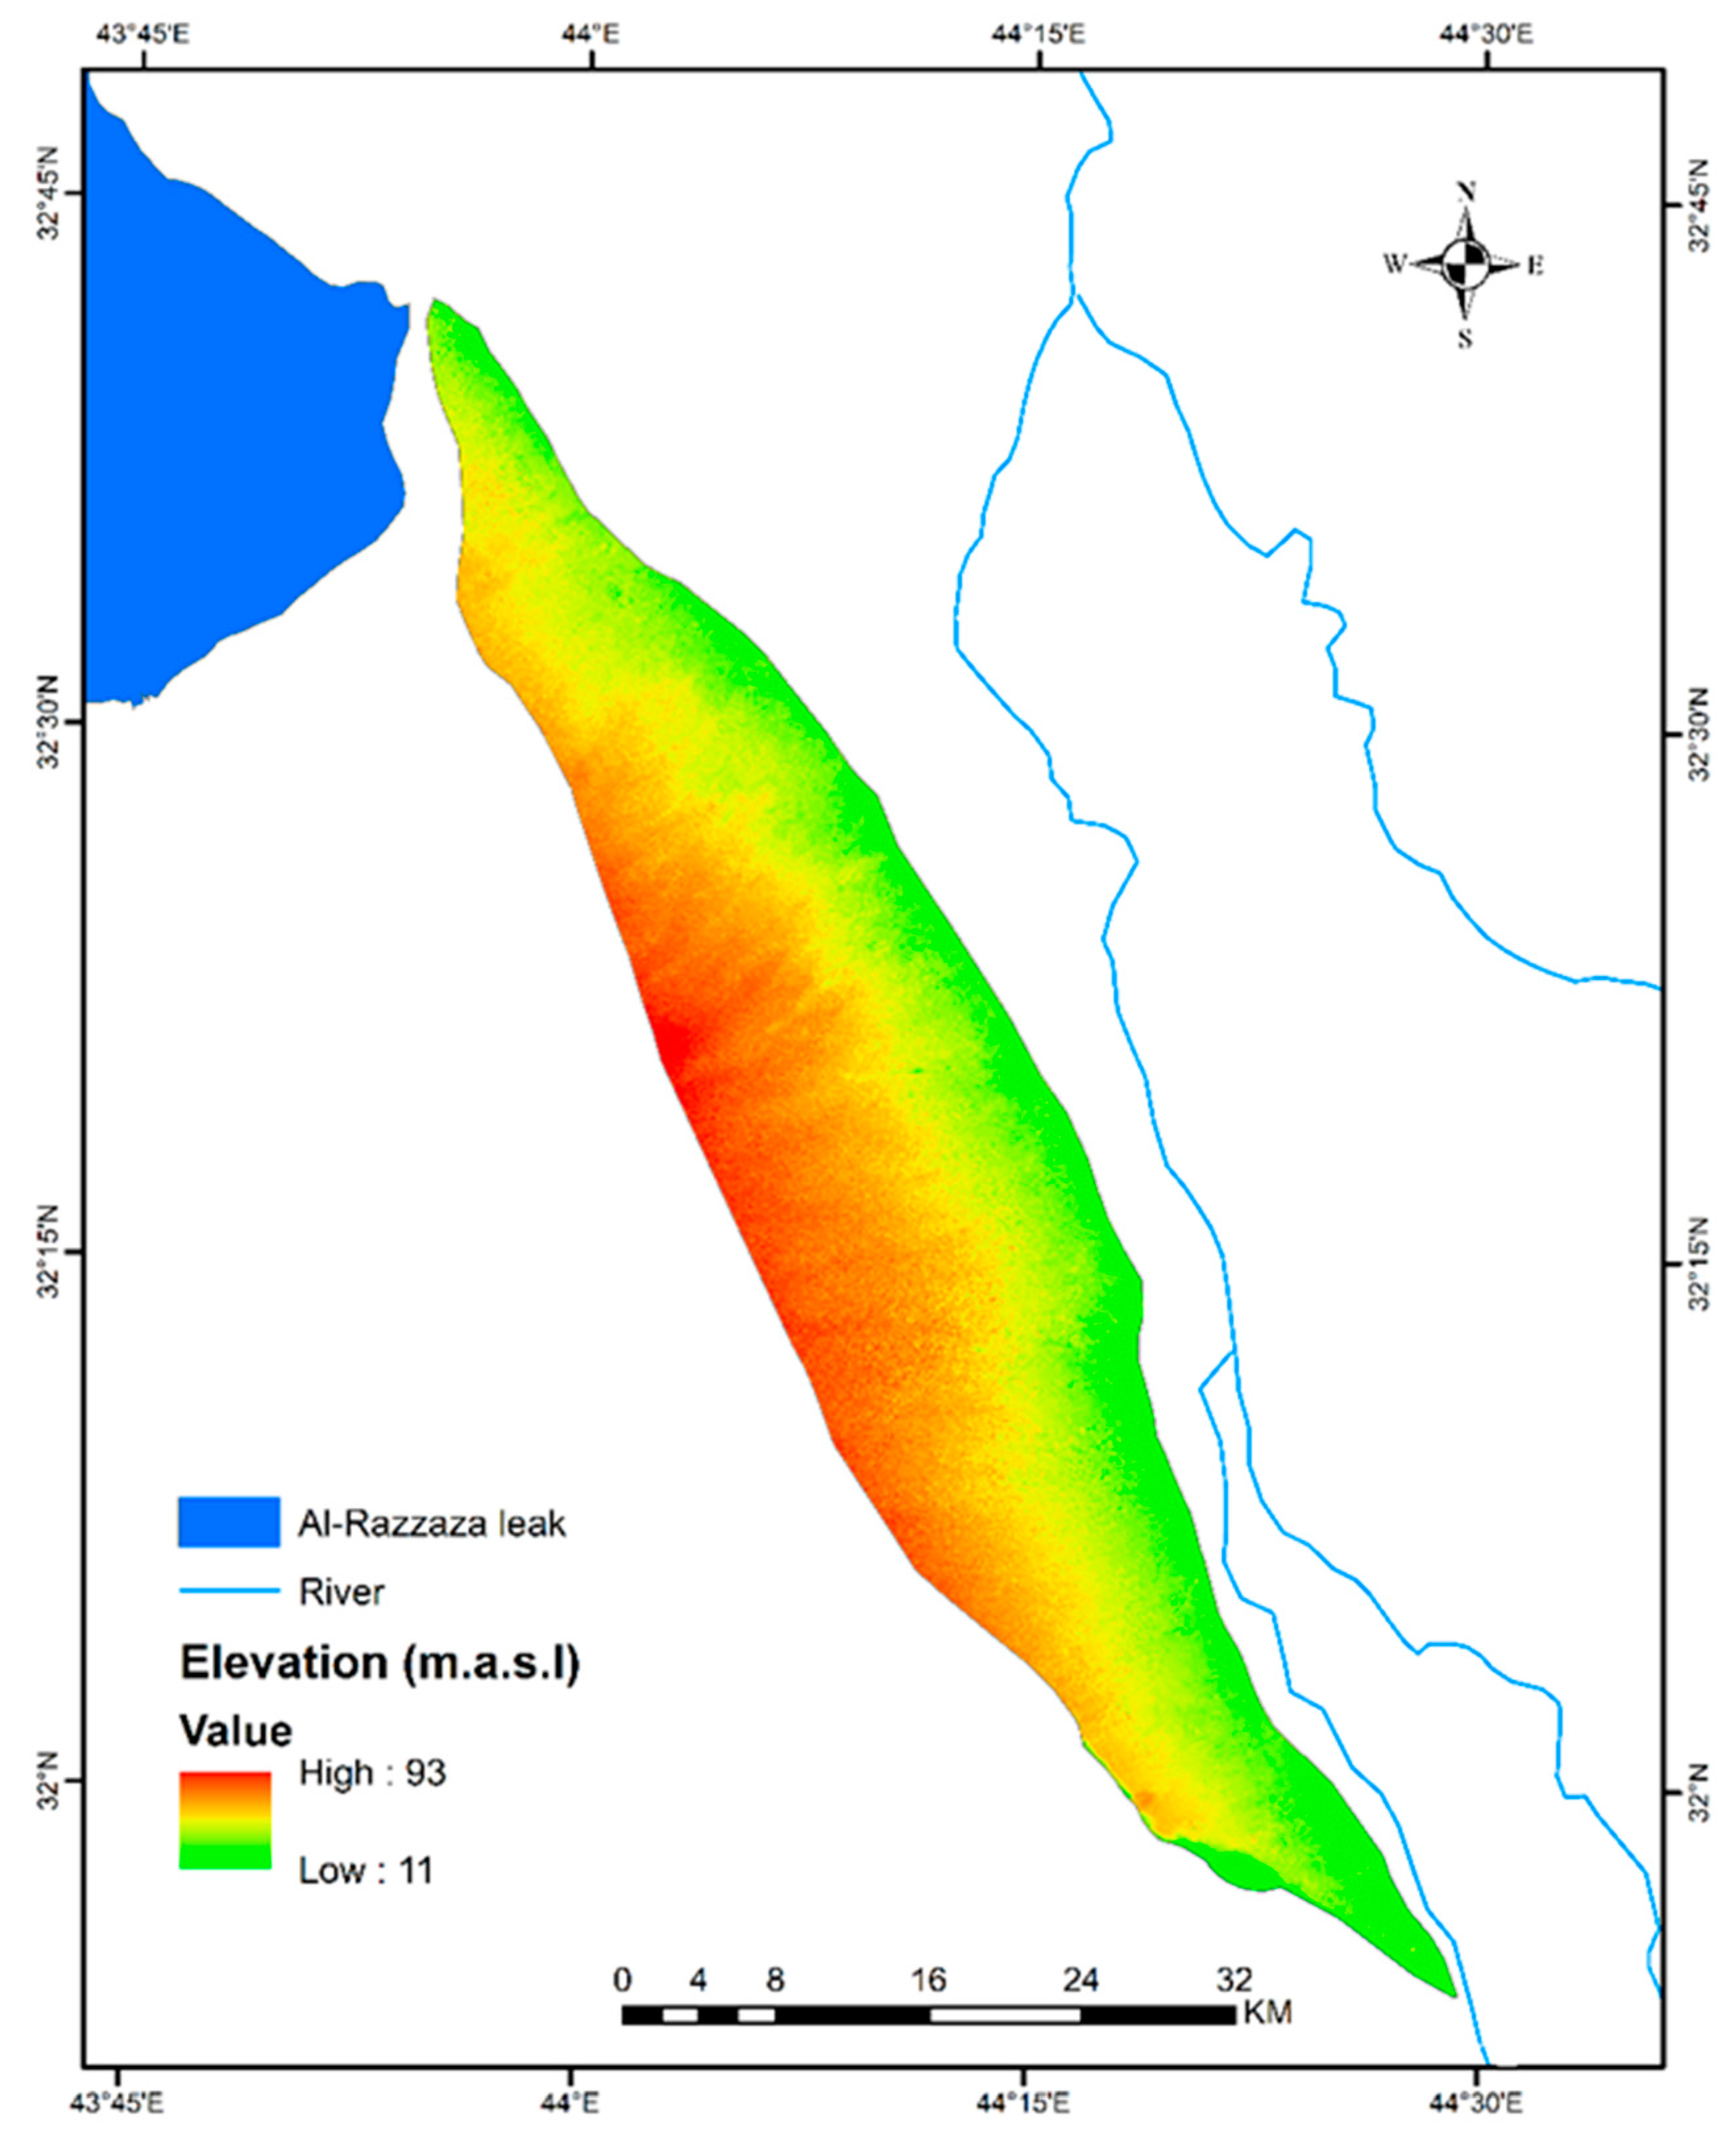
2.1. Study Area

Iraq is a country in a semi-arid/arid region of the Middle East. Geographically, the study area (Dibdibba aquifer) is located in central Iraq, between the cities of Najaf and Kerbala, with coordinates between 31°55′ N–32°45′ N latitude and 43°30′ E–44°30′ E longitude, as shown in Figure 1. The Dibdibba aquifer is an unconfined shallow aquifer with a single soil layer and fully depends on rainfall for recharge. It covers an area of 1100 km2 and is limited by two cliffs: the Tar AlSayyed within Kerbala city boundaries in the northwest and the Tar Al-Najaf within the boundaries of Najaf city in the south and southwest. The Al-Razzaza lake, located near the northern boundary of the aquifer, is an open surface reservoir. The eastern side of the aquifer is bounded by quaternary sediments. The topography elevation ranges from 10 m to 90 m above sea level. The study area is considered to be the most important aquifer in Iraq. The region is known for its significant cultivation activity, which has led to a growing demand for irrigation water and thus an increase in groundwater withdrawal. For the study area, the main direction of groundwater flow is generally towards the Euphrates River, from the southwest to the northeast, and the hydraulic gradient value ranges from 0.0011 to 0.0005. The mean temperature ranges from 11 °C during the winter season to 37.5 °C during the summer. The mean annual rainfall in the study area ranges from 90 mm at the Kerbala meteorological station to 112 mm at the meteorological station in Najaf. The wettest months of the year are between November and March; 80% of the yearly precipitation falls in this period. Summer is the driest season, from June to September. Scant and irregular rain falls in May and October. Since 2003, the groundwater level has decreased and the quality of the water has been degraded. This area has been greatly influenced by water withdrawal, especially in places that were subject to overexploitation [28]. Moreover, other studies [29,30] have referred to the salinization of groundwater as an indicator of the increasing use of irrigation water for agriculture, which has led to soil leaching and the transfer of fertilizers to the unconfined aquifer. To address the issues of the low groundwater table and the deteriorating water quality in the Dibdibba unconfined aquifer, this study used treated municipal wastewater as an artificial recharge source. The main reasons for choosing this type of water were its availability in relatively large quantities (100,000 m3/day) and the location of the nearby wastewater treatment plant.

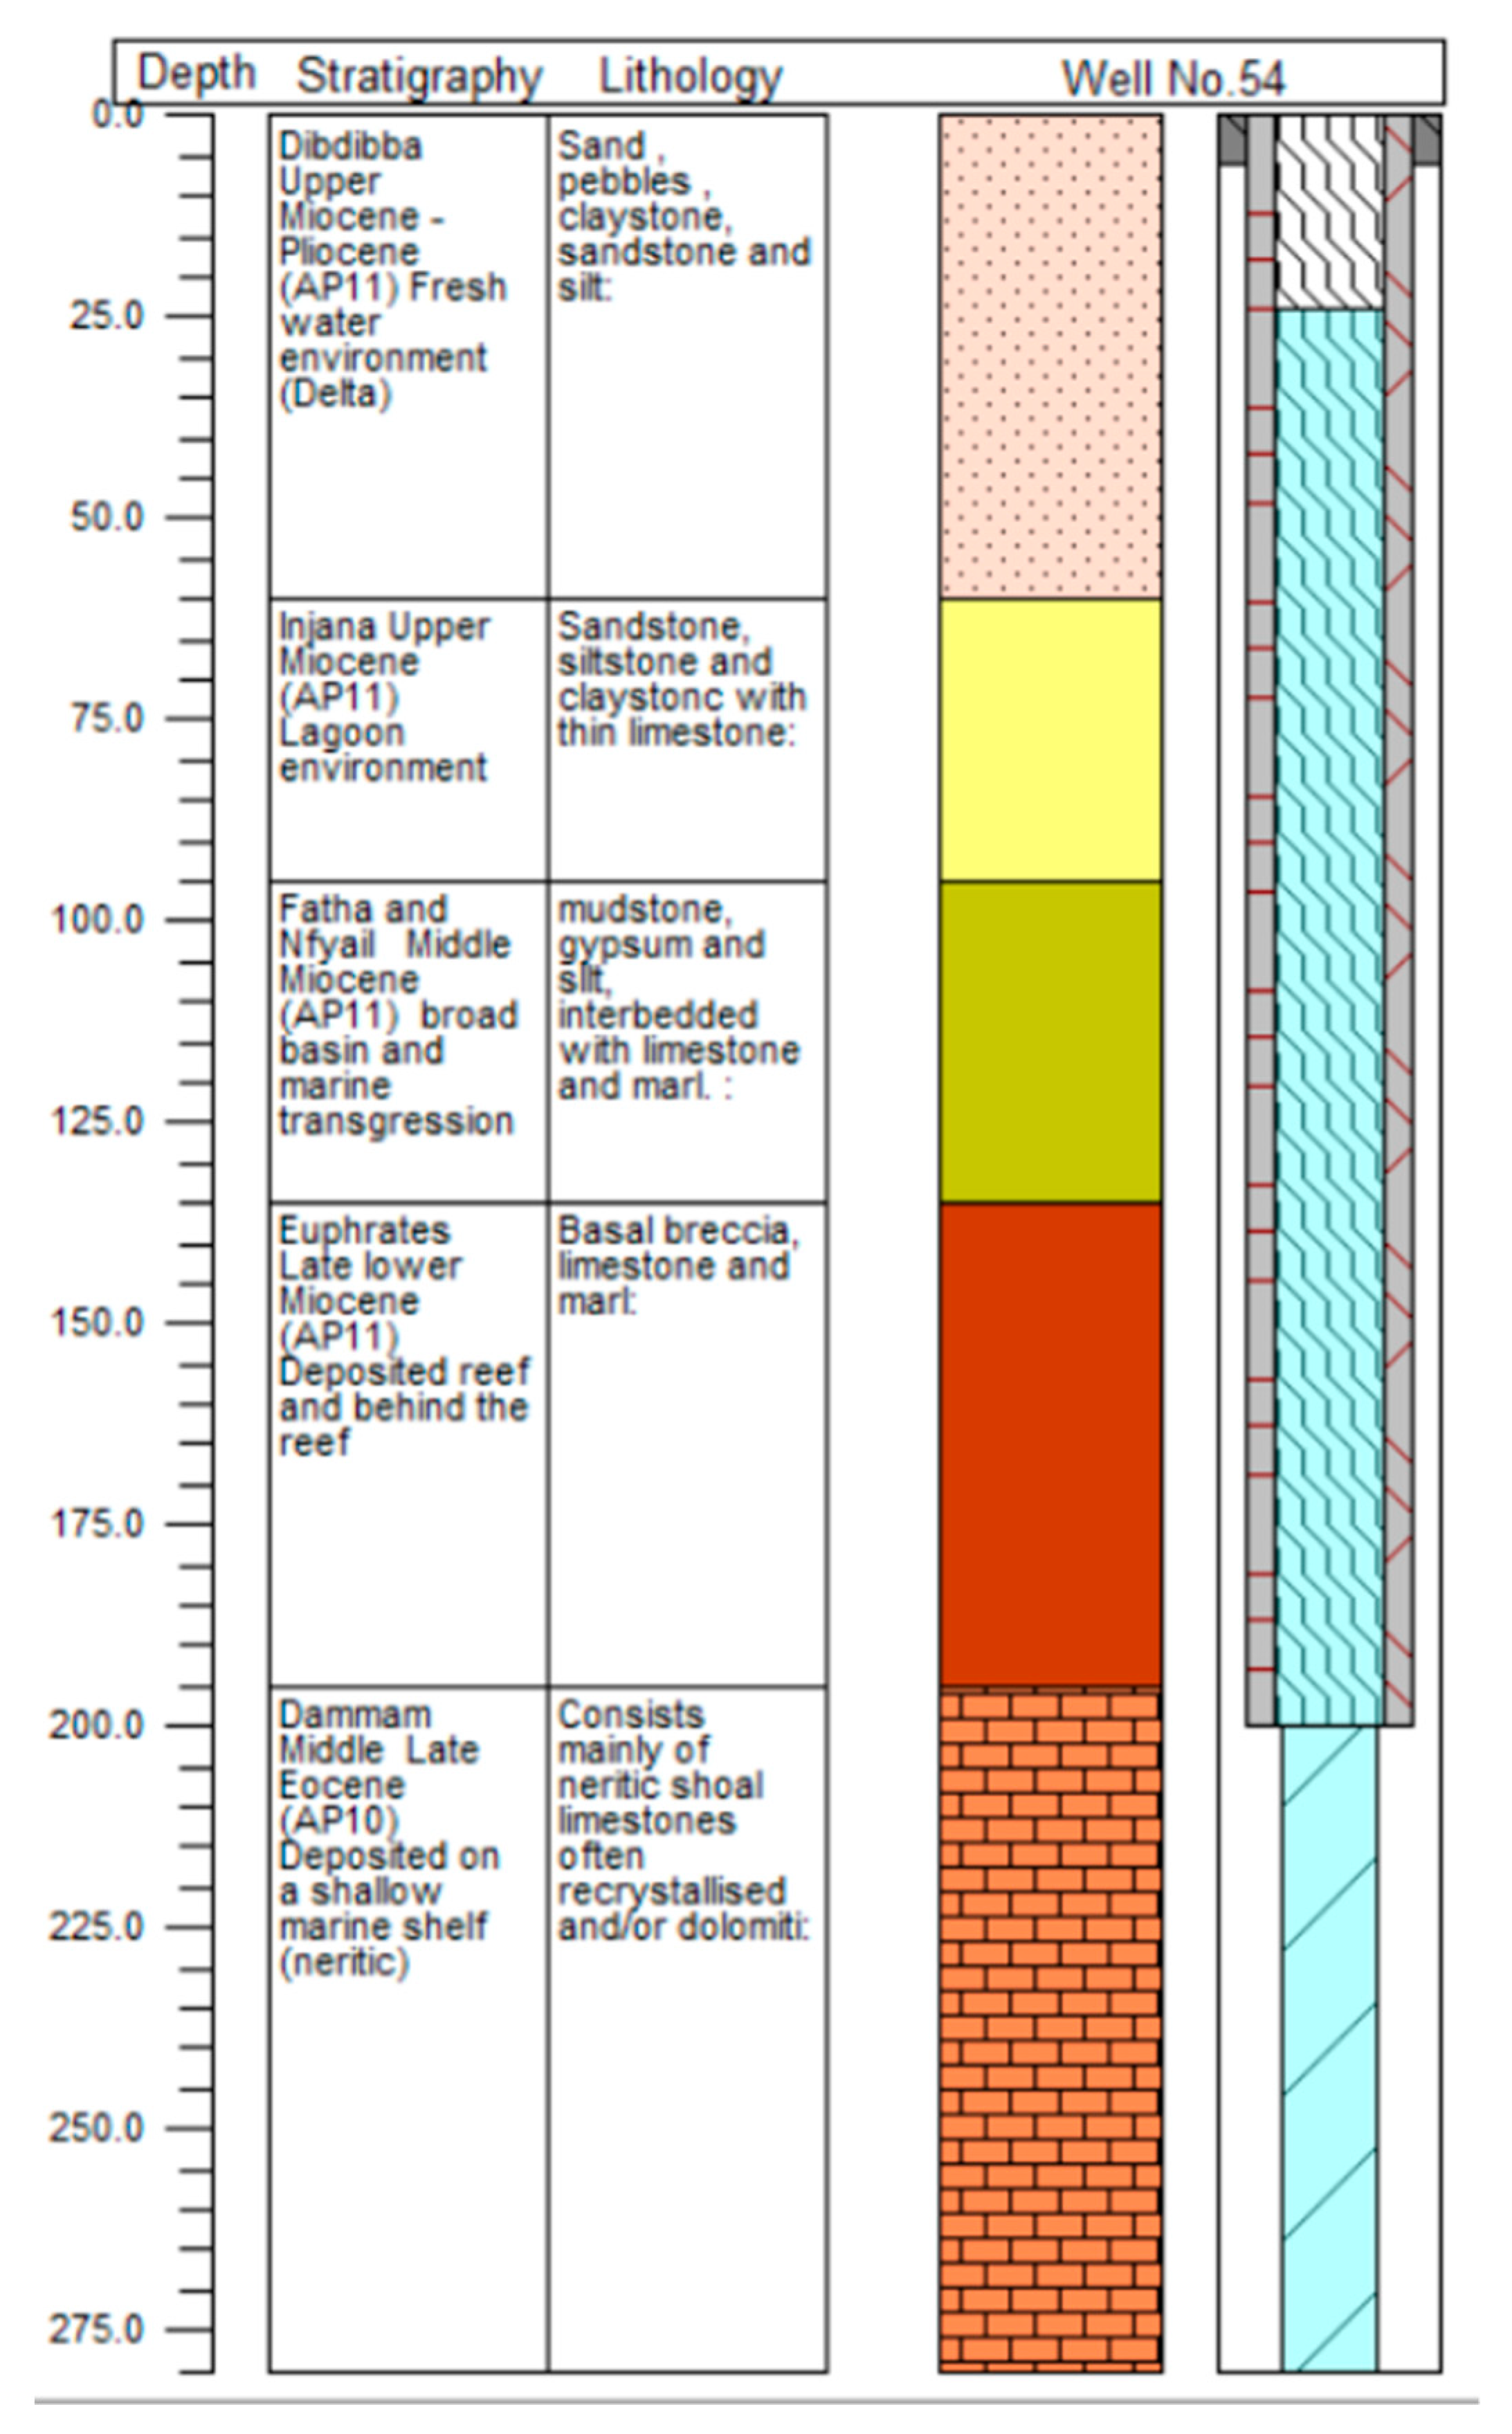
2.2. Hydrogeological Characterization

The correct description of the hydrogeological situation in the aquifer under study is essential for understanding the value of the pertinent flow operations. Without a correct description of the area, it is impossible to choose a suitable model or develop an authoritative calibrated model. Hydrogeological characteristics of the modeled area, such as the parameters of the aquifer, are only available for a few sites in the study area. In order to obtain an estimate of the information needed, the Kriging method was used to predict data across the entire region. Figure 1 shows the locations of the selected production wells used to predict the aquifer characteristics in the study area.
These characteristics have an important impact on the accuracy of calculating the artificial recharge of the aquifer. The most important soil attributes are the main parameters that control the flow rate of the downward percolation and infiltration, especially with this type of technique. Figure 2 shows the lithology formation that was identified utilizing deep well logs and results from the infiltration test. The stratigraphic column in the area of study includes many formations (from old to young): middle late Eocene (Al-Dammam), late lower Miocene (Euphrates), middle Miocene (Fatha and Nfayil), upper Miocene (Injana), and upper Miocene-Pliocene (Dibdibba). The last formation (Al-Dibdibba) represents the top of the main unconfined aquifer and covers 1100 square kilometers of the Najaf-Kerbala plateau. The aquifer is recharged by the seasonal stormwater, with water coming from the eastern and northeastern areas as well as directly from rainfall falling on the plateau [31,32]. The formation of Dibdibba consists of pebbly sandstone and sandstone with some claystone, siltstone, and marl associated with secondary gypsum. The thickness of the formation ranges from 45 to 60 m. The Al-Dibdibba formation is exposed at both ridges of the Tar Al-Najaf and the Tar Al-Sayyed, taking the topmost of the uncovered sequence, hence making up the bedrock of the desert plain between Najaf and Kerbala.

2.3. Groundwater Flow Simulation

In order to meet the objectives of the numerical modeling, a conceptual model was constructed. The conceptual model represents an idealistic and simplified representation of the problem, consisting of the spatial distribution of hydrogeological and geological units, types and location of boundaries, and the values of the aquifer parameters. A suitable description of the hydrogeological conditions in the study area is essential for building the conceptual groundwater flow model as well as for developing the reliably calibrated model. To obtain the input data for the conceptual model, a spatial statistical technique was used for all data. The geostatistical technique (Kriging) was used in this study to interpolate the groundwater level data and all other aquifer characteristics such as hydraulic conductivity and the upper and lower limits of the unconfined aquifer. These terms represent the major input data for the MODFLOW under the GMS simulation program.
In this study, the ordinary Kriging method was used to provide the estimated values for different initial input parameters at any unsampled points in the aquifer. For the best performance of the Kriging interpolation method, it is recommended that the input data are normally distributed (bell curve). Two testing methods were utilized to investigate whether or not the input data (aquifer parameters) followed a normal distribution; the first was the drawing of histograms of the data, and the second was a normal probability (Q-Q) plot. A normal Q-Q plot is generated by plotting the values of input data against the value of the standard normal distribution where their cumulative distributions are equal. If the points cluster around a straight line, the data distribution matches the normal distribution. The experimental semivariograms and the best-fitted theoretical models for the data of groundwater levels (head) are shown in Figure 3. The three nonlinear main different semivariogram models (exponential, spherical, and Gaussian) for observed groundwater head levels were plotted as shown in Figure 3a–c, respectively. The semivariogram parameters (i.e., nugget, partial sill, and range) were obtained for each model. To check the validity of all the assumptions made in the development of the theoretical model and estimation of model parameters, cross-validation was carried out on the data. It is clear from Figure 3 that the best fit of the data was the Gaussian model compared to other models. Therefore, the Gaussian model was chosen as the final model to be used in Kriging for the initial groundwater level data.
The second stage was the calibration of the model. Through the calibration process, the fine-tuning of the parameters was carried out in such a way that the numerical model could simulate groundwater levels that match the field measured values in the best possible way. The parameter estimation process was performed automatically using the PEST (=parameter estimation) calibration software under the GMS program. During the calibration process, this tool operates automatically to decrease the difference between measured and computed values by changing different aquifer parameter values such as hydraulic conductivity and transmissibility until minimum differences are reached. The tool uses mathematical optimization algorithms.
During the calibration process, sensitivities of the computed groundwater levels with respect to the aquifer parameters were calculated. These statistical indexes and others were used when deciding which aquifer parameters to consider and to detect amended calibration. Calibration was performed for two main states of the numerical model; the first was the steady state and the second was the transient state to investigate the performance of models to simulate the aquifer for selected periods in the future. The calibrated steady state is very important for the transient state as it represents the initial condition of the transient models.
The model calibration process is an important part of any groundwater modeling process. For the calibration under a steady-state condition, the model variables of the aquifer’s natural recharge and hydraulic conductivity were predicted. The steady state was calibrated using 15 observation wells and 2 adjustable variables. The calibration of the steady-state condition was obtained by reducing the variation between the observed groundwater table and the simulated groundwater table, where the observed heads automatically compared with heads computed by the model. The final calibrated model was created using the parameter estimation tools (PEST) application in GMS software. The measured values were registered, and the intervals of confidence (95%) and observation head interval (0.5 m) were selected.
For each homogeneous region in the study area, the natural recharge and hydraulic conductivity needed to be estimated separately in order to decrease the uncertainty resulting from the expected variance of the relatively large area studied. Therefore, the study region was divided into seven zones with estimated hydraulic conductivity parameters based on the results of the pumping test of twenty wells [33] and three sub-catchment areas for natural recharge depending on the aquifer characteristics (Figure 4).
The model was validated using well data for the transient condition. The calibrated models were used to estimate the effect of the suggested artificial recharge by the wells on the aquifer groundwater table with a focus on the surrounding area. Different scenarios were applied based on the hypothesis of groundwater pumping rates and artificial and natural recharge over the future period between 2022 and 2030. The results of the model were validated through the historical period 2016–2017 using realistic recharge rates drawn from the observations.

2.3.1. Grid Design

The domain of the model was chosen to cover 1100 km2. The optimum grid size for the model was found by trial and error. Two main criteria were considered. The first was the stability of the results for the last three trials at least. The second was the time required to complete the run, especially with 3D models and the use of the automatic calibration tool (PEST), as increasing the grid size to more cells than the optimal amount caused time-delays and irregularities in the solution, especially in the transient case. The grid of the model was composed of 7800 active cells. The cell width along rows and columns (x and y directions) was set at 500 m. The model region was created horizontally on a two-dimensional grid and vertically as a single unconfined layer. It is also important to note that independent results of the grid were obtained. Upper elevation values of the aquifer were determined based on a map of the topographic contour lines of the region, Figure 5, and the aquifer’s low elevation, which comprised the top elevations minus the depth of formation. The average depth of the geological formation was 40 m. Due to the MODFLOW within the GMS program, we adopted the topography as a top layer and it was determined by meters above sea level (m.a.s.l.). Consequently, all the other input and output contour map layers were produced with the same units.

2.3.2. Boundary Conditions

One of the most important requirements needed to solve the governing equations describing the flow in porous media like groundwater flow is determining the boundary conditions of the domain (study area). Boundary conditions refer to hydraulic conditions along the perimeter of the problem domain and mathematically can be classified into three types: constant head boundary, specified flow boundary, and head-dependent boundary. For the study area, boundary conditions were determined based on the flow pattern of groundwater in the Dibdibba unconfined aquifer and the observations of the groundwater level in the wells. A constant head boundary was applied at the eastern and western sides of the area. These head values were 35 m and 5 m, respectively, as obtained from measurements taken at observation wells. Moreover, the two features in the study area (i.e., Tar Al Sayyed and Tar Al Najaf) were defined as a no-flow boundary on the study area’s northwest and southwest edges since it matched the flow directions (streamlines).

2.3.3. Recharge Estimation

Because field recharge values are difficult to determine, calibrated recharge modeling was used. The spatially calibrated recharge was first distributed according to the water budget analysis and then adjusted until a good match was obtained between the calculated and observed groundwater levels. The amount of groundwater recharge in the region was fundamentally computed from rain infiltration, assumed to be approximately 10% of the mean annual rainfall, as was found by other researchers [33]. The groundwater pumping rate through produced wells to meet the water demand for irrigation in the study region constituted a main component of the outflow of the system. There were about 3000 wells operating in the study area aquifer until recently when the number of operating wells was significantly decreased. According to the General Commission of Groundwater reports, there are only 500 to 600 wells still operating in the study area. In general, well depths ranged from 20 to 90 m and the pumping rates were between 25 and 30 m3/h. The specific capacity of wells ranged from 5 to 220 m3/h [33].
Based on the pumps’ withdrawal rates and average well operating times, the value of the total abstraction rate could be calculated as follows:
Total   withdrawal = ( pumping   rate ×   operation   time ×   days   operation / year )   × number   of   production   wells / 365
When assuming that the operation time ranges from 6 to 8 h/day with an average discharge of 8 L/s and 145 days of operation per year, the annual pumping rate is 11,000 m3/day. These calculated values were applied as input for the simulation model due to the lack of direct field measurements.

3. Results and Discussion

By using the calibration and validation process for the numerical model and assurance of its consistency with real aquifer conditions, the simulation model can be used for the management of the aquifer. For this paper, the calibrated numerical model was used to investigate the impact of artificial recharge by wells in the Al-Dibdibba region on the groundwater levels of the unconfined aquifer. Therefore, constructing and validating an accurate simulation model was fundamental to reaching the objectives of the research. With the simulation model, the impact of the artificial recharge of the wells was evaluated using several scenarios.

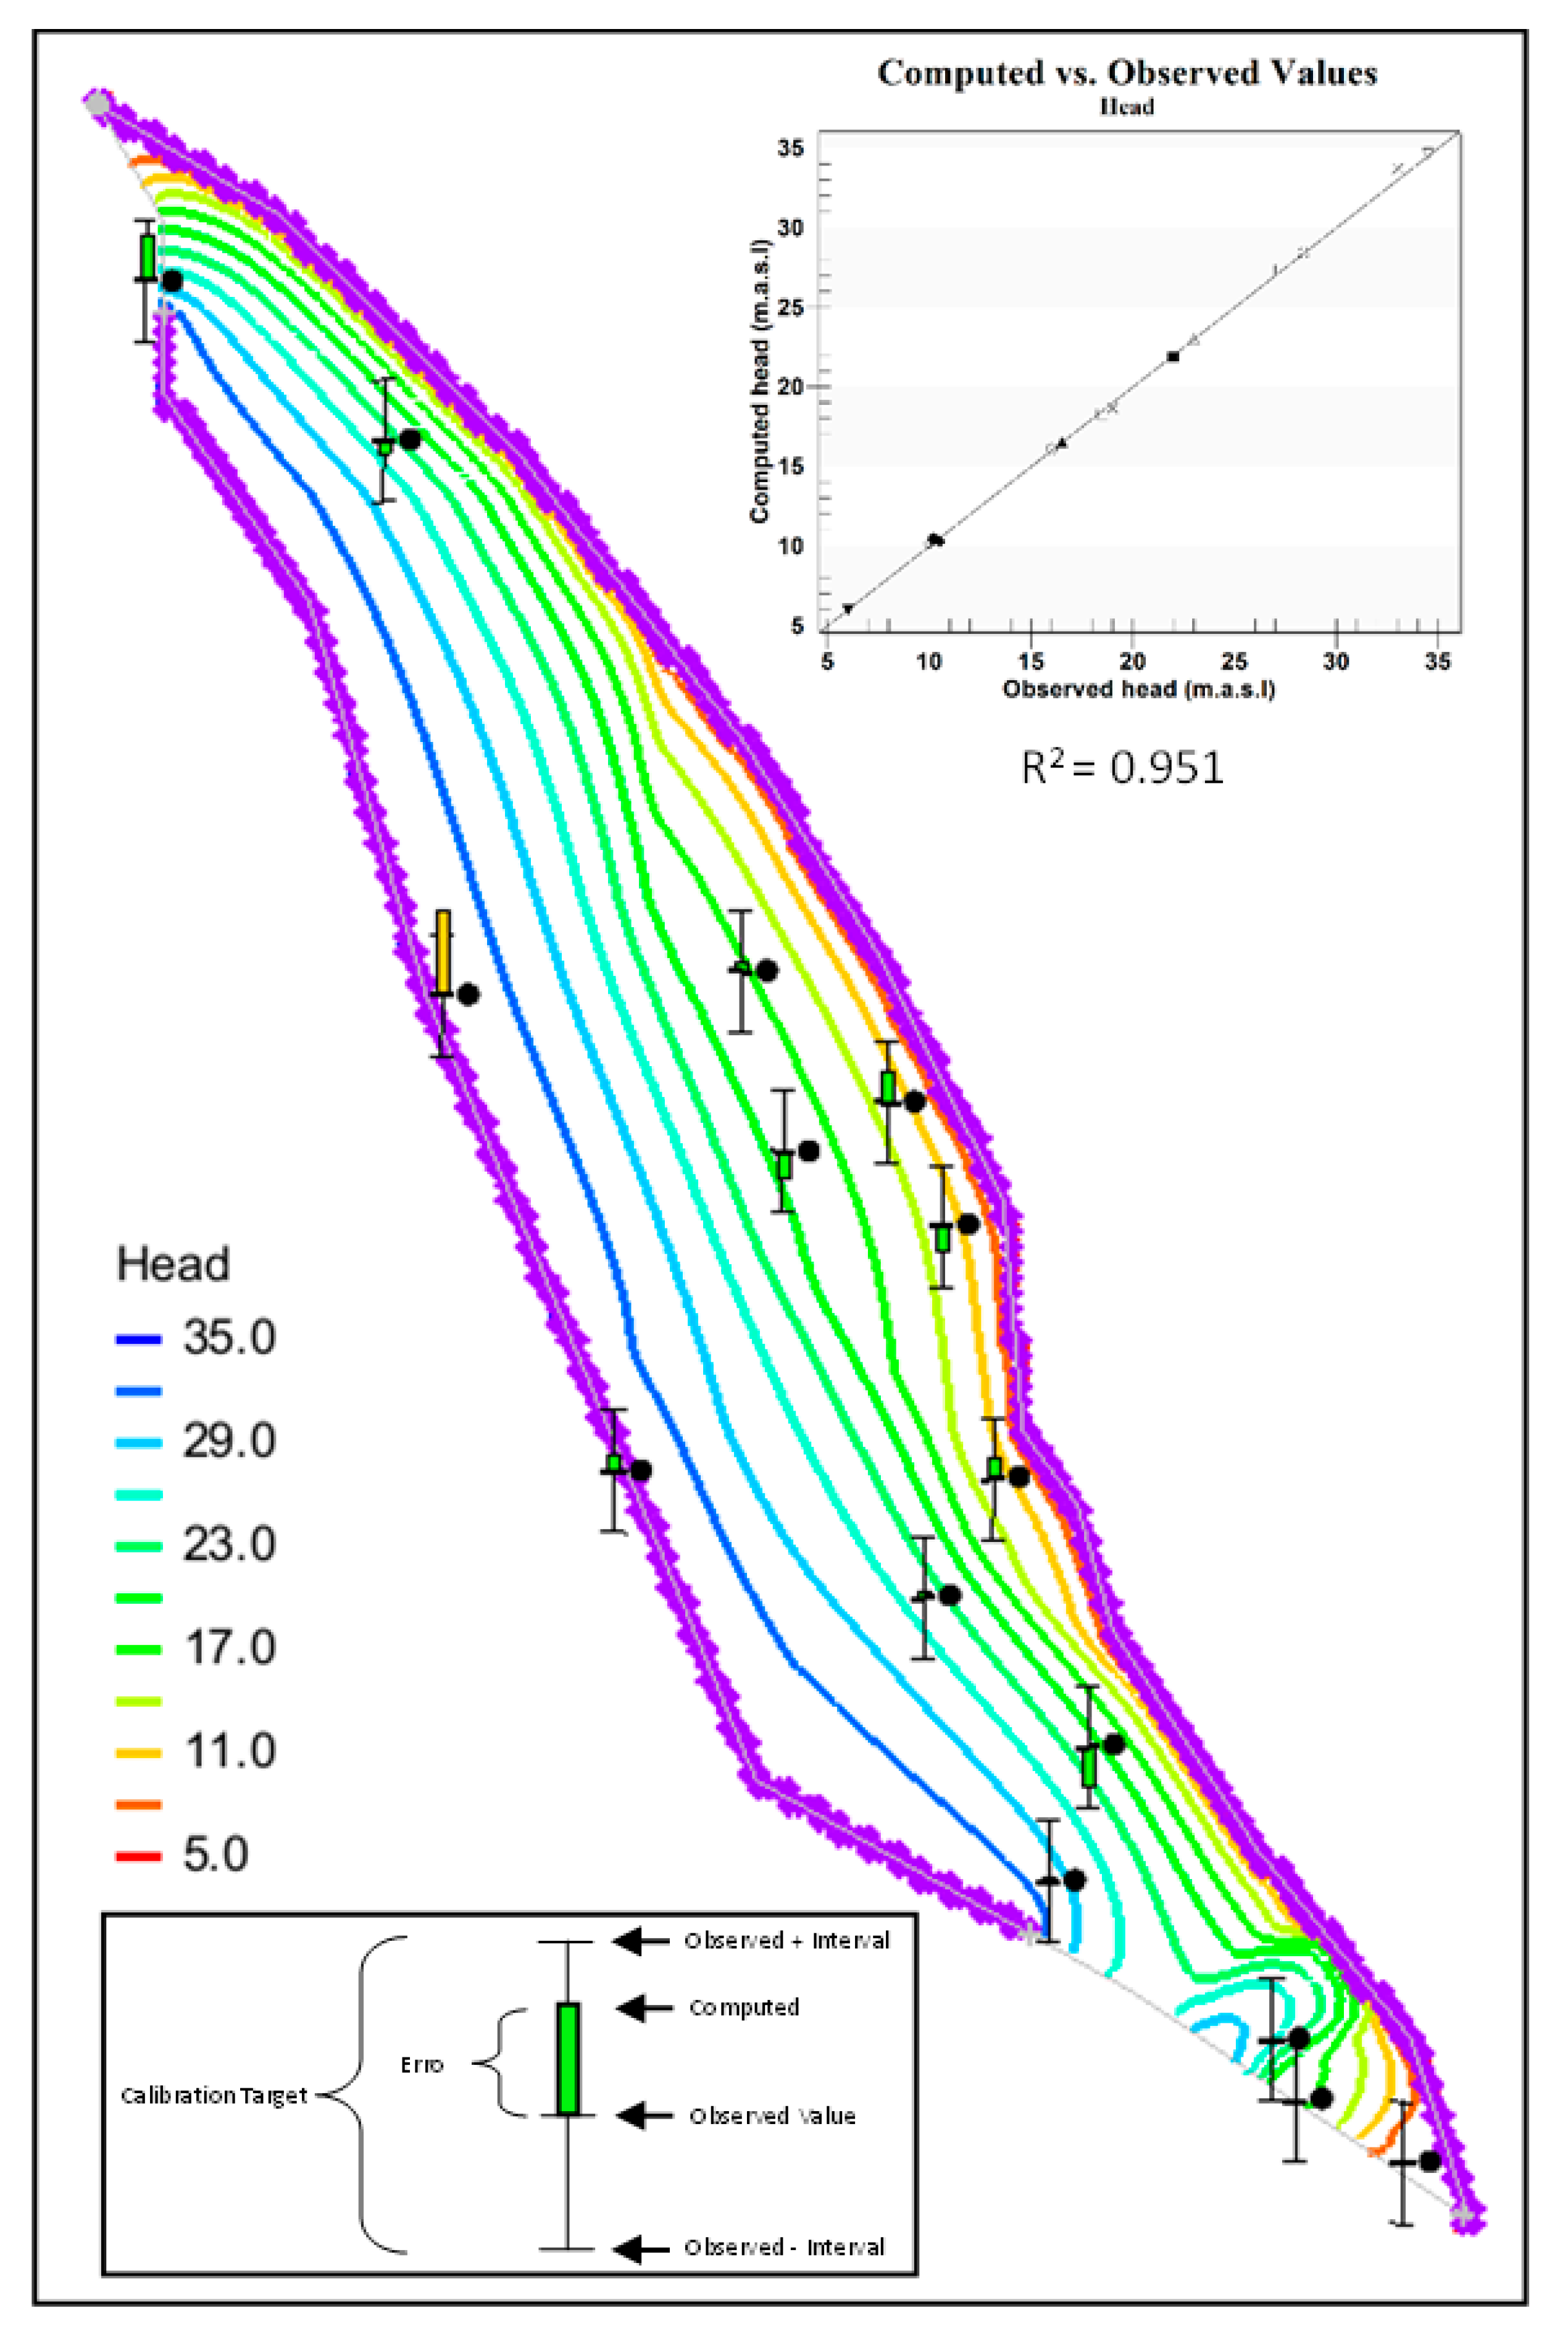
3.1. Steady-State Model Calibration and Validation

For the calibration and validation processes, the observation coverage in GMS was used, where the observed values from the field were automatically compared with the values computed by the model. The measured values were registered, and a confidence interval (95%) and observation head interval (0.5 m) were specified. The results of the calibration along with the calibration target bars are shown in Figure 6. The middle line represents the observed value. The top and bottom ends of the whiskers indicate the observed values plus the interval and the observed value minus the interval, respectively. The filled bar shows the error; the green color indicates that the error is within the specified interval (less than 0.5 m). Yellow bars denote that the error is between 0.5 and 1 m, and for the red bar, the error is more than 1 m. In the calibration process, effort was put into reducing the error or colored bar. For steady-state conditions, the calibration and validation of the numerical model were performed with available measured groundwater levels for 15 observed wells only. These 15 wells were chosen in such a way that they covered the entire study regions as well as reducing the duration time of simulated run in the calibration process (which was done automatically by using PEST tools within GMS software).
Figure 6 shows the calibration results and contour map of simulated groundwater levels of the Dibdibba aquifer for steady state conditions. In Figure 6, 15 of the calibration targets were used to represent the water level in the model, 14 bars are green (error less than 0.5 m), and one bar is yellow (error more than 0.5 and less than 1 m), so that the obtained values matched with the measured values at an acceptable accuracy level. Moreover, the results of the calibration model were deemed acceptable after comparing the computed groundwater elevations with the measured values as shown in Figure 6. The model matched the observed head with a determination coefficient (R2) of 0.951. This relatively high correlation value was obtained by using the PEST auto-calibration tool in the GMS software. In addition to the process of estimating hydraulic conductivities and recharge separately for each homogeneous zone, the study area was divided into several zones for these two important parameters during the calibration process of the conceptual model. These validated results are an indicator for good confidence for the estimated results for the simulated model. Consequently, the results of this steady-state calibrated model can be used as an initial condition in the process of calibrating the transient model.

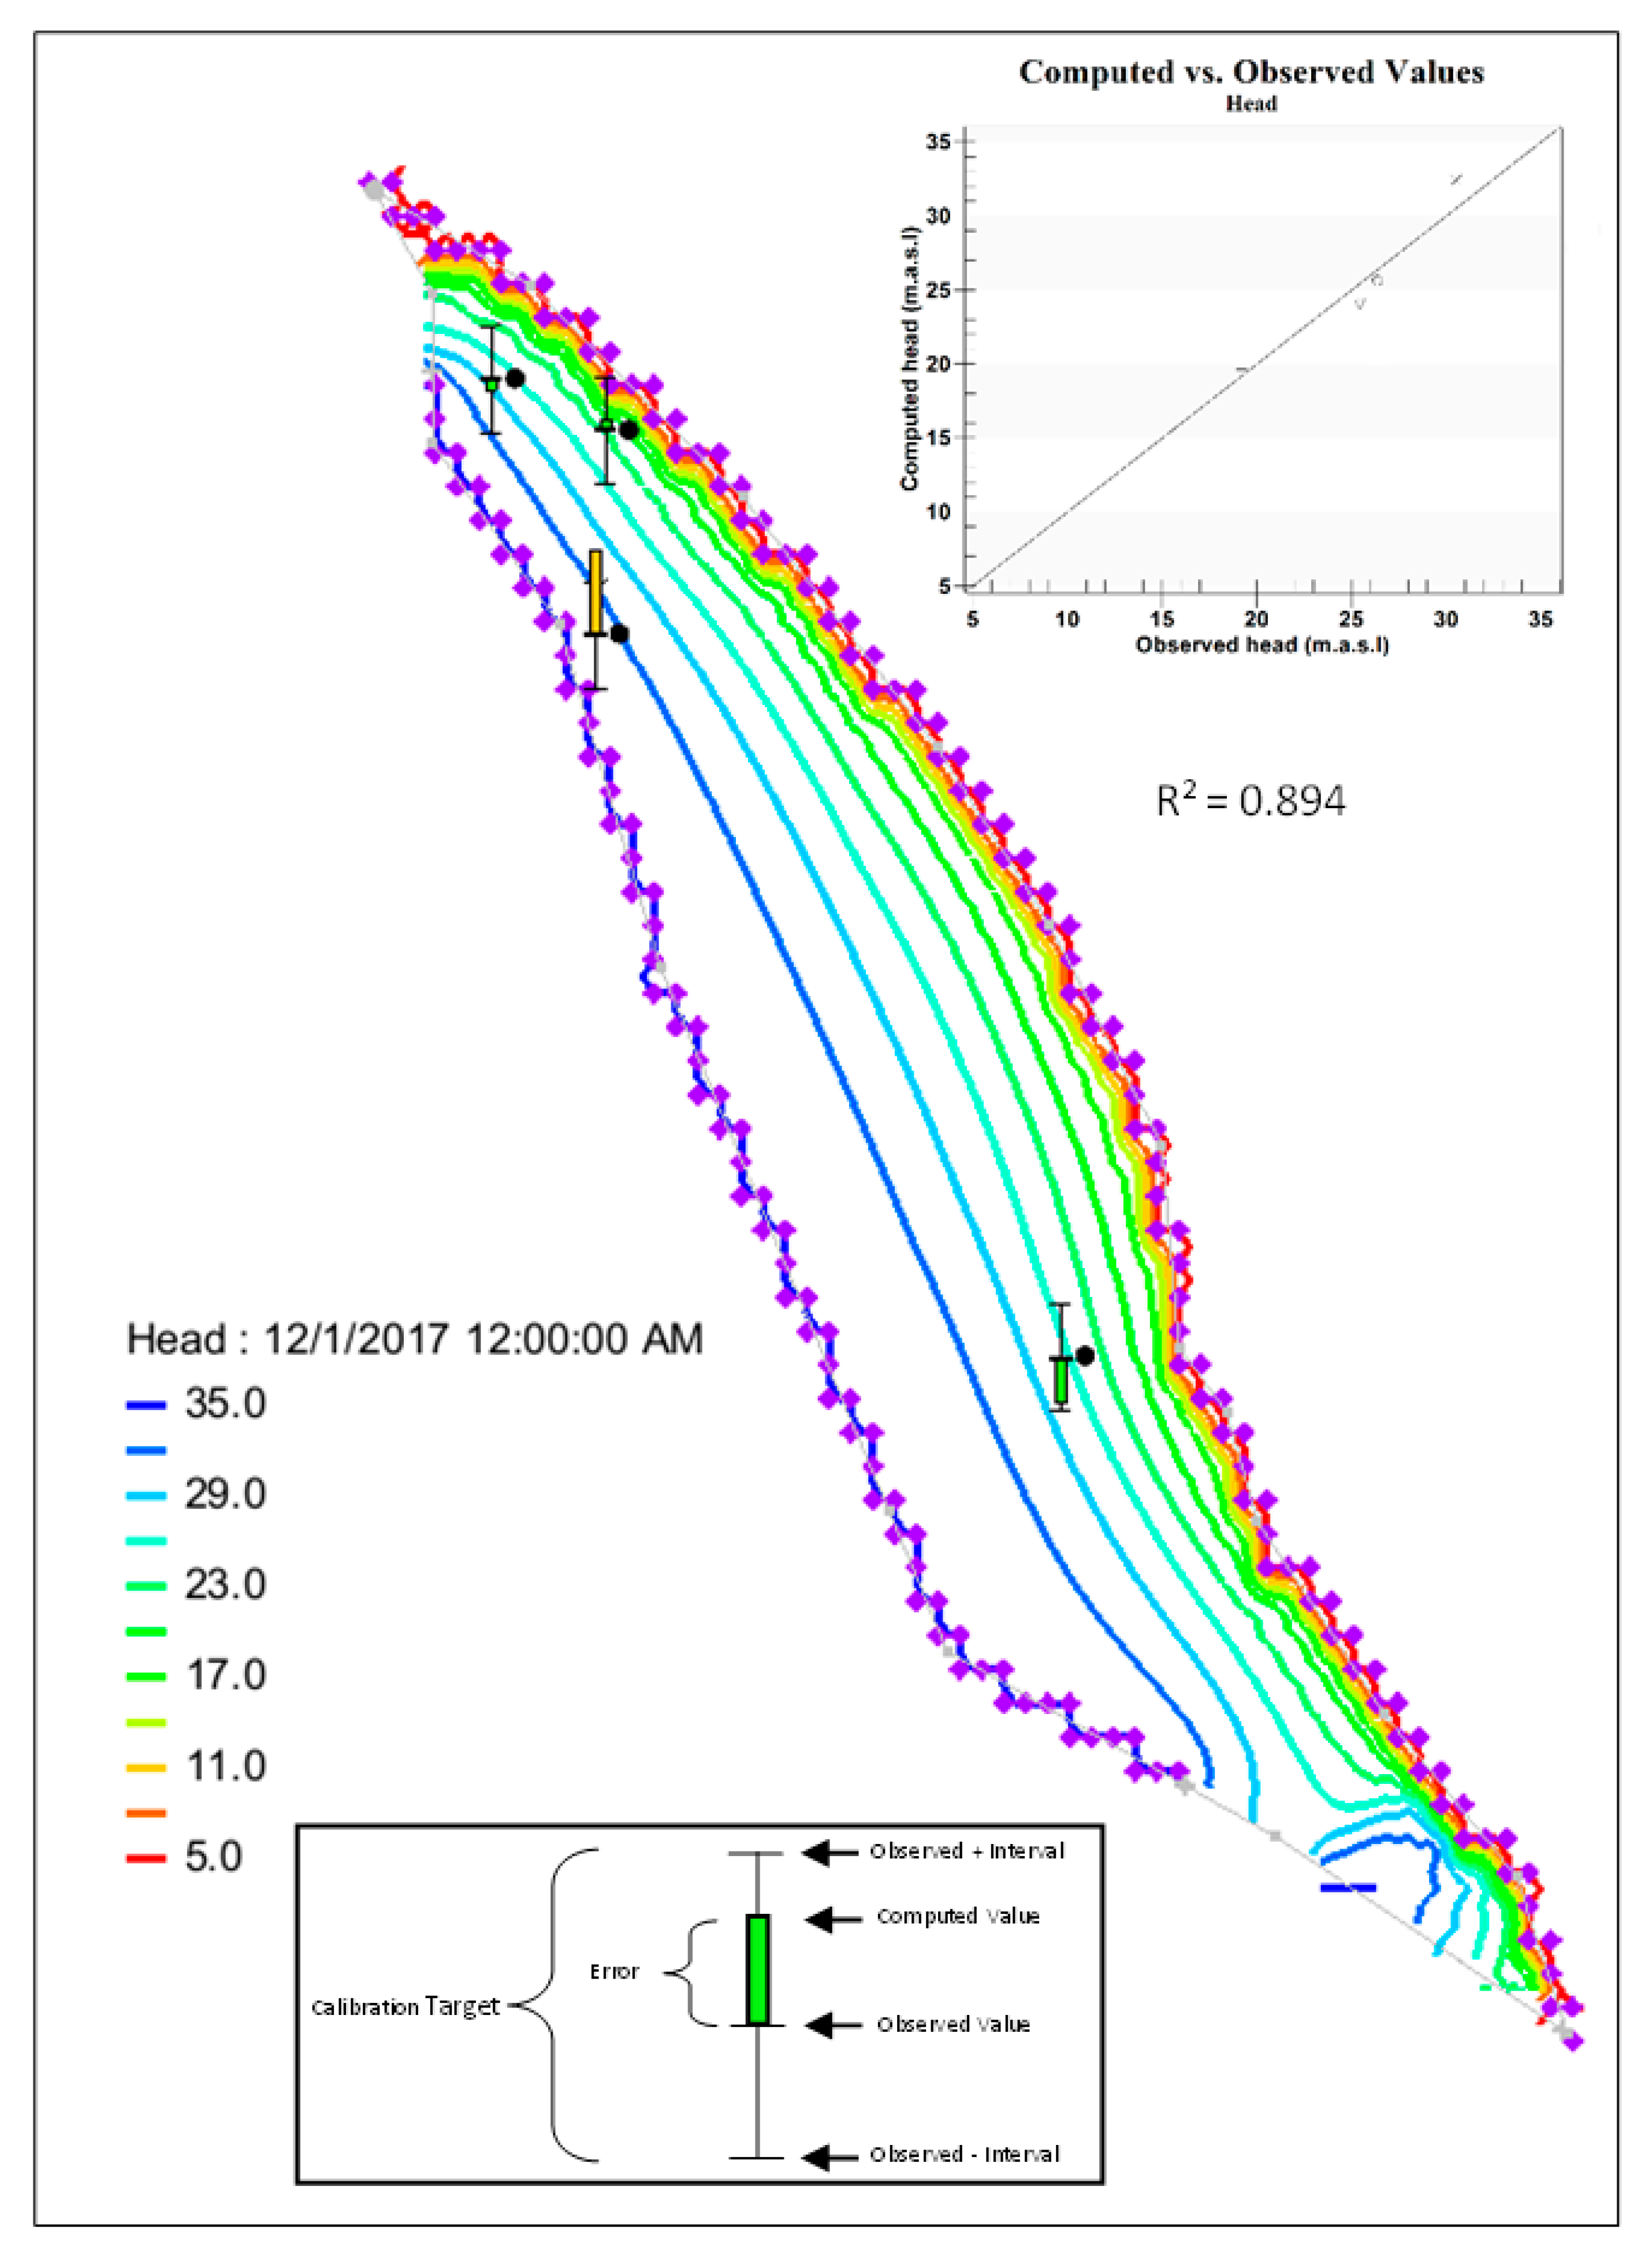
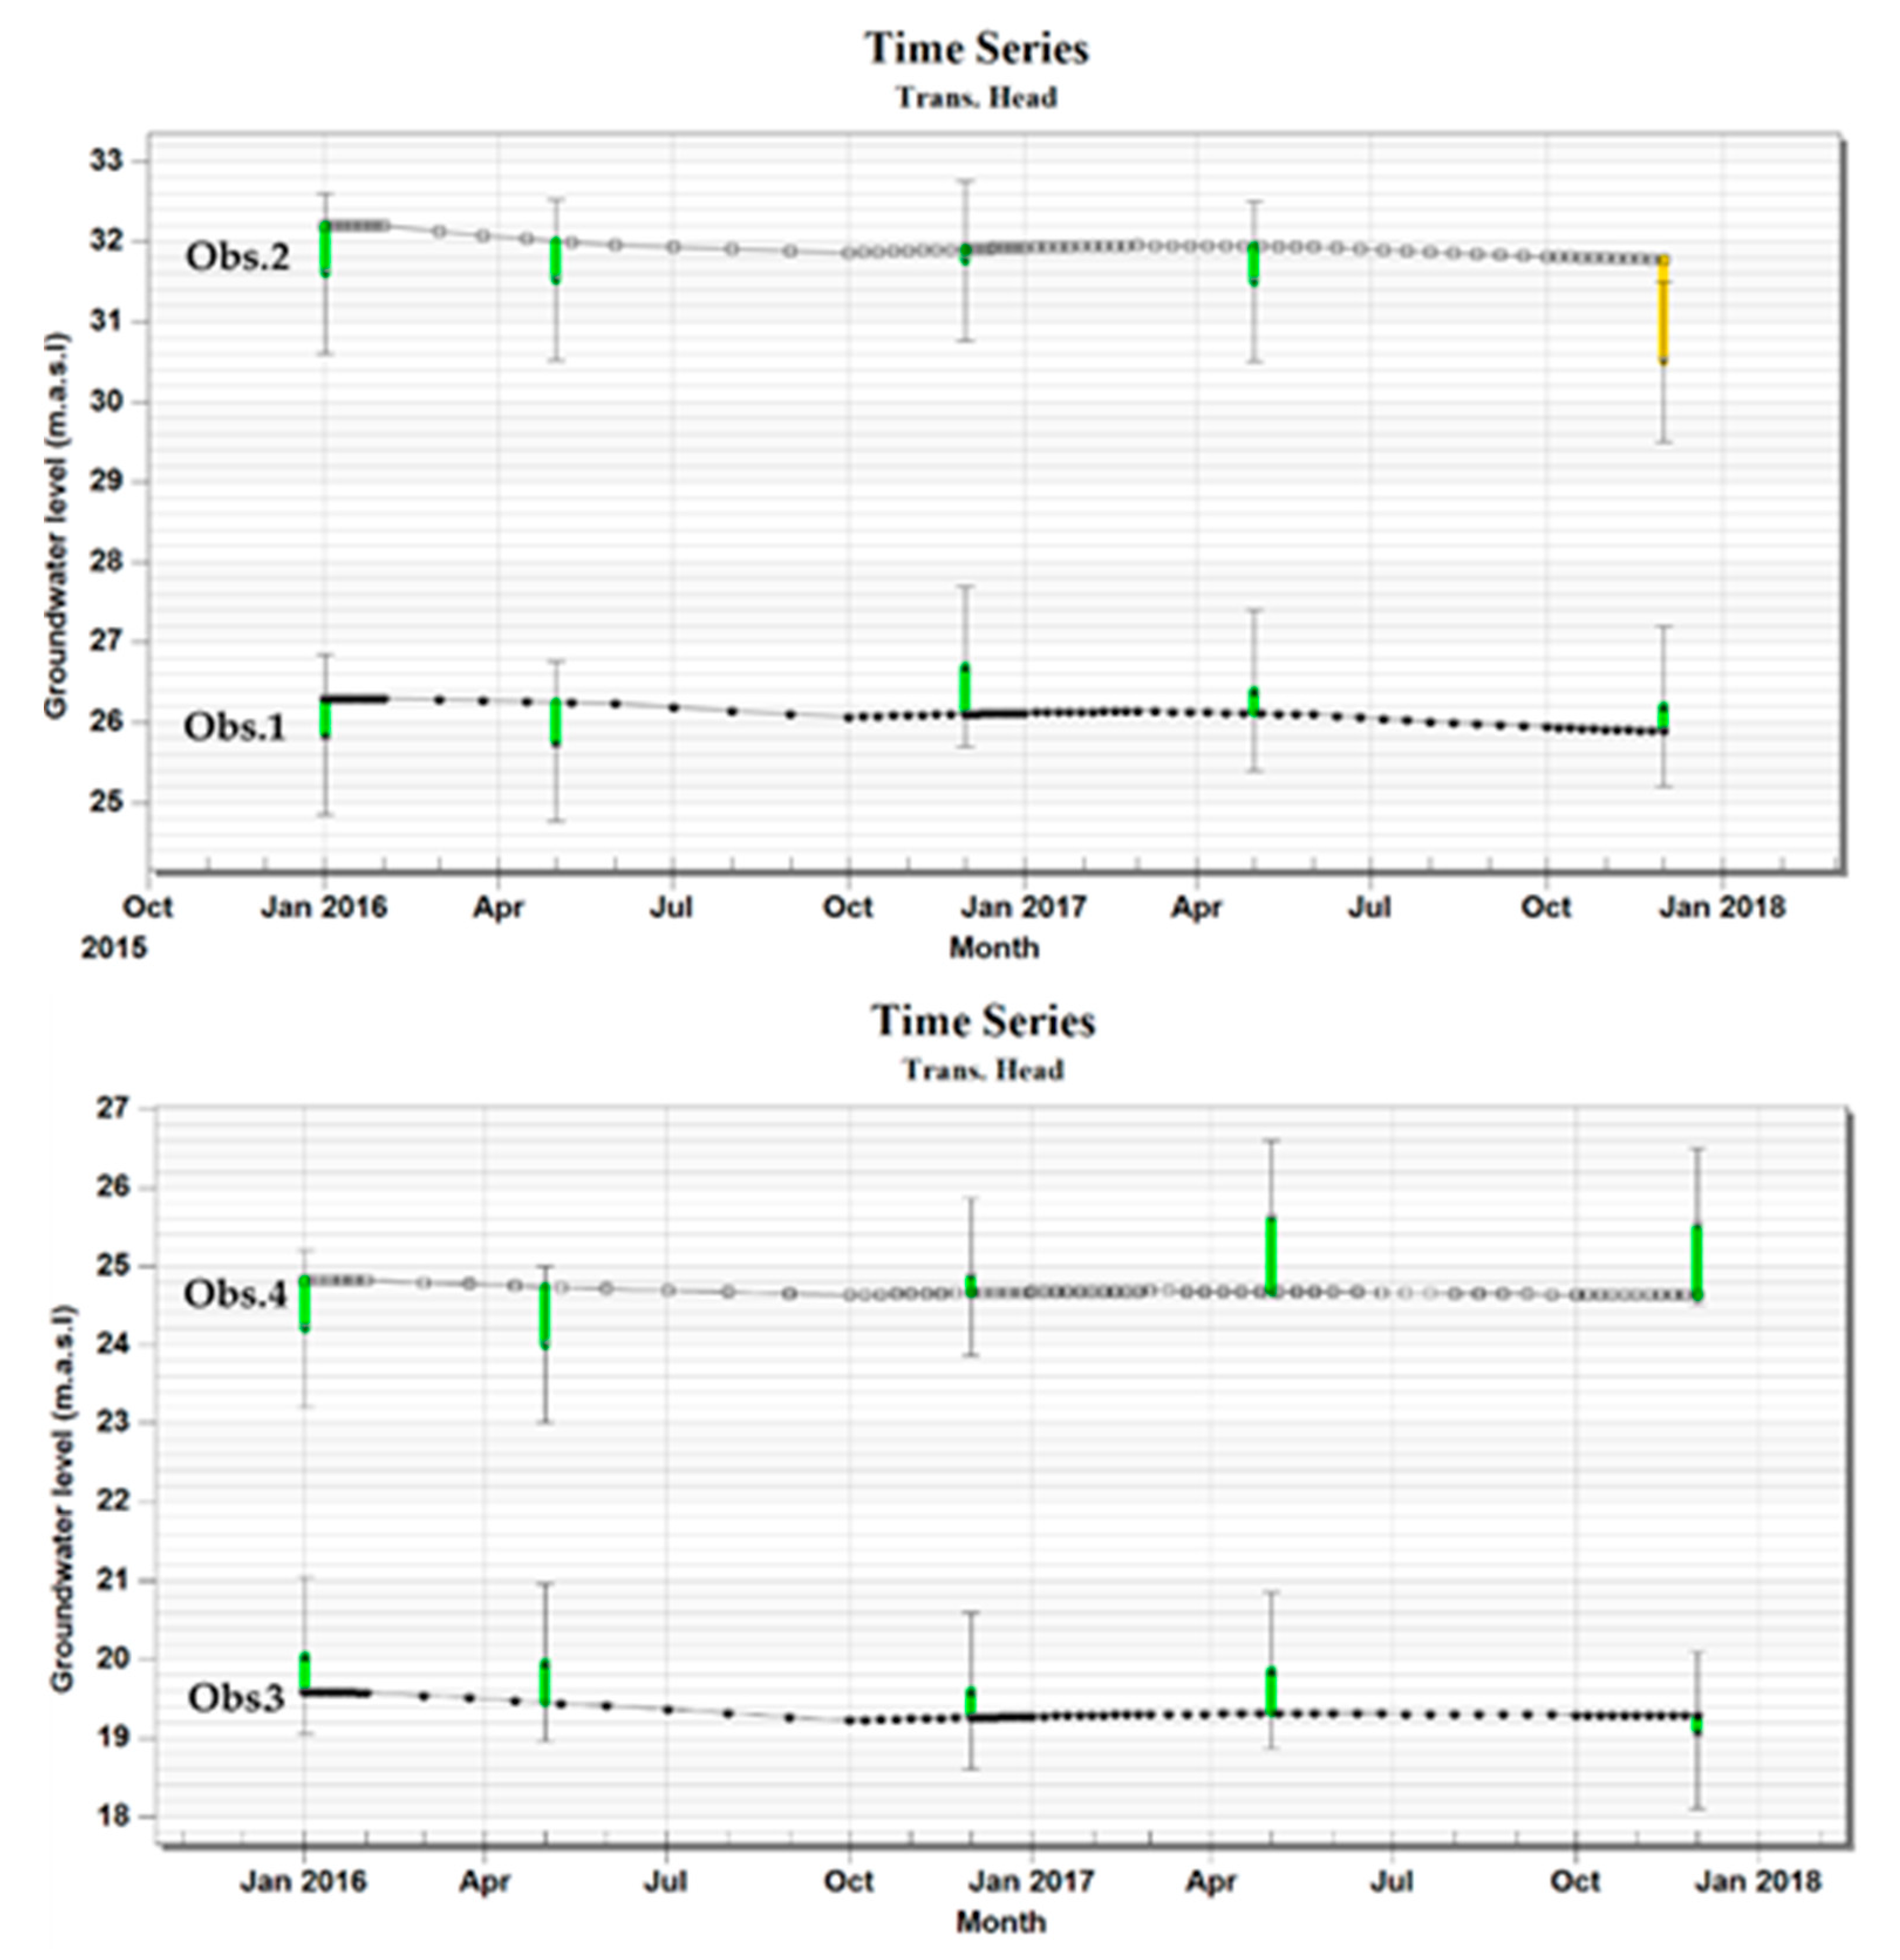
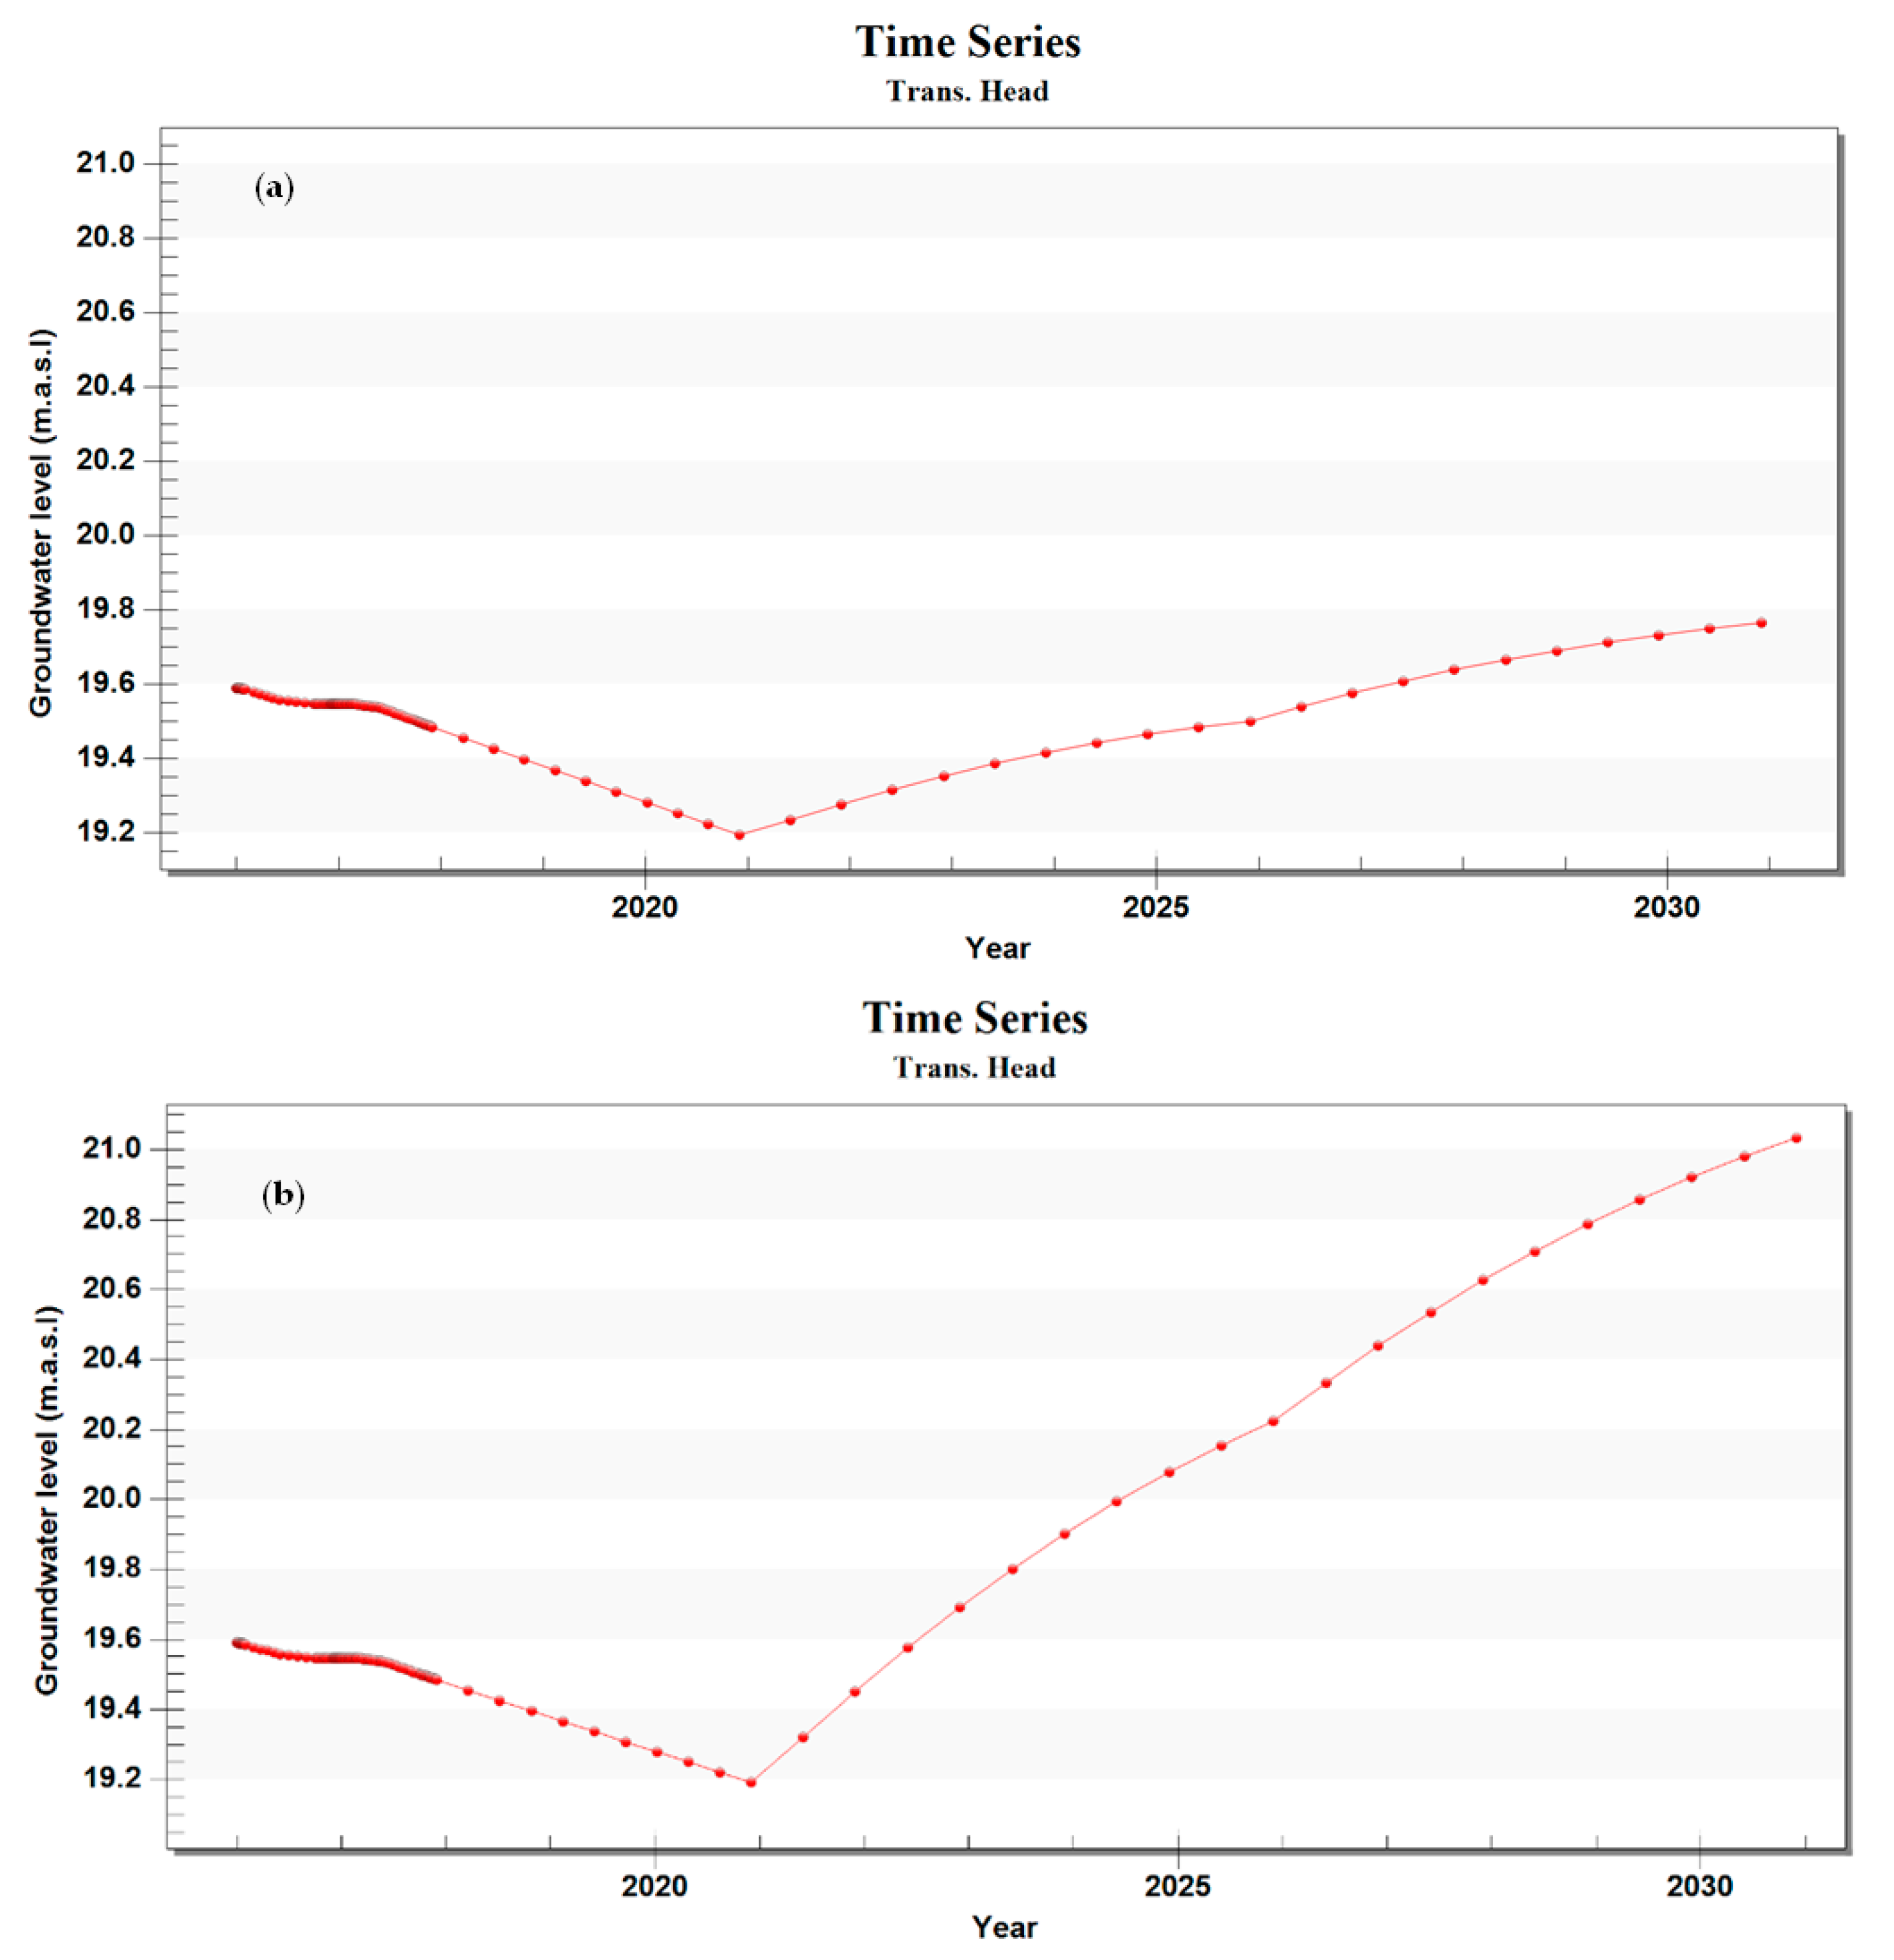
3.2. Transient Model Validation

In the case of transient conditions, groundwater levels are a function of time. Simulated steady-state aquifer levels were used as initial aquifer levels to simulate the transient state. Measuring groundwater levels was an important calibration objective of this operation. Moreover, the transient models determined preliminary predictions of the specific yield (Sy-values) of the Dibdibba unconfined aquifer. Values of Sy, computed from pumping tests in previous studies, ranged from 0.001 to 0.05 [33]. Constructing a transient mode ideally means managing large amounts of transient data from a diversity of sources, including water levels in observation wells as well as recharge and pumping well data. The values of pumping rates per month varied according to the requirements of the cultivations in the study area. The choice of a simulation time stage is a crucial part of designing a transient model because the determination of space and time strongly affects the numerical model results [34].
The transient calibration model had a starting date of 1 January 2016 and the end date was set to 1 December 2017, while the time period was divided into 23 time steps. Data used for the calibration and validation processes included the corresponding measured groundwater levels from 4 control wells (Figure 1). The locations of these wells approximately represented the region, especially the area near the Kerbala WWTP (Obs.1 to Obs.3) because the results of the study will focus on it. The corresponding variable was computed from the steady-state calibration model. The relevant discharge rates were estimated from the realistic consumption in the study region.
In the process of calibrating the transient state, specific yield values were selected to be the variable parameter within the PEST operation; this changed automatically until a good match between the observed and calculated groundwater levels from January 2016 to December 2017 was achieved (Figure 7). Of the 4 calibration targets represented in the model, only one bar was yellow and 3 were green. A transient scatter plot of observed versus simulated groundwater levels was used to investigate the transient numerical model. The results are shown in Figure 6. The scatter plot shows a coefficient of determination R2 = 0.894 at the end of simulation in 1 December 2017. As expected, the congruence in the transition state is less than the congruence in the steady state, where the determinant coefficient (R2) was less than the value obtained in the steady state. The simulation model of groundwater flow was validated for the period from January 2016 to December 2017. It reproduced close groundwater level variation for different previous monitoring readings as displayed in Figure 8. A comparison between the measured and the computed variations in groundwater levels in the monitoring wells is presented in Figure 8. The excellent performance of the simulation was shown by the transient simulation of the concordance between the modeled and measured groundwater levels in the observation wells. All the figures show a declining trend in elevation during the monitoring periods. According to these evaluations, the model was well calibrated. It is clear from Figure 8 that, for observation well No.2 (Obs.2), the simulation model results always overestimated observed groundwater levels during the validation period but within an acceptable range (green color bar). However, for the other observed wells, the estimated values both over- and underestimate the values for different monitoring times. These behaviors may be due to the different estimation ranges for the hydraulic parameters of the aquifer in addition to the effect of the well’s distance from the boundaries of the study area.

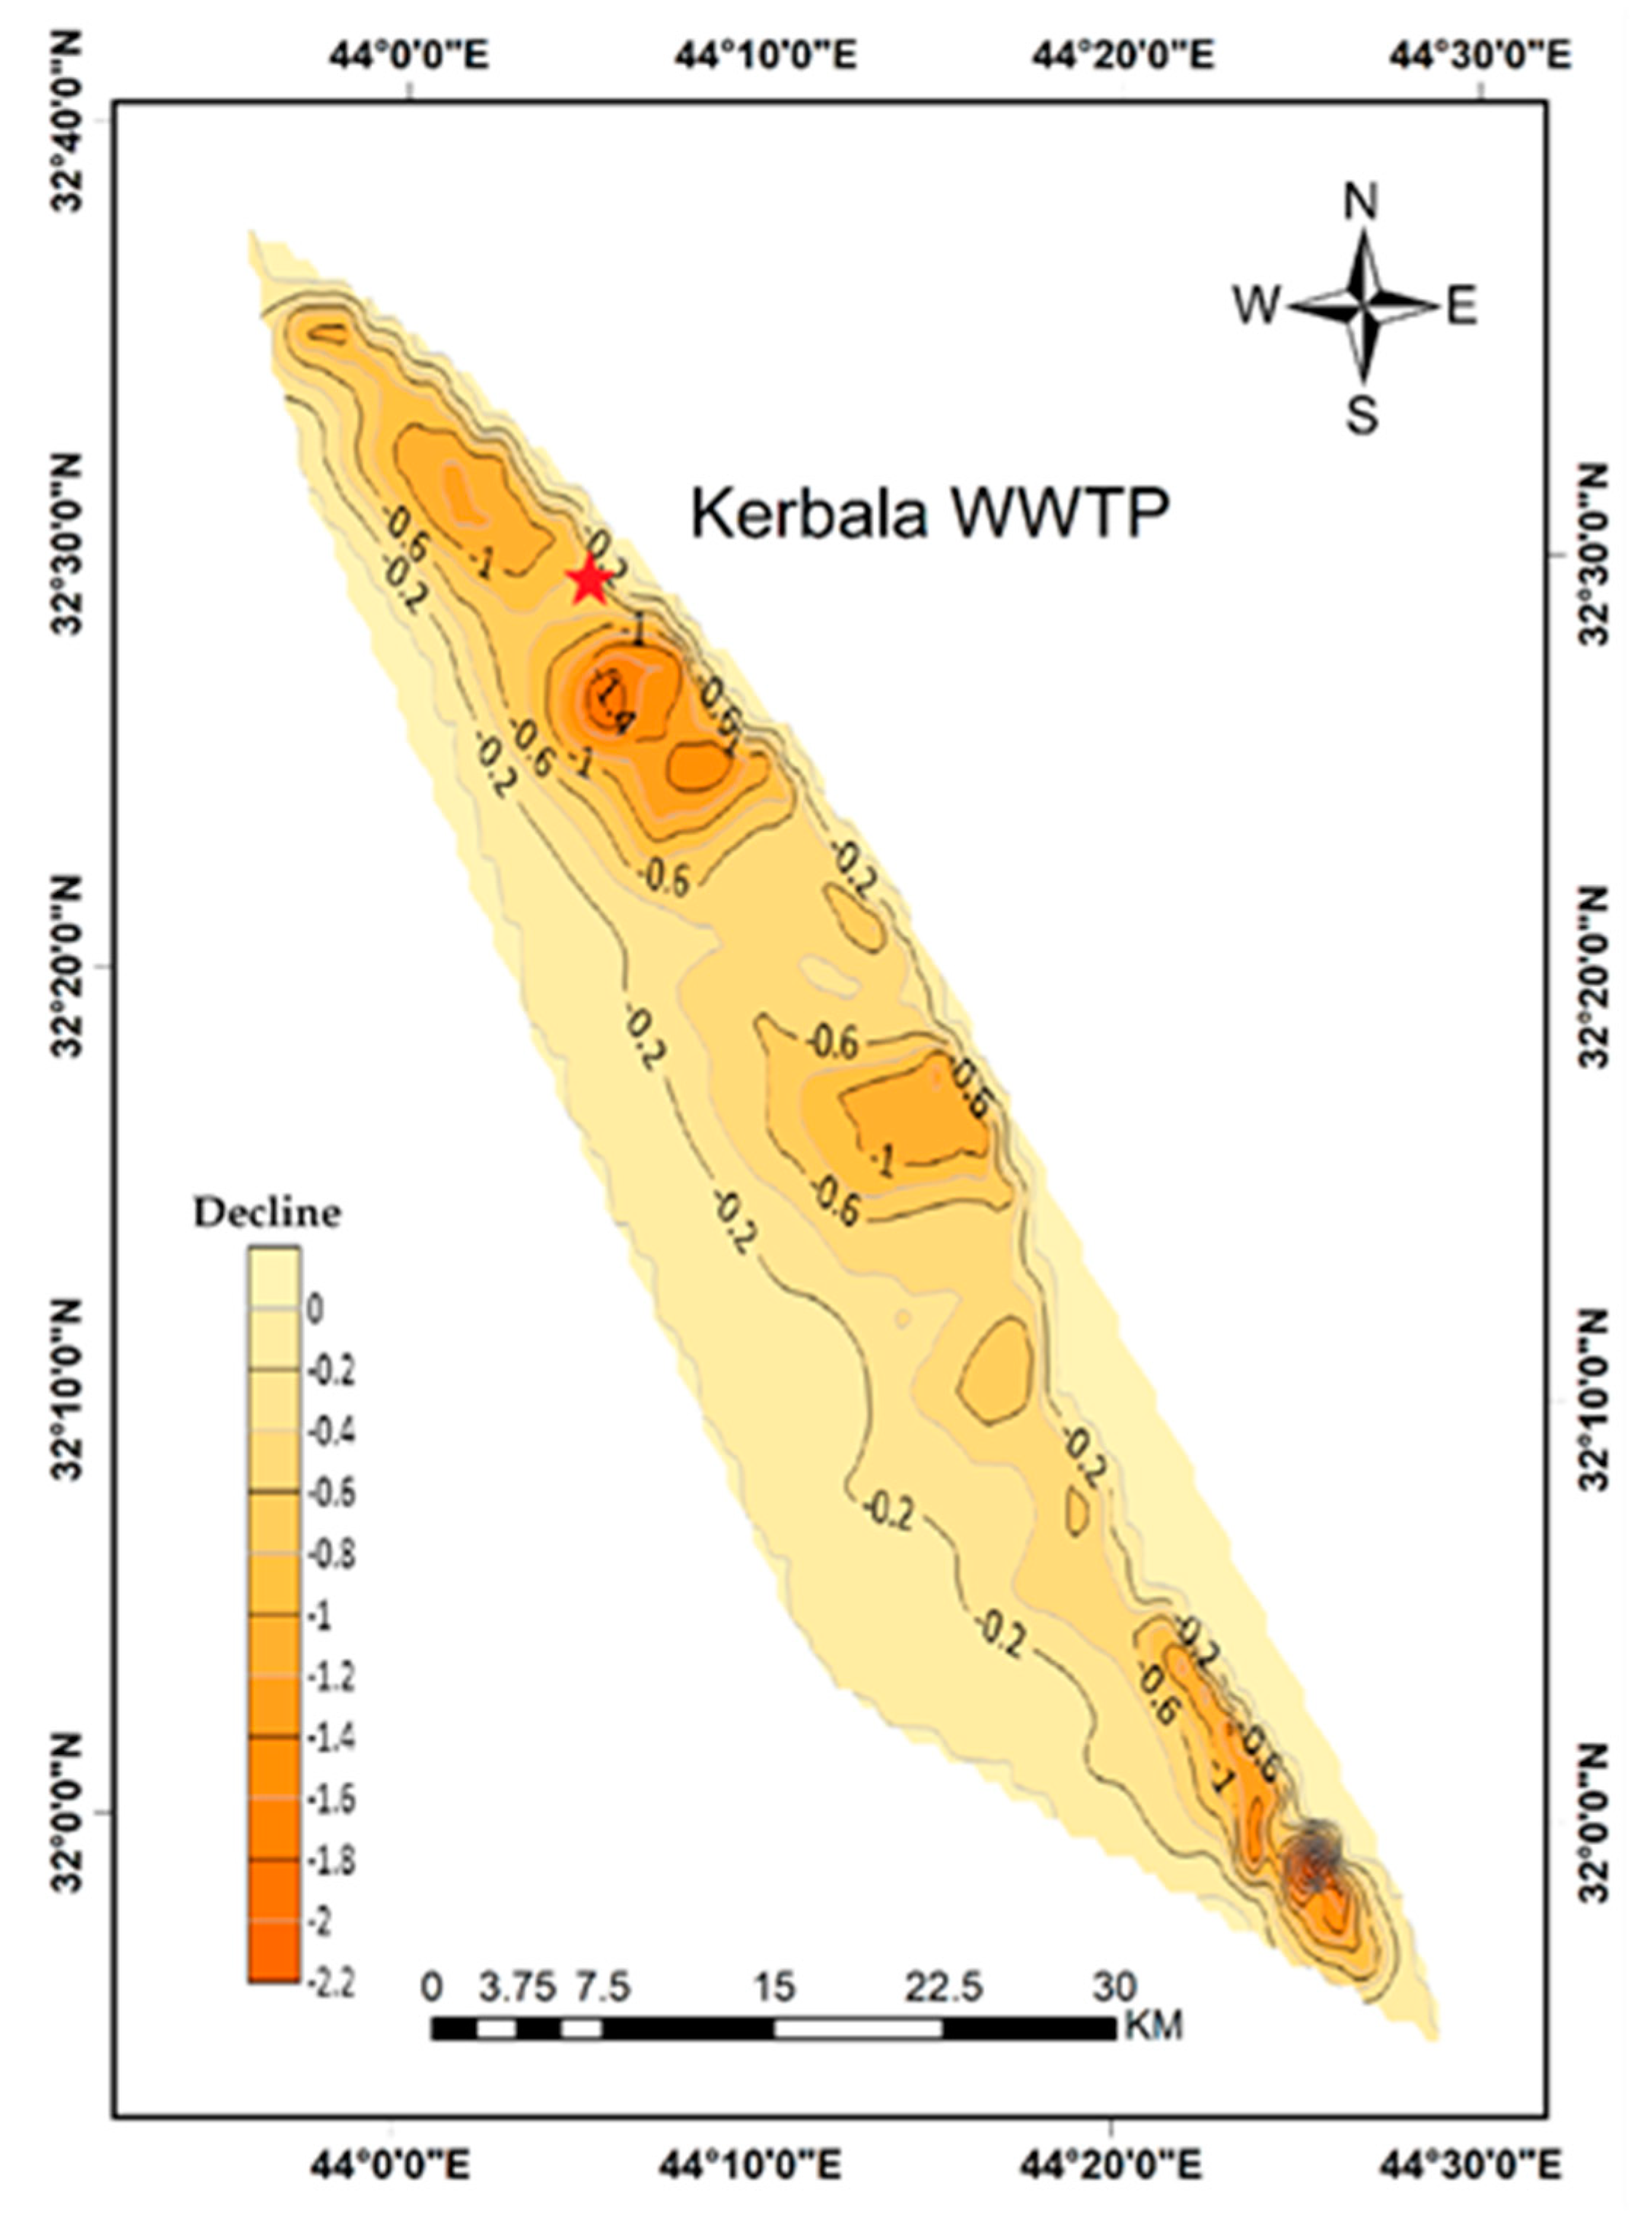
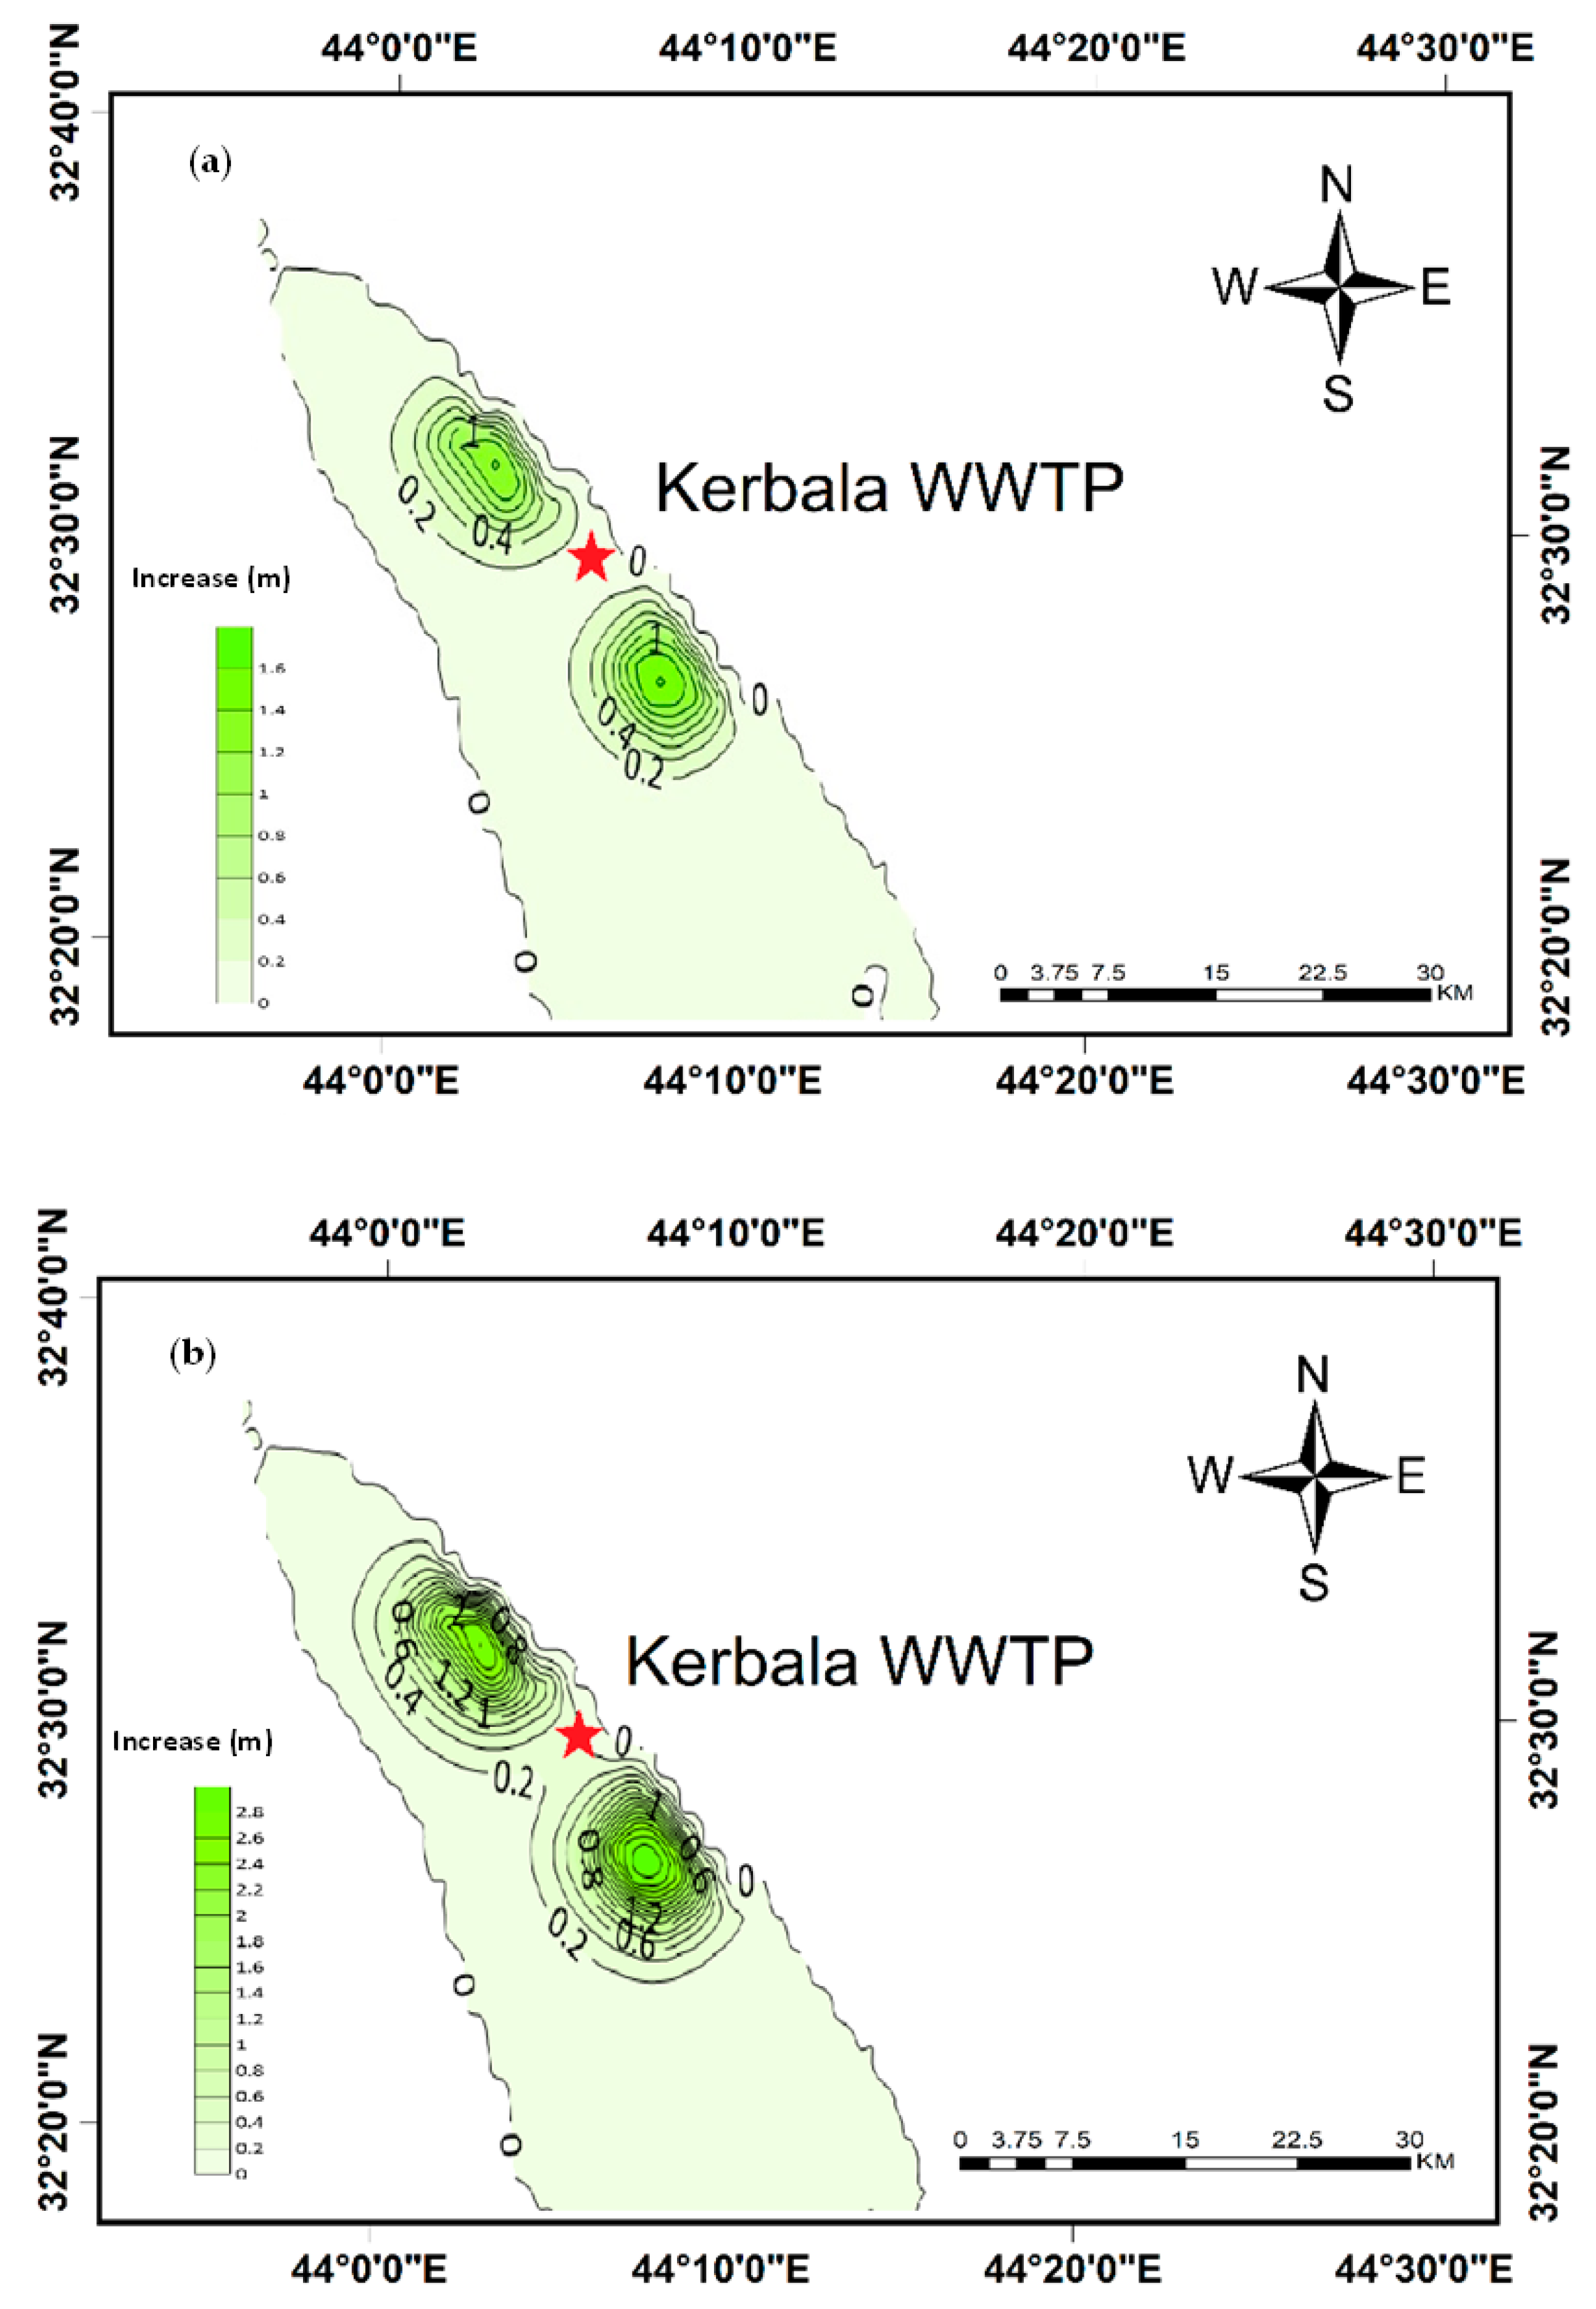
3.3. Evaluation of Artificial Recharge

The calibrated models were used to estimate the influence of the suggested artificial recharge by wells on the elevation of groundwater, focusing on the region surrounding the Kerbala WWTP. Different scenarios were applied, which considered the natural and artificial recharge and the rate of groundwater withdrawal by pumps between 2016 and 2030. This was done with two simulation models (MOD1 and MOD2) that performed calculations over the prediction time interval (2016–2030). In MOD1, the same boundary conditions were maintained during the entire simulation period, assuming the continuity of the present extraction and natural recharge rates of 2016 and the exclusion of the artificial recharge rate from the WWTP. Based on this scenario, the simulated groundwater levels would be more than 2 m lower at the Kerbala WWTP by the year 2030 (Figure 9). Therefore, this site is considered to be one of the best sites to establish artificial recharge wells due to its proximity to the treatment plant and the severe impact from withdrawal operations in this area as well as the lack of natural recharge. These results of the expected decline in groundwater levels have a sensitivity of assumptions made about the extraction values calculated by Equation (1) (11,000 m3/day), which depend on some other assumptions due to a lack of observation data.
In MOD2, the same boundary conditions as in MOD1 were applied with the addition of a recharge flow of 5000 m3/day injected into 20 selected recharge wells. These recharge wells were regularly distributed over the area near the treatment plant for economic and operational reasons. The comparison of the simulated groundwater elevation for 2030 based on MOD1 and MOD2 illustrated that an increase of close to 1.6 m (maximum) could be achieved with an artificial recharge pumping rate of 5000 m3/day (Figure 10a). Considering the minimum change of 0.2 m, the affected area around the WWTP site under recharge conditions would be about 91.6 km2, divided into two pools, one located on the left side of the Kerbala WWTP with an area of 45.4 km2 and the other located on the right side with an area of 45.2 km2, as shown in Figure 10a. It would spread over 18.5 km along the river and include a 36 km2 recovery area with a groundwater level increase of more than 0.5 m from MOD1.
An additional scenario, MOD3, was considered, in which 10% of the WWTP outflow (10,000 m3/day) was used as an artificial recharge rate for the aquifer groundwater table. As a consequence of this increase, a higher impact was obtained on the groundwater level (Figure 10b). The positively influenced area (0.2 m) increased to 136.8 km2 and the maximum increase in groundwater levels reached 2.8 m. The affected area extended 23 km along the river, including an 81 km2 recovery area and a rise of at least 0.5 m in the groundwater level.
Results relative to the observation well (Obs.3) located near the artificial recharge site as shown in Figure 1 were used to compare the temporal development of the groundwater level. Figure 11a illustrates that the artificial recharge would increase the groundwater level, especially near observation well No.3 (Obs.3). However, this effect diminished farther away from the recharge wells. A groundwater level increase occurred during the next decade of the modeling with an annual increase of 7 cm and 20 cm for 5000 and 10,000 m3/day recharge pumping rates, respectively, as shown in Figure 10a,b. It is clear from Figure 11 that there is a difference in the rate of increase due to the difference in the pumping rates of the recharge wells between the two scenarios. There is also a clear increase in the tendency of the expected rise in the groundwater level after 2026 for both scenarios. This may be due to the expected increase in the permeability of the soil surrounding the pumping well due to continuous pumping during the period before 2026.
At the end period of the simulation, the maximum expected groundwater level of the Obs.3 well will be close to 19.78 m.a.s.l. for the second scenario, while it could reach 21.1 m.a.s.l. for the third scenario. Consequently, the groundwater level in the area near the KWWTP can be increased to more than 1.3 m as a result of doubling the pumping rates (3rd scenario) during the next eight years. It is important to note that the models were calibrated based on the regional interpolation parameters due to the availability of data, while the effect of artificial recharge was evident in a specific area near the treatment plant where the sites of the proposed pumping wells (for economic requirements) were located. Therefore, these factors may cause predictive uncertainty in the expected results. As in many previous studies [5,6,8], the effect of hydrogeological properties was very significant in the rates of change of groundwater levels as a result of artificial recharge.
The estimation of water demand in the study area depends fundamentally on two significant factors. The first one is the climate status, which involves rainfall, temperature, sunshine duration, wind speed, and humidity. The second factor is the type of cultivation, which determines the demand for irrigation water and reflects the plant’s modulus [35]. According to the Ministry of Agriculture and Ministry of Water Resources (Iraq), the maximum irrigation water demand for a proposed crop plan has been determined to be equal to 3 m3/donum/day, (one donum = 2500 m2). Considering the simulation results for the next ten years, a new agricultural area could be added to the region, with an area of more than 5800 dunams (14.6 km2) if 5% of the treated water production from WWTP was used for the artificial recharge process. The additional areas could be increased to 25,000 dunums if 10% of the treated water production was used. This expected increase in cultivated land will be very useful in facing the phenomenon of desertification, global warming, and improving the environment in the study area.

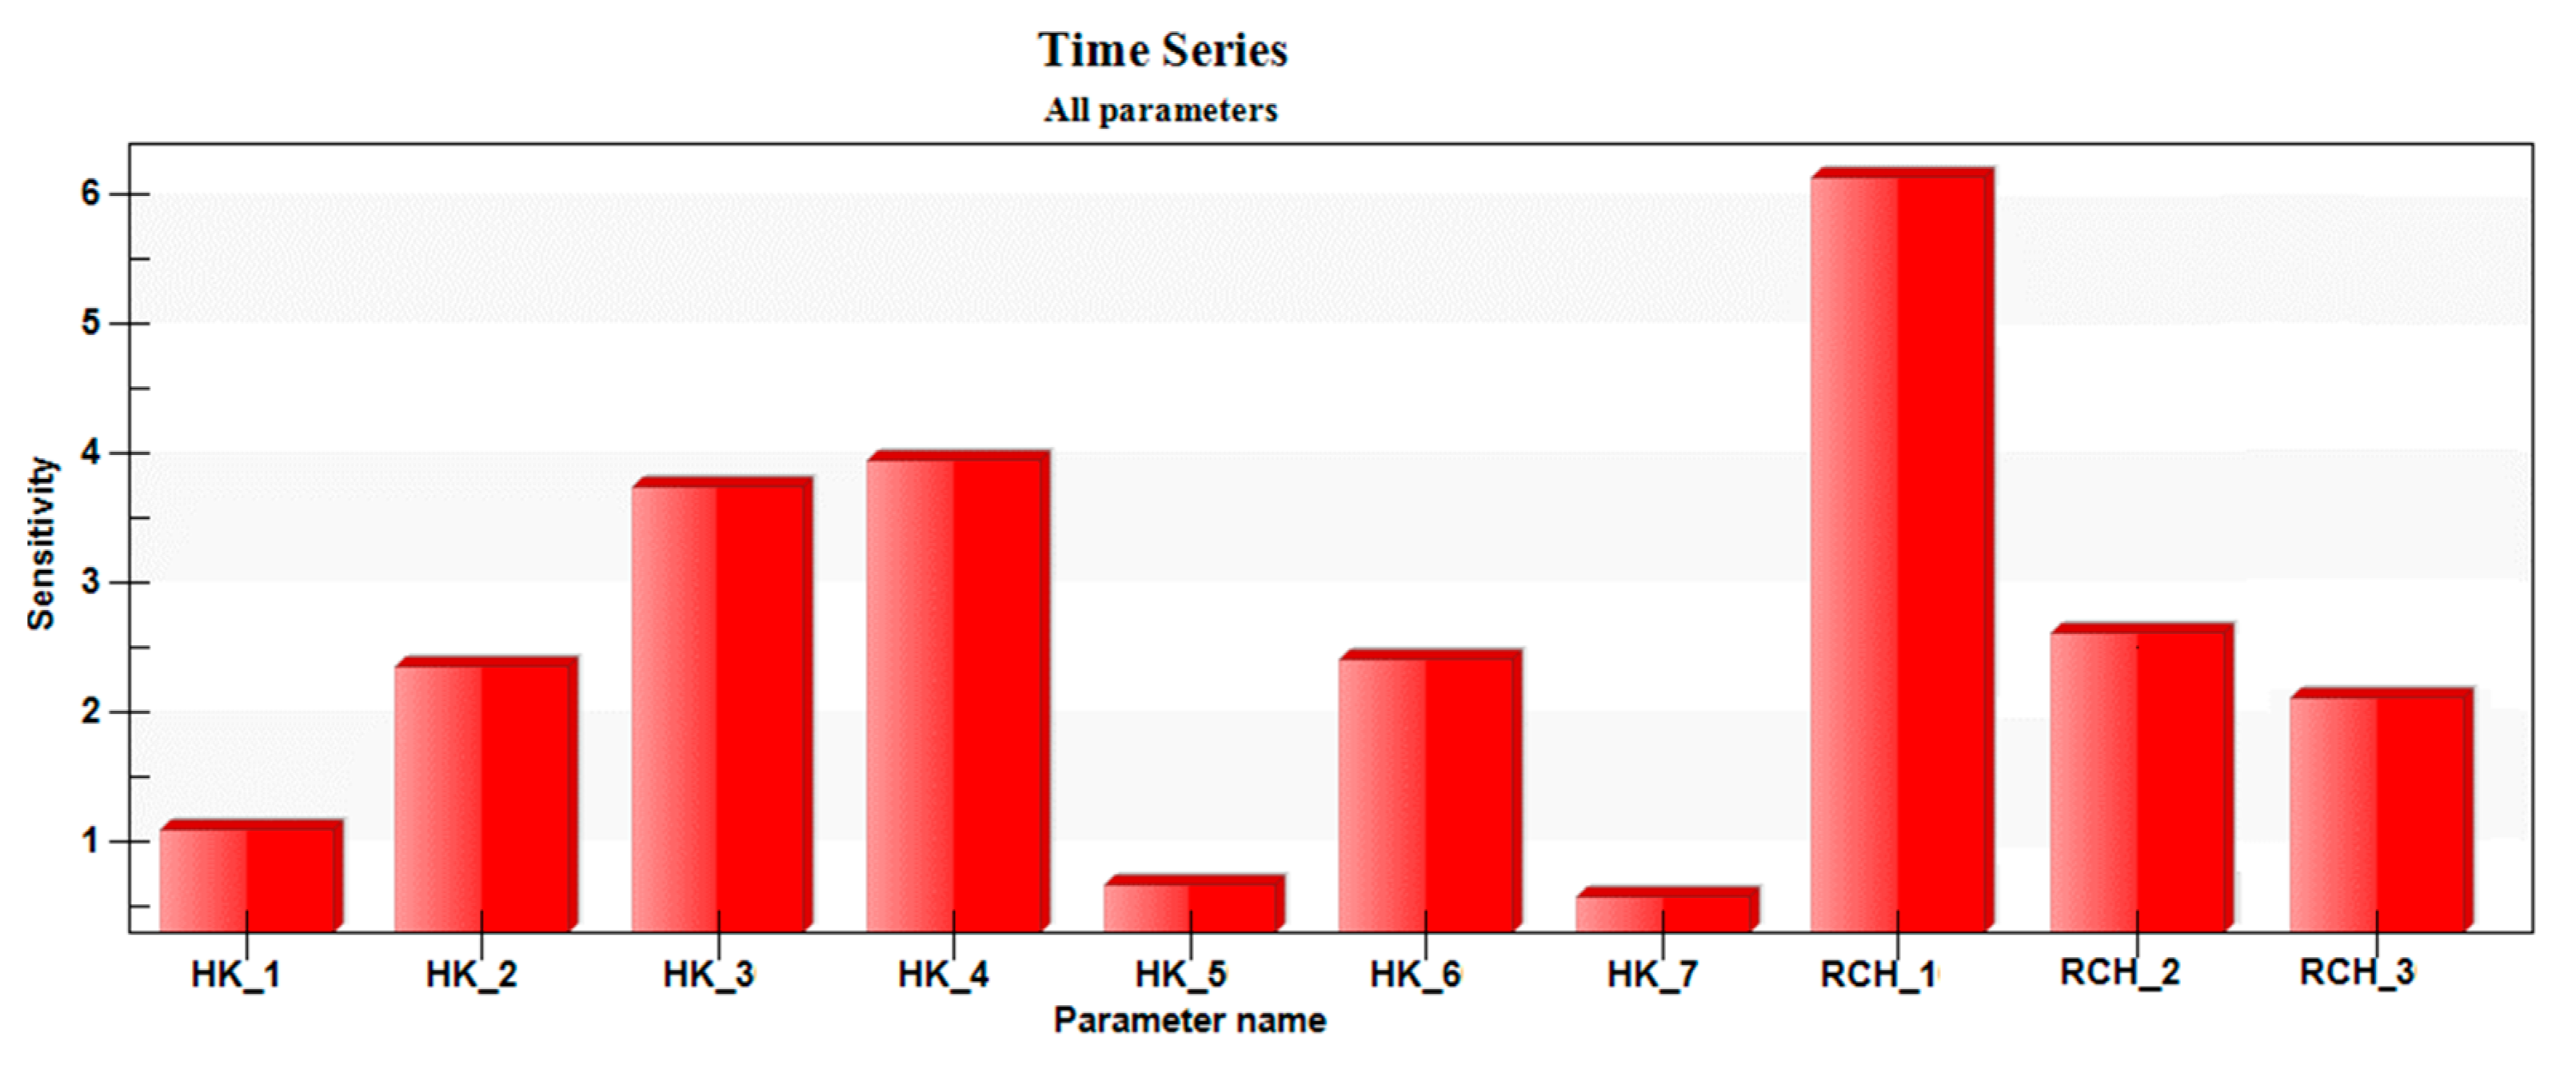
3.4. Sensitivity Analysis

Sensitivity analysis is a measure of uncertainty in the calibrated model caused by uncertainty in the aquifer parameters and boundary conditions. The main objective of the sensitivity analysis is to understand the influence of various model parameters and hydrogeological stresses on the aquifer system and to identify the most sensitive parameter(s) that will need spatial attention in the future studies. Sensitivity analysis was performed at the end of PEST iterations of each of the parameters used. For steady state, the hydraulic conductivity and natural recharge values for each zone within the study area (Figure 4) were examined as illustrated in Figure 12. It is clear to note that the steady-state model is sensitive to both recharge and hydraulic conductivity to a different degree. The model is highly sensitive to changes in natural recharge compared to its sensitivity to changes in hydraulic conductivity. The natural recharge of the largest zone (RECH-1) has the most significant impact in terms of predicting groundwater levels compared to other input parameters. The hydraulic conductivity parameters for regions 1, 5, and 7 had the least influence on the simulation model results. This behavior may be due to the large area represented by this parameter (RECH-1) relative to the other areas of parameters. The relatively small areas (HK-1, HK-2, HK-6, HK-7, and RECH-3) were the least sensitive compared to the other areas. It can therefore be noted that the spatial variability of parameters could influence predictions for steady-state calibration. However, the transient model shows sensitivity due to the increase and decrease in the specific yield but with a slow response. This analysis is useful in identifying the parameters that have the greatest impact on the model as well as the parameters that have the least impact on the model. Thus, non-sensitive parameters can be kept constant or removed in future studies, while it is necessary to give attention to the parameters that have a high sensitivity in the simulation model.

4. Conclusions

One of the main issues concerning the evolution of groundwater resource management and its sustainability is the efficient storage and control of its recharge and consumption rates. Artificial recharge is considered to be one of the most important tools that can help the sustainability of groundwater aquifers. In this study, a percentage of treated water (tertiary treatment) from the wastewater treatment plant (WWTP) in Kerbala was utilized to investigate the impact of artificial recharge on the groundwater levels in the Dibdibba unconfined aquifer. A three-dimensional numerical model was applied to simulate the flow system of the unconfined aquifer using MODFLOW with GMS 10.4. The developed models were calibrated automatically using the PEST tool. The modeled groundwater levels matched the observed groundwater levels for steady-state and transient simulations for the period 2016–2017.
The calibrated models were used to simulate three different scenarios. One scenario included applying natural conditions without artificial recharge and two scenarios included artificial recharge through wells (5000 and 10,000 m3/day) to show the response of the aquifer for the future period 2022–2030. The results of the simulations illustrated that during the study period, the artificial recharge of wells with a pumping rate of 5000 and 10,000 m3/day distributed over 20 injection wells would induce an annual increase of 7 cm and 20 cm in groundwater levels, respectively. This increase would lead to recovery of groundwater levels of up to 36 and 81 km2 around the recharge site for the 2nd and 3rd scenarios, respectively, and extend about 20 km along the river. Moreover, it was shown that the application of an artificial recharge project would reduce groundwater decline during long-term periods. In the first simulation using the artificial recharge scenario MOD2, the total increase in water storage volume was 6.4 × 10⁶ m3/year with a minimum increase in groundwater level of 0.2 m at the end of the simulation period in 2030. This means that the pumping rates could be raised to reclaim more than 14.6 km2 of the new agricultural area. In the second artificial recharge scenario MOD3, the new area of reclaimed agricultural land could be increased by more than 62 km2. These reclaimed areas could represent a significant addition to important agricultural production areas since the reclaimed areas consist of sandy soils that are suitable for cultivating multiple types of plants.

Author Contributions

Conceptualization, W.H.H., B.K.N. and K.M.; methodology, W.H.H., B.K.N., J.W. and C.R.; software, W.H.H. and J.W.; validation, B.K.N., K.M., J.W. and C.R.; formal analysis, W.H.H.; investigation, K.M., J.W. and C.R.; resources, W.H.H. and B.K.N.; data curation, W.H.H. and B.K.N.; writing—original draft preparation, W.H.H.; writing—review and editing, B.K.N., K.M., J.W. and C.R.; visualization, W.H.H.; supervision, W.H.H., B.K.N., K.M., J.W. and C.R.; project administration, B.K.N. and K.M.; funding acquisition, K.M. All authors have read and agreed to the published version of the manuscript.

Funding

This Research is fully funded by NUFFIC Orange Knowledge Program OKP-IRA-104278.

Data Availability Statement

All data are contained within the article.

Acknowledgments

This study has been funded by Nuffic, the Orange Knowledge Programme, through the OKP-IRA-104278 project titled “Efficient water management in Iraq switching to climate smart agriculture: capacity building and knowledge development” coordinated by Wageningen University & Research, The Netherlands.

Conflicts of Interest

The authors declare no conflict of interest.

References

  1. Shahid, S.; Alamgir, M.; Wang, X.J.; Eslamian, S. Climate change impacts on and adaptation to groundwater. In Handbook of Drought and Water Scarcity; CRC Press: Boca Raton, FL, USA, 2017; pp. 107–124. [Google Scholar]
  2. Hassan, W.H.; Nile, B.K. Climate change and predicting future temperature in Iraq using CanESM2 and HadCM3 modeling. Modeling Earth Syst. Environ. 2021, 7, 737–748. [Google Scholar] [CrossRef]
  3. Green, T.R. Linking climate change and groundwater. In Integrated Groundwater Management; Springer: Cham, Switzerland, 2016; pp. 97–141. [Google Scholar]
  4. Hassan, W.H. Climate change impact on groundwater recharge of Umm er Radhuma unconfined aquifer Western Desert, Iraq. Int. J. Hydrol. Sci. Technol. 2020, 10, 392–412. [Google Scholar] [CrossRef]
  5. Horriche, F.J.; Benabdallah, S. Assessing Aquifer Water Level and Salinity for a Managed Artificial Recharge Site Using Reclaimed Water. Water 2020, 12, 341. [Google Scholar] [CrossRef] [Green Version]
  6. Abraham, M.; Mathew, R.A.; Jayapriya, J. Numerical Modeling as an Effective tool for Artificial Groundwater Recharge Assessment. J. Phys. Conf. Ser. 2021, 1770, 012097. [Google Scholar] [CrossRef]
  7. Chitsazan, M.; Movahedian, A. Evaluation of artificial recharge on groundwater using MODFLOW model (case study: Gotvand Plain-Iran). J. Geosci. Environ. Prot. 2015, 3, 122. [Google Scholar] [CrossRef] [Green Version]
  8. Gale, I.; Neumann, I.; Calow, R.; Moench, D.M. The Effectiveness of Artificial Recharge of Groundwater: A Review; Institute of Social and Environmental Transition: Katmandu, Nepal, 2002. [Google Scholar]
  9. Bouwer, H. Artificial recharge of groundwater: Hydrogeology and engineering. Hydrogeol. J. 2002, 10, 121–142. [Google Scholar] [CrossRef] [Green Version]
  10. Sheng, Z. An aquifer storage and recovery system with reclaimed wastewater to preserve native groundwater resources in El Paso, Texas. J. Environ. Manag. 2005, 75, 367–377. [Google Scholar] [CrossRef]
  11. Cazurra, T. Water reuse of south Barcelona’s wastewater reclamation plant. Desalination 2008, 218, 43–51. [Google Scholar] [CrossRef]
  12. Shammas, M.I. The effectiveness of artificial recharge in combating seawater intrusion in coastal aquifer Salalah, Oman. Environ. Earth Sci. 2008, 55, 191–204. [Google Scholar] [CrossRef]
  13. Tamer, A.; Al-Assa, D.F.; Ahmad, A. Artificial groundwater recharge to a semi-arid basin: Case study of Mujib aquifer, Jordan. Environ. Earth Sci. 2010, 60, 845–859. [Google Scholar]
  14. Salem, S.B.; Chkir, N.; Zouari, K.; Cognard-Plancq, A.L.; Valles, V.; Marc, V. Natural and artificial recharge investigation in the Zeroud Basin, Central Tunisia: Impact of Sidi Saad Dam storage. Environ. Earth Sci. 2012, 66, 1099–1110. [Google Scholar] [CrossRef]
  15. Ketata, M.; Gueddari, M.; Bouhlila, R. Hydrodynamic and salinity evolution of groundwater during artificial recharge within semi-arid coastal aquifers: A case study of El Khairat aquifer system in Enfidha (Tunisian Sahel). J. Afr. Earth Sci. 2014, 97, 224–229. [Google Scholar] [CrossRef]
  16. Bouri, S.; Ben Dhia, H. A thirty-year artificial recharge experiment in a coastal aquifer in an arid zone:The Teboulba aquifer system (Tunisian Sahel). Comptes Rendus Geosci. 2010, 342, 60–74. [Google Scholar] [CrossRef]
  17. Hassan, W.H. Climate change projections of maximum temperatures for southwest Iraq using statistical downscaling. Clim. Res. 2021, 83, 187–200. [Google Scholar] [CrossRef]
  18. Hassan, W.H.; Khalaf, R.M. Optimum Groundwater use Management Models by Genetic Algorithms in Karbala Desert, Iraq. IOP Conf. Ser. Mater. Sci. Eng. 2020, 928, 022141. [Google Scholar] [CrossRef]
  19. Al-Aboodi, A.H.; Ibrahim, H.T.; Ibrahim, N. Estimation of groundwater recharge in Safwan-Zubair area, South of Iraq, using water balance and inverse modeling methods. Int. J. Civ. Eng. Technol. 2019, 10, 202–210. [Google Scholar]
  20. Al-Mussawi, W.H. Kriging of groundwater level-a case study of Dibdiba Aquifer in area of Karballa-Najaf. J. Kerbala Univ. 2008, 6, 170–182. [Google Scholar]
  21. Nile, B.K. Effectiveness of Hydraulic and Hydrologic Parameters in Assessing Storm System Flooding. Adv. Civ. Eng. 2018, 2018, 4639172. [Google Scholar] [CrossRef]
  22. Chenini, I.; Ben Mamou, A. Groundwater Recharge Study in Arid Region. An Approach Using GIS Techniques and Numerical Modeling. Comput. Geosci. 2010, 36, 801–817. [Google Scholar] [CrossRef]
  23. Katibeh, H.; Hafezi, S. Application of MODFLOW Model and Management by Utilizing Groundwater and Evaluation of the Performance of Artificial Recharge of Ab Barik Plain in Bam. J. Water Wastewater 2004, 50, 45–58. [Google Scholar]
  24. Martinez-Santos, P.; Martinez-Alfaro, P.; Murillo, J.M. A method to estimate the artificial recharge capacity of the Crestatx aquifer (Majorca, Spain). Environ. Earth Sci. 2005, 47, 1155–1161. [Google Scholar] [CrossRef]
  25. Izbicki, J.A.; Flint, A.L.; Stamos, C.L. Artificial recharge through a thick, heterogeneous unsaturated zone. Ground Water 2008, 46, 475–488. [Google Scholar] [CrossRef]
  26. Vandenbohede, A.; Van Houte, E.; Lebbe, L. Groundwater flow in the vicinity of two artificial recharge ponds in the Belgian coastal dunes. Hydrogeol. J. 2008, 16, 1669–1681. [Google Scholar] [CrossRef]
  27. Zhang, H.; Xu, Y.; Kanyerere, T. Site Assessment for MAR through GIS and Modeling in West Coast, South Africa. Water 2019, 11, 1646. [Google Scholar] [CrossRef] [Green Version]
  28. General Commission of Groundwater. Advanced Survey of Hydrogeologic Resources in Iraq, Phase II (ASHRI-2); Ministry of Water Resources of Iraq: Bagdad, Iraq, 2018; Unpublish report. [Google Scholar]
  29. Al-Sudani, H.I.Z. Groundwater system of Dibdibba sandstone aquifer in south of Iraq. Appl. Water Sci. 2019, 9, 1–11. [Google Scholar] [CrossRef] [Green Version]
  30. Abdulameer, A.; Thabit, J.M.; Kanoua, W.; Wiche, O.; Merkel, B. Possible Sources of Salinity in the Upper Dibdibba Aquifer, Basrah, Iraq. Water 2021, 13, 578. [Google Scholar] [CrossRef]
  31. Al-Jiburi, H.J.; Al-Basrawi, N.H.; Ibrahim, S.A.R. Hydrogeological and Hydrochemical Study of Karbala Quadrangle (NI-38-14), Scale 1: 250000.; GEOSURV: Sydney, Australia, 2002. [Google Scholar]
  32. Hassan, W.H. Application of a genetic algorithm for the optimization of a location and inclination angle of a cut-off wall for anisotropic foundations under hydraulic structures. Geotech. Geol. Eng. 2019, 37, 883–895. [Google Scholar] [CrossRef]
  33. Al-Ghanimy, M.A. Assessment of Hydrogeological Condition in Karbala—Najaf Plateau, Iraq. Ph.D. Thesis, (unpublished). University of Baghdad, Baghdad, Iraq, 2018. [Google Scholar]
  34. Anderson, M.P.; Woessner, W.W.; Hunt, R.J. Applied Groundwater Modeling: Simulation of Flow and Advective Transport; Academic Press: London, UK, 2015. [Google Scholar]
  35. Agriculture Organization of the United Nations. Fisheries Department. In The State of World Fisheries and Aquaculture, 1998; Food Agriculture Organization: Rome, Italy, 1999. [Google Scholar]
Figure 1. Location of the study area with the Kerbala WWTP.
Water 13 03167 g001
Figure 2. The stratigraphy and lithology of the formations in the study area.
Water 13 03167 g002
Figure 3. Experimental and fitted semivarigrams for the groundwater head level: spherical (a), exponential (b), and Gaussian (c).
Water 13 03167 g003
Figure 4. The divided zones of the hydraulic conductivity and natural recharge of the study area.
Water 13 03167 g004
Figure 5. DEM of the study area.
Water 13 03167 g005
Figure 6. Contour map of the simulated groundwater level in meters above sea level (m.a.s.l.) after calibration of the Dibdibba aquifer under steady-state conditions.
Water 13 03167 g006
Figure 7. Contour map of the simulated aquifer groundwater level on 1 December 2017.
Water 13 03167 g007
Figure 8. Validation in four observation wells during the transient period 2016–2017.
Water 13 03167 g008
Figure 9. The expected groundwater level decline in 2030 in the study area without recharge.
Water 13 03167 g009
Figure 10. Effect of artificial recharge in 2030: differences in groundwater elevation increases (a) between MOD2 and MOD1 and (b) between MOD3 and MOD1.
Water 13 03167 g010
Figure 11. Groundwater level variations in observation well No.3 (Obs.3). (a) MOD2 with 5000 m3/day and (b) MOD3 with 10,000 m3/day, artificial recharge rate for period (January 2022 to December 2030).
Water 13 03167 g011
Figure 12. Sensitivity analysis of modeling parameters.
Water 13 03167 g012
Publisher’s Note: MDPI stays neutral with regard to jurisdictional claims in published maps and institutional affiliations.

