Article

Cyanobacterial Biomass as a Potential Biosorbent for the Removal of Recalcitrant Dyes from Water

by
Carlos Diaz-Uribe
1,*,
Barni Angulo
1,
Karen Patiño
1,
Vincent Hernández
1,
William Vallejo
1,
Euler Gallego-Cartagena
2,
Arnold R. Romero Bohórquez
3,
Ximena Zarate
4 and
Eduardo Schott
5
1
Grupo de Investigación en Fotoquímica y Fotobiología, Facultad de Ciencias Básicas, Universidad del Atlántico, Puerto Colombia 081007, Colombia
2
Gestión de Estudios en Saneamiento y Ambiental, Department of Civil and Environmental, Universidad de la Costa, Calle 58 # 55-66, Barranquilla 080002, Colombia
3
Grupo de Investigación en Compuestos Orgánicos de Interés Medicinal CODEIM, Parque Tecnológico Guatiguará, Universidad Industrial de Santander, A.A. 678, Piedecuesta 681011, Colombia
4
Instituto de Ciencias Químicas Aplicadas, Facultad de Ingeniería, Universidad Autónoma de Chile, Santiago 7500912, Chile
5
Departamento de Química Inorgánica, Facultad de Química y de Farmacia, Centro de Investigación en Nanotecnología y Materiales Avanzados CIEN-UC, UC. Energy Research Center, Pontificia Universidad Católica de Chile, Vicuña Mackenna 4860, Macul, Santiago 7820436, Chile
*
Author to whom correspondence should be addressed.
Water 2021, 13(22), 3176; https://doi.org/10.3390/w13223176
Submission received: 20 September 2021 / Revised: 18 October 2021 / Accepted: 2 November 2021 / Published: 10 November 2021

Abstract

:
The accumulation of cyanobacteria produced due to eutrophication processes and the increment of different pollutants in water as a result of industrial processes affects aquatic environments such as the ocean, rivers, and swamps. In this work, cyanobacterial biomass was used as a biosorbent for the removal of a commercial dye, methylene blue (MB). Thus, MB was removed from biomass obtained from cyanobacterial samples collected from the swamp located in the Colombian Caribbean. Spectroscopical techniques such as FTIR, SEM, EDX measurements were used for the physico-chemical characterization of the bio-adsorbent material. Furthermore, we present the effect of various adsorption parameters such as pH, MB dose, time, and adsorbent concentration on the adsorbent equilibrium process. Three different isotherm models were used to model the MB adsorption on biomass. The functional groups identified on biomass suggest that these models are suitable for the characterization of the sorption of cationic dyes on the surfaces of the biomass; in addition, an SEM assay showed the heterogeneous surface of the biomass’ morphology. The equilibrium tests suggested a multilayer type adsorption of MB on the biomass surface. The kinetics results show that a pseudo-second order kinetic model was suitable to describe the MB adsorption on the biomass surface. Finally, the herein obtained results give an alternative to resolve the eutrophication problems generated by cyanobacterial growth in the swamp “Ciénaga de Malambo”.

1. Introduction

Water is a critical resource for all living beings on earth; however, we face a great ecological challenge today, due to rapid urbanization and human anthropogenic activities [1]. Contaminants such as organic and inorganic pollutants are delivered into the water affluents (e.g., ponds, lakes, streams, rivers, and oceans). These pollutants reduce light penetration and photosynthesis [2,3]. Currently, climate change indicators demonstrate the challenge that humanity is facing (e.g., CO2 atmosphere level, earth temperature, ocean temperature, glaciers and sea ice melting, global sea level, ocean acidification, and extreme climate) [4,5]. Among these indicators, the ocean’s acidification is increasing due to eutrophication [6], where an accumulation of plants and cyanobacteria is produced. These species will eventually decompose, affecting the pH and the aquatic species in the environment [7]. Thus, the cyanobacteria species can lead to hypoxia from effluents and disrupt trophic ecosystems [8]. In the Caribbean region, several swamps present this type of cyanobacterial bloom. Due to their potential risk, these species can affect the water consumption involved in different applications (e.g., drinking water, irrigation, fishing, and recreational waters) [9]. In the Colombian Caribbean region, there is an important muddy area made up of three swamps: the swamp “Ciénaga Mesolandia or Bahía”, the swamp “Ciénaga Grande de Malambo” and the swamp “Ciénaga el Convento” (see Figure 1). The swamp Ciénaga Grande de Malambo covers an area of nearly 225 ha, and its average depth is between 1.1 and 2.2 m in the low- and high-water seasons, respectively. This body of water presents a strong overload of organic matter produced by the discharge of raw domestic wastewater and by the construction of embankments on its only water exchange routes. This situation is critical for communities living near to the swamp, and this situation requires new alternatives to solve the contamination problem.
Currently, the effluents containing synthetic dyes cause significant pollution in water, mostly in industrial wastewater. They have become an increasingly major environmental problem; these compounds are classified as (1) anionic, (2) cationic, and (3) non-ionic [10,11]. Cationic dyes are more toxic than anionic dyes, as they can easily interact with negatively charged cell-membrane surfaces entering into cells and concentrating in the cytoplasm; thus, they also represent a risk to human health [12]. Methylene blue (MB, a cationic dye) is widely employed in different fields (e.g., dyeing fabric, cotton and plastics printing, as an oxidation-reduction indicator, antiseptic, and for pharmaceutical and food industries). However, it has highly toxic and carcinogenic properties in living organisms after short periods of exposure [13]. Currently, the removal of this dye from effluent has become environmentally important. This dye is stable to light, heat and oxidizing agents, which makes laborious removing it from water effluents. Generally, to remove dyes, the typical techniques used include: (1) chemical precipitation, (2) membrane processes, (3) oxidative degradation, (4) photo-catalytic degradation, (5) sonochemical degradation, (6) electrochemical degradation, and (7) integrated chemical–biological degradation [14,15]. Most of these techniques have some drawbacks (e.g., second stages for removing muddy waste, profit/price ratio, energy requirements). Due to the physical and chemical properties of adsorbents, the adsorption process is an effective method for pollutant remotion [16]. Currently, zeolites, activated carbon, and some polymer-based porous materials are employed in the adsorption applications. Currently, attention has been drawn towards the development of low-cost adsorbents, therefore, diverse kinds of biological materials have been used as dye removal agents from an aqueous solution [17]. In this sense, biosorption is a subcategory of adsorption, which involves combining active and passive transport mechanisms, beginning with the diffusion of the adsorbed component (called adsorbate) to the cell surface. After that, the adsorbate will bind to sites on the cell surface, which exhibit some chemical affinity for it [18]. Biosorption is cheaper than traditional treatment of contaminated water, and the number of required chemical components is smaller [19,20]. Diverse biological materials (e.g., rice husk, cotton waste, banana peel, orange peel, fungi, bacteria) have been reported for MB removal [21]. In this sense, there is a high interest in using biomass as a potential adsorbent, because the biomass-derived materials exhibit interesting properties, (e.g., renewable resources, carbon-neutral, low-cost, abundance, eco-friendly, and mechanical stability). Many classes of microbial biomasses are suitable as bio-adsorbents (e.g., algae, cyanobacteria, fungal and bacterial) [22]. Azam et al., performed this process using algal biomass for wastewater treatment under axenic conditions [23]. Cui et al., reported phenol and Cr (VI) removal using materials derived from harmful algal bloom biomass [24]. Ani et al., reported the use of carbon produced from biomass materials for the sequestration of dyes, heavy metals, and crude oil components from aqueous environments [25]. Furthermore, Vahabisani et al., generated an interesting review about biomass-derived adsorbents for the removal of petroleum pollutants from water [26].
Finally, cyanobacteria have various potential binding sites, such as hydroxyl and carboxyl groups, which are present on the cell wall. It has been shown that these chemical groups are critical for the dye removal by means of a biosorption process [27,28]. In the present study, the potential application of the biomass (obtained from cyanobacteria) to remove MB from aqueous solutions as a potential solution to the cyanobacteria accumulation in the swamp is presented. Additionally, this study provides information on the kinetics and adsorption process parameters.

2. Materials and Methods

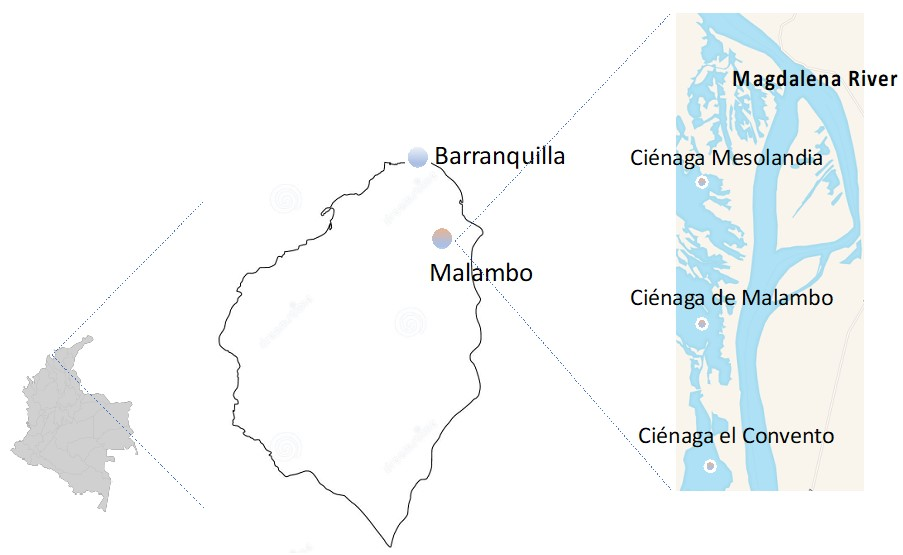
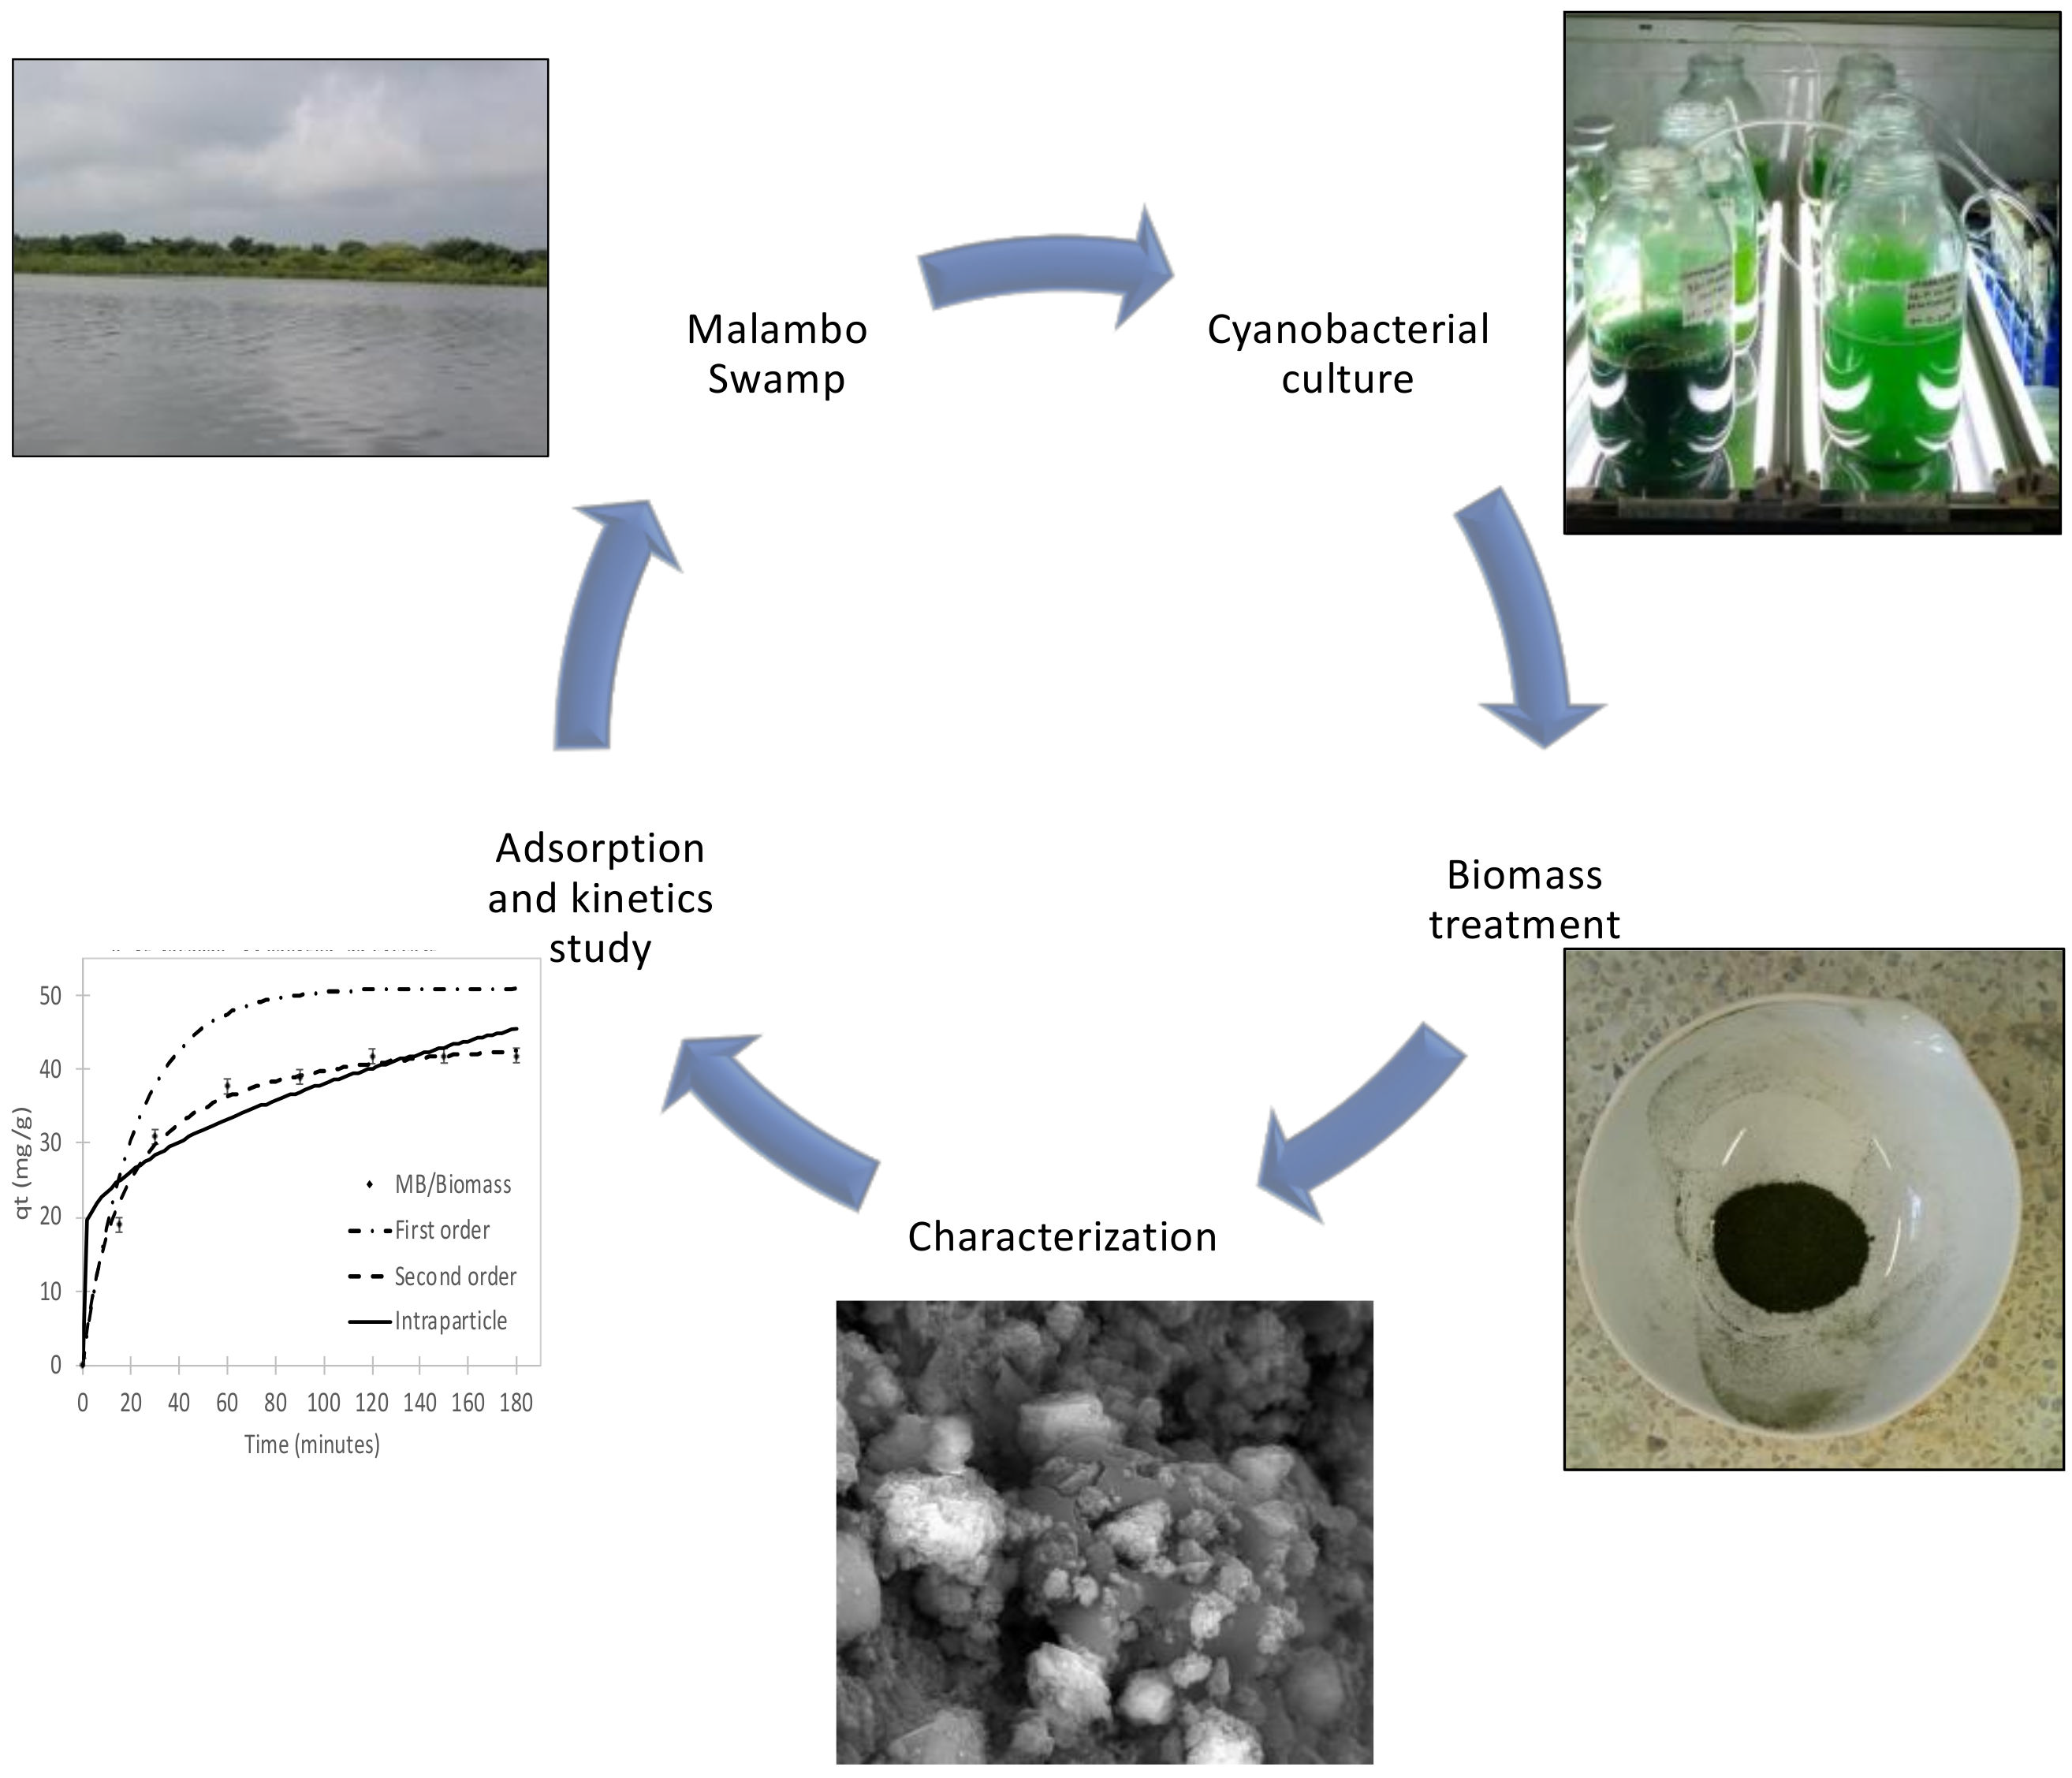
2.1. Cyanobacterial Biomass: Preparation and Characterization

The samples were obtained from Ciénaga Grande de Malambo, on the left bank of the Magdalena River, located in the Caribbean region. Details about biomass extraction can be found in a previous report [29]. The surface morphology of biomass was examined through field emission gun scanning electron microscopy (FEG-SEM). Furthermore, energy-dispersive spectroscope (EDS) was used to identify the elemental composition of the biomass. Finally, the infrared assay was carried out using an ECO-ATR alpha Bruker FTIR spectrometer.

2.2. Adsorption Experiments

Different parameters that influence the adsorption process were studied in this work, such as pH, initial concentration of MB, contact time, and adsorbent dose. All adsorption experiments were carried out in triplicate. MB concentration was determined by spectrophotometry at a wavelength of 665 nm using 1.0 cm-long path cells (spectrophotometer Shimadzu, Model UV-1800). The removal percentage of MB was determined according to Equation (1) [30]:
%   Removal   of   MB = Initial   concentration   ( C 0 ) Final   concentration C e Initial   concentration   ( C 0 ) × 100
The effect of the pH was determined using fixed conditions. In the process, 0.100 g of biomass and 100 mL of solution with 50 ppm of MB were mixed in a flask. Five different pH values were tested—the pH of the solutions was fixed at 2.0, 4.0, 6.0, 8.0, and 10.0 by micro-additions of HNO3 (0.0100 M) or NaOH (0.0100 M). The shake rate was 150 rpm under controlled temperature (289 K) for 3 h. After obtaining the optimum pH condition, the effects of the adsorbent dosage (0.200, 0.400, 0.6000, 0.800, 1.000, 1.200 and 1.500 g/L), contact time (15, 30, 60, 120, 180 and 240 min) and initial MB dose (25, 50, 100, 150, 200, 250, 300 and 350 ppm) were studied under the same shake rate and temperature conditions. The amount of dye adsorbed at equilibrium, qe (mg/g), was determined by Equation (2):
q e = C 0 C e · V m
where C0 (mg/L) is the initial concentration of MB in the liquid phase, Ce (mg/L) is the concentration at equilibrium of MB in the liquid phase, m(g) is the biomass amount and V(L) is the volume of the solution [31]. The Langmuir (Equation (3)), Freundlich (Equation (4)) and Temkin (Equation (5)) isotherm models were used to study the adsorption mechanism of the MB on biomass [32,33]. The Langmuir model is expressed as follows:
q e = q m K L C e 1 + K L C e
where qe is the amount (mg) of MB adsorbed per gram of biomass at equilibrium condition (qe; mg/g), the Langmuir maximum uptake of methylene blue per gram of biomass is (qm; mg/g); KL (L/mg) is the Langmuir constant and, the equilibrium concentration of the MB is (Ce). Furthermore, the Freundlich model can be expressed as follows:
q e = K F C e 1 / n  
where KF ((mg/g) (L/mg)1/n) and n are Freundlich constants, Ce(mg/L) is the equilibrium concentration of MB. Finally, the Temkin isotherm fits the following mathematic expression:
q e = R T b T L n A T C e = B L n A T C e
where A and B are the Temkin isotherm constants; bT represents the variation in adsorption energy (kJ/mol) and B is the Temkin constant associated with the parameter bT by the relation ( b T = R T B ), AT is the equilibrium binding constant (L/mg), T is the absolute temperature and R is the gas constant [34,35]. We used the correlation coefficient (R2) and an average relative error (ARE) to determine the best isotherm fitting [36]:
R E = 100 n i = 1 n q e q f q e
where qe is the experimental value, qf is the fitted value and n is the number of data points.

2.3. Kinetics Study

The mass in mg of MB which is adsorbed by a gram of the biomass at time, qt (mg/g), was calculated according to:
q t = C 0 C t · V m
where Ct (mg/L) is the liquid-phase concentration of MB solution at time t (min) [30]. We employed three adsorption kinetic models: the pseudo-first and pseudo-second order (Equations (7) and (8)) and the intraparticle diffusion (Equation (9)), according to the following equations [37]:
ln q t q e = ln q e k 1 t
t q t = 1 k 2 q e 2 + t q e
q t = k i d t 1 / 2 + C
where qt is the mass in mg of MB which is adsorbed by a gram of the biomass at time t (min) and qe is the amount of dye adsorbed at the equilibrium point (mg/g), k1(min−1) and k2(g*mg−1min−1) are the rate constants of the pseudo-first and pseudo-second order model, respectively, and the kid(mg/g*min1/2) is the intraparticle diffusion rate constant. The best fitting kinetics model was determined according to the correlation coefficient (R2) and the average relative error value. The general scheme of the experimental process is shown in Figure 2.

3. Results and Discussion

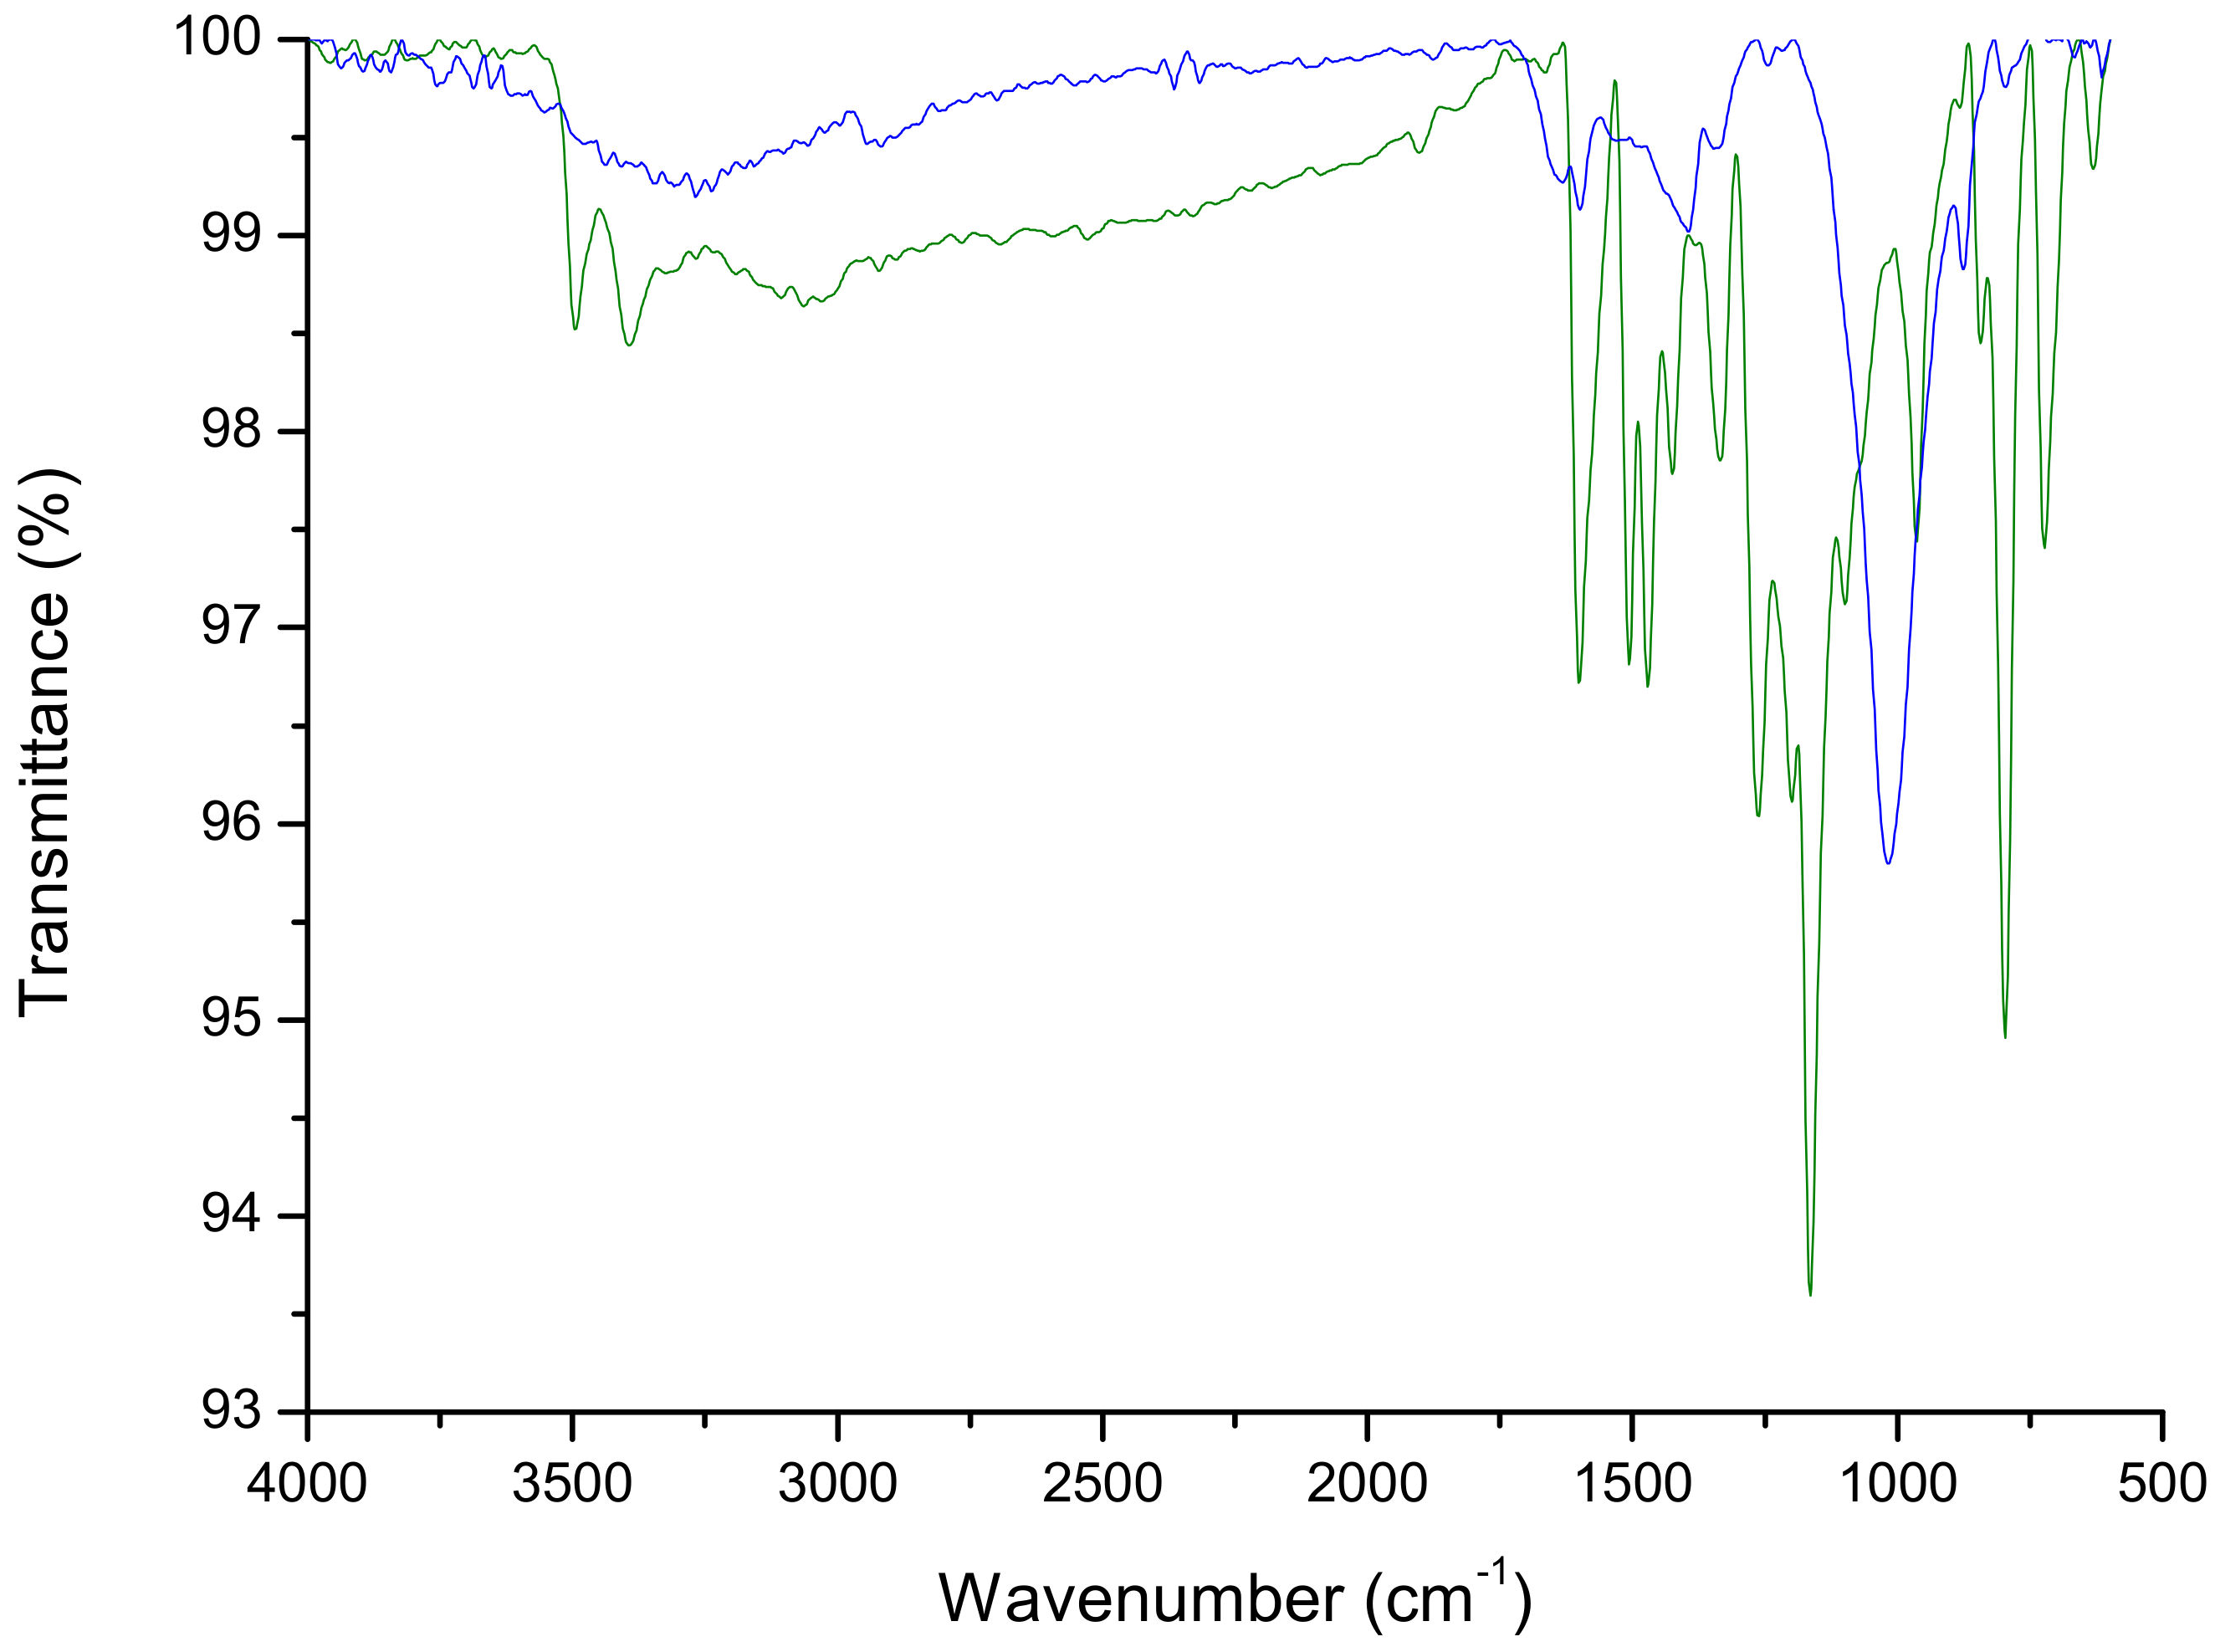
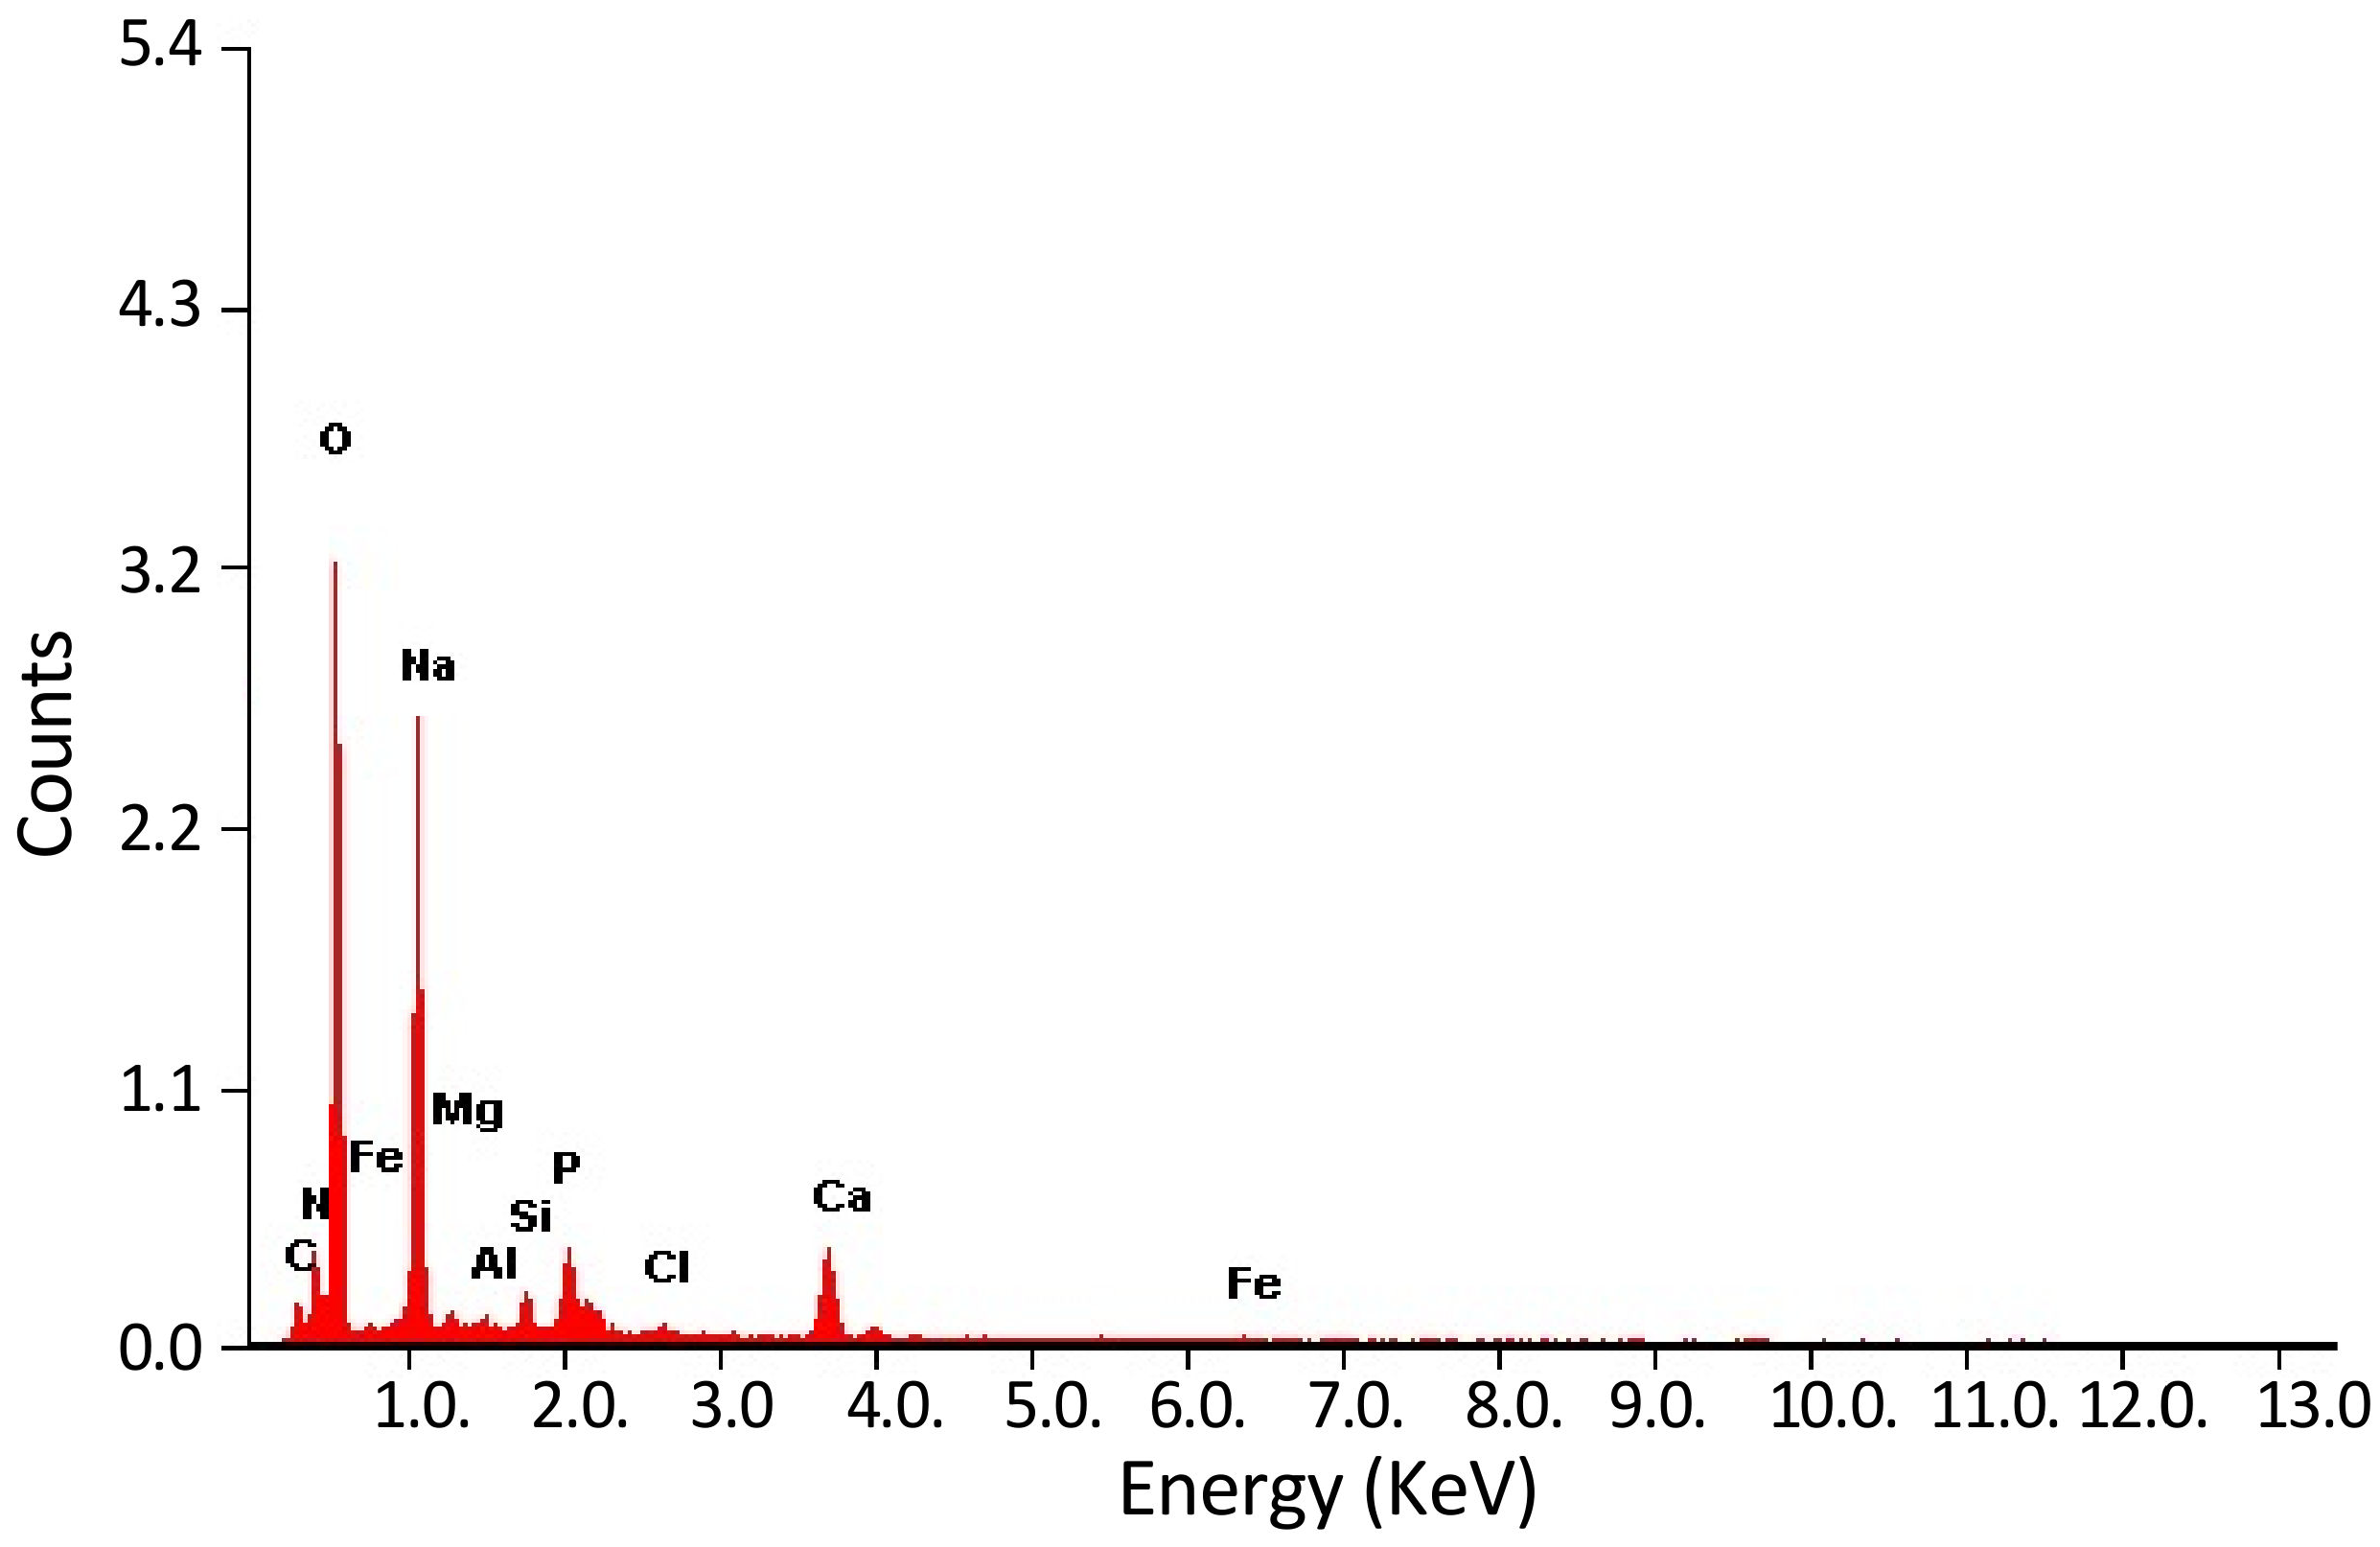
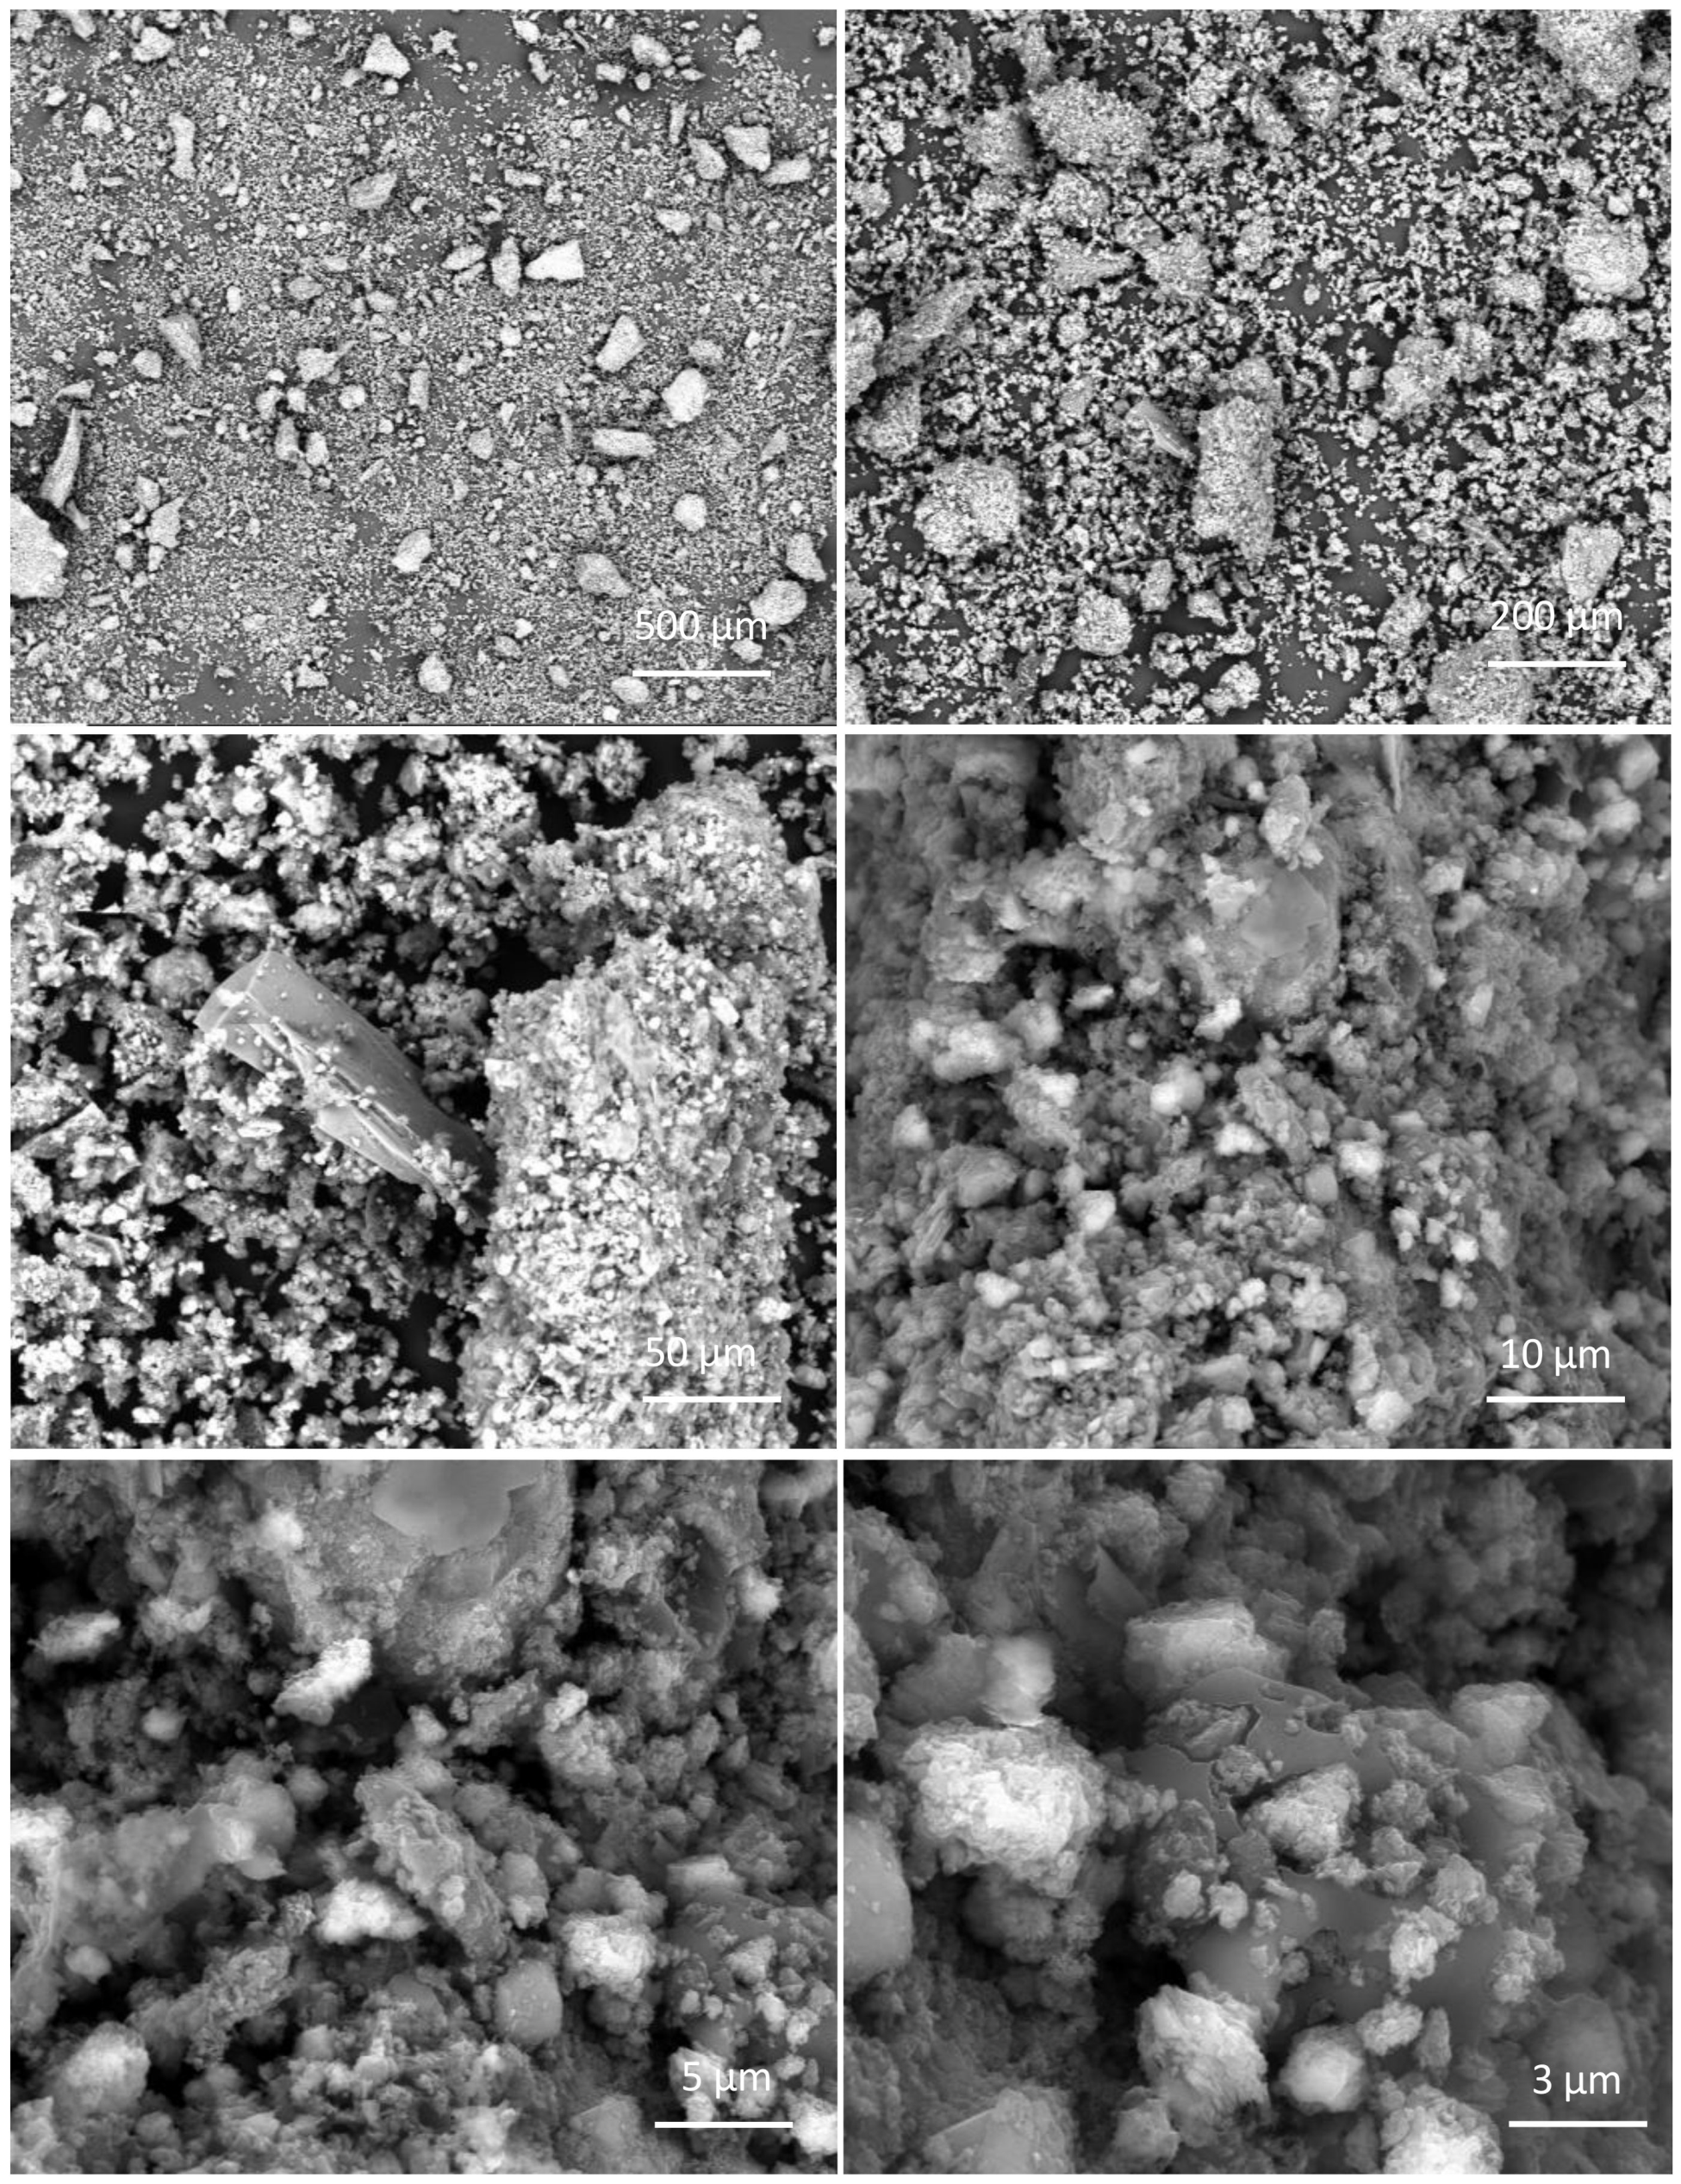
3.1. Biomass Characterization

The cyanobacterial genera Leptolyngbya, Raphidiopsis, Lyngbya, and Planktothrix were identified as the main components of the dry biomass. These genera are characterized by having filamentous organization and high requirements of nitrates to grow successfully [29]. The FTIR spectroscopy, SEM and the EDX experiments were carried out to characterize the biomass. The identification of chemical groups located on the biomass surface was performed by FTIR spectroscopy [38]. The biomass spectrum (see Figure 3, green line) was analyzed between 500 and 4000 cm−1 (Figure 3). The band located at 3500 cm−1 corresponds to bonded -OH from carboxylic groups on their surface. The signal located at 1664 cm−1 corresponds to the carbonyl (–C=O) stretching from the amide group. The band located at 3350 cm−1 corresponds to the N–H stretching and indicates the presence of imino compounds. The band located at 1425 cm−1 is assigned to primary alcohols, while the bands located at 1160 cm−1 and 1262 cm−1 are associated with ester groups [39]. Therefore, the functional groups identified on the biomass suggest that it is suitable for the bioadsorption of cationic molecules such as MB on their surfaces. The morphology characterization of the biomass surface was performed using an SEM assay [40].
FTIR spectroscopy is widely used to characterize the mechanism of binding on algal surfaces with the help of the hydroxyl, carboxylic acid, amine, amino, sulfonyl and phosphate functional groups found in the structure of the biomass. Thus, we performed the comparison of the FTIR spectra before and after dye adsorption (see Figure 3, blue line). The depicted results indicate that MB is generally attached to hydroxyl, amine and carboxyl groups of biomass [41]. Furthermore, it would be possible to regenerate the used biomass, as has been previously reported by Singh et al., using diluted NaOH [42].
An EDX assay was conducted to determine the elemental compositions of the biomass; see Figure 4. The results indicate that the chemical composition of biomass was: 5.04% of carbon, 53.64% of oxygen, 13.47% of nitrogen, 19.44% of sodium, and 3.40% of calcium with some other trace chemical elements. The abundance and components revealed by EDX are consistent with the FT-IR results. The high percentage of carbon, nitrogen, and oxygen is a typical requirement to enhance the adsorption of dyes by the biomass.
Figure 5 shows the SEM images of the biomass (magnification ranges between 3–500 μm). The morphology observed indicates a high degree of roughness and a heterogeneous surface [28]. These features favor the diffusion and adsorption of MB molecules into the internal space of the biomass. Figure 5 shows porous and finely segregated particles of different sizes (around 0.5–2 μm) which could be responsible for the sorption process.

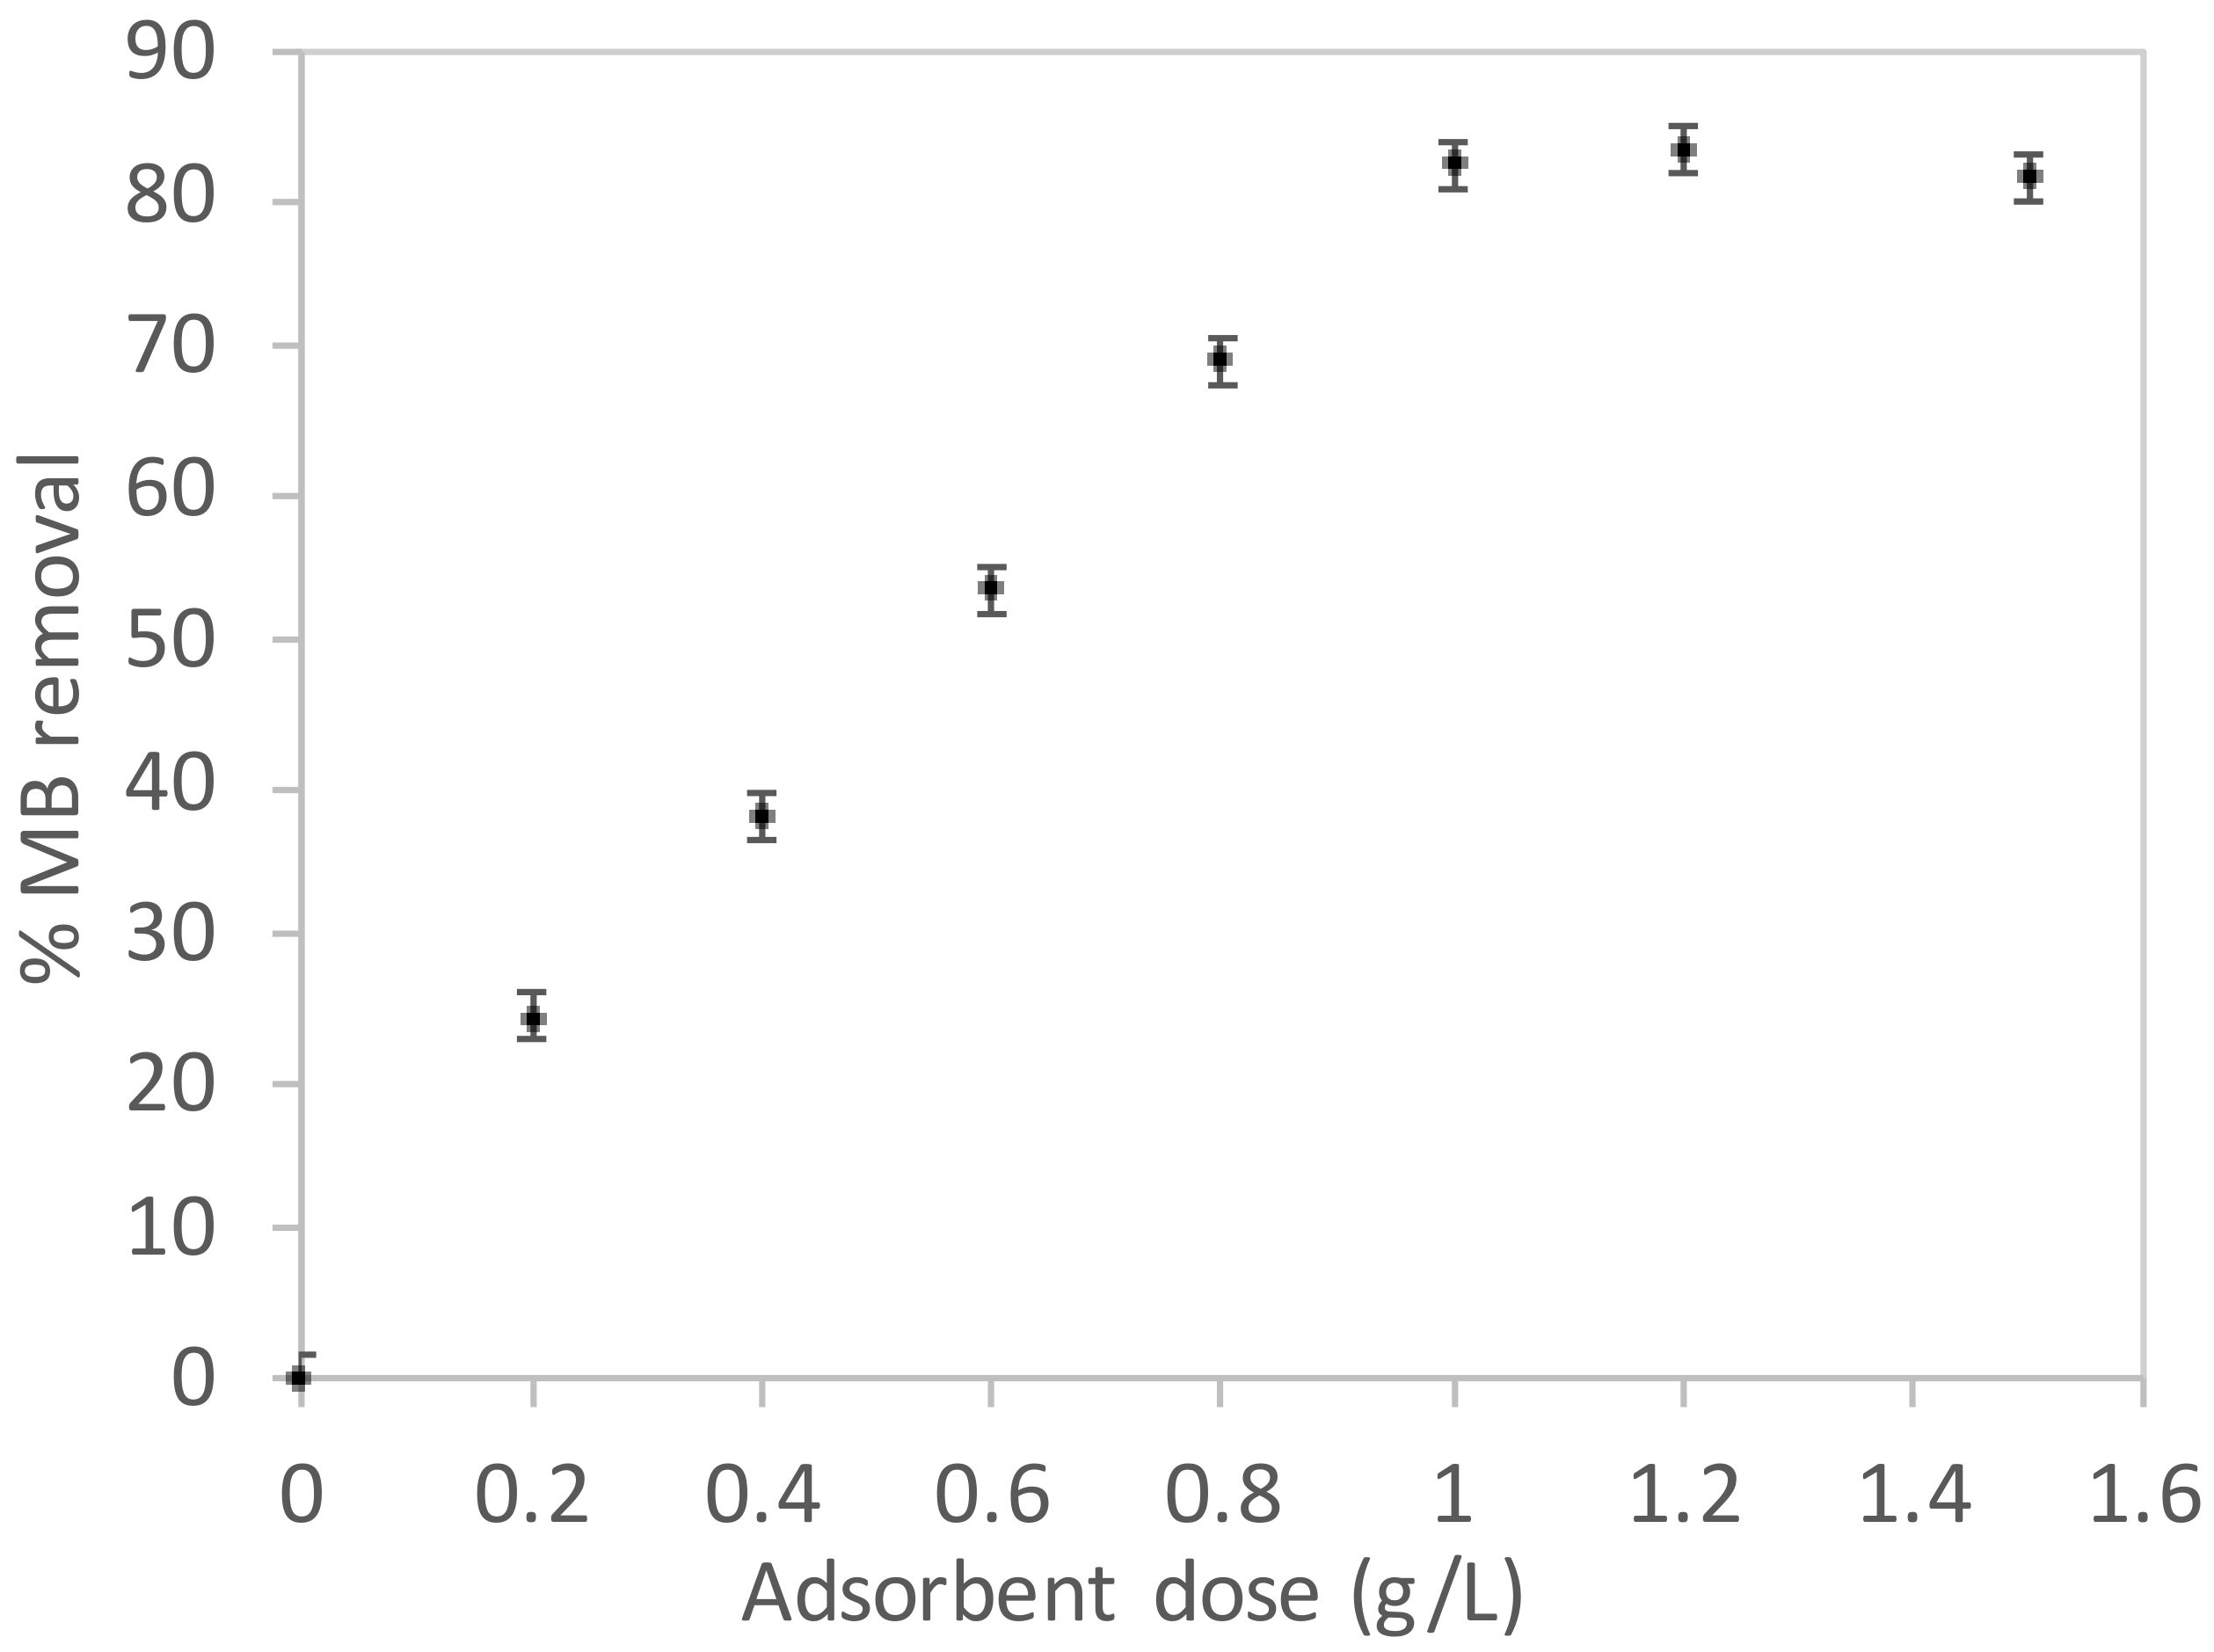
3.2. Adsorption Parameters Assay

An important controlling parameter in the adsorption study is the pH value. This parameter affects chemical groups on the biomass surface and also influences the ionization of the dye molecules [43]. Thus, we studied the pH effect in the range from 2.0 to 10.0. Figure 6 shows the pH’s effect on the percentage (%) of MB removal.
The %MB removal increases as the solution pH increases and the maximum %MB removal was reached at pH = 6.0. At higher pH values, the chemical-ionic intracellular composition changes, affecting the cell membrane chemical groups and their function (e.g., lipids and glycoproteins). The basic hydrolysis of different chemical groups can yield more negatively charged sites on the biomass surface [44]. The results show that the %MB removal increases from pH 2.0 to 6.0. At acidic pH values, the available hydrogen ions compete with the MB molecules, binding the sites of the biomass surface, whereas at higher pH values, there predominates an electrostatic attraction between the negatively charged surface and the positively charged MB [45]. According to these results, the optimum pH value for MB removal was pH = 6.0.
The biomass concentration effect on the %MB removal was studied in the range of 0.2 to 1.5 g biomass/L at a fixed pH of 6.0. Figure 7 shows the obtained results.
The %MB removal increased as the biomass concentration was higher as the active sites available on the biomass surfaces increased due to a higher biomass dose [46]. Figure 7 shows that the saturation limit is reached for doses higher than 1.0 g/L. This saturation behavior is associated with the reduction in the concentration gradient between the MB solution and the biomass surface [47]. Furthermore, Figure 8 shows the MB concentration effect on the removal process. Higher %MB removal was obtained at low concentrations, as more active sites are available on the biomass surface [48]. As observed, when the initial MB concentration increases at a fixed amount of adsorbent, the number of available sites decrease on the biomass surface, and therefore, the MB molecules compete for the active sites, decreasing the efficiency of the adsorption process [49].
Figure 9 shows the effect of time on the adsorption process (15–240 min). The %MB removal increased as the contact time increased, reaching a plateau at an exposure time of 120 min. Thus, before this time, the active sites available are higher, and the adsorption is faster; this stage is controlled by the MB molecules’ diffusion from the bulk solution to the biomass surface.
After 75 min (see Figure 9), the adsorption is not under the diffusion regimen. After that time, the process is dominated by the mass-transfer from solution to the biomass surface. Thus, this process is controlled by the presence of active sites available on the biomass surface. Therefore, before 75 min, the removal of MB is faster and it declines over the contact time due to a reduction in the number of active sites available on the biomass surface [50].

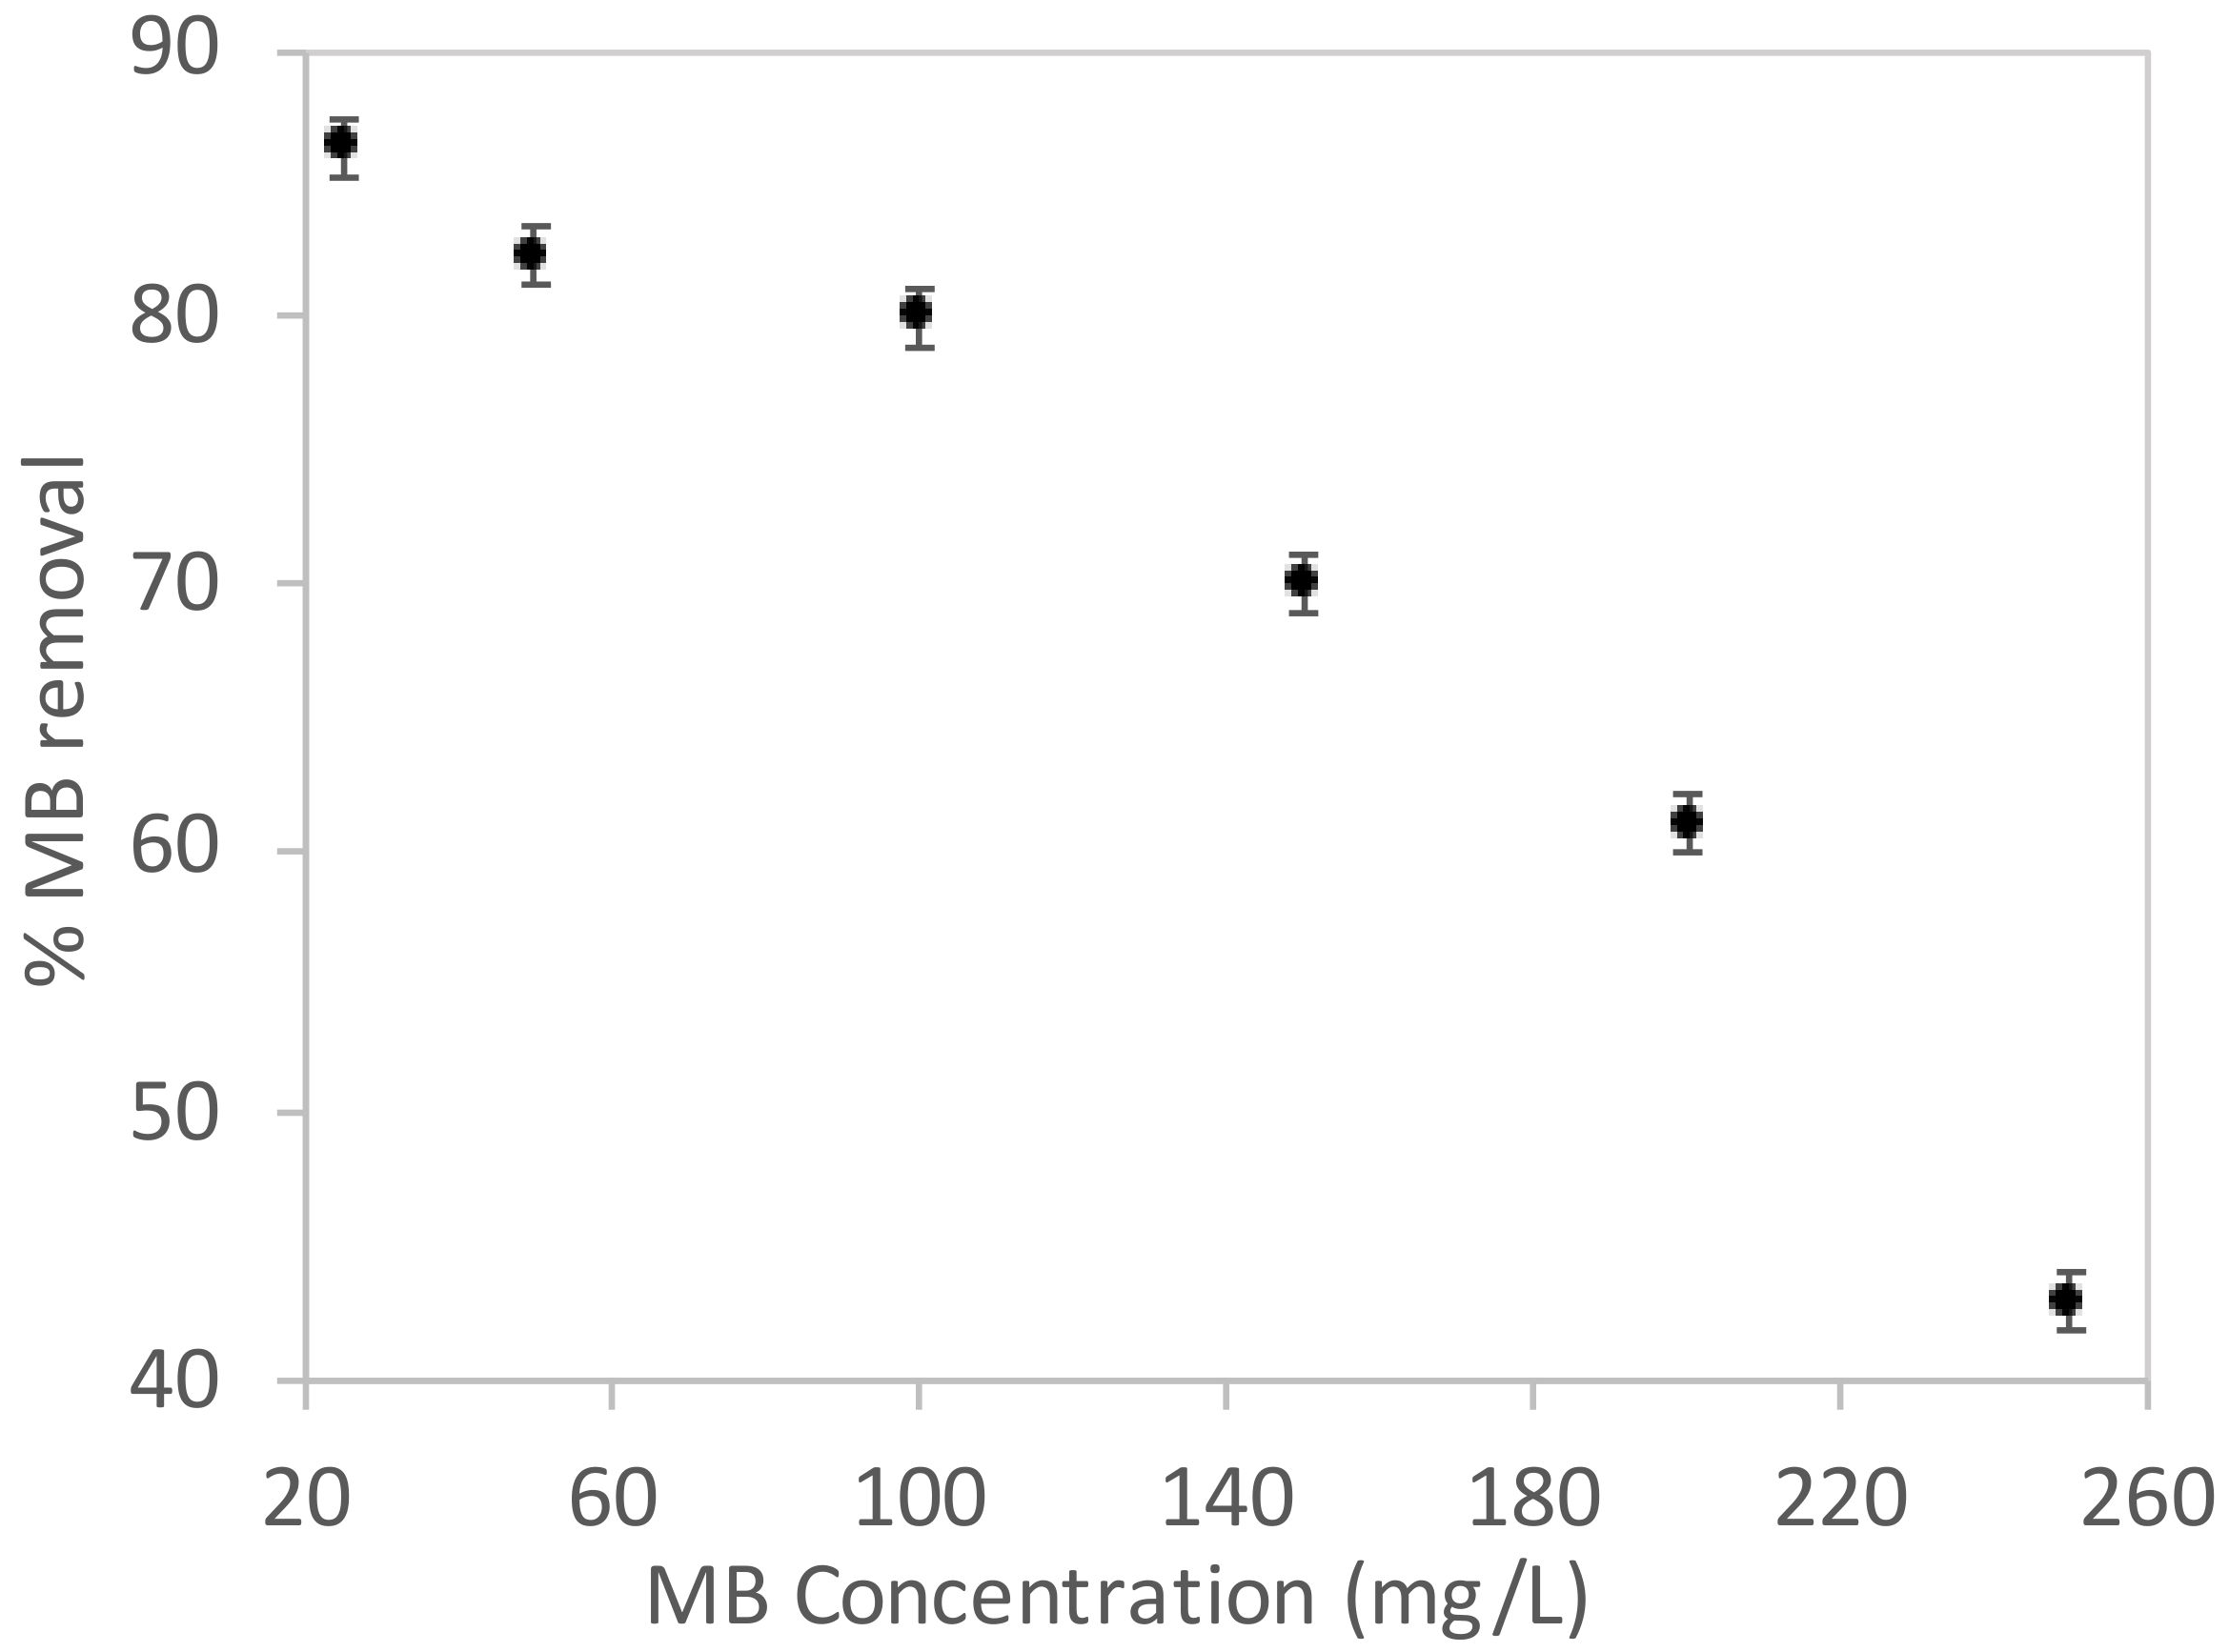
3.3. Adsorption Parameters Assay

Figure 10 shows the adsorption isotherm for MB removal; furthermore, Table 1 lists the adsorption isotherm parameters calculated after fitting the models to experimental data.
The Freundlich adsorption isotherm model has a higher fitting coefficient and lower ARE value than the rest of the used isotherm models. The good fitting with the Freundlich model indicated that the MB adsorption is of the multilayer type; furthermore, it indicates that the biomass surface is heterogeneous [51]. This result agrees with the morphology exhibited by the SEM assay. The value of the 1/n = 0.52 indicates that the adsorption process is favorable [52]. Furthermore, the KF constant of the Freundlich fitting was 14.32, where a higher value of KF suggested that the biomass adsorbent had a higher affinity for MB dye. Yang et al., reported a KF = 1.71 for Cr removal from sugarcane pulp residue and biosorbent [53], Kilic et al., reported a KF = 9.30 for Ni removal from almond shells and biosorbent [54], and Amouei et al., reported a KF = 5.28 for Cd removal from canola residue [55]. Compared to these previously reported studies, our results show the potential of cyanobacterial biomass for MB removal.

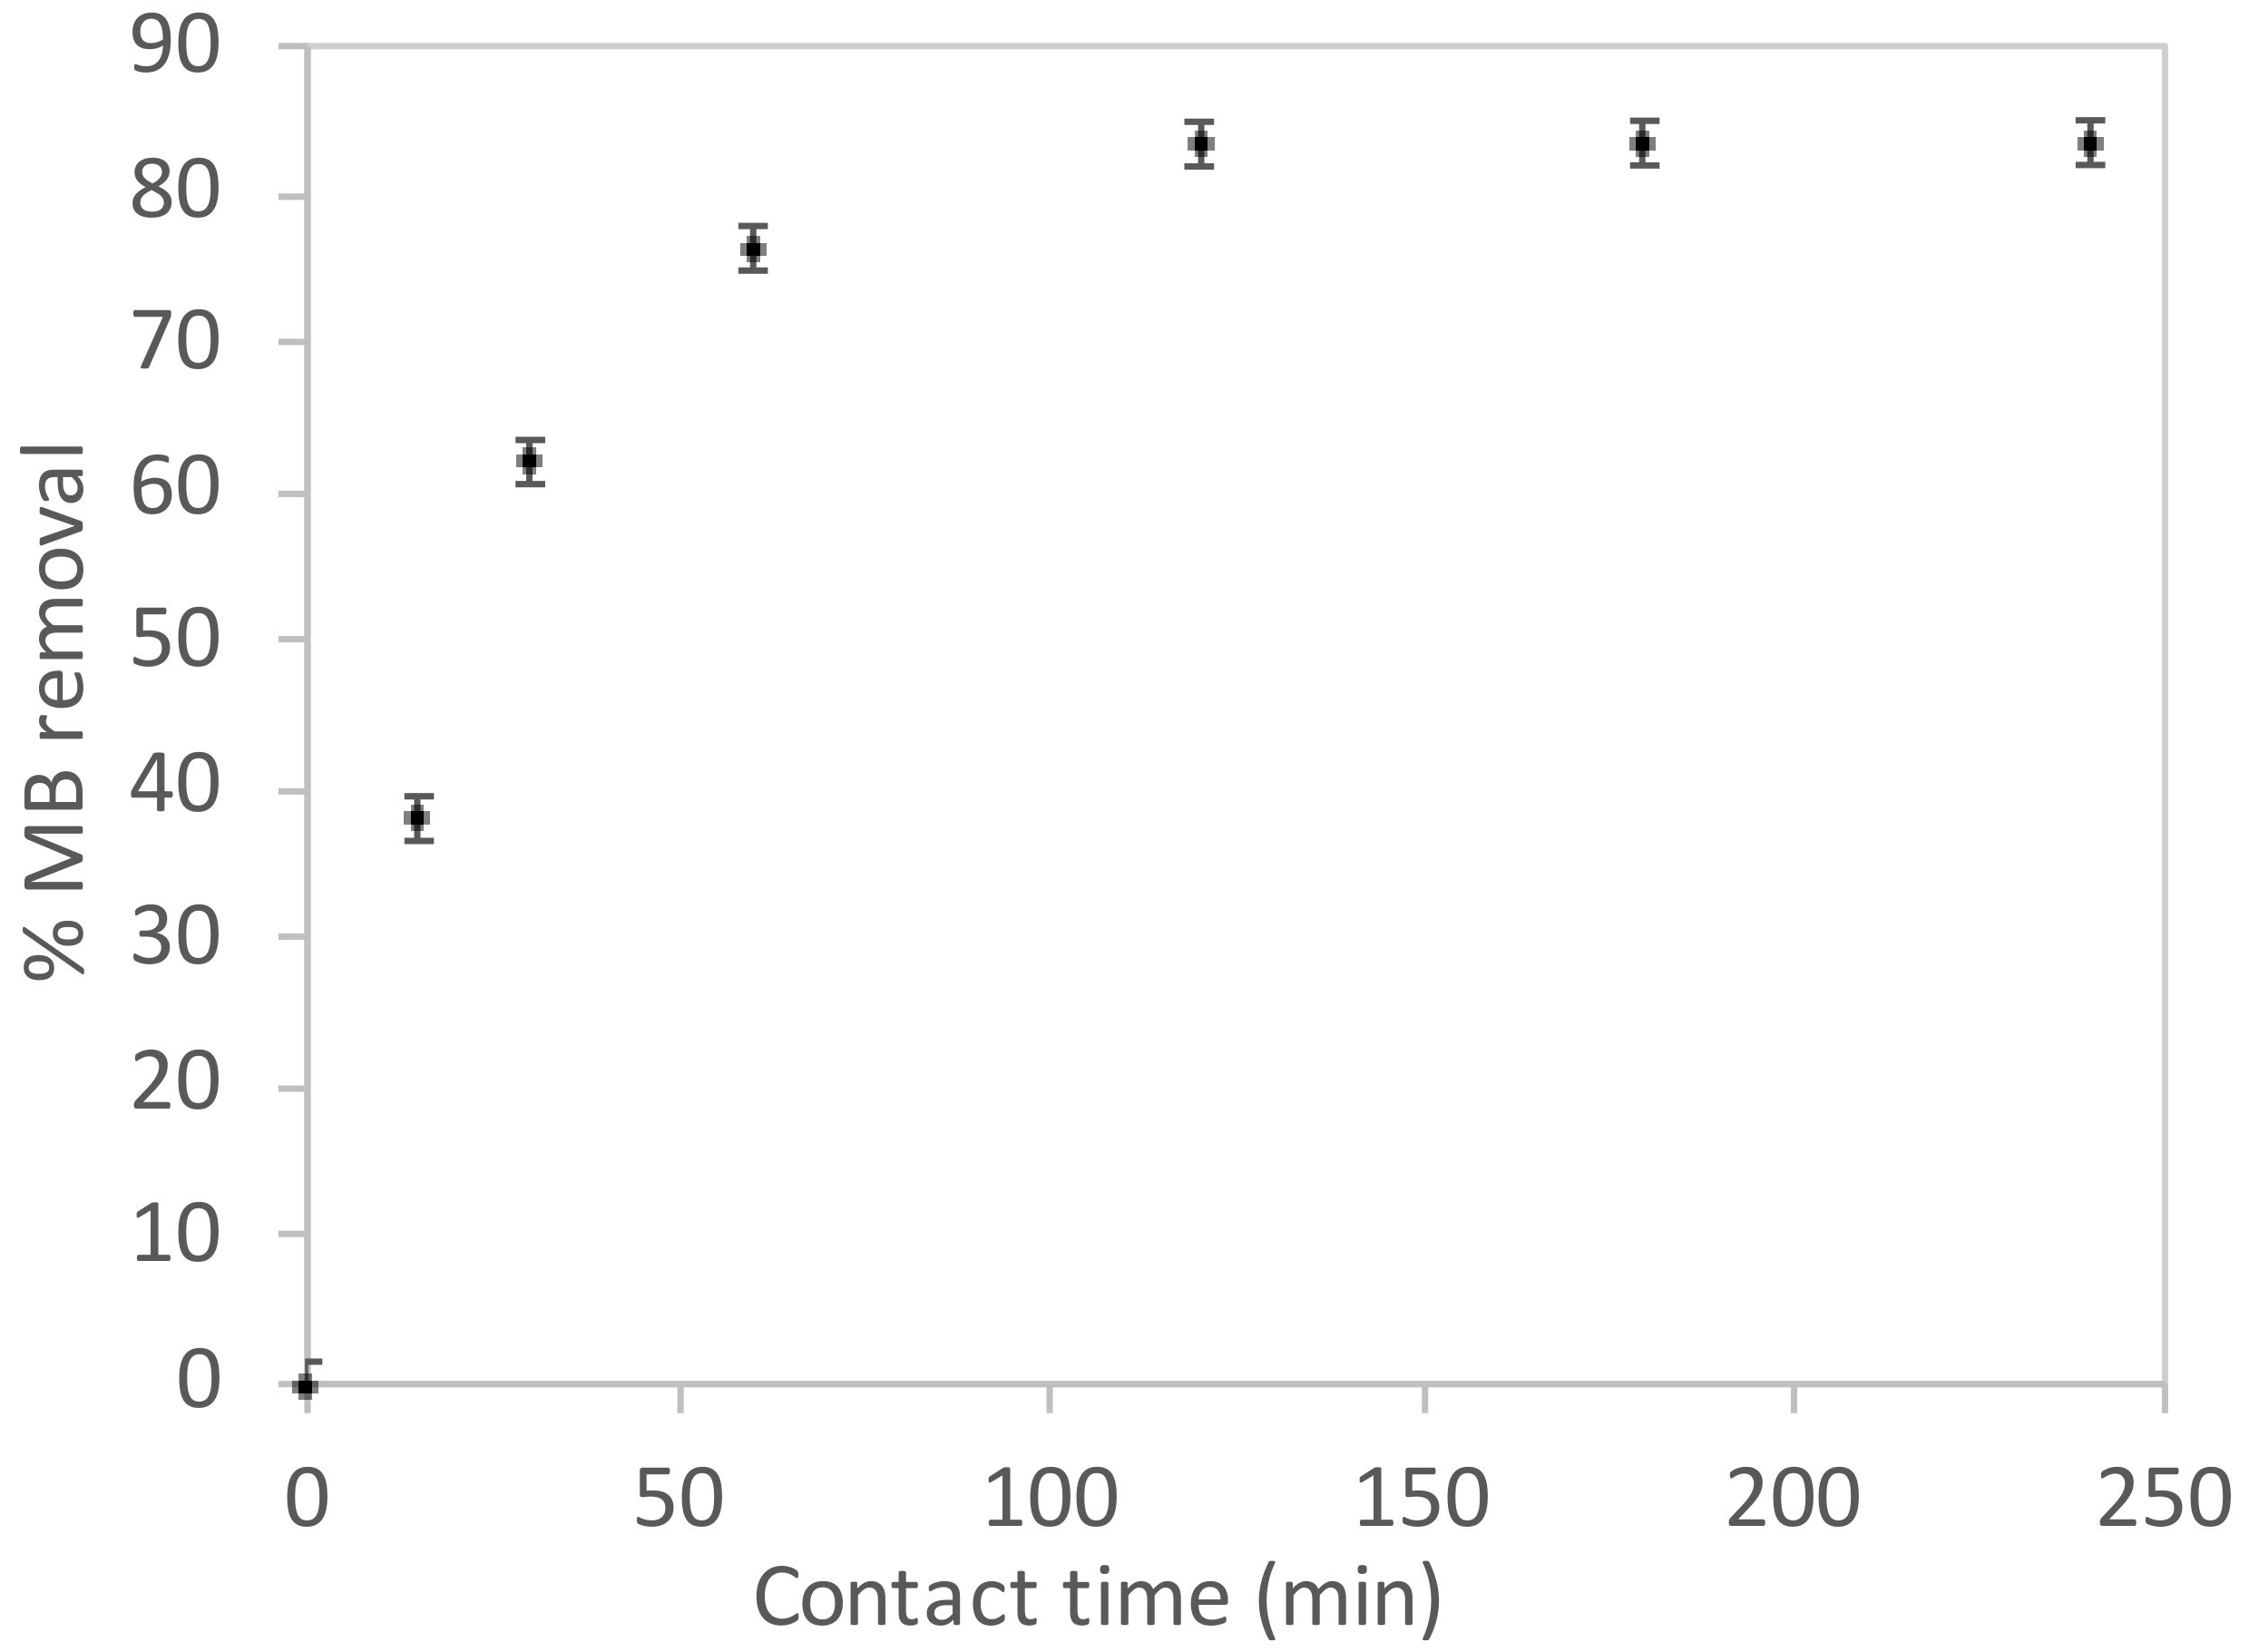
3.4. Adsorption Kinetics

The kinetic mechanism for the MB adsorption on biomass can be studied indirectly using different kinetics models. In this work, we used three different models. Figure 11 shows adsorption kinetic data, and Table 2 lists the parameters for the fitting of the kinetics data. The pseudo-second order model (PSO) showed best-fitting regression values (higher R2 and lower ARE value). These results suggest that the chemisorption is the dominant interaction during the MB adsorption on biomass surface. In the case of the intraparticle diffusion model, the kinetics data fitting parameters showed the worst results for the three models; it has been reported that this model requires a faster mass-transfer rate for the first stage of the adsorption process [56]. These results indicate that the intraparticle diffusion is not the dominating mechanism for the adsorption of MB onto biomass, and thus this model is not suitable for describing the herein adsorption process.
Our results are in accordance with other reports related to pollutant adsorption on biosorbent adsorbents. Wu et al., reported that this kinetics model described the Pb (II) adsorption using biochar [57]. Furthermore, the same trend was reported in other studies [58,59]. The main advantage of using cyanobacterial biomass as a biosorbent source is that this application can resolve the eutrophication problems generated by cyanobacterial growth in the swamp of Malambo. This strategy could be implemented in other locations in the Caribbean or other world places where this kind of situation is presented.

4. Conclusions

The MB removal on biomass obtained from cyanobacterial cultures was shown. The adsorption of MB on the biomass shows a maximum value at a pH of 6. The rapid adsorption process takes place at very low concentrations. The Freundlich model was suitable to describe the MB removal (R2 = 0.9913; ARE = 4.8%). Furthermore, the PSO model was suitable to describe the adsorption kinetic data indicating chemisorption, which could be the major interaction during MB adsorption on the biomass’ surface. All results indicate that the cyanobacterial biomass can be used as an economical sorbent for MB remotion. This application provides an alternative to resolve the eutrophication problems generated by cyanobacterial growth in the swamp of Malambo. Finally, this strategy could be implemented in other locations in the Caribbean or other regions around the world where this kind of situation is present.

Author Contributions

Conceptualization, C.D.-U.; methodology, C.D.-U., B.A., K.P., V.H., E.G.-C., A.R.R.B.; software, C.D.-U., B.A., A.R.R.B., W.V., X.Z., E.S.; validation, C.D.-U., B.A., K.P., V.H.; formal analysis, C.D.-U., B.A., V.H.; investigation, C.D.-U.; resources, C.D.-U.; data curation, C.D.-U., B.A.; writing—original draft preparation, C.D.-U., B.A., A.R.R.B., W.V., X.Z., E.S.; writing—review and editing, C.D.-U., B.A., A.R.R.B., W.V., X.Z., E.S.; visualization C.D.-U., B.A., A.R.R.B., W.V., X.Z., E.S.; supervision, C.D.-U.; project administration, C.D.-U.; funding acquisition, C.D.-U. All authors have read and agreed to the published version of the manuscript.

Funding

This research was funded by Universidad del Atlántico, grant number RES. REC. No. 2169-2020.

Institutional Review Board Statement

Not applicable.

Informed Consent Statement

Not applicable.

Data Availability Statement

All data are contained within the article.

Acknowledgments

The authors thank Universidad del Atlántico. (X.Z.), and E.S. thank FONDECYT 1201880, 1180565 and ANID/FONDAP/15110019.

Conflicts of Interest

The authors declare no conflict of interest.

References

  1. Adeel, M.; Song, X.; Wang, Y.; Francis, D.; Yang, Y. Environmental impact of estrogens on human, animal and plant life: A critical review. Environ. Int. 2017, 99, 107–119. [Google Scholar] [CrossRef]
  2. Škrbić, B.D.; Kadokami, K.; Antić, I. Survey on the micro-pollutants presence in surface water system of northern Serbia and environmental and health risk assessment. Environ. Res. 2018, 166, 130–140. [Google Scholar] [CrossRef]
  3. Hanafi, M.F.; Sapawe, N. A review on the current techniques and technologies of organic pollutants removal from water/wastewater. Mater. Today Proc. 2021, 31, A158–A165. [Google Scholar] [CrossRef]
  4. Sullivan, R.C.; Levy, R.C.; Da Silva, A.M.; Pryor, S.C. Developing and diagnosing climate change indicators of regional aerosol optical properties. Sci. Rep. 2017, 7, 1–13. [Google Scholar] [CrossRef] [PubMed]
  5. W.M.O. State of the Global Climate 2020; WMO-No. 1264; WMO: Geneva, Switzerland, 2021. [Google Scholar]
  6. Webb, A.E.; van Heuven, S.M.A.C.; de Bakker, D.M.; van Duyl, F.C.; Reichart, G.-J.; de Nooijer, L.J. Combined Effects of Experimental Acidification and Eutrophication on Reef Sponge Bioerosion Rates. Front. Mar. Sci. 2017, 4, 311. [Google Scholar] [CrossRef] [Green Version]
  7. Govers, L.L.; Lamers, L.P.M.; Bouma, T.J.; de Brouwer, J.H.F.; van Katwijk, M.M. Eutrophication threatens Caribbean seagrasses—An example from Curaçao and Bonaire. Mar. Pollut. Bull. 2014, 89, 481–486. [Google Scholar] [CrossRef]
  8. Visser, P.M.; Verspagen, J.M.H.; Sandrini, G.; Stal, L.J.; Matthijs, H.C.P.; Davis, T.W.; Paerl, H.W.; Huisman, J. How rising CO2 and global warming may stimulate harmful cyanobacterial blooms. Harmful Algae 2016, 54, 145–159. [Google Scholar] [CrossRef] [PubMed] [Green Version]
  9. WHO. Toxic Cyanobacteria in Water: A Guide to Their Public Health Consequences, Monitoring and Management, 2nd ed.; Chorus, I., Welker, M., Eds.; CRC Press: New York, NY, USA, 2021. [Google Scholar]
  10. Salleh, M.A.M.; Mahmoud, D.K.; Karim, W.A.W.A.; Idris, A. Cationic and anionic dye adsorption by agricultural solid wastes: A comprehensive review. Desalination 2011, 280, 1–13. [Google Scholar] [CrossRef]
  11. Zhou, Y.; Lu, J.; Zhou, Y.; Liu, Y. Recent advances for dyes removal using novel adsorbents: A review. Environ. Pollut. 2019, 252, 352–365. [Google Scholar] [CrossRef]
  12. Hao, O.J.; Kim, H.; Chiang, P.C. Decolorization of wastewater. Crit. Rev. Environ. Sci. Technol. 2000, 30, 449–505. [Google Scholar] [CrossRef]
  13. Bayomie, O.S.; Kandeel, H.; Shoeib, T.; Yang, H.; Youssef, N.; El-Sayed, M.M.H. Novel approach for effective removal of methylene blue dye from water using fava bean peel waste. Sci. Rep. 2020, 10, 1–10. [Google Scholar]
  14. Al-Zaban, M.I.; Mahmoud, M.A.; AlHarbi, M.A. Catalytic degradation of methylene blue using silver nanoparticles synthesized by honey. Saudi J. Biol. Sci. 2021, 28, 2007–2013. [Google Scholar] [CrossRef]
  15. Krosuri, A.; Wu, S.; Bashir, M.A.; Walquist, M. Efficient degradation and mineralization of methylene blue via continuous-flow electrohydraulic plasma discharge. J. Water Process Eng. 2021, 40, 101926. [Google Scholar] [CrossRef]
  16. Gemici, B.T.; Ozel, H.U.; Ozel, H.B. Removal of methylene blue onto forest wastes: Adsorption isotherms, kinetics and thermodynamic analysis. Environ. Technol. Innov. 2021, 22, 101501. [Google Scholar] [CrossRef]
  17. Aichour, A.; Zaghouane-Boudiaf, H.; Mohamed Zuki, F.B.; Kheireddine Aroua, M.; Ibbora, C.V. Low-cost, biodegradable and highly effective adsorbents for batch and column fixed bed adsorption processes of methylene blue. J. Environ. Chem. Eng. 2019, 7, 103409. [Google Scholar] [CrossRef]
  18. Afshariani, F.; Roosta, A. Experimental study and mathematical modeling of biosorption of methylene blue from aqueous solution in a packed bed of microalgae Scenedesmus. J. Clean. Prod. 2019, 225, 133–142. [Google Scholar] [CrossRef]
  19. Can-Terzi, B.; Goren, A.Y.; Okten, H.E.; Sofuoglu, S.C. Biosorption of methylene blue from water by live Lemna minor. Environ. Technol. Innov. 2021, 22, 101432. [Google Scholar] [CrossRef]
  20. Rangabhashiyam, S.; Lata, S.; Balasubramanian, P. Biosorption characteristics of methylene blue and malachite green from simulated wastewater onto Carica papaya wood biosorbent. Surf. Interfaces 2018, 10, 197–215. [Google Scholar]
  21. De Carvalho, H.P.; Huang, J.; Zhao, M.; Liu, G.; Dong, L.; Liu, X. Improvement of Methylene Blue removal by electrocoagulation/banana peel adsorption coupling in a batch system. Alex. Eng. J. 2015, 54, 777–786. [Google Scholar] [CrossRef] [Green Version]
  22. Yu, K.L.; Lee, X.J.; Ong, H.C.; Chen, W.H.; Chang, J.S.; Lin, C.S.; Show, P.L.; Ling, T.C. Adsorptive removal of cationic methylene blue and anionic Congo red dyes using wet-torrefied microalgal biochar: Equilibrium, kinetic and mechanism modeling. Environ. Pollut. 2021, 272, 115986. [Google Scholar] [CrossRef]
  23. Azam, R.; Kothari, R.; Singh, H.M.; Ahmad, S.; Ashokkumar, V.; Tyagi, V.V. Production of algal biomass for its biochemical profile using slaughterhouse wastewater for treatment under axenic conditions. Bioresour. Technol. 2020, 306, 123116. [Google Scholar] [CrossRef]
  24. Cui, Y.; Masud, A.; Aich, N.; Atkinson, J.D. Phenol and Cr(VI) removal using materials derived from harmful algal bloom biomass: Characterization and performance assessment for a biosorbent, a porous carbon, and Fe/C composites. J. Hazard. Mater. 2019, 368, 477–486. [Google Scholar] [CrossRef] [PubMed]
  25. Ani, J.U.; Akpomie, K.G.; Okoro, U.C.; Aneke, L.E.; Onukwuli, O.D.; Ujam, O.T. Potentials of activated carbon produced from biomass materials for sequestration of dyes, heavy metals, and crude oil components from aqueous environment. Appl. Water Sci. 2020, 10, 1–11. [Google Scholar] [CrossRef] [Green Version]
  26. Vahabisani, A.; An, C. Use of biomass-derived adsorbents for the removal of petroleum pollutants from water: A mini-review. Environ. Syst. Res. 2021, 10, 25. [Google Scholar] [CrossRef]
  27. Gunasundari, E.; Kumar, P.K. Adsorption isotherm, kinetics and thermodynamic analysis of Cu(II) ions onto the dried algal biomass (Spirulina platensis). J. Ind. Eng. Chem. 2017, 56, 129–144. [Google Scholar]
  28. Nithya, K.; Sathish, A.; Pradeep, K.; Kiran Baalaji, S. Algal biomass waste residues of Spirulina platensis for chromium adsorption and modeling studies. J. Environ. Chem. Eng. 2019, 7, 103273. [Google Scholar] [CrossRef]
  29. Patiño-Camelo, K.; Diaz-Uribe, C.; Gallego-Cartagena, E.; Vallejo, W.; Martinez, V.; Quiñones, C.; Hurtado, M.; Schott, E. Cyanobacterial Biomass Pigments as Natural Sensitizer for TiO2 Thin Films. Int. J. Photoenergy 2019, 2019, 1–9. [Google Scholar] [CrossRef] [Green Version]
  30. Saravanan, A.; Sundararaman, T.R.; Jeevanantham, S.; Karishma, S.; Kumar, P.S.; Yaashikaa, P.R. Effective adsorption of Cu(II) ions on sustainable adsorbent derived from mixed biomass (Aspergillus campestris and agro waste): Optimization, isotherm and kinetics study. Groundw. Sustain. Dev. 2020, 11, 100460. [Google Scholar] [CrossRef]
  31. Ayachi, F.; Kyzas, G.Z.; Aatrous, M.; Sakly, A.; Lamine, A.B. Evaluating the adsorption of Ni(II) and Cu(II) on spirulina biomass by statistical physics formalism. J. Ind. Eng. Chem. 2019, 80, 461–470. [Google Scholar] [CrossRef]
  32. Langmuir, I. The adsorption of gases on plane surfaces of glass, mica and platinum. J. Am. Chem. Soc. 1918, 40, 1361–1403. [Google Scholar] [CrossRef] [Green Version]
  33. Freundlich, H.M.F. Over the Adsorption in Solution. J. Phys. Chem. 1906, 57, 385–471. [Google Scholar]
  34. Saha, P.; Chowdhury, S.; Gupta, S.; Kumar, I. Insight into adsorption equilibrium, kinetics and thermodynamics of Malachite Green onto clayey soil of Indian origin. Chem. Eng. J. 2010, 165, 874–882. [Google Scholar] [CrossRef]
  35. Inyinbor, A.A.; Adekola, F.A.; Olatunji, G.A. Kinetics, isotherms and thermodynamic modeling of liquid phase adsorption of Rhodamine B dye onto Raphia hookerie fruit epicarp. Water Resour. Ind. 2016, 15, 14–27. [Google Scholar] [CrossRef] [Green Version]
  36. Kapoor, A.; Yang, R.T. Surface diffusion on energetically heterogeneous surfaces. AIChE J. 1989, 35, 1735–1738. [Google Scholar] [CrossRef]
  37. Benjelloun, M.; Miyah, Y.; Akdemir Evrendilek, G.; Zerrouq, F.; Lairini, S. Recent Advances in Adsorption Kinetic Models: Their Application to Dye Types. Arab. J. Chem. 2021, 14, 103031. [Google Scholar] [CrossRef]
  38. Özer, T.; Yalçın, D.; Erkaya, I.A.; Udoh, A.U. Identification and Characterization of Some Species of Cyanobacteria, Chlorophyta and BacillariophytaUsing Fourier-Transform Infrared (FTIR) Spectroscopy. IOSR J. Pharm. Biol. Sci. 2016, 11, 20–27. [Google Scholar]
  39. Coates, J. Interpretation of Infrared Spectra, A Practical Approach. In Encyclopedia of Analytical Chemistry; John Wiley & Sons, Ltd.: Hoboken, NJ, USA, 2006. [Google Scholar]
  40. Wang, S.; Baxter, L.; Fonseca, F. Biomass fly ash in concrete: SEM, EDX and ESEM analysis. Fuel 2008, 87, 372–379. [Google Scholar] [CrossRef]
  41. Guarín, J.R.; Moreno-Pirajan, J.C.; Giraldo, L. Kinetic Study of the Bioadsorption of Methylene Blue on the Surface of the Biomass Obtained from the Algae D. antarctica. J. Chem. 2018, 2018, 2124845. [Google Scholar] [CrossRef] [Green Version]
  42. Singh, J.; Kaur, G. Freundlich, Langmuir adsorption isotherms and kinetics for the removal of malachite green from aqueous solutions using agricultural waste rice straw. Int. J. Environ. Sci. 2013, 4, 250–258. [Google Scholar]
  43. Ncibi, M.C.; Mahjoub, B.; Seffen, M. Kinetic and equilibrium studies of methylene blue biosorption by Posidonia oceanica (L.) fibres. J. Hazard. Mater. 2007, 139, 280–285. [Google Scholar] [CrossRef]
  44. Moghazy, R.M. Activated biomass of the green microalga chlamydomonas variabilis as an efficient biosorbent to remove methylene blue dye from aqueous solutions. Water SA 2019, 45, 20–28. [Google Scholar] [CrossRef] [Green Version]
  45. Hameed, B.H. Spent tea leaves: A new non-conventional and low-cost adsorbent for removal of basic dye from aqueous solutions. J. Hazard. Mater. 2009, 161, 753–759. [Google Scholar] [CrossRef] [PubMed]
  46. Gupta, V.K.; Rastogi, A. Sorption and desorption studies of chromium(VI) from nonviable cyanobacterium Nostoc muscorum biomass. J. Hazard. Mater. 2008, 154, 347–354. [Google Scholar] [CrossRef] [PubMed]
  47. Deniz, F.; Karaman, S. Removal of Basic Red 46 dye from aqueous solution by pine tree leaves. Chem. Eng. J. 2011, 170, 67–74. [Google Scholar] [CrossRef]
  48. Siqueira, T.C.A.; da Silva, I.Z.; Rubio, A.J.; Bergamasco, R.; Gasparotto, F.; Paccola, E.A.S.; Yamaguchi, N.U. Sugarcane bagasse as an efficient biosorbent for methylene blue removal: Kinetics, isotherms and thermodynamics. Int. J. Environ. Res. Public Health 2020, 17, 1–13. [Google Scholar]
  49. Uddin, M.K.; Nasar, A. Walnut shell powder as a low-cost adsorbent for methylene blue dye: Isotherm, kinetics, thermodynamic, desorption and response surface methodology examinations. Sci. Rep. 2020, 10, 1–13. [Google Scholar] [CrossRef] [PubMed]
  50. Pavan, F.A.; Lima, E.C.; Dias, S.L.P.; Mazzocato, A.C. Methylene blue biosorption from aqueous solutions by yellow passion fruit waste. J. Hazard. Mater. 2008, 150, 703–712. [Google Scholar] [CrossRef]
  51. Ozudogru, Y.; Merdivan, M.; Goksan, T. Removal of methylene blue from aqueous solutions by brown alga Cystoseira barbata. Desalin. Water Treat. 2017, 62, 267–272. [Google Scholar] [CrossRef]
  52. Húmpola, P.D.; Odetti, H.S.; Fertitta, A.E.; Vicente, J.L. Thermodynamic analysis of adsorption models of phenol in liquid phase on different activated carbons. J. Chil. Chem. Soc. 2013, 58, 1541–1544. [Google Scholar] [CrossRef] [Green Version]
  53. Yang, Z.H.; Xiong, S.; Wang, B.; Li, Q.; Yang, W.C. Cr(III) adsorption by sugarcane pulp residue and biochar. J. Cent. South Univ. 2013, 20, 1319–1325. [Google Scholar] [CrossRef]
  54. Kiliç, M.; Kirbiyik, Ç.; Çepelioǧullar, Ö.; Pütün, A.E. Adsorption of heavy metal ions from aqueous solutions by bio-char, a by-product of pyrolysis. Appl. Surf. Sci. 2013, 283, 856–862. [Google Scholar] [CrossRef]
  55. Amouei, A.I.; Amooey, A.A.; Asgharzadeh, F. Cadmium Removal from Aqueous Solution by Canola Residues: Adsorption Equilibrium and Kinetics; Iranian Association of Chemical Engineers (IAChE): Tehran, Iran, 2013; Volume 10. [Google Scholar]
  56. Kannan, N.; Sundaram, M.M. Kinetics and mechanism of removal of methylene blue by adsorption on various carbons—A comparative study. Dye. Pigment. 2001, 51, 25–40. [Google Scholar] [CrossRef]
  57. Wu, Q.; Xian, Y.; He, Z.; Zhang, Q.; Wu, J.; Yang, G.; Zhang, X.; Qi, H.; Ma, J.; Xiao, Y.; et al. Adsorption characteristics of pb(ii) using biochar derived from spent mushroom substrate. Sci. Rep. 2019, 9, 1–11. [Google Scholar] [CrossRef] [Green Version]
  58. Uwamungu, J.Y.; Nartey, O.D.; Uwimpaye, F.; Dong, W.; Hu, C. Evaluating biochar impact on topramezone adsorption behavior on soil under no-tillage and rotary tillage treatments: Isotherms and kinetics. Int. J. Environ. Res. Public Health 2019, 16, 5034. [Google Scholar] [CrossRef] [PubMed] [Green Version]
  59. Nworie, F.S.; Nwabue, F.I.; Oti, W.; Mbam, E.; Nwali, B.U. Removal of methylene blue from aqueous solution using activated rice husk biochar: Adsorption isotherms, kinetics and error analysis. J. Chil. Chem. Soc. 2019, 64, 4365–4376. [Google Scholar] [CrossRef] [Green Version]
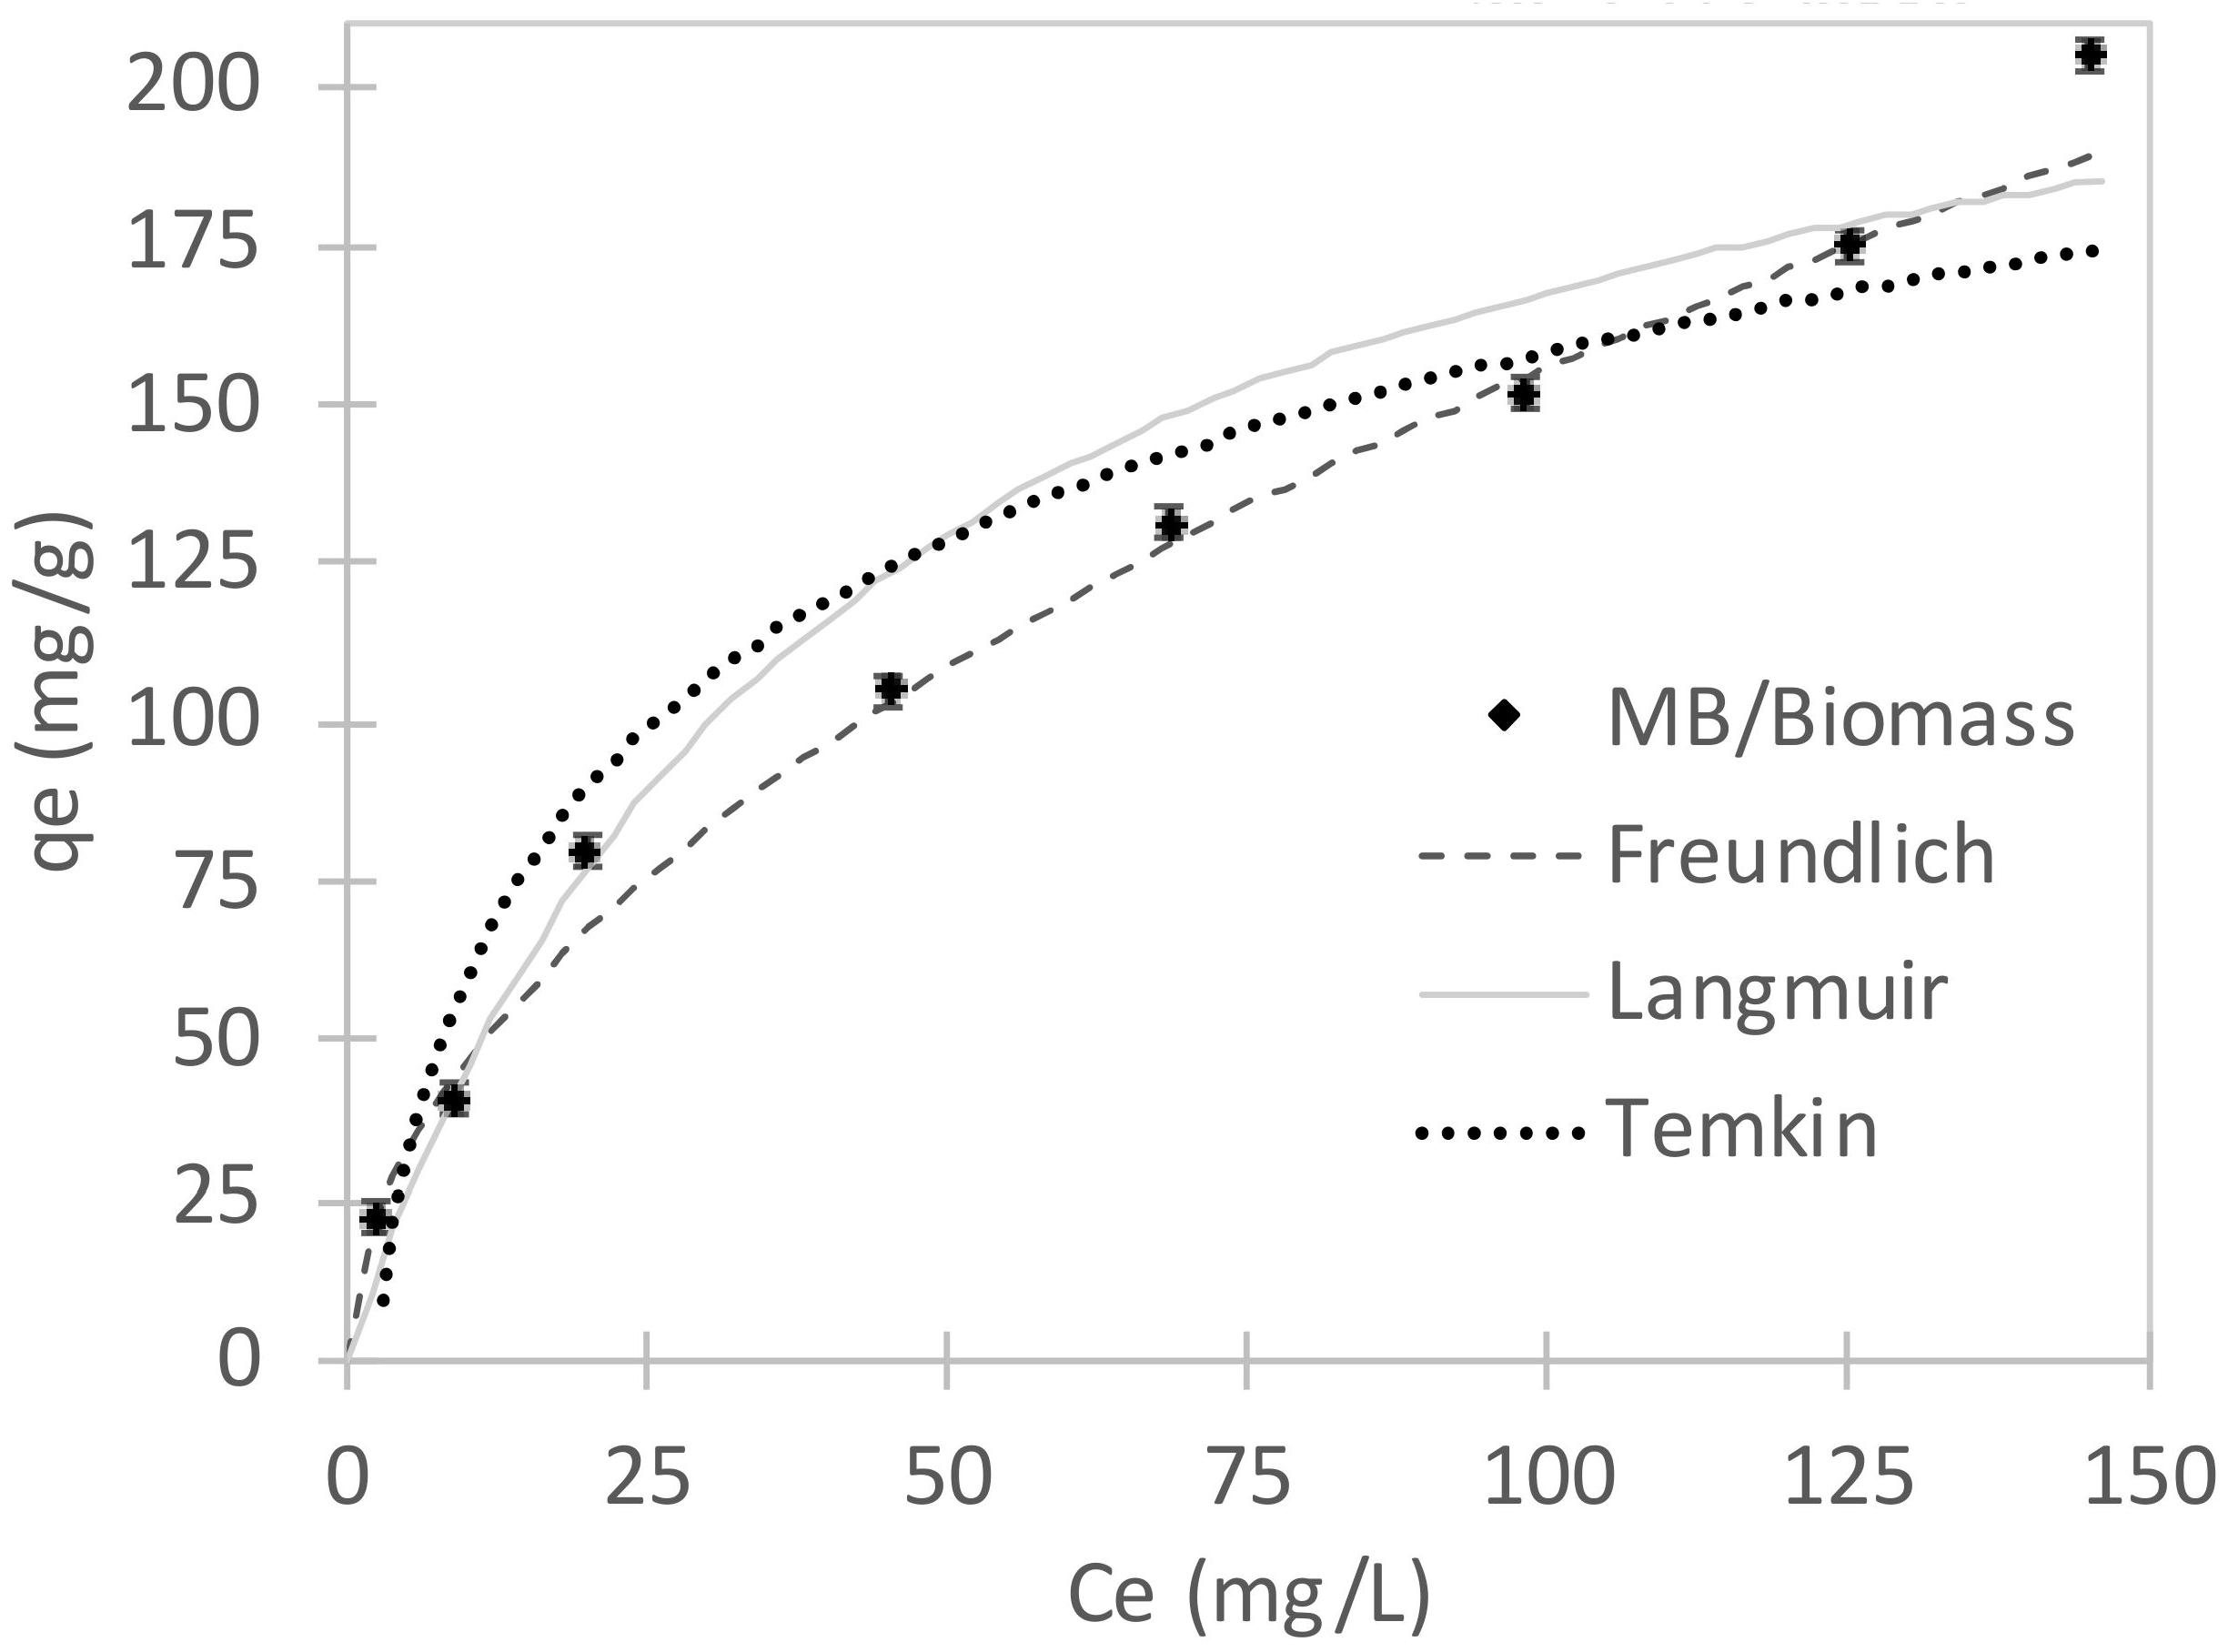
Figure 1. Location of the swamp “Ciénaga Mesolandia or Bahía”, the swamp “Ciénaga Grande de Malambo” and the swamp “Ciénaga el Convento” in the Colombian Caribbean region at the geographical coordinates 10°85′53″ N latitude and 74°75′64″ W longitude GPS Garmin Etrex 10. Click on figure for geolocation.
Water 13 03176 g001
Figure 2. General procedure. The samples were obtained from Ciénaga Grande de Malambo, and were subjected to cyanobacteria culture and biomass extraction, physical-chemical biomass treatment, characterization, and kinetic study.
Water 13 03176 g002
Figure 3. FTIR spectra of the obtained biomass (green line) and biomass/dye (blue line).
Water 13 03176 g003
Figure 4. EDX spectrum of biomass.
Water 13 03176 g004
Figure 5. Scanning electron micrographs of biomass at different magnification scales.
Water 13 03176 g005
Figure 6. The pH effect study for the %MB removal (0.001 g biomass and 100 mL of solution with 50 ppm of MB). The described system was stirred at 150 rpm under controlled temperature conditions (289 K) for 3 h).
Water 13 03176 g006
Figure 7. The adsorbent dose effect for the %MB removal (100 mL of solution with 50 ppm of MB, pH = 6.0, system was stirred at 150 rpm and kept at 289 K for 3 h).
Water 13 03176 g007
Figure 8. Effect of initial MB concentration (1.000 g of biomass, pH = 6.0, system was stirred at 150 rpm at 289 K for 3 h).
Water 13 03176 g008
Figure 9. Adsorption time effect on the %MB removal (1.000 g of biomass, 100 mL of solution with 50 ppm of MB, pH = 6.0, system was stirring at 150 rpm at 289 K).
Water 13 03176 g009
Figure 10. Fitting adsorption isotherm models for MB adsorption on biomass.
Water 13 03176 g010
Figure 11. Adsorption kinetics for MB adsorption on biomass.
Water 13 03176 g011
Table 1. Isotherm models parameters.
Isotherm ModelParameters
Langmuir 1qmax (mg g−1)
238.1
KL (L mg−1)
0.024
RLR2
0.45–0.9412
ARE (%)
12.5
Freundlich 2KF (mg g−1)(L mg−1)1/n
14.23
1/nR2
0.9913
4.8
Temkin 3A (L mg−1)
0.416
B (kJ/mol)R2
0.9181
24.7
1 Parameters according to Equation (3). 2 Parameters according to Equation (4). 3 Parameters according to Equation (5).
Table 2. Kinetic values calculated for MB sorption onto biomass.
ModelParameters
Pseudo-first-order 1qe (mg g−1)
50.95
k1 (min−1)
0.045
R2
0.9483
ARE (%)
24.8
Pseudo-second-order 2qe (mg g−1)
46.51
k2 (g.mg−1min−1)
0.013
0.99763.0
Intraparticle diffusion 3C (mg g−1)
16.55
kid (g.mg−1min−1)
2.1569
0.80799.7
1 Parameters according to Equation (8). 2 Parameters according to Equation (9). 3 Parameters according to Equation (10).
Publisher’s Note: MDPI stays neutral with regard to jurisdictional claims in published maps and institutional affiliations.

