Article

After the Storm: Fate and Leaching of Particulate Nitrogen (PN) in the Fluvial Network and the Influence of Watershed Sources and Moisture Conditions

1
Water Science & Policy Graduate Program, University of Delaware, Newark, DE 19716, USA
2
Plant & Soil Sciences, University of Delaware, Newark, DE 19716, USA
3
Stroud Water Research Center, 970 Spencer Road, Avondale, PA 19311, USA
*
Author to whom correspondence should be addressed.
Water 2021, 13(22), 3182; https://doi.org/10.3390/w13223182
Submission received: 27 September 2021 / Revised: 31 October 2021 / Accepted: 6 November 2021 / Published: 11 November 2021

Abstract

:
Large storms can erode, transport, and deposit substantial amounts of particulate nitrogen (PN) in the fluvial network. The fate of this input and its consequence for water quality is poorly understood. This study investigated the transformation and leaching of PN using a 56-day incubation experiment with five PN sources: forest floor humus, upland mineral A horizon, stream bank, storm deposits, and stream bed. Experiments were subjected to two moisture regimes: continuously moist and dry–wet cycles. Sediment and porewater samples were collected through the incubation and analyzed for N and C species, as well as the quantification of nitrifying and denitrifying genes (amoA, nirS, nirK). C- and N-rich watershed sources experienced decomposition, mineralization, and nitrification and released large amounts of dissolved N, but the amount of N released varied depending on the PN source and moisture regime. Drying and rewetting stimulated nitrification and suppressed denitrification in most PN sources. Storm deposits released large amounts of porewater N regardless of the moisture conditions, indicating that they could readily act as N sources under a variety of conditions. The inputs, processing, and leaching of large, storm-driven PN inputs become increasingly important as the frequency and intensity of large storms is predicted to increase with global climate change.

1. Introduction

Nitrogen (N) is a key nutrient responsible for water quality and the impairment of surface and groundwaters worldwide [1,2]. N inputs into aquatic ecosystems can occur in both dissolved and particulate forms [3,4,5]. Historically, research generally focused on the inputs of dissolved N species such as nitrate-N, ammonium-N, and dissolved organic N (DON) since they are more bioavailable than particulate N (PN) and easily assimilated [6]. However, recent studies indicate that PN inputs can be significant and can exceed the inputs of dissolved N into streams, particularly during large tropical storms and hurricanes [3,7]. Large storms have the erosive power and transport capacity to mobilize substantial amounts of PN which can constitute a significant portion of the annual N flux in a fraction of the time [3,7,8,9,10]. Dhillon and Inamdar [7] reported that as much as 33% of the annual N flux, much of it as PN, was exported in only two days during Tropical Storm Irene in a forested watershed in the mid-Atlantic United States (US). Similarly, Inamdar et al. [8] found that PN composed 39–87% of the storm event N export with storms constituting 65% of the 2011 total PN export. Furthermore, the composition of the particulate material can also change with sediment sources and storm magnitude [11,12,13,14,15]. Previous studies showed that, typically, near-stream sources dominate the particulate material for low-energy, small-to-moderate storm events, while contributions from distal or upland mineral soils increase with the largest storms [13,14,16,17]. While dissolved N inputs are immediately available for aquatic organisms, PN inputs can also decompose, leach, and serve as a longer-term source of N for aquatic ecosystems.
PN that enters the stream network is subject to processing that can result in the leaching, transformation, and sequestration of N. Thus, large storm events could represent critical “hot moments” [18] of PN inputs, and the deposited PN could create “hot spots” [19] of biogeochemical activity where inputs are transformed into dissolved and bioavailable forms of N and contribute to eutrophication and changes in aquatic metabolism [20,21]. Deposited PN may also be metabolized to gaseous N (nitrous oxide N2O and N2), and thus contribute to greenhouse gas emissions. Low-order streams, in particular, are important sites for processing and N removal [22,23,24], but these processes can be highly variable, and sensitive to environmental conditions that control residence time, temperature, oxygen supply, microbial community structure and function, and moisture conditions [23,24,25,26,27]. Fluvial N processing is particularly sensitive to moisture content and drying and rewetting cycles were shown to spur the intense decomposition, mineralization and release of carbon (C) and N [28,29,30]. The processing of N and leaching in the stream network can also be affected by the sources of PN and their composition [14,23,25,31]. The ability of the aquatic mechanisms to regulate the PN loads may be affected by recurring droughts and high-intensity storms, both of which are predicted to increase in severity and frequency due to global climate change [32]. To fully understand the environmental impact of storm inputs of PN on aquatic ecosystems, it is imperative that we assess how watershed PN sources and varying moisture conditions affect the fate and processing of PN in the fluvial network.
To address this knowledge gap we determined the fate of PN through a 56 day mesocosm incubation experiment using five PN sources and two moisture regimes. The PN sources were identified based on our previous studies [14,15] and included three distinct sources from a forested watershed—forest floor humus, upland mineral A horizon soil, and stream bank soil, and two mixed sources from the stream or fluvial network—along with floodplain storm deposit (hereafter storm deposit) and stream bed sediments. Incubations were performed for continuously moist conditions (regime 1) and a variable regime with distinct drying and wetting phases (regime 2). Porewater and sediment samples were collected at selected time points during the incubation and analyzed for total C and N, nitrate-N, ammonium-N, and DON and dissolved organic C (DOC). While our focus was on N, the organic C component was also included for a comprehensive assessment. In addition, abundances of nitrifying and denitrifying microbial genes (i.e., amoA, nirS, and nirK) were also assessed for two of the five sources: forest floor humus and storm deposit. These data were used to address the following key questions: How do watershed sources of PN and moisture conditions affect sediment and porewater N transformations and leaching? How do the porewater N values vary temporally through the incubation? Which PN sources are sources or sinks of N? We hypothesized that: (a) PN sources with elevated N content will leach N more readily and act as N sources; (b) the drying and rewetting moisture regime will result in greater N release and leaching from watershed PN sources; and (c) mineralization followed by nitrification will be the primary N pathway resulting in the leaching of N.

2. Materials and Methods

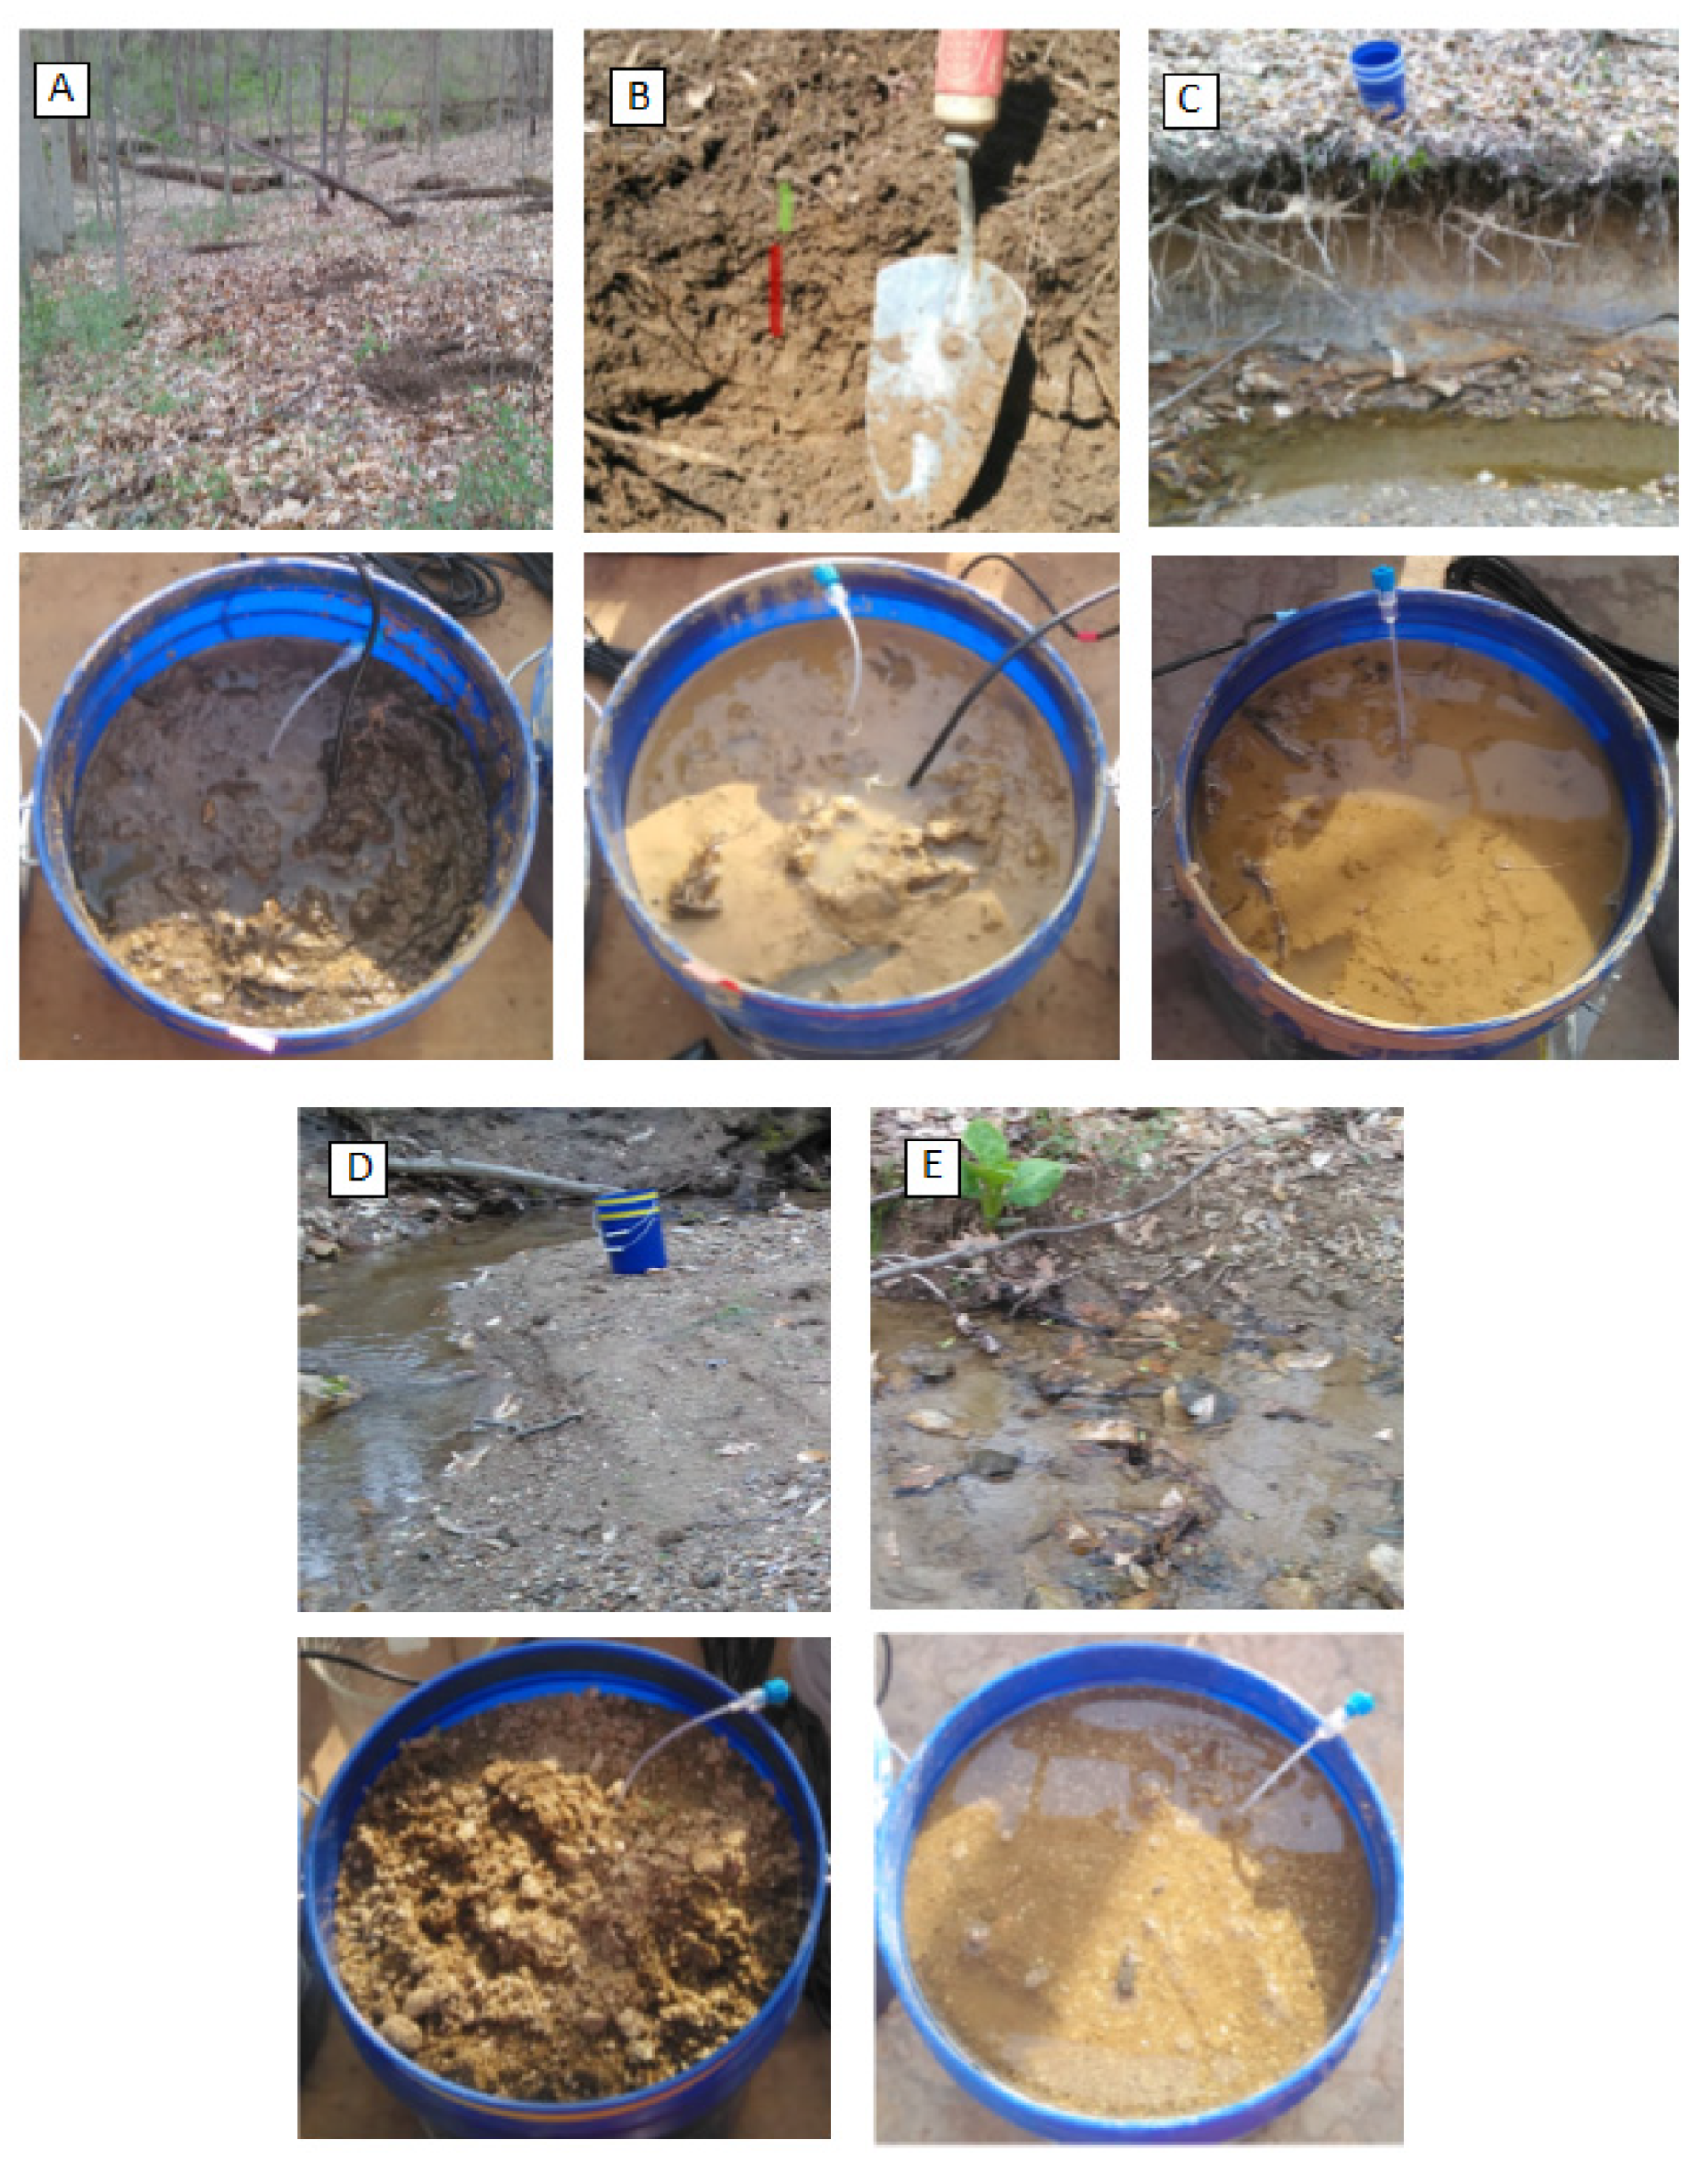
2.1. Incubation Setup and Sampling

Watershed PN sources for the incubation experiment were collected from a 79-ha forested, Piedmont watershed in Maryland which was extensively studied and described in Dhillon and Inamdar [7], Johnson et al. [14] and Rowland et al. [15]. Soils are deep, well-drained, coarse loamy, mixed, mesic Lithic Inceptisols that overlay the Mount Cuba Wissahickon Formation, which is primarily comprised of pelitic gneiss and schist with portions of pegmatite and amphibolite [33]. The forest has a mean stand age of 60 years with the deciduous canopy principally comprised of Fagus grandifolia (American beech), Liriodendron tulipifera (yellow poplar), and Acer rubrum (red maple).
Specific PN sources sampled included: forest floor humus, upland mineral A horizon soil, and stream bank soil (combination of exposed A and B horizons), and "mixed" sources included floodplain storm deposit and stream bed. These sources were selected based on our previous sampling studies and end-member mixing analysis for PN in this forested watershed [14,15]. To account for source heterogeneity, three to six locations were selected to collect samples for each of the five sources. Forest floor humus and upland mineral soil A were collected from the upland portions of the watershed. Stream bank, storm deposits, and stream bed were derived from the channel portion. Storm deposits were collected from floodplain sediments beside the stream channel, while stream bed material was collected from within the flowing stream channel. Large rocks and debris, plant stems or roots, and/or organic material greater than 2 mm was removed and the soil was manually mixed and homogenized to create a composite sample.
Storm deposit and stream bed sources were presumed to have already undergone mixing with runoff waters and were used as collected. The remaining three PN sources—forest floor humus, upland mineral A horizon soil, and stream bank soil, were mixed with baseflow stream water for 20 min in a mixing tub to simulate runoff mixing prior to placement in the incubation columns (Figure 1). Incubation columns were leached with high-density polyethylene (HDPE) 2-gallon buckets (23.5 cm tall, 23.5 cm in diameter; Figure 1). Replicates were created for each of the five sources for a total of 20 columns for each of the two moisture regimes simulated (total 40 columns). All columns were filled with the same depth/volume of sediment and particulate material at the start of the experiment and columns were weighed to determine the mass of the sediments (empty weight of buckets was subtracted).
All incubation columns were fitted with Soilmoisture Equipment Corp Micro-Rhizon sampler (1908D series; SoilMoisture Equipment Corp., Santa Barbara, CA, USA.) to collect pore water samples. The micro-rhizon samplers were installed approximately 5 cm below the surface of the incubation sediment at a 45° angle. One column for each of the PN source-regime treatment combination was also fitted with Decagon 5TM (Decagon Devices Inc., Pullman, WA, USA.) dual moisture and temperature probes to record soil moisture and temperature associated with the treatment. All columns were housed in the greenhouse at the Stroud Water Research Center, Avondale, PA. Incubation air temperature conditions were recorded at 15 min intervals throughout the experiment by EnviroDIY Mayfly Data Loggers (Stroud Water Research Center, Avondale, PA, USA). Mean temperatures ranged between 20–22 °C. Ambient air temperature and humidity were measured and recorded on sample collection days. Additional details are available in Krieg [34].
Two contrasting moisture treatments were applied to the incubation columns. Regime 1 sediments were frequently re-wetted with “small” rewetting events to represent moist or wet conditions in the stream. Regime 2 incubation sediments were allowed to dry and then re-wetted at day 25 with a “large” rewetting event, and then rewetted with the same “small” rewetting events of regime 1 until day 56. Typically, the small watering events ranged between 300–500 mL applied to the columns over a period of 30 min. The “large” rewetting event applied on day 25 represented a substantial precipitation event that would lead to uniform inundation across all sediment types and was applied to both regime 1 and 2 sediments. To achieve this, all columns were watered until inundated with ~1 cm standing water for a period of 30 min. Treatment water was added to columns in volume increments of 300 mL at a time. This “large” rewetting event used 600–1500 mL per incubation column and took place over a 3 h period. Treatment water used for the “small” and “large” rewetting events was filtered (Sterlitech 0.22 µm, Auburn, WA, USA) stream water collected during baseflow conditions from the second-order stream that drained the 79 ha watershed. Dissolved N concentrations for the second-order forested stream were previously described in [8] and were generally below 2 mgN/L for nitrate-N and below 0.5 mg/L for DON. Ammonium-N concentrations were below detection.
Two types of samples were collected from the incubation samples throughout the experiment: porewater and sediment cores. Extraction syringes were connected to the micro-rhizon samplers during pore water extraction samplings using a Luer-lock system and clear PVC tubing. For pore water collection, a vacuum was applied to the micro-rhizon samplers and, once vacuum was lost or the syringe was filled, the sample was decanted to a clean 250 mL HDPE bottle and the vacuum was reapplied until enough sample was collected. Filtration before refrigeration storage was not needed due to the 0.15 µm porosity of the micro-rhizon samplers, which effectively removed microbes from the sample during collection. Porewater collection occurred 4 times (day 0, day 26, day 33, and day 50) throughout the incubation. Sediment samples were collected 6 times (days 0, 4, 25, 26, 45, and 56). Sediment cores were extracted using a ¼” inner diameter aluminum pipe. After sample collection, the core hole was filled with heat-treated bentonite to prevent oxygenation without altering the sediment chemistry of the column.

2.2. Pore Water and Sediment Analysis and Microbial Gene Quantification

Porewater DOC and total dissolved N (TDN) were determined using a Shimadzu TOC-L analyzer (Columbia, MD, USA). Porewater nitrate-N (EPA-129-A Rev. 8) and ammonium-N (EPA-148-A Rev. 2) concentrations were determined on an AQ2 Discrete Analyzer (Seal Analytical, Mequon, WI, USA). DON was determined by the difference of TDN and inorganic N species. Sediment samples were analyzed for % TC and TN by combustion on an Elementar TC/TN analyzer (Ronkonkoma, NY, USA).
Two watershed sources out of the five, forest floor humus and storm deposit, were selected for microbial analysis because they represented distinctly different PN and leachate chemistry (based on data from this study itself), which allowed for the comparison of a C- and N-rich upland source versus a mixed source. Quantitative PCR (qPCR) analysis for nitrification and denitrification was performed using QuantStudioTM 6- Flex Real-Time PCR System (ThermoFisher, Waltham, MA, USA) with SYBR-Green I fluorescent dye. Primers were selected to measure the abundance of genes associated with nitrification and denitrification, specifically Arch-amoAf and Arch-amoAR [35] for ammonia oxidizing archea (AOA); amoA-1F and amoA-2R [36] for ammonia oxidizing bacteria (AOB); and nirS1R and nirS6R [37], and nirK583f and nirK5R [38] for denitrifying microbes (nirS and nirK).

2.3. Data Analysis and Comparisons Performed

To overcome the effects of dilution due to water additions and evaporative concentration during sediment drying, measured porewater concentrations (mg/L) were converted to masses (mg) using the equation:
C   o r   N   ( mg ) = C   o r   N   ( mg L ) × ( π × D 2 4 ) 1000 × % VWC
where %VWC is the volumetric water content recorded by the soil moisture probes during the incubation, D is the diameter (cm) and h (cm) is the height of the sediment column during incubation. These masses were then compared among incubation sources and moisture regimes. For sediments, direct comparisons of %TC and %TN were performed among sources and moisture treatments. Microbial abundance for nitrifying and denitrifying genes was compared using copy numbers.
In addition to the porewater N and C masses and their temporal variations through the incubation period, the net change in dissolved C and N mass was also determined by subtracting the measured mass value at day 50 from the starting value at day 0 and dividing the difference by the starting sediment weight of the source. This allowed us to investigate how various sources affected the porewater mass per unit weight of the source. Positive values were interpreted as the net increase (source/release) of porewater nutrient mass over the incubation period, while negative values (consumption/sink) were interpreted as net decreases. The differences were examined using ANOVAs, Tukey HSD, and Student’s t test.

3. Results

In the following, we describe the moisture conditions and compare the N and C values and the nitrifying and denitrifying gene abundances for watershed sources and moisture regimes. Specific comparisons include: the start and end N mass values, temporal patterns for porewater N and C values through the incubation period, the net change in porewater masses, and nitrification/denitrification potentials (inferred by gene abundances) for the individual sources.

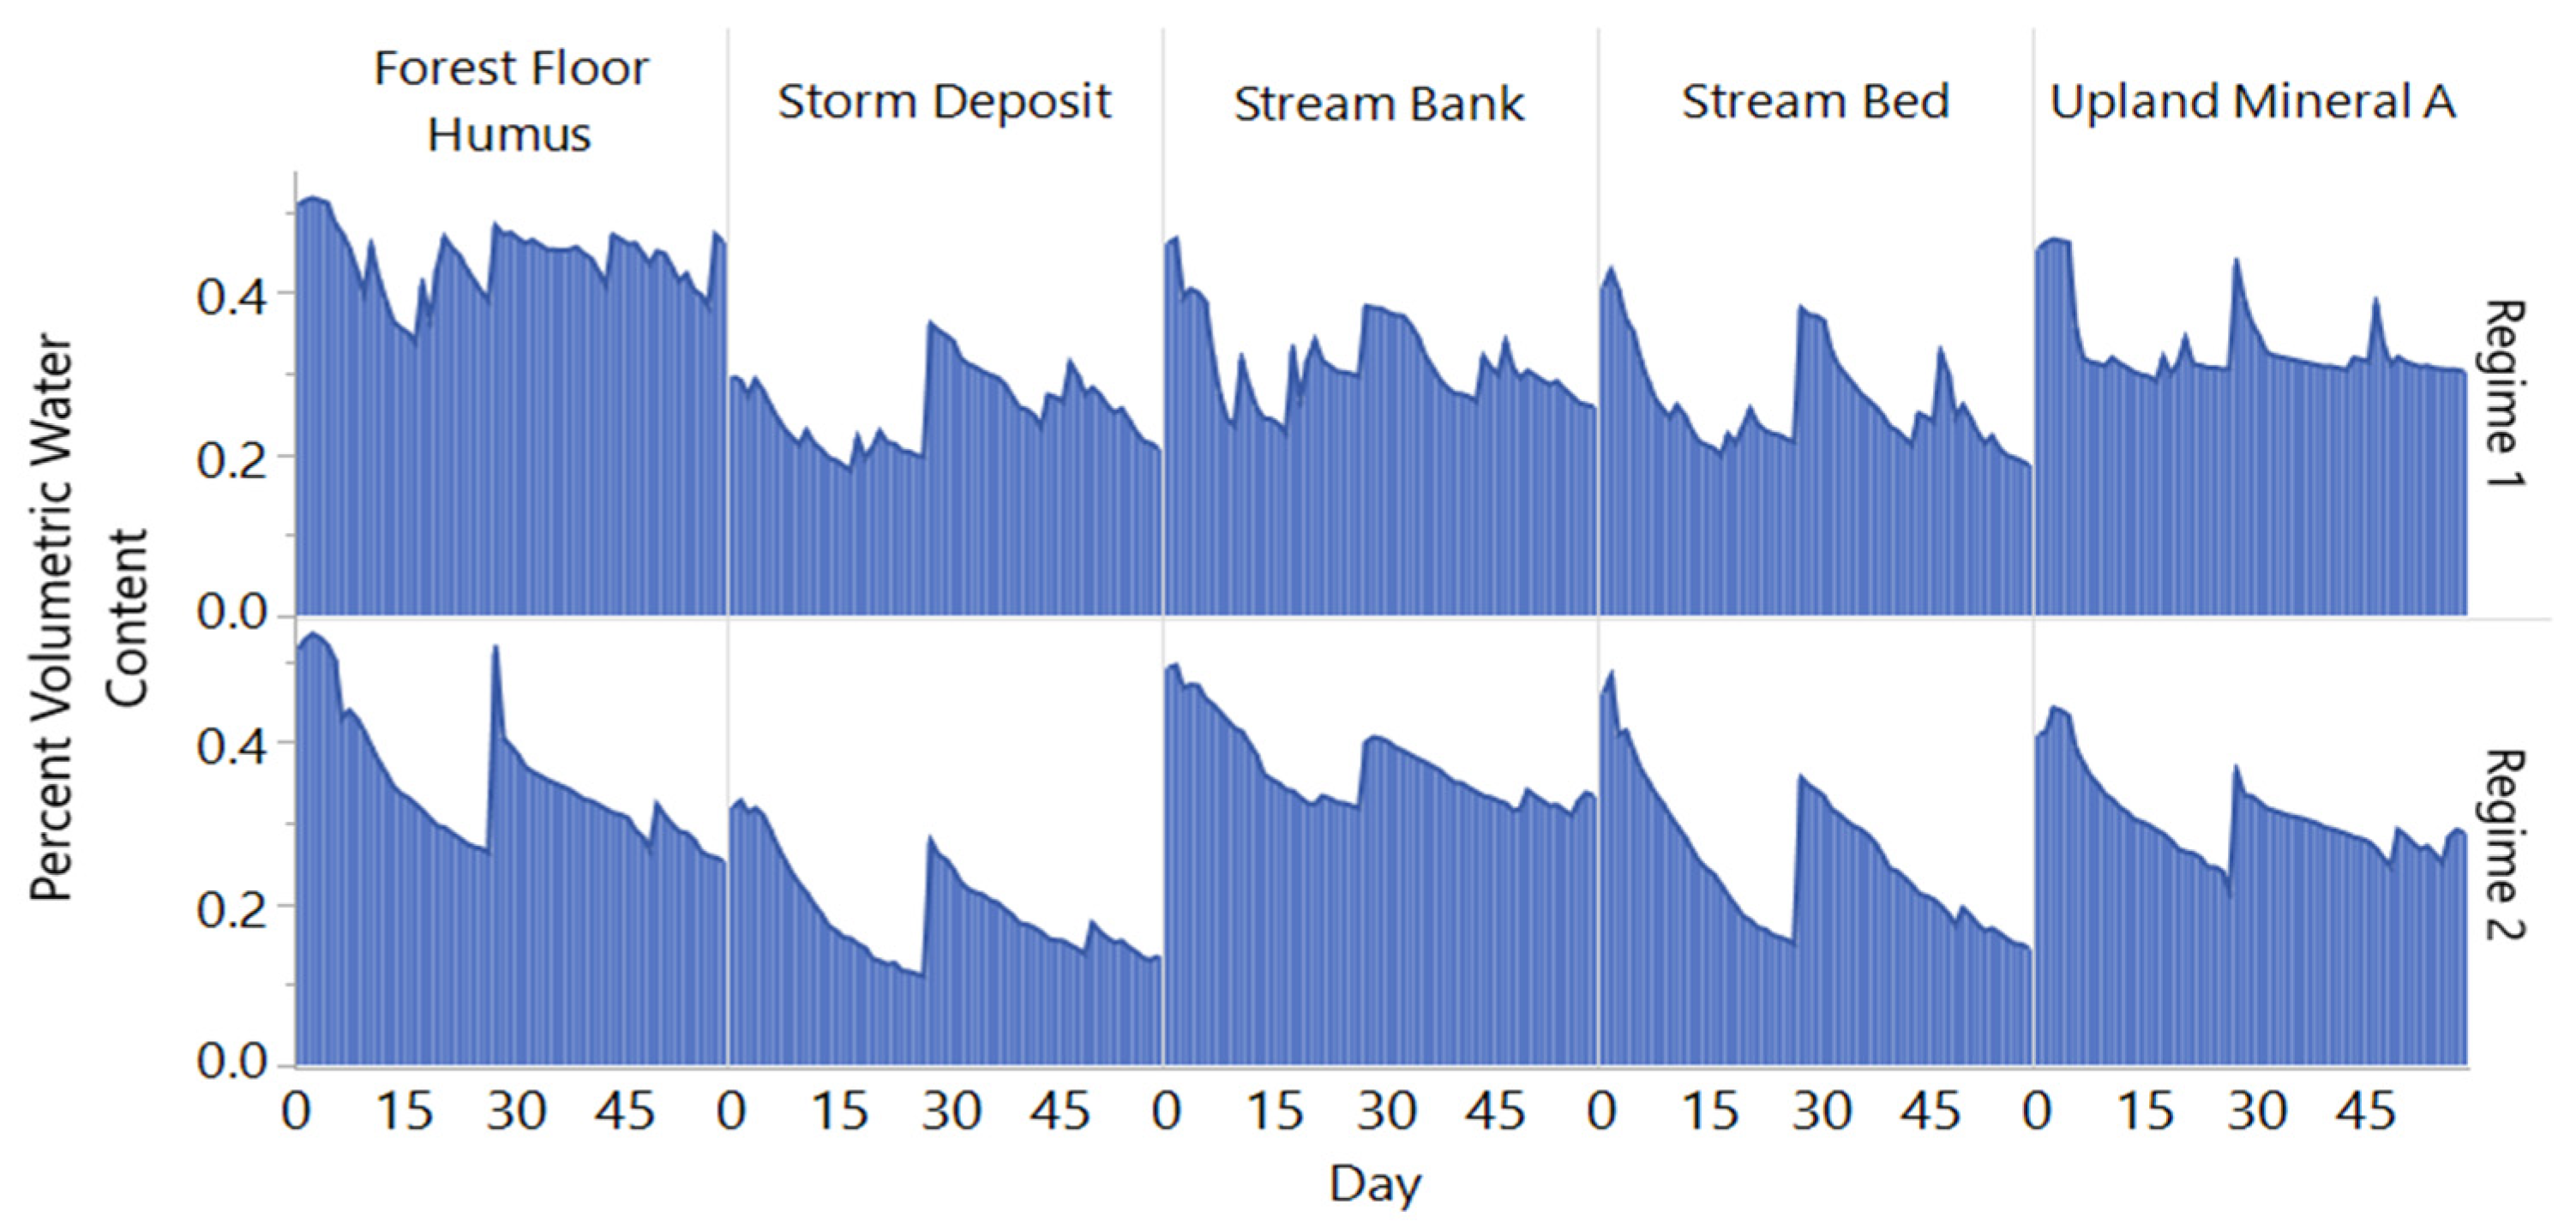
3.1. Moisture Variation for Incubation Regimes

The moisture profile for regime 1 was characterized by small changes in %VWC, while the moisture profile for regime 2 exhibited a drying phase from day 0 to day 25, a sharp increase at day 25 (during water additions; wetting), followed by decline and minor change for the rest of the incubation period (Figure 2). Forest floor and upland mineral A horizon soil sources appeared to be the most ineffective in retaining the most moisture and storm deposit. The storm deposit and stream bed indicated lower moisture conditions. When regime 1 was compared to regime 2, the moisture treatments resulted in significantly different moisture profiles for forest floor humus (p ≤0.0001), storm deposit (p ≤ 0.0001), stream bank soil (p ≤ 0.0001), and upland mineral A horizon soil (p = 0.0051), but no differences for stream bed (p = 0.3773).

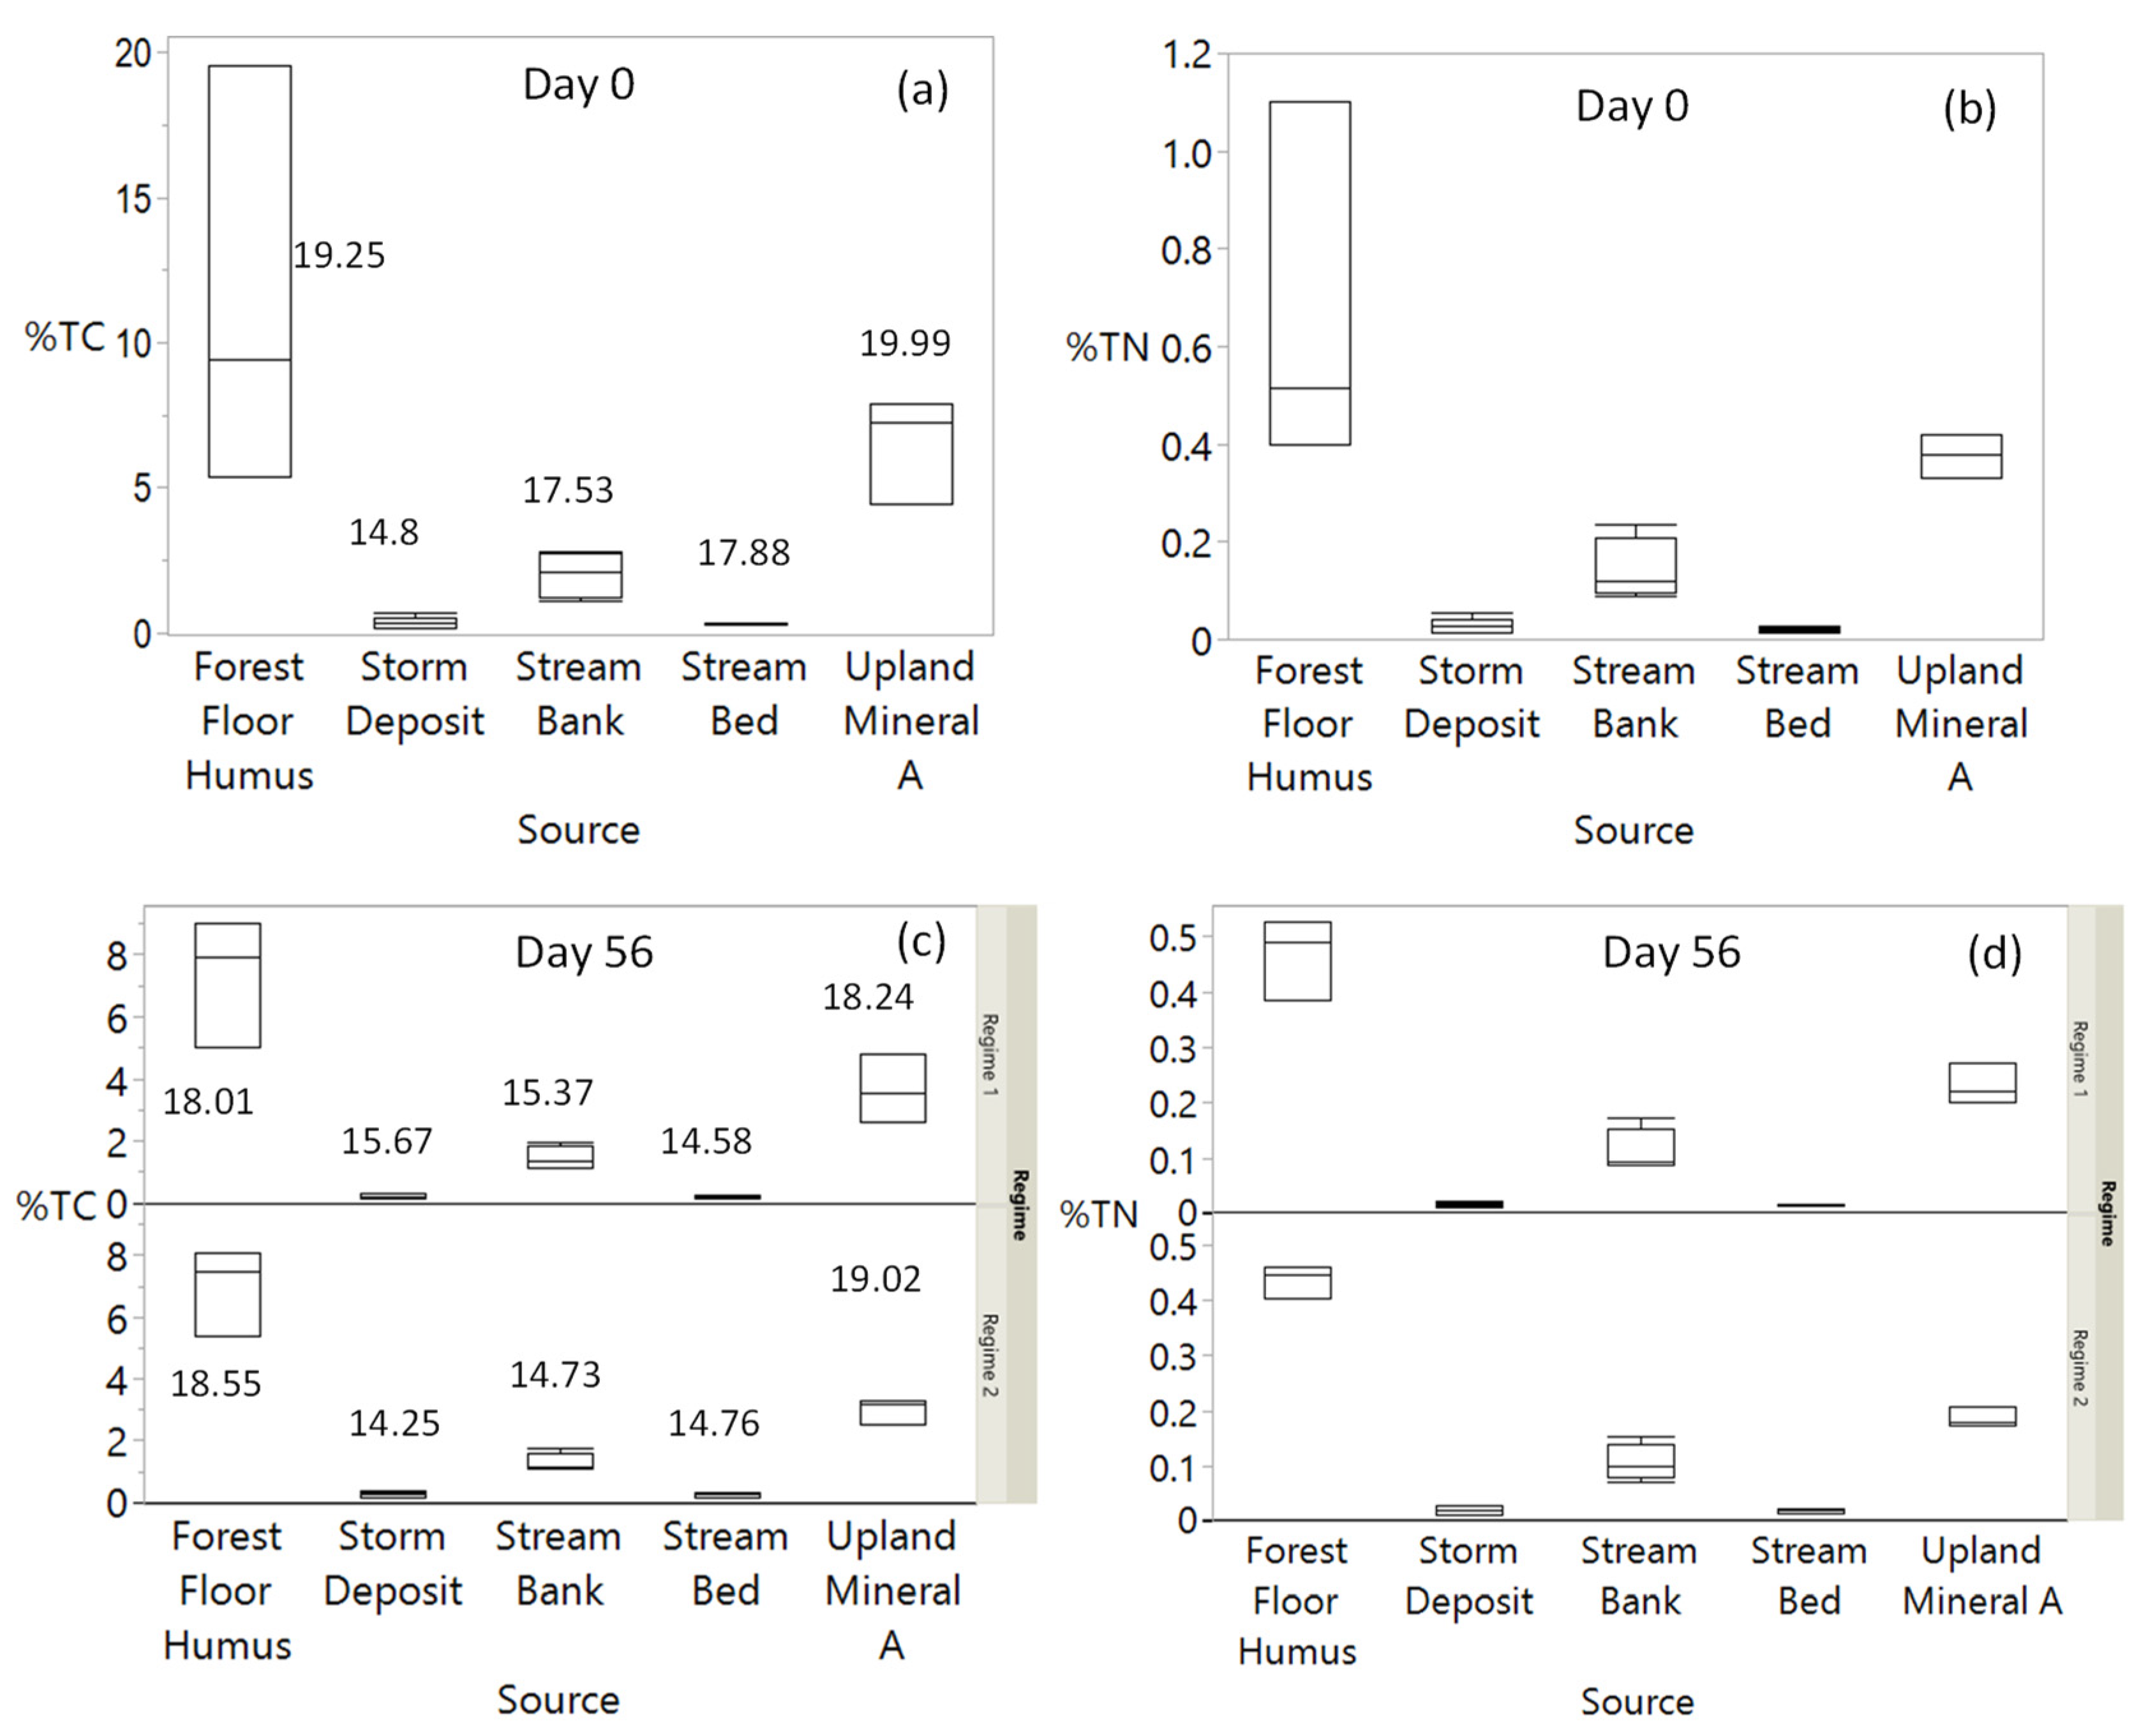
3.2. Changes in Sediment %TC and TN

At the beginning of the incubation, forest floor humus had the highest mean %TC and %TN concentration (11.4 and 0.67%, respectively), followed by, in order: upland mineral A soil (6.5 and 0.37%), stream bank soil (2 and 0.14%), storm deposit (0.35 and 0.02%) and stream bed (0.3 and 0.02%, Figure 3). The %TC and %TN values for the forest floor and upland mineral A soil were significantly (α level of 0.05) different from each other and from the other three sources (which were not significantly different from each other). In addition, at the start of the incubation, the forest floor humus and upland mineral A horizon soil sources had the highest mean molar C:N ratios (19.25 and 19.99, respectively, Figure 3) which were significantly different from the stream bed (17.88), stream bank soil (17.53) and storm deposit (14.80) values. At the end of the incubation (day 56), nearly all sources had lower %TC and %TN values than the starting values for both moisture regimes (Figure 3).

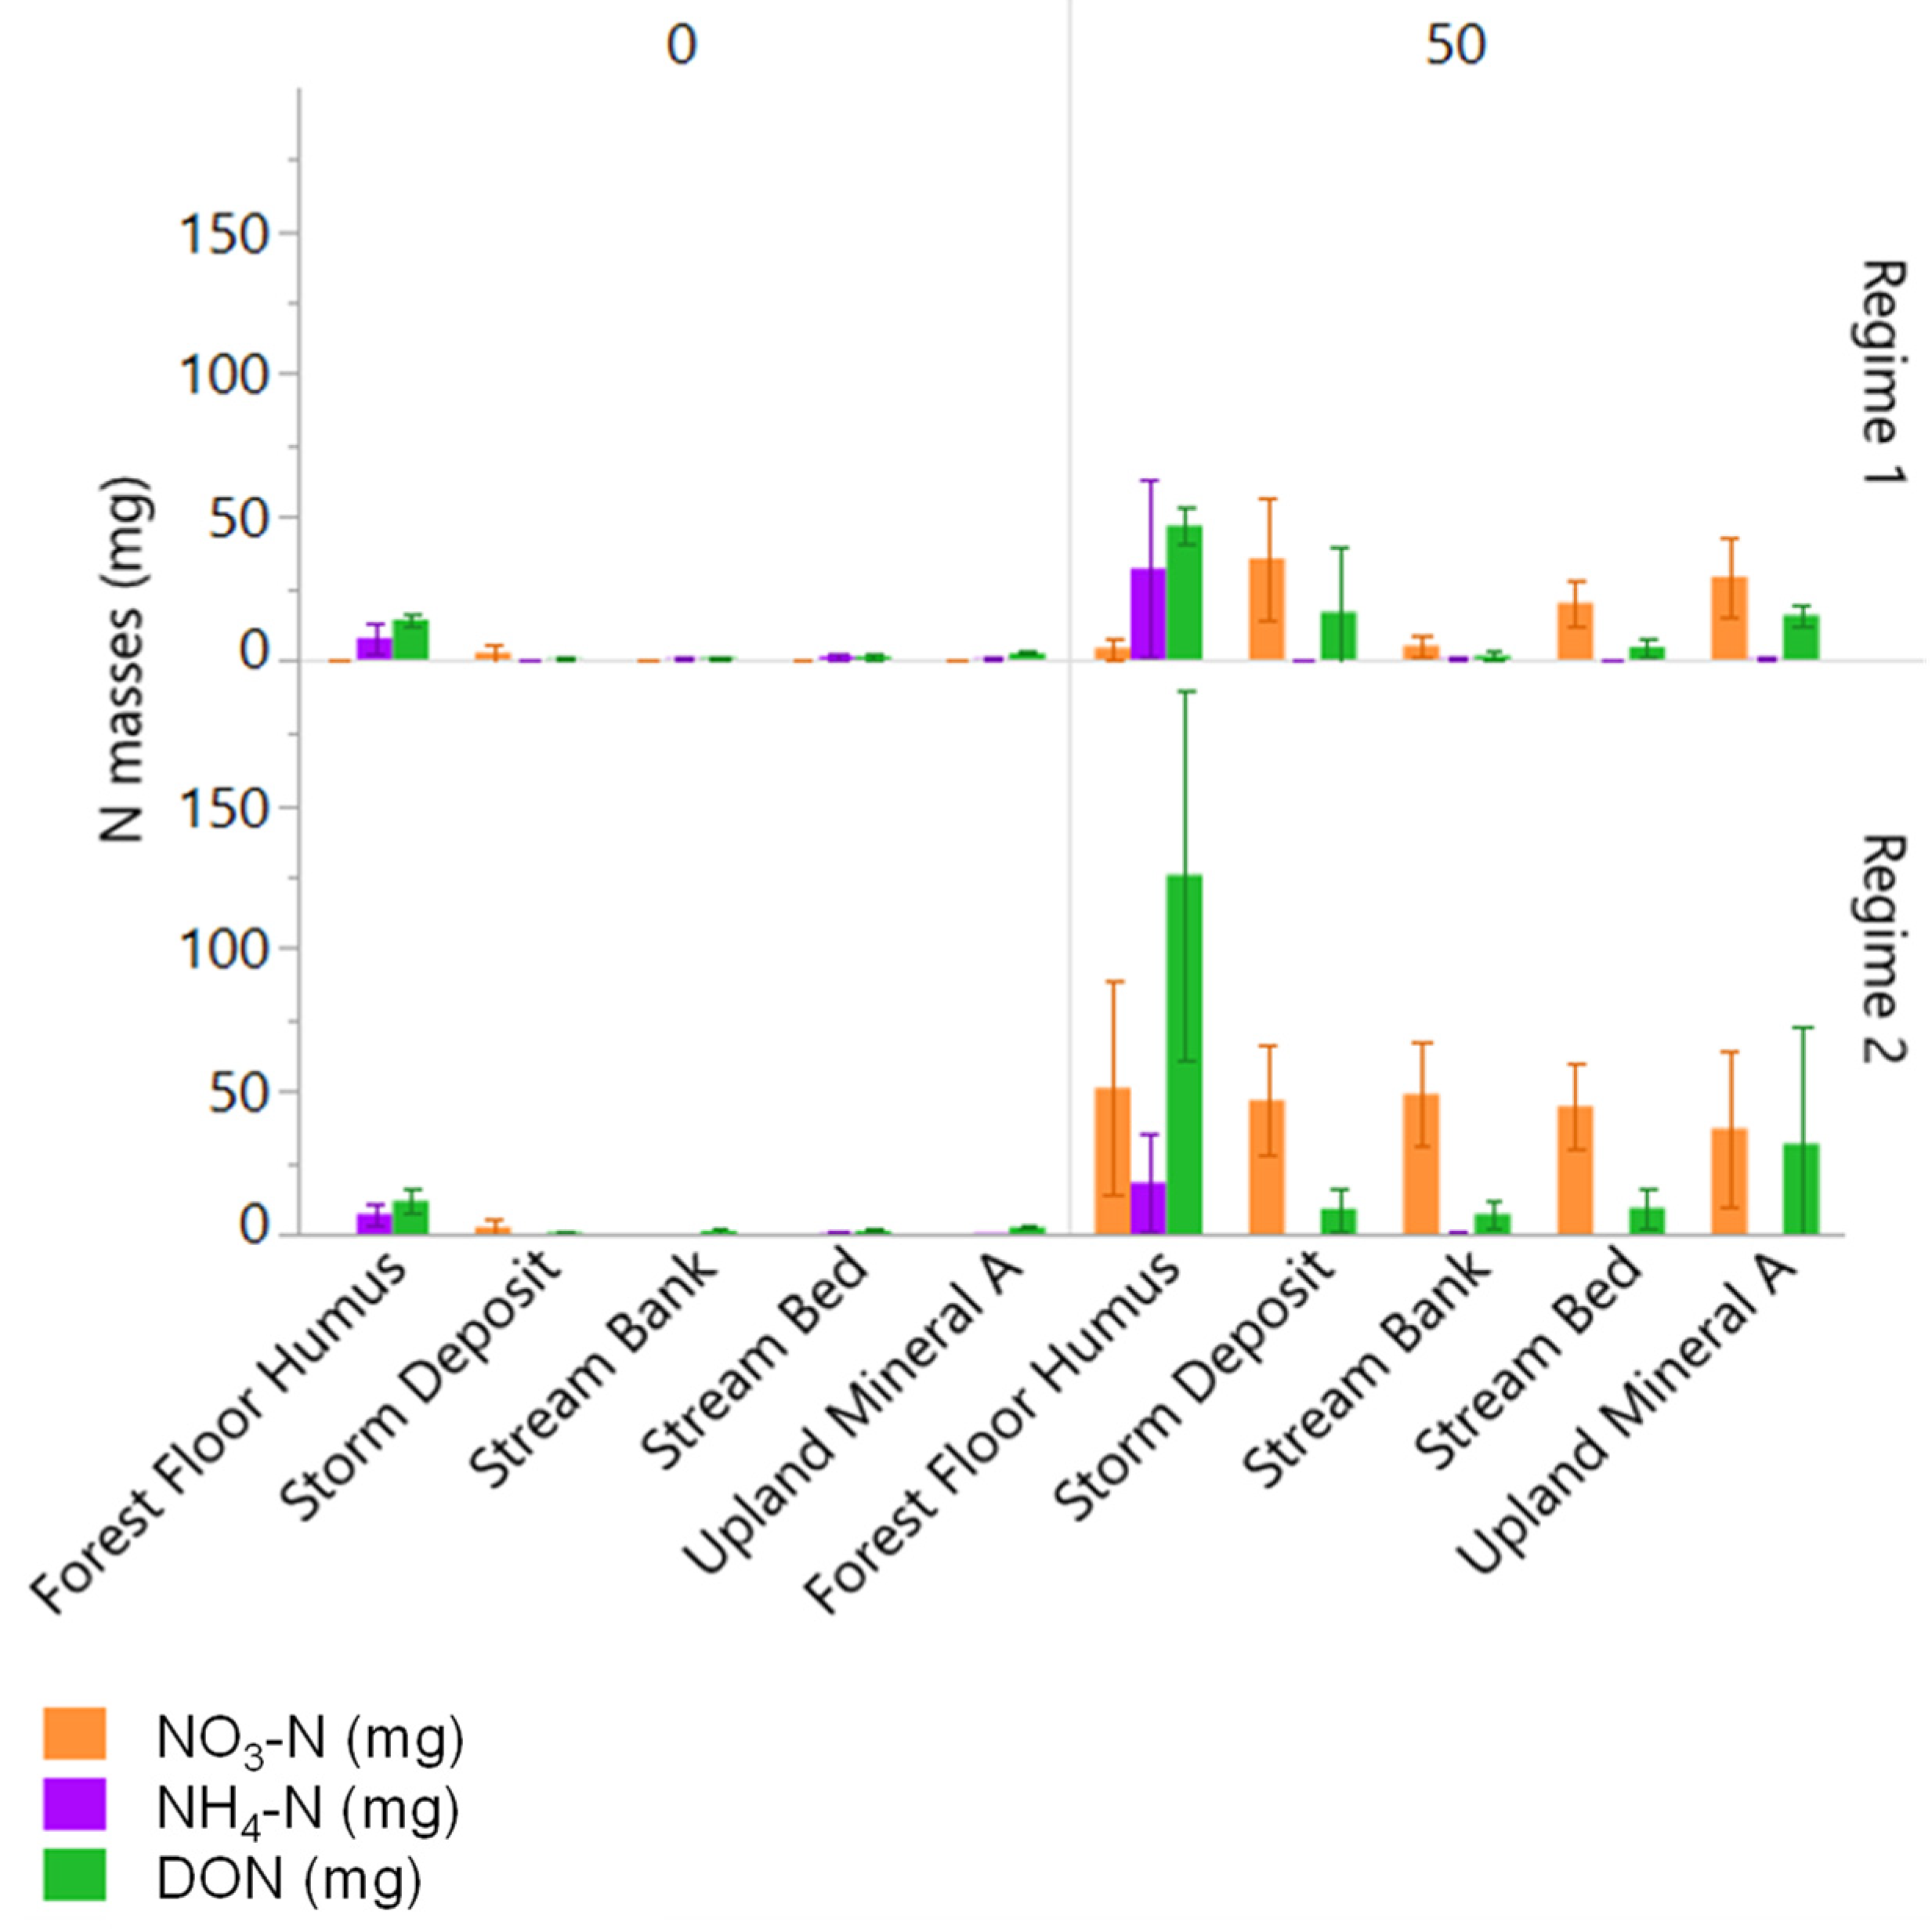
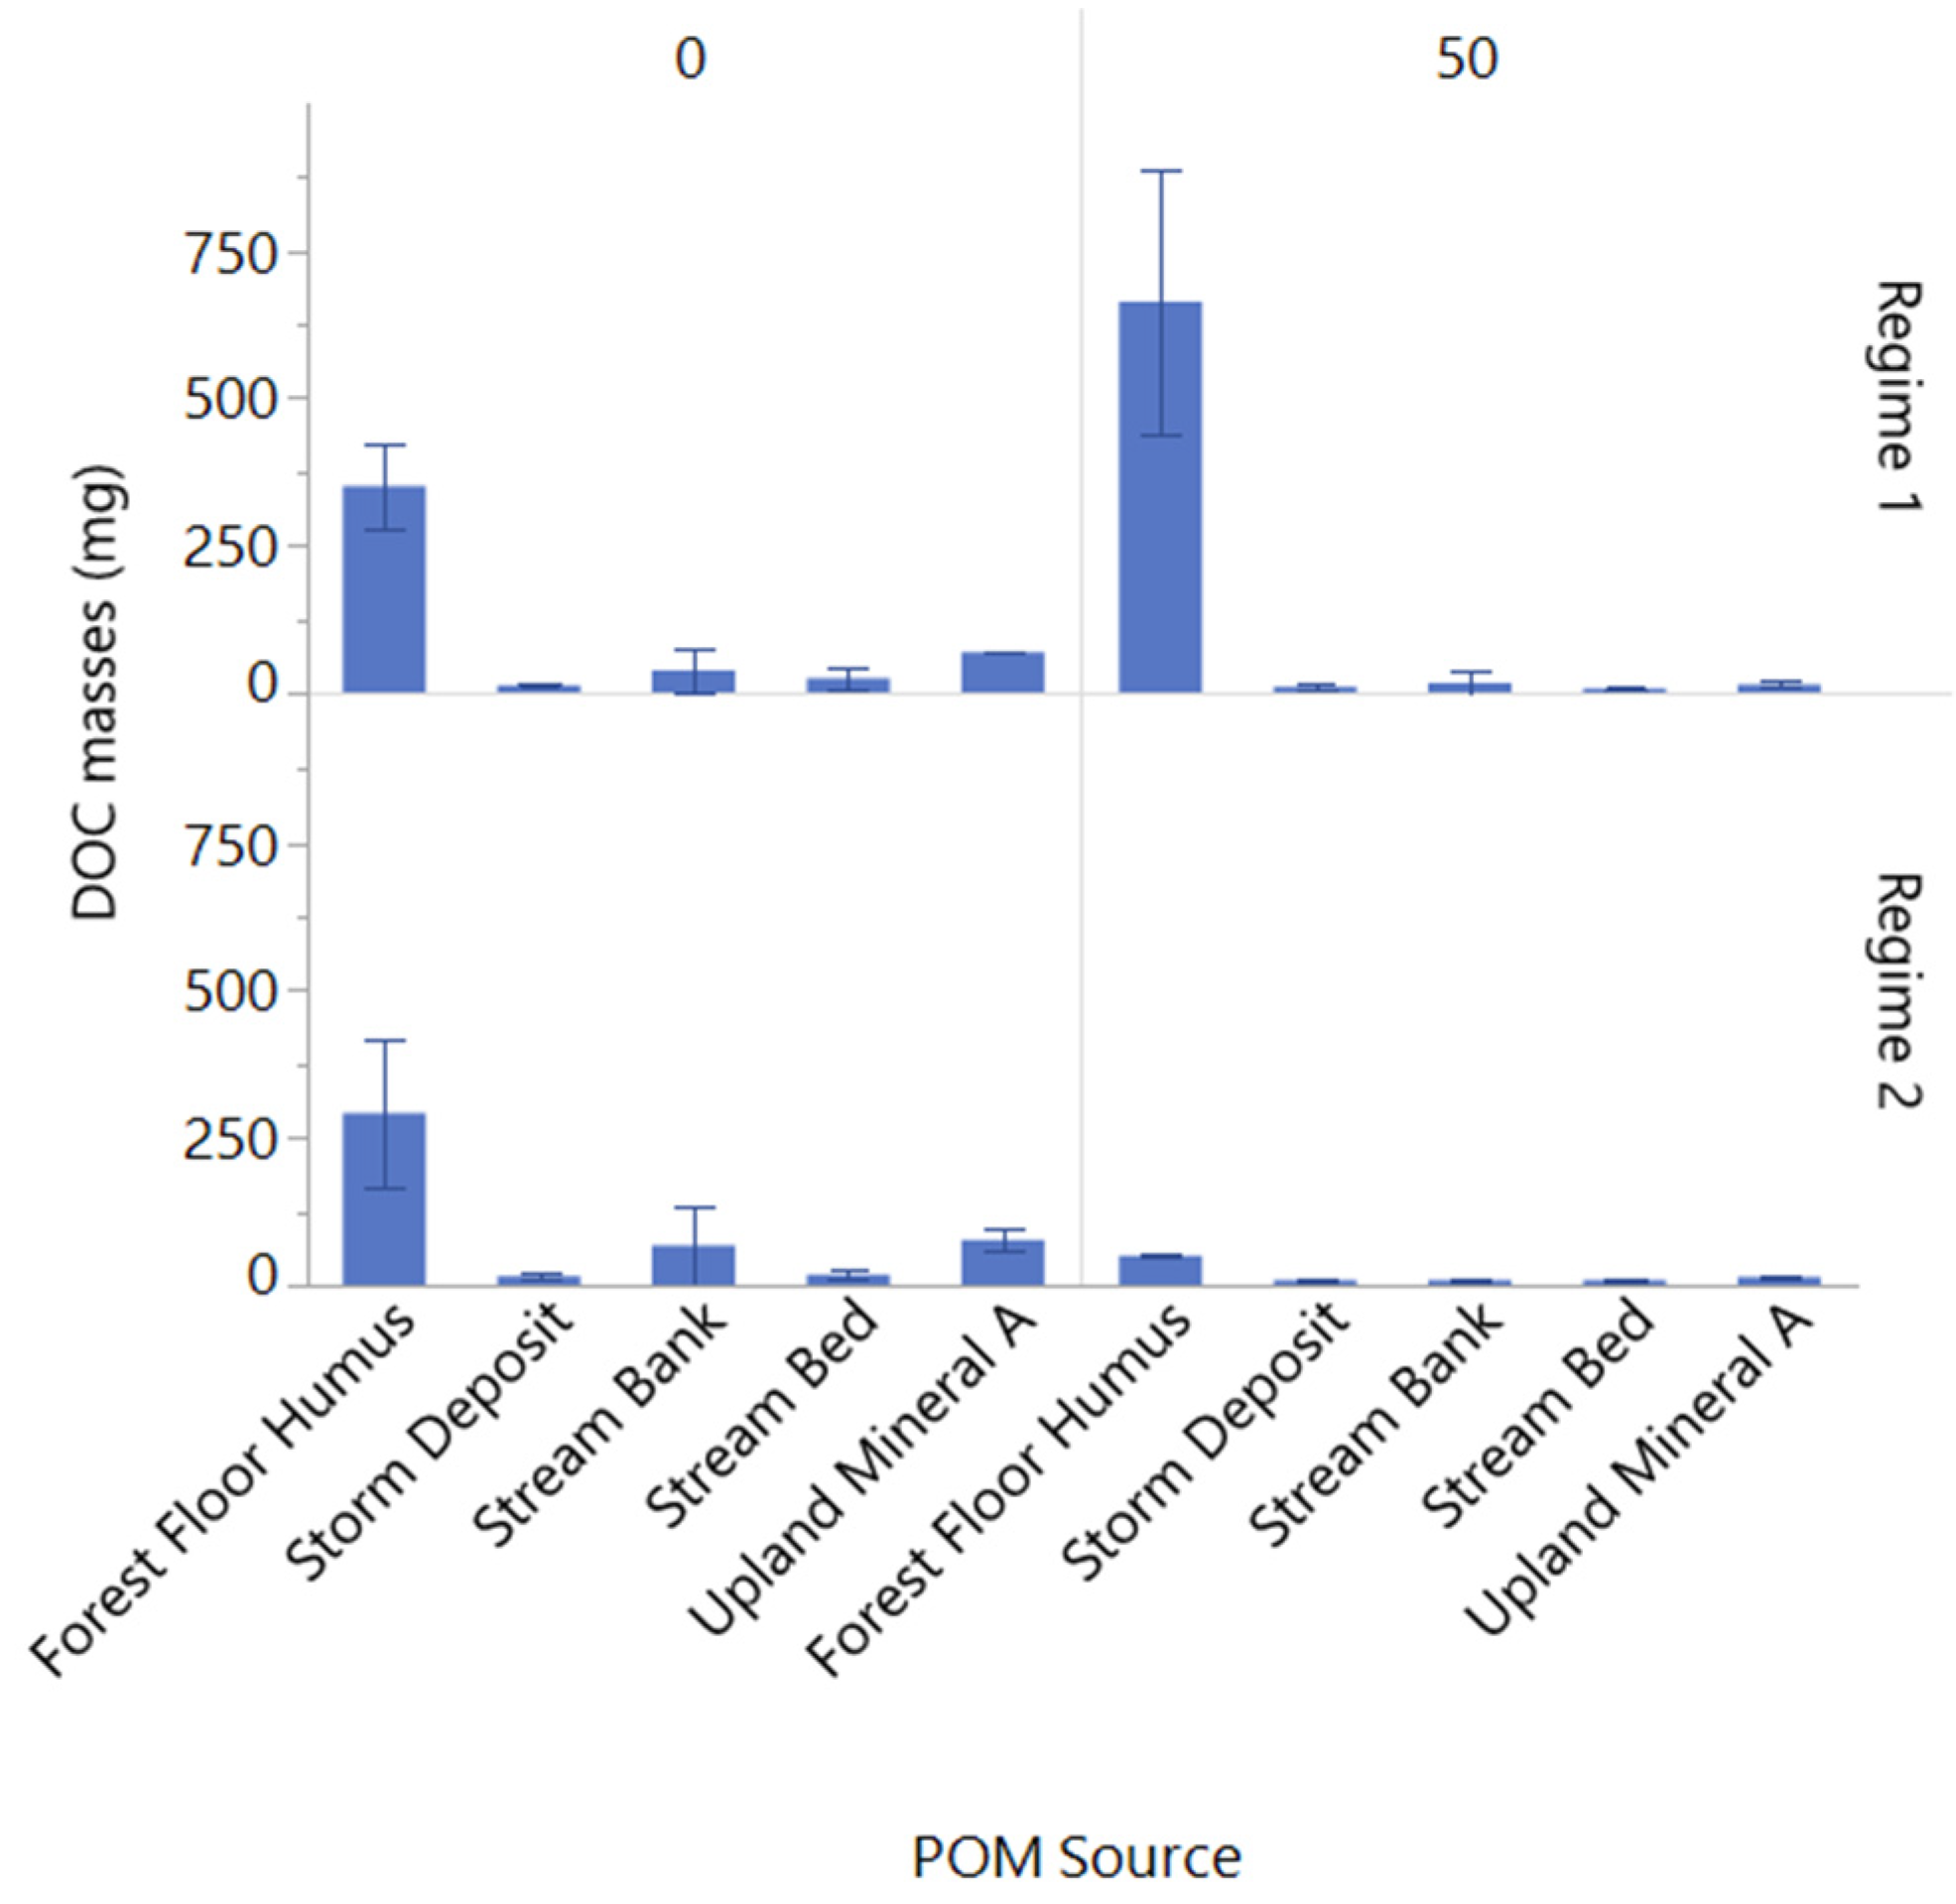
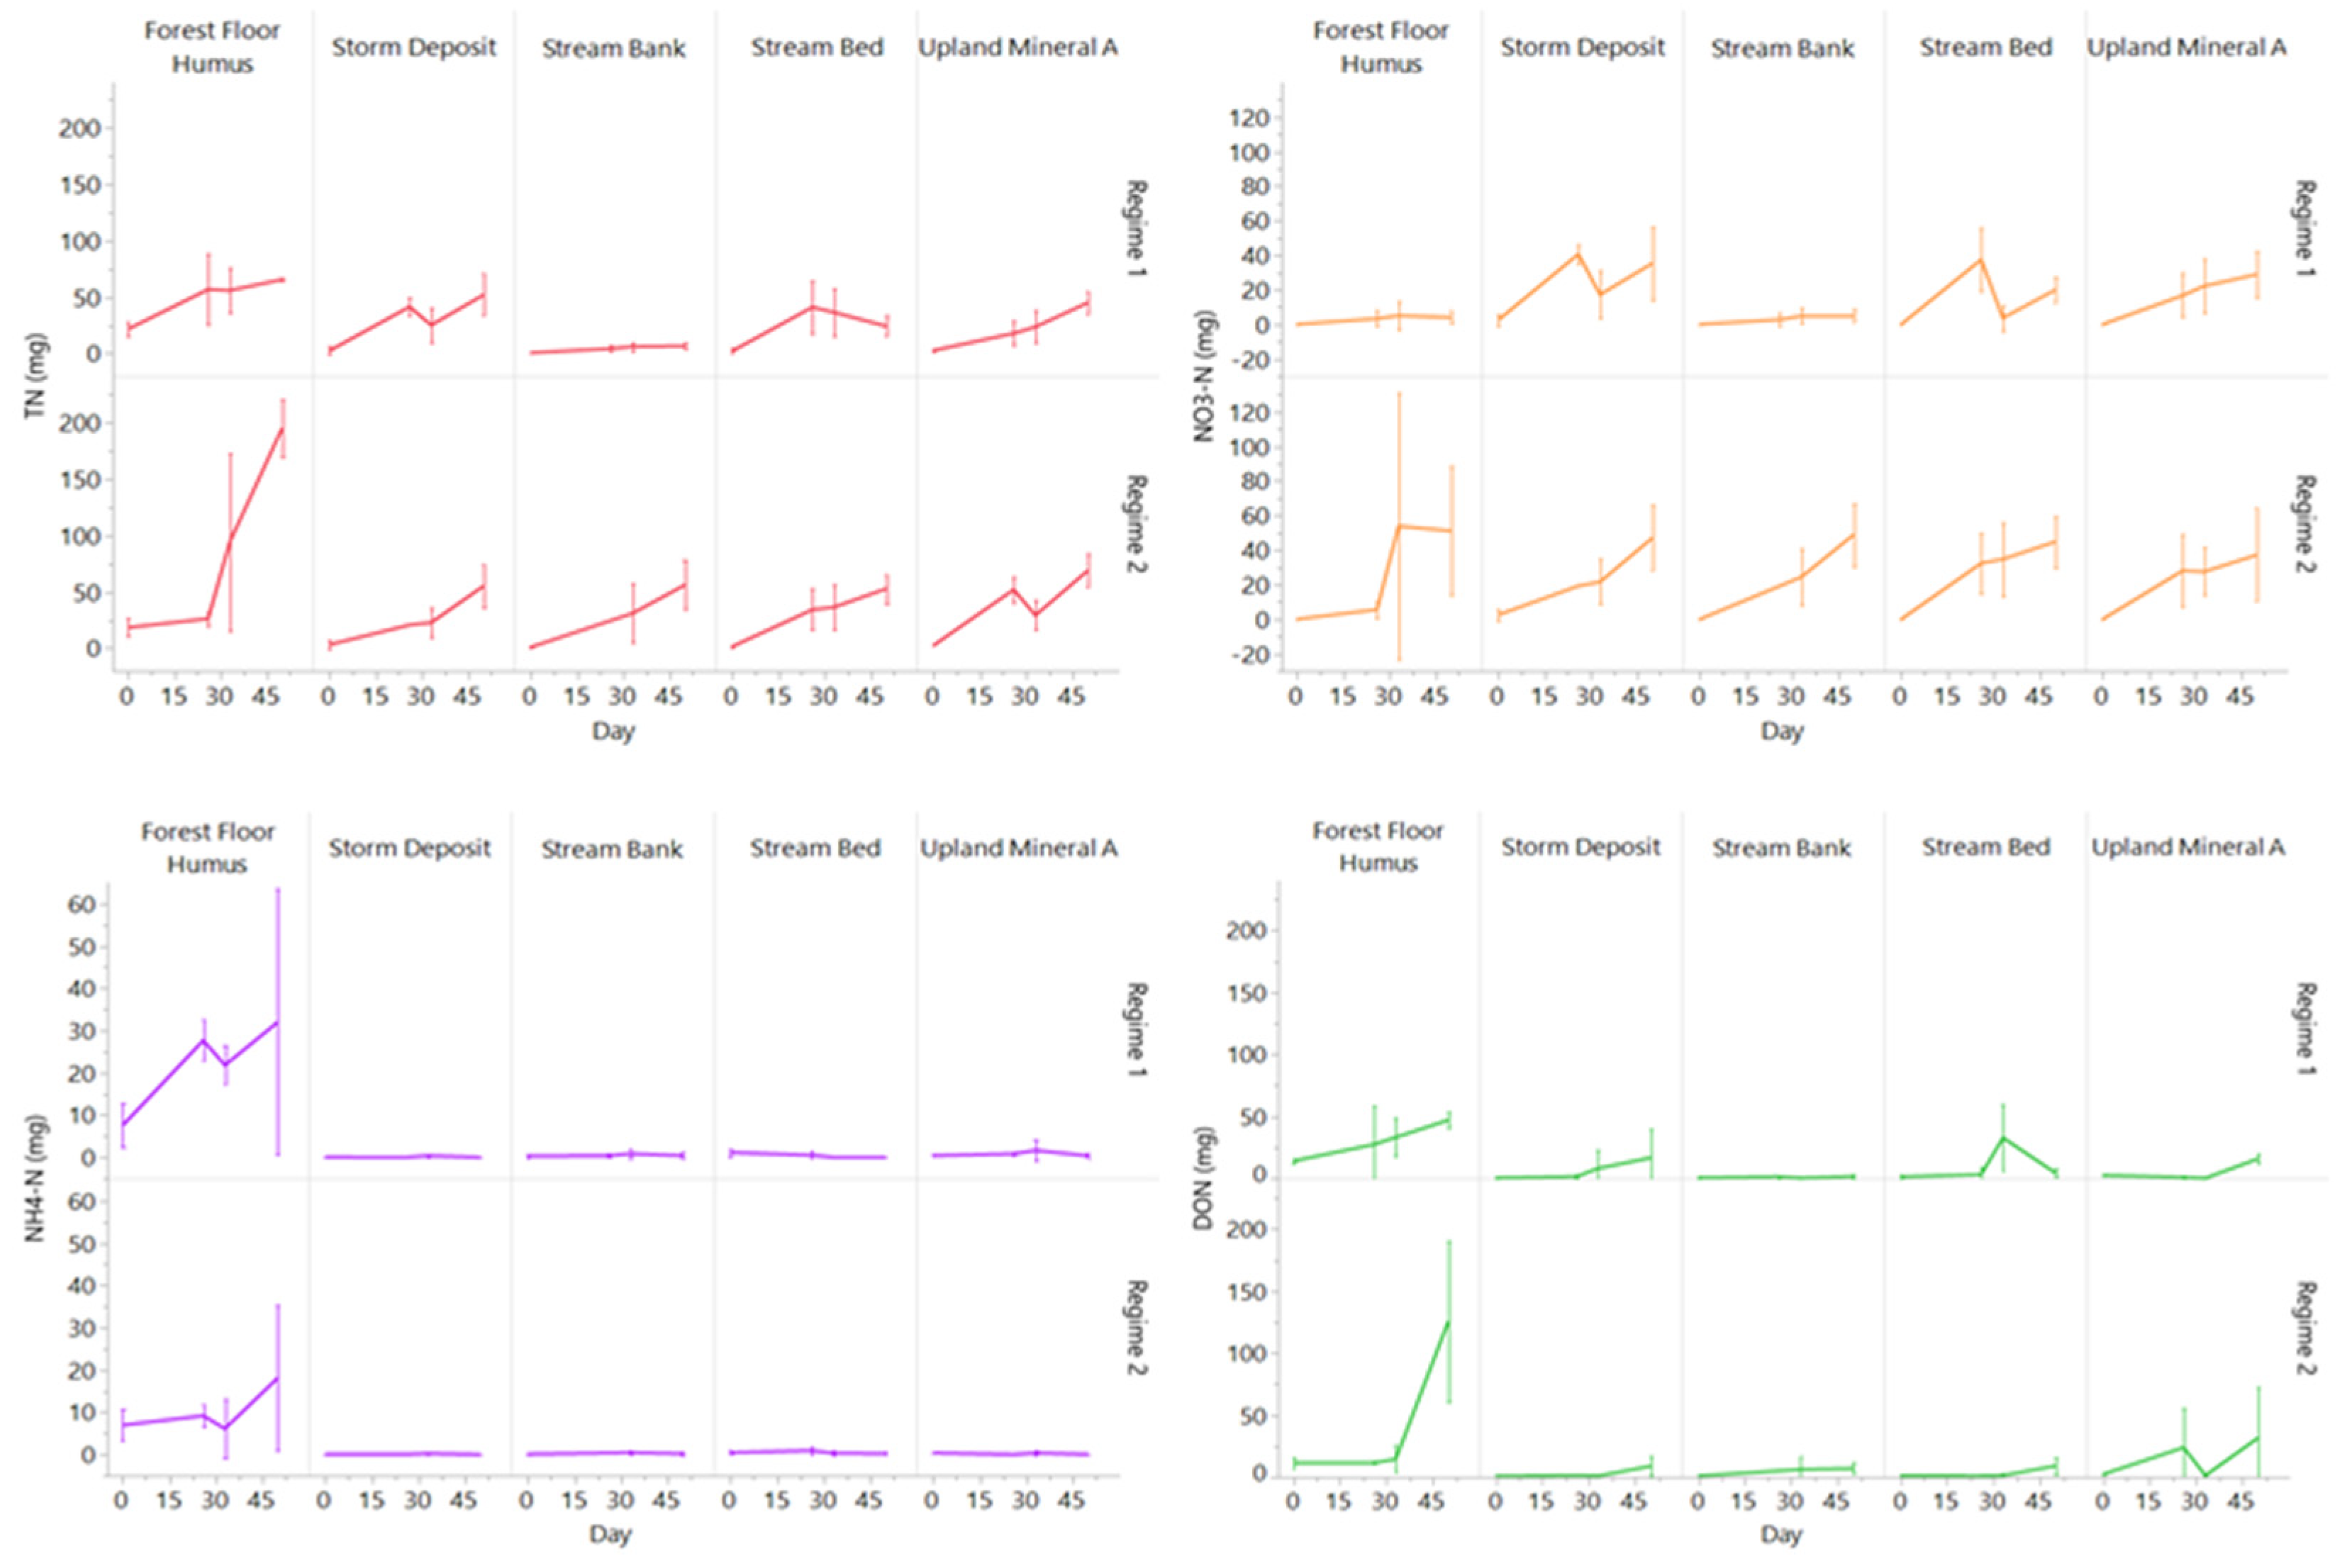
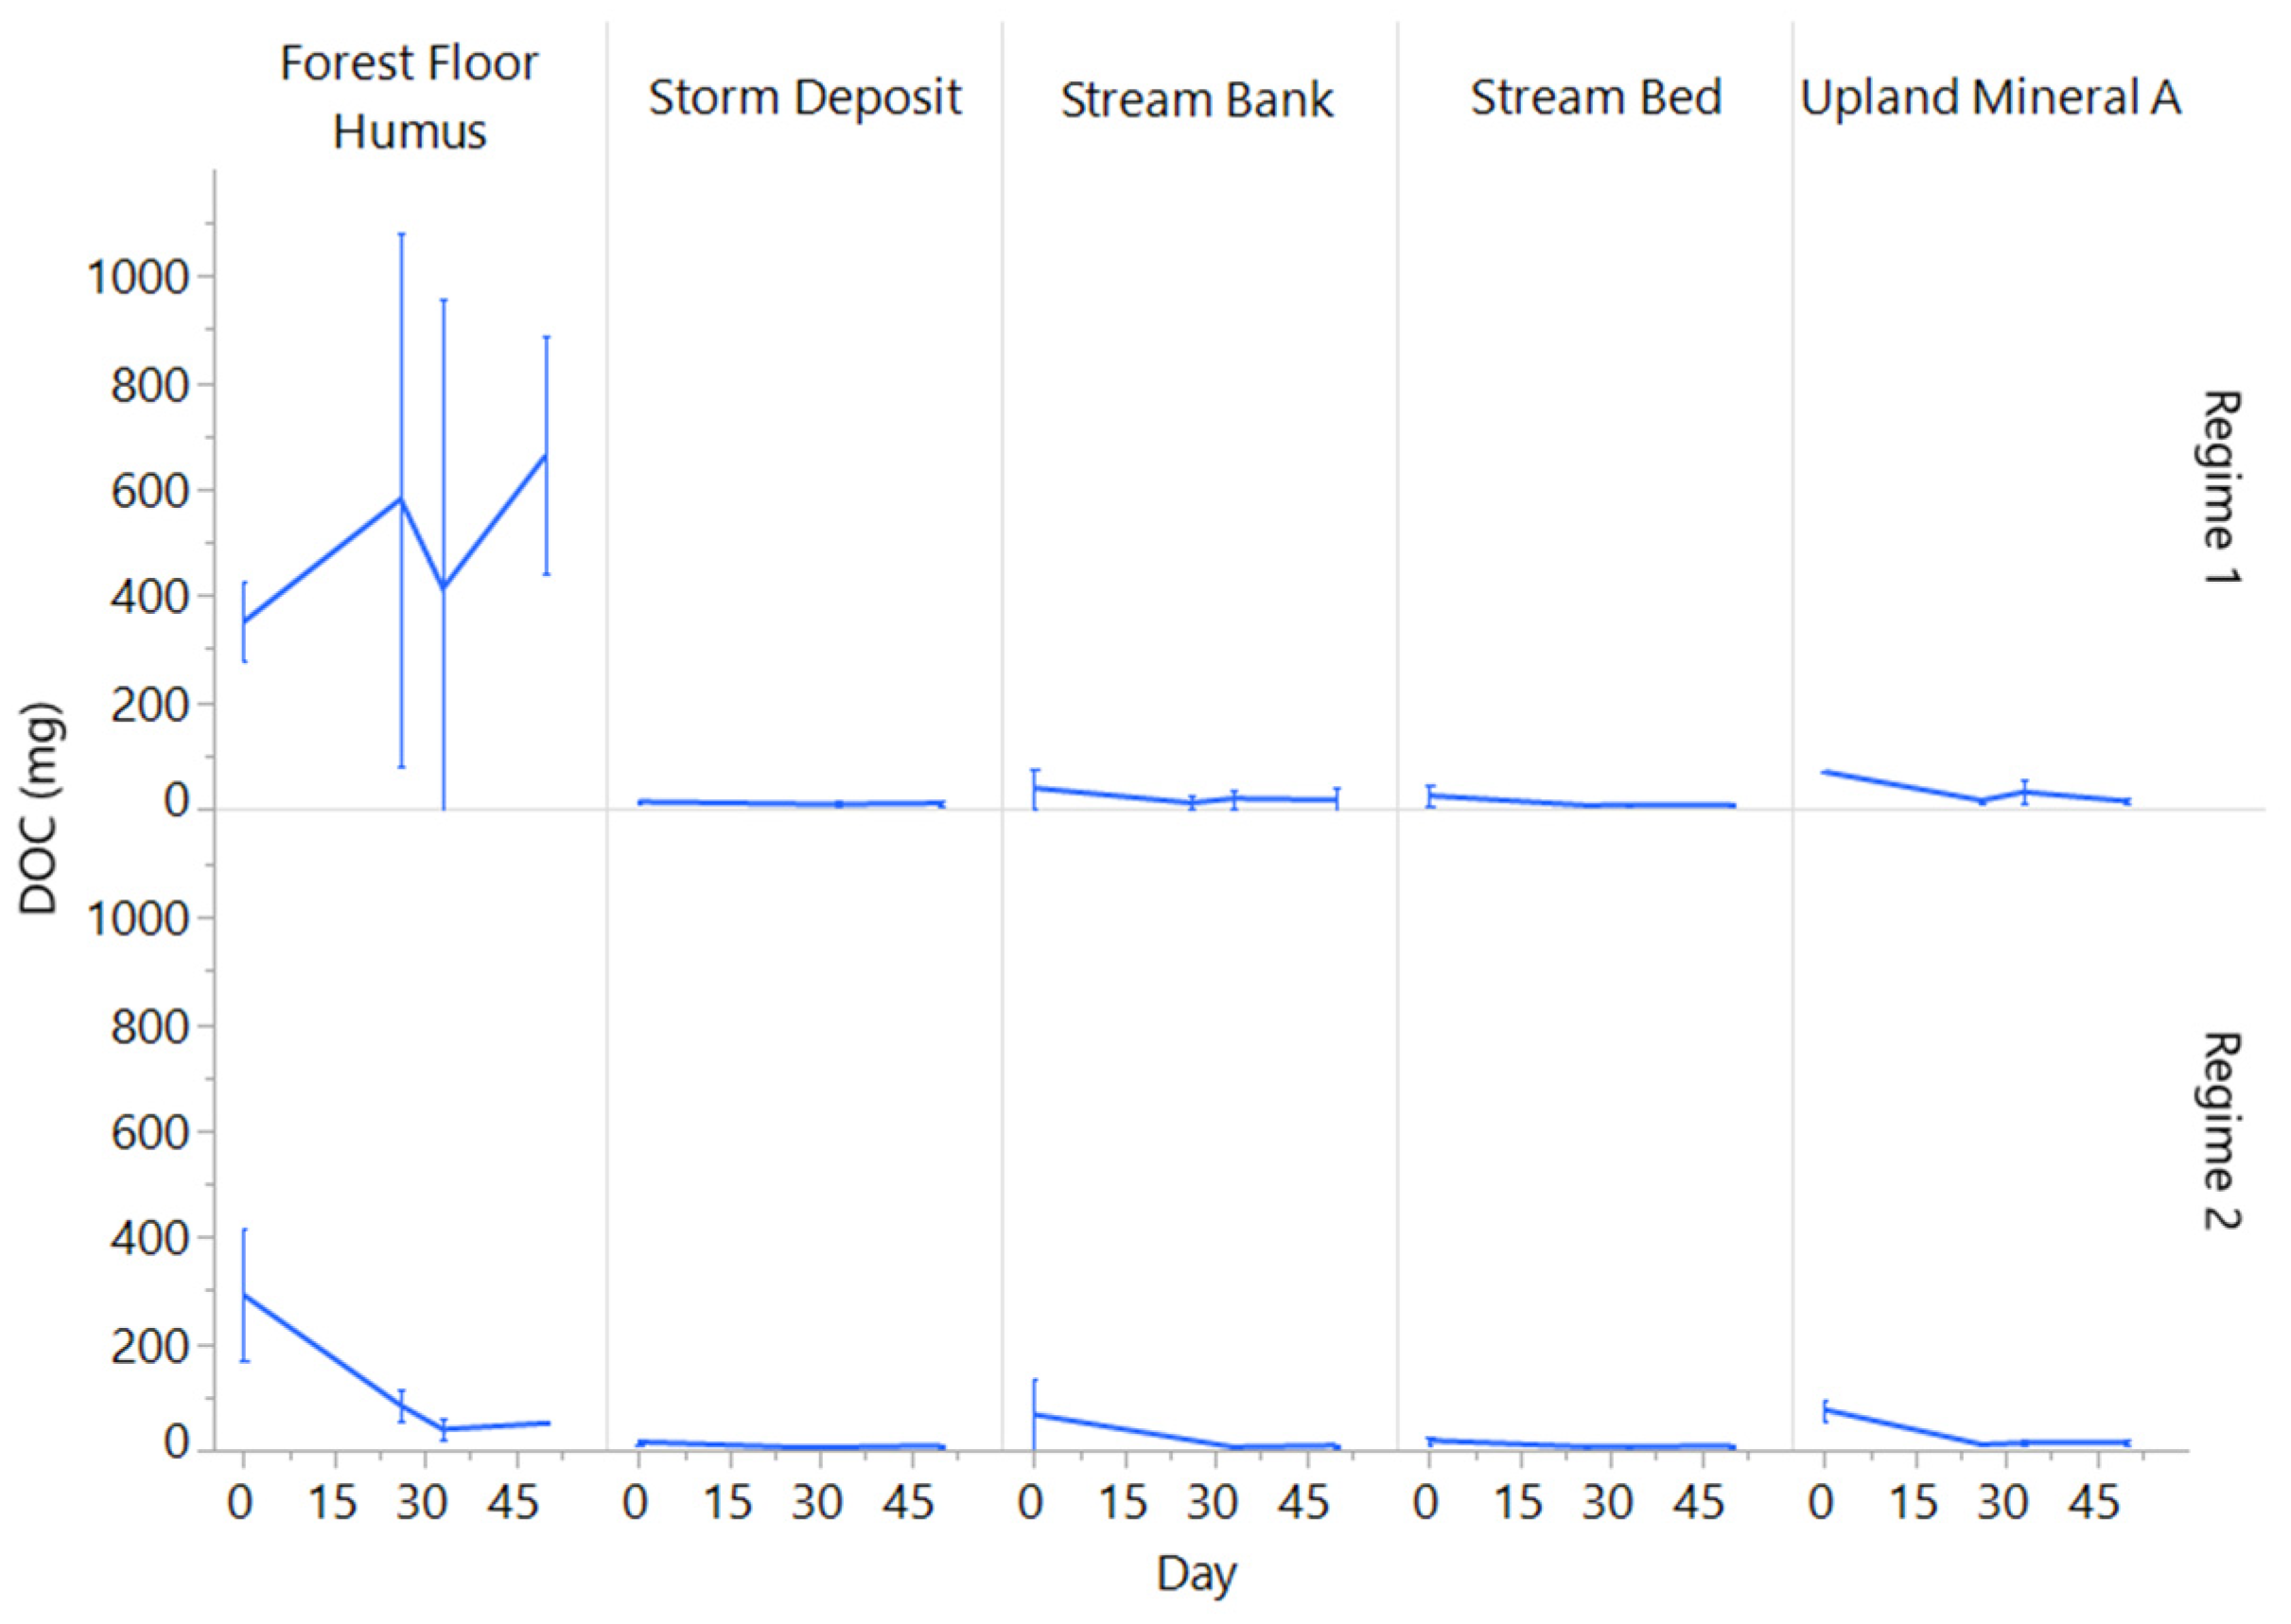
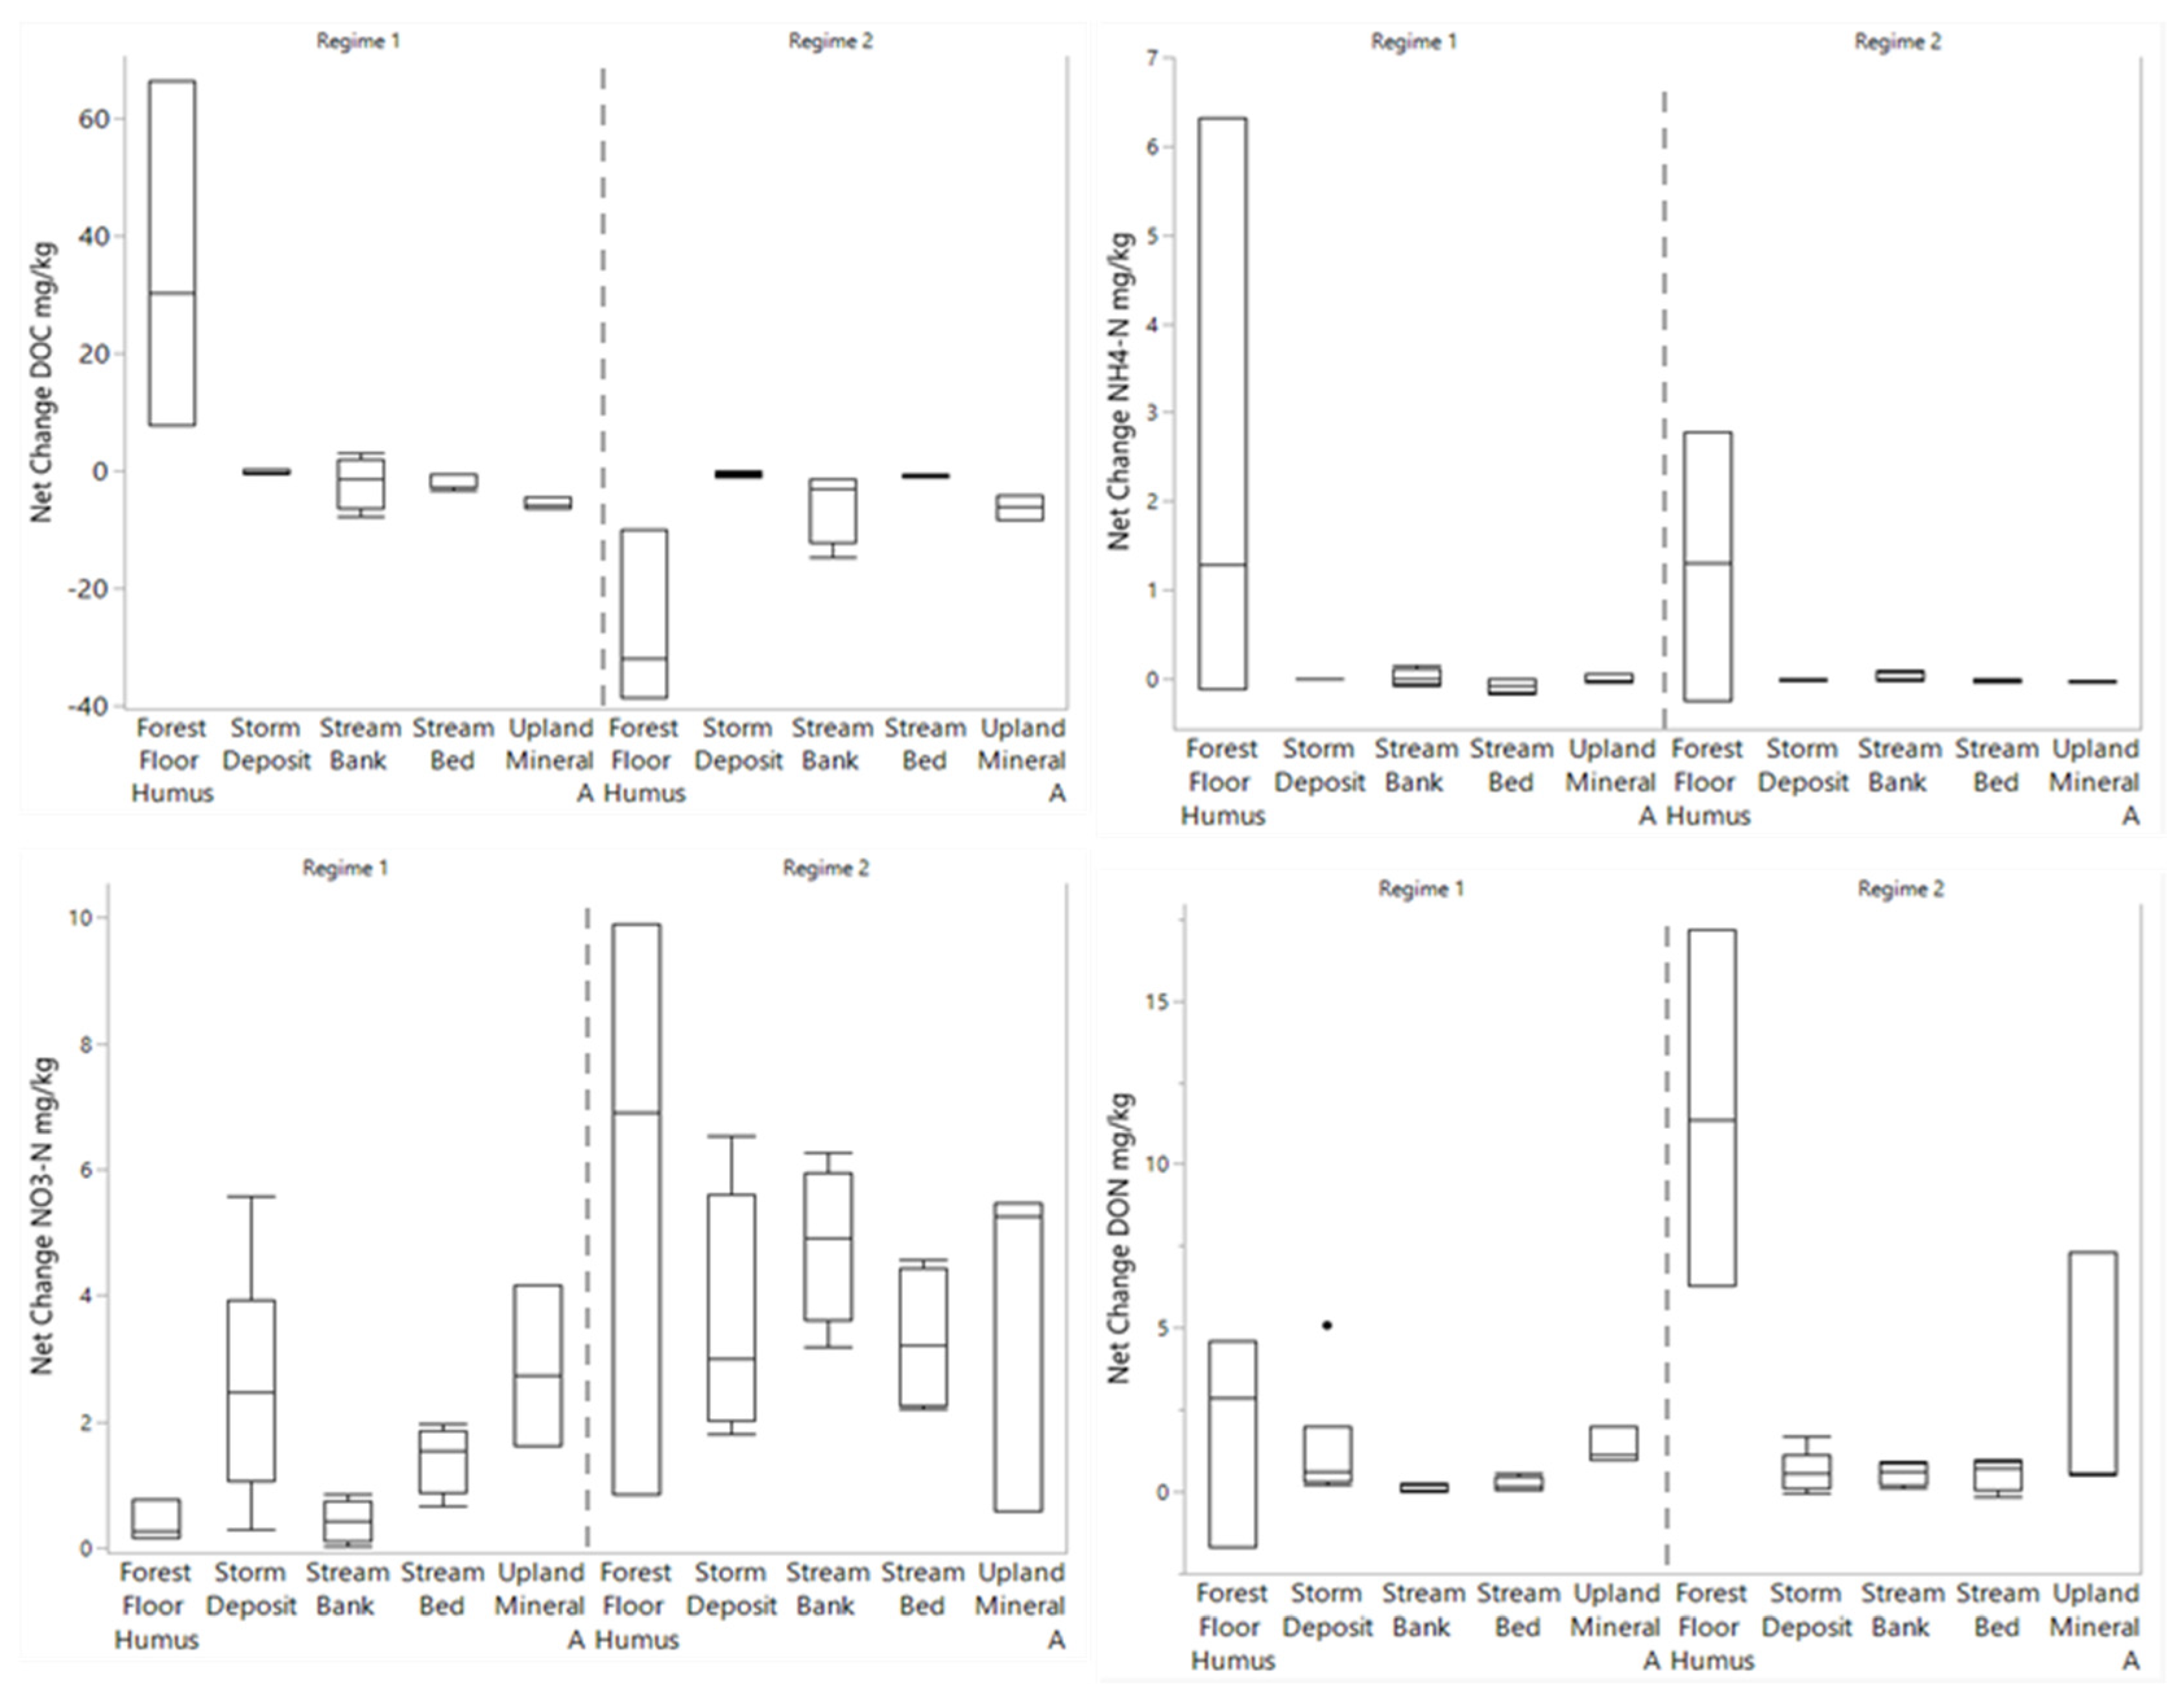
3.3. Changes in Porewater N and C

Compared to particulate %TC and %TN values, porewater N and C masses revealed more pronounced and variable changes between day 0 and day 50 (Figure 4). At the beginning of the incubation (day 0), porewater N was low and DON and ammonium-N accounted for 65–67% and 34–32% of the TDN, respectively, for all sources except storm deposit. In contrast, nitrate-N accounted for 75–98% of the TDN at day 0 for storm deposit, with DON and ammonium-N only contributing 2–22% to the TDN. Forest floor humus had the greatest DON and ammonium-N among all PN sources (Figure 4), and similarly, initially, had the highest DOC (Figure 5).
By the end of the incubation (day 50), porewater N masses increased and became more nitrate-N rich across all sources, except for forest floor humus in regime 1, which maintained the initial porewater N conditions (Figure 4). Similarly, final porewater DOC masses declined through the incubation across all PN sources and both regimes (Figure 5), except for forest floor source in regime 1 where porewater DOC increased.
Porewater N (Figure 6) and DOC (Figure 7) masses varied temporally across sources and moisture regimes. In general, porewater TDN increased throughout the incubation across all sources, with the greatest increase for forest floor humus. The temporal changes of porewater TDN were largely driven by changes in porewater nitrate-N. Forest floor humus, however, also indicated sharp increases in ammonium-N and DON across both regimes. In contrast, temporal changes in ammonium-N were especially muted for other sources (Figure 6).
The porewater DOC mass over the 50-day period decreased for all sources across both regimes except for the forest floor in regime 1 (Figure 7). The changes to the forest floor DOC for both moisture treatments dwarfed those of the other sources. Porewater DOC for forest floor humus in regime 1 increased through the incubation while the reverse was observed for regime 2.
Net changes in porewater N and C per unit of the sediment mass of the sources indicated important differences in source–sink behavior (Figure 8). Forest floor DOC was an important source of ammonium-N and DON for both regimes and for nitrate-N in regime 2. The difference in N response between the moisture regimes was especially pronounced for nitrate-N. Nitrate-N values for all sources (including the N-poor sources, storm deposit, stream bank soil, and bed) during regime 2 were greater than their corresponding regime 1 values indicating an increased release of nitrate-N. A contradictory response was observed for DOC with the forest floor being a significant source in regime 1 but a sink in regime 2.

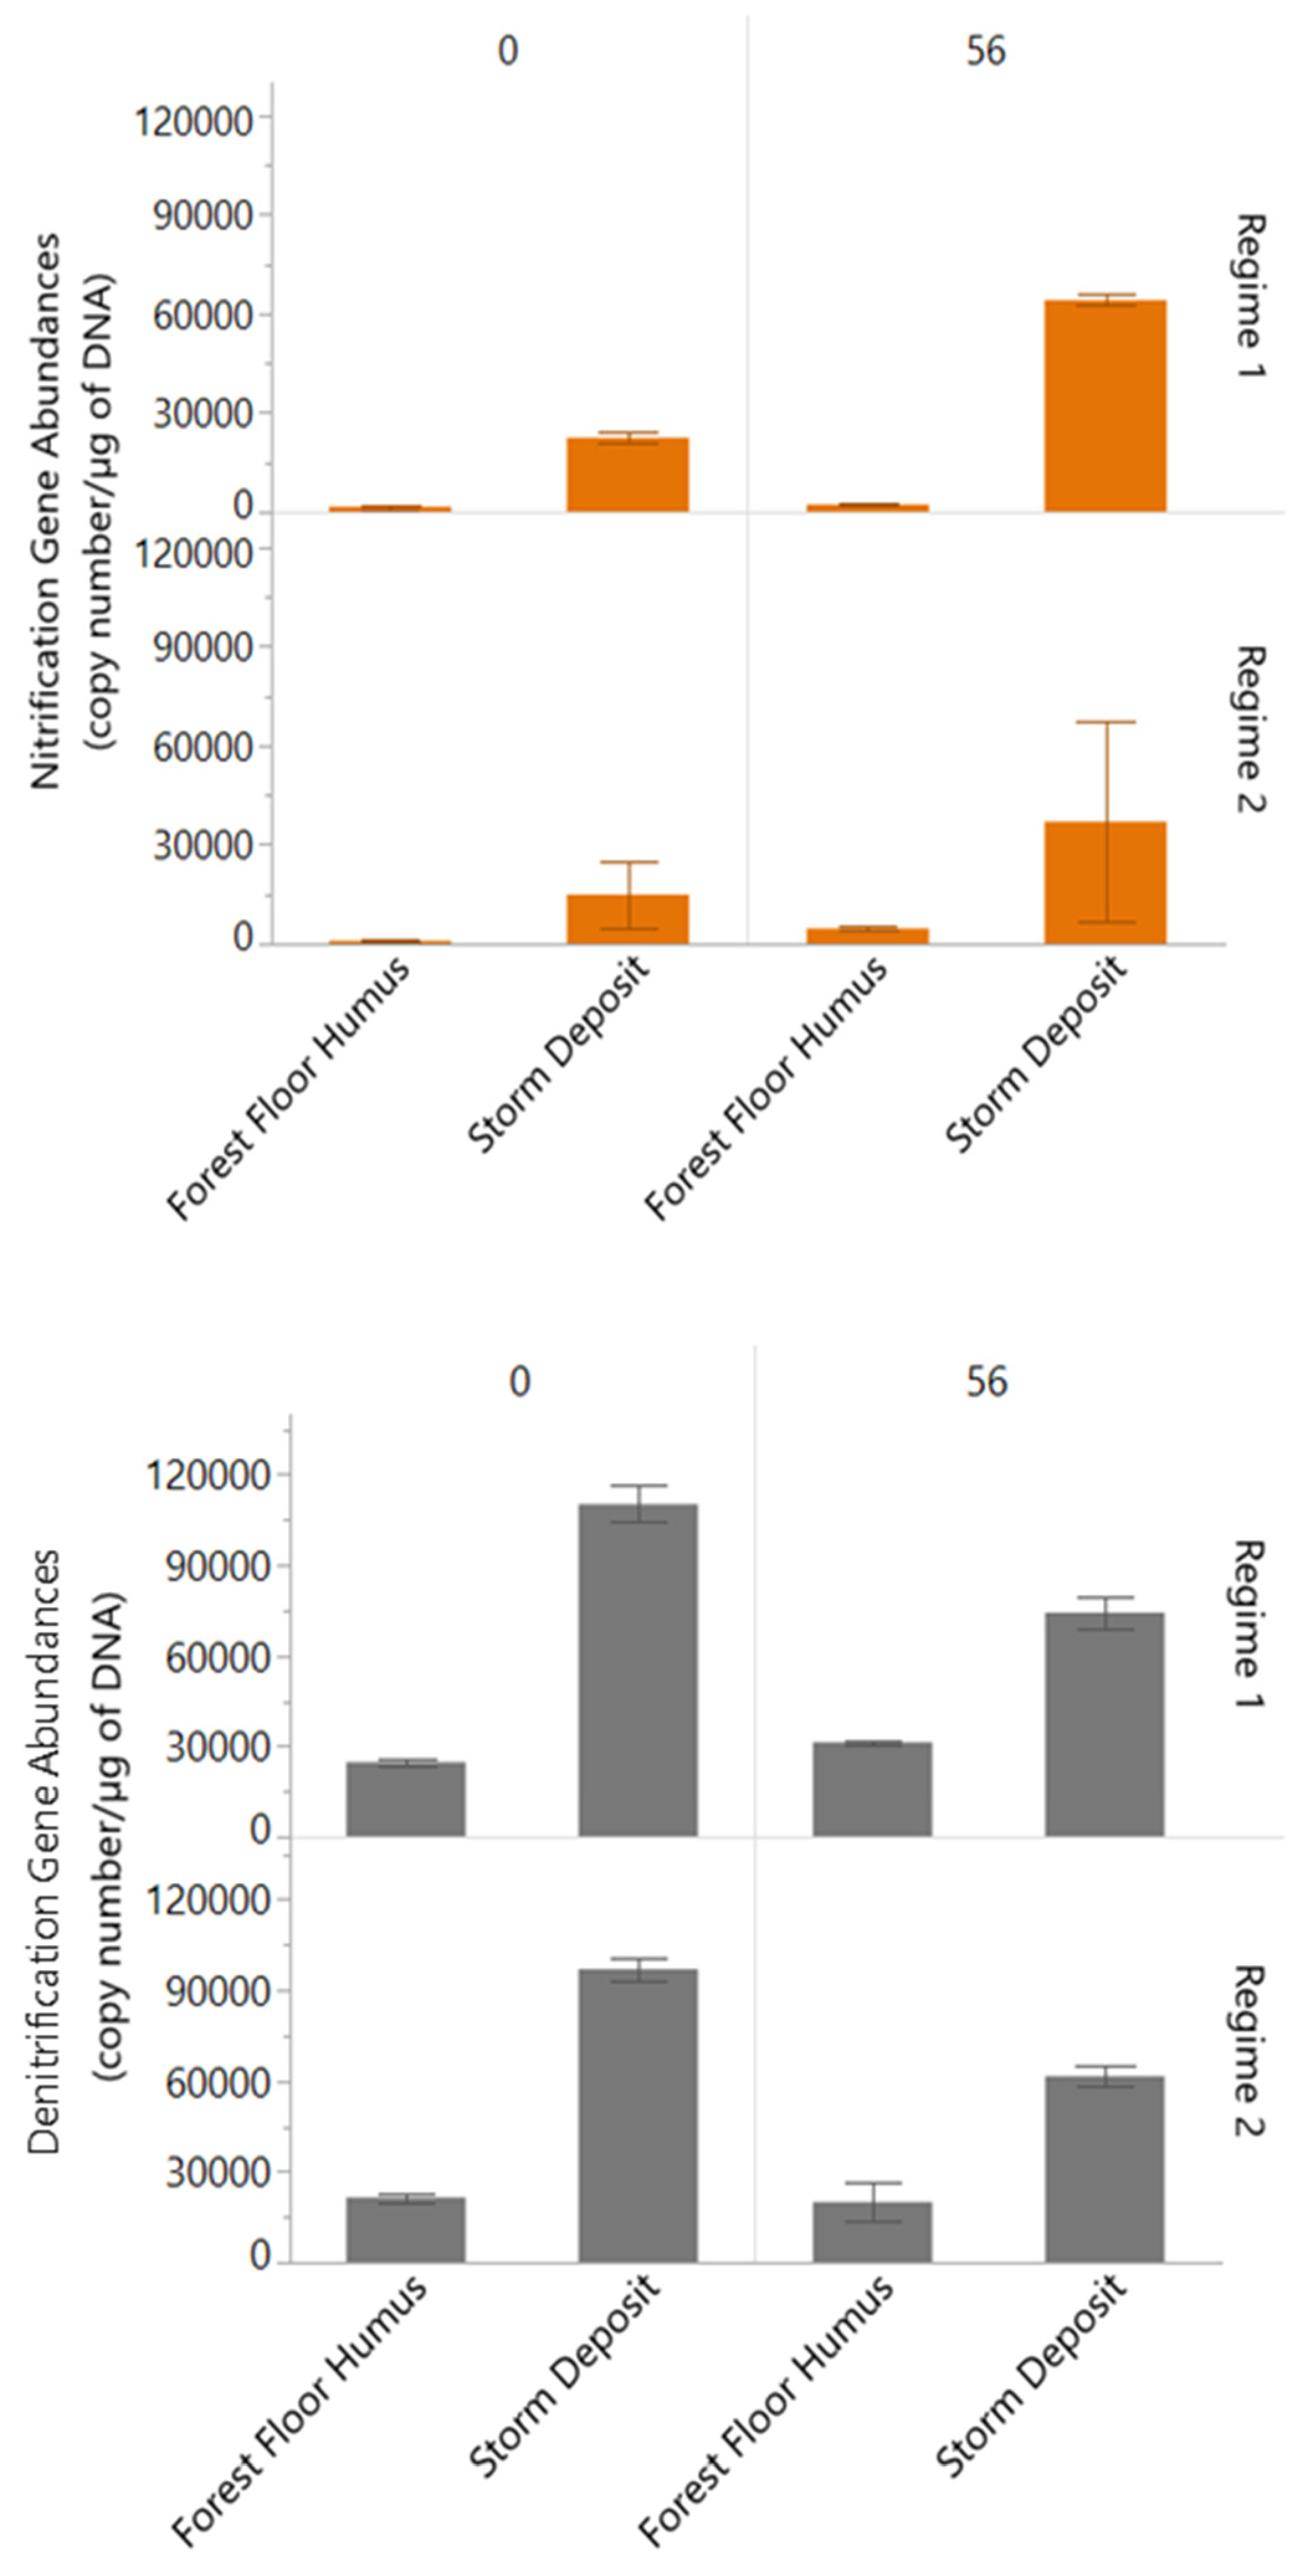
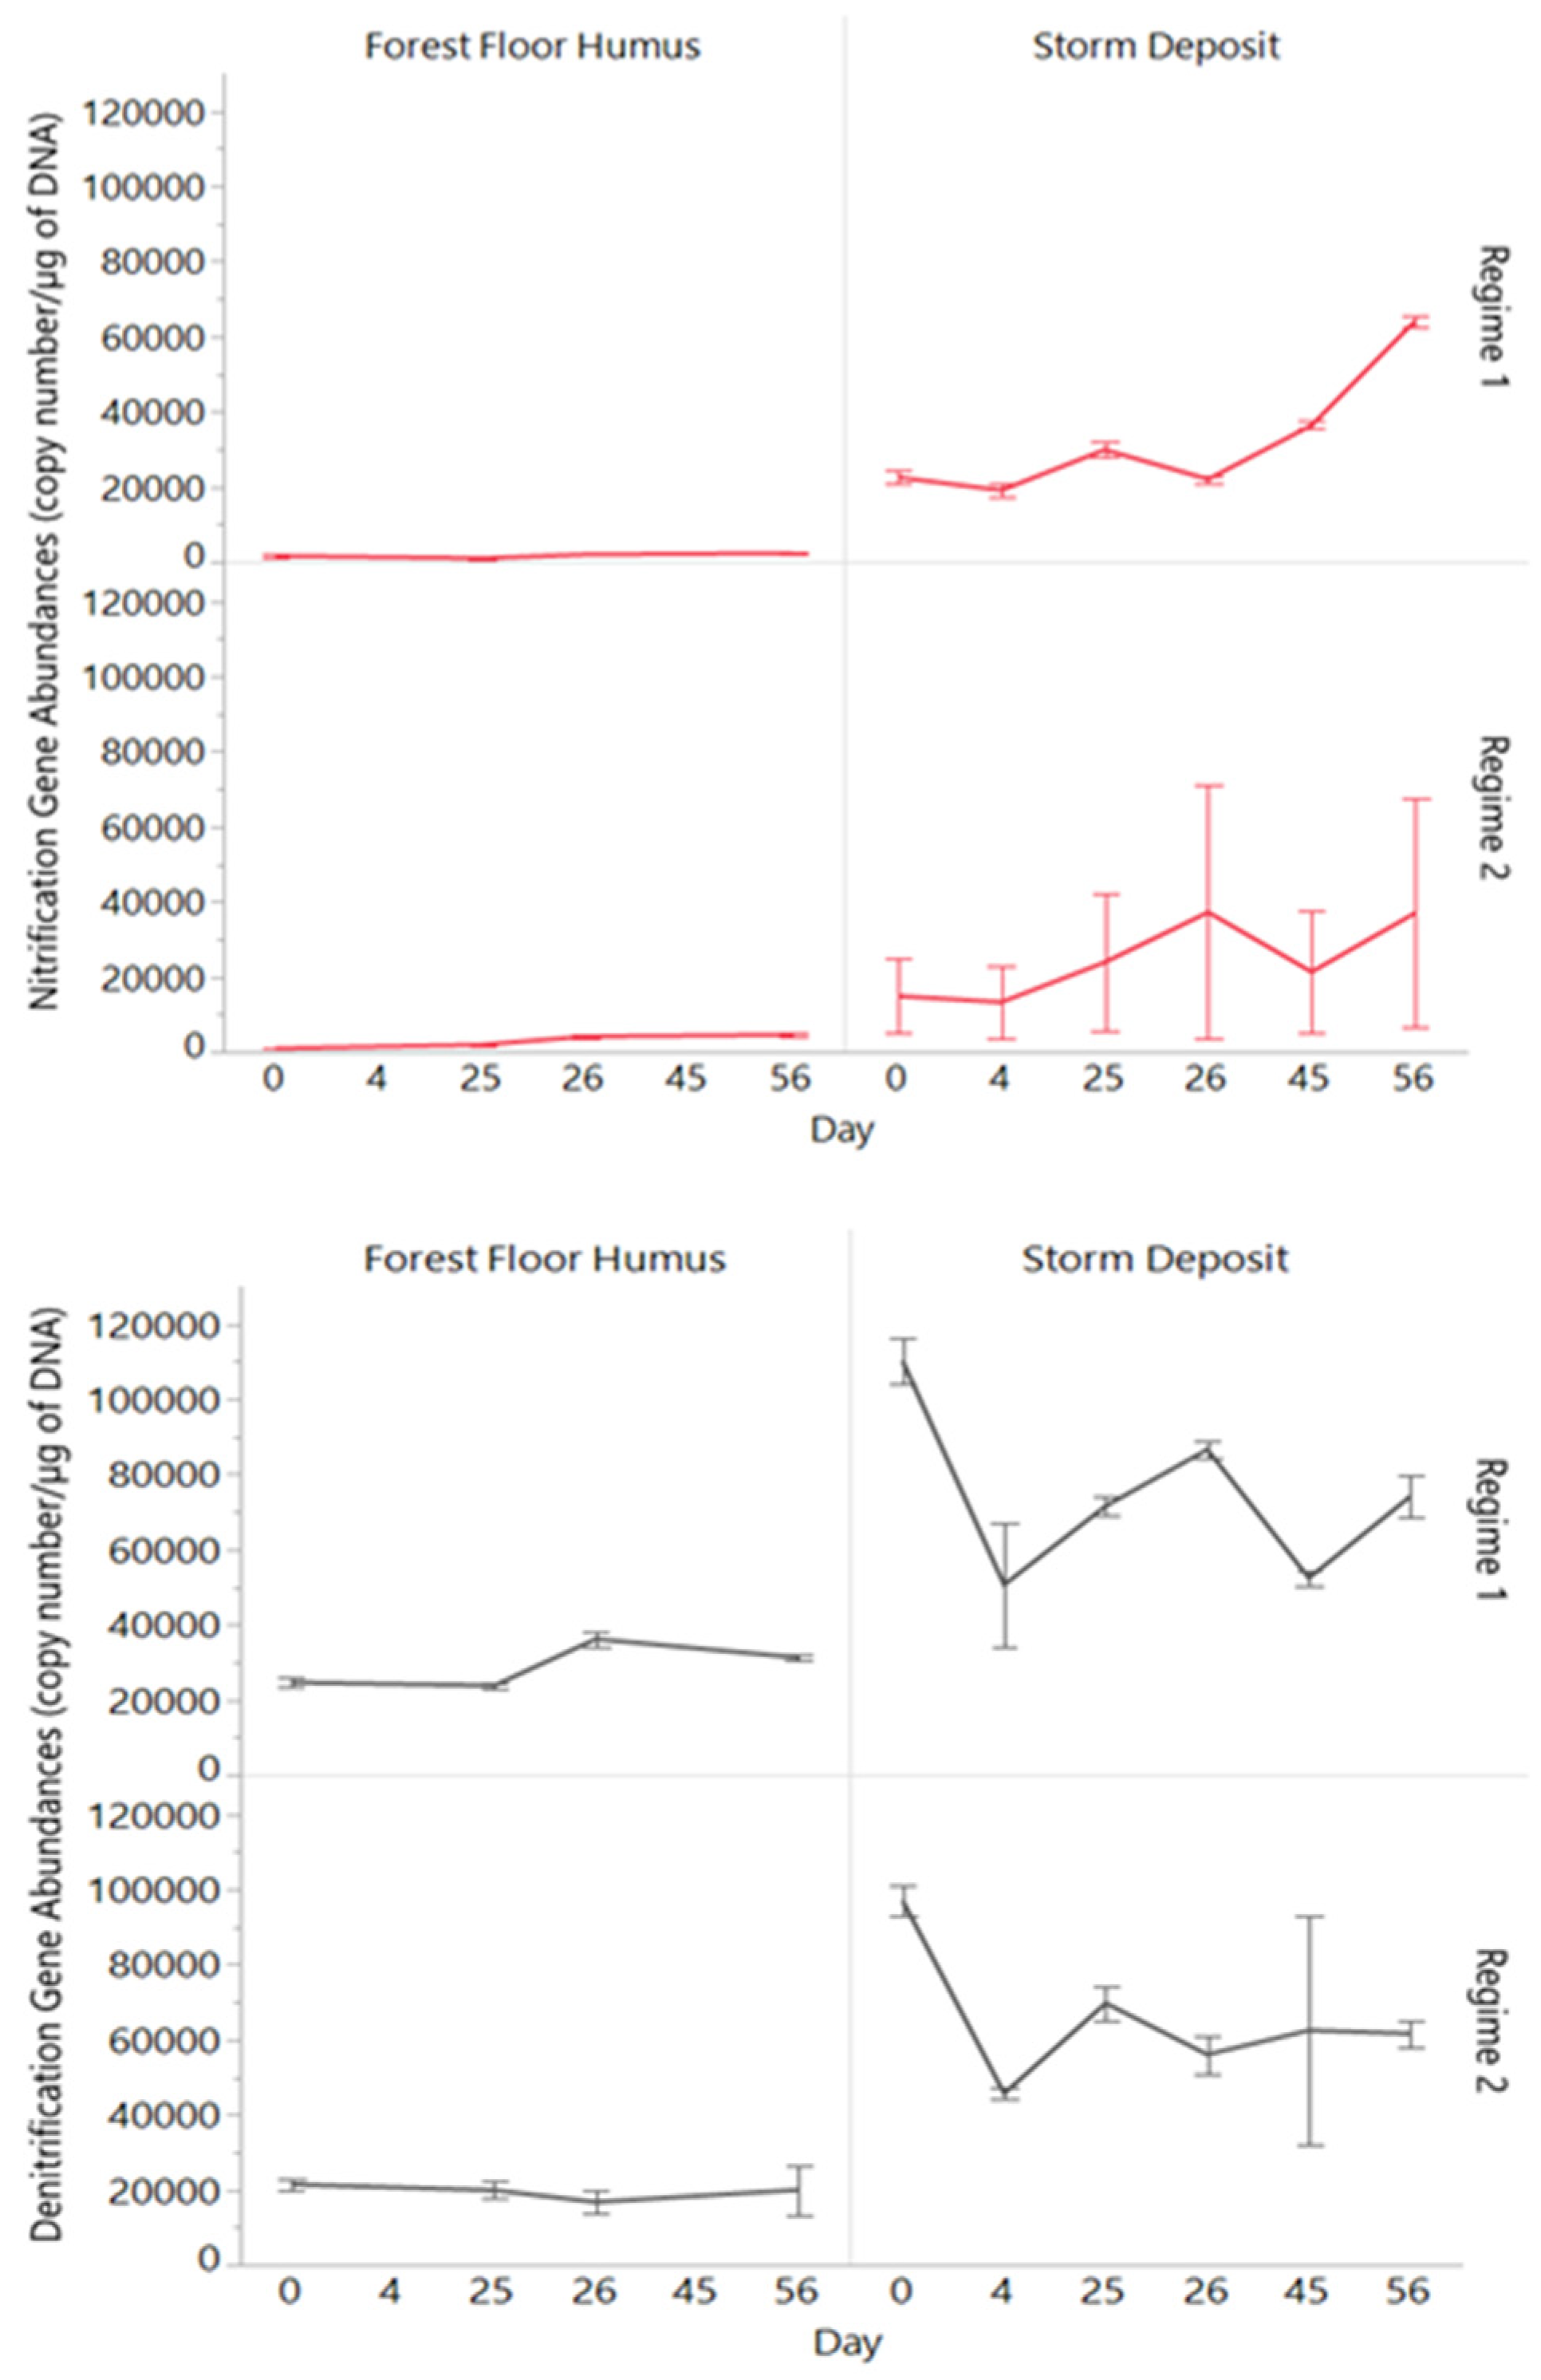
3.4. Nitrification and Denitrification Gene Abundances

Nitrification gene abundances were greater for storm deposit versus the forest floor at the start (day 0) for both regimes (Figure 9) and increased to even higher values at day 56. Similarly, the denitrification gene abundances were also higher for storm deposit versus the forest floor for both regimes, but unlike nitrification, the denitrification gene abundance for storm deposit decreased at day 56.
Forest floor humus exhibited a minimal temporal change in nitrification gene abundances (Figure 10). While there were some variations in nitrification genes with time for storm deposit, there was an overall increasing trend in the nitrification genes. The temporal changes of denitrification gene abundances were muted for the forest floor humus (Figure 10). Denitrification gene abundances for storm deposit revealed a mixed response (decrease and increase) with high variances but demonstrated an overall decreasing trend for both regimes.

4. Discussion

4.1. Role of Sources and Moisture Conditions for Processing and Leaching of PN

Results from this incubation study provided important insights into the source–sink behavior of PN and how watershed sources with varying C and N contents and moisture conditions could affect the fate and release/consumption of N in the fluvial network. Key N processes that could affect the PN fate in the fluvial system include leaching/desorption, sorption, mineralization, nitrification, and denitrification [20,39]. PN can release DON and ammonium-N into the solution via leaching or desorption, while DON, ammonium-N and nitrate-N can be sorbed or biologically assimilated into the PN pool [20]. Importantly, PN and DON can be mineralized to ammonium-N, which can subsequently be nitrified to nitrate-N under aerobic conditions. When nitrate-N exists under wet and oxygen limiting conditions, denitrification can dominate nitrogen cycling pathways in the headwaters and convert Nitrate-N to nitrogen gas [20]. Both nitrification and denitrification are carried out by distinct and diverse groups of specialized microorganisms including nitrifying microbes (e.g., ammonia oxidizing bacteria and archaea) and denitrifying bacteria [40]. Particulate organic matter can also influence denitrification indirectly via its influence on DOC [41,42,43]. For instance, labile DOC could stimulate assimilatory N uptake as well as denitrification [42,44].
Our results demonstrated that the source with elevated %C and N content, forest floor humus, was particularly susceptible to leaching and mineralization under moist or wet conditions. This source yielded elevated ammonium-N and DON in solution during regime 1 while the nitrate-N concentrations remained low. We attribute this to the leaching and mineralization of organic N with a suppression of nitrification under moist conditions. This assessment is supported by the decrease in particulate %TC and %TN and low nitrification gene abundance for this source under moist regime 1 conditions. In addition, moist regime 1 conditions also stimulated the leaching of DOC from the forest floor. In comparison, other sources revealed a muted response with regard to DOC, DON and NH4-N, but did indicate an increased release of nitrate-N. The increase in nitrate-N was seen for the other high-C and -N source, upland mineral A soil, as well as the C- and N-poor sources, storm deposit and stream bed. It should be noted that the storm deposit had elevated nitrification gene abundance, which increased through the incubation period. We speculate that the nitrate-N released from storm deposit and stream bed sources likely originated from the nitrification of sorbed ammonium-N on these sediments. Mineralization was likely not a key process for the storm deposit and stream bed since the organic N contents of these sources were low and porewater ammonium-N was negligible (unfortunately, we did not measure sediment-bound ammonium-N for our sources and do not have the information to confirm this speculation). However, it is also possible that the lack of porewater ammonium-N for the storm deposit and stream bed during regime 1 could have been due to the rapid nitrification or volatilization of ammonium-N from the solution [40,45]. Thus, sediment-bound nutrients, in addition to those associated with particulate organic fractions, could be important in nutrient transformations and release.
The big takeaway from this study was the sharp difference in solute response, particularly for nitrate-N, between the moist regime 1 and the dry–wet regime 2. N processing was particularly sensitive to moisture content and drying and rewetting cycles were shown to spur intense decomposition, mineralization, the release of C and N, and the emission of carbon dioxide [28,29,30]. This response is largely credited to the physical disruption of macroaggregates resulting in the exposure of previously unavailable particulate material [46,47], the decomposition of microorganisms that die due to moisture stress [48], and the increase in productivity and shifts in the population dynamics of surviving microorganisms, which can facilitate the assimilation, nitrification, or denitrification of N [48,49,50,51]. Rates of mineralization and nitrification subject to drying and rewetting were shown to outperform those of soils which experienced more consistent moisture conditions, though this response decreases with successive drying and rewetting cycles [50,52].
Forest floor humus had substantially greater amounts of porewater nitrate-N and nitrification gene abundances in the dry–wet regime 2 than in regime 1. We attribute the greater amount of porewater nitrate-N for forest floor humus in regime 2 to an increased mineralization of organic N followed by nitrification. Since a net decrease in particulate TC did not significantly differ across regimes, and nitrification is an autotrophic oxidation process that is independent of C, it is hypothesized that this net decline in porewater DOC was due to CO2 release via C mineralization, spurred by the drying and rewetting conditions of regime 2 [30,53,54]. This increase in leached inorganic N and decrease in leached C exemplifies the C and N mineralization response expected for the Birch Effect [28]. Laboratory scale studies [55] suggest that coarse particulate organic matter is more susceptible to the “priming effect” [56,57] than fine particulate organic matter and results in greater releases of N via the mineralization of PN. We believe this also likely occurred with the forest floor incubations. We must emphasize here that the forest floor humus in this watershed primarily originated from deciduous trees such as Fagus grandifolia (American beech), Liriodendron tulipifera (yellow poplar), and Acer rubrum (red maple). Deciduous litter is typically more N-rich and biodegradable compared to coniferous litter [52]. It is very possible that the mineralization, nitrification, and N leaching responses observed in this study for the deciduous forest floor PN source may not extend to watersheds with primarily coniferous forest floor.
Beyond the forest floor, all the other sources also yielded substantial increases in porewater nitrate-N. This suggests that nitrification likely stimulated nitrate-N production and release for all of these sources despite their muted response for other N forms. Overall, these results clearly show that PN source–sink behavior varies substantially with watershed sources and particularly with moisture conditions.

4.2. Broader Environmental Implications and Caveats

Recent climate trends and future projections indicate an increasing intensity of the largest storms, as well as increasing periods of dry or drought conditions between storms [32]. Larger and more intense storms will likely deliver more upland C- and N-rich sources such as the forest floor and upland soils to the fluvial/stream network. Similarly, increasing drought periods will likely replicate the moisture conditions we simulated in regime 2. Both of these scenarios suggest more PN in the stream network with a greater potential for the decomposition and leaching of N from this particulate source. Many of the streams and rivers in the mid-Atlantic US are already impaired because of anthropogenic inputs of N and phosphorus from urban and agricultural sources. Many of the states and jurisdictions of the Chesapeake Bay are already falling short of meeting the “pollution diet” or the required reductions in N to meet water quality targets [58]. This study suggests that additional inputs of PN from forested watersheds under a changing climate could make the water quality situation worse.
A quantification of the seasonal N dynamics of the Chesapeake Bay found that the influx of allochthonous N supports the primary aquatic production in the spring and continues to sustain the high N demands of phytoplankton in the summer, via the regeneration and recycling of DON and DIN [59,60]. According to the applied Finn Cycling Index (FCI), approximately 70% of the total system activity in the summer is due to the rate of nitrogen recycling in downstream aquatic ecosystems. This suggests that N leached from PN inputs from large summer storms could substantially disturb the seasonal N dynamics in coastal waters by providing fresh allochthonous N inputs that are typically not available [59]. For several decades, watersheds draining into the Chesapeake Bay have experienced N fluxes that are, on average, 10 times higher than the background fluxes [61], and have endured 6–8-fold increases in N inputs due to anthropogenic sources [62]. As anthropogenic N inputs in aquatic systems increase, the release of N from forested catchments, augmented by drying and rewetting cycles driven by climate change, continues to magnify an already difficult environmental problem.
While this study provided important insights into the transformation and leaching of PN, there were a few limitations. Following our previous work in the 79 ha forested watershed [14,15], we focused solely on PN inputs from forested landscapes. Similar PN inputs could also occur from urban and agricultural landscapes and could be potentially more bioavailable and easily degradable [5,63,64]. Understanding the fate of these PN inputs from urban and agricultural land uses is also an important knowledge gap that must be addressed. We also recognize that our incubation experiment lasted for only 56 days and was performed for two different, yet controlled, moisture conditions. Longer incubations across multiple seasons with variable moisture and temperature conditions would likely yield additional long-term insights into the processing of PN. Due to cost and logistical limitations, our microbial (functional gene) assessments were limited to only two sources; the inclusion of additional sources is recommended for future studies.

5. Conclusions

This study provided novel insights into the fate of particulate N in stream ecosystems by investigating the role of watershed PN sources and moisture regimes. The key findings from this research were: (1) The role of PN sources, forest floor humus; and the mixed sources, the storm deposit and stream bed, yielded comparable amounts of porewater N. Enhanced C and N mineralization, nitrification, and the low denitrification spurred these PN sources to release large amounts of porewater nitrate-N. In comparison, upland mineral A horizon and stream bank soils released minimal amounts of porewater N. (2) Moisture regime: drying and wetting conditions can enhance the release of N from PN sources. This was highlighted by the forest floor humus which yielded significantly greater amounts of porewater nitrate-N during the dry–wet regime 2 as opposed to the moist regime 1.
Overall, this study showed that PN could be an important source of porewater N to the stream network. Climate change projections indicate that large storms will increase in intensity and frequency, which could result in the increased export of greater amounts of PN, particularly from C- and N-rich upland sources such as the forest floor. This could result in the increased leaching of N in aquatic ecosystems and contribute to water quality concerns. Climate variability will also likely enhance the drying and rewetting cycles which, as shown by this work, may lead to more mineralization and nitrification of PN, resulting in the release of dissolved N. Taken together, these observations suggest that climate variability will pose important challenges for vulnerable aquatic ecosystems, such as the Chesapeake and Delaware Bays in the US, which are already suffering from excess anthropogenic pollution and eutrophication.

Author Contributions

Conceptualization, S.I., J.K. and C.K.; methodology, C.K., E.J., J.K. and S.I.; formal analysis, C.K.; investigation, C.K.; resources, S.I. and J.K.; data curation, C.K.; writing—original draft preparation, C.K. and S.I.; writing—review and editing, C.K., S.I., E.P., J.K. and E.J.; visualization, C.K.; supervision, S.I. and J.K.; project administration, S.I. and J.K.; funding acquisition, S.I. and J.K. All authors have read and agreed to the published version of the manuscript.

Funding

This research was funded by USDA NIFA grant 2015-67020-23585. Partial funding was provided by Research Endowment at Stroud Water Research Center.

Data Availability Statement

All data are publicly available on the online Hydroshare data repository; link: https://www.hydroshare.org/resource/4478fc64e802496d86badefffe809ab4/ (accessed on 9 November 2021).

Acknowledgments

We would like to thank the staff of the Fair Hill Natural Resource Management Area for providing us with assistance and access to the study site, and the UD Soil Testing Laboratory for their assistance with sample analysis. We thank the many students and personnel who helped with sample collection, including Doug Rowland, Catherine Winters, Daniel Warner, and Thomas Parr. We also thank the technical staff at Stroud Water Research Center, Laura Zgleszewski and Shannon Hicks for helping with the setups of the incubation experiment in the greenhouse.

Conflicts of Interest

The authors declare no conflict of interest.

References

  1. Howarth, R.; Swaney, D.; Billen, G.; Garnier, J.; Hong, B.; Humborg, C.; Johnes, P.; Mörth, C.; Marino, R. Nitrogen fluxes from the landscape are controlled by net anthropogenic nitrogen inputs and by climate. Front. Ecol. Environ. 2012, 10, 37–43. [Google Scholar] [CrossRef] [Green Version]
  2. Baron, J.; Hall, E.; Nolan, B.; Finlay, J.; Bernhardt, E.; Harrison, J.; Chan, F.; Boyer, E. The interactive effects of excess reactive nitrogen and climate change on aquatic ecosystems and water resources of the United States. Biogeochemistry 2013, 114, 71–92. [Google Scholar] [CrossRef]
  3. Alvarez-Cobelas, M.; Angeler, D.G.; Sánchez-Carrillo, S.; Almendros, G. Worldwide view of organic carbon export from catchments. Biogeochemistry 2010, 107, 275–293. [Google Scholar] [CrossRef]
  4. Bertani, I.; Bhatt, G.; Shenk, G.W.; Linker, L.C. Quantifying the Response of Nitrogen Speciation to Hydrology in the Chesapeake Bay Watershed Using a Multilevel Modeling Approach. J. Am. Water Resour. Assoc. 2021. [Google Scholar] [CrossRef]
  5. Lusk, M.G.; Toor, G.S.; Inglett, P.W. Organic nitrogen in residential stormwater runoff: Implications for stormwater management in urban watersheds. Sci. Total Environ. 2020, 707, 135962. [Google Scholar] [CrossRef] [PubMed]
  6. Katz, B.G. Nitrogen Overload: Environmental Degradation, Ramifications, and Economic Costs; John Wiley & Sons: Hoboken, NJ, USA, 2020; p. 272. [Google Scholar]
  7. Dhillon, G.S.; Inamdar, S. Extreme storms and changes in particulate and dissolved organic carbon in runoff: Entering uncharted waters? Geophys. Res. Lett. 2013, 40, 1322–1327. [Google Scholar] [CrossRef]
  8. Inamdar, S.; Dhillon, G.; Singh, S.; Parr, T.; Qin, Z. Particulate nitrogen exports in stream runoff exceed dissolved nitrogen forms during large tropical storms in a temperate, headwater, forested watershed. J. Geophys. Res. Biogeosci. 2015, 120, 1548–1566. [Google Scholar] [CrossRef] [Green Version]
  9. Taylor, P.G.; Wieder, W.R.; Weintraub, S.; Cohen, S.; Cleveland, C.C.; Townsend, A.R. Organic forms dominate hydrologic nitrogen export from a lowland tropical watershed. Ecology 2015, 96, 1229–1241. [Google Scholar] [CrossRef] [Green Version]
  10. Lloret, E.; Dessert, C.; Pastor, L.; Lajeunesse, E.; Crispi, O.; Gaillardet, J.; Benedetti, M.F. Dynamic of particulate and dissolved organic carbon in small volcanic mountainous tropical watersheds. Chem. Geol. 2013, 351, 229–244. [Google Scholar] [CrossRef]
  11. Gao, Q.; Tao, Z.; Yao, G.; Ding, J.; Liu, Z.; Liu, K. Elemental and isotopic signatures of particulate organic carbon in the Zengjiang River, southern China. Hydrol. Process. 2007, 21, 1318–1327. [Google Scholar] [CrossRef]
  12. Gomez, B.; Baisden, W.T.; Rogers, K.M. Variable composition of particle-bound organic carbon in steepland river systems. J. Geophys. Res. Earth Surf. 2010, 115. [Google Scholar] [CrossRef]
  13. Jung, B.; Lee, H.; Jeong, J.; Owen, J.; Kim, B.; Meusburger, K.; Alewell, C.; Gebauer, G.; Shope, C.; Park, J. Storm pulses and varying sources of hydrologic carbon export from a mountainous watershed. J. Hydrol. 2012, 440–441, 90–101. [Google Scholar] [CrossRef]
  14. Johnson, E.R.; Inamdar, S.; Kan, J.; Vargas, R. Particulate Organic Matter Composition in Stream Runoff Following Large Storms: Role of POM Sources, Particle Size, and Event Characteristics. J. Geophys. Res. Biogeosci. 2018, 123, 660–675. [Google Scholar] [CrossRef]
  15. Rowland, R.; Inamdar, S.; Parr, T. Evolution of particulate organic matter (POM) along a headwater drainage: Role of sources, particle size class, and storm magnitude. Biogeochemistry 2017, 133, 181–200. [Google Scholar] [CrossRef]
  16. Coynel, A.; Etcheber, H.; Abril, G.; Maneux, E.; Dumas, J.; Hurtrez, J. Contribution of Small Mountainous Rivers to Particulate Organic Carbon Input in the Bay of Biscay. Biogeochemistry 2005, 74, 151–171. [Google Scholar] [CrossRef]
  17. Oeurng, C.; Sauvage, S.; Coynel, A.; Maneux, E.; Etcheber, H.; Sánchez-Pérez, J. Fluvial transport of suspended sediment and organic carbon during flood events in a large agricultural catchment in southwest France. Hydrol. Process. 2011, 25, 2365–2378. [Google Scholar] [CrossRef] [Green Version]
  18. Vidon, P.; Allan, C.; Burns, D.; Duval, T.P.; Gurwick, N.; Inamdar, S.; Lowrance, R.; Okay, J.; Scott, D.; Sebestyen, S. Hot Spots and Hot Moments in Riparian Zones: Potential for Improved Water Quality Management1. J. Am. Water Resour. Assoc. 2010, 46, 278–298. [Google Scholar] [CrossRef]
  19. McClain, M.E.; Boyer, E.W.; Dent, C.L.; Gergel, S.E.; Grimm, N.B.; Groffman, P.M.; Hart, S.C.; Harvey, J.W.; Johnston, C.A.; Mayorga, E.; et al. Biogeochemical Hot Spots and Hot Moments at the Interface of Terrestrial and Aquatic Ecosystems. Ecosystems 2003, 6, 301–312. [Google Scholar] [CrossRef]
  20. Bernhardt, E.S.; Likens, G.E.; Hall, R.O.; Buso, D.C.; Fisher, S.G.; Burton, T.M.; Meyer, J.L.; McDowell, W.H.; Mayer, M.S.; Bowden, W.B.; et al. Can’t See the Forest for the Stream? In-stream Processing and Terrestrial Nitrogen Exports. BioScience 2005, 55, 219–230. [Google Scholar] [CrossRef]
  21. Tank, J.L.; Rosi-Marshall, E.J.; Griffiths, N.A.; Entrekin, S.A.; Stephen, M.L. A review of allochthonous organic matter dynamics and metabolism in streams. J. N. Am. Benthol. Soc. 2010, 29, 118–146. [Google Scholar] [CrossRef] [Green Version]
  22. Peterson, B.J.; Wollheim, W.M.; Mulholland, P.J.; Webster, J.R.; Meyer, J.L.; Tank, J.L.; Martí, E.; Bowden, W.B.; Valett, H.M.; Hershey, A.E.; et al. Control of Nitrogen Export from Watersheds by Headwater Streams. Science 2001, 292, 86–90. [Google Scholar] [CrossRef] [PubMed]
  23. Seitzinger, S.; Harrison, J.A.; Böhlke, J.K.; Bouwman, A.F.; Lowrance, R.; Peterson, B.; Tobias, C.; Drecht, G.V. Denitrification Across Landscapes and Waterscapes: A Synthesis. Ecol. Appl. 2006, 16, 2064–2090. [Google Scholar] [CrossRef] [Green Version]
  24. Bernhardt, E.S.; Likens, G.E.; Buso, D.C.; Driscoll, C.T. In-stream uptake dampens effects of major forest disturbance on watershednitrogen export. Proc. Natl. Acad. Sci. USA 2003, 100, 10304–10308. [Google Scholar] [CrossRef] [Green Version]
  25. Triska, F.J.; Duff, J.H.; Avanzino, R.J. Patterns of hydrological exchange and nutrient transformation in the hyporheic zone of a gravel-bottom stream: Examining terrestrial—Aquatic linkages. Freshw. Biol. 1993, 29, 259–274. [Google Scholar] [CrossRef]
  26. Storey, R.G.; Fulthorpe, R.R.; Williams, D.D. Perspectives and predictions on the microbial ecology of the hyporheic zone. Freshw. Biol. 1999, 41, 119–130. [Google Scholar] [CrossRef] [Green Version]
  27. Mulholland, P.J. The Importance of In-stream Uptake for Regulating Stream Concentrations and Outputs of N And P from a Forested Watershed: Evidence from Long-term Chemistry Records for Walker Branch Watershed. Biogeochemistry 2004, 70, 403–426. [Google Scholar] [CrossRef]
  28. Birch, H.F. The effect of soil drying on humus decomposition and nitrogen availability. Plant Soil 1958, 10, 9–31. [Google Scholar] [CrossRef]
  29. Cui, M.; Caldwell, M.M. A large ephemeral release of nitrogen upon wetting of dry soil and corresponding root responses in the field. Plant Soil 1997, 191, 291–299. [Google Scholar] [CrossRef]
  30. Jarvis, P.; Rey, A.; Petsikos, C.; Wingate, L.; Rayment, M.; Pereira, J.; Banza, J.; David, J.; Miglietta, F.; Borghetti, M.; et al. Drying and wetting of Mediterranean soils stimulates decomposition and carbon dioxide emission: The “Birch effect”. Tree Physiol. 2007, 27, 929–940. [Google Scholar] [CrossRef] [Green Version]
  31. Franzluebbers, K.; Weaver, R.W.; Juo, A.S.R.; Franzluebbers, A.J. Carbon and nitrogen mineralization from cowpea plants part decomposing in moist and in repeatedly dried and wetted soil. Soil Biol. Biochem. 1994, 26, 1379–1387. [Google Scholar] [CrossRef]
  32. Karl, T.R.; Melillo, J.M.; Peterson, T.C. Global Climate Change Impacts in the United States; Cambridge University Press: Cambridge, UK, 2009; p. 188. [Google Scholar]
  33. Blackmer, G.C. Preliminary Bedrock Geologic Map of a Portion of the Wilmington 30- by 60-Minute Quadrangle, Southeastern Pennsylvania. 2005. Available online: http://maps.dcnr.pa.gov/publications/Default.aspx?id=94 (accessed on 9 November 2021).
  34. Krieg, C.S. The Fate of Particulate Nitrogen in Fluvial Systems. Master’s Thesis, University of Delaware, Newark, DE, USA, 2018. [Google Scholar]
  35. Francis, C.A.; Roberts, K.J.; Beman, J.M.; Santoro, A.E.; Oakley, B.B. Ubiquity and diversity of ammonia-oxidizing archaea in water columns and sediments of the ocean. Proc. Natl. Acad. Sci. USA 2005, 102, 14683–14688. [Google Scholar] [CrossRef] [PubMed] [Green Version]
  36. Rotthauwe, J.H.; Witzel, K.P.; Liesack, W. The ammonia monooxygenase structural gene amoA as a functional marker: Molecular fine-scale analysis of natural ammonia-oxidizing populations. Appl. Env. Microbiol. 1997, 63, 4704–4712. [Google Scholar] [CrossRef] [PubMed] [Green Version]
  37. Braker, G.; Fesefeldt, A.; Witzel, K.P. Development of PCR primer systems for amplification of nitrite reductase genes (nirK and nirS) to detect denitrifying bacteria in environmental samples. Appl. Env. Microbiol. 1998, 64, 3769–3775. [Google Scholar] [CrossRef] [Green Version]
  38. Mosier, A.C.; Francis, C.A. Denitrifier abundance and activity across the San Francisco Bay estuary. Environ. Microbiol. Rep. 2010, 2, 667–676. [Google Scholar] [CrossRef] [PubMed]
  39. Stelzer, R.S.; Scott, J.T.; Bartsch, L.A. Buried particulate organic carbon stimulates denitrification and nitrate retention in stream sediments at the groundwater–surface water interface. Freshw. Sci. 2015, 34, 161–171. [Google Scholar] [CrossRef]
  40. Thamdrup, B. New Pathways and Processes in the Global Nitrogen Cycle. Annu. Rev. Ecol. Evol. Syst. 2012, 43, 407–428. [Google Scholar] [CrossRef]
  41. Greenan, C.M.; Moorman, T.B.; Kaspar, T.C.; Parkin, T.B.; Jaynes, D.B. Comparing Carbon Substrates for Denitrification of Subsurface Drainage Water. J. Environ. Qual. 2006, 35, 824–829. [Google Scholar] [CrossRef] [PubMed] [Green Version]
  42. Barnes, R.T.; Smith, R.L.; Aiken, G.R. Linkages between denitrification and dissolved organic matter quality, Boulder Creek watershed, Colorado. J. Geophys. Res. Biogeosci. 2012, 117. [Google Scholar] [CrossRef] [Green Version]
  43. Stelzer, R.; Thad Scott, J.; Bartsch, L.; Parr, T. Particulate organic matter quality influences nitrate retention and denitrification in stream sediments: Evidence from a carbon burial experiment. Biogeochemistry 2014, 119, 387–402. [Google Scholar] [CrossRef]
  44. Yoshimura, C.; Fujii, M.; Omura, T.; Tockner, K. Instream release of dissolved organic matter from coarse and fine particulate organic matter of different origins. Biogeochemistry 2010, 100, 151–165. [Google Scholar] [CrossRef]
  45. Follett, R.F. Chapter 2-Transformation and Transport Processes of Nitrogen in Agricultural Systems. In Nitrogen in the Environment, 2nd ed.; Hatfield, J.L., Follett, R.F., Eds.; Academic Press: San Diego, CA, USA, 2008; pp. 19–50. [Google Scholar]
  46. Utomo, W.H.; Dexter, A.R. Changes in soil aggregate water stability induced by wetting and drying cycles in non-saturated soil. J. Soil Sci. 1982, 33, 623–637. [Google Scholar] [CrossRef]
  47. Denef, K.; Six, J.; Paustian, K.; Merckx, R. Importance of macroaggregate dynamics in controlling soil carbon stabilization: Short-term effects of physical disturbance induced by dry–wet cycles. Soil Biol. Biochem. 2001, 33, 2145–2153. [Google Scholar] [CrossRef]
  48. Bottner, P. Response of microbial biomass to alternate moist and dry conditions in a soil incubated with 14C- and 15N-labelled plant material. Soil Biol. Biochem. 1985, 17, 329–337. [Google Scholar] [CrossRef]
  49. Stark, J.M.; Firestone, M.K. Mechanisms for Soil Moisture Effects on Activity of Nitrifying Bacteria. Appl. Environ. Microbiol. 1995, 61, 218–221. [Google Scholar] [CrossRef] [Green Version]
  50. Fierer, N.; Schimel, J.P. Effects of drying–rewetting frequency on soil carbon and nitrogen transformations. Soil Biol. Biochem. 2002, 34, 777–787. [Google Scholar] [CrossRef]
  51. Fierer, N.; Schimel, J.P.; Holden, P.A. Influence of Drying-Rewetting Frequency on Soil Bacterial Community Structure. Microb. Ecol. 2003, 45, 63–71. [Google Scholar] [CrossRef]
  52. Borken, W.; Matzner, E. Reappraisal of drying and wetting effects on C and N mineralization and fluxes in soils. Glob. Chang. Biol. 2009, 15, 808–824. [Google Scholar] [CrossRef]
  53. Franzluebbers, A.J.; Haney, R.L.; Honeycutt, C.W.; Schomberg, H.H.; Hons, F.M. Flush of Carbon Dioxide Following Rewetting of Dried Soil Relates to Active Organic Pools. Soil Sci. Soc. Am. J. 2000, 64, 613–623. [Google Scholar] [CrossRef]
  54. Kim, D.-G.; Vargas, R.; Bond-Lamberty, B.; Turetsky, M.R. Effects of soil rewetting and thawing on soil gas fluxes: A review of current literature and suggestions for future research. Biogeosciences 2012, 9, 2459–2483. [Google Scholar] [CrossRef] [Green Version]
  55. Tant, C.J.; Rosemond, A.D.; First, M.R. Stream nutrient enrichment has a greater effect on coarse than on fine benthic organic matter. Freshw. Sci. 2013, 32, 1111–1121. [Google Scholar] [CrossRef] [Green Version]
  56. Guenet, B.; Danger, M.; Abbadie, L.; Lacroix, G. Priming effect: Bridging the gap between terrestrial and aquatic ecology. Ecology 2010, 91, 2850–2861. [Google Scholar] [CrossRef]
  57. Guenet, B.; Danger, M.; Harrault, L.; Allard, B.; Jauset-alcala, M.; Bardoux, G.; Benest, D.; Abbadie, L.; Lacroix, G. Fast mineralization of land-born C in inland waters: First experimental evidences of aquatic priming effect. Hydrobiologia 2014, 721, 35–44. [Google Scholar] [CrossRef]
  58. Chesapeake Bay Program. Chesapeake Bay TMDL Executive Summary; Chesapeake Bay Program Office: Annapolis, MD, USA, 2018. [Google Scholar]
  59. Baird, D.; Ulanowicz, R.E.; Boynton, W.R. Seasonal Nitrogen Dynamics in Chesapeake Bay: A Network Approach. Estuar. Coast. Shelf Sci. 1995, 41, 137–162. [Google Scholar] [CrossRef]
  60. Bronk, D.A.; Glibert, P.M.; Malone, T.C.; Banahan, S.; Sahlsten, E. Inorganic and organic nitrogen cycling in Chesapeake Bay: Autotrophic versus heterotrophic processes and relationships to carbon flux. Aquat. Microb. Ecol. 1998, 15, 177–189. [Google Scholar] [CrossRef]
  61. Howarth, R.W.; Billen, G.; Swaney, D.; Townsend, A.; Jaworski, N.; Lajtha, K.; Downing, J.A.; Elmgren, R.; Caraco, N.; Jordan, T.; et al. Regional Nitrogen Budgets and Riverine N & P Fluxes for the Drainages to the North Atlantic Ocean: Natural and Human Influences. Biogeochemistry 1996, 35, 75–139. [Google Scholar]
  62. Boynton, W.R.; Garber, J.H.; Summers, R.; Kemp, W.M. Inputs, Transformations, and Transport of Nitrogen and Phosphorus in Chesapeake Bay and Selected Tributaries. Estuaries 1995, 18, 285–314. [Google Scholar] [CrossRef]
  63. Mbabazi, J.; Inoue, T.; Yokota, K.; Saga, M. Variability of particulate bioavailable phosphorus, particulate organic carbon and nitrogen in agricultural and urban rivers. J. Environ. Chem. Eng. 2019, 7, 103086. [Google Scholar] [CrossRef]
  64. Jani, J.; Yang, Y.; Lusk, M.G.; Toor, G.S. Composition of nitrogen in urban residential stormwater runoff: Concentrations, loads, and source characterization of nitrate and organic nitrogen. PLoS ONE 2020, 15, e0229715. [Google Scholar] [CrossRef] [PubMed] [Green Version]
Figure 1. Watershed sources of particulate material and sediments during sampling and their placement in buckets for mesocosm analysis. The sources included—(A) forest floor humus; (B) upland mineral A horizon soil; (C) stream bank soil; (D) floodplain storm deposit; and (E) stream bed sediments.
Water 13 03182 g001
Figure 2. Percent volumetric water content for the five sources across the two moisture regimes: regime 1—continuously moist and regime 2—dry–wet cycle.
Water 13 03182 g002
Figure 3. Sediment mean %TC and %TN contents for the five sources and two moisture regimes for day 0 (a,b) and day 56 (c,d). Regime 1: continuously moist and regime 2: dry–wet cycle are indicated by the top and bottom panels, respectively in (c,d). Molar carbon to nitrogen (C:N) for the sources are indicated next to the boxes. The lower bound of the box represents the first quartile (25%), the upper bound represents the third quartile (75%), the horizontal line in the box is the median, whereas the whiskers represent points that fall outside the quartiles but are within 1.5 times the interquartile range.
Water 13 03182 g003
Figure 4. Porewater masses of N species for the five sources and two moisture regimes for day 0 and day 50. Regime 1: continuously moist and regime 2: dry–wet cycle.
Water 13 03182 g004
Figure 5. Porewater mass of DOC for the five sources and two moisture regimes for day 0 and day 50. Regime 1: continuously moist and regime 2: dry–wet cycle.
Water 13 03182 g005
Figure 6. Temporal patterns of porewater-dissolved N species–total dissolved N (red), nitrate-N (orange), ammonium-N (purple) and dissolved organic N (green) over the incubation period for the five sources and two moisture regimes. Regime 1: continuously moist and regime 2: dry-wet cycle.
Water 13 03182 g006
Figure 7. Temporal patterns of porewater DOC over the incubation period for the five sources and two moisture regimes. Regime 1: continuously moist, and regime 2: dry-wet cycle.
Water 13 03182 g007
Figure 8. Comparison of net change in porewater-dissolved N and C mass per unit weight of the source sediment. Negative values indicate consumption (sink) of the solute while positive values indicate release (source) of solutes.
Water 13 03182 g008
Figure 9. Comparison of initial (day 0) and final (day 56) nitrification and denitrification gene abundances (copy number/µg of DNA) for forest floor humus and storm deposit by moisture regimes. Nitrification genes are the sum of AOA and AOB (top) and denitrification genes are the sum of nirS and nirK (bottom). Bars and error bars denote gene abundance means and standard deviation.
Water 13 03182 g009
Figure 10. Temporal changes in nitrification (red) and denitrification (black) gene abundances (copy number/µg of DNA) over the incubation period for the five sources and two moisture regimes. Nitrification and denitrification gene abundance measurements were taken on day 0, 4, 25, 26, 45, and 56 and their means are reported as points on the graph. Standard deviation is denoted with error bars.
Water 13 03182 g010
Publisher’s Note: MDPI stays neutral with regard to jurisdictional claims in published maps and institutional affiliations.

