Article

Characterization and Polyculture Analysis of Microalgae Strains Based on Biomass Production and Nutrient Consumption, and Bacterial Community in Municipal Wastewater

School of Civil Engineering, Southeast University, Nanjing 211189, China
*
Authors to whom correspondence should be addressed.
Water 2021, 13(22), 3190; https://doi.org/10.3390/w13223190
Submission received: 15 September 2021 / Revised: 5 November 2021 / Accepted: 8 November 2021 / Published: 11 November 2021
(This article belongs to the Special Issue Biodegradation of Persistent Pollutants in Wastewater)

Abstract

:
Polyculture of microalgae could enhance biomass production. It is crucial to select the proper combination of microbial polyculture which can achieve a positive impact. Ten microalgae suitable for healthy growth in municipal wastewater were selected. Simulated wastewater was used to conduct experiments on the cultivation of single microalgae. Possible combinations of microalgae were analyzed from three aspects: the potential for conversion into biofuels, the consumption of different forms of nitrogen and phosphorus, and the structure of microalgae bacterial communities. From the perspective of converting to biocrude, Leptolyngbya boryana with high protein content was found unsuitable as a biomass raw material. Non-metric multidimensional scale analysis of different forms of nitrogen and phosphorus consumption shows the preference of the microalgae community for the use of nitrogen and phosphorus. By analyzing the bacterial community structure, it was found that microalgae have a significant impact on the bacterial community. We believe that it is more likely to improve the production efficiency of microalgae by establishing the combination of microalgae with high biocrude conversion efficiency, different nitrogen and phosphorus utilization preferences, and large difference in bacterial community structure.

1. Introduction

A diverse energy system has been established in the world, primarily including fossil energy, nuclear energy, renewable energy, and hydro-energy. With people paying more attention to environmental issues such as climate change and energy crisis, the proportion of renewable energy in energy supply has been increasing in the past few years, increasing by 14.5% in 2019, the biggest driving factor in energy consumption growth except for natural gas [1]. The average growth rate of biofuel production in 2018 was 9.7%, the highest level since 2010, but the total proportion of biofuel was still less than 0.7% of global primary energy consumption in 2018.
Researchers have explored the possibility of crops, agricultural, forestry residues, and microalgae as raw materials for biomass. Microalgae may be the most potential biomass raw material [2]. Microalgae grow more quickly, and their photosynthetic efficiency can reach more than 10%, which is 10 to 50 times higher than terrestrial plants [3,4]. The high productivity potential of microalgae is one of the main driving factors for its use as a raw material for biofuel production. In addition, microalgae also have the characteristics of low labor demand, a short life cycle unrestricted by location, and ease of commercial production [5]. However, there are still many problems in the commercial application of using microalgae as biomass raw materials. The density of outdoor cultivation of microalgae is too low, steady biomass production at a large scale in outdoor venues is difficult, high biomass yield and high lipid content are usually contradictory, the cost of harvesting microalgae is too expensive, etc. [6,7]. To turn microalgae biofuels into a commercially feasible method, the microalgae cultivation system needs to have the following characteristics: high biomass yield, high biomass quality and stable operation [8]. Cost reduction is the key to the commercialization of biofuels and using municipal wastewater as a culture medium is very helpful in this regard [9].
A wide range of microalgae strains were verified as capable of utilizing nitrogen (N) and phosphorus (P) in wastewaters as nutrients for their growth [10]. The proportion of C:P and C:N in microalgae is lower than that in terrestrial primary producers, and the N and P nutrients are more critical to the growth of microalgae [11,12]. The biological invader is an important factor in any system. The system must have sufficient defense or tolerance to avoid system breakdown because the increased cost of disinfection is unbearable [13]. However, using wastewater for farming in outdoor open pond facilities may be the only way to rapidly cultivate microalgae on the scale required by commercial production [14]. The species in the community and their role in the ecosystem can determine the stability and productivity of the ecosystem. Microalgae have an important influence on the community structure of their habitat. A high-diversity microalgae system may result in more robust operation and high productivity. Compared to microalgae monocultures, microalgae polycultures with higher diversity have more functional genes, so they are more stable and resistant to species invasion [3,15].
The improvement of strains through genetic modification technology is the most likely way to achieve large-scale commercial production [13]. Genetic engineering and community are not reciprocally exclusive methods. A community with multiple microalgae can exhibit more biological characteristics than a single microalgae community, which has no relationship with whether the microalgae has been gene-edited [16]. These microalgae polycultures can increase stability and productivity, apparently by using resources more efficiently through closer ecological niches [14]. The research of Godwin et al. on the cultivation of polyculture microalgae also proved that, although polyculture may not maximize any single function, having more functionality means that polyculture can show better robustness when subjected to external influences [17]. Therefore, more complex microalgae polyculture communities may use resources more efficiently, helping to increase biomass while removing pollutants [18,19]. Not all microalgae culture can have a positive effect on the production of biofuels because there is always a nutritional competition relationship between microalgae [20]. Competition may increase the efficiency of nutrient utilization, but may crash the system. In addition to microalgae, the microbial community also plays an important role, and different microalgae also have an impact on the structure of the microbial community. Previous research showed that condition-dependent mutualistic relationships between the microbial and microalgae populations directly affect the efficiency of microalgae nutrient absorption and biomass production [21]. There are dozens of species of microalgae that can grow in wastewater, and there are hundreds of combinations in microalgae cultivation. Therefore, clarifying some principles for establishing combined microalgae culture will help the researchers to find a suitable microalgae polyculture combination more quickly.
Mixed and highly complex communities might have a higher capacity for resource use and allocation that could contribute to increasing biomass and increase the stability of the community. The ability to consume the organic molecules present in these effluents is strongly dependent on the substrate characteristics. Municipal wastewater is the best potential substrate for the commercial cultivation of microalgae. It is not clear which characteristics should be considered when municipal wastewater is used as a culture medium to establish polyculture. To explore this problem, it is necessary to clarify the difference in growth characteristics of single microalgae in wastewater. Different microalgae were inoculated into simulated wastewater at the same initial optical density to detect the difference in their growth process. First of all, we should pay attention to the yield of biomass, as well as the difference in growth rate. The second aspect is to focus on the biomass composition and the potential for conversion to biofuels of each microalgae. The third goal is to analyze the reasons for the difference in nutrient utilization based on the genetic sequencing of the bacteria to verify the influence of different microalgae on the bacterial community structure. Combined with the results of the above three aspects, a possible combination of polyculture microalgae was proposed.

2. Materials and Methods

2.1. Microalgae Strains and Proliferation Culture

The microalgae species used in this study are shown in Table 1. The principles for the selection of microalgae species are as follows: (1) microalgae selected by the Aquatic Species Program, (2) microalgae proved to be suitable for growth in wastewater, (3) microalgae species have a large span on the molecular phylogenetic tree. The microalgae species were purchased from Freshwater Microalgae Culture Collection at the Institute of Hydrobiology (FACHB) of the Institute of Hydrobiology, Chinese Academy of Sciences. The identified microalgae cells were placed on agar plates and cultivated under light:dark cycles of 12 h:12h at 25 °C; the light source was LED tubes (25 Wm−2). Microalgae strains were chosen and moved to new agar plates. Repeat this several times until a single colony is selected and moved to a BG11 medium for growth [22]. Colonies were cultivated at 25 °C at light:dark cycles of 12 h:12 h and were flushed under an airflow of 10 mLs−1L−1 for 12 h with light (810 μmolm2s−1). After 7 days of reproduction, under the same culture conditions, 100 mL of microalgae liquid with a higher optical density were transferred to a 1 L culture vessel, and the newly configured BG11 medium added to expand the culture.

2.2. Simulated Municipal Wastewater Culture Medium

To reduce the difficulty of the mechanism of analysis and detection caused by the complicated water quality and fluctuating water volume of actual domestic wastewater in the experiment, simulated water distribution was used to simulate actual domestic wastewater as the water source. The simulated wastewater is configured according to the actual municipal wastewater behind the municipal wastewater treatment plant grid in Nanjing, China. Nitrate (NO3-N), ammonium (NH4+-N), and organic nitrogen are respectively selected as potassium nitrate (KNO3), ammonium chloride (NH4Cl), and urea (with a nitrogen content of 45%) and simulated following the ratio of nitrogen element 90:8:2. Inorganic phosphorus and organic phosphorus are respectively selected potassium dihydrogen phosphate (KH2PO4) and lecithin according to the element ratio of 4:1. On the basis of BG11 medium, adjust the composition as follows (g/100 L): C6H12O6 (22.5), NH4Cl (18.9), carbamide (0.945), KNO3 (0.78), KH2PO4 (2.3), lecithin (2.5), MgSO4·7H2O (13.79), FeSO4·7H2O (0.6), CuSO4·5H2O (0.01), MnSO4·H2O (0.04), CaCl2·2H2O (0.57), NaHCO3 (8.7), CoCl2·6H2O (0.39), NiCl2·6H2O (0.39), NiCl2·6H2O (0.19), H3BO3 (0.02), 100 mL of A5 solution. The water quality of the simulated wastewater is as follows: CODMn (253), BOD5 (170), TN (57.8), NO3-N (1.15), NH4+-N (51.8), organic nitrogen (4.4), TP (5.1), PO43+-P (4.08), and organic phosphorus (1.2) mgL−1.

2.3. Microalgal Culture Conditions

The microalgae proliferated by BG11 was collected and centrifuged at 1000× g for 10 min, and then removed the supernatant. Next, the microalgae were transferred from the bottom of the centrifuge tube to different volumes of simulated wastewater, and the optical density was measured. The dilution ratio was calculated based on the volume of the microalgae liquid before centrifugation and the volume of the simulated wastewater. The relationship curve between the optical density at 680 nm and the dilution ratio was drawn and the dilution ratio was calculated when the absorbance was 0.1 by the curve. The required microalgae liquid volume was determined according to the dilution ratio, and the microalgae was inoculated into the simulated wastewater culture medium after centrifugation.
The experimental device mainly includes three parts: culture device, ventilation device and light device. The culture device is cylindrical, the working volume is 3 L, the diameter is 15 cm and the height is 21 cm. The depth of the microalgae cultivation pond is set according to the HRAPS (high rate microalgae ponds) which are commonly used for outdoor cultivation, about 20 cm [31]. After adding simulated wastewater, the water depth is 17 cm, closer to the commercial cultivation scenario compared to other laboratories conditions. Intermittent ventilation culture was used in the experiment, and ventilation was stopped in the dark cycle. The airflow rate is 10 mLs−1L−1, which is transported to the bottom of the cultivation device by the hose, and the gas is discharged by connecting the bubble stone. Using LED light source to simulate sunlight, the photosynthetically effective radiation of light source is 810 μmolm2s−1, and the light: dark illumination cycle is 12 h:12 h. Three parallel test groups were set for each species of microalgae. The microalgae were grown in the experimental apparatus for 18 days.

2.4. Analytical Methods

2.4.1. Biomass Analysis

The optical density of microalgae at 680 nm was measured with an ultraviolet spectrophotometer, which indirectly reflects the proliferation of microalgae. Take 100 mL of microalgae liquid and filter through pre-weighed glass-fiber filter paper (W1). Weigh the filtered filter paper after drying at 105 °C for 2 h (W2), and calculate the dry weight of the microalgae based on the weight difference (W2-W1) [32].
The methyl tert-butyl ether (MTBE) method was used to determine microalgal lipid [33]. The detailed procedures used in this research are as follows: (1) 80 mL of microalgal liquid was centrifuged at 1000× g for 10 min, then the supernatant liquid was removed; (2) 3 mL methanol was added to the centrifuge tube for vortex oscillation; (3) 10 mL MTBE was added and the reagent was cultivated on a shaking table at 25 °C for 1 h; (4) 2.5 mL water was added to induce phase separation; (5) After incubation at 25 °C for 10 min, the upper organic phase was collected after the sample was centrifuged at 1000× g for 10 min; (6) the organic phase is transferred in a weighed tin tray, which was placed in the clean fume hood; and (7) after the organic solvent is completely volatilized, the tin tray is transferred to the oven and dried at 80 °C to constant weight. The lipid yield is calculated according to the quality difference between the front and the back.
The phenol-sulfuric acid method was built on following the work of Dubis et al. [34]. The detailed procedures used in this research are as follows: (1) take 15 mL sample, 1000× g centrifuge for 10 min, and remove the supernatant; (2) the centrifuged microalgae were suspended in 40% hydrochloric acid solution (v/v), and the cells were broken by ultrasonic wave for 10 min; (3) then the sample is placed in a water bath at 100 °C for 30 min; (4) 2 mL sample solution is put into a glass tube, 1 mL 5% phenol solution added, and after shaking 5 mL concentrated sulfuric acid is added, shaken and mixed quickly again, and placed at 25 °C for 30 min; and (5) the light absorption at 490  nm was measured on the spectrophotometer and the carbohydrate concentration was determined according to a standard curve. The protein extraction and detection methods were followed in current study for experimental purpose [35,36].
Due to the development of hydrothermal liquefaction (HTL), compared with the previous lipid extraction technology, full use of the nutritional cost of microalgae can be made, including carbohydrate and protein to more accurately evaluate the ability of these microalgae to transform into biological crude products by HTL. The effective biomass yield and conversion efficiency were calculated according to the content of lipid, carbohydrate and protein [37]. The estimation formula used is as follows:
Biocrude = Lipid × 0.8 + Carbohydrate × 0.18 + Protein × 0.06
Biocrude   conversion   rate = Biocrude Lipid + Carbohydrate + Protein

2.4.2. Nitrogen and Phosphorus Analysis

Samples were taken at the end of the experiments and were analyzed for Ammonia (NH4+-N), Nitrate (NO3-N), Total Kjeldahl nitrogen (TKN), phosphate (PO43+-P) and total phosphorus (TP). Microalgae liquid was filtered for analysis with a 0.22 μm poly-ethersulfone membrane filter. The determination of Ammonia, Nitrate, TKN and phosphate in aqueous samples was conducted according to Standard Methods [38]. Specifically, COD was analyzed using the permanganate index method, ammonia titration with standard H2SO4 (after preliminary distillation), nitrate colorimetrically using the cadmium reduction method, TKN after digestion, and distillation and titration of ammonium nitrogen and phosphate and TP using the ascorbic acid method, The TP was digested with potassium persulfate before detection. All samples were centrifuged and filtered through Millipore membrane filters (4.7 cm diameter, 0.45 μm pore diameter) to remove solids and color before analyses. Then the concentration of organic nitrogen and organic phosphorus were calculated for subsequent analysis.
Organonitrogen = TKN NH 4 +
Organophosphorus = TP PO 4 3
The difference in the utilization of various types of nitrogen and phosphorus is an important feature of microalgae and an indirect way to reflect differences in microalgae communities. Therefore, non-metric multidimensional scale analysis (NMDS) was performed on the utilization of five nutrients of ammonia, nitrate, organonitrogen, phosphate and organophosphorus through various microalgae. SPSS 18 (SPSS Inc., Chicago, IL, USA) was used for NMDS analysis. First, calculate the Euclidean distance between each sample depending on nutrient consumption. Then convert it between −1 and 1 according to the variable to form a dissimilarity distance matrix. To decompose the sample distance matrix by dimensionality reduction, a three-dimensional distance map between samples is formed.

2.5. Amplicon Sequencing and Data Analysis

On the 16th day of the experiment, the group with the highest absorbance among three parallel experiments and water samples were collected. The water sample containing microalgae was filtered with a 0.22 μm filter membrane for bacterial 16S rRNA sequencing analysis. The samples were transported on dry ice and stored at −80 °C until the sequencing analysis began. The primers 515F (GTGCCAGCMGCCGCGGTAA) and 926R (CCGTCAATTCMTTTRAGTTT) were used in this sequencing, which targeted the V4-V5 region of Bacteria. The sequencing strategy uses NovaSeq-PE250, and each sample has about 60,000 effective sequences. Data analysis was performed using the Quantitative Insights into Microbial Ecology 2 (QIIME 2 2019.4 https://qiime2.org, accessed on 15 March 2021) an open source software package was used for denoising and clustering analysis [39]. The generated bacterial clusters were compared to the Silva132 database, and the classify-sklearn algorithm was used to enter the species taxonomy annotation [40]. Based on the results of sequence species taxonomy annotations, the relative abundance of bacterial communities in each sample was analyzed at the phylum level. Then, through the heat map analysis, we can compare the differences of the bacterial community structure more intuitively, to determine the influence of different microalgae on the bacterial community structure, combining the functions of typical bacteria to analyze possible polyculture microalgae combinations.

3. Result and Discussion

3.1. Biomass of Microalgae

The growth rate and biomass yield of microalgae are important indicators to measure whether they are suitable for biomass energy resources. The maximum optical density and the cycle to reach the maximum optical density of microalgae in the simulated wastewater are very different. Compared to the initial inoculation of 0.1, the optical density increased more than four times. Although the maximum optical density of the three groups of experiments were quite different, the average multiplication efficiency was nearly 12 times, and the maximum average optical density was 1.19. Scenedesmus obliquus showed the best growth performance in terms of maximum optical density. It should be noted that the maximum optical density of Scenedesmus obliquus was reached on the 16th day, which was longer than that of other microalgae. It also reflected that the efficiency of Scenedesmus obliquus proliferation in wastewater was not high. This verified the experiments of many researchers, that Scenedesmus obliquus is suitable to grow in wastewater [41]. Leptolyngbya boryana and Micractinium sp. are the second and third, respectively. Leptolyngbya boryana is better than Micractinium sp. in maximum optical density and growth rate, but Micractinium sp. is more stable and less different than Leptolyngbya boryana, which may indicate that Micractinium sp. is more adaptable to adverse environmental factors. The maximum optical densities of Synechocystis sp., Chlamydomonas reinhardtii, Nannochloropsis oceanica and Spirulina sp. were similar, ranging from 0.7 to 0.8, which were close to the average values of each species. Compared with Nannochloropsis oceanica, Synechocystis sp. takes a longer time to reach the maximum optical density of Chlamydomonas reinhardtii and Spirulina sp. In contrast, Chlamydomonas reinhardtii and Spirulina sp. are more suitable for growing in simulated wastewater. Leptolyngbya boryana, Pediastrum sp. and Chlorella pyrenoidosa had low maximum optical density, and did not show strong adaptability in simulated wastewater.
It should be pointed out that, compared to other studies such as the photobioreactor, the water depth in this experiment is greater, therefore the maximum optical density achieved was lower [41]. The aeration has not undergone purification treatment, which is closer to the conditions of outdoor open high rate algae ponds. Therefore, the data in the parallel experiments are quite different. This may reflect the robustness of various microalgae to unknown environmental conditions. Combined with the maximum optical density, Pediastrum sp., Synechocystis sp., and Chlorella pyrenoidosa have relatively small fluctuations. From the time to reach the maximum optical density, Scenedesmus obliquus and Synechocystis sp. are more stable.
When microalgae are used as biomass energy resources, we assume that the higher the lipid content produced the better, because it is conducive to improving the efficiency of microalgae conversion into biofuel. Therefore, on the 16th day, the dry weight of microalgae and the contents of lipid, carbohydrate and protein to dry weight were measured, presented in Figure 1b. Scenedesmus obliquus had the highest lipid content, and the average value of the three groups reached 48%, with little difference. The lipid content of Micractinium sp., Leptolyngbya boryana, Desmodesmus sp., Pediatrum sp. and Synechocystis sp. was 30–40%. The lipid production of other microalgae was less than 25%. From the perspective of lipid percentage, Micractinium sp., Leptolyngbya boryana, Desmodesmus sp., Pediastrum sp. and Scenedesmus obliquus have more potential.

3.2. Potential as Biocrude

Comparing results presented in Figure 1a,b, it is found that optical density, an indirect measurement of biomass, shows a large deviation in evaluating the potential of microalgae as biomass raw materials. Different from the optical density and dry weight, the biocrude product yield and conversion rate calculated based on the composition of the microalgae can more intuitively evaluate the potential of the microalgae as a biomass raw material. As for the method for biocrude, the result is shown in Figure 2. Although the lipid content of Pediastrum sp. is not the highest compared to other microalgae, as a raw material for biomass energy production it has the highest production efficiency in simulated wastewater. Micractinium sp., Desmodesmus sp., Scenedesmus obliquus and Synechocystis sp. can also achieve higher production efficiency. Scenedesmus obliquus has the highest conversion efficiency, which is due to its high lipid content. Many studies have shown that under the condition of nitrogen stress, it can increase the proportion of lipid in microalgae, but it will also reduce the total biomass. If we use environmental stress to increase the proportion of lipid in commercial culture, we usually need a two-stage culture method [42]. Environmental changes usually affect the production efficiency of microalgae, which will further increase the material cost and time cost of microalgae, and the yield may not be significant. Therefore, this experiment further verified that when hydrothermal liquefaction (HTL) was used as the follow-up process, it might not be appropriate to increase the proportion of lipid through environmental stress. Biocrude mainly consists of hydrocarbons and O/N-containing compounds [43]. Some nitrogen and sulfur contained in proteins may be released to the biocrude lipid via HTL, resulting in the release of odor and negatively affecting combustion and other properties of biocrude lipid [44]. The protein content contributes little to the conversion of microalgae into crude biological products. From the perspective of the production of these, the high protein content in microalgae means that the utilization efficiency of nitrogen is reduced. Without the use of genetic engineering methods, microalgae with high protein content should be excluded from the list of candidates for biomass fuel raw materials. From this perspective, Leptolyngbya boryana and Nannochloropsis oceanica are not suitable as raw materials for biomass fuels. In contrast, if the two-stage cultivation method is adopted, whether the result of the increase in lipid content and the decrease in overall biomass production can have a positive impact on the profitability of biocrude products should be studied.

3.3. Nitrogen and Phosphorus Consumption

Nitrogen and phosphorus exist in different forms in wastewater, although microalgae use these nitrogen and phosphorus metabolites similarly. Before those N and P are utilized by microalgae, it is usually necessary for the community microorganisms to work together to transform various forms of nitrogen and phosphorus into suitable forms. The research of FAN et al. showed that some lipid metabolism genes might originate from bacteria via horizontal gene transfer [45]. The preferred order of N utilization by microalgae is NH4+-N > NO3-N > NO2-N > urea [46]. However, there are still differences in the utilization of nitrogen by different microalgae, which will affect the function of community, and then affect the utilization efficiency of nitrogen and phosphorus in simulated wastewater. The differences in nitrogen and phosphorus consumption by various microalgae are shown in Figure 3. Desmodesmus sp. and Pediastrum sp. consumed more nitrogen than other microalgae, and the nitrogen concentration decreased from 57.8 mg/L to nearly 30 mg/L. Desmodesmus sp. mainly consumed ammonium nitrogen. At the end of the experiment, the concentrations of nitrate and organic nitrogen increased compared to the initial concentration. When the total nitrogen decreased, the three forms of nitrogen decreased in varying degrees. The concentration of nitrogen in simulated wastewater of Micractinium sp. and Scenedesmus obliquus decreased by about 20%, and the concentration of nitrate also increased. The main contribution of the decrease of TN concentration came from the consumption of ammonia. The decrease of the TN concentration of the other microalgae was not obvious, which was also confirmed in the biomass. The biomass yield of these microalgae was low. It should be pointed out that the concentration of total nitrogen in the culture medium of Chlorella pyrenoidosa was higher than that in the initial test, and the concentrations of organic nitrogen and NO3-N increased several times compared to that in the initial test.
The consumption of phosphorus in simulated wastewater is shown in Figure 3b. The TP concentration in Scenedesmus obliquus medium was only one-fifth of the original concentration, and the inorganic phosphorus and organic phosphorus decreased. The concentration of phosphorus in Micractinium sp., Desmodesmus sp., Pediastrum sp. and Nannochloropsis oceanica media was also reduced by about 60%. Desmodesmus sp. was different from the other three groups in that the concentration of total phosphorus was about twice as high as the initial concentration. In the other algal media, the decrease of TP concentration was not significant. This shows that the utilization of nitrogen and phosphorus by various microalgae in simulated wastewater is different, which is the embodiment of the different functions of these communities. It is one of the methods to increase the functional diversity of the community to find microalgae with different functions.
It is widely accepted that inorganic phosphate is the most preferred P form for algal uptake [47]. Organic phosphorus can be converted into inorganic phosphorus with the help of microbial communities. Since the organic phosphorus in wastewater is one-fifth, increasing the use of organic phosphorus can help increase the production of microalgae. In the experiments of Desmodesmus sp., Scenedesmus obliquus, Synechocystis sp. and Chlorella pyrenoidosa, the concentration of organophosphorus decreased significantly, which may indicate that there are symbiotic microorganisms that can help decompose organophosphorus in the community. Mixing them with microalgae with high phosphorus utilization efficiency may further increase the phosphorus utilization efficiency of polyculture microalgae.
To intuitively compare the differences of nitrogen and phosphorus utilization by these microalgae communities, NMDS analysis was carried out on the differences in five nutrients’ utilization by these microalgae communities. The nutrient consumption of five kinds of nitrogen and phosphorus was analyzed by NMDS. All kinds of factor are reduced to three dimensions. As shown in Figure 4a, Desmodesmus sp., Chlorella pyrenoidosa and Pediastrum sp. are distributed around the rest of the microalgae, which is far from other groups, indicating that the utilization of nitrogen and phosphorus nutrients by these microalgae communities is quite different from that of other species. As can be seen from Figure 4b, Synechocystis sp. is also far from other experimental groups. Therefore, we think that the difference in nutrient utilization of these four microalgae is larger than that of other microalgae. By adding microorganisms that are beneficial to microalgae to increase lipid or biomass production, it is difficult to increase the abundance of the microorganisms in the community for a long time and then establish a stable community. Therefore, considering the method of polyculture microalgae cultivation may have a greater chance of establishing a stable and efficient community. When we consider the polyculture of microalgae, we should consider mixing these microalgae with microalgae that are located in the center of Figure 4 and have a higher yield. This may be more efficient in the use of nitrogen and phosphorus, and achieve the purpose of improving biomass production and robustness. Many past studies have paid more attention to the yield and quality of microalgae biomass in the process of screening microalgae, and have ignored the functional differences that can be brought about by differences in the community structure of microalgae. Therefore, many microalgae suitable for multi-cultivation may have been missed. Subsequent research should use nutrient component consumption and community structure, combined with metabolic analysis, to discover microalgae that may be suitable for combined culture.

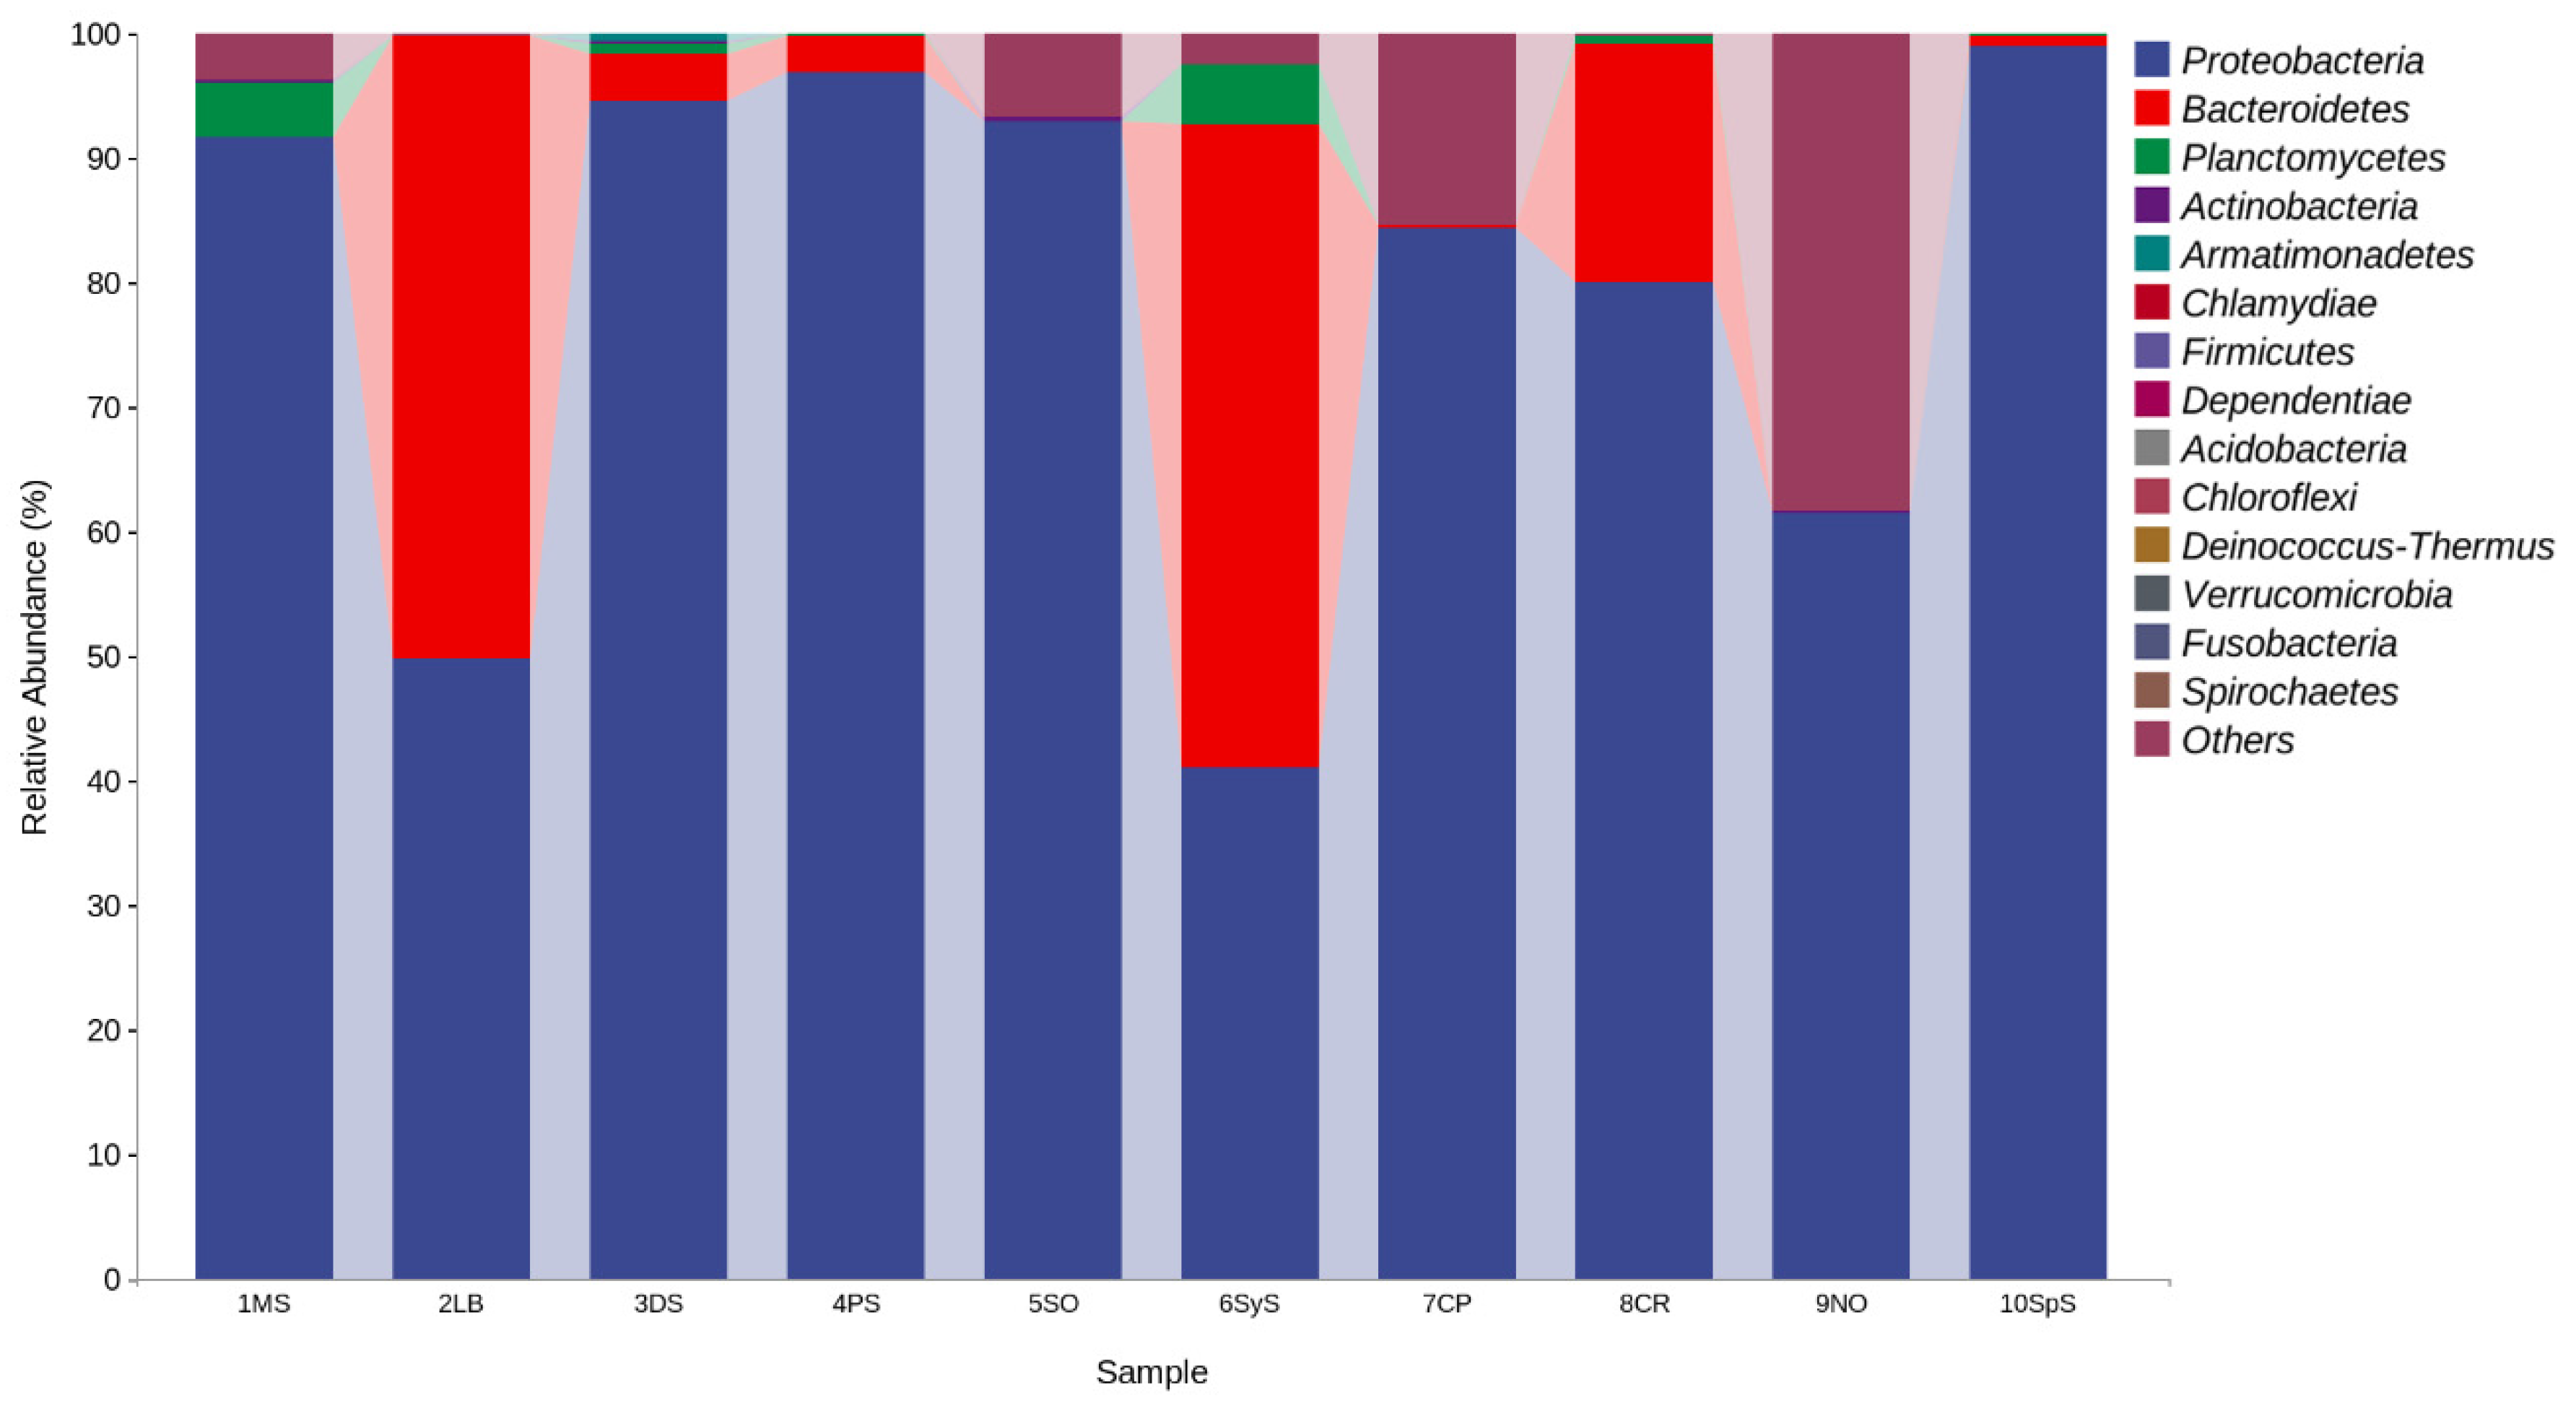
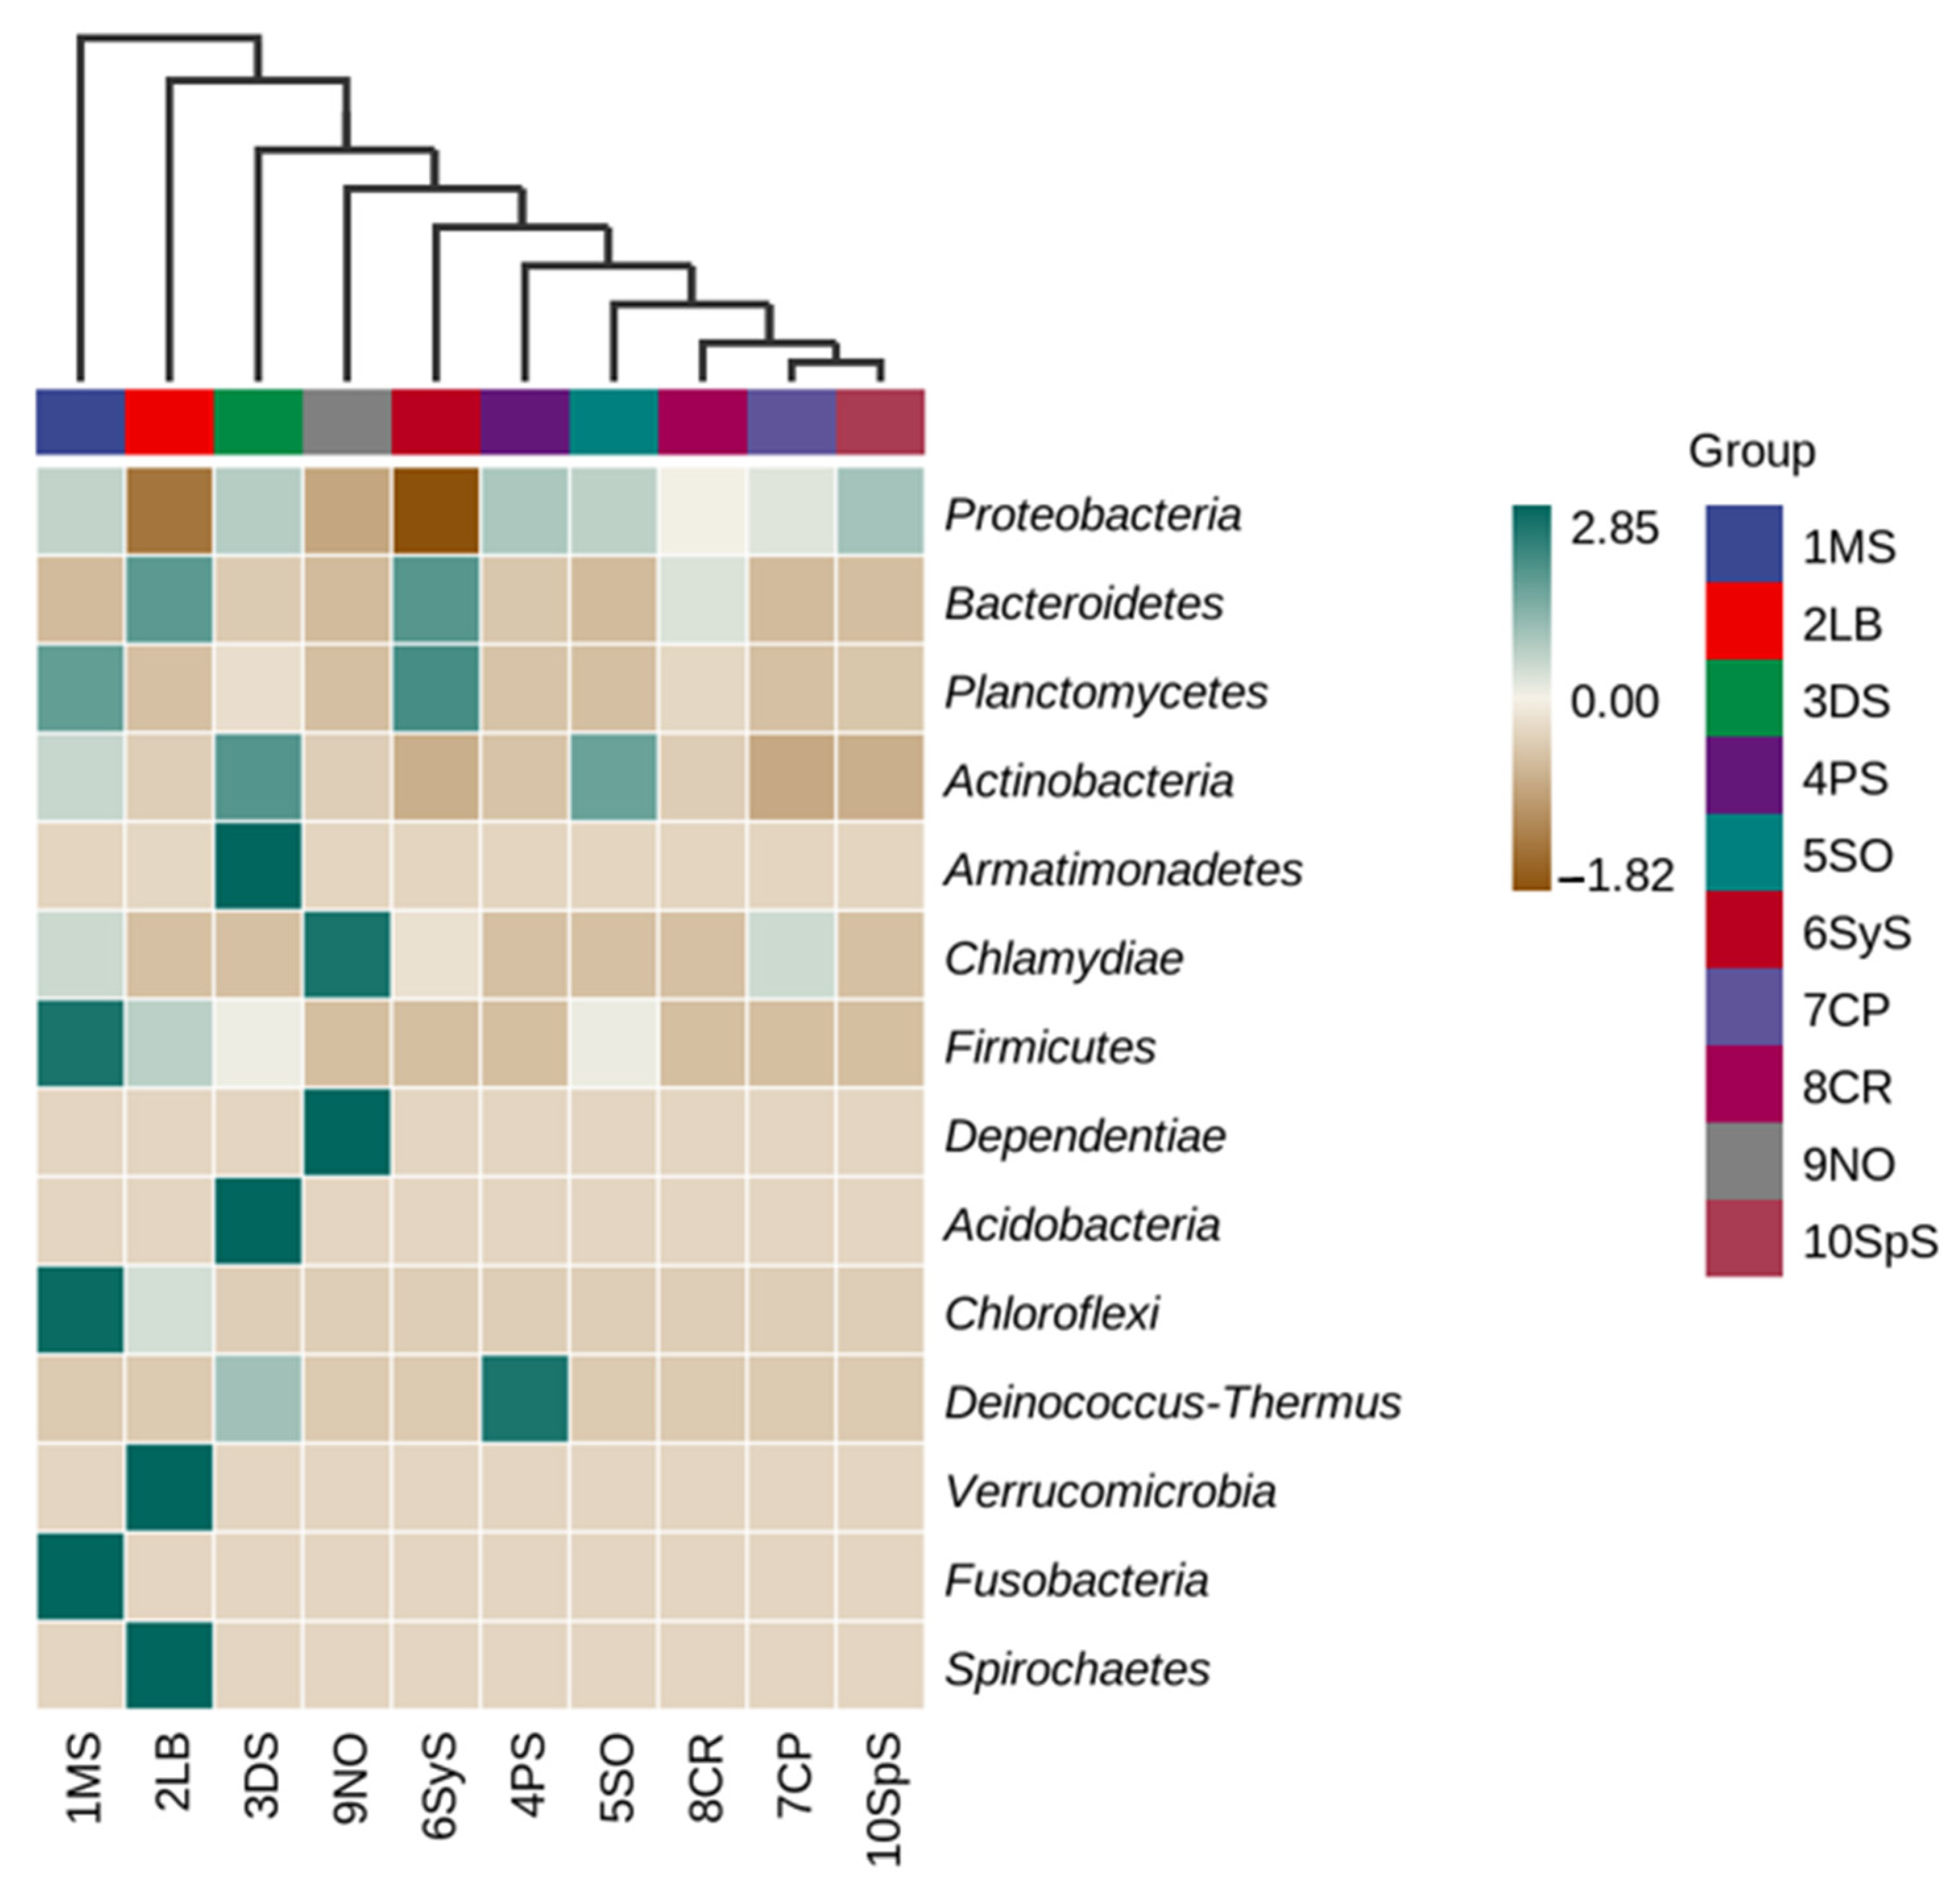
3.4. Bacterial Community Structure

The sequenced abundance of ten different microalgae experimental groups was analyzed at different species classification levels, as shown in Figure 5. Except for Leptolyngbya boryana and Synechocystis sp., the other groups have the highest relative abundance of Proteobacteria. Proteobacteria are widely present in soil and wastewater, and have the function of degrading complex macromolecular organic matter [48]. The relative abundance of Bacteroidetes is the largest in the two experimental groups, Leptolyngbya boryana and Synechocystis sp. Bacteroidetes can degrade macromolecular organic matter and can also lyse cyanobacteria cells. The relative abundance of Dependentiae (TM6) is also high, accounting for more than 30% of the Nannochloropsis oceanica experimental group. At the level of phylum classification, the experimental groups are quite different in bacterial community structure, which reflects the key position of microalgal influence on bacterial communities.
The heatmap can highlight the influence of various microalgae on the bacterial community. Through cluster analysis, the differences of bacterial community structure in each microalgae culture medium can be more directly expressed, and the analysis of bacterial function can provide a basis for establishing the combination of poly-cultured microalgae, as shown in Figure 6. As the dominant bacteria in wastewater, Proteo-bacteria have little difference in relative abundance between groups. No. 4 Pediastrum sp. is the microalgae species with the greatest potential for producing biocrude. The abundance of Deinococcus-Thermus in its community is significantly higher than that of other groups. Deinococcus-Thermus has the ability to deal with extreme pressures, including radiation, oxidation, dryness and high temperature. The reason is that Deinococcus-Thermus can synthesize carotenoids [48]. Carotenoids can increase the absorption cross-section of the light system to absorb radiant energy. The experimental groups of No. 3 Desmodesmus sp. and No. 6 Synechocystis sp. differed significantly from other groups in the consumption of nitrogen and phosphorus. The abundance of Armatimonadetes and Acidobacteria in the No. 3 Desmodesmus sp. experimental group is higher than that of the other groups. Among them, Armatimonadetes is a kind of bacteria commonly found in plant roots [49]. Acido-bacteria is one of the common bacterial phyla in the soil. It has many functions such as participating in the iron cycle, photosynthesis, and participating in the metabolism of single carbon compounds [50]. The No. 6 Synechocystis sp. experimental group was more abundant in Planctomycetes and Bacteroidetes than other groups. Planctomycetes may play an important role in participating in the carbon, nitrogen and sulfur cycles [51]. These differences in community structure may be an important reason for the differences in nutrient use efficiency. Microalgae can have a key impact on the structure of the bacterial community. Combining the differences in nitrogen and phosphorus consumption and community structure will help us build a more efficient system for co-cultivating a variety of microalgae.

4. Conclusions

Using wastewater to polyculture microalgae in open ponds can increase the economy of mass algal cultivation for biofuel production. By investigating the growth of 10 microalgae strains in simulated wastewater, we were able to evaluate the combination of microalgae potentially suitable for polyculture cultivation. From the perspective of proliferation rate, Scenedesmus obliquus grows in wastewater with the highest optical density, whereas Pediastrum sp. has a shorter proliferation cycle and higher production efficiency. Using hydrothermal liquefaction technology to extract energy from microalgae, Leptolyngbya boryana with high protein content is not suitable as a biomass raw material. Through the NMDS analysis of nitrogen and phosphorus consumption, Desmodesmus sp., Chlorella pyrenoidosa, Pediastrum sp. and Synechocystis sp. are quite different from other microalgae, which may be due to their different effects on community structure. Combined with the bacterial community structure, analysis of the influence of microalgae on the bacterial community is mainly reflected in the relatively low abundance species, but these species may have a significant impact on the function of the community. We believe that it is more likely to improve the production efficiency of microalgae by selecting the combination of microalgae with high conversion efficiency, different nitrogen and phosphorus utilization preferences, and a large difference in bacterial community structure.

Supplementary Materials

The following are available online at https://www.mdpi.com/article/10.3390/w13223190/s1, Table S1: The original data of Figure 1a, Table S2: The original data of Figure 1b, Table S3: The original data of Figure 2, Table: S4 The original data of Figure 3a, Table S5: The original data of Figure 3b, Table S6: The original data of Figure 4.

Author Contributions

Conceptualization, Methodology, Writing—Original Draft, Review & Editing, W.L.; Conceptulization, Methodology, Resources, Writing—Original Draft, Review & Editing, Supervision, D.F.; Methodology, Data curation, T.P.; Conceptulization, Methodology, Writing—Original Draft, Review & Editing, Supervision, R.P.S. All authors have read and agreed to the published version of the manuscript.

Funding

This research was funded by National Natural Science Foundation of China, grant number 51850410512.

Institutional Review Board Statement

Not applicable.

Informed Consent Statement

Not applicable.

Data Availability Statement

Not applicable.

Acknowledgments

Thanks to Dafang Fu for his financial support and guidance.

Conflicts of Interest

The authors declare no conflict of interest.

References

  1. Dudley, B. BP Statistical Review of World Energy; BP Statistical Review: London, UK, 2018; pp. 51–53. [Google Scholar]
  2. Brennan, L.; Owende, P. Biofuels from microalgae—A review of technologies for production, processing, and extractions of biofuels and co-products. Renew. Sustain. Energy Rev. 2010, 14, 557–577. [Google Scholar] [CrossRef]
  3. Chen, G.; Zhao, L.; Qi, Y. Enhancing the productivity of microalgae cultivated in wastewater toward biofuel production: A critical review. Appl. Energy 2015, 137, 282–291. [Google Scholar] [CrossRef]
  4. Rosenberg, J.N.; Mathias, A.; Korth, K.; Betenbaugh, M.J.; Oyler, G.A. Microalgal biomass production and carbon dioxide sequestration from an integrated ethanol biorefinery in Iowa: A technical appraisal and economic feasibility evaluation. Biomass Bioenergy 2011, 35, 3865–3876. [Google Scholar] [CrossRef]
  5. Liang, M.-H.; Jiang, J.-G. Advancing oleaginous microorganisms to produce lipid via metabolic engineering technology. Prog. Lipid Res. 2013, 52, 395–408. [Google Scholar] [CrossRef] [PubMed]
  6. Chisti, Y. Constraints to commercialization of algal fuels. J. Biotechnol. 2013, 167, 201–214. [Google Scholar] [CrossRef]
  7. Lam, M.K.; Lee, K.T. Microalgae biofuels: A critical review of issues, problems and the way forward. Biotechnol. Adv. 2012, 30, 673–690. [Google Scholar] [CrossRef]
  8. Godwin, C.M.; Lashaway, A.R.; Hietala, D.C.; Savage, P.E.; Cardinale, B.J. Biodiversity improves the ecological design of sustainable biofuel systems. GCB Bioenergy 2018, 10, 752–765. [Google Scholar] [CrossRef]
  9. Tumilar, A.S.; Milani, D.; Cohn, Z.; Florin, N.; Abbas, A. A Modelling Framework for the Conceptual Design of Low-Emission Eco-Industrial Parks in the Circular Economy: A Case for Algae-Centered Business Consortia. Water 2021, 13, 69. [Google Scholar] [CrossRef]
  10. Choi, W.J.; Chae, A.N.; Song, K.G.; Park, J.; Lee, B.C. Effect of trophic conditions on microalga growth, nutrient removal, algal organic matter, and energy storage products in Scenedesmus (Acutodesmus) obliquus KGE-17 cultivation. Bioprocess Biosyst. Eng. 2019, 42, 1225–1234. [Google Scholar] [CrossRef]
  11. Elser, J.J.; Fagan, W.F.; Denno, R.F.; Dobberfuhl, D.R.; Folarin, A.; Huberty, A.; Interlandi, S.; Kilham, S.S.; McCauley, E.; Schulz, K.L.; et al. Nutritional constraints in terrestrial and freshwater food webs. Nature 2000, 408, 578–580. [Google Scholar] [CrossRef]
  12. Mollamohammada, S.; Aly Hassan, A.; Dahab, M.; Kumar, S. A Hybrid Biological-Adsorption Approach for the Treatment of Contaminated Groundwater Using Immobilized Nanoclay-Algae Mixtures. Water 2021, 13, 633. [Google Scholar] [CrossRef]
  13. Georgianna, D.R.; Mayfield, S.P. Exploiting diversity and synthetic biology for the production of algal biofuels. Nature 2012, 488, 329–335. [Google Scholar] [CrossRef]
  14. Newby, D.T.; Mathews, T.J.; Pate, R.C.; Huesemann, M.H.; Lane, T.W.; Wahlen, B.D.; Mandal, S.; Engler, R.K.; Feris, K.P.; Shurin, J.B. Assessing the potential of polyculture to accelerate algal biofuel production. Algal Res. 2016, 19, 264–277. [Google Scholar] [CrossRef] [Green Version]
  15. Tian, Y.-T.; Wang, X.; Cui, Y.-H.; Wang, S.-K. A symbiotic yeast to enhance heterotrophic and mixotrophic cultivation of Chlorella pyrenoidosausing sucrose as the carbon source. Bioprocess Biosyst. Eng. 2020, 43, 2243–2252. [Google Scholar] [CrossRef]
  16. Shurin, J.B.; Abbott, R.L.; Deal, M.S.; Kwan, G.T.; Litchman, E.; McBride, R.C.; Mandal, S.; Smith, V.H. Industrial-strength ecology: Trade-offs and opportunities in algal biofuel production. Ecol. Lett. 2013, 16, 1393–1404. [Google Scholar] [CrossRef] [Green Version]
  17. Godwin, C.M.; Hietala, D.C.; Lashaway, A.R.; Narwani, A.; Savage, P.E.; Cardinale, B.J. Ecological Stoichiometry Meets Ecological Engineering: Using Polycultures to Enhance the Multifunctionality of Algal Biocrude Systems. Environ. Sci. Technol. 2017, 51, 11450–11458. [Google Scholar] [CrossRef]
  18. Bell, T.A.S.; Doig, L.; Peyton, B.M.; Gerlach, R.; Fields, M.W. Contributions of the microbial community to algal biomass and biofuel productivity in a wastewater treatment lagoon system. Algal Res. 2019, 39, 101461. [Google Scholar] [CrossRef]
  19. Mhedhbi, E.; Khelifi, N.; Foladori, P.; Smaali, I. Real-Time Behavior of a Microalgae–Bacteria Consortium Treating Wastewater in a Sequencing Batch Reactor in Response to Feeding Time and Agitation Mode. Water 2020, 12, 1893. [Google Scholar] [CrossRef]
  20. Aubakirova, M.; Krupa, E.; Mazhibayeva, Z.; Isbekov, K.; Assylbekova, S. The Role of External Factors in the Variability of the Structure of the Zooplankton Community of Small Lakes (South-East Kazakhstan). Water 2021, 13, 962. [Google Scholar] [CrossRef]
  21. Shetty, P.; Boboescu, I.Z.; Pap, B.; Wirth, R.; Kovács, K.L.; Bíró, T.; Futó, Z.; White, R.A.; Maróti, G. Exploitation of Algal-Bacterial Consortia in Combined Biohydrogen Generation and Wastewater Treatment. Front. Energy Res. 2019, 7, 230. [Google Scholar] [CrossRef]
  22. Stanier, R.Y.; Kunisawa, R.; Mandel, M.; Cohenbaz, G. Purification and Properties of Unicellular Blue-green Algae. Bacteriol. Rev. 1971, 35, 171–205. [Google Scholar] [CrossRef]
  23. Mehrabadi, A.; Farid, M.M.; Craggs, R. Potential of five different isolated colonial algal species for wastewater treatment and biomass energy production. Algal Res. 2017, 21, 1–8. [Google Scholar] [CrossRef]
  24. Cho, D.-H.; Choi, J.-W.; Kang, Z.; Kim, B.-H.; Oh, H.-M.; Kim, H.-S.; Ramanan, R. Microalgal diversity fosters stable biomass productivity in open ponds treating wastewater. Sci. Rep. 2017, 7, 1979. [Google Scholar] [CrossRef] [PubMed] [Green Version]
  25. Gerber, L.N.; Tester, J.W.; Beal, C.M.; Huntley, M.E.; Sills, D.L. Target Cultivation and Financing Parameters for Sustainable Production of Fuel and Feed from Microalgae. Environ. Sci. Technol. 2016, 50, 3333–3341. [Google Scholar] [CrossRef]
  26. Msanne, J.; Polle, J.; Starkenburg, S. An assessment of heterotrophy and mixotrophy in Scenedesmus and its utilization in wastewater treatment. Algal Res. 2020, 48, 101911. [Google Scholar] [CrossRef]
  27. Branco Dos Santos, F.; Du, W.; Hellingwerf, K.J. Synechocystis: Not Just a Plug-Bug for CO2, but a Green E. coli. Front. Bioeng. Biotechnol. 2014, 2, 36. [Google Scholar] [CrossRef] [Green Version]
  28. Liu, J.; Han, D.; Yoon, K.; Hu, Q.; Li, Y. Characterization of type 2 diacylglycerol acyltransferases in Chlamydomonas reinhardtii reveals their distinct substrate specificities and functions in triacylglycerol biosynthesis. Plant J. 2016, 86, 3–19. [Google Scholar] [CrossRef] [Green Version]
  29. Biondi, N.; Bassi, N.; Chini Zittelli, G.; de Faveri, D.; Giovannini, A.; Rodolfi, L.; Allevi, C.; Macrì, C.; Tredici, M.R. Nannochloropsis sp. F&M-M24: Oil production, effect of mixing on productivity and growth in an industrial wastewater. Environ. Prog. Sustain. Energy 2013, 32, 846–853. [Google Scholar] [CrossRef]
  30. Hupfauf, B.; Süß, M.; Dumfort, A.; Fuessl-Le, H. Cultivation of Microalgae in Municipal Wastewater and Conversion by Hydrothermal Carbonization: A Review. ChemBioEng Rev. 2016, 3, 186–200. [Google Scholar] [CrossRef]
  31. Mark Ibekwe, A.; Murinda, S.E.; Murry, M.A.; Schwartz, G.; Lundquist, T. Microbial community structures in high rate algae ponds for bioconversion of agricultural wastes from livestock industry for feed production. Sci. Total Environ. 2017, 580, 1185–1196. [Google Scholar] [CrossRef] [Green Version]
  32. Beigbeder, J.-B.; Boboescu, I.Z.; Damay, J.; Duret, X.; Bhatti, S.; Lavoie, J.-M. Phytoremediation of bark-hydrolysate fermentation effluents and bioaccumulation of added-value molecules by designed microalgal consortia. Algal Res. 2019, 42, 101585. [Google Scholar] [CrossRef]
  33. Matyash, V.; Liebisch, G.; Kurzchalia, T.V.; Shevchenko, A.; Schwudke, D. Lipid extraction by methyl-tert-butyl ether for high-throughput lipidomics. J. Lipid Res. 2008, 49, 1137–1146. [Google Scholar] [CrossRef] [PubMed] [Green Version]
  34. DuBois, M.; Gilles, K.A.; Hamilton, J.K.; Rebers, P.A.; Smith, F. Colorimetric Method for Determination of Sugars and Related Substances. Anal. Chem. 1956, 28, 350–356. [Google Scholar] [CrossRef]
  35. Rausch, T. The estimation of micro-algal protein content and its meaning to the evaluation of algal biomass I. Comparison of methods for extracting protein. Hydrobiologia 1981, 78, 237–251. [Google Scholar] [CrossRef]
  36. Bradford, M.M. Bacteriological Reviewsrapid and Sensitive Method for Quantitation of Microgram Quantities of Protein Utilizing Principle of Protein-dye Binding. Anal. Biochem. 1976, 72, 248–254. [Google Scholar] [CrossRef]
  37. Biller, P.; Ross, A.B. Potential yields and properties of oil from the hydrothermal liquefaction of microalgae with different biochemical content. Bioresour. Technol. 2011, 102, 215–225. [Google Scholar] [CrossRef] [PubMed]
  38. Fusheng, W. Water and Wastewater Monitoring and Analysis Methods, 4th ed.; China Environmental Publishing Group: Beijing, China, 2002; pp. 88–697. [Google Scholar]
  39. Bolyen, E.; Rideout, J.R.; Dillon, M.R.; Bokulich, N.A.; Abnet, C.C.; Al-Ghalith, G.A.; Alexander, H.; Alm, E.J.; Arumugam, M.; Asnicar, F.; et al. Reproducible, interactive, scalable and extensible microbiome data science using QIIME 2. Nat Biotechnol 2019, 37, 852–857. [Google Scholar] [CrossRef] [PubMed]
  40. Bokulich, N.A.; Kaehler, B.D.; Rideout, J.R.; Dillon, M.; Bolyen, E.; Knight, R.; Huttley, G.A.; Gregory Caporaso, J. Optimizing taxonomic classification of marker-gene amplicon sequences with QIIME 2’s q2-feature-classifier plugin. Microbiome 2018, 6, 90. [Google Scholar] [CrossRef] [PubMed]
  41. Ye, S.; Gao, L.; Zhao, J.; An, M.; Wu, H.; Li, M. Simultaneous wastewater treatment and lipid production by Scenedesmus sp. HXY2. Bioresour. Technol. 2020, 302, 122903. [Google Scholar] [CrossRef] [PubMed]
  42. Zhou, W.; Min, M.; Li, Y.; Hu, B.; Ma, X.; Cheng, Y.; Liu, Y.; Chen, P.; Ruan, R. A hetero-photoautotrophic two-stage cultivation process to improve wastewater nutrient removal and enhance algal lipid accumulation. Bioresour. Technol. 2012, 110, 448–455. [Google Scholar] [CrossRef]
  43. Li, Z.; Savage, P.E. Feedstocks for fuels and chemicals from algae: Treatment of crude bio-oil over HZSM-5. Algal Res. 2013, 2, 154–163. [Google Scholar] [CrossRef]
  44. Ross, A.B.; Jones, J.M.; Kubacki, M.L.; Bridgeman, T. Classification of macroalgae as fuel and its thermochemical behaviour. Bioresour. Technol. 2008, 99, 6494–6504. [Google Scholar] [CrossRef] [PubMed]
  45. Fan, J.; Ning, K.; Zeng, X.; Luo, Y.; Wang, D.; Hu, J.; Li, J.; Xu, H.; Huang, J.; Wan, M.; et al. Genomic Foundation of Starch-to-Lipid Switch in Oleaginous Chlorella spp. Plant Physiol. 2015, 169, 2444–2461. [Google Scholar] [CrossRef] [Green Version]
  46. Perez-Garcia, O.; Escalante, F.M.E.; de-Bashan, L.E.; Bashan, Y. Heterotrophic cultures of microalgae: Metabolism and potential products. Water Res. 2011, 45, 11–36. [Google Scholar] [CrossRef] [PubMed]
  47. Tian, B.; Hua, Y. Carotenoid biosynthesis in extremophilic Deinococcus-Thermus bacteria. Trends Microbiol. 2010, 18, 512–520. [Google Scholar] [CrossRef]
  48. Zhang, T.; Shao, M.-F.; Ye, L. 454 pyrosequencing reveals bacterial diversity of activated sludge from 14 sewage treatment plants. ISME J. 2012, 6, 1137–1147. [Google Scholar] [CrossRef] [PubMed]
  49. Vik, U.; Logares, R.; Blaalid, R.; Halvorsen, R.; Carlsen, T.; Bakke, I.; Kolstø, A.-B.; Økstad, O.A.; Kauserud, H. Different bacterial communities in ectomycorrhizae and surrounding soil. Sci. Rep. 2013, 3, 3471. [Google Scholar] [CrossRef] [Green Version]
  50. Kalam, S.; Basu, A.; Ahmad, I.; Sayyed, R.Z.; El-Enshasy, H.A.; Dailin, D.J.; Suriani, N.L. Recent Understanding of Soil Acidobacteria and Their Ecological Significance: A Critical Review. Front. Microbiol. 2020, 11, 580024. [Google Scholar] [CrossRef]
  51. Shu, Q. Molecular progresses of marine Planctomycetes: A review. Afr. J. Microbiol. Res. 2011, 5, 6018–6023. [Google Scholar] [CrossRef]
Figure 1. (a) The maximum optical density of the ten species of microalgae under the experimental conditions and the time to reach the maximum optical density. The dotted lines represent the average values respectively. (b) Percentage calculated based on the ratio of lipid, carbohydrate and protein in the microalgae to the dry weight detected at the end of the experiment. Error bars are calculated based on the standard deviation of three parallel experiments. The original data presented in figure are provided in the Supplementary Materials.
Water 13 03190 g001
Figure 2. The left axis represents the yield of crude bio-products calculated based on the composition of microalgae. The right axis represents biocrude conversion rate which means that microalgae is used as raw material, and the unit dry weight can be converted into biocrude.
Water 13 03190 g002
Figure 3. Concentration of (a) Ammonia, Nitrate, Organic nitrogen, and (b) Phosphate, Organic phosphorus on the 16th day.
Water 13 03190 g003
Figure 4. NMDS analysis of nitrogen and phosphorus consumption. The projection of the three-dimensional NMDS graphics on (a) the NMDS1 and 2, (b) the NMDS2 and 3 coordinate axis planes.
Water 13 03190 g004
Figure 5. Relative abundance of bacterial communities at phylum level in each experimental group.
Water 13 03190 g005
Figure 6. According to the relative abundance of taxa at each sample level, the relative abundance of the same species is standardized to draw a heat map. The samples were analyzed by UPGMA clustering according to the Euclidean distance of the species composition data.
Water 13 03190 g006
Table 1. List of microalgae strains used in current study.
No.Latin Species NameFACHB-Number *Reference
1Micractinium sp.1267[23]
2Leptolyngbya boryana2210[24]
3Desmodesmus sp.2042[25]
4Pediastrum sp.931[23]
5Scenedesmus obliquus13[26]
6Synechocystis sp.898[27]
7Chlorella pyrenoidosa5[24]
8Chlamydomonas reinhardtii359[28]
9Nannochloropsis oceanica926[29]
10Spirulina sp.810[30]
* More detailed information about microalgae can be found on https://algae.ihb.ac.cn/English/ (accessed on 26 November 2020) by FACHB-number.
Publisher’s Note: MDPI stays neutral with regard to jurisdictional claims in published maps and institutional affiliations.

