
Factors Affecting Shellfish Quality in Terms of Faecal Contamination at Blakeney Point, East Anglia, UK
by
 , , , and
Andrew S. Ball
1,2,* ,
,
Esmaeil Shahsavari
1,
Leadin S. Khudur
1,2,
Arturo Aburto-Medina
1 and
David J. Smith
3 1
School of Science, RMIT University, Bundoora, Melbourne, VIC 3083, Australia
2
ARC Training Centre for the Transformation of Australia’s Biosolids Resource, RMIT University, Bundoora, Melbourne, VIC 3083, Australia
3
Department of Biological Sciences, University of Essex, Colchester CO4 3SQ, UK
*
Author to whom correspondence should be addressed.
Water 2021, 13(22), 3192; https://doi.org/10.3390/w13223192
Submission received: 27 October 2021
/
Revised: 9 November 2021
/
Accepted: 9 November 2021
/
Published: 11 November 2021
(This article belongs to the Section Biodiversity and Functionality of Aquatic Ecosystems)
Abstract
:Relatively high E. coli and Faecal Streptococci (FS) numbers have been reported in the waters surrounding Blakeney Point, East Anglia, UK, an area containing significant shellfishery industries including mussels and cockles, despite the implementation of development works aimed at reducing residual contamination problems. The aim of this study was to evaluate the potential of using bacterial analyses and sterol profiling to assess the current levels and source of faecal pollution at Blakeney Point. No evidence of significant human faecal contamination of water in and around Blakeney Point could be found using either traditional microbiological analyses or sterol profile analysis. The presence of significant quantities of sitosterol, however, suggests that faecal contamination of water from birds does occur but at the concentration detected would not affect water quality. Analysis of cockles and mussels taken from the area show that negligible levels of coprostanol were present, confirming that faecal pollution was not causing any contamination issues. Apart from cholesterol, brassicasterol, an algal biomarker, as expected was dominant in shellfish flesh. The results confirm that current water treatment processes are successful in ensuring water quality at Blakeney Point and that a combination of microbial testing with sterol profile analysis confirmed that low microbial concentrations of faecal contaminants present in and around Blakeney Point most probably originate from migratory and/or resident bird species.
1. Introduction
Bacterial indicators of faecal pollution, such as the faecal coliforms (FC)/faecal streptococci (FS) ratio, have been extensively used to quantify faecal material entering aquatic systems [1]. The main origins of faecal contamination found in rivers, streams, and estuaries tend to be from the release of untreated sewage or treated wastewater effluent, stormwater drains, industrial effluents, and run-off from adjacent animal farms [2,3,4,5]. Determining the origin of faecal pollution, particularly in areas with established shellfisheries is essential in both assessing potential health risks and implementing an effective remediation action plan [6]. In a recent paper [1], this approach was used to identify a sewage outfall to be the main source of FC impacting oyster beds, with additional FS from agricultural sources. However, the application of bacterial indicators to identify sources of faecal pollution is difficult due to the effect of different environmental conditions such as temperature and salinity, which significantly affect bacterial survival rates [7,8,9,10]. Additionally, neither FC or FS or their ratio can be used to identify sources of faecal pollution as there is no one species restricted to a single animal [11,12,13].
In contrast, the use of biomarkers, such as faecal sterols, can distinguish between human and animal sources of faecal contamination [14,15,16]. In addition, other biomarkers such as alkylnaphalenes [17], brominated dioxins [18], and polyaromatic hydrocarbons [19] have been used as pollution biomarkers and to assess the health of marine mussels [20,21]. Sterols present in environmental waters can originate from human sewage, livestock faecal input, wild bird populations, as well as benthic macro-invertebrates. The source specificity is due to various factors including diet [15], the biosynthesis of specific sterols by animals [9], and the transformation of sterols to stanols of various isometric configurations by gut microflora [9,22]. Although individual sterols cannot per se differentiate between sources of faecal pollution [23], different sterols are present in differing abundance or ratios in animals [24,25,26,27,28]. Therefore, the detection and enumeration of sterols in aquatic samples, together with the use of ratios of selected sterols, can differentiate between human and animal faecal contamination, and possibly identify the group of animals which are affecting water quality. Using sterol profile analysis, we recently reported that human and bird sources contributed to the faecal pollution impacting the oyster beds in the Blackwater Estuary, UK [16].
In this work, we extend earlier studies [1,16] by incorporating both bacterial-and biomarker-based analysis at another important shellfishery producing estuary. Importantly, we demonstrate the benefits of using both microbiological and sterol analyses and confirm the general applicability of this approach to the global shellfish industry. In this study site, relatively high E. coli numbers have been reported in the waters surrounding Blakeney Point, despite the implementation of development works the purpose of which was to reduce residual contamination problems. There exist several potential sources of contamination that could impact Blakeney Point. This investigation examined water quality in terms of faecal loading around Blakeney Point. Several sites were chosen as potential point sources of faecal material from grazing cattle, wild bird populations, and human activity (Figure 1). The aim of this study was to evaluate the potential of using bacterial analyses and sterol profiling to estimate both the current levels and source of faecal pollution within an important shellfish producing estuary. This approach may be widely applicable for use as a management tool for the shellfish industry.
2. Materials and Methods
2.1. Description of the Sampling Area
2.2. Sample Collection
This investigation represents a rapid assessment during a single time period. A clustered study design was used; water samples (5 L, n = 18) were collected at low tide, in triplicate in Schott bottles with polytetrafluoroethylene (PTFE) lids cleaned using 3% Decon 90, rinsed with distilled water and oven dried. Samples were analysed in the laboratory within 12 h of sample collection. Eight sites were examined in total; Figure 1 shows the position of each sample site. Samples of shellfish were also taken from two sites; shellfish (mussels and cockles, n = 20 for each) were collected from Simpoles Head and Freshers Creek (Site 1 and 2, respectively). Results of water sample analysis represents real-time contamination whilst results obtained from the shellfish represent accumulation of contaminants over several weeks and therefore concentrations and profiles represent a much longer time period.
All samples were stored in an insulated box containing ice packs. All samples were kept at 4 °C until analysis.
2.3. Chemicals and Reagents
All chemicals and reagents used in this study were of analytical grade and used without further purification. The following chemicals were purchased from Sigma-Aldrich (Suffolk, UK): 4-methyl-umbelliferyl-β-d-glucuronide (MUG), methylumbelliferyl-β-d-glucoside (MUD), methanol (CH3OH), hexane (C6H14) and chloroform (CHCl3) (all analytical grade), trimethylsilyl (TMS), BSTFA (bis(trimethylsilyl)trifluoroacetamide and 5α-cholestane. A-1 media for the growth of bacterial indicators was purchased from Oxoid (Cheshire, UK). Ultrapure water (18.3 MΩηcm−1) was used throughout. Helium was sourced from BOC (London, UK).
2.4. Bacterial Analysis of Water
An aliquot (1 mL) of each water sample was mixed with 9 mL of sterile saline water. A series of 10-fold dilutions (up to 10−3 for water) were prepared. Water was analysed using an MTP method [29]. Briefly, A-1 medium used for the detection of E. coli and facial was amended with 4-methyl-umbelliferyl-β-d-glucuronide (MUG) while for the enumeration of FS, A-1 media was amended with methylumbelliferyl-β-d-glucoside (MUD) [29]. The concentrations of E. coli and FS were estimated according to the most probable number calculation with 8 wells and 5 tubes per dilution. The results were expressed as number of bacteria per 100 mL of water.
2.5. Sterol Extraction and Analysis
Water was filtered through pre-combusted (at 450 °C) GFF glass fibre filters (Whatman, Kent, UK, nominal pore size = 0.45 µm, diameter = 47 mm). Water samples were quantitatively extracted using the one-phase CHCl3/MeOH/H2O Bligh and Dyer method [30] with a ratio of 1:2:0.8 (v/v/v). In this study, 30 mL of H2O, 75 mL of methanol and 37.5 mL of CHCl3 were added to a separation funnel together with 10–20 µg of internal standard (IS, 5α-cholestane). Sterols were derivatised into their corresponding trimethylsilyl (TMS) ethers by the addition of 100 µL of BSTFA (bis(trimethylsilyl)) trifluoroacetamide.
2.6. Sterol Extraction from Shellfish
Shellfish were collected from Freshers Creek (mussels: Site 2) and from Simpoles Head (cockles: Site 1). Shellfish flesh (n = 6 for each analysis) was cleaned by scrubbing and washing in cold water and following removal, the flesh was freeze dried for 24 h using Christ Alpha 1–2 LDplus −55 °C Freeze Dryer, and 10–15 g of the dried flesh was homogenised and extracted using hexane [31]. Samples extracted with hexane were derivatised as described above.
2.7. Sterol Analysis
Gas chromatography analysis was performed with a Carlo Erba 8060 GC, fitted with a Fisons Mass Detector 800 (i.e., a mass spectrometer, MS). The GC conditions were as follows: separation on an HT-5 column with a 25 m × 0.22 mm ID and 0.1 µm film thickness using a cool on column injector and a temperature program of injection at 60 °C for 2 min; 10 °C min−1 to 300 °C; 3 °C min−1 to 320 °C; 10 °C min−1 to 360 °C for 10 min. Helium was used as the carrier gas at a flow rate of 2 mL min−1, and 1 µL injections were carried out on the GC using an auto-injector (AS-800). The MS was used in the EI mode at 70 eV with mass scanning from 45 to 585 m/z over 1 s. The results were analyzed using the MassLab 1.4 software package (ThermoQuest, Manchester, UK) provided with the instrument. Identification of sterols was performed through a combination of standards and application to the National Institute of Standards and Technology (NIST) mass spectral library [32]. Peak identification was based on a relative retention time and total ion mass spectral comparison with an external standard. Sterols were quantified by peak area comparison with the internal standard 5α-cholestane. Extraction efficiency was between 85 and 110%; day-to-day variability showed a relative standard error of <10%. The limit of detection was 0.01 µg L−1.
2.8. Statistical Analyses
MPN returns discontinuous data and therefore non-parametric statistical analysis was used for all the MPN data. For comparisons between two samples, a Mann–Whitney U test was used and for multiple sample comparisons, a Kruskal–Wallis test was used. To determine any association between variables, Spearman’s correlation tests were carried out. All statistical tests were performed using SigmaStat.
Analysis of variance (ANOVA; p = 0.05) was used to determine significant differences among the major sterols and total sterols. Prior to analysis, the homogeneity of variance and normal distribution were assessed. When normality was not fulfilled, data transformation was performed prior to ANOVA (e.g., log transformation) [32]. ANOVA was followed by the Tukey post hoc test. Pearson correlation between sterols in shellfish flesh and potential sources of faecal contamination in water samples was carried out using SPSS version 24. Both p values, 0.01 and 0.05, were used for correlation analysis. Results are presented as mean ± standard error, unless otherwise stated.
3. Results and Discussion
3.1. Microbial Analysis
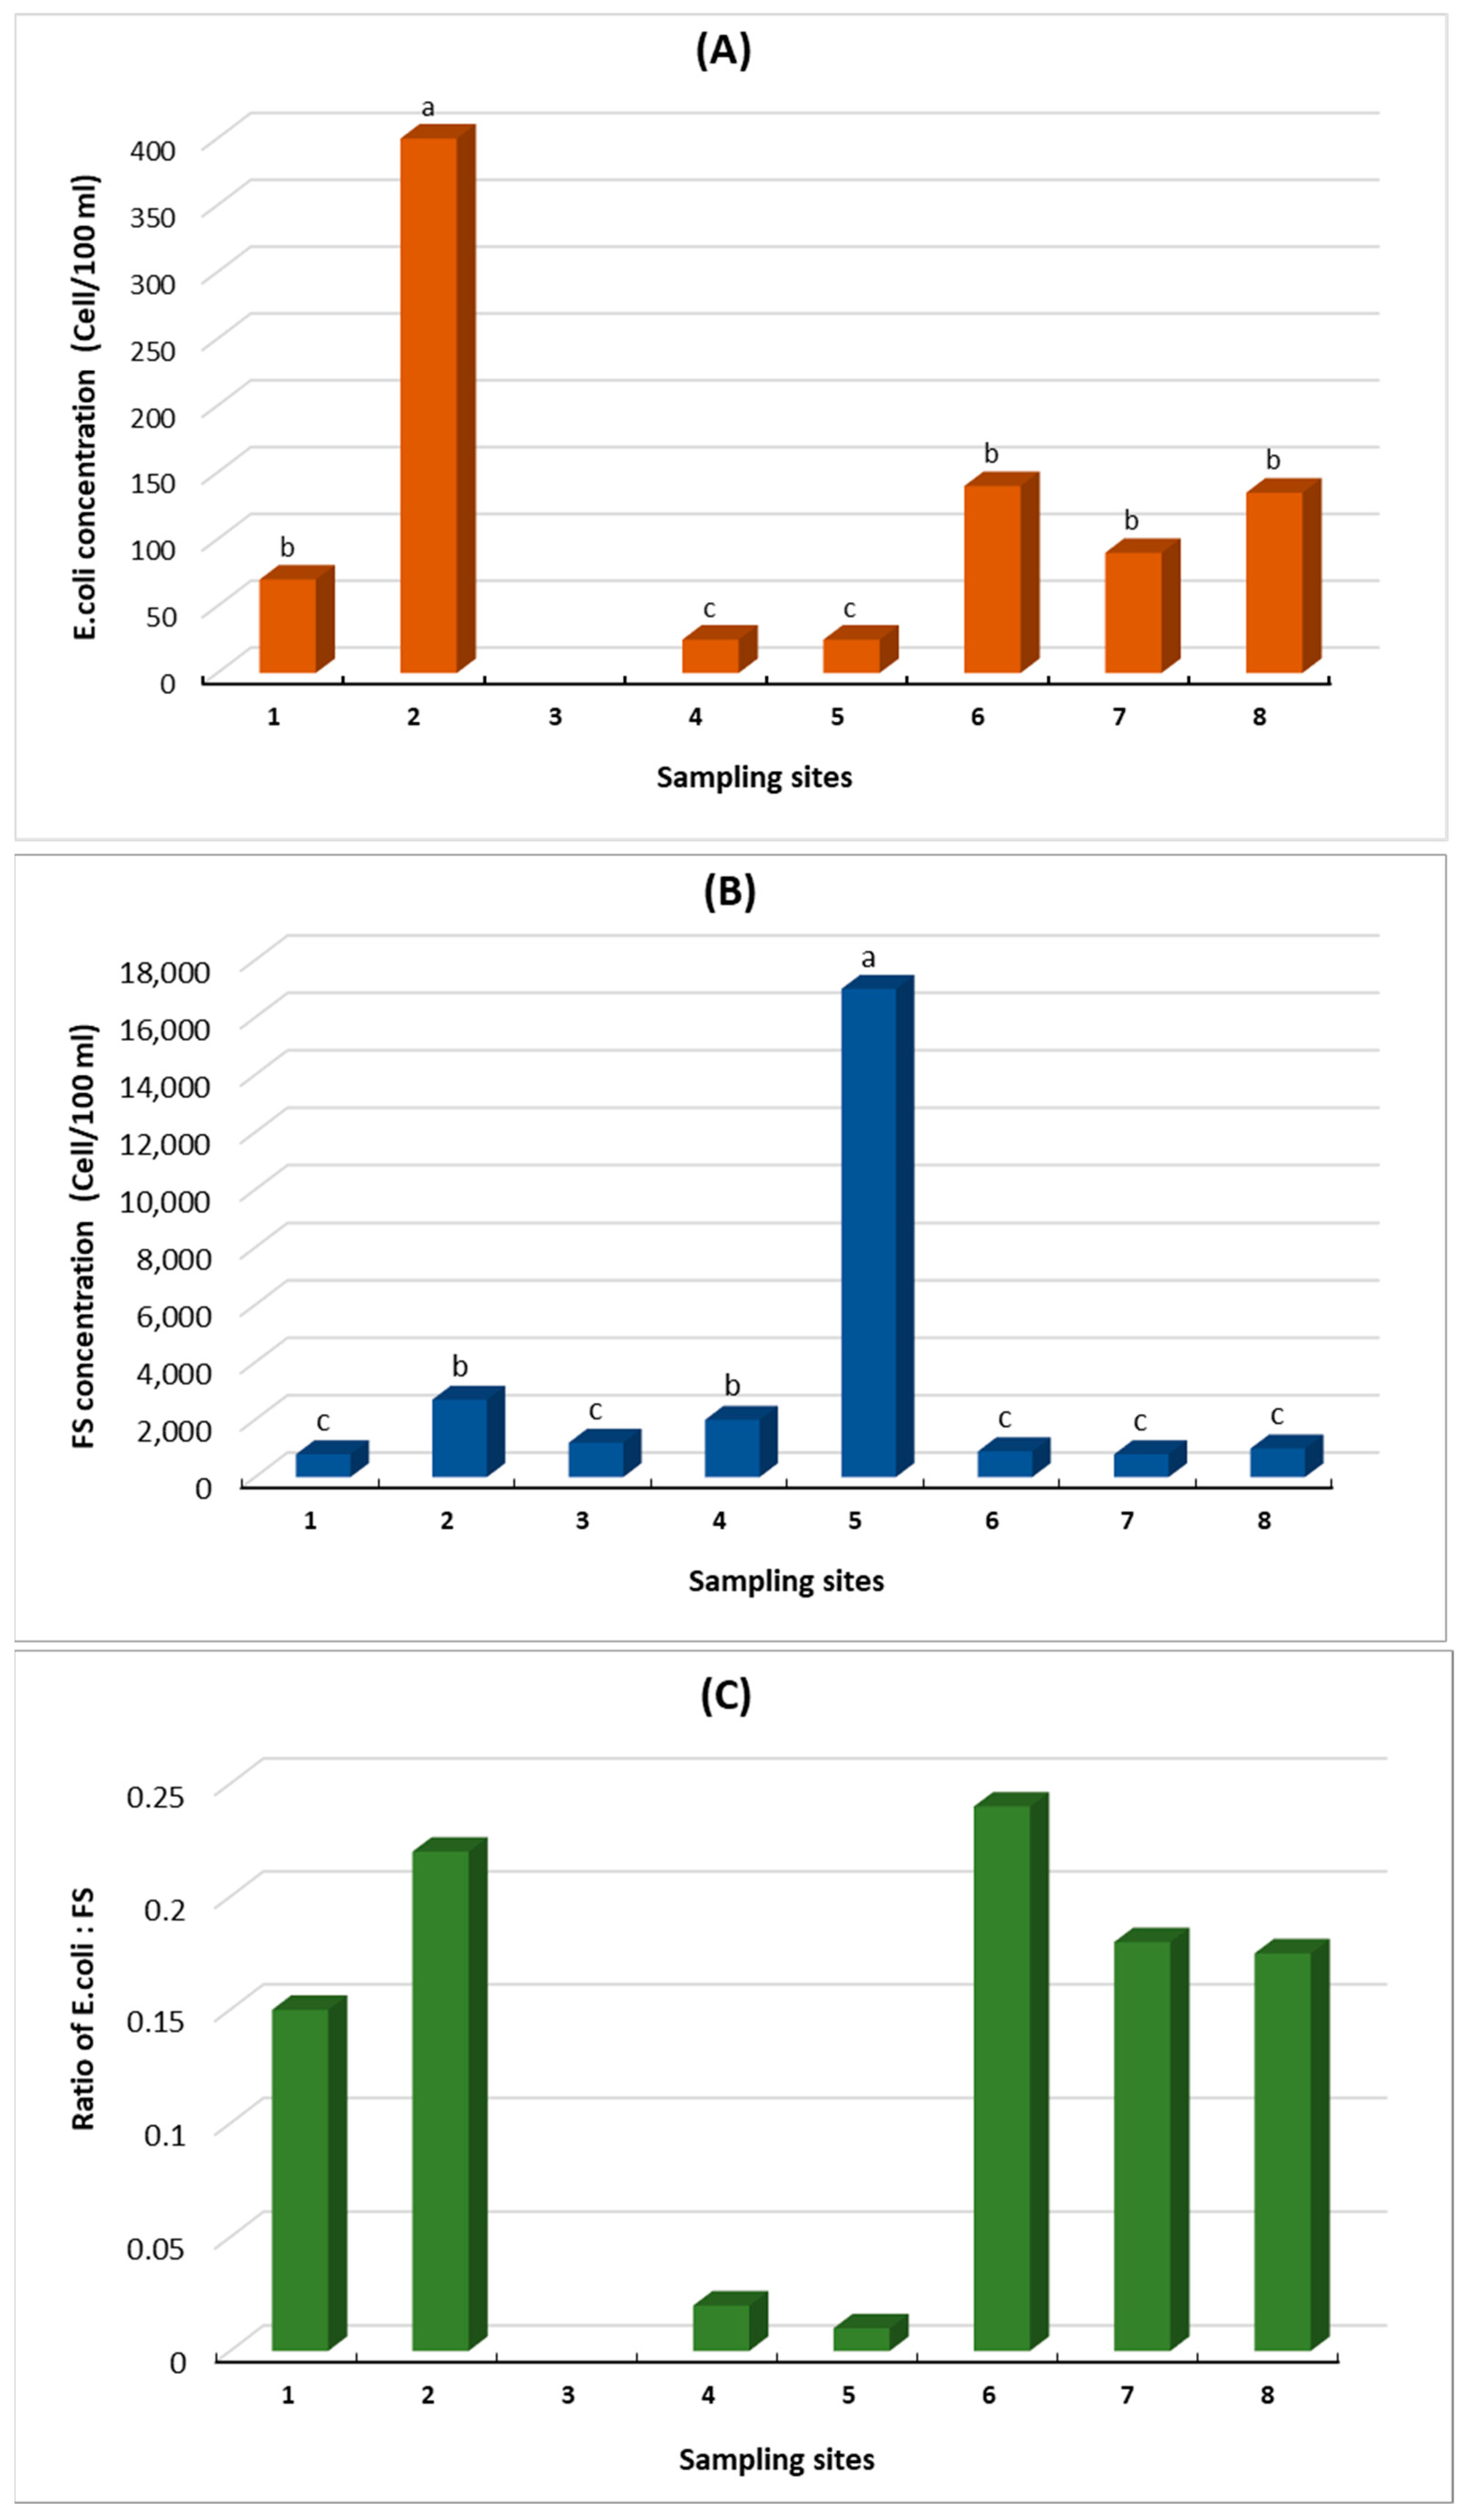
Highest concentrations were obtained from Freshers Creek (Site 2—see Figure 1), with E. coli numbers reaching 400 per 100 mL of water. This number is significantly below the Bathing Waters Directive guidelines (Bathing Water Directive 2006/7/EC) if they were applied; concentrations obtained from other sites were significant lower. There was no significant difference in concentrations determined within the River Cley (Sites 7 and 8) and within the Blakeney Channel at Scaupe Run (Site 6) and Simpoles Head (Site 1). Lowest concentrations were determined at Morston Creek (Site 3).
Compared to many inland waters affected by faecal contamination, the E. coli concentrations are low in most samples examined (Figure 2a). In one study examining E. coli concentrations in water overlying oyster beds at low tide monitored over 12 months ranged from 0 to 367 cells 100 mL−l [1]. The same study also identified concentrations of E. coli > 5000 cells per 100 mL−1 in stream water. In another study examining E. coli concentrations in rivers in south-west Victoria, Australia E. coli concentrations were reported >10,000 cfu/100 mL−1 [33]. The authors were examining the impact of agricultural contamination on water quality.
In contrast to the numbers of E. coli identified, extremely high concentrations of FS (17,000 per 100 mL) were observed at Blakeney Harbour Sluice; generally, FS concentrations were high at many of the sites. Apart from Blakeney Harbour Sluice, high concentrations were also observed at Freshers Creek (2000 per 100 mL). Blakeney Harbour also showed relatively high concentrations of FS but there was no significant difference in the concentrations of FS determined for the other sites. The numbers reported are similar to a study examining FS concentrations in water overlying oyster beds at low tide, which reached 13,500 cells 100 mL−1 [1]; the same study reported FS concentrations in stream water were reported as high as >25,000 cells per 100 mL−1.
The E. coli: FS ratio can be used to indicate the most probable source of faecal contamination and with limited accuracy predict if pollution is from humans or animals [7]. Ratios > 4 suggest human and ratios < 0.7 suggest that animals are the major contributor to faecal pollution. In all cases, the ratio recorded were <0.25, suggesting that the major contributor to the faecal pollution of Blakeney was animal based. There were no differences between the River Cley sites, sites situated within the Blakeney Channel (Scaupe Run and Simpoles Head) and Freshers Creek. These sites exhibited significantly higher ratios than those observed at the remaining sites. The values obtained suggest that animals play a more important role in influencing faecal contaminations at Blakeney, although the low ratios determined for the Blakeney Harbour and Morston Creek sites are due to high FS counts and low E. coli counts, suggesting that these latter sites are more affected by animal pollution than the other sites, although the E. coli:FS ratio cannot be used to differentiate between animals.
3.2. Sterol Concentrations and Sterol Profile Analysis of Water Samples
Having established the animal nature of the faecal contamination at sites around Blakeney Point, sterol analysis was carried out on the same samples (Figure 3A). Total sterol concentrations in water samples were highest within Blakeney Harbour Sluice. Concentrations were at an intermediate level within Blakeney Channel and lowest within Blakeney Harbour and the River Cley (Figure 3A). The range of total sterol concentrations observed were generally lower than the 250 ng 100 mL−1–480 ng 100 mL−1 range that was reported for water overlying Salcott Creek oyster fisheries over a 12-month period [16].
In terms of the sterol profile, this was largely dominated by cholesterol. Cholesterol dominates the sterols presents in all samples besides Site 1, the River Cley Above the Weir where no sterols were detected. Cholesterol is found in many different organisms and although it can indicate faecal pollution, the lack of specificity associated with this parameter does not lend well to its use as a species faecal biomarker. In a previous study, cholesterol was found to represent on average 49% of the total sterol concentration in water overlying Salcott Creek oyster fisheries over a 12-month period. In the present study, cholesterol represents 89% of the total sterol concentration reported across all sites (480 ng 100 mL−1).
Figure 3B represents the relative concentrations of sterols in the absence of cholesterol. Relatively high concentrations of coprostanol, a faecal biomarker, was the only sterol found within the River Cley, below the weir (12 ng 100 mL−1). Coprostanol was also detected at Scaupe Run, immediately downstream from the River Cley (20 ng 100 mL−1) and at Simpoles Head (6 ng 100 mL−1) (Figure 3B). Coprostanol represents the principal sewage biomarker, suggesting human origin of faecal material. However, no individual sterol can differentiate between sources of faecal pollution because they are not restricted to one organism [23]; coprostanol is also present in the faeces of pigs and cats [14,34]. At Scaupe Run, however, relative high concentrations of sitosterol were also detected suggesting, in the absence of fucosterol, that animal grazing activity and resulting faecal input could be affecting this site along with contamination from the River Cley originating below the Weir. High concentrations of sitosterol, indicative of terrestrial vegetation and grazing animal activity including birds, were also found at Blakeney Harbour Sluice (28 ng 100 mL−1), which drains a grazing marsh, Simpoles Head (12 ng 100 mL−1) which, coupled with the other sterols suggest that the relative high concentrations of sitosterol is a result of faecal contamination from herbivores, most probably grazing birds [35]. Water sampled at Scaupe Run and Morston also exhibited low concentrations of fucosterol, an indicator of the presence of microalgae [36].
At Simpoles Head (Site 1) within the Blakeney Channel and downstream from Sites 7 and 8, the relative concentration of coprostanol decreases further whilst sitosterol increases, suggesting that grazing activity is increasingly more important as a source of contamination downstream. Within Blakeney Harbour Sluice (Site 5), the dominant sterol other than cholesterol is sitosterol which dominates the relative sterol profile, although coprostanol is present within waters of Site 5 albeit at very low concentrations. Biomarkers of algae were also abundant at Site 5. Within Blakeney Harbour, coprostanol and sitosterol dominate with equal importance to the overall profile—cholesterol, and fucosterol, an indicator of macroalgae is also relatively important, potentially due to elevated nutrients (an untested variable). The relative sterol profile of Morston was very similar to that of the Harbour, but less so with sitosterol and coprostanol becoming a slightly more important fucosterol.
Examination of the profile of sterols using absolute concentrations allows hypotheses to be made regarding the extent of species pollution but when carrying out inter-site comparisons, the varying levels of sterols present can lead to misinterpretation and false conclusions. Such bias towards more heavily contaminated sites can be alleviated by normalising the actual concentrations against the total sterol concentration present at a particular site. The resulting value can be converted into the percentage and the relative importance of the different sterols at each site can be investigated (Figure 4).
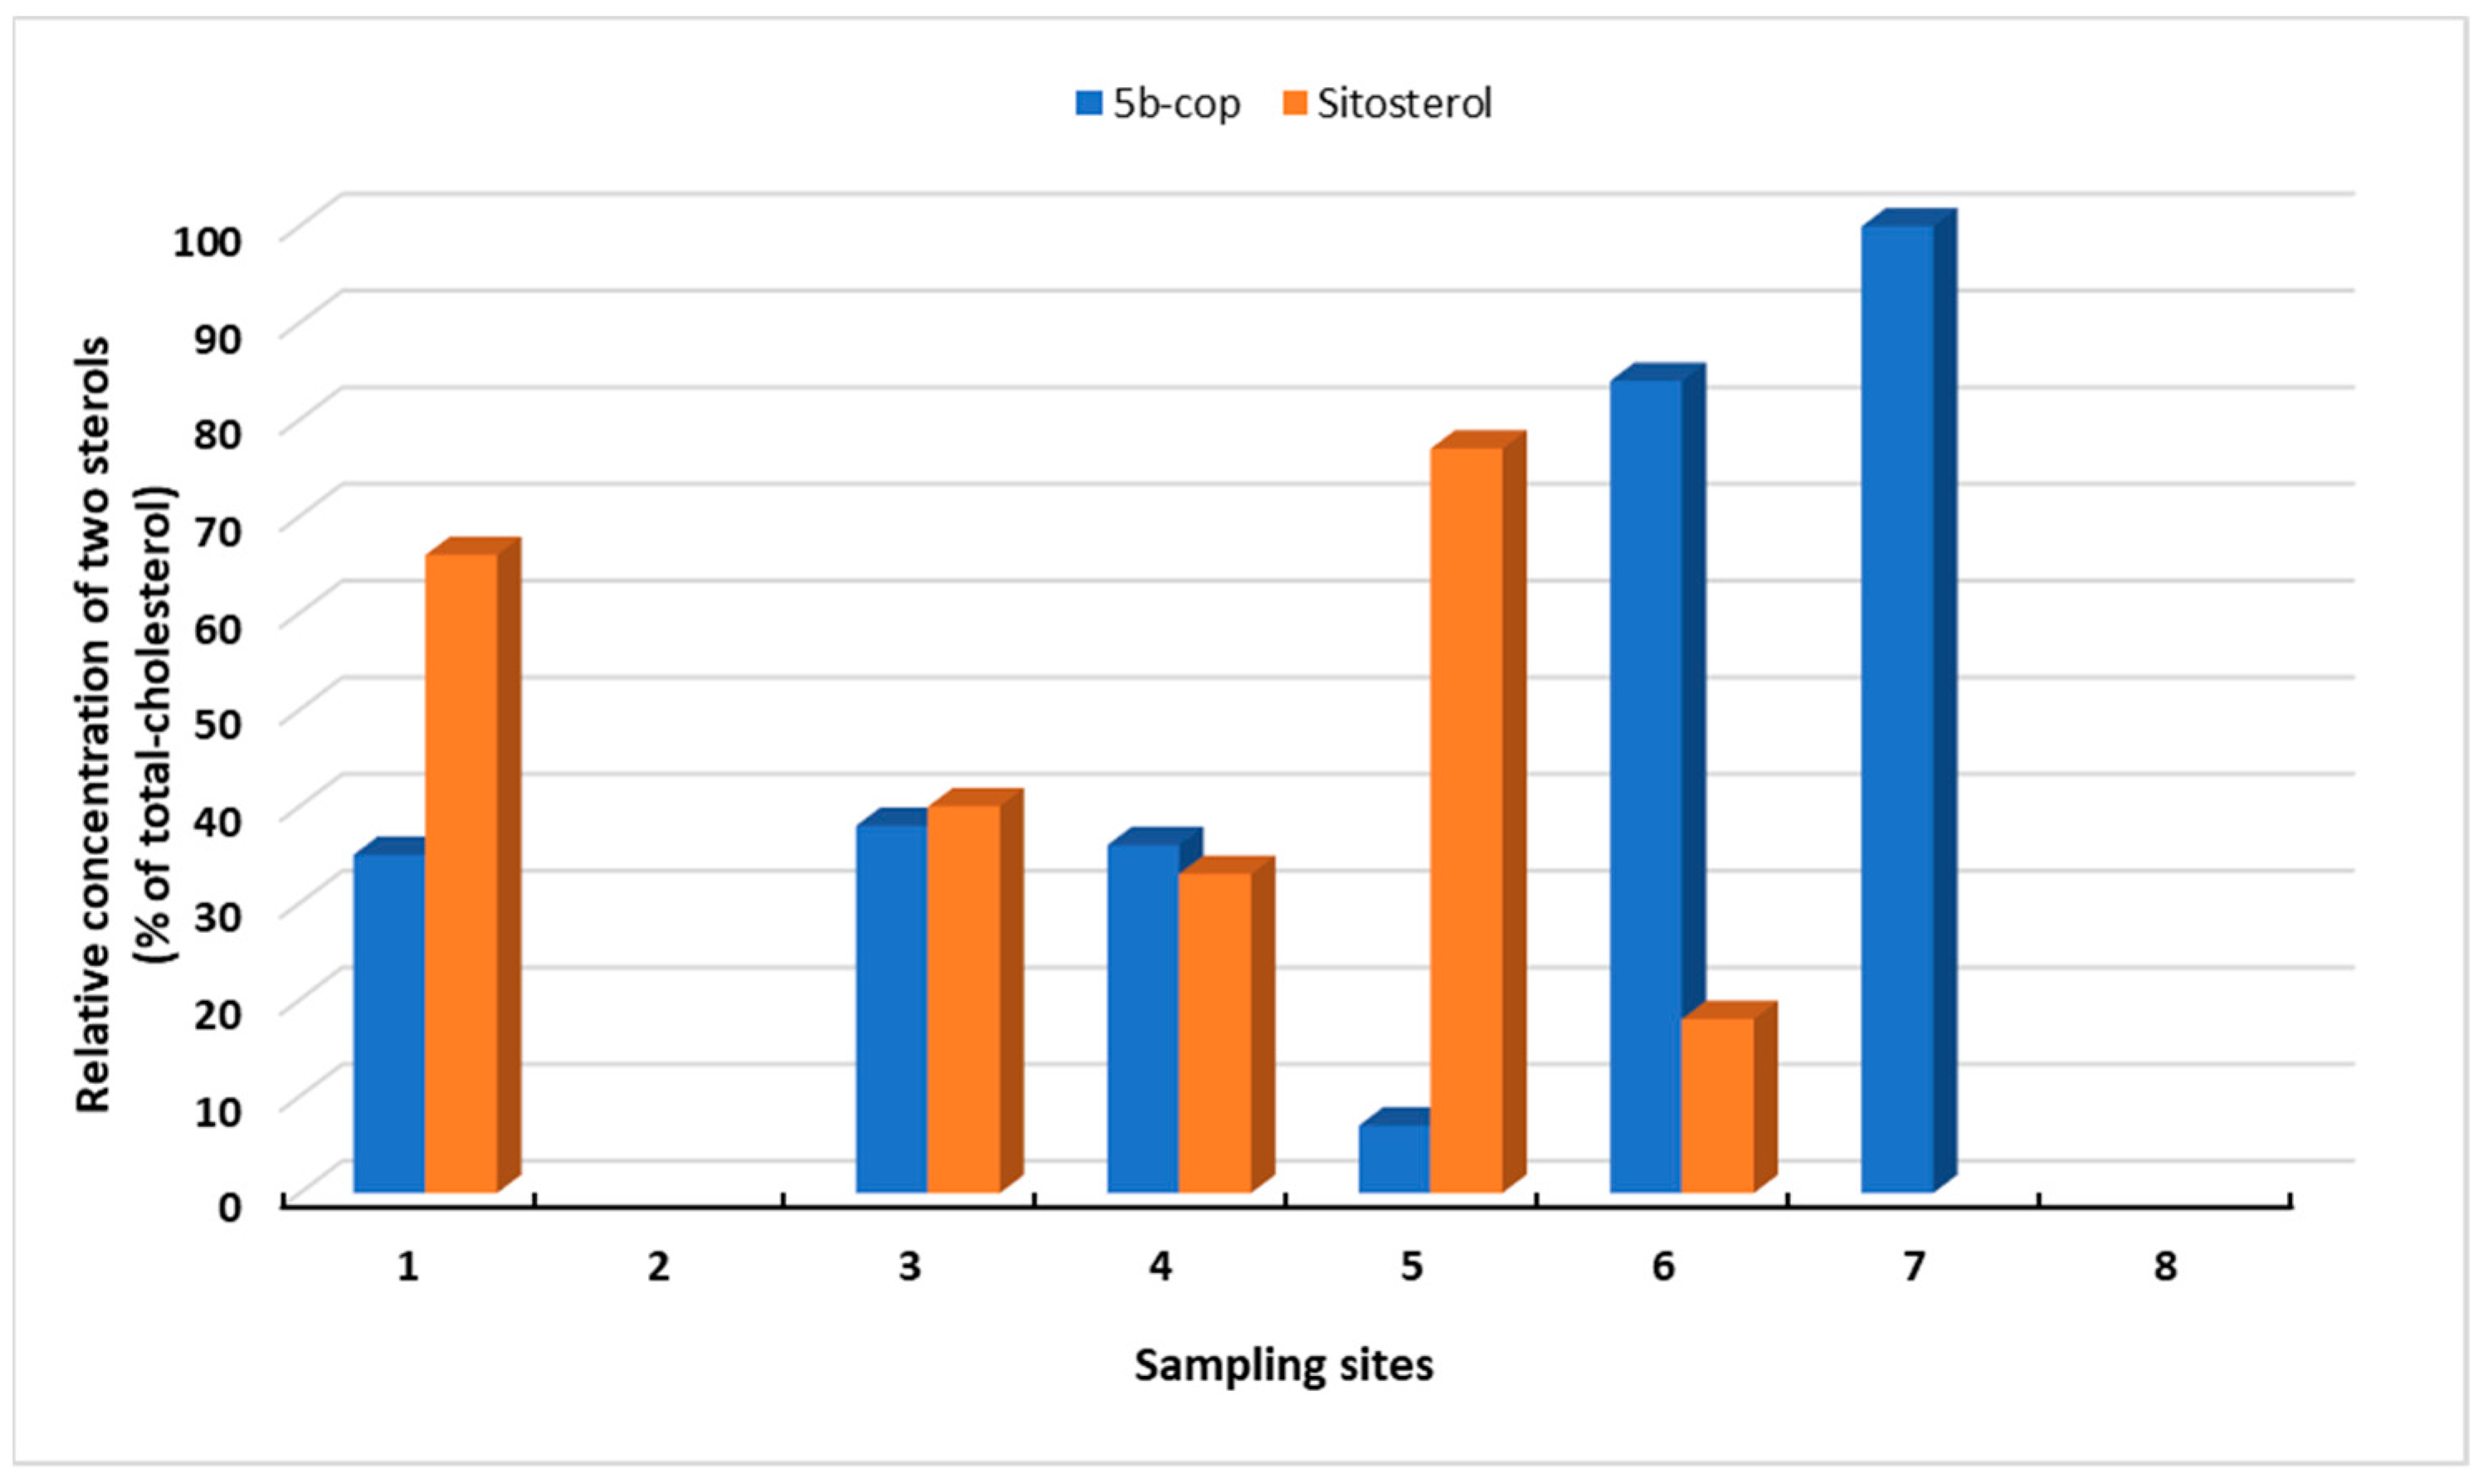
Figure 4 shows how the relative contribution of coprostanol and sitosterol varies with site within the study area. The relative importance of coprostanol decreases from The Cley and Scaupe Run (Site 6 to 5). Out of all sites, highest concentrations of the two sterols was found at Blakeney Harbour Sluice (Site 5), which is dominated by sitosterol and relative levels and actual concentration of coprostanol levels are low. The importance of the two sterols then becomes equal at Morston and Blakeney Harbour (Sites 3 and 4) due to decreased concentrations of sitosterol rather than increases in coprostanol.
3.3. Sterol Concentrations and Sterol Profile Analysis of Shellfish
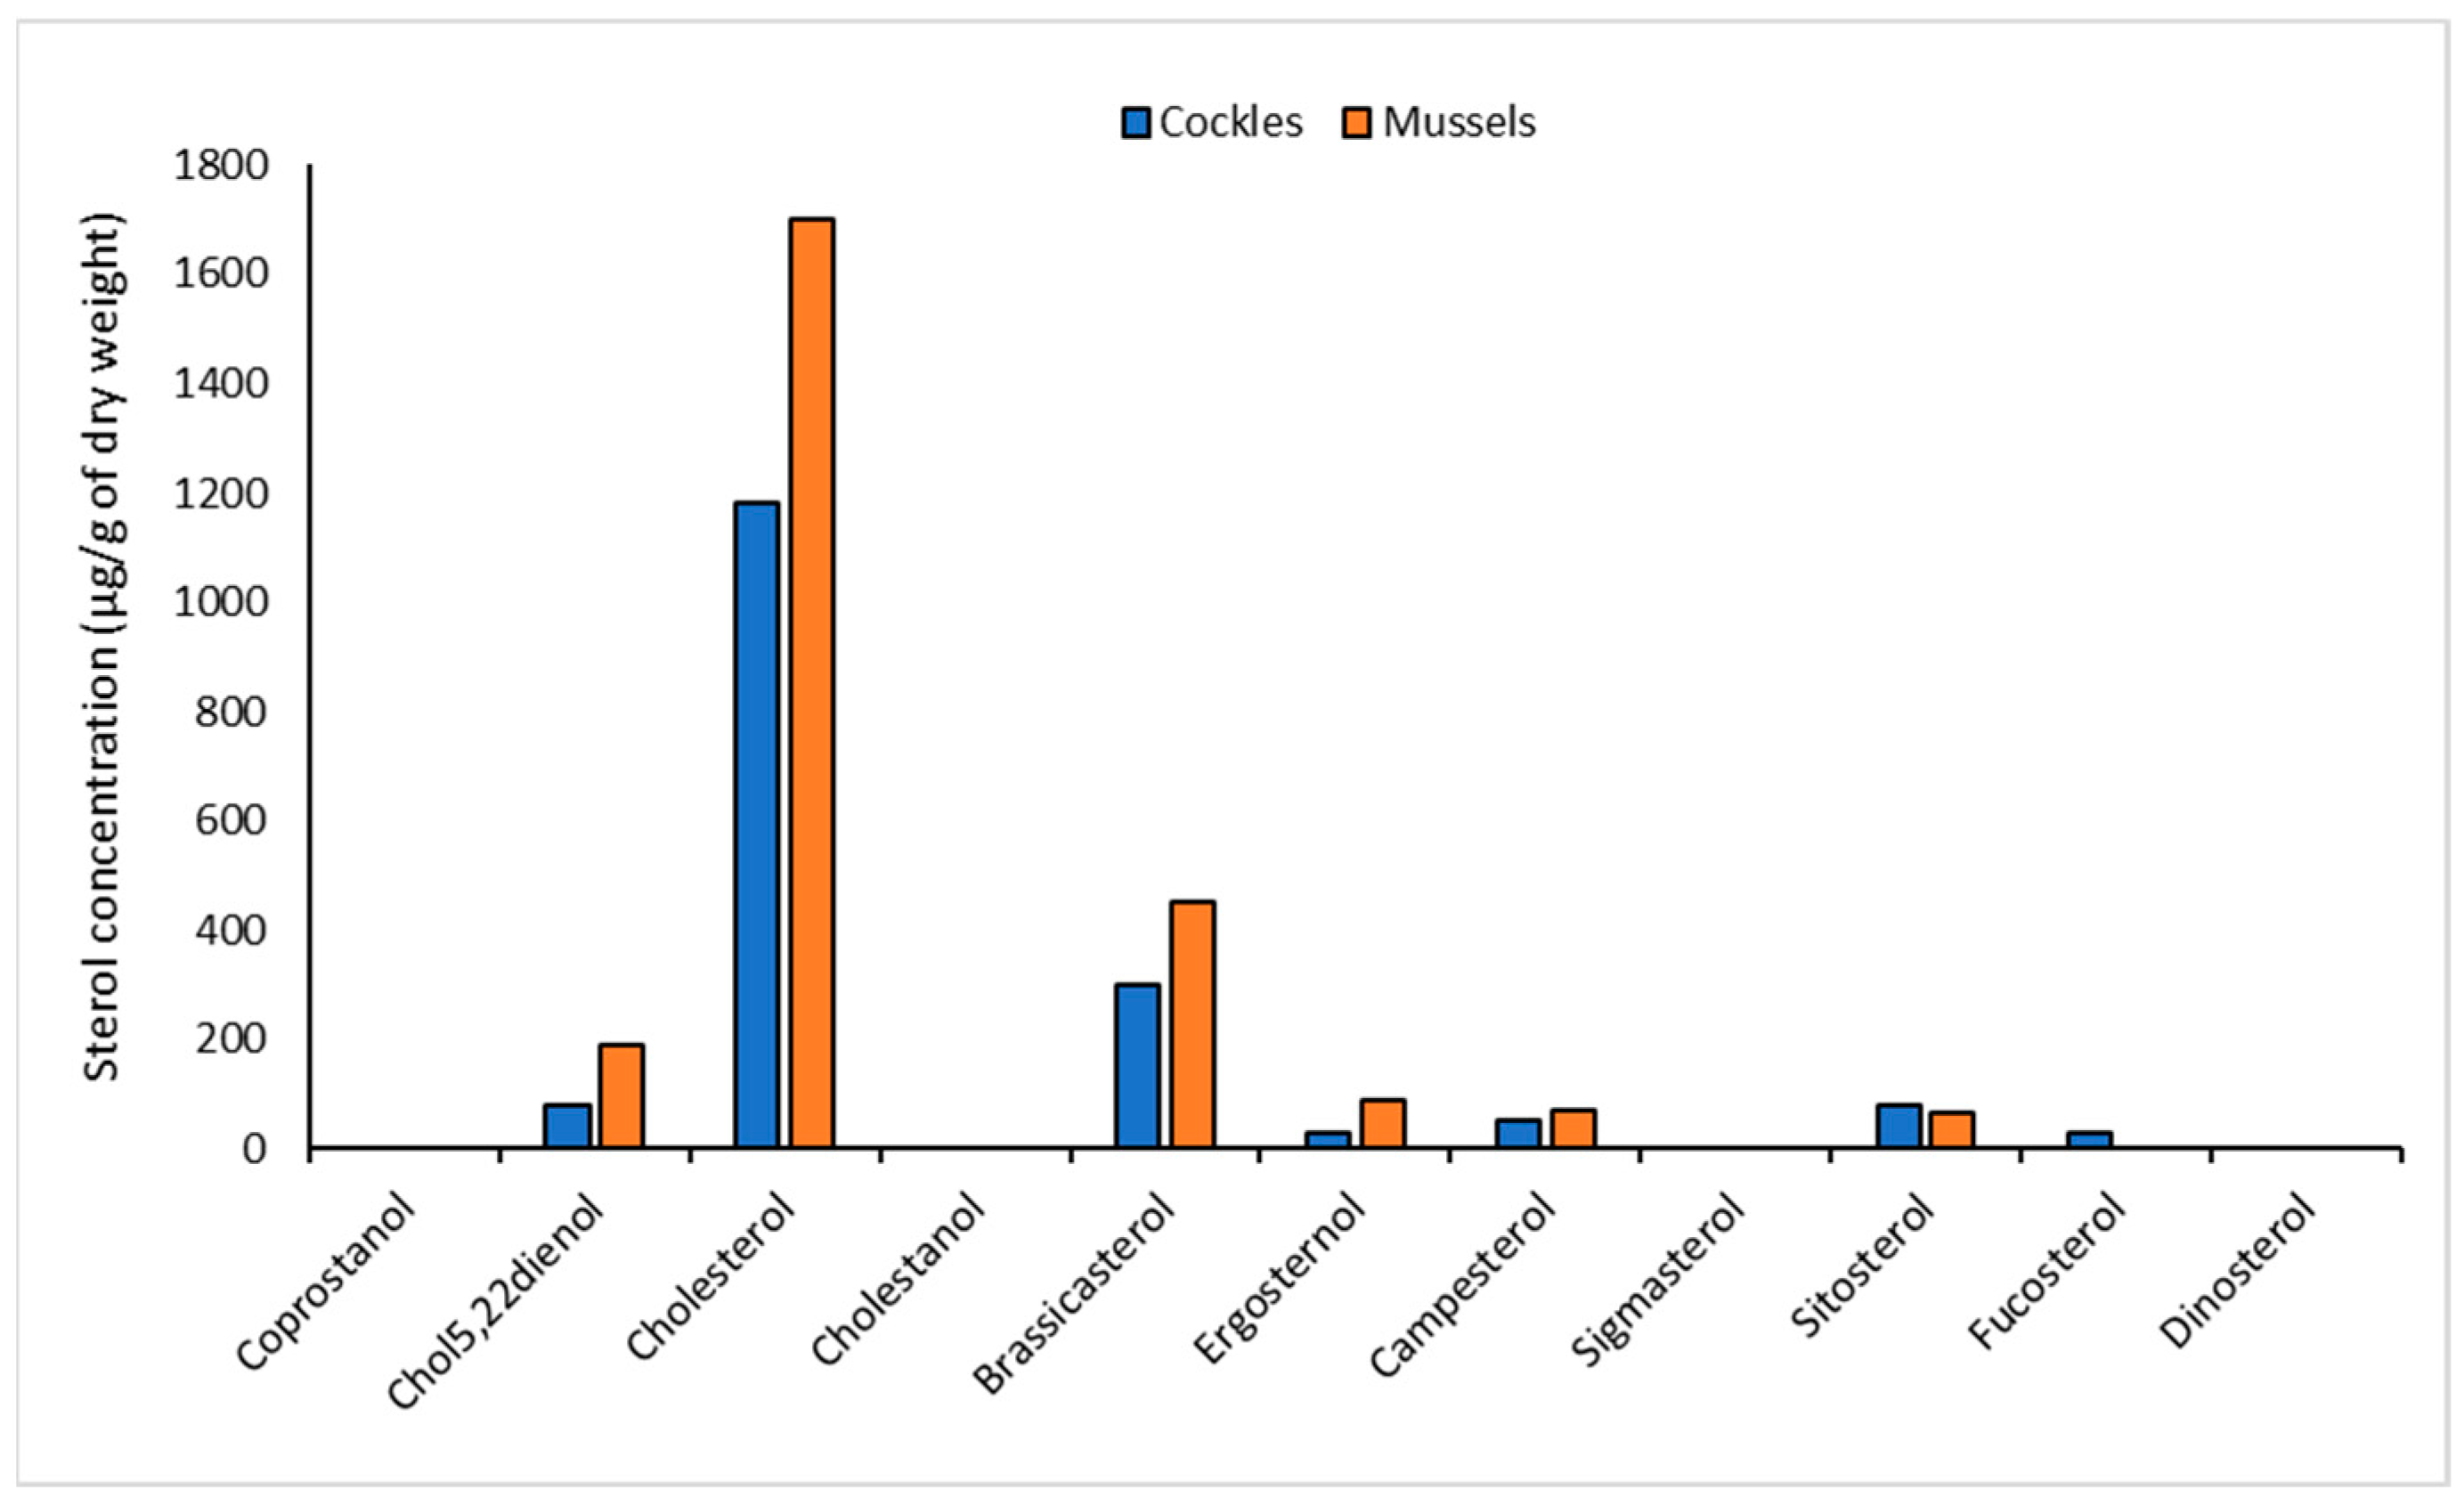
The sterol profile of cockles and mussels was dominated by cholesterol. The concentration of this sterol was 1700 µg g−1 dry weight of flesh in mussels and 1180 g g−1 dry weight in cockles (Figure 5). Cholesterol, previously reported to be present at high concentrations in mussels [37], is a constituent of animal cell membranes and therefore found in most organisms [38]. Brassicasterol was the second-most abundant sterol present in profiles of cockles and mussels (Figure 5). Brassicasterol and chol5,22dienol are both indicators of phytoplankton [27,39] and are abundant in shellfish flesh, probably reflecting the feeding habits of the two molluscs. No coprostanol was detected, confirming that human sewage does not impact either the mussels or cockles. Relatively high concentrations of sitosterol suggest that grazing animal species may have a minor impact in terms of faecal input.
3.4. Relationship between Sterol and Microbial Concentrations in Water Samples
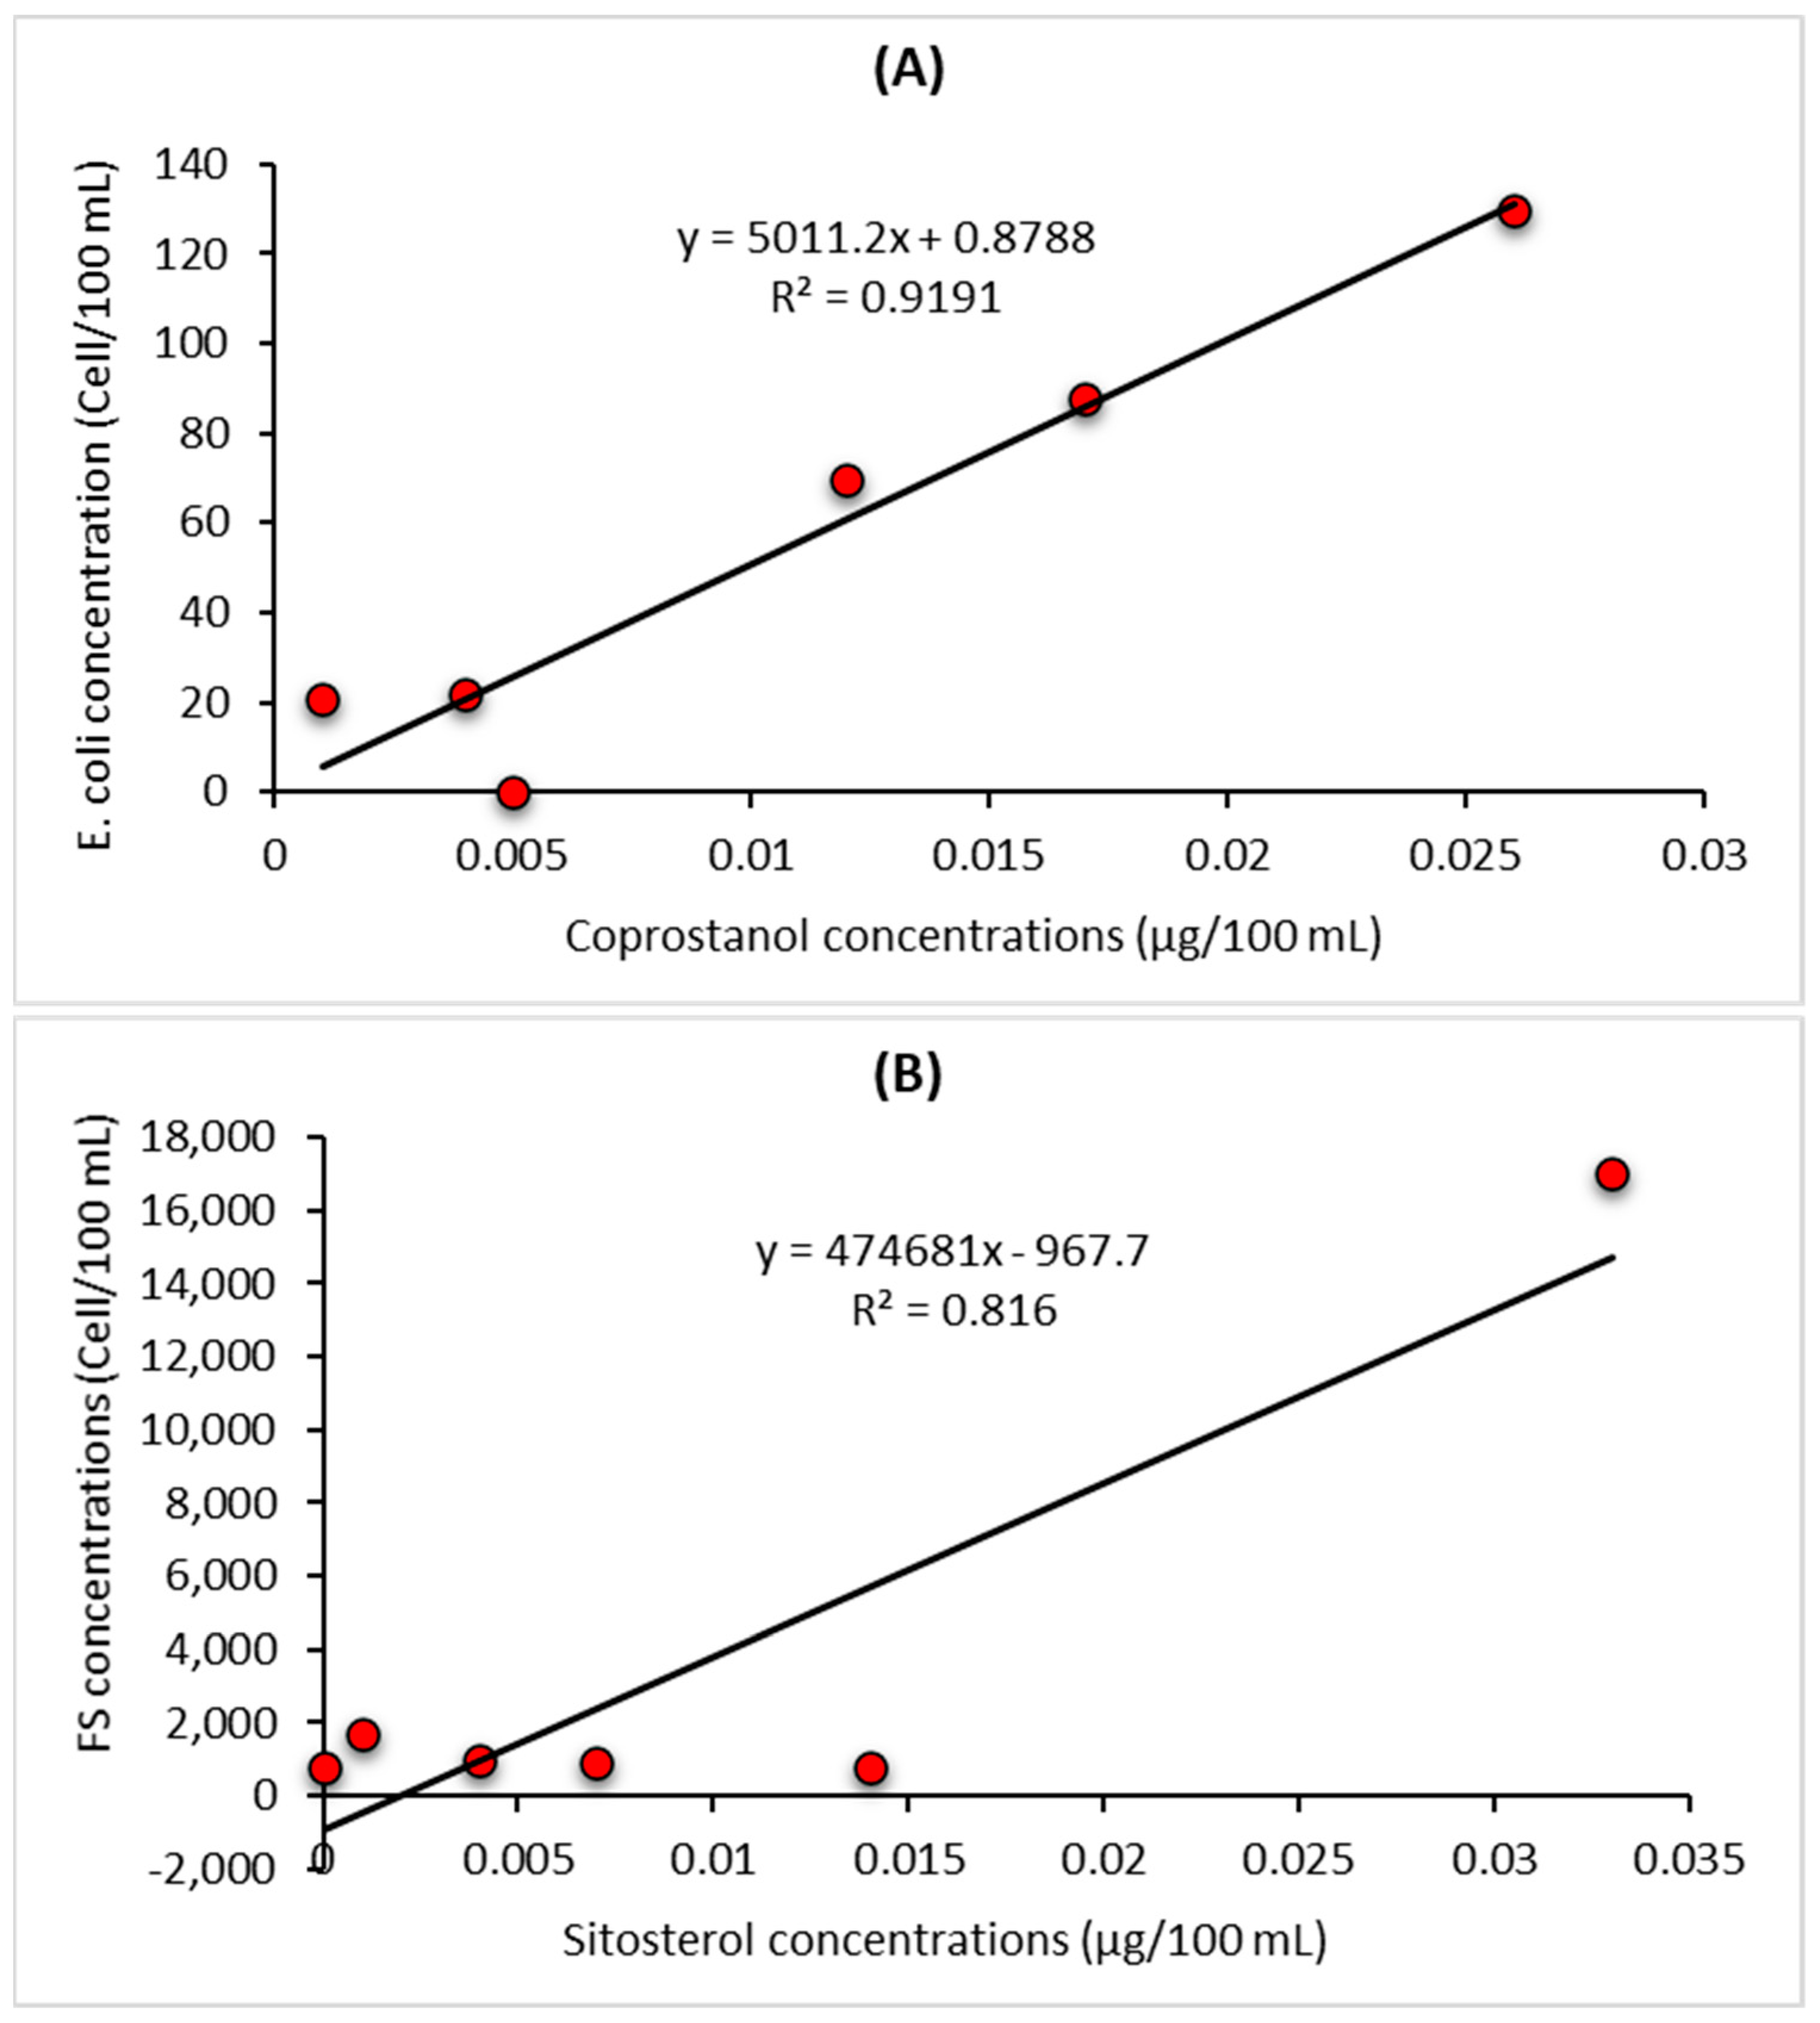
To determine whether there are significant correlations between bacterial faecal indicators and the two specific faecal sterols indicators coprostanol and sitosterol regression analyses were carried out (Figure 6). Coprostanol is a general indicator of human sewage and there was a strong association (R2 = 0.92, p < 0.001, n = 6) between E. coli numbers and coprostanol concentrations (Figure 6A). In contrast, there was no significant relationship between concentrations of E. coli and sitosterol, cholesterol, or total sterol concentrations (data not shown). No significant relationship between FS and coprostanol, cholesterol, and total sterol concentrations were observed (data not shown). However, a significant relationship with sitosterol (R2 = 0.82, p < 0.001, n = 6) was observed (Figure 6B). The correlation observed between the bacterial indicators and the main sterols identified in the study (Figure 6) confirm not only the complementarity of the two approaches but also the benefits of combining both bacterial and sterol profile analyses to elucidate the likely source of faecal pollution. This approach can provide an important management tool to not only monitor shellfish quality but also identify the sources of faecal pollution impacting shellfish quality, allowing specific remedial action to be taken.
4. Conclusions
The aim of this research was to enumerate and identify the extent and source of faecal contamination impacting the waters surrounding Blakeney Harbour using both traditional microbiological and novel sterol profile analytical approaches. Previously relatively high E. coli and FS numbers have been reported in the waters surrounding Blakeney Point, East Anglia, UK, an area containing significant shellfishery industries, including mussels and cockles, despite the implementation of remedial works aimed at reducing residual contamination problems. The highest concentrations of the faecal indicator E. coli were obtained from Freshers Creek (Site 2 with E. coli numbers reaching 400 per 100 mL of water). However, this number is significantly below the Bathing Waters Directive guidelines if they were applied; in contrast, FS concentrations were high at many of the sites, reaching 17,000 per 100 mL Blakeney Harbour Sluice. The E. coli: FS ratio at all sites were <0.25, suggesting that the major contributor to the faecal pollution of Blakeney was animal based, with latter sites more affected by animal pollution.
Sterol profile analysis identified cholesterol as dominating the sterols present; cholesterol is found in many different organisms and does not represent a species faecal biomarker. Although coprostanol, a sewage biomarker was the only sterol found within the River Cley, the concentration was low (12 ng 100 mL−1), confirming that no significant human faecal contamination could be detected in waters around Blakeney Point. Rather, the presence of sitosterol in water samples suggests that the native bird population may be the main source of faecal contamination, although at the concentration detected, it would not affect water quality.
Analysis of cockles and mussels taken from the area confirm that faecal pollution was not impacting shellfish quality. Apart from cholesterol, brassicasterol, an algal biomarker, as expected was dominant in shellfish flesh. The results confirm that current water treatment processes are successful in ensuring water quality at Blakeney Point and that a combining microbial testing with sterol profile analysis led to concluding that microbial low residual concentrations of faecal contaminants present in and around Blakeney Point most probably originate from migratory and/or resident bird species.
Author Contributions
Writing—original draft preparation, A.S.B.; writing—review and editing, E.S., L.S.K. and A.A.-M.; supervision, D.J.S. All authors have read and agreed to the published version of the manuscript.
Funding
No funding were received to carry out this research.
Institutional Review Board Statement
Not applicable.
Informed Consent Statement
Not applicable.
Data Availability Statement
Not applicable.
Conflicts of Interest
The authors declare no conflict of interest.
References
- Florini, S.; Shahsavari, E.; Ngo, T.; Aburto-Medina, A.; Smith, D.J.; Ball, A.S. Factors Influencing the Concentration of Fecal Coliforms in Oysters in the River Blackwater Estuary, UK. Water 2020, 12, 1086. [Google Scholar] [CrossRef]
- Blanch, A.R.; Belanche-Muñoz, L.; Bonjoch, X.; Ebdon, J.; Gantzer, C.; Lucena, F.; Ottoson, J.; Kourtis, C.; Iversen, A.; Kühn, I.; et al. Tracking the origin of faecal pollution in surface water: An ongoing project within the European Union research programme. J. Water Health 2004, 2, 249–260. [Google Scholar] [CrossRef] [PubMed] [Green Version]
- Lee, C.-Y.; Panicker, G.; Bej, A.K. Detection of pathogenic bacteria in shellfish using multiplex PCR followed by CovaLink™ NH microwell plate sandwich hybridization. J. Microbiol. Methods 2003, 53, 199–209. [Google Scholar] [CrossRef]
- Oliveira, J.; Cunha, A.; Castilho, F.; Romalde, J.L.; Pereira, M.J. Microbial contamination and purification of bivalve shellfish: Crucial aspects in monitoring and future perspectives—A mini-review. Food Control 2011, 22, 805–816. [Google Scholar] [CrossRef]
- Godfree, A.; Kay, D.; Wyer, M. Faecal streptococci as indicators of faecal contamination in water. J. Appl. Microbiol. 1997, 83, 110–119. [Google Scholar] [CrossRef] [PubMed]
- Stapleton, C.M.; Wyer, M.D.; Kay, D.; Crowther, J.; McDonald, A.T.; Walters, M.; Gawler, A.; Hindle, T. Microbial source tracking: A forensic technique for microbial source identification? J. Environ. Monit. 2007, 9, 427–439. [Google Scholar] [CrossRef] [PubMed]
- Chou, C.-C.; Liu, Y.-P. Determination of fecal sterols in the sediments of different wastewater outputs by GC-MS. Int. J. Environ. Anal. Chem. 2004, 84, 379–388. [Google Scholar] [CrossRef]
- American Water Works Association. Standard Methods for the Examination of Water and Wastewater, 9th ed.; APHA, AWWA and WPCF: Washington, DC, USA, 1995. [Google Scholar]
- Sinton, L.; Finlay, R.; Hannah, D. Distinguishing human from animal faecal contamination in water: A review. N. Z. J. Mar. Freshw. Res. 1998, 32, 323–348. [Google Scholar] [CrossRef] [Green Version]
- Sharip, Z.; Mohamad, M.F. Microbial Contamination in Urban Tropical Lentic Waterbodies and Ponds along an Urbanization Gradient. Pertanika J. Trop. Agric. Sci. 2019, 42, 165–184. [Google Scholar]
- Obiri-Danso, K.; Jones, K. Distribution and seasonality of microbial indicators and thermophilic campylobacters in two freshwater bathing sites on the River Lune in northwest England. J. Appl. Microbiol. 1999, 87, 822–832. [Google Scholar] [CrossRef] [Green Version]
- Obiri-Danso, K.; Jones, K. Intertidal sediments as reservoirs for hippurate negative campylobacters, salmonellae and faecal indicators in three EU recognised bathing waters in north west England. Water Res. 2000, 34, 519–527. [Google Scholar] [CrossRef]
- Zimmer-Faust, A.G.; Brown, C.A.; Manderson, A. Statistical models of fecal coliform levels in Pacific Northwest estuaries for improved shellfish harvest area closure decision making. Mar. Pollut. Bull. 2018, 137, 360–369. [Google Scholar] [CrossRef]
- Leeming, R.; Ball, A.; Ashbolt, N.; Nichols, P. Using faecal sterols from humans and animals to distinguish faecal pollution in receiving waters. Water Res. 1996, 30, 2893–2900. [Google Scholar] [CrossRef]
- Harrault, L.; Milek, K.; Jardé, E.; Jeanneau, L.; Derrien, M.; Anderson, D.G. Faecal biomarkers can distinguish specific mammalian species in modern and past environments. PLoS ONE 2019, 14, e0211119. [Google Scholar] [CrossRef] [PubMed] [Green Version]
- Florini, S.; Shahsavari, E.; Aburto-Medina, A.; Khudur, L.S.; Mudge, S.M.; Smith, D.J.; Ball, A.S. Are Sterols Useful for the Identification of Sources of Faecal Contamination in Shellfish? A Case Study. Water 2020, 12, 3076. [Google Scholar] [CrossRef]
- Scarlett, A.G.; Clough, R.; West, C.; Lewis, C.A.; Booth, A.M.; Rowland, S.J. Alkylnaphthalenes: Priority pollutants or minor contributors to the poor health of marine mussels? Environ. Sci. Technol. 2011, 45, 6160–6166. [Google Scholar] [CrossRef] [PubMed]
- Fernandes, A.; Mortimer, D.; Gem, M.; Dicks, P.; Smith, F.; White, S.; Rose, M. Brominated dioxins (PBDD/Fs) and PBDEs in marine shellfish in the UK. Food Addit. Contam. 2009, 26, 918–927. [Google Scholar] [CrossRef] [Green Version]
- Law, R.; Kelly, C.; Baker, K.; Langford, K.; Bartlett, T. Polycyclic aromatic hydrocarbons in sediments, mussels and crustacea around a former gasworks site in Shoreham-by-Sea, UK. Mar. Pollut. Bull. 2002, 44, 903–911. [Google Scholar] [CrossRef]
- Langston, W.; O’Hara, S.; Pope, N.; Davey, M.; Shortridge, E.; Imamura, M.; Harino, H.; Kim, A.; Vane, C. Bioaccumulation surveillance in milford haven waterway. Environ. Monit. Assess. 2012, 184, 289–311. [Google Scholar] [CrossRef] [PubMed] [Green Version]
- Emmanouil, C.; Green, R.M.; Willey, F.R.; Chipman, J.K. Oxidative damage in gill of Mytilus edulis from Merseyside, UK, and reversibility after depuration. Environ. Pollut. 2008, 151, 663–668. [Google Scholar] [CrossRef] [PubMed]
- Chiang, Y.-R.; Ismail, W. Anaerobic Biodegradation of Steroids. In Anaerobic Utilization of Hydrocarbons, Oils, and Lipids; Springer Nature: Cham, Switzerland, 2020; pp. 165–195. [Google Scholar]
- Mudge, S.M.; Bebianno, M.J.A.; East, J.A.; Barreira, L.A. Sterols in the Ria Formosa Lagoon, Portugal. Water Res. 1999, 33, 1038–1048. [Google Scholar] [CrossRef]
- Frena, M.; Souza, M.R.; Damasceno, F.C.; Madureira, L.A.; Alexandre, M.R. Evaluation of anthropogenic contamination using sterol markers in a tropical estuarine system of northeast Brazil. Mar. Pollut. Bull. 2016, 109, 619–623. [Google Scholar] [CrossRef]
- Patton, D.; Reeves, A. Sterol concentrations and temporal variations on the north shore mudflats of the firth of Tay, Scotland. Mar. Pollut. Bull. 1999, 38, 613–618. [Google Scholar] [CrossRef]
- Bull, I.D.; Lockheart, M.J.; Elhmmali, M.M.; Roberts, D.J.; Evershed, R.P. The origin of faeces by means of biomarker detection. Environ. Int. 2002, 27, 647–654. [Google Scholar] [CrossRef]
- Mudge, S.; Hooper, L.; Icely, J. Biomarkers associated with sewage in the Arade Estuary, Portugal. Environ. Technol. 1998, 19, 1055–1059. [Google Scholar] [CrossRef]
- Grimalt, J.O.; Fernandez, P.; Bayona, J.M.; Albaiges, J. Assessment of fecal sterols and ketones as indicators of urban sewage inputs to coastal waters. Environ. Sci. Technol. 1990, 24, 357–363. [Google Scholar] [CrossRef]
- Evershed, R.P.; Bethell, P.H. Application of Multimolecular Biomarker Techniques to the Identification of Fecal Material in Archaeological Soils and Sediments; ACS Publications: Washington, DC, USA, 1996. [Google Scholar]
- Bligh, E.G.; Dyer, W.J. A rapid method of total lipid extraction and purification. Can. J. Biochem. Physiol. 1959, 37, 911–917. [Google Scholar] [CrossRef] [PubMed]
- Ghosh, P.; Patterson, G.W.; Wikfors, G.H. Use of an improved internal-standard method in the quantitative sterol analyses of phytoplankton and oysters. Lipids 1997, 32, 1011–1014. [Google Scholar] [CrossRef] [PubMed]
- Ennos, A.R. Statistical and Data Handling Skills in Biology; Pearson Education: London, UK, 2007. [Google Scholar]
- Aburto-Medina, A.; Shahsavari, E.; Salzman, S.A.; Kramer, A.; Ball, A.S.; Allinson, G. Elucidation of the microbial diversity in rivers in south-west Victoria, Australia impacted by rural agricultural contamination (dairy farming). Ecotoxicol. Environ. Saf. 2019, 172, 356–363. [Google Scholar] [CrossRef]
- Kolm, H.E.; Gomes, K.V.; Ishii, F.K.; Martins, C.C. An integrated appraisement of multiple faecal indicator bacteria and sterols in the detection of sewage contamination in subtropical tidal creeks. Int. J. Hyg. Environ. Health 2018, 221, 1032–1039. [Google Scholar] [CrossRef] [PubMed]
- Leeming, R.; Latham, V.; Rayner, M.; Nichols, P. Detecting and Distinguishing Sources of Sewage Pollution in Australian Inland and Coastal Waters and Sediments; ACS Publications: Washington, DC, USA, 1997. [Google Scholar]
- Lee, J.M.; Jeon, J.H.; Yim, M.-J.; Choi, G.; Lee, M.S.; Park, Y.G.; Lee, D.-S. Comparison of fucosterol content in algae using high-performance liquid chromatography. Fish. Aquat. Sci. 2020, 23, 9. [Google Scholar] [CrossRef] [Green Version]
- Puglisi, E.; Nicelli, M.; Capri, E.; Trevisan, M.; Del Re, A.A. Cholesterol, β-sitosterol, ergosterol, and coprostanol in agricultural soils. J. Environ. Qual. 2003, 32, 466–471. [Google Scholar] [CrossRef] [PubMed]
- Cathum, S.; Sabik, H. Determination of steroids and coprostanol in surface water, effluent and mussel using gas chromatography-mass spectrometry. Chromatographia 2001, 53, S394–S399. [Google Scholar] [CrossRef]
- Mudge, S.; Lintern, D.G. Comparison of sterol biomarkers for sewage with other measures in Victoria Harbour, BC, Canada. Estuar. Coast. Shelf Sci. 1999, 48, 27–38. [Google Scholar] [CrossRef]
Figure 1.
(A) Map of Blakeney Point indicating the position of sampling sites ( ![Water 13 03192 i001]() Landmarks,
Landmarks, ![Water 13 03192 i002]() Sampling points). (B) Map of England and Wales: The red square shows the location of the study site.
Sampling points). (B) Map of England and Wales: The red square shows the location of the study site.
 Landmarks,
  Sampling points). (B) Map of England and Wales: The red square shows the location of the study site.
Figure 1.
(A) Map of Blakeney Point indicating the position of sampling sites ( ![Water 13 03192 i001]() Landmarks,
Landmarks, ![Water 13 03192 i002]() Sampling points). (B) Map of England and Wales: The red square shows the location of the study site.
Sampling points). (B) Map of England and Wales: The red square shows the location of the study site.
Landmarks, Sampling points). (B) Map of England and Wales: The red square shows the location of the study site.
Figure 2.
(A). Concentrations of E. coli in environmental water samples taken during low tide from around Blakeney Point. Values represent mean data. (B). Concentrations of Faecal Streptococci (FS) from environmental water samples taken during low tide from around Blakeney point. Values represent mean data. (C). The ratio of E. coli to Faecal Streptococci in water samples collected from around Blakeney Point during a low tide period. (1) Simpoles Head, (2) Freshers Creek, (3) Mortson Creek, (4) Blakeney Harbour, (5) Blakeney Harbour Sluice, (6) Scaupe Run, (7) River Cley (below weir), (8) River Cley (above weir). Lower case letters above the bars (A,B) a, b, c, denote the significance between the sites at p < 0.05.

Figure 3.
(A). Total water sterol concentrations of at each of the sites. Concentrations (ng per 100 mL of seawater) are given in ranges and are indicated by the different sized symbols and are indicated by the different sized symbols. (1) Simpoles Head, (2) Freshers Creek, (3) Mortson Creek, (4) Blakeney Harbour, (5) Blakeney Harbour Sluice, (6) Scaupe Run, (7) River Cley (below weir), (8) River Cley (above weir). (B) Relative concentrations of sterols in water samples taken from around Blakeney Point during a low tide period with omission of cholesterol.

Figure 4.
The relative concentrations of coprostanol (5b-cop) and sitosterol in water samples, as calculated from the total sterol concentration minus cholesterol, at various sites around Blakeney as determined during a low tide period. (1) Simpoles Head, (2) Freshers Creek, (3) Mortson Creek, (4) Blakeney Harbour, (5) Blakeney Harbour Sluice, (6) Scaupe Run, (7) River Cley (below weir), (8) River Cley (above weir).

Figure 5.
Sterol concentrations (µg g−1 dry weight flesh) determined in cockles extracted from Freshers Creek and mussels extract from Simpoles Head.
Figure 5.
Sterol concentrations (µg g−1 dry weight flesh) determined in cockles extracted from Freshers Creek and mussels extract from Simpoles Head.

Figure 6.
(A). Linear regression of E. coli (numbers per 100 mL) and coprostanol (µg 100 mL) in water samples. (B). Linear regression of Faecal Streptococci (numbers per 100 mL) and sitosterol (µg 100 mL) in water.
Figure 6.
(A). Linear regression of E. coli (numbers per 100 mL) and coprostanol (µg 100 mL) in water samples. (B). Linear regression of Faecal Streptococci (numbers per 100 mL) and sitosterol (µg 100 mL) in water.


Table 1.
Sampling site numbers, site name, and samples taken during the study.
| Site Number | Sampling Site Name | Samples Types |
|---|---|---|
| 1 | Simpoles Head | Mussels |
| 2 | Freshers Creek | Cockles |
| 3 | Mortson Creek | Water |
| 4 | Blakeney Harbour | Water |
| 5 | Blakeney Harbour Sluice | Water |
| 6 | Blakeney Channel (Scaupe Run) | Water |
| 7 | River Cley (below weir) | Water |
| 8 | River Cley (above weir) | Water |
Publisher’s Note: MDPI stays neutral with regard to jurisdictional claims in published maps and institutional affiliations. |
© 2021 by the authors. Licensee MDPI, Basel, Switzerland. This article is an open access article distributed under the terms and conditions of the Creative Commons Attribution (CC BY) license (https://creativecommons.org/licenses/by/4.0/).
Share and Cite
MDPI and ACS Style
Ball, A.S.; Shahsavari, E.; Khudur, L.S.; Aburto-Medina, A.; Smith, D.J. Factors Affecting Shellfish Quality in Terms of Faecal Contamination at Blakeney Point, East Anglia, UK. Water 2021, 13, 3192. https://doi.org/10.3390/w13223192
AMA Style
Ball AS, Shahsavari E, Khudur LS, Aburto-Medina A, Smith DJ. Factors Affecting Shellfish Quality in Terms of Faecal Contamination at Blakeney Point, East Anglia, UK. Water. 2021; 13(22):3192. https://doi.org/10.3390/w13223192
Chicago/Turabian StyleBall, Andrew S., Esmaeil Shahsavari, Leadin S. Khudur, Arturo Aburto-Medina, and David J. Smith. 2021. "Factors Affecting Shellfish Quality in Terms of Faecal Contamination at Blakeney Point, East Anglia, UK" Water 13, no. 22: 3192. https://doi.org/10.3390/w13223192
Note that from the first issue of 2016, this journal uses article numbers instead of page numbers. See further details here.