
Investigation of Spatial and Temporal Variability of Hydrological Drought in Slovenia Using the Standardised Streamflow Index (SSI)


1
Faculty of Civil and Geodetic Engineering, University of Ljubljana, 1000 Ljubljana, Slovenia
2
Slovenian Environment Agency, 1000 Ljubljana, Slovenia
*
Author to whom correspondence should be addressed.
Water 2021, 13(22), 3197; https://doi.org/10.3390/w13223197
Submission received: 19 October 2021
/
Revised: 8 November 2021
/
Accepted: 11 November 2021
/
Published: 11 November 2021
(This article belongs to the Special Issue Modelling Hydrologic Response of Non-homogeneous Catchments)
Abstract
:Drought is a complex phenomenon with high spatial and temporal variability. Water scarcity has become a growing problem in Slovenia in recent decades. Therefore, the spatial and temporal variability of hydrological drought was investigated in this study by analysing the Standardized Streamflow Index (SSI). Monthly discharge data series from 46 gauging stations for the period 1961–2016 were used to calculate SSI values at five different time scales (1, 3, 6, 12, and 24 months). The results indicate that the frequency and intensity of droughts in Slovenia has increased in recent decades at most of the analysed gauging stations and at all time scales considered. Spring and summer periods were identified as critical in terms of water deficit. SSI values vary independently from the location of the gauging station, confirming that drought is a regional phenomenon, even in a small country such as Slovenia. However, SSI values vary considerably depending on the time scale chosen. This was also confirmed by the results of the hierarchical clustering of the number of extreme droughts, as various time scales resulted in a different distribution of gauging stations by individual groups.
1. Introduction
Drought is a complex natural hazard, connected with water scarcity that affects ecosystems and society [1]. It is a long-term recurring phenomenon that usually affects larger regions and can cause severe damage and economic losses as well as loss of human lives (e.g., [2,3]). Furthermore, spatial and temporal characteristics of droughts vary significantly [2]. Due to its complexity, drought is hard to define, monitor, and qualify. According to Wilhite and Glanz [4], drought can be classified into four types, namely meteorological, agricultural, hydrological, and socioeconomic. Some other researchers have also included other factors of atmospheric, ecological, or water management (e.g., [5,6,7]). Common to all types of drought is that they are the consequence of a lack of precipitation, which results in water shortage for some activities (e.g., agriculture) or for some user groups (e.g., drinking water consumers) [4].
Drought indices are commonly used for detection, monitoring, and evaluation of drought events. Lloyd-Hughes [8] found in the literature over 100 drought indices proposed for use in drought monitoring and evaluation, a fact reflecting the complexity of the subject matter. The choice of a suitable drought index for a particular drought analysis depends on several factors, such as type of drought, climate, and hydrological characteristics of the region, the aim of the study, accessibility of data and information, etc. (e.g., [3,9,10]); therefore, it is difficult to talk about the ‘best’ drought index. Each type of index focuses on a specific part of the hydrological cycle and has its purpose for a specific application [1]. There is a commonly used group of standardized drought indices, which are related to different variables of the hydrological cycle (e.g., the Standardized Precipitation Index (SPI), Standardized Precipitation and Evapotranspiration Index (SPEI), Standardized Streamflow Index (SSI), and the Standardized Groundwater level Index (SGI)). They all originate from SPI, which is the most-widely used standardized meteorological drought index. All the mentioned standardized drought indices are based on a similar calculation procedure, which enables compartments of drought in different parts of the hydrological cycle [1,10]. In addition to standardized drought indices, there are also some other techniques for drought investigation, for example cross-wavelet analysis [11].
Hydrological drought can be defined as a prolonged period with below-normal water availability in surface and subsurface water due to natural causes (e.g., [1,9,12]). Climate change also has a major impact on surface and subsurface water availability (e.g., [13,14]). Many studies have investigated hydrological drought at the national, continental, or global scale using observed (e.g., [10,15,16,17,18]) or modelled (e.g., [9,12,19,20,21]) streamflow/runoff data. One of the most commonly used hydrological drought indices is SSI, which uses observed discharge data. It allows spatial and temporal comparisons of the hydrological conditions of a stream [15]. Its main advantage is that only one variable (monthly discharge time series) is needed and the code or software to calculate the index is freely available [22]. Another advantage is that it can be used to monitor both short- and long-term hydrological droughts [22]. The limitation of the method is that the values of SSI only indicate the degree of drought intensity at a location but not the actual amounts of water. In this respect, SSI only accounts for the streamflow in the context of drought monitoring, with no other influences being investigated. Thus, the impact of water use is not taken into account.
Due to the lack of precipitation and its uneven distribution, drought or water scarcity has been a growing problem also in Slovenia [23,24]. After 1990, agricultural drought has been declared 11 times, of which nine times have been since 2000 (2000, 2001, 2003, 2006, 2007, 2009, 2012, 2013, and 2017). In most of the listed years, the drought reached the dimensions of a natural disaster, which means that the estimated direct damage exceeded 0.3 per mil of GDP [25]. Due to these facts, a need for further investigation of droughts and their characteristics in Slovenia has arisen. The main objective of this study is a thorough investigation of the spatial and temporal variability of hydrological drought by analysing SSI at various time scales for gauging stations in Slovenia. In the frame of this study, seasonality of the SSI results was investigated, and the results for the hydrologically wettest and driest years were compared for all selected gauging stations. Additionally, an analysis of the number of severe and extreme drought events at all selected gauging stations was conducted.
2. Materials and Methods
2.1. Data
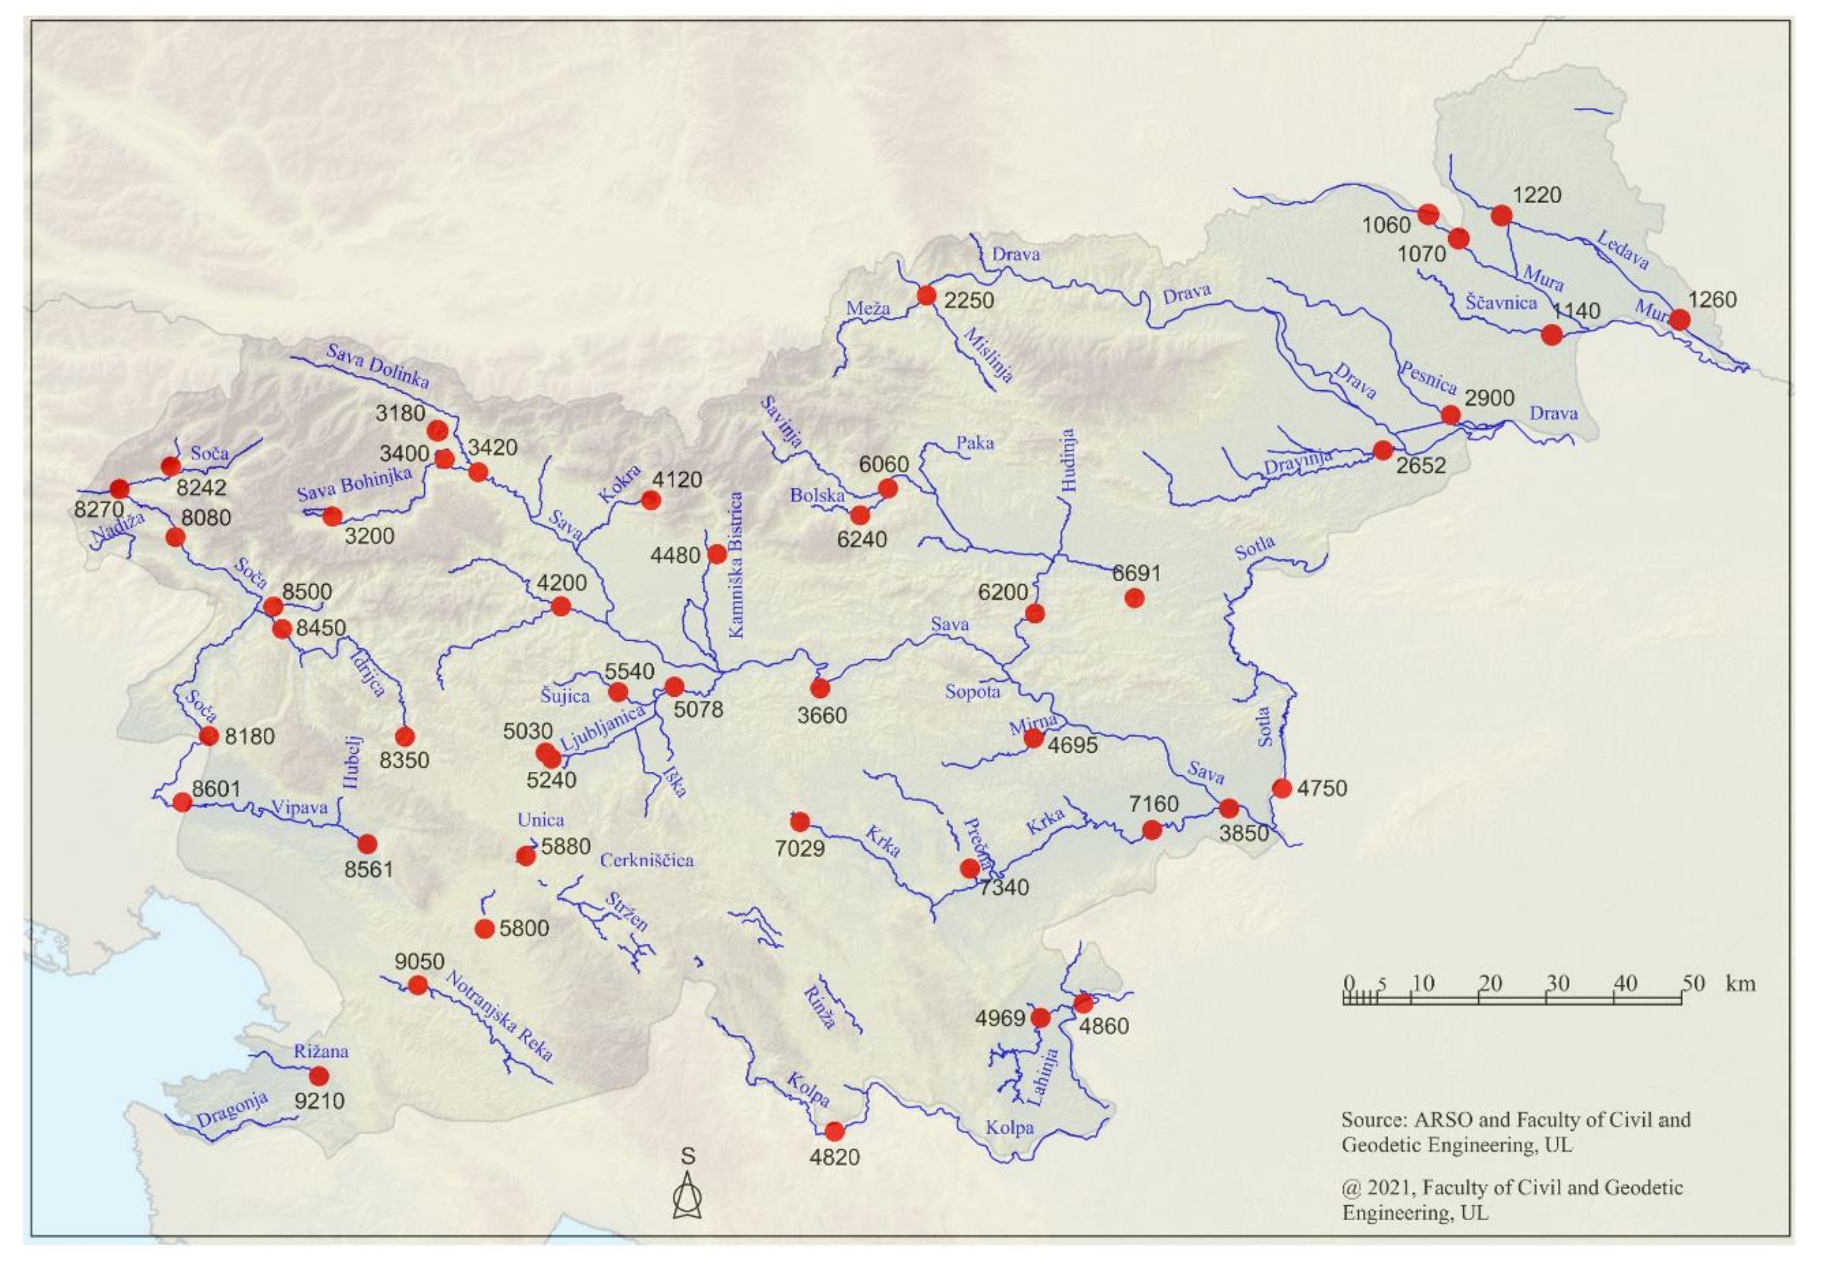
Analyses were performed based on monthly discharge data series at 46 gauging stations in Slovenia for the period 1960–2016 (Table 1 and Figure 1). Due to the uniform spatial distribution of gauging stations covering different flow regimes, some gauging stations were also selected with a shorter set of measurements. Furthermore, data from the gauging stations with the minimum possible data gap and anthropogenic influence (e.g., the influence of human activities, such as deforestation, urbanization, construction of reservoirs, and water abstraction) were selected.
2.2. Methods
In order to compare the streamflow time series in time and space regardless of the magnitude and the river regimes, standardization of the streamflow series is needed [16,17,26,27]. Among several hydrological drought indices the standardized streamflow index (SSI) is commonly used. SSI is a statistically-based drought index depending on the long-term monthly streamflow records [20]. The methodology is analogous to the standardized precipitation index (SPI), which was developed by [28]. The main aim of the methodology is to quantify the above-average anomalies on different time scales (e.g., 1, 3, 6, 12, 24, or 48 months).
The first step of the SSI methodology is to determine the probability density function for the selected streamflow time series. The gamma distribution is most commonly used and was applied also in this study. Once the cumulative distribution function F(x) is identified, the SSI values can be calculated as z-scores, following the procedure of Guttman [26]. More details about the SSI calculation can be found in [17]. McKee et al. [28] established the criteria for determining the beginning and the end of a drought event, considering that a drought event begins when the index is continuously negative and reaches the value of −1 or less, and it ends when index becomes positive (Table 2).
Analysis of the number of extreme droughts was performed using hierarchical clustering. This is a method that assigns the considered values or cases based on their similarity to clusters in order to create a hierarchy of clusters (e.g., [30]). Combining and splitting of the clusters is based on the measure of dissimilarity among sets of observations, which is achieved by the use of an appropriate metric [31]. In the study, Ward’s minimum variance method on a distance matrix calculated by the Euclidean distance measure was used. Cluster analysis was performed using Orange software v3.11 [32]. Other analyses and presentation of the results were performed using R software v4.1 [33] and SAGA GIS software v7.4 [34].
3. Results and Discussion
3.1. Comparison of the Wet and Dry Years
SSI values were calculated for five different time scales: one month (SSI-1), three months (SSI-3), six months (SSI-6), twelve months (SSI-12), and twenty-four months (SSI-24) for the period 1960–2016 for 46 selected gauging stations in Slovenia. An example of the results for one of the analysed stations is presented in Figure 2. The results showed that the SSI variability was greater on shorter time scales rather than on longer ones, which was expected. On longer time scales, drought was less common, but the duration was longer and more intense, while on shorter time scales, hydrological drought had a shorter duration and lower intensity, but occurred more frequently.
The results of the SSI values for the Polana I (1220) gauging station (Figure 2) clearly showed that the frequency and intensity of droughts increased in the last two decades, i.e., a fact that can be observed at all considered time scales. This is consistent with the findings of Cunja et al. [35], who reported that the frequency of drought events in Slovenia has been increasing in the last decades. They analysed 44 gauging stations in Slovenia from 1960 onwards. They reported that the largest drought event at the Polana I (1220) gauging station occurred in 2003 and the wettest year was 1965/66. According to flow deficit calculation, they identified as many as 216 drought days at the Polana I station in 2003. In general, they identified the year 2003 as hydrologically the driest year in the period 1960–2016 using different low-flow indices. Furthermore, they reported that the drought in 2003 affected most of Slovenia. Slightly less severe droughts occurred in 1993 and 2012, which is also evident from Figure 2. However, Cunja et al. [35] also argued that drought is a regional phenomenon, as in 1993 the most severe drought occurred in the northern part of Slovenia, in 2003 and 2012 in the northeastern part (Prekmurje region), and in 2011 in the southern part of the country.
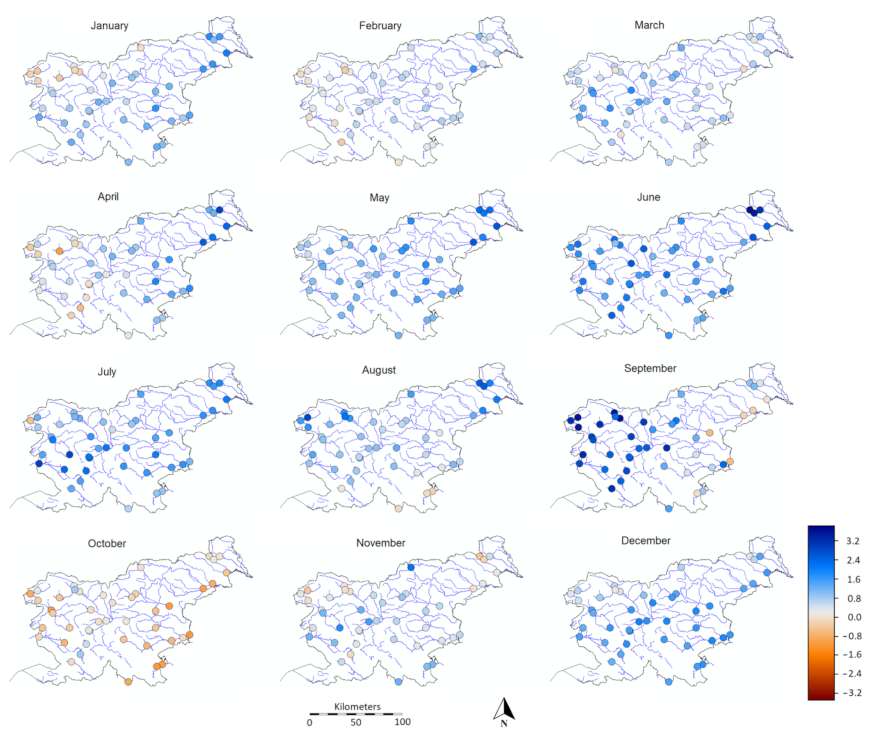
Following the findings of Cunja et al. [35], the hydrologically wettest (1965) and driest year (2003) were compared for all 46 selected gauging stations in this study. As can be seen from Figure 3, no major drought events occurred in the typically wet year of 1965 as expected. According to the calculated one month SSI (Figure 3), October 1965 was the driest month. The lowest one month SSI value was calculated at the hydrological station Rakovec (4750) with a value of 1,236 (moderate drought), and the highest in June at the hydrological station Gornja Radgona I (1060) with a value of 3,523 (extremely wet).
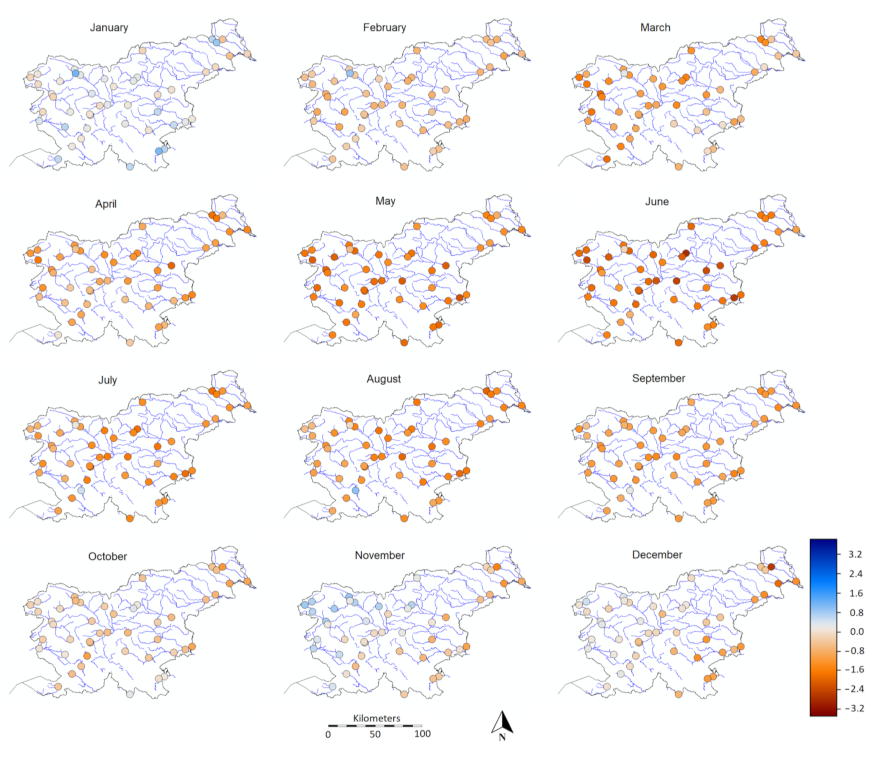
Spatial presentation of SSI-1 values for the driest year 2003 is presented in Figure 4. In 2003, the drought was exceptional in spring as well as in summer, which can be seen from Figure 4. The lowest SSI-1 value was calculated in June at the Nazarje (6060) gauging station with a value of −2874 (extreme drought), and the highest in January at the gauging station Mlino I (3400) with a value of 1083 (moderately wet). In May and June, the values of SSI-1 were below 0 for all considered gauging stations. Furthermore, 96% of gauging stations in May had a value of SSI-1 less than −1, which indicates that moderate drought occurred at these locations. In June, as many as 97% of all considered gauging stations had SSI-1 values below −1 (Figure 4).
Similarly, comparison of the SSI values at higher time scales was conducted. The highest value of the SSI-6 in 2003 was −0.081 (mild drought) calculated at the Mlino I (3400) gauging station in June, and the lowest −2844 at the Polana I (1220) gauging station in December (extreme drought). The value of SSI-12 for the driest year 2003 reached its maximum at the Mlino I (3400) station with a value of −0.330 (mild drought), and an extreme drought occurred in the area of the Rakovec (4750) station, where the SSI-12 reached a value of −2909 (extreme drought).
As the amount of precipitation in the area of Slovenia decreases from west to east, we could generally expect that the western part of Slovenia is less affected by droughts than its eastern part. However, the results of the SSI values at all considered time scales and their spatial distribution showed this was not the case. SSI values varied quite independently from the location of the gauging station and differed depending on the selected time scale. Drought events did not occur evenly, confirming that drought is a regional phenomenon even in a small country such as Slovenia. The same was reported also by Lorenzo-Lacruz et al. [16], who investigated the spatiotemporal characteristics of hydrological droughts in the Iberian Peninsula during the second half of the 20th century and found substantial spatial heterogeneity of hydrological droughts. Similar conclusions were also drawn by Wang et al. [21], who reported obvious spatial variations of drought characteristics (frequency, duration, and magnitude) even on a catchment scale (Luanhe River basin in China). On the other hand, Telesca et al. [15] reported a universal behaviour of SSI time series at the catchment scale, i.e., over the Ebro basin in Spain.
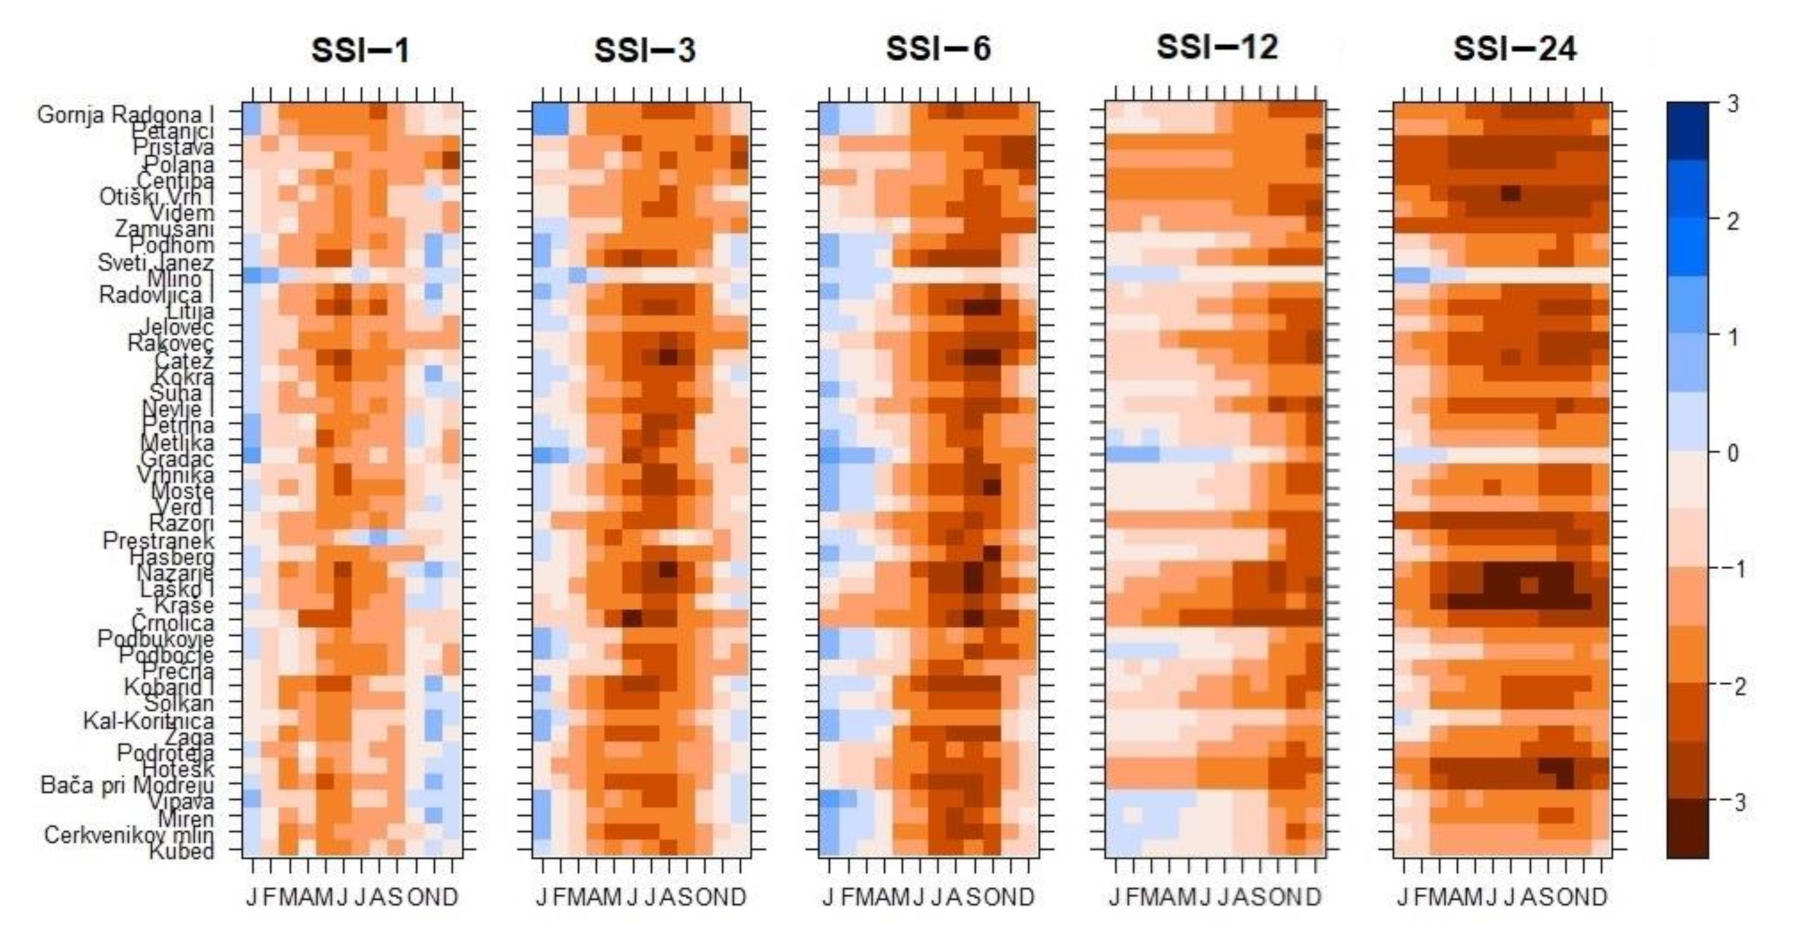
Additionally, we analysed SSI values at various time scales for a dry year 2003 using heatmaps (Figure 5), which allow a quick visual assessment of the results as well as seasonal comparison of the calculated SSI values for all selected stations. It was obvious that with the increasing time scale, drought events lasted longer and were more intense, which confirmed the previous findings of this study. Among the considered gauging stations, Mlino I (3400) was the least arid location regardless of the time scale in 2003 (Figure 5). This is not surprising as the station is located in the wettest part of Slovenia with a maximum annual mean precipitation of more than 3000 mm. On the other hand, it was hard to identify the driest location at the selected time scale, since there was more than one, and they varied according to the selected time scale. This once again confirmed the fact that droughts are regional phenomena in Slovenia. In terms of the seasonality, the results of SSI-1 show that at most locations, May and June were among the driest months, while the winter months (January, November, and December) were the wettest in 2003. Similar conclusions can be made also for other time scales taking into account that SSI values at longer time scales present values for the corresponding time period, i.e., SSI-6 values in December present the response of the discharge from July to December at the specific location. For example, the highest SSI-6 values in 2003 occurred in August and September, reflecting the response of the discharges to climatic conditions in the past six months, i.e., in the spring and summer months. This finding is in agreement with Sušnik [36], who reported that drought periods in spring and summer 2003 in Slovenia brought a record water deficit and consequently crop devastation and a high financial damage. Spring and summer periods were identified as critical in terms of water deficit for the period 1961–2002 also by [37]. Additionally, Jelovčan and Šraj [38] reported the lowest water levels as well as groundwater levels in the summer months for the southwestern part of the country. Furthermore, Sapač et al. [39] reported that summer low-flow conditions prevailed for 12 gauging stations in the Ljubljanica River catchment (gauging stations 5030–5880 of this study).
3.2. Analysis of the Number of Extreme Droughts
In this analysis, we defined the number of severe and extreme droughts. According to the drought classification (Table 2), severe drought occurs when the SSI index value is between −1.5 and −2, and extreme drought occurs when the SSI index value is less than −2. In order to obtain information on the locations in Slovenia where the occurrence of severe and extreme droughts was the most common, we used only the gauging stations with a complete set of discharge data. Therefore, the total number of the considered hydrological stations for this analysis was 34. The results are presented in Table 3.
As we can see, several severe and extreme drought events occurred in Slovenia in the considered period (Table 3). The results show that at least one extreme drought event (SSI < −2) occurred at all considered locations regardless of the time scale, except at the gauging stations Pristava (1140), Rakovec (4750), and Prečna (7340). Of course, the number of severe droughts was higher than the number of extreme droughts. A higher number of drought events is characteristic of longer time scales. As droughts on longer time scales are more intense and last longer, the number of severe and extreme droughts at all gauging stations increases with the increasing time scales.
Considering the SSI index at a 1-month time scale, extreme and severe droughts most often affected the Vrhnika location (5030). The Prestranek location (5800) was most affected by the droughts in the case of the SSI index at a 3-month time scale. Considering the 12-month SSI index, the area of the Laško station (6200) was most affected by extreme drought (Table 3).
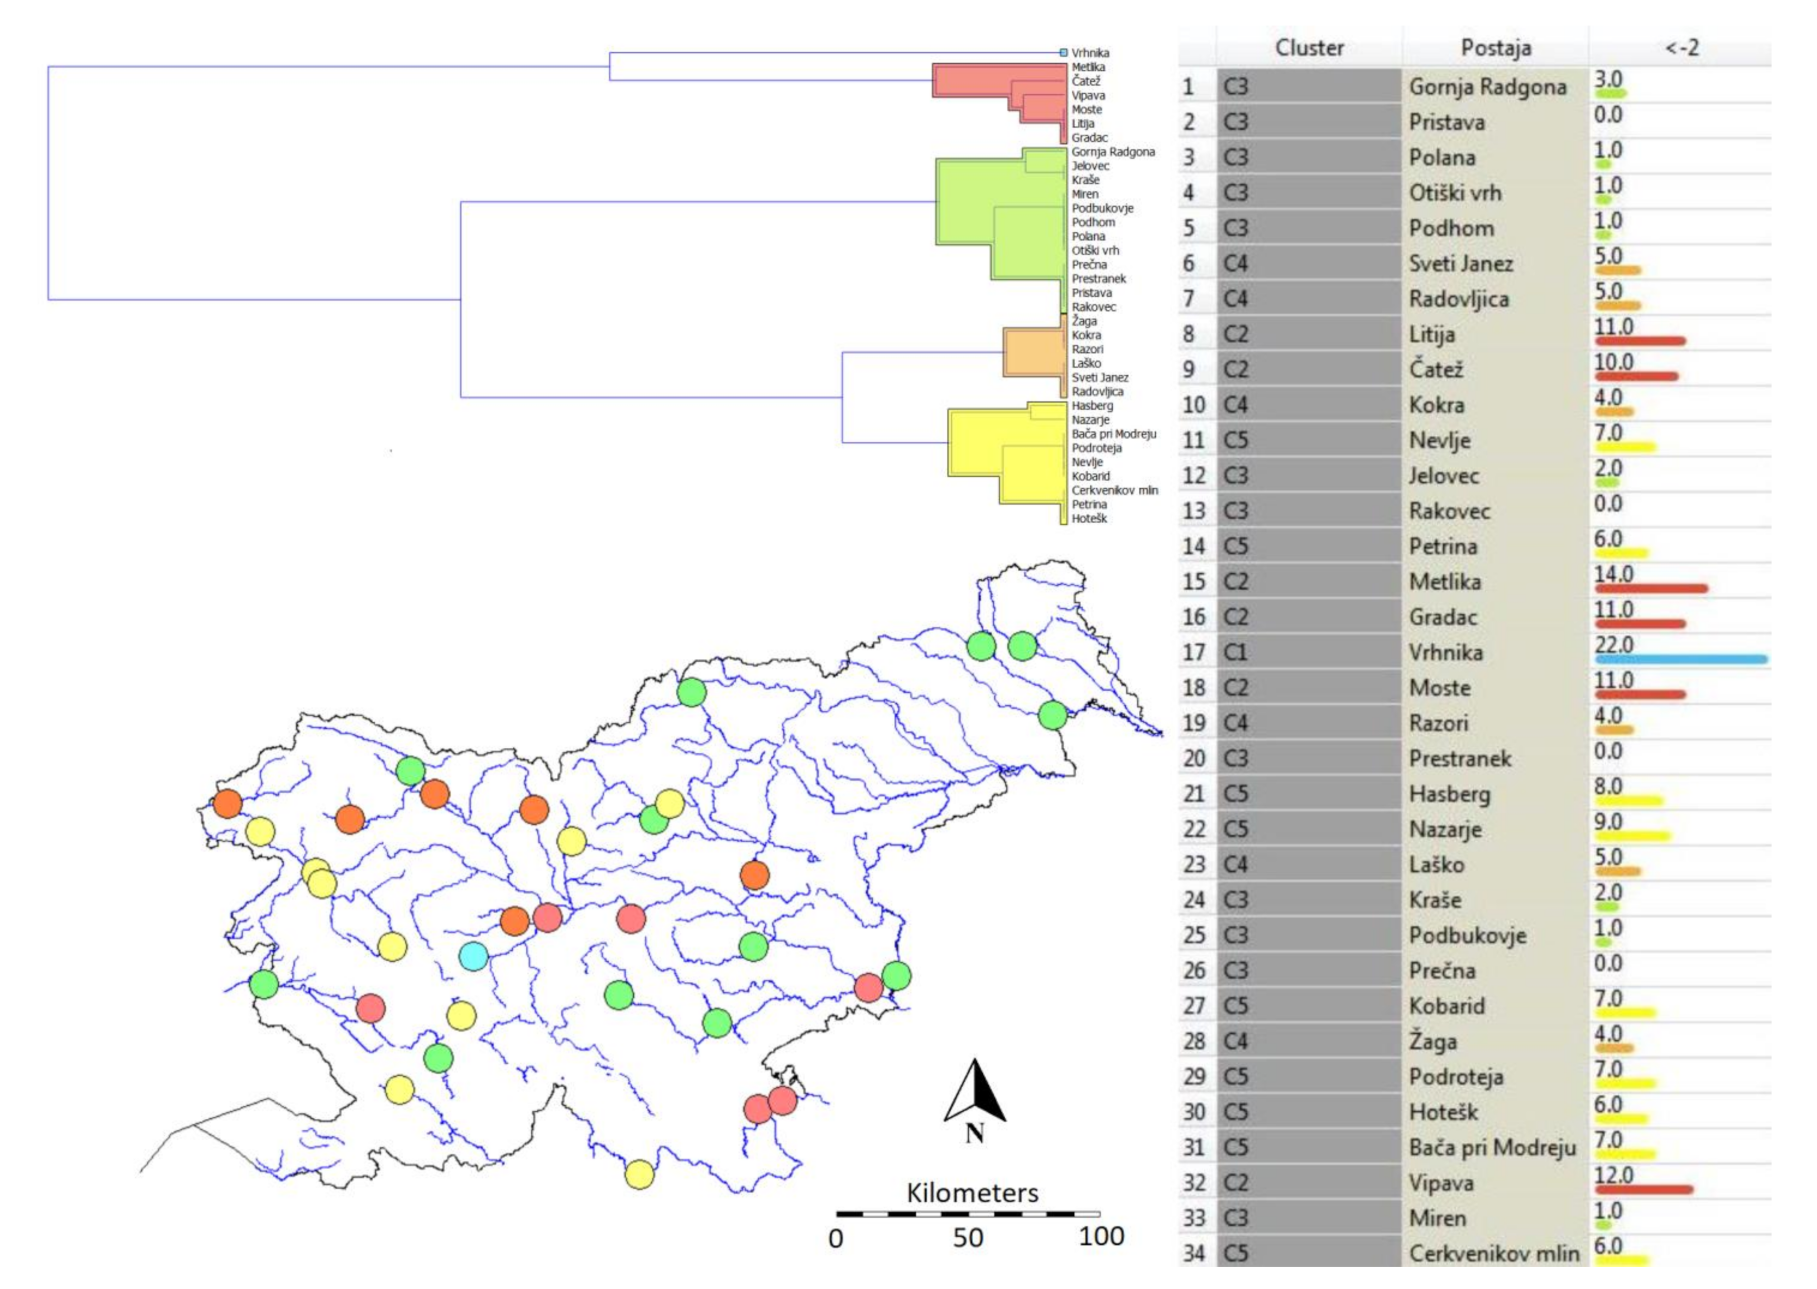
In the next step, hierarchical clustering of the number of extreme droughts (SSI < −2) was conducted. The results indicated that the hierarchical clustering of the number of extreme droughts divided the values into five different groups in all cases, regardless of the time scale (Figure 6, Figure 7 and Figure 8). In the case of the one month time scale (SSI-1), in group C1 (blue colour), only the Vrhnika gauging station with 22 drought events was assigned (Figure 6). This was the station with the highest number of extreme droughts in the period from 1960 to 2016, which is consistent with the previous findings. Gauging stations assigned to group C2 (red colour) with the number of extreme events between 10 and 14 were mainly located in the southern part of the country. On the other hand, group C4 (orange colour), consisting of gauging stations with the number of extreme events between 4 and 5, mainly covers the northern part of the country. In group C5 (yellow colour), which includes gauging stations with 6 to 9 extreme drought events, there were mainly stations located in the western part of the country (Figure 6). Group C3 (green colour) of hierarchical classification indicated an uneven spatial distribution of locations with a relatively low number of extreme droughts (0 to 3 events).
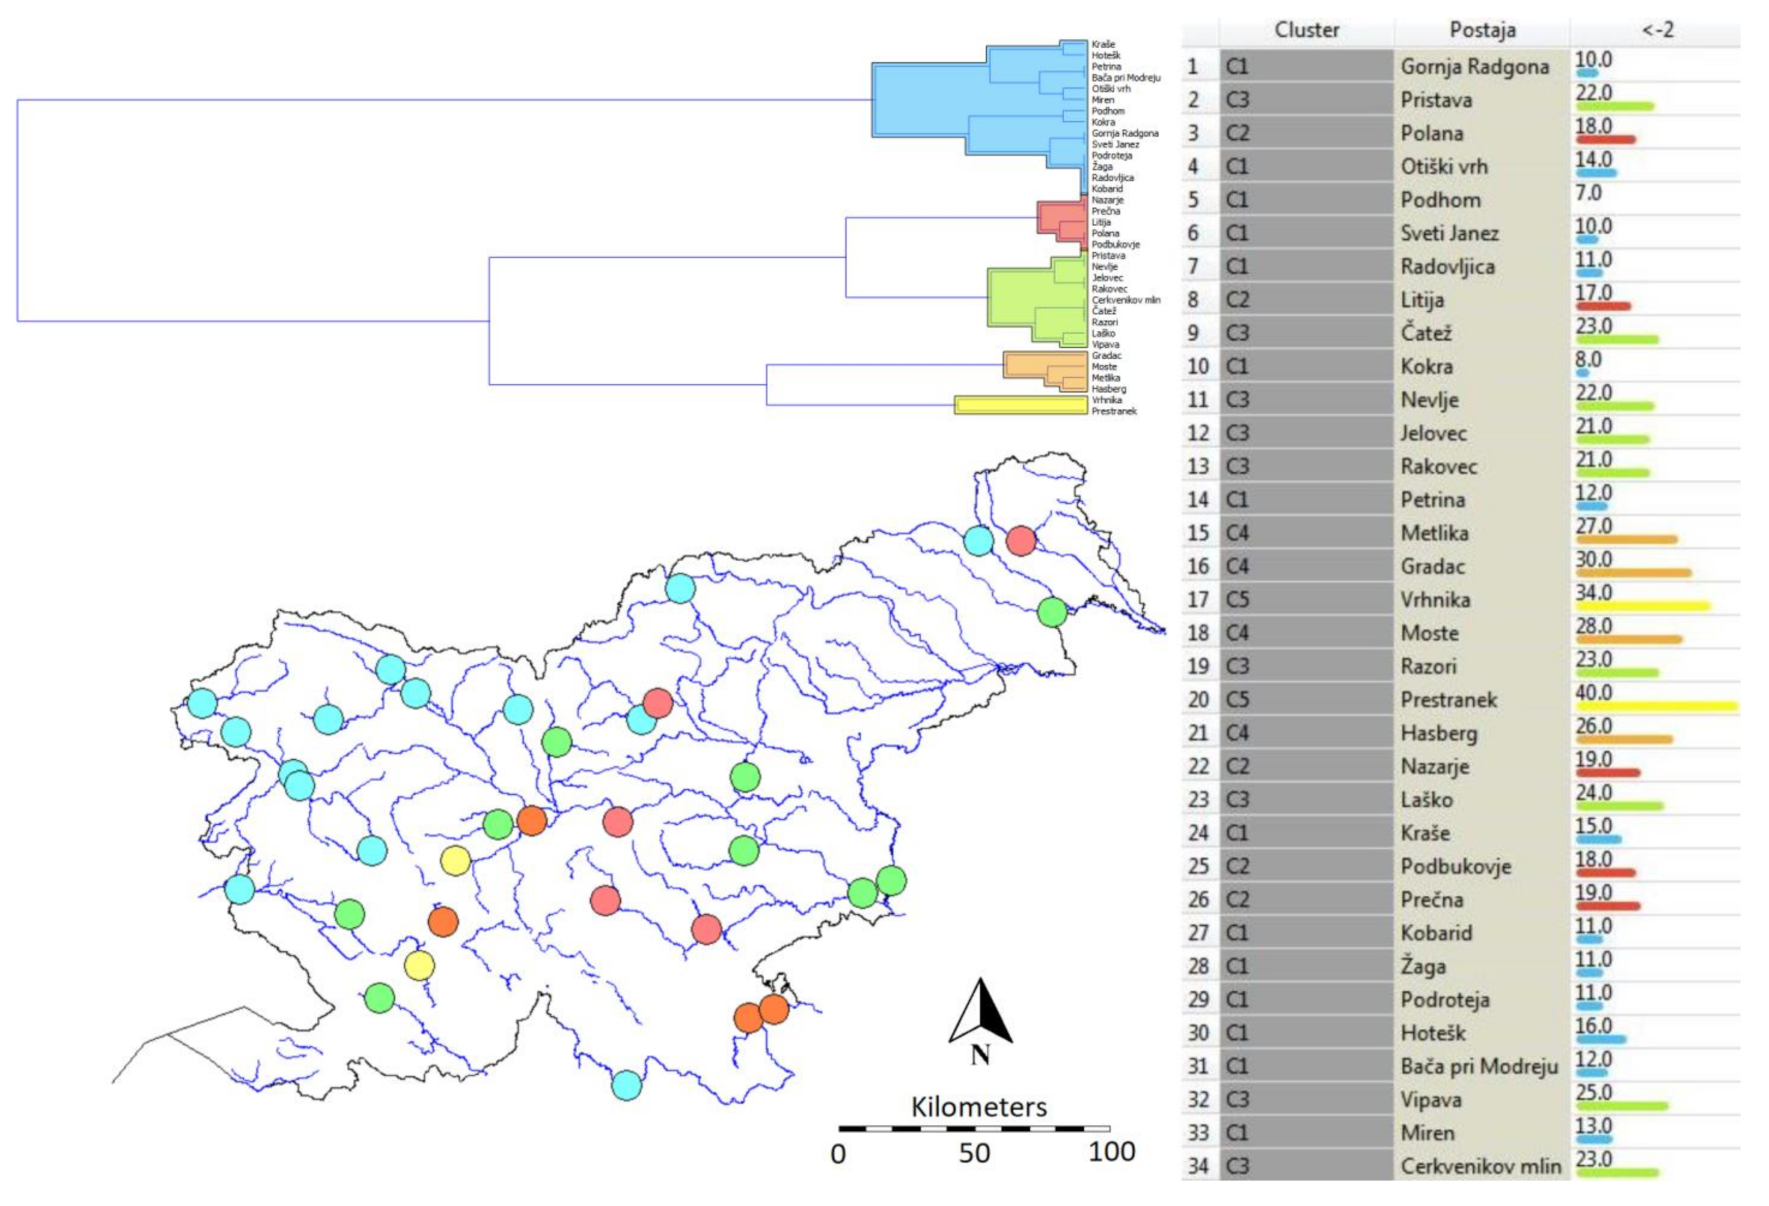
The results of the hierarchical clustering using a 6-month time scale show that at all the considered gauging stations at least 7 extreme drought events occurred, with the most, as many as 40, recorded at the Prestranek station (5800). In addition to the Prestranek station, the Vrhnika station (5030) was also included in group C5 (yellow) with 34 extreme drought events (Figure 7). Both stations are located in the southwestern part of the country. The stations located in the southeastern part of Slovenia were mainly assigned to group C3 (green colour) with 21 to 25 extreme drought events. On the other hand, group C1 (blue colour), which consisted of stations with 7 to 16 extreme events, covering mainly the northwestern part of Slovenia (Figure 7). The other two groups (C2 and C4) covered mainly the central and eastern parts of the country.
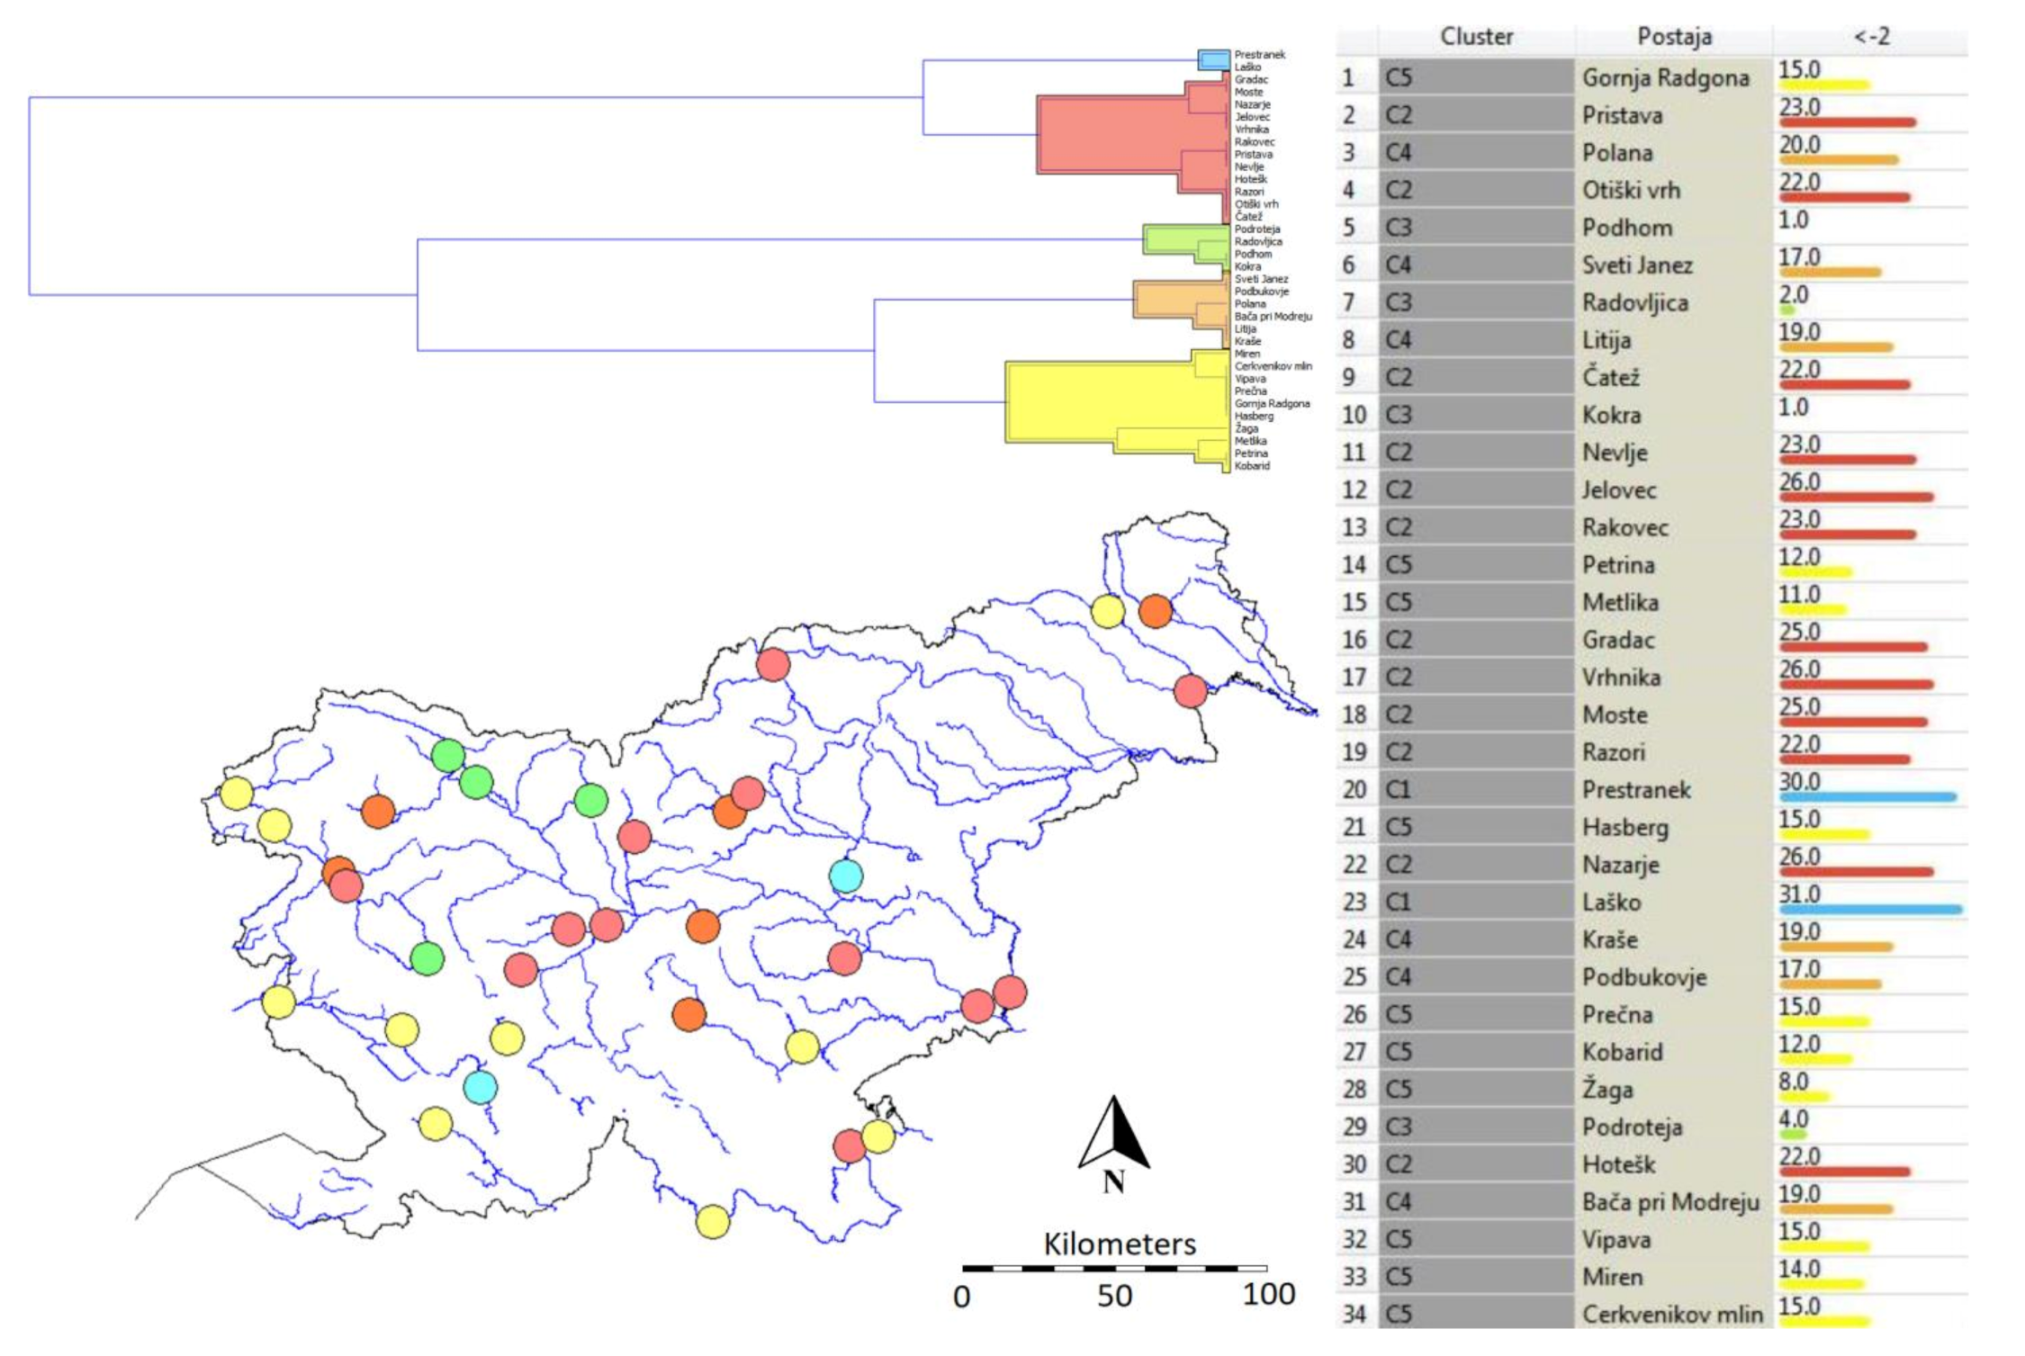
If we extend the time scale to 12 months, the results of the hierarchical clustering showed that the gauging stations with the lowest number of extreme drought events (1 to 4) belonged to group C3 (green) and were located mainly in the northwest of Slovenia (Figure 8). Furthermore, gauging stations with 8 to 15 extreme drought events belonged to group C5 (yellow) and were mainly located in the southwestern part of Slovenia, with the exception of gauging station Gornja Radgona I (1060). The gauging stations assigned to other three groups (C1, C2, and C4) were unevenly distributed across the country.
4. Conclusions
This study provided a comprehensive analysis of the spatial and temporal characteristics of hydrological drought in Slovenia during the period 1961–2016. Monthly discharge data series from 46 gauging stations were used to calculate the SSI values at five different time scales. The methods used in the study followed the standard procedures applied for the characterization of hydrological drought in various similar studies.
The results of the calculated SSI values indicated that the frequency and intensity of droughts in Slovenia increased in recent decades at most of the analysed gauging stations. This was observed at all considered time scales. Spring and summer periods were identified as critical in terms of water deficit during the considered period.
Despite the fact that the amount of precipitation in Slovenia decreases from west to east, the results of the SSI values at all considered time scales and their spatial distribution showed a different picture. SSI values varied quite independently from the location of the gauging station; however, they differed depending on the selected time scale. Thus, it appears that drought events do not occur evenly, confirming that drought is a regional phenomenon even in a small country such as Slovenia. Therefore, the results confirmed the findings of some other researchers, i.e., that it is important that an appropriate time scale (accumulation period) is chosen to capture the characteristics of a drought typical for certain hydrological/meteorological conditions (e.g., [10,27,40]). Nevertheless, the same was confirmed also by the results of the hierarchical clustering of the number of extreme droughts, as the application of various time scales resulted in a different distribution of gauging stations by individual groups.
For the first time, SSI methodology was used to investigate hydrological drought in Slovenia. The results of the presented analyses demonstrated that SSI values provided useful information in terms of drought investigation, monitoring, and further planning of the appropriate measures related to water management. However, one should keep in mind that the SSI values only indicate the degree of drought intensity at a location but not the actual amounts of water. Based on the results of the study, our proposal would be to integrate the SSI values into drought monitoring tools for Southeastern Europe [41] or at the European level [42], similar to the SPI.
Author Contributions
Conceptualization, methodology, and supervision, M.Š. and M.K.; software, formal analysis, and investigation, L.Z.; visualization, L.Z. and M.Š.; writing—original draft, M.Š.; writing—review and editing, M.K. and L.Z. All authors have read and agreed to the published version of the manuscript.
Funding
This research was partially funded by the Slovenian Research Agency (ARRS), grant number P2-0180 (Water Science and Technology, and Geotechnical Engineering: Tools and Methods for Process Analyses and Simulations, and Development of Technologies) and the Slovenian national committee of the IHP UNESCO research programme (UNESCO IHP C3330-20-456010).
Data Availability Statement
Publicly available datasets were analyzed in this study. This data can be found here: http://vode.arso.gov.si/hidarhiv/.
Acknowledgments
The authors would like to acknowledge the Slovenian Environment Agency (ARSO) for making the data publicly available.
Conflicts of Interest
The authors declare no conflict of interest.
References
- Van Loon, A.F. Hydrological drought explained. WIREs Water 2015, 2, 359–392. [Google Scholar] [CrossRef]
- Stahl, K.; Hisdal, H.; Tallaksen, L.; Lanen, H.A.J.; Hannaford, J.; Sauquet, E. Trends in Low Flows and Streamflow Droughts across Europe; UNESCO: Paris, France, 2008. [Google Scholar]
- Hasan, H.H.; Razali, S.F.M.; Muhammad, N.S.; Ahmad, A. Research trends of hydrological drought: A systematic review. Water 2019, 11, 2252. [Google Scholar] [CrossRef] [Green Version]
- Wilhite, D.A.; Glantz, M.H. Understanding the drought phenomenon: The role of definitions. Water Int. 1985, 10, 111–120. [Google Scholar] [CrossRef] [Green Version]
- Bazza, M. Water Resources Planning and Management for Drought Mitigation Mohamed. In Proceedings of the Regional Workshop on Capacity Building on Drought Mitigation in the Near East; Food and Agriculture Organization of the United Nations, Regional Office for the Near East: Rabbat, Morocco, 2002. [Google Scholar]
- Zamani, S.; Gobin, A.; Van de Vyver, H.; Gerlo, J. Atmospheric drought in Belgium—Statistical analysis of precipitation deficit. Int. J. Climatol. 2016, 36, 3056–3071. [Google Scholar] [CrossRef] [Green Version]
- Crausbay, S.D.; Ramirez, A.R.; Carter, S.L.; Cross, M.S.; Hall, K.R.; Bathke, D.J.; Betancourt, J.L.; Colt, S.; Cravens, A.E.; Dalton, M.S.; et al. Defining ecological drought for the twenty-first century. Bull. Am. Meteorol. Soc. 2017, 98, 2543–2550. [Google Scholar] [CrossRef]
- Lloyd-Hughes, B. The impracticality of a universal drought definition. Theor. Appl. Climatol. 2014, 117, 607–611. [Google Scholar] [CrossRef] [Green Version]
- Van Lanen, H.A.J.; Wanders, N.; Tallaksen, L.M.; Van Loon, A.F. Hydrological drought across the world: Impact of climate and physical catchment structure. Hydrol. Earth Syst. Sci. 2013, 17, 1715–1732. [Google Scholar] [CrossRef] [Green Version]
- Barker, L.J.; Hannaford, J.; Chiverton, A.; Svensson, C. From meteorological to hydrological drought using standardised indicators. Hydrol. Earth Syst. Sci. Discuss. 2015, 12, 12827–12875. [Google Scholar] [CrossRef] [Green Version]
- Ghaderpour, E.; Vujadinovic, T.; Hassan, Q.K. Application of the Least-Squares Wavelet software in hydrology: Athabasca River Basin. J. Hydrol. Reg. Stud. 2021, 36, 100847. [Google Scholar] [CrossRef]
- Tallaksen, L.M.; Hisdal, H.; Lanen, H.A.J.V. Space-time modelling of catchment scale drought characteristics. J. Hydrol. 2009, 375, 363–372. [Google Scholar] [CrossRef]
- Awotwi, A.; Annor, T.; Anornu, G.K.; Quaye-Ballard, J.A.; Agyekum, J.; Ampadu, B.; Nti, I.K.; Gyampo, M.A.; Boakye, E. Climate change impact on streamflow in a tropical basin of Ghana, West Africa. J. Hydrol. Reg. Stud. 2021, 34, 100805. [Google Scholar] [CrossRef]
- Booij, M.J.; Schipper, T.C.; Marhaento, H. Attributing changes in streamflow to land use and climate change for 472 catchments in australia and the United States. Water 2019, 11, 1059. [Google Scholar] [CrossRef] [Green Version]
- Telesca, L.; Lovallo, M.; Lopez-Moreno, I.; Vicente-Serrano, S. Investigation of scaling properties in monthly streamflow and Standardized Streamflow Index (SSI) time series in the Ebro basin (Spain). Phys. A Stat. Mech. Its Appl. 2012, 391, 1662–1678. [Google Scholar] [CrossRef]
- Lorenzo-Lacruz, J.; Moŕan-Tejeda, E.; Vicente-Serrano, S.M.; Ĺopez-Moreno, J.I. Streamflow droughts in the Iberian Peninsula between 1945 and 2005: Spatial and temporal patterns. Hydrol. Earth Syst. Sci. 2013, 17, 119–134. [Google Scholar] [CrossRef] [Green Version]
- Vicente-Serrano, S.; Peña-Gallardo, M.; Hannaford, J.; Lorenzo-Lacruz, J.; Svoboda, M.; Quiring, S.; Dominguez-Castro, F.; Maneta, M.; Tomas-Burguera, M.; El Kenawy, A. Complex spatial and temporal influences of climatic drought time-scales on hydrological droughts in natural basins of US. In Proceedings of the International Electronic Conference on Hydrological Cycle (CHyCle-2017), Online, 12–16 November 2017; pp. 1–6. [Google Scholar]
- Wu, J.; Chen, X.; Yao, H.; Gao, L.; Chen, Y.; Liu, M. Non-linear relationship of hydrological drought responding to meteorological drought and impact of a large reservoir. J. Hydrol. 2017, 551, 495–507. [Google Scholar] [CrossRef]
- Shukla, S.; Wood, A.W. Use of a standardized runoff index for characterizing hydrologic drought. Geophys. Res. Lett. 2008, 35, 1–7. [Google Scholar] [CrossRef] [Green Version]
- Lai, C.; Zhong, R.; Wang, Z.; Wu, X.; Chen, X.; Wang, P.; Lian, Y. Monitoring hydrological drought using long-term satellite-based precipitation data. Sci. Total Environ. 2019, 649, 1198–1208. [Google Scholar] [CrossRef]
- Wang, Y.; Duan, L.; Liu, T.; Li, J.; Feng, P. A Non-stationary Standardized Streamflow Index for hydrological drought using climate and human-induced indices as covariates. Sci. Total Environ. 2020, 699, 134278. [Google Scholar] [CrossRef]
- World Meteorological Organization and Global Water Partnership. Handbook of Drought Indicators and Indices; World Meteorological Organization and Global Water Partnership: Geneva, Switzerland, 2016; ISBN 9781351967525. [Google Scholar]
- Sušnik, A.; Gregorič, G.; Uhan, J.; Kobold, M.; Andjelov, M.; Petan, S.; Pavlič, U.; Valher, A. Drought variability in Slovenia and analysis of drought in 2013. In Proceedings of the 24. Mišičev Vodarski dan 2013; Vodnogospodarski biro: Maribor, Slovenia, 2013; pp. 102–109. [Google Scholar]
- Cunja, J.; Kobold, M.; Šraj, M. Analysis of runoff deficit using the treshold method for the case of three gauging stations in Slovenia. Acta Hydrotech. 2020, 33, 113–127. [Google Scholar] [CrossRef]
- ARSO. Ocena Tveganja za Sušo; ARSO MOP: Ljubljana, Slovenia, 2017. (In Slovenian) [Google Scholar]
- Guttman, N.B. Accepting the Standardized Precipitation Index: A calculation algorithm. JAWRA J. Am. Water Resour. Assoc. 1999, 35, 311–322. [Google Scholar] [CrossRef]
- Šebenik, U.; Brilly, M.; Šraj, M. Drought Analysis Using the Standardized Precipitation Index (SPI). Acta Geogr. Slov. 2017, 57, 31–49. [Google Scholar] [CrossRef] [Green Version]
- Mckee, B.T.; Doesken, J.N.; Kleist, J. The relationship of drought frequency and duration to time scales. In Proceedings of the Eight Conference on Applied Climatology, Anaheim, CA, USA, 17–22 January 1993; pp. 1–6. [Google Scholar]
- Lloyd-Hughes, B.; Saunders, M.A. A drought climatology for Europe. Int. J. Climatol. 2002, 22, 1571–1592. [Google Scholar] [CrossRef]
- Zabret, K.; Rakovec, J.; Šraj, M. Influence of meteorological variables on rainfall partitioning for deciduous and coniferous tree species in urban area. J. Hydrol. 2018, 558, 29–41. [Google Scholar] [CrossRef]
- Zaki, M.J.; Meira, M.J. Data Mining and Analysis: Fundamental Concepts and Algorithms; Cambridge University Press: New York, NY, USA, 2013; ISBN 9780521766333. [Google Scholar]
- Demšar, J.; Curk, T.; Erjavec, A.; Gorup, Č.; Hočevar, T.; Milutinovič, M.; Možina, M.; Polajnar, M.; Toplak, M.; Starič, A.; et al. Orange: Data Mining Toolbox in Python. J. Mach. Learn. Res. 2013, 14, 2349–2353. [Google Scholar]
- R Core Team. R: A Language and Environment for Statistical Computing 2021; R Foundation for Statistical Computing: Vienna, Austria, 2021; Available online: http://www.R-project (accessed on 7 May 2021).
- SAGA. System for Automated Geoscientific Analyses; University of Hamburg, Institute of Geography: Hamburg, Germany, 2007; Available online: http://www.saga-gis.org/ (accessed on 17 March 2019).
- Cunja, J.; Kobold, M.; Šraj, M. Temporal and spatial analysis of the largest hydrological droughts in Slovenia. Ujma 2019, 33, 95–103. [Google Scholar]
- Sušnik, A. Dinamika primanjkljaja vode za kmetijske rastline včeraj, danes in jutri. In Proceedings of the Mišičev Vodarski dan 2003; Vodnogospodarski Biro: Maribor, Slovenia, 2003; pp. 84–91. [Google Scholar]
- ARSO. Ranljivost Slovenskega Kmetijstva in Gozdarstva na Podnebno Spremenljivost in Ocena Predvidenega Vpliva; ARSO MOP: Ljubljana, Slovenia, 2003. (In Slovenian) [Google Scholar]
- Jelovčan, M.; Šraj, M. Analysis of groundwater levels in piezometers in the Vipava Valley. Acta Hydrotech. 2020, 33, 61–78. [Google Scholar] [CrossRef]
- Sapač, K.; Rusjan, S.; Šraj, M. Assessment of consistency of low-flow indices of a hydrogeologically non-homogeneous catchment: A case study of the Ljubljanica river catchment, Slovenia. J. Hydrol. 2020, 583, 124621. [Google Scholar] [CrossRef]
- Vicente-Serrano, S.M.; López-Moreno, J.I. Hydrological response to different time scales of climatological drought: An evaluation of the Standardized Precipitation Index in a mountainous Mediterranean basin. Hydrol. Earth Syst. Sci. 2005, 9, 523–533. [Google Scholar] [CrossRef] [Green Version]
- DMCSEE. Drought Management Centre for Southeastern Europe. 2007. Available online: http://www.dmcsee.org/en/drought_monitor/ (accessed on 3 November 2021).
- EDO. European Drought Observatory. 2021. Available online: https://edo.jrc.ec.europa.eu/edov2/php/index.php?id=1000 (accessed on 3 November 2021).
Figure 1.
Location of the considered gauging stations on the map of Slovenia.

Figure 2.
Example of the SSI results at various time scales for the gauging station Polana I (1220).
Figure 2.
Example of the SSI results at various time scales for the gauging station Polana I (1220).

Figure 3.
Spatial presentation of SSI-1 values for a wet year 1965.

Figure 4.
Spatial presentation of SSI-1 values for a dry year 2003.

Figure 5.
Seasonality of SSI results at various time scales (1, 3, 6, 12, and 24 months) for a dry year 2003.
Figure 5.
Seasonality of SSI results at various time scales (1, 3, 6, 12, and 24 months) for a dry year 2003.

Figure 6.
Hierarchical clustering of the number of extreme droughts using the one month time scale (SSI-1 < −2) and spatial presentation of the results on the map of Slovenia. Groups are indicated by colours: C1 (blue), C2 (red), C3 (green), C4 (orange), and C5 (yellow).
Figure 6.
Hierarchical clustering of the number of extreme droughts using the one month time scale (SSI-1 < −2) and spatial presentation of the results on the map of Slovenia. Groups are indicated by colours: C1 (blue), C2 (red), C3 (green), C4 (orange), and C5 (yellow).

Figure 7.
Hierarchical clustering of the number of extreme droughts using the six month time scale (SSI-6 < −2) and spatial presentation of the results on the map of Slovenia. Groups are indicated by colours: C1 (blue), C2 (red), C3 (green), C4 (orange), and C5 (yellow).
Figure 7.
Hierarchical clustering of the number of extreme droughts using the six month time scale (SSI-6 < −2) and spatial presentation of the results on the map of Slovenia. Groups are indicated by colours: C1 (blue), C2 (red), C3 (green), C4 (orange), and C5 (yellow).

Figure 8.
Hierarchical clustering of the number of extreme droughts using the 12 month time scale (SSI-12 < −2) and spatial presentation of the results on the map of Slovenia. Groups are indicated by colours: C1 (blue), C2 (red), C3 (green), C4 (orange), and C5 (yellow).
Figure 8.
Hierarchical clustering of the number of extreme droughts using the 12 month time scale (SSI-12 < −2) and spatial presentation of the results on the map of Slovenia. Groups are indicated by colours: C1 (blue), C2 (red), C3 (green), C4 (orange), and C5 (yellow).


Table 1.
Main characteristics of the considered gauging stations.
| Station Code | Gauging Station | River | Station Elevation [m a.s.l.] | Catchment Area [km2] |
|---|---|---|---|---|
| 1060 | Gornja Radgona I | Mura | 202.34 | 10,197.2 |
| 1070 | Petanjci | Mura | 193.65 | 10,391.4 |
| 1140 | Pristava I | Ščavnica | 169.37 | 272.8 |
| 1220 | Polana I | Ledava | 191.35 | 209.4 |
| 1260 | Čentiba | Ledava | 154.31 | 861.7 |
| 2250 | Otiški Vrh I | Meža | 334.00 | 552.6 |
| 2652 | Videm | Dravinja | 209.04 | 767.3 |
| 2900 | Zamušani I | Pesnica | 201.85 | 479.8 |
| 3180 | Podhom | Radovna | 566.07 | 166.8 |
| 3200 | Sveti Janez | Sava Bohinjka | 525.04 | 94.4 |
| 3400 | Mlino I | Jezernica | 467.57 | 8.6 |
| 3420 | Radovljica I | Sava | 408.18 | 908.0 |
| 3660 | Litija | Sava | 230.55 | 4849.7 |
| 3850 | Čatež I | Sava | 736.70 | 10232.4 |
| 4120 | Kokra I | Kokra | 18.01 | 113.1 |
| 4200 | Suha I | Sora | 7.98 | 568.9 |
| 4480 | Nevlje I | Nevljica | 1.20 | 82.2 |
| 4695 | Jelovec | Mirna | 208.49 | 271.2 |
| 4750 | Rakovec | Sotla | 140.12 | 561.3 |
| 4820 | Petrina | Kolpa | 219.31 | 467.3 |
| 4860 | Metlika | Kolpa | 126.96 | 1966.3 |
| 4969 | Gradac I | Lahinja | 133.46 | 218.9 |
| 5030 | Vrhnika | Ljubljanica | 285.93 | 1135.1 |
| 5078 | Moste I | Ljubljanica | 281.32 | 1778.0 |
| 5240 | Verd I | Ljubija | 286.28 | karst |
| 5540 | Razori | Šujica | 298.37 | 46.9 |
| 5800 | Prestranek | Pivka | 519.75 | karst |
| 5880 | Hasberg | Unica | 444.88 | karst |
| 6060 | Nazarje | Savinja | 337.03 | 457.1 |
| 6200 | Laško I | Savinja | 215.07 | 1668.2 |
| 6240 | Kraše | Dreta | 365.55 | 100.8 |
| 6691 | Črnolica I | Voglajna | 263.27 | 54.7 |
| 7029 | Podbukovje I | Krka | 258.49 | 346.9 |
| 7160 | Podbočje | Krka | 146.27 | 2253.0 |
| 7340 | Prečna | Prečna | 163.82 | 295.2 |
| 8080 | Kobarid I | Soča | 194.94 | 437.1 |
| 8180 | Solkan I | Soča | 53.77 | 1580.4 |
| 8242 | Kal-Koritnica I | Koritnica | 404.7 | 86.0 |
| 8270 | Žaga | Učja | 341.56 | 50.2 |
| 8350 | Podroteja I | Idrijca | 327.05 | 111.3 |
| 8450 | Hotešk | Idrijca | 160.86 | 443.5 |
| 8500 | Bača pri Modreju | Bača | 164.04 | 143.1 |
| 8561 | Vipava II | Vipava | 96.09 | 131.9 |
| 8601 | Miren I | Vipava | 35.93 | 588.3 |
| 9050 | Cerkvenikov mlin | Reka | 342.70 | 332.1 |
| 9210 | Kubed II | Rižana | 61.16 | 204.7 |
Table 2.
Drought classification according to SPI/SSI method [29].
Table 2.
Drought classification according to SPI/SSI method [29].
| SPI/SSI Value | Category |
|---|---|
| 2.00 or more | Extremely wet |
| 1.50 to 1.99 | Severely wet |
| 1.00 to 1.49 | Moderately wet |
| 0.00 to 0.99 | Mildly wet |
| 0.00 to −0.99 | Mild drought |
| −1.00 to −1.49 | Moderate drought |
| −1.50 to −1.99 | Severe drought |
| −2.00 or less | Extreme drought |
Table 3.
The total number of severe and extreme drought events at the considered gauging stations.
| Station Code | Gauging Station | SSI-1 | SSI-6 | SSI-12 | |||
|---|---|---|---|---|---|---|---|
| SSI < −1.5 | SSI < −2 | SSI < −1.5 | SSI < −2 | SSI < −1.5 | SSI < −2 | ||
| 1060 | Gornja Radgona I | 19 | 3 | 42 | 10 | 47 | 15 |
| 1140 | Pristava I | 7 | 0 | 50 | 22 | 44 | 23 |
| 1220 | Polana I | 12 | 1 | 43 | 18 | 46 | 20 |
| 2250 | Otiški Vrh I | 23 | 1 | 41 | 14 | 46 | 22 |
| 3180 | Podhom | 15 | 1 | 25 | 7 | 29 | 1 |
| 3200 | Sveti Janez | 25 | 5 | 30 | 10 | 44 | 17 |
| 3420 | Radovljica I | 29 | 5 | 32 | 11 | 48 | 2 |
| 3660 | Litija | 31 | 11 | 48 | 17 | 48 | 19 |
| 3850 | Čatež I | 35 | 10 | 52 | 23 | 51 | 22 |
| 4120 | Kokra I | 19 | 4 | 20 | 8 | 25 | 1 |
| 4480 | Nevlje I | 26 | 7 | 46 | 22 | 36 | 23 |
| 4695 | Jelovec | 21 | 2 | 59 | 21 | 49 | 26 |
| 4750 | Rakovec | 16 | 0 | 53 | 21 | 52 | 23 |
| 4820 | Petrina | 31 | 6 | 39 | 12 | 20 | 12 |
| 4860 | Metlika | 35 | 14 | 56 | 27 | 47 | 11 |
| 4969 | Gradac I | 34 | 11 | 61 | 30 | 64 | 25 |
| 5030 | Vrhnika | 45 | 22 | 54 | 34 | 50 | 26 |
| 5078 | Moste I | 41 | 11 | 52 | 28 | 51 | 25 |
| 5540 | Razori | 31 | 4 | 59 | 23 | 55 | 22 |
| 5800 | Prestranek | 0 | 0 | 67 | 40 | 56 | 30 |
| 5880 | Hasberg | 43 | 8 | 59 | 26 | 49 | 15 |
| 6060 | Nazarje | 31 | 9 | 39 | 19 | 48 | 26 |
| 6200 | Laško I | 29 | 5 | 56 | 24 | 51 | 31 |
| 6240 | Kraše | 22 | 2 | 34 | 15 | 40 | 19 |
| 7029 | Podbukovje I | 15 | 1 | 58 | 18 | 53 | 17 |
| 7340 | Prečna | 23 | 0 | 48 | 19 | 62 | 15 |
| 8080 | Kobarid I | 27 | 7 | 33 | 11 | 37 | 12 |
| 8270 | Žaga | 31 | 4 | 35 | 11 | 39 | 8 |
| 8350 | Podroteja I | 20 | 7 | 41 | 11 | 39 | 4 |
| 8450 | Hotešk | 20 | 6 | 39 | 16 | 61 | 22 |
| 8500 | Bača pri Modreju | 28 | 7 | 41 | 12 | 50 | 19 |
| 8561 | Vipava II | 42 | 12 | 50 | 25 | 60 | 15 |
| 8601 | Miren I | 26 | 1 | 35 | 13 | 30 | 14 |
| 9050 | Cerkvenikov mlin | 25 | 6 | 59 | 23 | 45 | 15 |
Publisher’s Note: MDPI stays neutral with regard to jurisdictional claims in published maps and institutional affiliations. |
© 2021 by the authors. Licensee MDPI, Basel, Switzerland. This article is an open access article distributed under the terms and conditions of the Creative Commons Attribution (CC BY) license (https://creativecommons.org/licenses/by/4.0/).
Share and Cite
MDPI and ACS Style
Zalokar, L.; Kobold, M.; Šraj, M. Investigation of Spatial and Temporal Variability of Hydrological Drought in Slovenia Using the Standardised Streamflow Index (SSI). Water 2021, 13, 3197. https://doi.org/10.3390/w13223197
AMA Style
Zalokar L, Kobold M, Šraj M. Investigation of Spatial and Temporal Variability of Hydrological Drought in Slovenia Using the Standardised Streamflow Index (SSI). Water. 2021; 13(22):3197. https://doi.org/10.3390/w13223197
Chicago/Turabian StyleZalokar, Lenka, Mira Kobold, and Mojca Šraj. 2021. "Investigation of Spatial and Temporal Variability of Hydrological Drought in Slovenia Using the Standardised Streamflow Index (SSI)" Water 13, no. 22: 3197. https://doi.org/10.3390/w13223197
Note that from the first issue of 2016, this journal uses article numbers instead of page numbers. See further details here.