Article

Multi-Indices Assessment of Origin and Controlling Factors of Trace Metals in River Sediments from a Semi-Arid Carbonated Basin (the Sebou Basin, Morocco)

1
Laboratoire Ecologie Fonctionnelle et Environnement, Université de Toulouse, CNRS, 31326 Castanet Tolosan, France
2
Laboratoire Ressources Naturelles et Développement Durable, Faculty of Science, Ibn Tofail University, Kenitra 14000, Morocco
*
Authors to whom correspondence should be addressed.
Water 2021, 13(22), 3203; https://doi.org/10.3390/w13223203
Submission received: 19 July 2021 / Revised: 22 October 2021 / Accepted: 4 November 2021 / Published: 12 November 2021
(This article belongs to the Special Issue Water and the Ecosphere in the Anthropocene)

Abstract

:
River water quality is particularly of concern in semi-arid countries with limited water resources. Increasing anthropogenic activities can lead to the accumulation of trace metals (TM) in bottom sediments, which is a specific storage compartment. The present study aimed to investigate the geochemistry of trace metals (As, Cd, Co, Cr, Cu, Ni, Pb, Zn) and of some physico-chemical parameters in bottom sediments from the Sebou basin, which represents 1/3 of the surface water resources of Morocco. The order of abundance of the metals was Zn > Cr > Cu > Ni > Pb > Co > As > Cd. A major fingerprint of weathering on metal concentration, and point and non-point anthropogenic sources were highlighted. The origin and intensity of the contamination were determined using a combination of geochemical indicators. The contamination was on the whole moderate, with Cr, Zn, Cu, and Pb as the most enriched metals, especially at the A1, S3, and S4 stations located downstream of Fez city, well known for its intensive industrial and tannery activities. A multi-variate analysis evidenced the strong link between natural elements such as Co with clays and Fe oxides, and As with Ca, whereas Cd, Cu, Cr, Ni, Pb, Zn, partly originating from anthropogenic activities (industrial and domestic waste, agricultural inputs), were linked to phosphorus, oxides, carbonates, and/or POC, indicating their anthropic source and/or control by sediment compounds. Cadmium, Pb, and Cu were the most available metals. Finally, in addition to Cd, Pb and Zn were identified as hazardous metals in sediments as evidenced by the positive relationship between the proportion of the labile fraction and the enrichment factor revealing anthropogenic inputs.

1. Introduction

In riverine systems, trace metals (TM) have been a matter of concern in recent decades because of the environmental risk presented by increasing anthropogenic activities (mining, agricultural, industrial, domestic, artisanal) [1]. TM also originate from natural sources (alteration of primary or secondary minerals, volcanic eruption, atmospheric deposits) [2,3]. Several major processes (weathering, erosion, runoff, riverine transport, sedimentation) and the physicochemical properties of the elements influence the inflow and behaviour of TM. The input of contaminants such as TM to rivers may affect benthic species and human health because of their toxicity, persistence, and capacity to accumulate throughout the food chain [4]. This effect may be more significant when the effluents are discharged without any pre-treatment [5]. While some metals are essential for life at high concentrations (Co, Cr, Cu, Fe, Mn, Mo, Ni, Zn), they can be toxic for benthic ecosystems as well as for humans [1]. Other metals (Pb, Cd) have no known biological interest.
Bottom sediments are an important component of the river system and result from river transport and sedimentation. They are mainly composed of particles of variable sizes, from endogenous or exogenous origins [6] and comprise heterogeneous physico-chemical compartments (iron and manganese oxides, organic matter, clays, carbonates, and a residual mineral faction) [7]. They act as a sink for pollutants, have a great TM retention capacity [8,9], and are able to accumulate and/or release various elements (of natural and/or anthropogenic origin) into the water [10]. Thus, one of the best ways to assess the state of accumulation of TM and of the persistence of contamination in rivers is to investigate the bottom sediments [6,11,12].
The analysis of the total concentrations of TM in sediments is necessary to assess the whole sediment quality. However, it is not enough to evaluate the contamination status, mobility, and bioavailability of TM [13] since the behaviour of TM in sediments depends on various biogeochemical processes [14]. Changes in river physico-chemical conditions, such as redox potential, dissolved oxygen, or pH, may affect the release of TM into the aquatic ecosystem and their bioavailability [15]. It therefore remains challenging to assess (i) the sources of anthropogenic inputs and the intensity of TM contamination in river sediments, and (ii) the potential availability of these contaminants, which may endanger living organisms [6], since they are assumed to be bound to non-residual fractions [12,16].
Semi-arid basins are characterized by long dry low-water periods. Such intermittent rivers are today a matter of particular concern since they represent half of the global river network and they are complex socio-ecological systems [17]. They undergo erratic flow regimes through alternate dry and wet periods with intense flood events, making them highly sensitive to contaminants such as trace metals [16], particularly with increasing anthropogenic pressure and changes in climate conditions [18,19].
The Sebou basin in Morocco is representative of such conditions. It is one of the most populated regions (5.6 million inhabitants) in Morocco and harbours one of the largest hydrographic networks. It represents 33 and 20% of the surface and groundwater resources of the country, respectively [20]. The rapid development of artisanal and industrial activities, population growth, and the modernization and intensification of agriculture have decreased the quality of the Sebou River [21]. Today, it is considered as one of the most polluted rivers in Morocco [22]. Several studies have been carried out to identify trace metal contamination in the Sebou basin, but most of them focused on the biological and physico-chemical study of water and sediments in the Fez sub-basin [15,23,24,25,26]. None have investigated the whole basin status and taken into consideration the availability of these contaminants at this scale and in various hydrological conditions.
The present study aimed to determine, at the scale of the fluvial part of the Sebou basin and during seasonal conditions: (i) the level of TM concentration in the river bottom sediments, (ii) the natural vs. anthropogenic origins of TM and the contamination intensity, (iii) the mobility and availability of TMs and the environmental risk, and finally, (iv) the controlling factors of trace metals.
For that purpose, we used a set of geochemical indicators to constrain the main hypotheses. We postulated that the various anthropogenic activities in the Sebou basin led to metal contamination of the river sediments and that the seasonal and hydrological conditions influenced sediment quality.

2. Materials and Methods

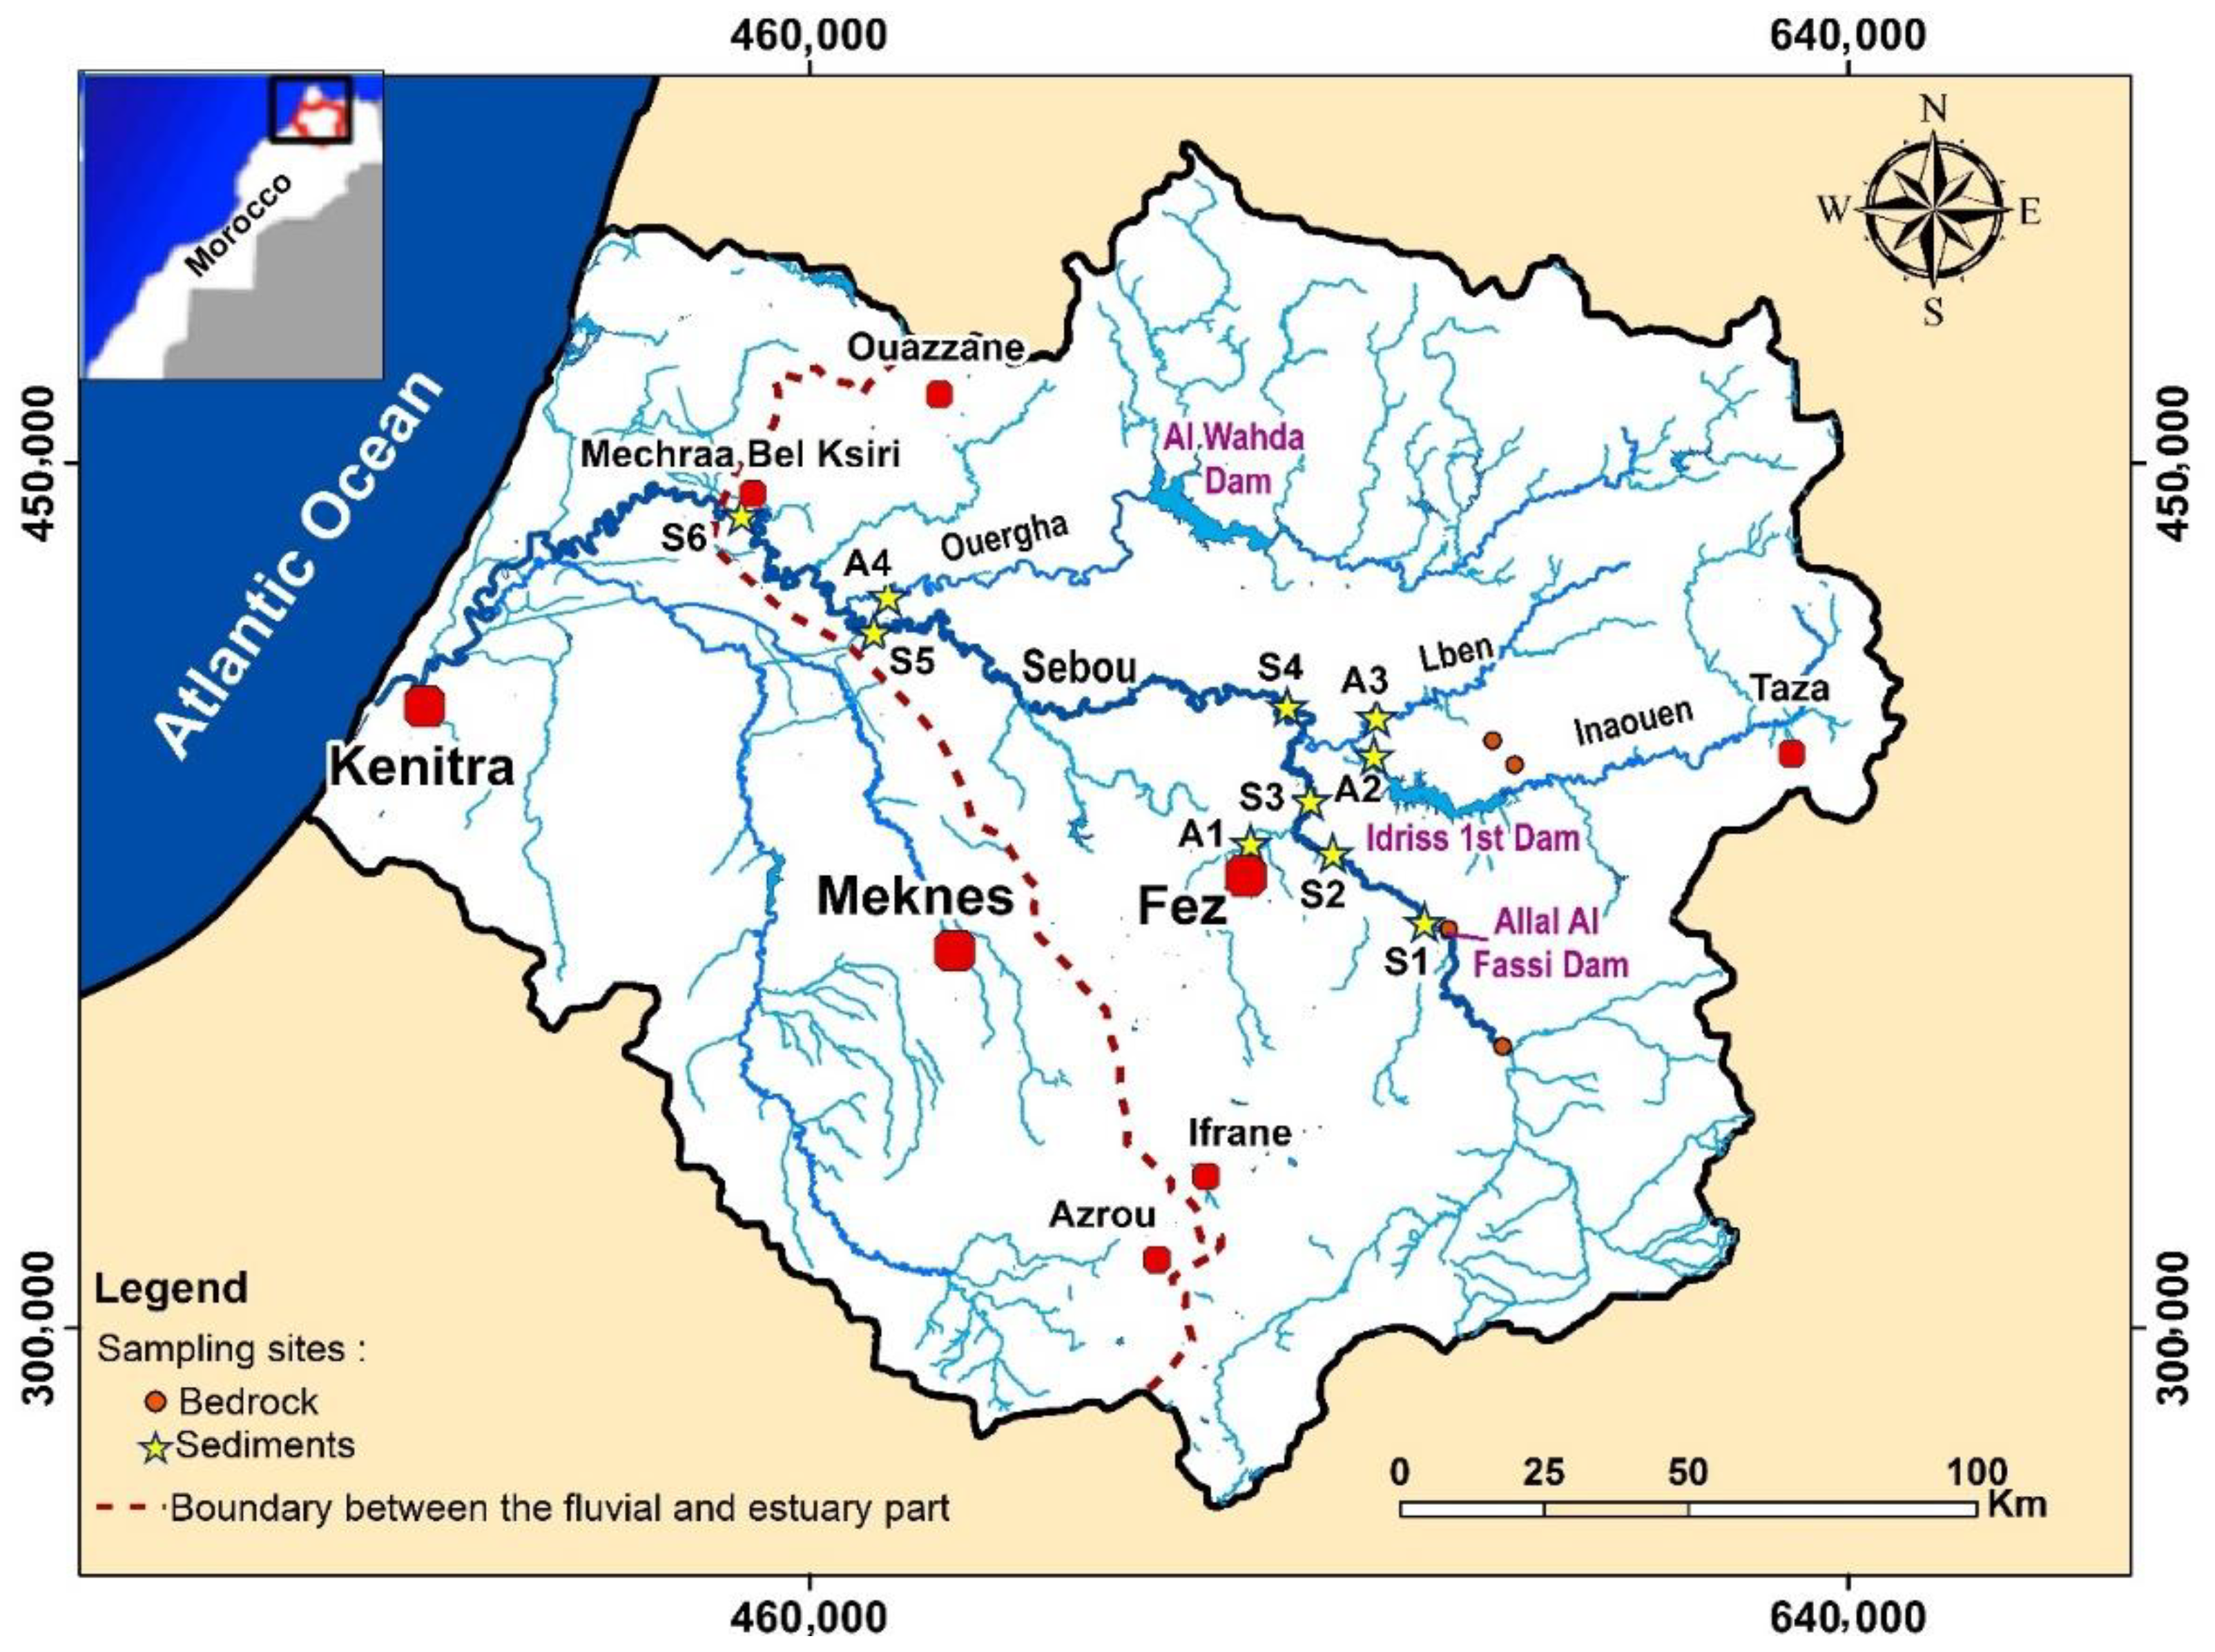
2.1. Description of the Sampling Area

The Sebou basin, located in northwest Morocco between 4° and 7° West and 33° and 35° North, occupies a surface of 40,000 km2 (i.e., 6% of the Moroccan territory). The Sebou River flows over 500 km from its source in the Middle Atlas (Guigou River) to the Atlantic Ocean. This basin represents one-third of the surface water and twenty percent of the groundwater resources of the country. The fluvial part studied here extends over an area of 26,200 km2 from the Upper Sebou basin to the city of Mechraa Bel Ksiri (outlet Station S6, Figure 1).
Three geomorphological units can be distinguished [27] (Figure S1): the Upper, Middle, and Lower Sebou basin. The Upper Sebou rises in the middle Atlas to more than 2800 m and lies on permeable Jurassic limestone and dolomite bedrock. The Middle Sebou is located in the Pre-Rif and Rif mountains, where the altitude reaches 2000 m a.s.l. It is characterized by very steep slopes and erodible soils developed on flysch, sandstone, shale, and marl [28]. The lower Sebou is constituted by impermeable Permo-Triassic and primary formations covered by silty-clay alluvium. The soils are quite diverse with calco-magnesimorph soils in the middle Atlas, poorly evolved soils in the Rif, and deep, hydromorphic, and tirsified soils in the valleys [29].
The weathering products of the soils and bedrocks, i.e., the sediments of the Sebou river, are mainly composed of quartz (33–35%), calcite (28–30%), and clays (20–24%) according to the mineralogical analysis performed on the total fraction [29]. In the finest fraction (<2 µm) of the Sebou sediments, five main clay minerals have been identified ([29], Table S1): mixed-layer clays 10–14 and smectites (28–73%), illites (14–45%), chlorites (5–23%), and kaolinites (5–21%).
The climate is of Mediterranean type with oceanic influence, characterized by two distinct seasons: a wet season (October–April) and a dry season (May–September). The average rainfall and temperature vary between 600 to 1000 mm and 10 to 20 °C, respectively. These climate variations are related to the altitude and wind influences from continental and oceanic origins.
The annual surface water inflow of the Sebou River (5600 million m3·year−1 at Mehdia city) is very irregular in space and time. The hydrological regime depends strongly on the main tributaries: Lben (108 million m3·year−1), Inaouen (547 million m3·year−1), and Ouergha (2877 million m3·year−1) [22]. The Sebou basin contains 10 large dams and 44 small dams and hill lakes (Figure 1). The largest dam is Al Wahda with a water storage capacity of 3714 million m3 [22].
The Sebou basin is also very well endowed with fertile and irrigated land (Saïs and Gharb plains). Only twenty-five percent of the basin drainage area is covered by natural vegetation (Figure S2). Forests occupy an area of 1,200,000 ha and the arable area is about 1,873,000 ha (about 20% of the national potential). The main crops grown are vegetables, cereals, beet sugar and cane for sugar production, oleaginous plants (olive, sunflower, soybean), citrus, and vines [21]. The extent of irrigated areas is estimated at 1,873,000 ha [30]. In addition to agricultural activities, the Sebou basin supports a highly developed industrial activity (Figure S2 and Table S2). The largest units are quarries (crusher-run, clay, sand, marble, gravel), sugar refineries (1845 T·year−1, 50% of national production), paper (209,000 T·year−1), oil production (80,000 T·year−1, 65% of national production), and tanneries (12,000 T·year−1, 60% of national production) [31]. All these activities have led to a degradation of the aquatic ecosystem quality. The increasing use of fertilizers and plant protection products has resulted in the contamination of groundwater by agrochemicals. Pesticide application in the fields of the Sebou basin is estimated to be around 2 kg·year−1·ha−1, i.e., more than 70 T·year−1 [30].
The cities of the basin discharge more than 80 million m3·year−1 of wastewater, with 86% discharged into watercourses [22]. The city of Fez alone generates 40% of these discharges [5] (Figure S2). Several studies have highlighted the impact of the industrial activity of this city on the quality of water and sediment [21,24,25]. The main polluting activities (Table S2) are tanneries, textile and paper industries, which generate copper, lead, nickel, and sulfides. Liquid discharges from food processing industries (oil, sugar, dairy products, etc.) cause biological inhibition in the aquatic ecosystem due to the high concentration of organic matter. During the periods of these liquid discharges, dam waters are released to dilute the pollutant load in order to improve the water quality of the Sebou River.

2.2. Sampling and Pre-Treatment of the Samples

Four spatial sampling campaigns were carried out in 2018 and 2019 during contrasted hydrological periods and seasons (March 2018: high flow and April 2019: low flow, called “spring period”; July 2018 and July 2019: low flow, called “summer period”). The discharge during these four campaigns at the outlet station (S6) was 486.5, 5.2, 50.1, and 24.1 m3·s−1, respectively). The year 2019 was drier than 2018, which explains the hydrological conditions, especially in the spring period (very low discharge with no water release from dams).
The surface sediments of the river (0–5 cm) were collected along the Sebou River (code S, S1 was taken from Allal Al Fassi dam) and its tributaries (Fez, Inaouen, Lben, and Ouergha) (code A, Figure 1). In 2018, eight stations (S1, S2, A1, A2, A3, S5, A4, and S6) were sampled and in 2019, two more stations (S3 and S4) were added. These stations were selected to survey the main watercourse of the Sebou River (from upstream to downstream) and the changes in sediment quality occurring after the confluence with the tributaries.
The sediments were sampled by hand with sterilized non-powdered gloves, from the riverbank under the running water, and then stored in polyethylene bottles. Once in the laboratory, the samples were air-dried, quartered, gently disaggregated in an agate mortar, and sieved using a nylon screen into three fractions (2000–200 μm, 200–63 μm, and ≤63 μm) according to well-described protocols [6,12]. Then, the samples were weighed and stored for the physico-chemical analyses. In addition, four major bedrock types occupying the basin were sampled in August 2020: Limestone, Calcareous Dolomite, Marl, and Evaporite (Figure 1 and Figure S1).

2.3. Physico-Chemical Treatments and Analysis

The micro-granulometry was determined on the total (≤2 mm) and the fine (≤63 μm) fractions of the sediments using a wet laser diffractometer (LA920-V2 Horiba ISO 13320) with a detection limit between 10 nm and 3.5 mm, at the Laboratoire écologie fonctionnelle et environnement (Toulouse, France).
Chemical analyses of major and trace elements were performed on the crushed bedrocks and on the fine fraction of the sediments (≤63 µm), well-known for its high affinity for trace metals [32]. A complete dissolution using the alkaline fusion method with lithium metaborate was first completed. Then, the analysis was performed on an inductively Coupled Plasma-Mass Spectrometer (ICP-MS) at the Service d’Analyse des Roches et des Minéraux (SARM, http://sarm.cnrs.fr/index.html (October 2018, November 2019, November 2020) of the Centre for Petrographic and Geochemical Research (CRPG, Nancy, France). Blanks and certified standard sediments were used following standardized and validated methods [33].
Particulate organic carbon (POC) and nitrogen content in sediments were determined using a Flash 2000 ThermoFisher analyser (Waltham, MA, USA), after decarbonation with hydrochloric acid (1 mol·L−1, HCl, 2N) on a hot plate (60 °C). This process was repeated several times until the complete disappearance of the effervescence, following a well calibrated procedure for calcareous sediments [12]. The analyses were performed at the Laboratory écologie fonctionnelle et environnement (Toulouse, France).
The available fraction of trace metals in sediments was assessed using a single chemical extraction with Ethylene Diamine Tetra Acetic Acid (EDTA-2 Na, 0.05 mol·L−1) [34,35] and for some samples, the extraction was also performed with hydrochloric acid (HCl, 0.2 mol·L−1) [35,36]. One gram of sample (fraction ≤ 63 µm) was leached by 10 mL of the chemical reagent, agitated for 60 min, centrifuged, and filtered on a 0.22 µm porosity filter. Two blanks were treated by the same process. This method has been successfully applied on similar sediments [16]. After dilution, the filtrate was analysed with a Q-inductively coupled plasma-mass spectrometer (Q-ICP-MS Agilent 7500ce, Santa Clara, CA, USA) at the Observatory Midi-Pyrénées analytical platform (OMP, Toulouse, France).

2.4. Data Treatment

2.4.1. Contamination Indices

While the assessment of the total concentration of trace metals in sediments is necessary, it does not provide sufficient information to identify the level of contamination and TM origins [37]. For that purpose, various contamination indices have been proposed. Because none of them are perfectly effective, in this study, anomalies of metal concentrations were assessed using a set of available indices.

Enrichment Factor (EF)

Many authors have used the enrichment factor as an indicator of the anthropogenic contribution of trace metal concentrations [6,38].
EF = (X/R)Sample/(X/R)Background
where (X/R)sample and (X/R)Background are the ratios between the concentrations of the trace metals and the normalizing element in the sample and in the reference material, respectively.
Various reference elements have been used to calculate the enrichment factor: Al [16,39]; Li [40]; Cs [6,41,42]; Sc [43]; Fe [37]; Th [44]; Ti [38]; Mn [45].
To select the most appropriate elements, we followed the approach developed by [42] which consists in investigating the relationship between the trace metal concerned and a set of candidate reference elements. Finally, Aluminium (Al) was selected as the normalizing element because it is a rather conservative element, a major constituent of clay minerals, and it exhibited a very significant correlation with most of the trace metals [42].
The Post Archean Australian Shales (PAAS, [46]) and the Upper Continental Crust (UCC, [47]) are the most widely used reference materials. Using these materials may lead to an EF misinterpretation, however, because of regional bedrock particularities [6,16,43,48]. In this study, the enrichment factor was first determined using the mean element concentrations of bedrocks from the Sebou basin as a reference material. In addition, other reference materials were used for comparison, such as the bedrocks from the Tafna basin (located in North-East Algeria on a similar carbonated context) [16] and the Upper Continental Crust (UCC, [47]).
According to [49], five levels of EF for trace metals can be defined: 0 to 2: deficiency to low; 2 to 5: Moderate enrichment; 5 to 20: Significant enrichment; 20 to 40: Very rich enrichment; ≥40: Extremely high enrichment.

Geo-Accumulation Index (Igeo)

The geo-accumulation index was used to assess the intensity of metal contamination [50]. It is the ratio between the concentration of the trace metal in the sediment and the concentration of the same element in the geochemical background. The coefficient 1.5 (correction factor) considered the natural fluctuations of trace metals in the geochemical background that may be caused by mineralogical effects in the sediment. The Igeo was calculated according to the following equation:
Igeon = log2(Cn/(1.5 × Bn))
where Cn is the measured concentration for the metal n, and Bn is the value of the geochemical background for the same element.
Igeo is associated with seven classes of pollution intensity [50]: Igeo ≤ 0: Unpolluted; 0–1: Unpolluted to moderately polluted; 1–2: Moderately polluted; 2–3: Moderately to strongly polluted; 3–4: Strongly polluted; 4–5: Heavily to extremely polluted; Igeo ≥ 5 Extremely polluted.

Contamination Degree (CD)

The contamination degree (CD) was used to estimate the polymetallic contamination for each sample [51]:
CD = ∑ CF
where CF is the contamination factor determined by the ratio between the concentration of the trace metals in the concerned sediment and in the local bedrock:
CF = (Sediment/BedrockSebou)trace metal
Four classes of contamination degree are distinguished [51]: CD < 6 Low contamination; 6–12: Moderate contamination; 12–24: Considerable contamination; 24 ≥ CD: Very high contamination.

Potential Ecological Risk Index (RI)

While the previous indices inform about the enrichment and contamination of trace metals in sediments, they do not take their potential toxicity effect into account. The potential ecological risk index (RI) was used as an indicator of the level of toxicity of trace metals in sediments in the aquatic ecosystem [51]:
RI = ∑Eri
Eri = CFi × Ti
where Eri: Individual potential ecological risk factor for the element i; CF i n : Contamination Factor (with CF1 to CFn calculated using Equation (4)); Ti: Toxicity index assigned to trace metals according to their relative toxicity in the environment. A weight of 1 was assigned to Zn, 2 to Cr, 5 to Cu, Ni, and Pb, 10 to As, and 30 to Cd.
Five classes of risks have been defined for Er and four classes for RI [51]: Er < 40 (low risk), 40 ≤ Er < 80 (Moderate risk), 80 ≤ Er < 160 (considerable risk), 160 ≤ Er < 320 (High potential risk) and Er ≥320 (Very high potential risk) ; RI < 150 (low risk), 150 ≤ RI < 300 (moderate risk), 300 ≤ RI < 600 (considerable risk) and RI≥ 600 (high risk)

Sediment Quality Guidelines (SQG)

In addition to the previous indices, the Canadian Sediment Quality Guidelines (SQG) can be used to assess the toxicity of trace metals in sediments [52]. Two levels were proposed by [53]: the threshold effect level (TEL) and the probable effect level (PEL). Three classes were defined to assess the biological effects of trace metal concentrations in the aquatic environment: (1) Rare (<TEL); (2) Occasional (>TEL and <PEL); (3) Frequent (>PEL).

2.4.2. Statistical Analysis

Data treatment was carried out using Excel (2010) and SPSS statistic 21 software. The ternary diagrams were plotted using Golden Software Grapher and the maps were generated using ArcMap 10.2.2.
Since the normality condition of the data was not generally satisfied, the non-parametric Spearman correlation coefficient was used to evaluate the significance of the relationships between major and trace metals in sediments. Principal component analysis (PCA) was performed using SPSS Statistic 21 software to identify the main controlling factors explaining the trace metal patterns in the Sebou basin sediments. The data used in the PCA were automatically centred and reduced by the software.

3. Results

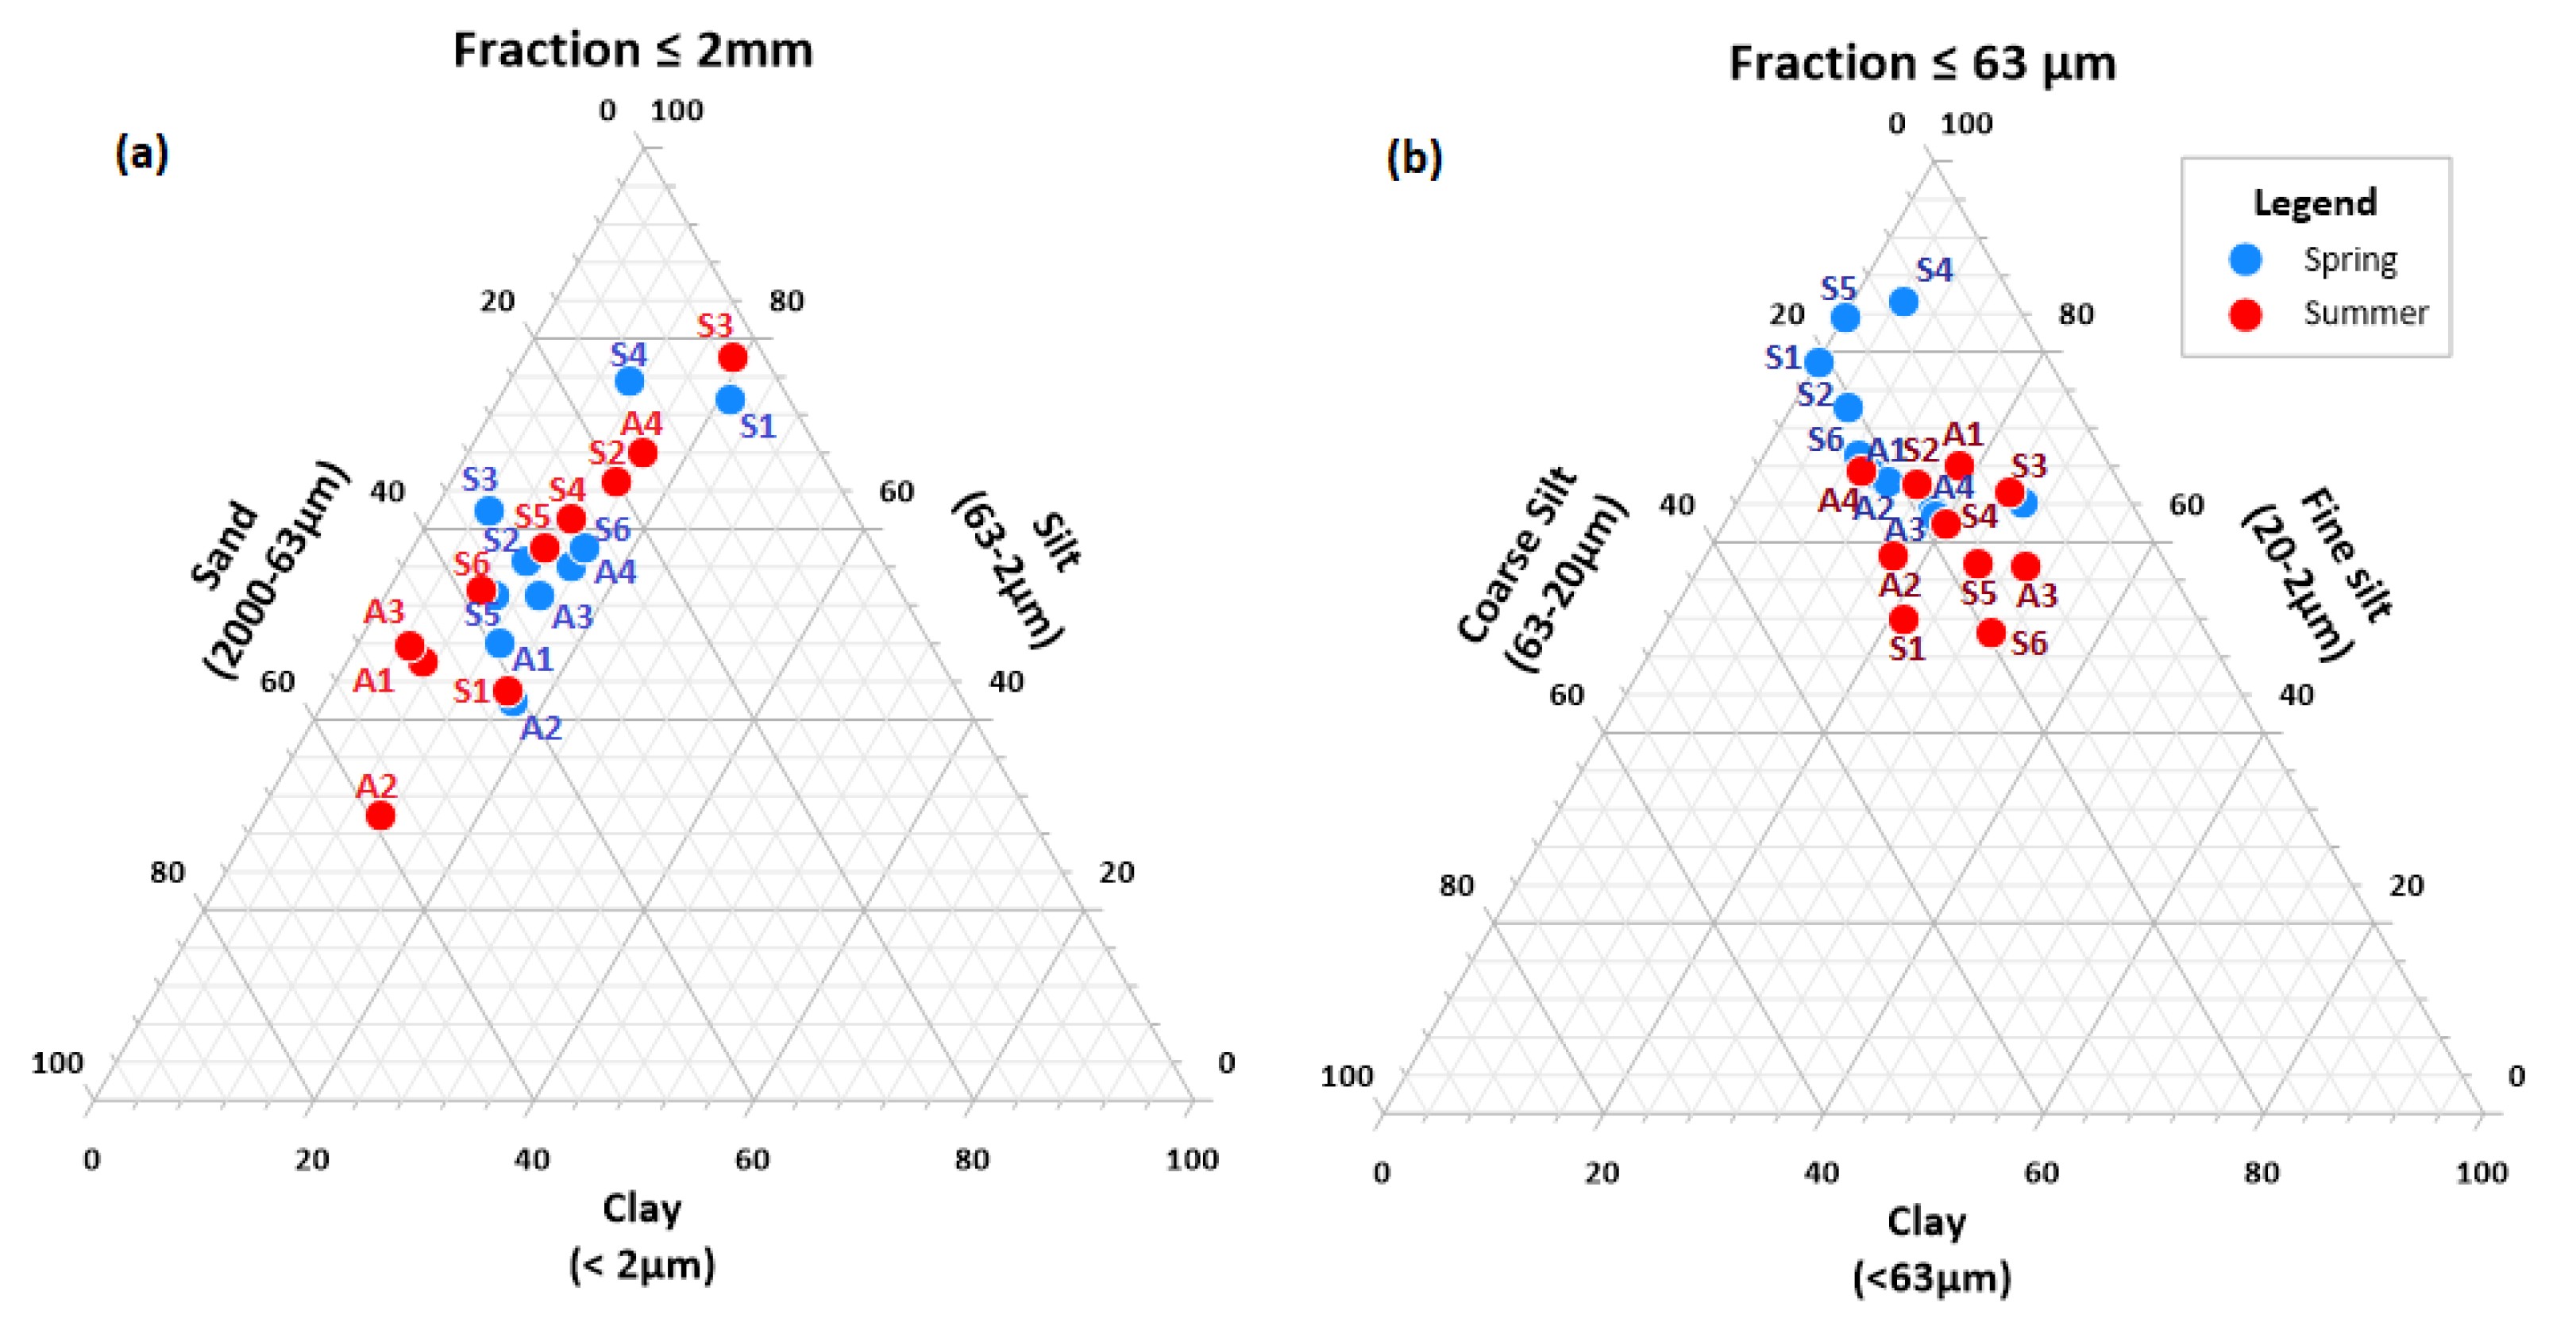
3.1. Sediment Texture and Particular Organic Carbon Content

According to Shepard’s classification [54], the sediment texture of the total fraction (≤2 mm) indicated that 41% of the samples were sandy silty, 24% clayey silty, 20% silty sandy, 9% silty, and 6% sandy (Figure S3a). The fine fraction ≤ 63 µm (silts and clays) accounted for more than 57% for 74% of samples. Station S1, which was sampled on the border of the Allal Al Fassi dam, had the highest fine fraction content, especially in the spring period. The sediments collected in the summer period were aligned from the silt to the sand end-members (Figure 2a). The dominance of the fine fraction (Silts + clays) in spring was as follows: S4 > S6 > S2 > S3 > S5, whereas in summer the sediments were coarser from upstream to downstream (S3 > S2 > S4 > S5 > S6) (Figure 2a).
The spring sediments contained more fine particles in the finest fraction (≤63 µm) compared with summer sediments, except for some samples (A1, S3, A4), which had a similar particle size distribution for the two seasons (Figure 2b). The mean proportions of coarse silt (20–63 µm), fine silt (20–2 µm), and clay (<2 µm) were 11%, 70%, and 19% in spring and 21%, 61%, and 18% in summer, respectively.
The particulate organic carbon (POC) content was rather low and varied only slightly between spring and summer conditions (0.2 to 2.5% and 0.3 to 2.3%, respectively, in average 0.88% and 0.87%, respectively). The highest POC content was for A1 (Fez tributary) and S4 (Sebou River) (Figure 1; Table 1). The C/N ratio varied between 4 and 9%, with an average of 6.4%. The stations with the highest C/N were S2 and A1 (Figure 1). This ratio determines the degree of degradation of organic matter: the lower it is, the faster the speed of organic matter mineralization.

3.2. Major and Trace Metal Concentrations in Sediments

The average concentrations of major elements and trace metals of the different campaigns for each sampling station are shown in Table 1.
Silica, Al, Fe, Ca, Mg, Na, and K oxides constituted more than 70% of the geochemical composition of the sediments. Three groups of elements were determined (SiO2, Al and Fe oxides, and base cations). The range of these classes were 30–64%, 13–28%, and 17–57% with mean values of 52%, 18%, and 30%, respectively (Figure S3b).
The order of abundance of the trace metals (for simplification As was associated to metals) was Zn > Cr > Cu > Ni > Pb > Co > As > Cd (Figure S4), which is consistent with other river carbonated sediments [16,55]. The S2 station, located upstream of the Sebou River, recorded the lowest total concentration of TE (∑TE = 207 µg·g−1), while the S3 site, located on the Sebou River (downstream of Fez city) was the most concentrated one (∑TE = 805 µg·g−1). The standard deviation indicated a higher dispersion for Zn, Cr, and Cu concentrations (Table 1).
As shown in Table 1, the highest average concentrations for Cd, Cu, Cr, Zn, and Pb were found at S3, for As at S1, for Ni at A1 and A4, and for Co at A3 and A4 stations. The high concentrations at site S4 were only observed for the sample taken during the spring period. The average concentration of As decreased progressively from upstream (S1) to downstream (S6).
The concentrations of trace metals(TM) in sediments were higher than those of the UCC [47], except for Co, and they were also higher than those observed on the nearby carbonated Tafna River (North-East Algeria, [16]), except for As and Pb. They were lower, however, than those observed in the Upper Pearl River basin (Carbonate basin, China, [55]) (Table 1) and also lower than other Moroccan rivers (Bouregreg River, Western Morocco [56]; Day River, Oum Rabia basin, Southern Morocco, [57]; Ansguemir River, North-East Morocco, [58]), except for Zn and Cr (Table 1).

3.3. Spatial and Temporal Variation of Trace Metal Concentrations

The spatial variation of TMs in the Sebou sediments was not significant, except for Zn, Cr, Cu, and Pb as indicated by their standard deviation, which revealed a higher dispersion of the concentrations. Except for Zn, whose concentration was significantly higher in spring than in summer, the trace metal content did not vary significantly between the seasons (Figure 3).
Compared with previous spatial studies carried out in the Sebou basin [29,59], the concentration of trace metals in sediments has increased, especially for Zn and Cr (Table S4). The concentration of TM at site S3 (samples taken downstream the confluence of Fez tributary with the Sebou River) increased for Zn and Cr concentrations by 1.3 and 1.4 times, respectively, while Pb, Ni, Cu, and Co decreased by 1.1 (for Cu), 1.3 (for Ni), 1.2 (for Pb) and 1,3 (for Co) times compared to data from [60].

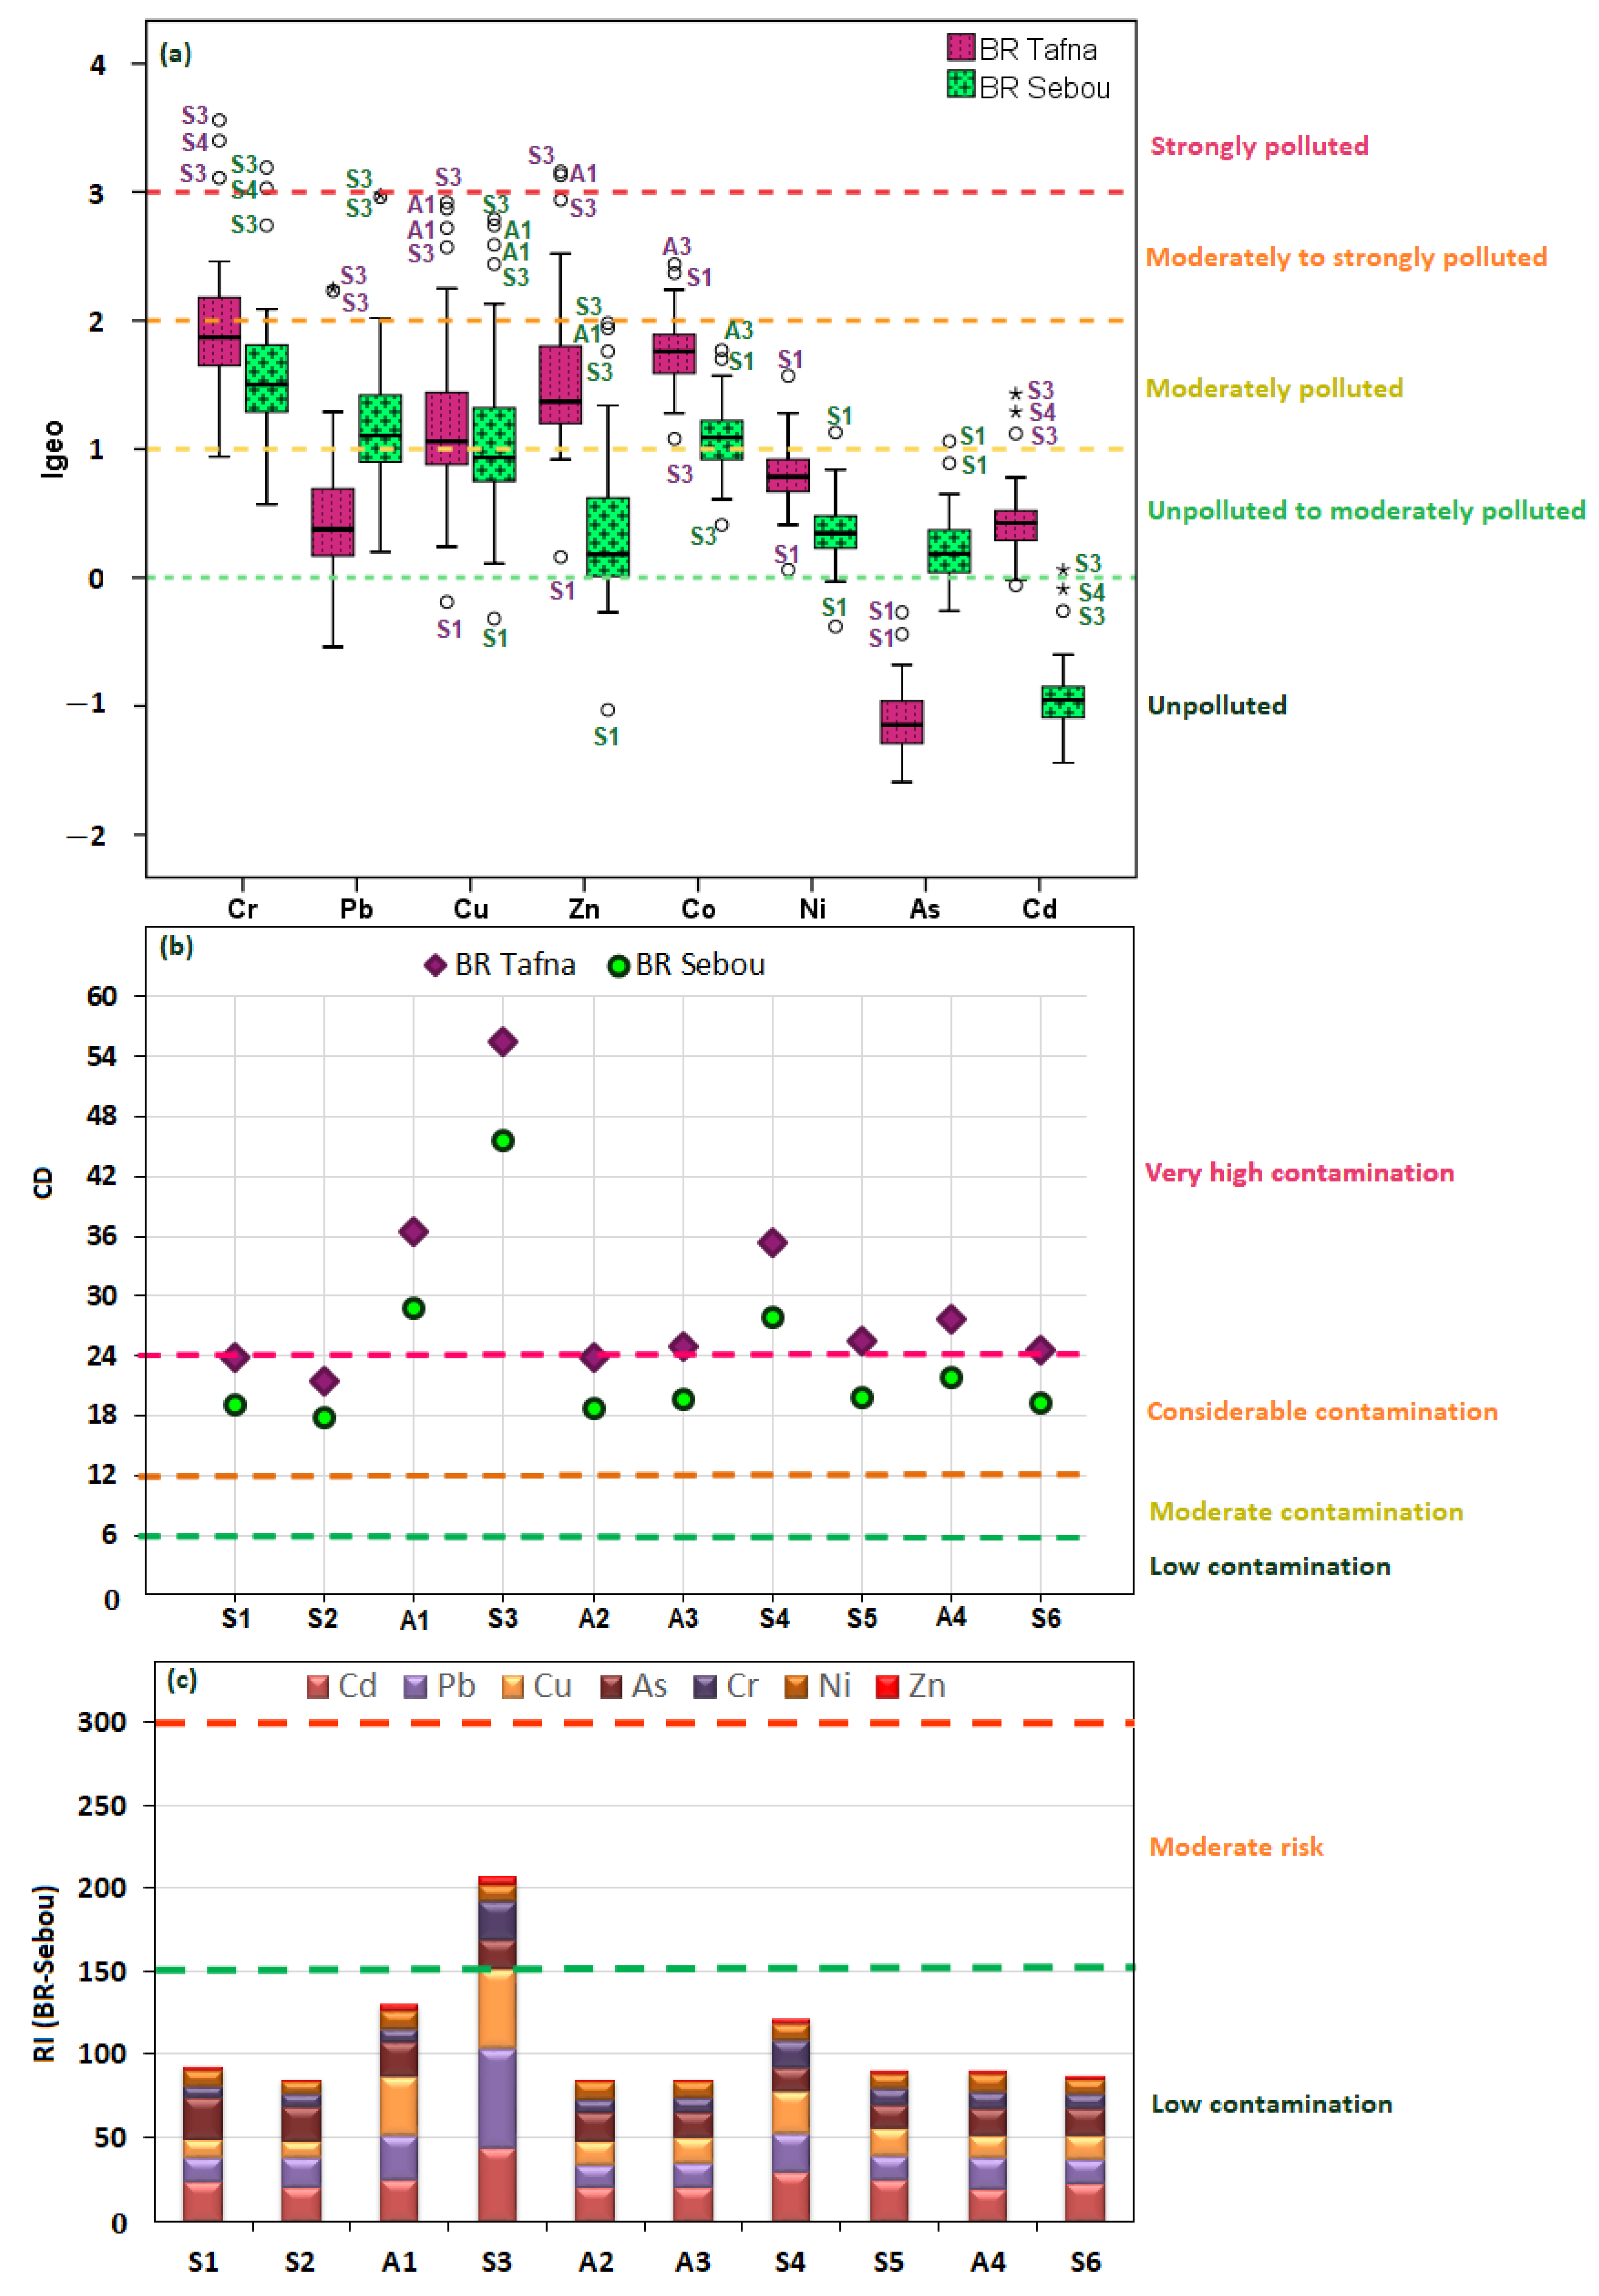
3.4. Assessment of Sediment Contamination

3.4.1. With the Enrichment Factor (EF)

The EF, using the Sebou bedrock as a normalizer (Figure 4a and Table S3), indicated sediments naturally enriched in trace elements (EF ≤ 1.5, deficiency to low), especially As, Ni, Cd, and Co. Nevertheless, this EF threshold was exceeded for some elements with maximum values at site S3 for Zn (1.6), Cr (3.7), Cu (2.8), and Pb (3.8). As shown in Figure 4b, the enrichment factor calculated with reference to the UCC indicated that the majority of the sediments were significantly enriched in TM (EF > 1.5).

3.4.2. With Other Contamination Indices

The contamination and ecological risk indices (Igeo (Equation (2)), CD (Equation (3)), and RI (Equation (5)) were calculated for the Sebou sediment using the mean local bedrock concentrations (Table S3).
The geoaccumulation index (Igeo) varied between −1.44 and 3.19. The average decreased in the following order: Cr > Pb > Cu > Co > Zn > Ni > As > Cd. Based on Muller (1981)’s classification [50], Zn, Ni, As, and Cd evidenced an unpolluted to moderate pollution (Igeo < 1). The exception was for some sites (A1, S3, S4 for Zn and S1 for As and Ni), which exhibited a moderate contamination (1 < Igeo ≤ 2) (Figure 5a). About 60% of the samples were moderately polluted (1 < Igeo ≤ 2) for Co. For Cu and Pb, 40% of samples were unpolluted to moderately polluted, and 46% moderately polluted, except at sites A1, S3, and S4, where sediments were moderately to heavily polluted (2 < Igeo ≤ 3). For Cr, 85% of samples were moderately polluted and 12% moderately to heavily polluted, especially at sites A1, S3, and S4. Higher Igeo values were observed when using the Tafna bedrock instead of the Sebou bedrock as a normalizer, except for As and Pb (Figure 5a).
The contamination degree (CD) ranged between 12 and 24 (Equation (3)) for 71% of the sediment samples, indicating a considerable contamination, while the higher values (DC ≥ 24) for 26% of samples attested a very high contamination, especially at A1, S3, and S4 sites (Figure 5b).
The TM concentrations were compared with the thresholds of the Sediment Quality Guideline [52] (Table 1). According to the classification proposed by Smith et al. (1995) [53], an occasional toxicity risk to the aquatic ecosystem (concentration between TEL and PEL) was detected for As (at S1), Pb (at S3), Ni (at all sites), Cu (at A1, S3, S4, S5), Cr (at S1, S2, A1, A2, A3, S6), and Zn (at A1, S3, S4). Cr was the only TM exhibiting a frequent toxicity risk (≥PEL) to the ecosystem at S3, S4, S5, and A4 sites (Figure 1).
In addition, the individual potential ecological risk indicator (Er) indicated a low contamination (Er < 40), except for Cd (S3 station), Cu (S3 and A1 stations), and Pb (S3 station) which exhibited a moderate ecological risk (40 < Er ≤ 80). The mean value of RI revealed also a low risk (RI < 150), except for S3 station which exhibited a moderate risk for benthic organisms (Figure 5c).

3.4.3. With Metal Fractionation

The total concentration of TMs made it possible to determine a degree of contamination and a level of toxicity and to identify the natural and anthropogenic contributions of these elements in the Sebou sediments. As information is often lacking about the (bio)availability of TM and about their complex and different distributions among various solid phases or chemical species [7], according to [61], metal fractionation in sediments can be used as a proxy to assess anthropogenic enrichment.
EDTA extractions were applied on sediments sampled in 2018 for a set of stations (S1, S2, A1, A2, A3, S5, A4, and S6), whereas HCl extraction could only be performed on some of the stations (S2, A1, S3, S4, S6) (Table 2). The average concentrations of available metals in sediments collected at each sample site are shown in Table 2. The proportion of metals in the non-residual fraction extracted with EDTA ranged from 0.03% to 49%. The order of abundance of the extracted metals was as follows: Cd > Pb > Cu > Co > Zn > Ni > As> Cr. For all samples, the available fraction of As, Cr, and Ni was very low (0% to 6%), while it ranged between 25% and 49% for Cd. Lead and Cu were significantly extracted (24% and 20%, respectively, on average), especially at Station A1. Unfortunately, sediments from Stations S3 and S4 could not be extracted with EDTA.
For comparison, the labile fraction extracted by HCl was very much lower (between 0.01 and 10%). The order of abundance of this fraction was: Cd > Zn > Ni > Co > As > Cu > Pb > Cr. As for EDTA extraction, the most labile TM was Cd, especially at Stations A1, S3, and S4. Note that despite the low extraction values, the sediments from Stations S3 and S4 exhibited the highest available fraction for Cd, Cu, Ni, and Zn.

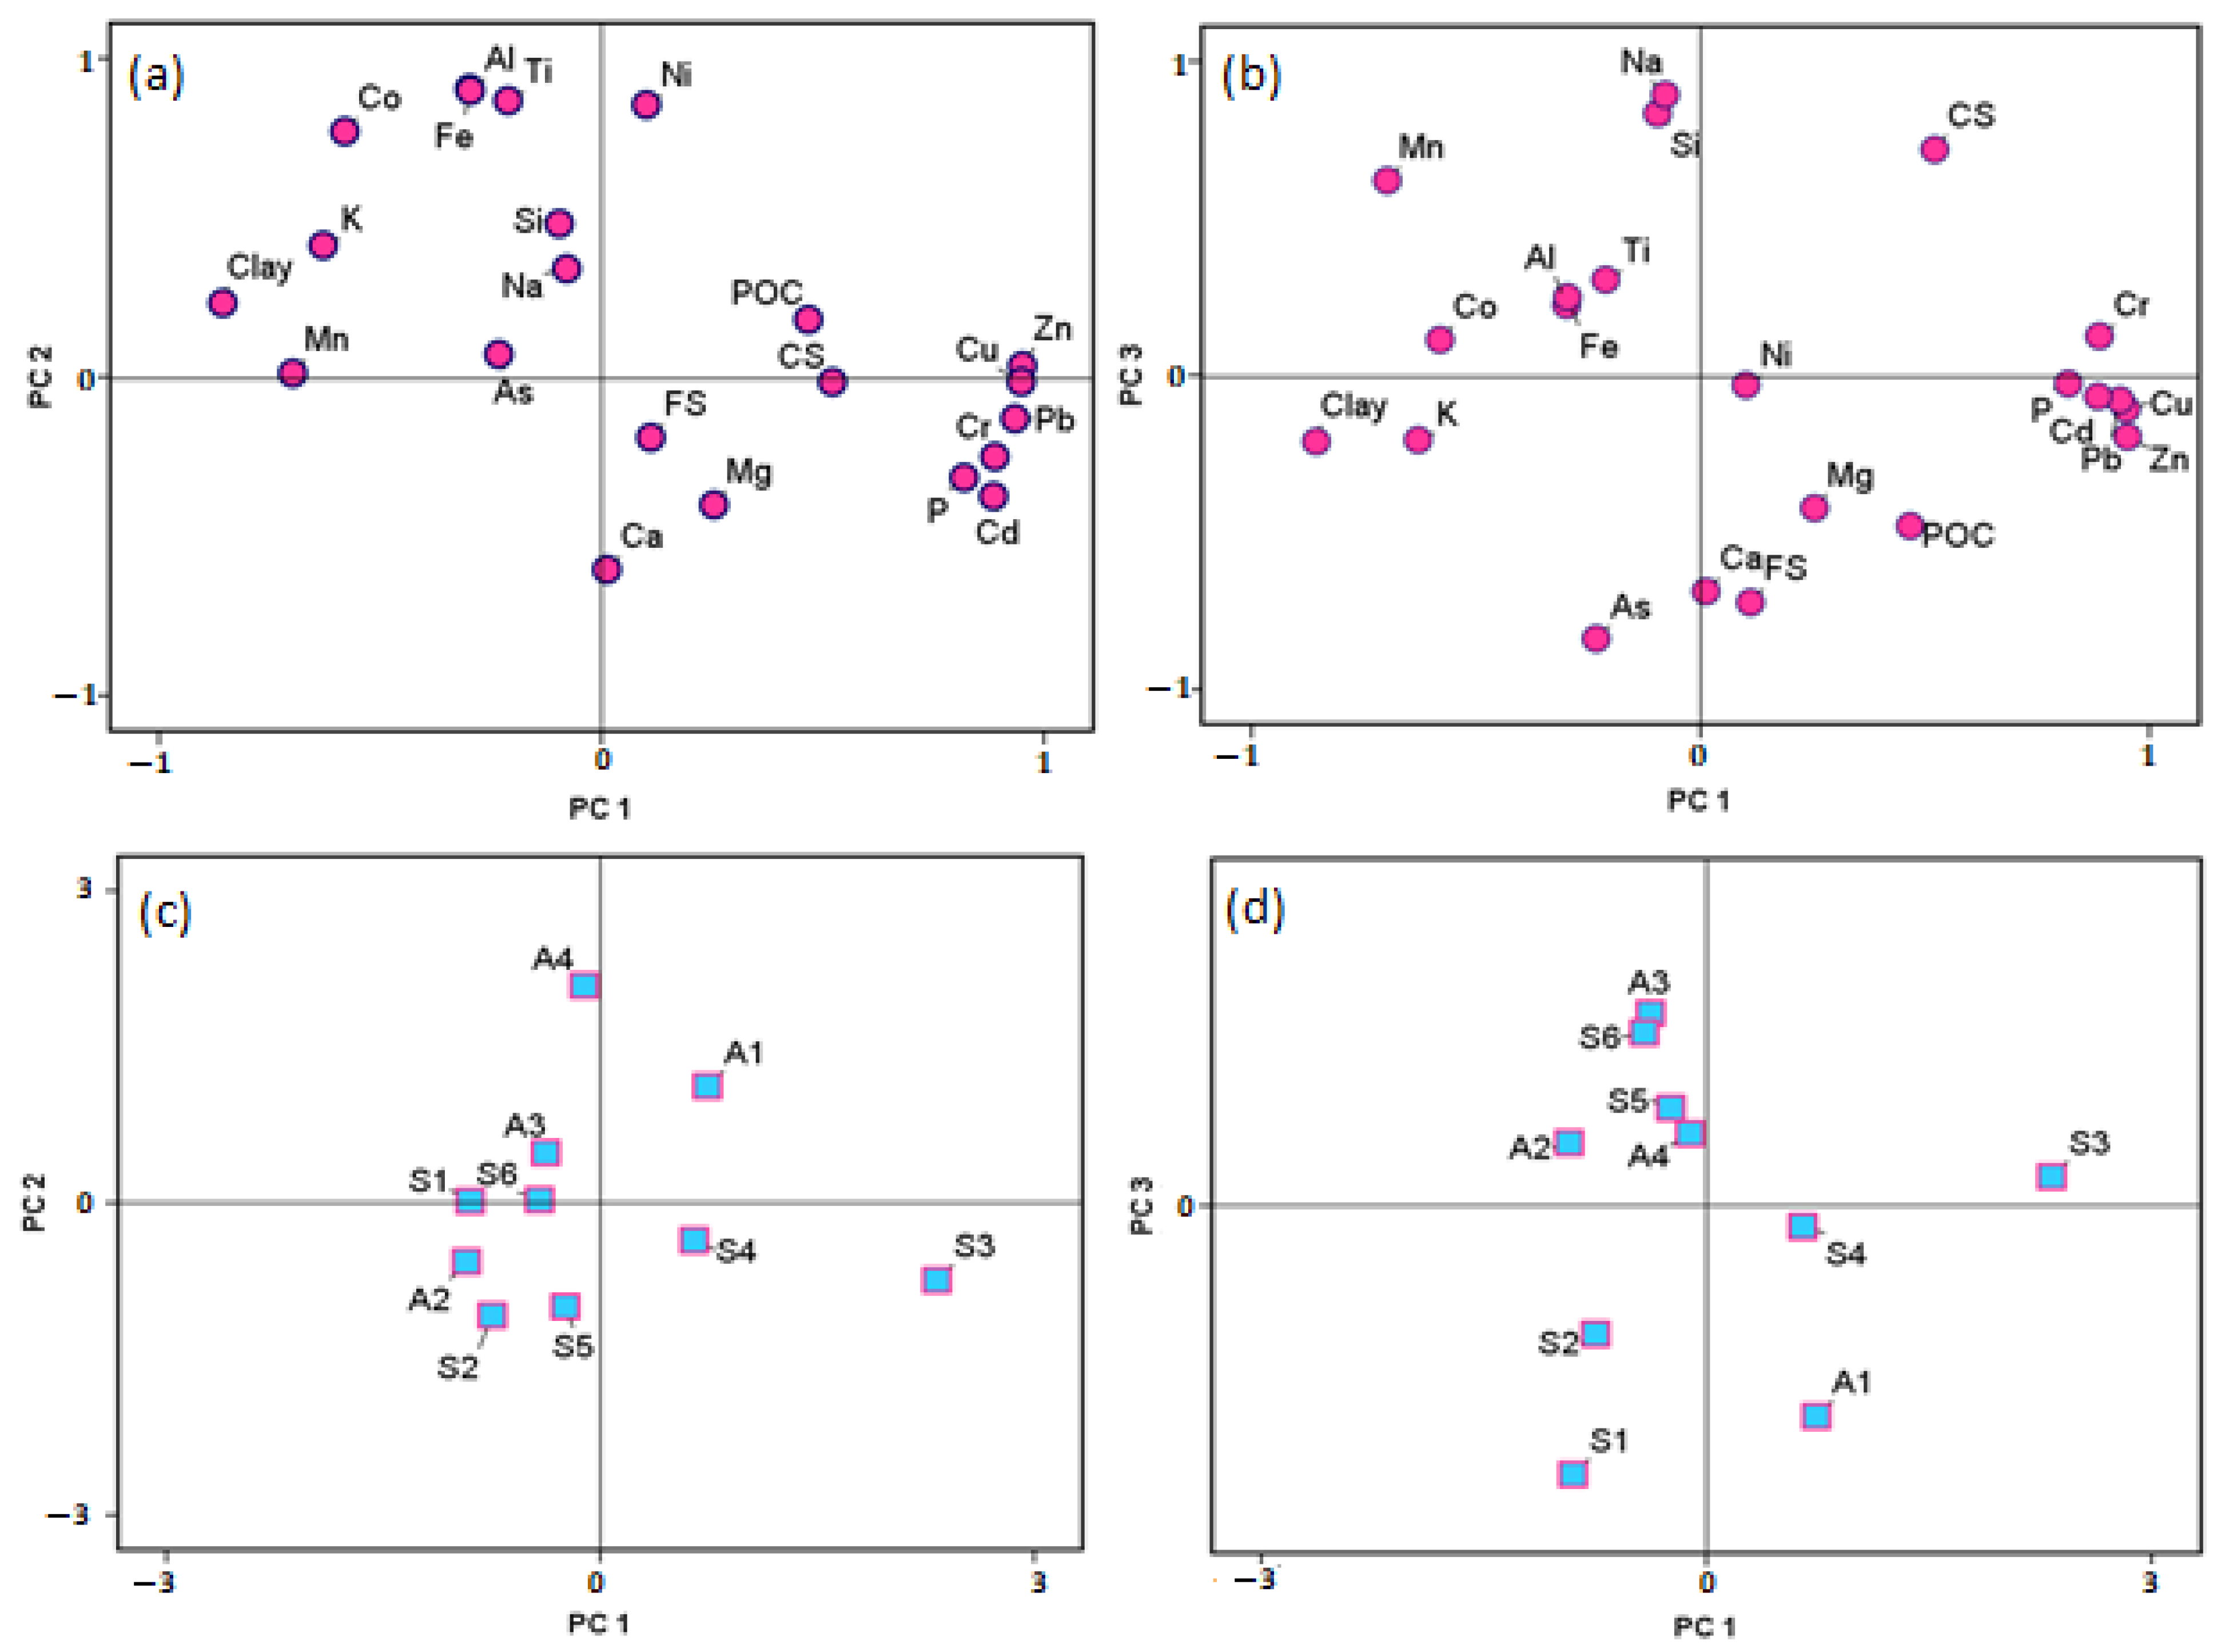
3.5. PCA and Relationships between Element Concentration and Main Parameters

The two-by-two correlation matrix between the physico-chemical variables and the metals, excluding the outliers evidenced by the geochemical indices such as EF, is shown in Table S5. The concentrations of Cu, Co, Cr, Ni, and Zn were significantly positively correlated with each other and were also significantly positively correlated with Fe, Mn, and Al (Cu was to a lesser extent linked to Fe). A positive relationship of Cd with phosphorus can be noticed, as well as between Pb and POC (Figure S5). Arsenic was negatively linked to Na and Si. It is worth mentioning that Co was linked to Clays, Ti, and K.
A PCA was performed on the whole dataset including the contaminated outlier stations to investigate and interpret jointly the different patterns of trace metals in terms of behaviour, sources (natural and anthropogenic), and controlling factors of TM in the sediments (Table 3 and Figure 6).
The first three components represented 81% of the total variance, with the first two accounting for 68.7%. Copper, Zn, Pb, Cr, and Cd were significantly positively correlated to the first axis together with Phosphorus and Coarse Silts, while Co, Mn, K, and Clays were negatively related. Axis 2 linked positively Ni, Co, Ti, Al, and Fe and negatively Ca. Arsenic and Ca were negatively linked to axis 3, unlike Na, Si, and Coarse Silts. Axis 4 represented only 7.3% of the total variance and no metals were related; it only supported Mg, POC, and Fine Silts.
Stations S3, A1, and S4 were positively linked to axis 1, while A4 was linked to axis 2 and S1 and S2 to axis 3. Only Stations S2 and A1, exhibiting the highest C/N ratio, were linked to axis 4.

4. Discussion

4.1. Origin of Trace Metals and Controlling Factors

The relative spatial homogeneity of metal concentrations among the collected sediments, whatever the season, argues for a major fingerprint of natural weathering, mainly from carbonate dissolution from upstream to downstream the Sebou River. This is consistent with previous investigations on some Sebou stations [29] and is also convergent with the indications of the contamination indices, such as the low EF values for most of the trace metals (see Section 4.2).
In addition, the correlations between trace metals and major element concentrations make it possible to constrain the origins and/or the controlling factors of the trace metals. The strong positive links between Cu, Pb, Zn, Cd, and Cr evidenced a common origin, which is consistent with the waste inputs from industrial activities in the basin mentioned in Table S2. Axis 1 on the PCA evidenced the influence of contamination as regards these metals, particularly on site S3 (Fez River), and highlighted their control by coarse silts. The anthropogenic source from domestic waste or agricultural or industrial activities (Figure S2), such as the application of phosphate fertilizers, may explain the positive relationship of Cd and Cr with phosphorus. The average low EF value observed for these metals argues for a dominant natural source from carbonate or phosphate minerals, except in some stations. Nevertheless, the anthropic Cd from phosphate fertilizers may also have precipitated with secondary carbonate phases as was observed in an agricultural carbonated context in France [62] and in the nearby Tafna basin in Algeria [16]. The positive link between Co, Mn, K, and Clays in the PCA, in contrast, suggests a natural weathering source in the basin [27] and/or the control of these elements by clays. As mentioned, illites and multi-layer illites/smectites enriched in K are the main clays, which compose the sediments of the basin (Table S1). Moreover, the association of Co and Ni with Ti, Al, and Fe suggests that these metals were associated to silicates and oxides ([12,16]; Figure S3b). The marly formations of the Rif and Prerif, drained by the Ouergha river, contribute a large quantity of a clayey cortege rich in illites and chlorites compared with the contribution of River Sebou. This is illustrated by the position of Station A4 in the PCA. Station S1, located on Allal Fassi Dam, is enriched in fine fractions and is located on limestone and dolomite bedrock, which explains its negative correlation with PC2, like A1.
Silicate minerals (such as plagioclases) are resistant and their presence in coarse silts is attested by the significant amounts of quartz and silica in the Sebou sediments [29]. This is also explained by PCA axis 3, with the positive link between Na, Si, and CS in opposition to carbonates (Ca). On this axis, arsenic is linked to carbonates since they are naturally found in carbonated sediments from sedimentary rock ([6,16]; Table S3). Arsenic can also be partially of anthropic origin from fertilizers and contribute to sediment enrichment by diffuse pollution. However, like Cd it is susceptible to be trapped by carbonate precipitation [62]. Indeed, the main limestone weathering origin is supported by the low As enrichment, evidencing weak contamination, when using the local bedrock reference rather than UCC (Figure 4 and Figure 5). The concentration of As was the highest upstream in the limestone area and its decrease downstream attests its source from limestone and a progressive dilution and/or a complexation without significant inputs.
Organic matter has often been mentioned as a controlling factor of metals in soils and river sediments [12,63]. In the Sebou sediments, while the anthropic sources of organic matter are considerable (Table S2), no significant relationship was observed between POC and trace metal concentrations (Table S5), except for Pb (r2 = 0.63, n = 32, p < 0,05, without Station S3; Figure S5), and its contribution to the PCA, when taking into account all the samples, is not significant. A similar link between Pb and organic matter was found in river sediments from the carbonated Gascogne area (SW France), even if Al-Fe oxides were also involved in Pb complexation [12].
The trace metal content did not vary significantly between the seasons except for Zn, whose concentration was significantly higher in spring than in summer (Figure 3). This means that the finest texture observed in spring has no strong influence on the metal sources or on the contamination for the majority of the metals. The higher dispersion observed for Zn, Cr, Cu, and Pb in spring is probably related to the very different discharge conditions during the two spring field campaigns.

4.2. Intensity and Location of Trace Metal Contamination

The contamination indices were used to identify the enrichment, the intensity, and the degree of contamination of the TM in the Sebou sediments.
The use of a mean local bedrock or to a lesser extent the bedrock from a nearby basin [38] has been mentioned as necessary to avoid overestimating the anthropogenic contamination. This was more recently outlined for carbonate basin conditions [9], and particularly for the Tafna basin located in northwest Algeria [16], which is characterized by a geological and lithological similarity with the Sebou basin. The similar enrichment pattern observed for metals in the Sebou sediments normalized with the respective Sebou and Tafna bedrocks, and their lesser enrichment compared with UCC for a majority of metals, retained the relevance of using a mean local bedrock as a reference.
Both Igeo and EF indices showed a low enrichment for As, Co, and Ni in the Sebou sediments, indicating a natural origin from mineral weathering (see Section 4.1). Consistently with the numerous anthropogenic activities in the Fez area, Stations A1 (Fez tributary), S3 and S4 (downstream Fez city) were identified as the most polluted sites for Pb, Zn, Cu, and especially Cr (See Figure S2 and Table S2). A similar pattern was observed for these stations with the contamination index (CD), a polymetallic indicator, which also revealed Stations A1, S3, and S4 to be the most contaminated ones. Station S3 (downstream of Fez city) was strongly linked to the contamination axis 1 in the PCA (Figure 6c). The liquid discharges from Fez city are known to be highly concentrated in some major (SO4) and trace metals (Cr, Cu, Pb) [15,20,21,23,25], due to the use of certain chemicals in the manufacturing process of artisanal and industrial products ([5]; Table S2). A very low pH (between 3.2 and 4.2) was registered from the effluents of tanneries, metal finishing facilities, and olive oil mills [5], which favoured metal dispersion downstream detected in Stations S3 and S4. Other industries mentioned in Table S2 especially at Fez, Meknes, Mechraa Bel Ksiri, and Kenitra (downstream of S6) [22] contribute to the metal contamination downstream. In addition to industrial discharges, 51% of the Sebou basin population lives in rural areas. The majority of these households do not have a sewerage network or a solid waste collection service. These wastes are collected in an uncontrolled dump and sometimes incinerated [30], which increases the risk of contaminating the water resources. The Sebou basin supports extensive agricultural activities (Figure S2). All these anthropic activities contribute to intense contamination as detected in Stations S3 and A1, or to more diffuse contamination transported downstream, such as Cd, Pb, and Zn linked to the use of phosphate fertilizers and agrochemicals [64] and also to the use of detergents found in household effluents. The metal fractionation also pointed out the highest availability for Cd, and depending on the extractant for Cu, Pb, and Zn, in Stations S3, S4, and A1.
In some places, a natural enrichment in TM (indicated by CD in March 2018 at Station S1 on the Allal Al Fassi Dam) by simple texture effect may be present since no significant anthropic inputs occurred in the upstream basin. During this period of high flow, high loads of suspended solid matter were trapped behind the dam. The abundance of the very fine fraction for this sample favoured the trapping of metals due to their high affinity [32]. Dams have been shown to be important traps of metals in sediments originating from upstream contamination [30] and can be of secondary sources with dam releases [65]. While this was not the case for Station S1, it may occur in dams as in the Inaouen or Ouergha tributaries.
Such polymetallic indices remain interesting to detect and quantify the intensity of the contamination from cumulative inputs of TMs due to anthropogenic activities. However, according to single indicators, except for Stations A1, S3, and S4, not all the sampled sediments were enriched, while the CD index indicated a significant contamination (12 ≤ CD < 24) for all the stations. This is not consistent since the concentration levels of TMs in these sites are in the range of—or even lower than—the SC Guidelines (Table 1). Our investigations highlighted that the use of such indices might thus lead to contradictory results compared to metal specific indices such as EF and Igeo.
Finally, the combined use of multi-indices was useful to consider the contamination pattern of TMs in the Sebou basin. It showed that the intensity of anthropogenic contamination in the basin was concentrated in the area of Stations A1, S3, and S4, which are heavily impacted by pollution and contamination from local industries [21,23,24,25]. Additionally, non-point contamination due to agricultural impacts is also suspected, particularly for Cd.

4.3. Availability of Trace Metal and Environmental Risk

The Sediment Quality Guidelines (SQGs) were one of the indicators used to assess the toxicological risk of each TE (Zn, Cr, Cu, Ni, Pb, As, Cd) on the Sebou benthic ecosystem. In 2014, a water treatment plant was opened downstream of the city of Fez, which helped to reduce the pollution load into the river. Nevertheless, our results (Station S3) indicate that the potential risk of toxicity remains high and that the concentrations have even increased for Cr and Zn. SQGs can sometimes lead to erroneous conclusions since they are only based on the total concentrations of TMs in the sediment [66] and do not consider the natural concentrations resulting from bedrock weathering. The potential ecological risk (RI) of polymetallic pollution indicated a low risk (RI < 150) for all stations, except Station S3 for which the RI indicated a moderate ecological risk (40 < Er <80) for Cd, Cu, and Pb, while Cr was the most concentrated and enriched TM. These differences are related to the RI calculation method for the individual elements, which takes the toxicity weight (30 for Cd, 5 for Cu and Pb, and 2 for Cr) into consideration.
The total concentration is not sufficient to evaluate the potential risk of metal availability to living organisms [16,67]. The distribution of TMs between the residual and non-residual fractions was determined using widely used simple EDTA and HCl extractions in order to extract the maximum possible fraction of trace elements more or less weakly adsorbed on organic and inorganic complexes [35,68]. HCl can extract metals from exchangeable and carbonate phases [36], whereas EDTA is able to extract metals that are more strongly linked to oxides and organic matter [69] known for their metal affinity [7]. The amount of TM extracted by EDTA was consistent with other studies, while the extracted fraction of TM using HCl was very low. This contrasted with the high TM extractions already performed on such river sediments [35,36,68] but using a different HCl concentration. According to previous studies, a concentration of 0.2 mol·L−1 or 0.5 mol·L−1 HCl extraction gives similar results to those with 0.05 mol·L−1 of EDTA extraction [35,68], except on estuarine and marine samples for which 0.2 mol·L−1 of HCl extracted a low quantity of trace elements [35]. Some authors [70] suggested that under these conditions, 1 mol·L−1 HCl may be suitable for extracting the non-residual fraction, while other studies [71] considered that 1 mol·L−1 HCl may partially dissolve the residual fraction, particularly in carbonate conditions. In the fluvial part of the Sebou basin, there is no marine influence, which justified using 0.2 mol·L−1 HCl. Nevertheless, the lithology of the basin may explain the weak extraction. Some evaporite outcrops occur along the Sebou (Figure S1) and despite their limited area, they play an important role in the geochemical composition of the Sebou watercourse [29] by increasing salinity. Furthermore, the protons provided by the added 0.2 mol·L−1 HCl might be completely neutralized by the dissolution of certain minerals, such as carbonates [35]. In addition, metals might be re-adsorbed rapidly [72] if the pH conditions of the extraction increase due to carbonate dissolution. Therefore, under such geochemical conditions of evaporite and carbonates, it is recommended to use EDTA rather than HCl as a reactant for single extraction [35] or to use 0.5 mol·L−1 HCl extractant, as proposed by [73]. This reinforces the idea that these extraction procedures are only operational and not universal selective methods, since the results are associated to the type of extractants and to the specific extraction protocols [35].
Previous results of a sequential extraction performed on the Sebou sediments indicated a higher non-residual fraction of Co and Pb (between 63–89% and 23–69%, respectively) than in the present study [74]. Sequential procedures extract trace elements associated to an extended set of compartments of the sediments (exchangeable phase, carbonates, oxides, organic matter), whereas a single EDTA mainly extracts metals linked to oxides and organic matter [69]. Indeed, these two metals behave differently: Co was associated to Fe oxides and clays, while Pb was linked to phosphates, iron oxides, and to some POC (Figure 6, Table 3, Figure S6), as also pointed out by [7].
For the sites considered to be uncontaminated, Cr was mostly in the residual phase or was quickly re-precipitated with iron and/or manganese oxides. This is supported by the very low fraction of Cr extracted, whatever the extractants, and by the significant correlation between the total concentrations of Cr and Al and Fe (r2 = 0.93 and 0.86, respectively, but not to the labile fraction). Unfortunately, Cr could not be extracted using EDTA in the sediments from Stations S3 and S4, the most enriched in Cr due to anthropic activities. For these stations, the extraction of Cr using HCl was not effective probably due to the control of Cr anthropogenic inputs by oxides and organic matter.
The labile fraction of Cd was generally high although the total concentration was the lowest among the trace metals, and the enrichment factor using the local bedrock reference was below one. This may be related to the carbonate trapping of Cd by precipitation of secondary carbonate as observed by [62] in similar conditions and to the high solubility of Cd in the presence of carbonates [72]. Therefore, under some conditions of pH and organic matter content, especially during the period of olive oil pressing (December–February) and sugar refining (April–June), the risk of Cd release and ecotoxicity is high, especially since the RI of Cd evidenced a moderate ecological risk.
While the HCl extraction was weak, the sediments from the most contaminated Stations S3 and S4 (not included in the EDTA extraction) exhibited the highest extraction. In terms of TM availability, these stations thus undergo the highest local risk. Trace metals could be released into the aquatic ecosystem with a minor change in physico-chemical characteristics of the river water (redox potential, pH, dissolved organic matter, salinity, inorganic ligands) [20,21]. The environmental conditions of the river can be very hazardous for living organisms since Pb, Cu, and Zn are easily bioavailable at pH 4, 5, and 5.5, respectively [63].
A comparison of the metal availability using the two extractants was possible on sediments from Station A1 (Fez station). Even if not in the same range of extractability, Cd, Zn, and Cu were the most extracted metals in both cases, which argues for an anthropic origin and a hazardous behaviour. Moreover, Cd and Zn were linked and associated to carbonate as already mentioned by [6,75] and others in cultivated basins, while the high extraction of Cu and Pb by EDTA confirmed their association to organic matter and oxides. Consequently, compared to Cd and Zn, their environmental risk is lower regarding their availability. Finally, the percentage of the labile fraction (EDTA extraction) was significantly related to the enrichment factor for Zn (r2 = 0.65, y = 82.61x − 27, n = 12, p < 0.05) and Pb (r2 = 0.53, y = 8.54ln(x) + 6.88, n = 12, p < 0.05) (Figure S7). Whenever enrichment of these metals occurred in relation to an anthropic origin, this demonstrates that a higher availability was observed which might be hazardous for living organisms.

5. Conclusions

This study aimed to determine the natural and anthropogenic sources of TM (As, Cu, Cr, Co, Cd, Pb, Ni, Zn), their contamination level, their availability, and the controlling factors in the Sebou river sediments.
In the dominant carbonate conditions of the Sebou basin, the fingerprint of natural weathering on the origin of metals in the sediments was highlighted. Despite a fine sediment texture in the high flow period of spring, only Zn was more concentrated in spring. Trace metal concentrations did not vary significantly, except Zn, Cr, Pb, and Cu, and particularly As, which decreases regularly along the water course.
A set of geochemical indicators was combined to assess the contamination intensity of trace elements in sediments. The polymetallic contamination index must be used with caution since it may lead to contradictory results compared to metal-specific indices such as Igeo and EF. For the latter, the use of local bedrock composition as a reference is recommended.
Copper, Pb, Zn, Cd, and Cr contamination is consistent with the waste inputs from industrial activities, particularly in Stations A1, S3, S4, close to Fez city (Cr, Cu, Pb), and/or from non-point sources such as agricultural fertilizers (Cd). A potential ecological risk was detected at Station S3.
Based on the relationships between elements and a PCA, we were able to distinguish the metals of natural origin associated to various sediment components, which were controlled by clays and Fe oxides (such as Co and Ni) and to carbonates (such as As), and those undergoing contamination which were linked to oxides and organic matter (Pb, Cu), P and carbonates (Cd, Zn), and Coarse Silts.
Cadmium, Pb, and Cu were the most available metals (36, 24, 20% on average, respectively). The higher metal extraction observed using EDTA than with HCl was discussed in relation with the stations concerned and the distribution of the metals on the sediment components. In the context of carbonates and evaporites, a concentration of 0.5 mol·L−1 HCl is recommended for metal extraction, as for saline conditions.
The positive relationship between labile fractions and EF for Pb and Zn evidenced an anthropogenic origin. Despite its low enrichment in sediments, Cd was identified as a hazardous element due to its high availability. The link between metal enrichment in sediment and metal availability indicated that anthropogenic contamination is hazardous for living organisms.

Supplementary Materials

The following are available online at https://www.mdpi.com/article/10.3390/w13223203/s1. Figure S1. Geological map and associated lithology of the Sebou basin (performed using ArcGis software on the basis of the geological map of Morocco 1/1,000,000) Source: M. Saadi, E.A. Hilali, M. Bensaïd, A. Boudda, M. Dahmani, Carte géologique du Maroc (1/1,000,000), Ministère de l’Energie et des Mines, Direction de la Géologie. (1985). Figure S2. Land use (except white areas, which mainly concern mountainous areas, where no information is available) and location of the main anthropogenic activities, assumed to be potential pollution sources at the scale of the whole Sebou Basin. Figure S3a. Shepard’s classification of Sebou basin sediments (particle size < 2 mm). Figure S3b. Ternary plot of major elements in river bottom sediments from the Sebou basin. Figure S4. Box plot of the TE concentrations in bottom sediments from the Sebou basin. Note that concentrations are expressed in log, except for Cd. Figure S5. Relationship between Pb total content (µg·g−1) and particular organic matter (% POC) for samples from all campaigns (spring: March 2018 and April 2019 and summer: July 2018 and July 2019); n = 32 (outliers S3 sampled in April and July 2019 were not included). Figure S6. Relationships between labile fraction of Pb extracted by EDTA with (a) labile fraction of Fe (µg·g−1) and (b) POC (%). Figure S7. Relationships between the enrichment factor (EF) and the labile fraction extracted by EDTA (µg·g−1) for (a) Zn and (b) Pb. Table S1. Mineralogical composition of the clays in the Sebou Basin sediments collected at the stations Machraa Bel Ksiri, Azib, Soltane, and M’jara [29], which correspond respectively to Station S6, the upstream of Station S5, and the upstream of the Station A4 of the present study. Table S2. Different types of industries located in the Sebou basin. Table S3. Chemical composition of total major and trace elements of the bedrocks sampled in the Sebou basin. Table S4. Comparison of the TM content of the Sebou sediments measured in this study with previous studies. Table S5. Spearman correlation coefficients between total concentrations of major elements, trace metals, and POC (excluding outliers). Table S6. Correlation matrix for parameters used in the PCA: mean concentrations of major elements and trace metals content of particular organic matter (POC), Coarse Silts (CS), Fine Silts (FS), and Clays. In bold, p < 0.05.

Author Contributions

Conceptualization and design of the experiments, S.E.M., S.H., J.-L.P. and A.P.; Field experiments, S.E.M., S.H., J.-L.P. and A.P.; Sample preparation, S.E.M.; Methodology, reagents/materials/analysis tools, S.E.M., A.P., S.H. and J.-L.P.; Data analysis, S.E.M., A.P. and S.H.; Writing, S.E.M. and A.P.; Review and editing, S.H. and J.-L.P.; Visualization, S.E.M.; Supervision, A.P., S.H. and J.-L.P.; Project administration and funding acquisition, J.-L.P., S.H. and A.P. All authors have read and agreed to the published version of the manuscript.

Funding

This research was funded by the PHC-Toubkal program via Campus France as well as by a CNRS contribution in France and the Agence de l’eau Artois-Picardie, which supported analysis costs in the framework of the O’Sebou observatory. Sara EL MRISSANI received financial support from PHC-Toubkal via Campus France.

Institutional Review Board Statement

Not applicable.

Informed Consent Statement

Not applicable.

Data Availability Statement

Data available on request due to restrictions. The data presented in this study are available on request and under conditions from the corresponding author (A.P.). The data are not publicly available because Sara EL MRISSANI has not yet defended her PhD.

Acknowledgments

The authors are very grateful to the staff of the analytical platforms (PAPC, PLANET) and the ECOBIZ team from the Laboratoire Ecologie Fonctionnelle et Environnement, as well as the ICPMS Platform team at GET-OMP for their assistance and help with part of the physico-chemical analysis and/or sample preparation. This work is a part of the co-supervised PhD (Ibn Tofail University-Toulouse INP) research of Sara EL MRISSANI and of the PHC-Toubkal project O’Sebou. Warm thanks go to two anonymous reviewers for their fruitful comments.

Conflicts of Interest

The authors declare no conflict of interest. The founding sponsors had no role in the design of the study; in the collection, analyses, or interpretation of data; in the writing of the manuscript, and in the decision to publish the results.

References

  1. Barton, C.; Schmitz, S. Chapter 26—Environmental Toxicology: Terrestrial. In Information Resources in Toxicology, 4th ed.; Elsevier: Amsterdam, The Netherlands, 2009; pp. 247–250. [Google Scholar] [CrossRef]
  2. Mantei, E.J.; Foster, M.V. Heavy metals in stream sediments: Effects of human activities. Environ. Earth Sci. 1991, 18, 95–104. [Google Scholar] [CrossRef]
  3. Benamar, M.; Toumert, I.; Tobbeche, S.; Tchantchane, A.; Chalabi, A. Assessment of the state of pollution by heavy metals in the surficial sediments of Algiers Bay. Appl. Radiat. Isot. 1999, 50, 975–980. [Google Scholar] [CrossRef]
  4. Volpe, M.; Lacara, F.; Volpe, F.; De Mattia, A.; Serino, V.; Petitto, F.; Zavalloni, C.; Limone, F.; Pellecchia, R.; De Prisco, P.; et al. Heavy metal uptake in the enological food chain. Food Chem. 2009, 117, 553–560. [Google Scholar] [CrossRef]
  5. Hayzoun, H.; Garnier, C.; Durrieu, G.; Lenoble, V.; Le Poupon, C.; Angeletti, B.; Ouammou, A.; Mounier, S. Organic carbon, and major and trace element dynamic and fate in a large river subjected to poorly-regulated urban and industrial pressures (Sebou River, Morocco). Sci. Total Environ. 2015, 502, 296–308. [Google Scholar] [CrossRef] [PubMed]
  6. N’Guessan, Y.; Probst, J.; Bur, T.; Probst, A. Trace elements in stream bed sediments from agricultural catchments (Gascogne region, S-W France): Where do they come from? Sci. Total Environ. 2009, 407, 2939–2952. [Google Scholar] [CrossRef] [PubMed]
  7. Leleyter, L.; Probst, J.-L. A New Sequential Extraction Procedure for the Speciation of Particulate Trace Elements in River Sediments. Int. J. Environ. Anal. Chem. 1999, 73, 109–128. [Google Scholar] [CrossRef]
  8. Singh, K.P.; Mohan, D.; Singh, V.K.; Malik, A. Studies on distribution and fractionation of heavy metals in Gomti river sediments—A tributary of the Ganges, India. J. Hydrol. 2005, 312, 14–27. [Google Scholar] [CrossRef]
  9. Birch, G. Determination of sediment metal background concentrations and enrichment in marine environments—A critical review. Sci. Total Environ. 2017, 580, 813–831. [Google Scholar] [CrossRef] [PubMed]
  10. Wang, Z.; Li, M.; Zhang, R.; Zhuang, C.; Liu, Y.; Saito, Y.; Xie, J.; Zhao, B. Impacts of human activity on the late-Holocene development of the subaqueous Yangtze delta, China, as shown by magnetic properties and sediment accumulation rates. Holocene 2011, 21, 393–407. [Google Scholar] [CrossRef]
  11. Rodrigues, M.L.K.; Formoso, M.L.L. Geochemical Distribution of Selected Heavy Metals in Stream Sediments Affected by Tannery Activities. Water Air Soil Pollut. 2006, 169, 167–184. [Google Scholar] [CrossRef]
  12. Bur, T.; Probst, J.; N’Guessan, M.; Probst, A. Distribution and origin of lead in stream sediments from small agricultural catchments draining Miocene molassic deposits (SW France). Appl. Geochem. 2009, 24, 1324–1338. [Google Scholar] [CrossRef] [Green Version]
  13. Sundaray, S.K.; Nayak, B.B.; Lin, S.; Bhatta, D. Geochemical speciation and risk assessment of heavy metals in the river estuarine sediments—A case study: Mahanadi basin, India. J. Hazard. Mater. 2011, 186, 1837–1846. [Google Scholar] [CrossRef] [PubMed]
  14. Charriau, A.; Lesven, L.; Gao, Y.; Leermakers, M.; Baeyens, W.; Ouddane, B.; Billon, G. Trace metal behaviour in riverine sediments: Role of organic matter and sulfides. Appl. Geochem. 2011, 26, 80–90. [Google Scholar] [CrossRef] [Green Version]
  15. Hassimi, H.; Taleb, A.; Bouezmarni, M.; Karzazi, O.; Taleb, M.; Kherbeche, A.; Debbaut, V. The effect of the physicochemical conditions variations on the behavior of heavy metals trapped in polluted fluvial system sediments: The case of Oued Sebou, Morocco. Appl. Water Sci. 2019, 9, 17. [Google Scholar] [CrossRef] [Green Version]
  16. Benabdelkader, A.; Taleb, A.; Probst, J.; Belaidi, N.; Probst, A. Anthropogenic contribution and influencing factors on metal features in fluvial sediments from a semi-arid Mediterranean river basin (Tafna River, Algeria): A multi-indices approach. Sci. Total Environ. 2018, 626, 899–914. [Google Scholar] [CrossRef] [Green Version]
  17. Fovet, O.; Belemtougri, A.; Boithias, L.; Braud, I.; Charlier, J.; Cottet, M.; Daudin, K.; Dramais, G.; Ducharne, A.; Folton, N.; et al. Intermittent rivers and ephemeral streams: Perspectives for critical zone science and research on socio-ecosystems. Wiley Interdiscip. Rev. Water 2021, 8, e1523. [Google Scholar] [CrossRef]
  18. Rozemeijer, J.; Noordhuis, R.; Ouwerkerk, K.; Pires, M.D.; Blauw, A.; Hooijboer, A.; van Oldenborgh, G.J. Climate variability effects on eutrophication of groundwater, lakes, rivers, and coastal waters in the Netherlands. Sci. Total Environ. 2021, 771, 145366. [Google Scholar] [CrossRef]
  19. Huttunen, I.; Hyytiäinen, K.; Huttunen, M.; Sihvonen, M.; Veijalainen, N.; Korppoo, M.; Heiskanen, A.-S. Agricultural nutrient loading under alternative climate, societal and manure recycling scenarios. Sci. Total Environ. 2021, 783, 146871. [Google Scholar] [CrossRef] [PubMed]
  20. Lamhasni, N.; Chillasse, L.; Abba, H.; Haouat, S.E.L.; El, M. Typologie des eaux de surface du bassin du Sebou par multi-approche : Corrélation entre indice biologique global des réseaux de contrôle et de surveillance (IBG-RCS) et l’approche physicochimique et microbiologique. Afr. Sci. Rev. Int. Des Sci. Technol. 2013, 9, 35–49. [Google Scholar]
  21. Perrin, J.; Rais, N.; Chahinian, N.; Moulin, P.; Ijjaali, M. Water quality assessment of highly polluted rivers in a semi-arid Mediterranean zone Oued Fez and Sebou River (Morocco). J. Hydrol. 2014, 510, 26–34. [Google Scholar] [CrossRef]
  22. ABHS. Inventaire du degré de pollution des ressources en eau dans le bassin du Sebou. In Mission 2 Rapp. l’inventaire Du Degré Pollut. Sebou; ABHS: Rabat, Morocco, 2014; 174p. [Google Scholar]
  23. De Waele, J.; Di Gregorio, F.; El Wartiti, M.; Fadli, D.; Follesa, R.; Marini, A.; Melis, M. Geo-environmental risk in the upper valley of the Oued Sebou (Fès, Central Morocco): A preliminary approach. J. Afr. Earth Sci. 2004, 39, 491–500. [Google Scholar] [CrossRef]
  24. Koukal, B.; Dominik, J.; Vignati, D.; Arpagaus, P.; Santiago, S.; Ouddane, B.; Benaabidate, L. Assessment of water quality and toxicity of polluted Rivers Fez and Sebou in the region of Fez (Morocco). Environ. Pollut. 2004, 131, 163–172. [Google Scholar] [CrossRef] [PubMed]
  25. Hayzoun, H.; Garnier, C.; Durrieu, G.; Lenoble, V.; Bancon-Montigny, C.; Ouammou, A.; Mounier, S.J.L. Impact of rapid urbanisation and industrialisation on river sediment metal contamination. Environ. Monit. Assess. 2014, 186, 2851–2865. [Google Scholar] [CrossRef]
  26. Dra, A.; El Gaidoumi, A.; Tanji, K.; Benabdallah, A.C.; Taleb, A.; Kherbeche, A. Characterization and Quantification of Heavy Metals in Oued Sebou Sediments. Sci. World J. 2019, 2019, 7496576. [Google Scholar] [CrossRef] [PubMed] [Green Version]
  27. Snoussi, M.; Haïda, S.; Imassi, S. Effects of the construction of dams on the water and sediment fluxes of the Moulouya and the Sebou Rivers, Morocco. Reg. Environ. Chang. 2002, 3, 5–12. [Google Scholar] [CrossRef]
  28. Arthurton, R.; Le Tissier, M.; Snoussi, M.; Kitheka, J.; Shaghude, Y.; Kane, A.; Flöser, G.; Kremer, H. AfriCat: LOICZ—Global Change Assessment and Synthesis of River Catchment—Coastal Sea Interactions and Human Dimensions in Africa; LOICZ Reports & Studies; LOICZ IPO: Geesthacht, Germany, 2008; 30p. [Google Scholar]
  29. Haida, S. Transport de Matière et Bilan de L’érosion Mécanique et de L’altération Chimique Dans un Bassin Versant de Zone Semi-Aride: Le Sebou. Impacts des Variations Climatiques et des Activités Humaines. Ph.D. Thesis, Ibn Tofail University, Kenitra, Morocco, 2000; 268p. [Google Scholar]
  30. ABHS. Inventaire du Degré de Pollution des Ressources en Eau dans le Bassin du Sebou. Rapport de l’Agence du Bassin Hydraulique du Sebou-Maroc; ABHS: Rabat, Morocco, 2015. [Google Scholar]
  31. ABHS. Etude D’actualisation du Plan Directeur D’aménagement Intégré des Ressources en Eau du Bassin du Sebou; PDAIRE ABHS, MISSION I; ABHS: Rabat, Morocco, 2007. [Google Scholar]
  32. Probst, J.-L.; Messaïtfa, A.; Krempp, G.; Behra, P. Fluvial transports of Mercury pollution in the Ill river basin (Northeastern France): Partitioning into aqueous phases, suspended matter and bottom sediments. Environ. Sci. Mercur. Contam. 1999, 501–520. [Google Scholar] [CrossRef] [Green Version]
  33. Carignan, J.; Hild, P.; Mevelle, G.; Morel, J.; Yeghicheyan, D. Routine Analyses of Trace Elements in Geological Samples using Flow Injection and Low Pressure On-Line Liquid Chromatography Coupled to ICP-MS: A Study of Geochemical Reference Materials BR, DR-N., UB-N., AN-G and GH. Geostand. Newsl. 2001, 25, 187–198. [Google Scholar] [CrossRef]
  34. Sahuquillo, A. Overview of the use of leaching/extraction tests for risk assessment of trace metals in contaminated soils and sediments. TrAC Trends Anal. Chem. 2003, 22, 152–159. [Google Scholar] [CrossRef]
  35. Leleyter, L.; Rousseau, C.; Biree, L.; Baraud, F. Comparison of EDTA, HCl and sequential extraction procedures, for selected metals (Cu, Mn, Pb, Zn), in soils, riverine and marine sediments. J. Geochem. Explor. 2012, 116–117, 51–59. [Google Scholar] [CrossRef]
  36. Kuo, S.; Lai, M.; Lin, C. Influence of solution acidity and CaCl2 concentration on the removal of heavy metals from metal-contaminated rice soils. Environ. Pollut. 2006, 144, 918–925. [Google Scholar] [CrossRef]
  37. Chester, R.; Stoner, J.H. Pb in Particulates from the Lower Atmosphere of the Eastern Atlantic. Nat. Cell Biol. 1973, 245, 27–28. [Google Scholar] [CrossRef]
  38. Reimann, C.; de Caritat, P. Distinguishing between natural and anthropogenic sources for elements in the environment: Regional geochemical surveys versus enrichment factors. Sci. Total Environ. 2005, 337, 91–107. [Google Scholar] [CrossRef]
  39. Aloupi, M.; Angelidis, M. Normalization to lithium for the assessment of metal contamination in coastal sediment cores from the Aegean Sea, Greece. Mar. Environ. Res. 2001, 52, 1–12. [Google Scholar] [CrossRef]
  40. Loring, D.H. Normalization of heavy-metal data from estuarine and coastal sediments. ICES J. Mar. Sci. 1991, 48, 101–115. [Google Scholar] [CrossRef]
  41. Ackermann, F. A procedure for correcting the grain size effect in heavy metal analyses of estuarine and coastal sediments. Environ. Technol. Lett. 1980, 1, 518–527. [Google Scholar] [CrossRef]
  42. Roussiez, V.; Ludwig, W.; Probst, J.-L.; Monaco, A. Background levels of heavy metals in surficial sediments of the Gulf of Lions (NW Mediterranean): An approach based on 133Cs normalization and lead isotope measurements. Environ. Pollut. 2005, 138, 167–177. [Google Scholar] [CrossRef] [Green Version]
  43. Hernandez, L.; Probst, A.; Probst, J.L.; Ulrich, E. Heavy metal distribution in some French forest soils: Evidence for atmospheric contamination. Sci. Total Environ. 2003, 312, 195–219. [Google Scholar] [CrossRef] [Green Version]
  44. Larrose, A.; Coynel, A.; Schäfer, J.; Blanc, G.; Massé, L.; Maneux, E. Assessing the current state of the Gironde Estuary by mapping priority contaminant distribution and risk potential in surface sediment. Appl. Geochem. 2010, 25, 1912–1923. [Google Scholar] [CrossRef]
  45. Zoller, W.H.; Gladney, E.S.; Duce, R.A. Atmospheric Concentrations and Sources of Trace Metals at the South Pole. Science 1974, 183, 198–200. [Google Scholar] [CrossRef]
  46. Taylor, S.R.; McLennan, S.M. The Continental Crust: Its Composition and Evolution; Blackwell Malden Mass: Hoboken, NJ, USA, 1985; 312p. [Google Scholar]
  47. Wedepohl, K.H. The composition of the continental crust. Geochim. Cosmochim. Acta 1995, 59, 1217–1232. [Google Scholar] [CrossRef]
  48. Reimann, A.C.; de Caritat, P. Intrinsic Flaws of Element Enrichment Factors (EFs) in Environmental Geochemistry. Environ. Sci. Technol. 2000, 34, 5084–5091. [Google Scholar] [CrossRef]
  49. Sutherland, R.A. Depth Variation in Copper, Lead, and Zinc Concentrations and Mass Enrichment Ratios in Soils of an Urban Watershed. J. Environ. Qual. 2000, 29, 1414–1422. [Google Scholar] [CrossRef]
  50. Muller, G. Index of geoaccumulation in sediments of the Rhine River. GeoJournal 1969, 2, 108–118. [Google Scholar]
  51. Hakanson, L. An ecological risk index for aquatic pollution control : A sedimentological approach. Water Res. 1980, 14, 975–1001. [Google Scholar] [CrossRef]
  52. MacDonald, D.D.; Ingersoll, C.G.; Berger, T.A. Development and Evaluation of Consensus-Based Sediment Quality Guidelines for Freshwater Ecosystems. Arch. Environ. Contam. Toxicol. 2000, 39, 20–31. [Google Scholar] [CrossRef] [PubMed]
  53. Smith, S.L.; MacDonald, D.D.; Keenleyside, K.A.; Ingersoll, C.G.; Field, L.J. A Preliminary Evaluation of Sediment Quality Assessment Values for Freshwater Ecosystems. J. Great Lakes Res. 1996, 22, 624–638. [Google Scholar] [CrossRef]
  54. Shepard, F.P. Nomenclature Based on Sand-silt-clay Ratios. J. Sediment. Res. 1954, 24, 151–158. [Google Scholar] [CrossRef]
  55. Qu, S.; Wu, W.; Nel, W.; Ji, J. The behavior of metals/metalloids during natural weathering: A systematic study of the mono-lithological watersheds in the upper Pearl River Basin, China. Sci. Total Environ. 2020, 708, 134572. [Google Scholar] [CrossRef]
  56. Bounouira, H. Etude des Qualites Chimiques et Geochimiques du Bassin Versant du Bouregreg. Ph.D. Thesis, Ibn Tofail Kenitra University, Kenitra, Morocco, 2007; 274p. [Google Scholar]
  57. Barakat, A.; El Baghdadi, M.; Rais, J.; Nadem, S. Assessment of Heavy Metal in Surface Sediments of Day River at Beni-Mellal Region, Morocco. Res. J. Environ. Earth Sci. 2012, 4, 797–806. [Google Scholar]
  58. Bouzekri, S.; El Hachimi, M.L.; Touach, N.; El Fadili, H.; El Mahi, M.; Lotfi, E.M. The study of metal (As, Cd, Pb, Zn and Cu) contamination in superficial stream sediments around of Zaida mine (High Moulouya-Morocco). J. Afr. Earth Sci. 2019, 154, 49–58. [Google Scholar] [CrossRef]
  59. Azzaoui, S. Les Métaux Lourds Dans le Bassin Versant du Sebou. Géochimie Source de Pollution et Impact sur la Qualité des Eaux de Surface. Ph.D. Thesis, Ibn Tofail University, Kenitra, Morocco, 1999; 135p. [Google Scholar]
  60. Amri, N.; Benslimane, M.; Zaoui, H.; Hamedoun, M.; Outiti, B. Evaluation Of The Heavy Metals Accumulate In Samples Of The Sediments, Soils And Plants By Icp-oes With The Average Sebou, Moroccan Stat. Phys. Condens. Matter Soc. 2007, 8, 43–52. [Google Scholar]
  61. Fan, W.; Xu, Z.; Wang, W.-X. Metal pollution in a contaminated bay: Relationship between metal geochemical fractionation in sediments and accumulation in a polychaete. Environ. Pollut. 2014, 191, 50–57. [Google Scholar] [CrossRef] [PubMed]
  62. Wu, X.; Probst, A. Influence of ponds on hazardous metal distribution in sediments at a catchment scale (agricultural critical zone, S-W France). J. Hazard. Mater. 2021, 411, 125077. [Google Scholar] [CrossRef] [PubMed]
  63. Tessier, A.; Fortin, D.; Belzile, N.; DeVitre, R.; Leppard, G. Metal sorption to diagenetic iron and manganese oxyhydroxides and associated organic matter: Narrowing the gap between field and laboratory measurements. Geochim. Cosmochim. Acta 1996, 60, 387–404. [Google Scholar] [CrossRef]
  64. Micó, C.; Recatalá, L.; Peris, M.; Sánchez, J. Assessing heavy metal sources in agricultural soils of an European Mediterranean area by multivariate analysis. Chemosphere 2006, 65, 863–872. [Google Scholar] [CrossRef]
  65. Benabdelkader, A.; Taleb, A.; Probst, J.; Belaidi, N.; Probst, A. Origin, distribution, and behaviour of rare earth elements in river bed sediments from a carbonate semi-arid basin (Tafna River, Algeria). Appl. Geochem. 2019, 106, 96–111. [Google Scholar] [CrossRef] [Green Version]
  66. Burton, G.A. Sediment quality criteria in use around the world. Limnology 2002, 3, 65–75. [Google Scholar] [CrossRef]
  67. Badassan, T.; Avumadi, A.; Ouro-Sama, K.; Gnandi, K.; Jean-Dupuy, S.; Probst, J.-L. Geochemical Composition of the Lomé Lagoon Sediments, Togo: Seasonal and Spatial Variations of Major, Trace and Rare Earth Element Concentrations. Water 2020, 12, 3026. [Google Scholar] [CrossRef]
  68. Cuvier, A.; Leleyter, L.; Probst, A.; Probst, J.-L.; Prunier, J.; Pourcelot, L.; Le Roux, G.; Lemoine, M.; Reinert, M.; Baraud, F. Why comparison between different chemical extraction procedures is necessary to better assess the metals availability in sediments. J. Geochem. Explor. 2021, 225, 106762. [Google Scholar] [CrossRef]
  69. Baize, D. Teneurs en Eléments Traces Métalliques dans les sols (France). References et Stratégies D’interprétation; INRA: Paris, France, 1997; p. 408. [Google Scholar]
  70. Snape, I.; Scouller, R.; Stark, S.; Stark, J.; Riddle, M.; Gore, D. Characterisation of the dilute HCl extraction method for the identification of metal contamination in Antarctic marine sediments. Chemosphere 2004, 57, 491–504. [Google Scholar] [CrossRef]
  71. Chao, T.T.; Zhou, L. Extraction Techniques for Selective Dissolution of Amorphous Iron Oxides from Soils and Sediments. Soil Sci. Soc. Am. J. 1983, 47, 225–232. [Google Scholar] [CrossRef]
  72. Mitchell, K.N.; Gómez, M.S.R.; Barrera, A.L.G.; Flores, L.Y.; de la Torre, J.A.F.; González, F.J.A. Evaluation of Environmental Risk of Metal Contaminated Soils and Sediments Near Mining Sites in Aguascalientes, Mexico. Bull. Environ. Contam. Toxicol. 2016, 97, 216–224. [Google Scholar] [CrossRef]
  73. Sutherland, R.A.; Tack, F.M.; Ziegler, A.D.; Bussen, J.O. Metal extraction from road-deposited sediments using nine partial decomposition procedures. Appl. Geochem. 2004, 19, 947–955. [Google Scholar] [CrossRef]
  74. Leleyter, L. Speciation Chimique des Elements Majeurs, Traces et des Terres Rares dans les Matieres en Suspension et dans les Sediments de Fond des Cours d’eau : Application aux Fleuves de Patagonie (Argentine), a la Piracicaba (Bresil), a L’oued Sebou (Maroc) et a l’ill (France). Ph.D. Thesis, Louis Pasteur University, Strasbourg, France, 1999; 298p. [Google Scholar]
  75. Roussiez, V.; Probst, A.; Probst, J.-L. Significance of floods in metal dynamics and export in a small agricultural catchment. J. Hydrol. 2013, 499, 71–81. [Google Scholar] [CrossRef] [Green Version]
Figure 1. The Sebou basin (North-West Morocco) and the location of the bedrock and bottom sediments sampling stations from upstream to downstream: along the Sebou main course (from S1 to S6) and the tributaries (from A1 to A4). The red dashed line delimits the considered fluvial sub-basin at Machraa Bel Ksiri city (outlet station S6). For maps concerning geology-lithology, land cover, and anthropic activities, see Supplementary Figures S1 and S2.
Water 13 03203 g001
Figure 2. Mean respective proportion of particle size distribution of the sediments collected in the Sebou basin during spring (blue) and summer (red) seasons. (a) Ternary plot of the total fraction ≤ 2000 µm (Sands, 2000–63 µm; silts, 63–2 µm and clays, ≤2µm). (b) Ternary plot of the fine fraction ≤ 63µm (Coarse silts 63–20 µm, fine silts, 20–2 µm and clay, ≤2µm).
Water 13 03203 g002
Figure 3. Box plot for trace metal concentrations in river sediments sampled in the Sebou basin during spring (blue box) and summer (pink box). The names of the stations are indicated for the outlier values (see Figure 1). Note that concentrations are expressed in log, except for Cd.
Water 13 03203 g003
Figure 4. Comparison between the enrichment factor (EF) of trace metals in the river sediments from the Sebou basin normalized to the composition of: (a) the bedrocks (BR) of the Sebou (green) and the Tafna (pink) basins and (b) the UCC (Upper Continental Crust). The circles and stars represent out and extra outliers, respectively. The green and orange dashed lines indicate the 1.5 and 5 thresholds respectively.
Water 13 03203 g004
Figure 5. Contamination indices of trace elements in the Sebou River Sediments: (a) Geoaccumulation index calculated using the local bedrock (green boxplot: BR Sebou)) and the Tafna basin bedrock (pink boxplot: BR Tafna) [16]. The names of the sites for outlier data are indicated; (b) mean contamination degree (CD) per station identified using the local bedrock (circle) and the Tafna basin bedrock [16] (rhombus); (c) Mean potential ecological risk (RI) per station using the local bedrock (BR-Sebou).
Water 13 03203 g005
Figure 6. Principal Component Analysis (PCA) for the PC1-PC2 (a) and PC1-PC3 (b) components, considering the mean concentrations of trace and major elements, the contents of POC, Clays, Fine (FS) and Coarse (CS) Silts in bottom sediments of the Sebou basin; (c,d) represent the corresponding sampling stations associated to the same components, respectively.
Water 13 03203 g006
Table 1. Mean ( X - ), standard deviation (σ), minimum (min), and maximum (max) concentrations of major, trace metals, POC, and C/N ratio in sediments collected during the sampling periods (n = 36), at each sampling site of the Sebou River and its tributaries. The mean ( X - ) concentration of TM in the sediments of two carbonate basins (the Tafna Basin (Algeria, [16]) and the Upper Pearl River basin (China, [55])) are shown, as well as the mean ( X - ) concentration of TM in the sediments of three regional basins in Morocco (Bouregreg river, Bouregreg watershed, [56]; Day River, Oum Rabia Watershed, [57]; Ansguemir River, Moulouya Watershed, [58]). The mean total concentration of the Sebou bedrock (this study, Table S3), of the Tafna bedrock [16], and of the UCC composition [47], are presented. Values of TEL (Threshold Effect Level) and PEL (Probable Effect Level) of sediment quality guidelines are mentioned [53].
StationTrace Metals (µg·g−1)Major Element (mg·g−1. Except POC (%)
ZnCrCuNiPbCoAsCdSiAlFeMnMgCaNaKTiPPOCC/N
SedimentS1 X - 91.5275.2423.0931.8715.2611.056.830.21140.2849.5029.080.3910.49178.411.0214.073.120.890.616.53
σ55.0935.9010.2518.155.564.592.240.0542.8223.5213.800.164.6680.090.547.341.250.340.332.11
S2 X - 69.7977.4620.2126.1318.039.525.760.19153.6445.3427.130.3929.45144.702.4011.063.130.651.017.64
σ6.8110.002.093.002.050.850.540.025.956.362.570.033.917.670.340.970.180.130.280.66
A1 X - 195.6784.5779.2134.9026.7411.665.600.22157.0650.6830.760.3220.92141.342.4510.993.280.841.777.48
σ70.735.1632.513.714.101.150.470.024.583.892.320.043.107.480.640.590.110.150.741.03
S3 X - 279.67243.98103.2030.1761.077.154.820.39165.5541.7425.470.3119.95146.942.689.682.861.470.875.87
σ30.6453.4317.502.660.580.700.490.0319.773.582.570.031.6310.580.740.780.090.280.560.71
A2 X - 79.2779.6433.2032.1113.0211.224.780.19176.6247.0029.980.6013.65146.213.5911.562.950.730.386.12
σ5.9210.704.805.112.401.461.190.0210.977.542.750.131.1422.820.911.820.280.020.081.22
A3 X - 79.5782.8234.4632.0315.1312.464.330.18210.2454.8432.750.4810.88112.205.7413.133.500.680.455.95
σ16.2819.734.987.441.763.120.500.0225.6420.478.840.051.5732.501.045.730.770.030.210.68
S4 X - 130.66174.5854.3030.7923.839.923.970.26182.2245.8226.850.4214.84136.233.6711.133.011.331.426.69
σ67.56109.5526.493.3110.270.650.270.0912.793.231.460.060.791.150.560.980.050.590.841.82
S5 X - 84.68104.3635.2729.0414.869.803.960.22188.2444.8726.260.4713.59136.503.8110.673.031.051.046.17
σ16.0228.947.674.332.390.770.240.0418.324.942.670.020.714.720.601.350.050.160.250.55
A4 X - 104.15102.1329.2234.5819.4213.074.700.17231.7265.1238.880.5210.3878.874.9012.444.070.800.955.83
σ12.7618.353.385.721.741.870.350.0210.5411.865.590.060.818.730.492.160.520.070.710.85
S6 X - 84.8089.8630.1131.0214.9110.964.440.20217.7451.8631.090.4711.79106.274.4711.013.500.840.525.73
σ4.374.562.350.860.780.320.290.009.951.810.800.030.514.870.270.710.070.040.120.80
Sebou basin X - 111.83101.2341.0531.4020.2710.954.950.21184.6450.2530.230.4515.56130.443.5811.633.280.890.886.43
σ64.1850.0826.336.4011.572.271.110.0633.8011.896.280.116.5236.011.472.960.560.300.591.16
Min37.4645.8113.4218.418.896.663.440.1492.6731.7019.150.267.6468.950.537.761.950.520.264.31
Max301.34281.76115.5752.5161.4817.068.590.40247.2585.4645.930.7934.63254.976.5422.134.621.752.508.96
Tafna X - 74.3140.8317.5116.6343.376.615.130.1933.4030.7217.630.3314.43113.972.2110.26-0.582.14-
Upper Pearl X - 159.55205.25106.3284.3319.30-17.360.41------------
Bouregreg X - 139.5073.88-32.0053.5013.8832.13-------------
Day X - 100.13102.27108.62-109.01--1.27------------
Ansgumir X - 74.00-23.67-41.33-5.711.11------------
SC guidelinesTEL123.0037.3035.7018.0035.00-5.900.59------------
PEL315.0090.00197.0036.0091.30-17.003.53------------
BedrockSebou X - 50.9320.5411.1516.005.183.342.740.2686.7512.088.600.2431.76259.471.643.781.220.59--
Tafna X - 22.4015.9010.2011.808.602.106.900.10177.7316.198.290.3417.29194.175.767.41----
UCC X - 52.0035.0014.3018.6017.0011.602.000.10303.4877.4430.890.5313.5129.4525.6728.653.120.67--
Table 2. Average trace metal concentrations of the available fraction (μg·g−1) and proportion of the total concentration (%) in sediments using EDTA extraction for the stations sampled in 2018 and HCl extraction for some stations (S2, A1, S3, S4, S6).
AsCdCoCrCuNiPbZn
ppm%ppm%ppm%ppm%ppm%ppm%ppm%ppm%
EDTA ExtractionS1 X - 0.091.040.142.380.674.080.040.037.8423.171.001.94.1721.7919.2813.06
S2 X - 0.091.620.0632.600.768.180.080.114.6524.561.365.124.5827.593.925.74
A1 X - 0.182.90.0941.070.897.370.080.0813.3932.021.323.8612.3644.3715.8612.37
S3 X - ----------------
A2 X - 0.020.710.0533.360.584.980.070.082.336.780.842.551.2411.251.321.69
A3 X - 0.030.770.0526.670.554.890.080.103.079.820.662.372.2715.121.181.71
S4 X - ----------------
S5 X - 0.082.130.0739.950.485.330.110.157.1426.421.435.83.2526.883.465.11
A4 X - 0.051.080.0842.800.655.700.060.075.3719.581.033.434.725.547.067.76
S6 X - 0.051.060.0735.960.615.440.080.096.8722.831.153.643.121.332.442.92
Sebou basin X - 0.071.320.0736.070.655.850.070.095.8820.161.083.64.1923.625.765.71
σ0.040.660.027.130.151.570.020.033.198.710.331.322.889.076.114.4
HCl ExtractionS1 X - ----------------
S2 X - 0.030.580.013.550.090.90.040.050.231.140.220.850.040.261.852.67
A1 X - 0.061.030.013.620.070.60.030.030.420.660.190.580.040.152.121.23
S3 X - 0.040.80.025.770.121.740.030.010.550.580.582.000.030.054.271.60
A2 X - ----------------
A3 X - ----------------
S4 X - 0.071.80.025.590.212.20.040.020.470.830.822.580.030.133.722.58
S5 X - ----------------
A4 X - ----------------
S6 X - 0.010.330.012.690.060.580.020.020.190.630.210.680.030.191.712.02
Sebou basin X - 0.040.800.013.900.11.040.030.030.330.790.341.130.030.172.442.05
σ0.030.670.012.430.060.790.010.020.220.310.331.060.010.081.582.77
Table 3. PCA components for total concentrations of major and trace metals in the Sebou sediments and the corresponding percentages of the variance and correlation coefficients (significance level p < 0.05 in bold). CS: Coarse Silts; FS: Fine Silts.
ElementsRotated Component Matrix
PC1PC2PC3PC4
Zn0.960.05−0.150.16
Cr0.89−0.250.150.04
Cu0.95−0.01−0.050.16
Ni0.150.88−0.09−0.11
Pb0.95−0.11−0.070.07
Co−0.580.770.10−0.09
As−0.160.13−0.910.09
Cd0.92−0.35−0.11−0.01
Si−0.130.450.83−0.25
Al−0.310.890.25−0.06
Fe−0.300.890.24−0.12
Mn−0.650.020.43−0.53
Mg0.14−0.45−0.140.62
Ca0.09−0.55−0.800.00
Na−0.110.300.89−0.26
K−0.530.47−0.41−0.33
Ti−0.250.840.370.00
P0.82−0.310.000.09
POC0.290.10−0.040.90
CS0.58−0.000.56−0.46
FS0.00−0.23−0.430.72
Clays−0.810.260.31−0.16
Eigen value9.925.192.721.61
% Total variance45.1023.5712.367.33
% Cumulative variance45.1068.6881.0388.36
Publisher’s Note: MDPI stays neutral with regard to jurisdictional claims in published maps and institutional affiliations.

