
A Review on Existing Methods to Assess Hydraulic Erodibility Downstream of Dam Spillways


1
Department of Applied Sciences, University of Quebec at Chicoutimi, Chicoutimi, QC G7H 2B1, Canada
2
Hydro-Québec Production Unité Expertise en Barrages, 75 Boulevard René-Lévesque Ouest, Montréal, QC H2Z 1A4, Canada
*
Author to whom correspondence should be addressed.
Water 2021, 13(22), 3205; https://doi.org/10.3390/w13223205
Submission received: 31 October 2021
/
Revised: 9 November 2021
/
Accepted: 9 November 2021
/
Published: 12 November 2021
(This article belongs to the Special Issue Erosion Processes in Hydraulic Engineering)
Abstract
:In recent years, rock scouring or erosion downstream of dams has become an increasing dam safety concern. Several theoretical, semi-theoretical, semi-analytical and numerical methods can be used to assess the rock erosion in hydraulic structures. Semi-theoretical approaches determine the correlation between the erosive intensity of fluid flow and the resistive capacity of rock. Such approaches establish the scour thresholds as a function of erosive intensity of water and several rock mass indices by using in situ data and a curve-fitting approach. In some studies, the excavatability index, initially developed for rock mass stability analysis, was used to analyse the rock mass resistance in hydraulic erodibility analysis. The effectivity and weight of the geomechanical parameters used are yet to be determined on the basis of the erodibility phenomenon. The semi-analytical methods are developed on the basis of the mechanical and hydraulic interaction of rock mass and water. Four methods developed by Bollaert et al. are important in determining the erodibility in the plunge pool, but they are not applicable in the case of spillways. They used the comprehensive fracture mechanics for closed-end joints, quasi-steady impulsion, and dynamic impulsion (DI) for blocky rock erosion. The application of these methods to each site is necessary to identify constants that are difficult to determine. Few numerical methods are available to assess the rock mass erosion in hydraulic structures. In the case of numerical methods, the erosive agent is indistinct, and the hydraulic hazard parameter on the spillway surface is almost challenging to apply. This study comprehensively reviews the mechanism of erosion and the methods for assessing the risk of potential rock mass erosion downstream of dams and hydraulic structures. The advantages and disadvantages of all methods are discussed and the potential future research directions in this domain are proposed.
Research Highlights:
- Existing methodologies for investigating the hydraulic erodibility of rock in dam spillways and plunge pools are reviewed comprehensively.
- Hydraulic erodibility or scouring downstream of dams can be assessed by theoretical, semi-theoretical, semi-analytical, and numerical methods.
- The advantages and disadvantages of existing methods for evaluating erosion and scouring are summarized.
- Future directions for assessing the hydraulic erodibility of rock in hydraulic structures (dams) are discussed.
1. Introduction
In recent years, the risk of rock scouring or erosion in hydraulic structures increased the concern about dam safety. The terms ‘erodibility’, ‘scour’, and ‘hydraulic erosion’ are considered synonymous technical words to explain critical centralised erosion that occurs when the erosive intensity of fluid surpasses the resistive capacity of the rock mass. The design of dam spillways that can discharge a wide range of floods with the minor scouring of material is one of the important challenges in designing hydraulic structures [1,2].
Rock scouring is a complicated mechanism. Rock scour basically occurs by four principal mechanical processes as revealed by its occurrence near engineering structures:
- Rock block abrasion (long term);
- Intact rock fracturing (brittle failure and fatigue failure);
- Single block deletion (uplift pressures in fractures and shear forces);
- Rock block peeling off.
These mechanisms of rock erosion are presented in Figure 1.
The instantaneous processes consist of rock block removal and brittle failure. In the case of block removal mechanism, single rock blocks can be lifted by horizontal and vertical pressures. Along these lines, the stream turbulence, block size, block dimensions, bulge of the blocks, surrounding rock mass, joint roughness, and cohesion of filling as a shear destabilised force are relevant and effective parameters that straightforwardly characterise the lifting forces.
The breaking of rock in fractured media is scientifically explained by the hypothesis of linear elastic fracture mechanics and may occur by abrupt or progressive hydraulic-driven fracturing. The stress intensity at the tip of shut-end cracks and fracture toughness of the rock play important roles in identifying the types of fracturing; if the stress intensity surpasses the fracture toughness, then brittle failure will occur; otherwise, dynamic fracturing of rock or fatigue failure will occur [4]. Fatigue failure spreads a current fracture on the basis of the intensity and the number of pressure pulses and stops when fracture formation is finished.
In the case of the block peeling-off mechanism, quasi-steady pressure forces play an important role. This type of erosion ordinarily occurs in thin rock layers with protruded open-end rock blocks. The block protrusion causes the stream deviation. The deviation of the stream creates the lifting and drag forces on the block because of the quasi-steady stream velocity, which causes block ejection [3].
Figure 1 demonstrates the other time-dependent rock mass scouring mechanism that occurs on the rock surface by abrasion phenomenon. Abrasion, occasionally referred to as ball-milling or bedrock wear, alludes to gradual grinding resulting from the repeated impacts due to different particles, such as sands or cobbles that are carried by flowing fluid. The occurrence of scouring because of abrasion commonly requires a large amount of time. Thus, dam overtopping or spillway erodibility evaluations are rarely conducted.
These mechanisms are used for the development of the methods for the prevision of rock mass erosion.
This review paper attempts to provide an extensive survey of the existing methods to assess the rock mass erosion in several types of hydraulic structures. We extract the advantages and disadvantages of the existing semi-theoretical, semi-analytical, and numerical approaches. A comparison between the semi-theoretical methods is conducted on the basis of the committed error of each method by considering real datasets and the prediction of each methodology. To efficiently explain the existing methods, we present the algorithm of each methodology in various flowcharts. Some potential future research directions are presented on the basis of this review. Finally, the limitations of the application of some methods in erosion prediction are defined, and the new necessary research in this domain is established.
In this work, the semi-theoretical methods are first explained. Thereafter, the semi-analytical methodologies are explained by mainly focusing on the comprehensive scour model (CSM). The scouring at the multiblock system with numerical methods is explained. The summary of the paper and conclusion of the authors are presented in the last two sections of this work.
2. Scour Prediction Approaches
Many authors have studied scour hole development below plunging spillway jets [5,6,7,8]. The disintegration capability of soil along inclines or unlined spillway channels is also considered in several studies [9,10,11,12]. Amongst the approaches used for assessing rock mass erosion, the most common are semi-theoretical methods according to the correlation between the resistive capacity of rock and the erosive intensity of fluid, such as Annandale’s and Pells’ approach [1]. Some classical equations can be used for computing the final scour depth in plunge pools. The flowchart in Figure 2 shows the classifications of the empirical, theoretical, and semi-theoretical methods.
2.1. Comparative Methods Based on Resistance of Materials for Erosion and Rate of Energy Dissipation
A certain form is considered in the design of a dam spillway to evaluate the potential of hydraulic erosion of dams. The scour threshold is an erodibility index and a function of P that is widely used in the industry [13,14,15]. This function is calculated for different comparative methods on the basis of the interpreted erosion obtained from various case studies. A threshold line with a specific scour condition that distinguishes case studies can be identified in the plotted data. The correlation between the resistance of material for erosion and the energy dissipation rate P is calculated as in Equation (1):
where P is the total water erosive intensity that is released on or over the material. Material resistance to erosion depends on its strength and can be explained by existing methods that determine the overall component commitment. In P < f(Kh), the limit of erodibility is not surpassed, while P > f(Kh) indicates that the values above the erodibility threshold are exceeded; accordingly, erosion will occur, and the material will scour [16,17,18].
Equation (1) is a two-part equation representing the erosive force and the material resistance threshold to scouring, which is determined by the erodibility index, rock mass erosion index (RMEI), or geological strength index (GSI) (eGSI). In this work, an improved strategy is needed to find an agent that is easy to be determined while explaining the overall strength of the fluctuating turbulence. Hydraulic water energy (kW/m2) denotes the erosive force of stream water and is represented as hydraulic stream power (Pa) or unit stream power dissipation . The favoured agent for this purpose is the rate of energy dissipation. Hydraulic turbulence is the main cause of energy loss and pressure fluctuations. Increased turbulence intensity leads to a great energy dissipation rate and high levels of water pressure fluctuations. Erosive force and pressure fluctuations of flowing water are evaluated and calculated, as in the following equations, in energy dissipation rate analysis:
where is the unit stream power dissipation and the change in unit stream power between two locations along a flow path (kW/m2); = unit weight of water (kN/m3); q = unit discharge rate (m2/s); ΔE = energy loss (J = kg·m2·s−2); hl = head loss; x = horizontal direction of flow; y = depth of water; Zb = the vertical distance of the bottom surface from the reference datum; = water density (kg/m3); V = velocity of flowing water; g = gravitational acceleration (m/s2); Q = total discharge amount (m3/s); = width of a flow section measured at the water surface (m); and Sf = and presents the friction slope or the gradient of the total hydraulic energy line. Figure 3a shows the variation of properties over a differential flow section in an open channel. Figure 3b shows the cross-sectional view of the flow channel.
This equation was used for evolving equations to assess the energy dissipation rate for a characteristic manner of erosion [1,20]. Annandale provided alternate forms of Equation (3) to decide the erosive limit concerning an assortment of flow cases, including open channels, plunge pools, hydraulic jumps, knick-points, and head cuts [21].
Part two of Equation (1) shows the rock resistance capacity, which is calculated by using the rock mass parameters and forms an index when inserted into the equation. In this regard, different categories of engineering rock mass that are used in evaluating the rock mechanical excavatability apply a large number of agents that modify the rock hydraulic erodibility [22,23]. Van Schalkwyk used some rock mass indices for this purpose, including the rock mass rating (RMR) classification of Bieniawski; the Q-classification of Barton, which was primarily suggested for underground space designs; and the index suggested by Kirsten for evaluating the excavatability of earth materials [24,25,26,27,28]. The authors reported similar results for all these indices. However, the highest accuracy was found for the Kirsten index (N), which is used to evaluate the erosion of rock mass [29,30,31].
Equation (5) is determined by using certain rock mass parameters, such as uniaxial compressive strength (UCS), mass strength (Ms), joint shear strength (Kd), relative block structure (Js), and rock block size (Kb). The proposed system applies across the full range of natural materials from the weakest soils to the hardest rocks.
In 1982, Kirsten used the classifications and charts of Jennings to propose a descriptive chart with Ms ranging from 0.87 to 280 [27,32]. In 1970, Cecil combined the RQD index with the joint set (Jn) and introduced the Kb factor ranging from 1 to 100 [33]. The corresponding changes for RQD and Jn were 5–100% and 1–5, which were proposed by Barton and Kirsten, respectively [26,27,28]. The Kb factor was later adopted in the N index. The Jr/Ja ratio represents the joint shear strength for the Kd factor, where Jr is the joint roughness, ranging from 0.5 to 4, and Ja is the joint surface change ranging from 0.75 to 18 [27]. The Kd changes from 0.03 to 5.33. Js is the effect of rock block shape and the path by which related joints are arranged to flow. In 1982, Kirsten proposed the rating for orthogonal fractured systems, which ranges from 0.37 to 1.5. The author also used the orthogonal case as the measuring standard because it was simple and effective, maintaining that the jointing angle was correct in most cases, even though slight errors exist. However, this notion was rejected by Boumaiza et al. in 2019. The finding of Boumaiza et al. in 2019 encouraged a proposed new rating from 0.09 to 1.38 for nonorthogonal fractured systems. In 2018, Kamali stressed that the number and connectivity of blocks increase and have considerable effects on erodibility under orthogonal joint conditions [34,35].
The following are the two other indices recently proposed by Pells to evaluate the limit of rock resistance to erosive power of water: geological strength index (GSI) (eGSI) and RMEI. The eGSI was developed on the basis of the GSI of Hoek and previously suggested to define and classify the rock mass [1,36].
Bieniawski concluded that the joint orientation parameter is not considered in the RMR system, when the GSI system is identified utilising the RMR system [37]. In this regard, Pells suggested the eGSI index for illustrating the importance of the joint orientation relative to the flow direction and a rock block shape by considering the recently proposed discontinuity orientation adjustment parameter (Edoa) (Equation (6)) [1].
The RMEI index is the other index suggested by Pells [1]. This index may be noted on the basis of the likelihood factor (LF) and relative significance factor (RF) (Equation (7)). Prefixes P1 to P5 in Equation (7) are various sets of parameters introduced in the classification system. P1 to P5 indicate the kinematically viable system for isolation, the feature of the potentially eroding surface, the feature of joints, the joint spacing, and the rock block shape, respectively [1].
Pells argued that the erosion mechanism in this field is poorly represented by existing indices, including Kirsten’s index. The RMEI systems represent the rock mass parameters that gain significance from studies on eroded rocky spillways to control this mechanism. A high RF is used to measure the relative importance of the rock mass parameters. The RF measures the isolation and eroding surface by using three values: joints (RF = 2), joint spacing (RF = 1), and rock block shape (RF = 1).
The RMEI system designed by Pells for hydraulic erosion is structually similar to the Q-system of Barton that was initially designed for field investigaions. The size of the rock blocks determined by joint spacing and dip is indirectly included in RMEI. However, the joint shear strength is not considered in the RMEI system. The joint nature that maintains the natural conditions of joints can be used as an alternative for determining the rock block size. Joint spacing is a less significant factor (RF = 1) in the RMEI system compared with joint factor (RF = 2). The Kb rating factor as an indicator of the rock block size is given more importance in the Q-system compared with the Kd factor representing the joint shear strength [26]. This phenomenon shows that the field evaluation to determine the importance of the rock mass parameters is highly influenced by the individual judgement of the analyst.
Pells assumed that the existing indices, including Kirsten’s index, do not indicate the erosion mechanism in the field. Accordingly, the RMEI system attempts to represent the rock mass parameters controlling the erosion mechanism. The relative importance of these parameters is assumed to be due to the field observations of the eroded rocky spillways. A high RF weights the important rock mass parameters. The kinematically viable system for isolation and the feature of the potentially eroding surface are weighted with a high RF value of three compared with the nature of joints (RF = 2), joint spacing (RF = 1), and rock block shape (RF = 1). The structure of the RMEI system for hydraulic erosion is considered similar to that of the Q-system, which was also developed on the basis of the field investigation. In the RMEI system of Pells, the rock block size is indirectly included. However, the joint spacing and dip could provide an idea about the rock block size given that the wide spacing of joints produces a more important rock block volume than the close spacing of joints. The joint shear strength is not included in the RMEI classification. Nevertheless, the nature of the joint factor is the same given that it incorporates the natural conditions of joints. The RMEI classification considers the joint spacing factor as a less important factor (RF = 1) compared with the nature of the joint factor, which is weighted with RF = 2. The Q-system provides a more important rating to the Kb factor, which is an indicator of the rock block size, compared with the Kd factor, which represents the joint shear strength [26]. The discordance of the relative importance of the parameters included in these two classification systems demonstrates how the field evaluation can be highly affected by analyst judgement. Consequently, the relative importance of the rock mass parameters is difficult to determine by using an accurate alternative.
2.1.1. Background of the Comparative Methods Base on Kirsten’s Index
Van Schalkwyk assumed the erosion condition as a function of erosion depth (Table 1) [29]. They also used recent data from Moore, Kirsten’s index limitations, and scale effects to update their findings [38]. Accordingly, the scour threshold lines were changed (Table 1).
Annandale analysed the findings of Moore, Van Schalkwyk, and other scour data using Kirsten’s index to offer a scour threshold related to unit stream power dissipation (ΠUD) (Table 1) [21,29,31]. Table 1 illustrates that the erosion depth beyond two leads to scour occurrence, while the values below two are insignificant and might be the outcome of loose rock blocks being removed from the surface [21]. In 2000, Kirsten adopted a similar approach for determining the scour threshold to show the scour and no-scour conditions by using data from the study of Dooge and Moore [18,30,31]. A comparison of the scouring onset values for Kirsten’s index versus ΠUD is presented in Figure 4, and the corresponding equations are shown in Table 2.
2.1.2. Background of Pells’ Methods
Pells classified the erosion condition in certain classes with minor modifications on the depth of eroded area according to the same concept of the study of Van Schalkwyk and added information on the extent of the eroded area (Table 3). Neither depth nor volume is a complete descriptor of the erosion severity. However, whether the conditions in the first and second columns of Table 3 should be simultaneously or separately considered is ambiguous in this classification. Pells noted that neither depth nor volume is a complete descriptor. Thus, if the conditions should be simultaneously considered, then it might result in a problem, for example, whether class 1 or 2 should be considered for the maximum depth of 0.5 m and the general extent of 8 m3/100 m2.
Pells plotted the calculated index values versus ΠUD by using the eGSI index (Equation (6)) and the RMEI index (Equation (7)) to manually determine the selected erosion classes. These values were separated by scour threshold lines (Figure 5a,b) and were originally proposed by Pells and recently modified by Douglas [39].
However, no finding has been obtained on the optimisation introduced into the original scour threshold lines.
2.1.3. Discussion of EIM and Pells’ Methods
The easiness and wide pertinence to different stream conditions make the erodibility index method (EIM) especially alluring for practice. In any case, this approach is not without confinement. As the name of this approach suggests, it consolidates an empirical index to classify and identify the rock. Along these lines, the EIM cannot reveal various erosion mechanisms (i.e., fatigue failure, block removal, or brittle failure). The results of EIM are general and do not incorporate the erosion mechanisms. The geometry of rock is considered 2D, and the 3D nature of the discontinuity orientations is not accounted. However, this method can illustrate the discontinuity structure relative to the flow direction.
The data analysed by Annandale consider several types of flow conditions (137 case studies), while Pells used the predominant channel flow in spillways. Under the channel flow conditions, block removal is considered to be the dominant mechanism for scour to occur; thus, the analysis of variables representing blocks (e.g., Kb) in those cases would be expected to show great importance. Under the jet conditions wherein fracturing of the rock can be more dominant, the other variables may be shown to be more relevant (e.g., Ms).
Rock scour is a highly complicated mechanism, and its evaluation should start by identifying the relevant rock mass parameters to assess this mechanism. For this purpose, in 2019, Boumaiza et al. developed a method on the basis of real data and previous empirical methods [35]. They examined a set of rock mass parameters to determine those that are considered related parameters to evaluate the rock mass erosion. In the proposed approach, various parameters are assessed, such as Edoa, NPES, Jo, Js, Kd, Kb, Vb, and UCS. Finally, Kd, Vb, Jo, Edoa, and NPES were chosen as the relevant parameters by sensitivity analysis.
2.2. Semi-Theoretical Methods for Computing Scour of the Plunge Pools
Several semi-theoretical equations can be used for computing the final scour depth in the plunge pool bottom in alluvial and weathered rock. Some semi-theoretical equations are identified in Table 4 [40,41,42,43,44,45,46,47,48,49,50]. The reduced models of the Froude scale are used to produce most semi-theoretical equations based on the real data analysis and experiments. Some of these equations are proposed on the basis of the prototypes for ski-jump conditions. Several equations are also considered (Table 5). In 1985, Mason and Arumugam proposed Equation (8) for the intermediate outlet conditions of the free surface reservoir and dam structures on the basis of the several prototype cases and the models of numerous erodible beds [5].
The different parameters of Equation (8) are illustrated in Figure 6, where Ys represents the scouring depth below the bedrock, Hn is the net energy head, g is the gravitational acceleration, Г is the experimental coefficient, Ds stands for the sum of the scour depth and tailwater depth, q represents the specific flow rate, Y0 is the tailwater depth, and d stands for the block and bed material size [50].
In Equation (8) and Figure 6, , , , , and are experimental and empirical constants settled in Table 4 by different authors. Various coefficients of Table 4 contrasted with general equations. represents the vertical interval between the tailwater level and the reservoir, and t0 stands for the energy loss in the chute; h0 is the vertical distance between the outlet exit and the tailwater level, and Hn = H0 = HB − t0 stands for the net energy head at the outlet exit. Ui, i, and i are the jet velocity, thickness, and angle in the initial point, respectively. Uj, Bj, and j are the total jet velocity, thickness, and angle in the impact point, respectively. Table 6 shows the abbreviation list of the plunge pool semi-theoretical approaches.
3. Semi-Analytical Methods
Semi-analytical methods are derived by calibration of at least one parameter using experiments, or empirical calibration of coefficients using data. A jet plunging into a pool leads to the development of average and fluctuating dynamic pressures that can cause the breakup and removal of rock. When a jet plunges into a pool, it creates dynamic pressures below the point of jet impact. These pressures consist of average and fluctuating dynamic pressures. If free air is introduced into a plunge pool by the jet, then the average dynamic pressure decreases with the increase in the air concentration [3,55,56,57]. In 2019, Maleki and Fiorotto analysed the block stability and potential rock scour in the plunge pool bottom on the basis of new experimental study by focusing on the mean dynamic pressure and fluctuating pressure coefficients produced by rectangular water jets [58]. In the fluvial erosion case, the comprehensive scour model (CSM) of Bollaert is one of the adopted semi-analytical methods [59]. This model was proposed in 2002 for plunge pools with circular jets and later in 2010 developed for riverbed by Bollaert.
Plunging jets occur in different types of hydraulic structures, including the characteristic location of the spillways, overtopping dams, valves, and dam structural gates [59]. In such a manner, the CSM could be used for plunging jets. The CSM of Bollaert comprises three unique techniques, for example, comprehensive fracture mechanics (CFM), quasi-steady impulsion (QSI), and dynamic impulsion (DI) (Figure 7). In the main strategy, the CSM explains the fracture propagation by utilising linear elastic fracture mechanics. In the subsequent technique, the second law of Newton (impulsion) and net uplift pressure are used to determine the single block uplift. Bollaert proposed the QSI technique to assess the eroded area in walls of plunge pools and determine the scour depth. The QSI technique is developed for protruding rock blocks on the basis of the different flow conditions and relative flow direction. The hydraulic parameters are determined along the critical area in the pool bottom and rock mass surface for every fracture mechanism. Figure 7 illustrates the CSM.
Figure 7 illustrates the main physical and mechanical processes used for determination of rock scouring (CSM). CFM comprises three modules: falling jet module, plunge pool module, and rock mass module. The latter executes the fracture mechanism.
The falling jet module (Figure 8) clarifies how the geometrical and hydraulic parameters of the plunging jets are changed from outlet exit to impact point of plunge pool surface. Issuance jet velocity (Vi), initial turbulence intensity (Tu), and issuance jet diameter (Di) identify the jet characteristics at the outlet exit. Tu represents the extent of the root-mean-square (RMS) estimation of the fluctuating velocity of the plunging jet to the mean axial velocity of the plunging jet. The plunging jet pathway relies upon air drag and ballistics. The falling jet module can determine the jet pathway length L from issuance to the impact point, the longitudinal distance of the plunging jet from issuance to the impact point, the jet velocity (Vj), and the jet diameter (Dj) at the impact point (Equations (9) and (10)) [60,61].
The plunge pool module depicts the plunging jet whilst crossing the plunge pool. This module characterises and computes the pressures of water at the plunge pool bottom on the rock surface. The Y/Dj ratio plays an important role in defining coefficients, which is straightforwardly identified with jet diffusion. Y is fundamental and represents the plunge pool water depth. The fluctuating dynamic pressures C′pa and the mean dynamic pressure coefficient Cpa, which are determined by using Equations (11)–(13), are the important pressures straightforwardly estimated under the centreline of the jet impact point. These pressure coefficients were defined on the basis of the experimental data analysis of [55].
where is the air concentration in % and is the volumetric air-to-water ratio. Table 7 illustrates Tu for various outlet structural types, and the polynomial coefficients for various turbulence intensities. The input and output parameters of the plunge falling jet and pool modules are noted in Table 8. Figure 9a,b demonstrate the Cpa and C′pa as functions of the pool water depth to jet diameter (Y/Dj) on the basis of the curve fitting of Ervine results [55].
In the rock mass module (third module), the water pressures at the plunge pool bottom on the rock surface (water–rock interface) are utilised to determine the pressures inside the rock mass discontinuities. Several pressure fluctuations can be observed in the open- and close-ended discontinuities. The fluctuating pressures introduced into the close-ended fissures and open-ended joints in the rock or concrete masses by the average and dynamic fluctuating pressures originate from the interaction between the plunging jets and the surrounding water in the plunge pools. The major parameters follow: coefficient of maximum dynamic pressure () used for the closed-end rock joints and brittle failure mechanism, the characteristic amplitude (ΔPc) and pressure cycle frequency (fc) used for closed-end rock joints, brittle failure and fatigue failure mechanism, and the coefficient of maximum DI (CImax) used for the open-ended rock joints and single blocks [59].
3.1. CFM
The CFM method recognises the final scour depth in the pool bottom around the area of the turbulent jet impingement for the close-ended joints. This method presents two different approaches for brittle failure and fatigue failure mechanism.
For this purpose, the maximum dynamic pressure in the close-ended fissures is determined by using Equation (15) [59]:
where
represents the dynamic pressure coefficient and is provided from multiplication of the amplification factor Г+ with C′pa, which is determined by using Table 9 and by superposition by Cpa.
In 2016, Bollaert modified and simplified the and defined the new equation for (MPa) (Equation (16)) [64].
where is the density of water with a dimension of kg/m3.
As noted in the past area, the minimum and maximum pressures of the cycles are used to determine . The fc follows the supposition of an ideal resonator framework and relies upon the air concentration (Equation (14)) in the joint αi and on the joint length Lf that appeared in Figure 10 [59]. Figure 10a shows the Lf in the closed-end rock joints, and Figure 10b presents the Lf in the open-ended rock joints.
Crack propagation represents the stresses occurring at the joint tip because of the fatigue mechanism owing to the cyclic nature of pressures inside the rock joints. This concept is depicted by linear elastic fracture mechanics. The propagation of cracks can be fragile or time subordinate diffusion. The fragile or brittle failure occurs when an applied stress intensity (KI) surpasses the fracture toughness (KIc). Fatigue failure occurs in the contrary case. Stresses are described by KI (Equation (17)) [65]:
where KI is the stress intensity (MPa/m1/2), which is produced by dynamic pressures in the pool bottom and applied to the crack tip that may cause joint propagation; is water stress (MPa) and determined as 80% of because of the varying values of inside the fracture; f represents the boundary correction factor and relies on the joint type and persistency. Three relevant joint geometries are presented in Figure 10. These geometries are a semi-elliptical crack (EL), single edge crack (SE), and centre cracked (CC). In each of these configurations, the boundary correction factors (f) are defined by Equations (18)–(20).
where C is coefficient in Equation (18) graphically determined on the basis of the ratios and Ø. Bollaert (2016) simplified Equation (17) and proposed Equation (21) for determining the stress intensity [64].
As previously mentioned, stress intensity (KI) is produced by dynamic pressures in the pool bottom and applied to the joint tip that may cause joint propagation. If the stress intensity (KI) is higher than the fracture toughness KIc, then crack propagation may occur.
The KIc relies on the mineralogical type of rock, tensile strength (T), and UCS. The changes are conducted to illustrate the rate of loading and in situ stress. Along these lines, the in situ fracture toughness KI,ins is developed on the basis of data analysis and constrained by using Equations (22) and (23) and Table 10 [3].
where indicates the confinement horizontal in situ stress and is determined by using vertical stress and K0 (). UCS, , and T are in MPa. If the applied stress intensity surpasses the in situ fracture toughness (KI ≥ KI,ins), then brittle failure will occur; otherwise, failure mechanics and crack propagation are communicated as Equation (24) [66]:
where C and m rely on the rock characteristics that are recognised on the basis of fatigue tests; dN represents the number of pressure cycles; and ΔKI defines the most and the least stress intensity differences. Variables m and C must be determined to handle time-dependent crack propagation into the model [67].
In 2016, Bollaert et al. modified Equation (24) and proposed Equation (25) as the new equation for the fatigue process. Fracture toughness (KIc) was considered in the new equation [68]:
The flowchart of CFM is presented in Figure 11. The ultimate scour depth and time of scouring could be computed on the basis of the maximum dynamic pressure in the pool bottom (Pmax), stress intensity (KI), in situ fracture toughness (KI,ins), and fatigue failure mechanism owing to this method.
3.2. DI Method
Bollaert proposed the DI method for the first time, which is used for predicting the ultimate scour depth in the plunge pools for open-ended joints and single rock blocks [59]. This method explains the movement of rock blocks by their mass on the basis of the uplift pressures. DI is based on the maximum impulse (Imax) in an open-ended rock mass fracture (single rock block) that is provided by the time integral of net forces. Net forces consist of the submerged weight of the block, shear and interlocking forces, and forces produced by pressures under and over the block [59,62]. The final purpose in the DI method is to determine the uplift height (hup) by using net uplift velocity (), which is determined by net impulsion (Inet) (kN/s), and the block mass (ms) (kg). The DI method is explained stepwise in the following paragraphs. The flowchart of DI is presented in Figure 12; Figure 13 shows the impulse dynamics on a block.
Kinetic and potential energies have been used in Equation (26) for determining the uplift height (hup) (m) from Equation (27) and comparing with block height (Zb) (m).
where is the uplifting velocity (m/s), which is also named ‘launch velocity’ computed from Equation (36) and net impulsion (Inet) shown in Equation (28).
where Fu and Fo are considered the forces produced by pressures under and over the block (kN), and are produced because of the dynamic pressure in the pool bottom; is the submerged weight of block (kN), which is determined by using Equation (29); and is the shear force (kN). Shear force () is considered zero because it acts in a direction parallel to a surface. This variable is zero for a cubic block. Time integral () is in seconds, taken over the period ( is the period in which positive differences exist in forces produced by pressures over and under the block), and is determined by Equation (34). The block mass is in kilograms and determined by Equation (35).
where is the block volume (m3); is the unit weight of rock (kN/m3); is the unit weight of water (kN/m3); and Xb, Yb, and Zb are the block width, length, and height, respectively.
The shear force Fsh was dismissed in these relations. The nature of the rock joints is rough in real situations. The roughness of the rock joints plays an important role in determining the shear strength. The shear strength of rock must be determined when designing rock-engineering structures. In this regard, the shear resistance must be determined in the block uplift process. The block uplift velocity relies upon the lateral pressure differences and frictional resistance of the sidelong discontinuities. For this reason, in 2014, Pan et al. developed several analytical equations for computing shear resistance force (Fsh) for two unique modes [69]. The first mode (Equation (30)) is used when the pressure fluctuations are equal in the opposite surface (top and bottom) of the block. The second mode (Equation (31)) is used when the pressure fluctuations at the top of a rock block are more prominent than that at the bottom of a rock block.
where μ stands for the frictional coefficient, is the submerged unit weight (kg/m3), and Δh is the pressure head difference.
Bollaert determined the difference between the forces under and over the block by using a nondimensional (CI) coefficient (Equation (33)), which is produced by curve fitting on the basis of some experiments [59]. Variable CI is the coefficient for determining the difference between pressures under and over the block. Thus, Equation (33) should be used for computing net uplift force ().
where Y is the water depth in the plunge pool and is the jet diameter at the impact. Both variables are in meters.
where is the incoming kinetic energy (m), Vj is the jet speed at impact (m/s), and A is the area of the block surface over or under the block (m).
where is a nondimensional time coefficient and assumed by large-scale laboratory experiments, Lf is the total length of the joint (m), and c is the mean wave celerity (m/s). If Xb, Yb, and Zb are considered as block width, length, and height, respectively, then the total length of the joint is Lf = 2 Zb + Xb.
where stands for the block volume (m3), and is the density of rock (kg/m3). Considering Equations (26)–(29) and (32)–(35), uplifting velocity () is computed similar to Equation (36):
Finally, the uplift height is directly computed by using Equation (37).
After hup is determined, the ratio of uplift height to block height (hup/Zb) must be characterised. The capability of rock scour must be evaluated by utilising Figure 14, which depends on field data analysis. In 2005, Bollaert and Schleiss determined that the block might be separated from the rock mass when hup/Zb is greater than 20% (hup/Zb > 0.20) [61].
The Bollaert portrayal for the DI method has two ambiguities, especially in enlisting (Fu − Fo). A comparable delineation was determined for DI and portraying CI coefficient in several articles of Bollaert [59,61,62,63].
The CI, (Fu − Fo), and uplift height (hup) are difficult to determine considering this description. The final dimension of (Fu − Fo) is in m instead of kN by considering this description. The unit weight of water () and area of block surface (A) are not intended for converting the DI coefficient (CI) to force.
In 2004, Annandale corrected Bollaert’s problem in converting CI to force and proposed a modified equation for determining (hup) [71]. However, Annandale did not consider the nondimensional time coefficient () in Equation (37).
Bollaert published a new article and proposed the simplified CSM (SCSM) because of the difficulty in understanding the CSM [64]. In SCSM, the DI method is explained stepwise. Bollaert corrected the problem in previous publications. This time, he converted CI to pressure instead of force and did not consider the block surface area (A). We present Equation (38) for computing the hup by considering its explanation about the DI method and block surface area (A).
where the block surface area (A) is in m2.
In 2006, Manso developed the CSM of Bollaert and studied the effects of the plunge pool geometry on the rock scour with a high velocity jet. Manso performed different experiments by considering the various plunge pool geometries (12 geometries) [72]. This work was conducted to determine the effect of the plunge pool geometry on pressure produced by circular jets. In 2014 and 2016, Duarte developed the CSM focused on the jet aeration and considered various types of fluid on the basis of air content (β) to propose a new equation for determining block displacement (uplift height hup) [73,74].
In 2009, Asadollahi proposed a semi-analytical methodology for assessing the single block stability in the plunge pools by using three-dimensional block stability (BS3D) [75]. Asadollahi developed this methodology by numerical BS3D code. BS3D is used to compute the block uplift acceleration by using Federspiels’ experimental studies [76,77,78]. In this methodology, the uplift height can be determined on the basis of Newton’s second law after the aforementioned acceleration is computed. Asadollahi assessed the erosion in the plunge pools on the basis of Bollaert DI technique. Moreover, Asadollahi modified Bollaert’s criteria for deciding the occurrence of block removal and proposed the hup/Zb > 0.25 ratio based on data analysis of several case studies and using Martins’ experimental data [79]. For this reason, Asadollahi actualised a Fortran code dependent on the calculation presented by Tonon (2007) [80]. BS3D considers all expansive displacement techniques for rock blocks subject to conventional powers. This methodology had admissible results compared with the observed block uplift.
3.3. QSI Method
In 2010, Bollaert proposed the QSI technique to assess the scour in walls of the plunge pools for parallel flow condition relative to the rock surface [81]. Bollaert developed this methodology on the basis of Reinius’ study, which was for identification of the effect of the pressure fluctuations on the rectangular rock block uplift and protruding block cases [82]. The effective forces that are applied to the block and cause the rock block uplift or ejection follow: rock block submerged weight, quasi-steady uplift force produced because of the pressures underneath the rock block, and the turbulent uplift forces produced because of the pressure fluctuations (Figure 15b) [81]. The uplift forces produced because of the pressure fluctuations are significant to cause the block uplift in protruding rock block cases. In 2015, George studied various flow condition analyses and concluded that the quasi-steady system is more effective than the other lifting forces when considering the parallel flow condition. George also found that the forces produced by pressure fluctuations could be neglected from calculations. The flowchart of QSI is presented in Figure 16 [83].
Figure 15a shows the various areas that developed as a result of the falling jet in the plunge pools. Figure 15b illustrates the effective lifting forces that cause the rock block uplift, where eblock represents the block protrusion, hblock is the block height, Lblock denotes the block length, and βblock is the angle between the block edges.
In the QSI, only quasi-steady lift force is considered in the calculations. The quasi-steady lift force is determined by using Equation (39) [81]:
where Cuplift denotes the net uplift pressure coefficients and computed by deducting the surface pressure coefficient (Csurf) from the pressure coefficient inside the joints (Cjoint) (Cjoint − Csurf). Table 11 shows the potential net static uplift pressures for various arrangements of rock blocks [82].
As referenced, Lblock is the block length (m) that appeared in Figure 15b, and VX,max represents the diffusive jet velocity in different locations. The different distances form wall jet issuance points and are computed by using Equation (40) [84]. The jet velocity profile and jet thickness have an inverse relationship where the wall jet velocity decreased, and the wall jet velocity profile smoothed when the jet thickness is increased (Figure 15a).
where hdownstream is the initial thickness of flow (Figure 15a) at the point of deflection and determined by using Equation (41), where qdownstream is the discharge rate in the downstream side and qtotal is the total discharge rate of the falling jet.
The VZbottom is the initial wall jet velocity (m/s). VZbottom relies upon the angles that the jet makes with the water surface at the impacting point and water depth Z, and computed by utilising the model of Hartung and Häusler, which is presented in Equation (42) [85].
where Zcore (m) represents the vertical distance that the core jet needs to be deflected inside plunge pools and commonly considered as 4–5 times the Dj. The Vi represents the initial plunging jet velocity with a dimension of m/s, and Z is the water depth.
Table 12 illustrates the downstream and upstream digressed pieces of the absolute stream rate for various impingement angles δ, which are introduced by Reich [86].
Block shape is one of the important parameters in rock block removal. For this purpose, the common blocks shape was identified on the basis of the existing rock mass geomechanical data and field observations. In that capacity, a plate-like formed block will be ejected just by jet impact. Finally, the ultimate scour depth can be determined by utilising Bollaert’s DI technique after the lifting forces are determined.
On the basis of Lesleighter’s study on Paradise Dam in Australia, the DI method overestimates the scour depth, where the prediction of CFM is close to the actual case [87].
The basis of the semi-analytical methods is experimental. For this purpose, Table 13 illustrates some information about the setup of these experiments.
Numerous parameters affect the plunge pool scour. These parameters can be studied in two different aspects: hydraulic and rock mass.
The most critical parameter in the hydraulic aspect is uplift pressure, which depends on many other geometrical and hydraulic parameters; for example, tailwater depth, initial jet velocity, jet diameter, and plunging jet height affect pool bottom and total uplift pressures. Increasing the tailwater depth will decrease the uplift pressure; conversely, the uplift pressure will increase by raising the initial jet velocity, jet diameter, and plunging jet height.
Numerous geometrical and geomechanical parameters in the rock mass aspect affect the ultimate scour depth. These parameters include joint opening, block volume, block shape, joint roughness, and fracture toughness. This selection of parameters can be comprehensively studied as future challenges.
4. Scouring at the Multiblock System with Numerical Methods
Most previous methods used for computing the scour depth or to assess the hydraulic erodibility were developed for the analysis of a single rock block related to the geomechanical, geometrical, and hydraulic parameters. In most plunge pool cases, the stability of a single rock block is assessed as a representative block of a characteristic blocky layer in various hydraulic conditions. This assessment is continued for nether layers because the representative block started to be stable for removal. Limited methods have been proposed to assess the scouring for multiblock systems, which are presented in Section 4. Figure 17 presents the numerical approach.
Multi-block assessments are more important than single-block assessments because of the location dependent assessment of this system. This system can assess the scouring for various rock block shape and geometrical conditions. In 2009, Wibowo evaluated rock erosion by modelling in universal distinct element code (UDEC) software for dam spillways, based on the block theory of Goodman [88,89]. Figure 18 shows the UDEC model. The red blocks in this model are more vulnerable to removal than those shown in blue.
In 2016, Castillo and Carrillo proposed a numerical simulation by using computational fluid dynamics (CFD) in FLOW-3D software to help in determining the bed erosion in plunge pools [50]. Their methodology solves the Navier–Stokes equations and combines various turbulence models, a block transport model, a semi-theoretical model of the rock mass erosion, and a methodology for computing the free surface of the fluid. This methodology evaluates the hydraulic erodibility of the bed rock by using the combination of the aforementioned models by accurate characterization. In the final step of their study, they conducted a comparison between the pressures and the mean dynamic pressure coefficients obtained exactly at the stagnation area with the parametric approach and studied the local effects of the block’s movement.
Li and Liu, in 2010, proposed another numerical method on the basis of the discrete fracture network (DFN) for evaluating scouring in the plunge pools. The DFN is developed based on a numerical analysis of the hydraulic erodibility in the downstream of dams and the Monte Carlo technique. Ejectable 2D rock blocks were determined by considering the geometry of the plunge pools and discontinuity behaviour. Li and Liu simulated the fluctuating pressures inside the joint and the distribution pressure fluctuating inside the fractured media. Li also analysed the rock block stability on the basis of the empirical equations as a function of rock joint hydraulic pressures [90].
In 2011, Dasgupta, proposed a methodology for evaluating the plunge pool scouring on the basis of three-dimensional computational fluid dynamic (CFD) programming for computing the representative erosive agent of water that is applied to the rock surface [91]. Dasgupta used 2D UDEC to simulate the rock mass. The results of ANSYS FLUENT (plunge pool bottom pressures) were applied to the UDEC to assess the rock block ejection and brittle failure. Figure 19a highlights the 3D flow pattern of the plunging jet of a single valve. Figure 19b shows the primary results of the surface erosion. Figure 19b(1), Figure 19b(2), and Figure 19b(3) show the results of the block removal simulation, brittle failure of the rock block simulation, and combination of the two latter simulations, respectively. The fluctuation of the transient pressure is applied to the rock surface as the dynamic pressure and the time-dependent pressures inside cracks and fractures. The rock block removal at the water–rock interface explains the scouring mechanism.
The methodology of Dasgupta demonstrates promise to utilise numerical techniques for combining the three-dimensional rock mass geometry alongside complicated stream cases.
George presented a non-numerical (experimental–analytical) methodology by using block theory to evaluate the stability of the 3D rock blocks and potential hydraulic erodibility in dam spillways [83]. The methodology of George and Sitar proposed to evaluate the hydraulic erodibility on the basis of multiblock systems [92,93]. Scaled physical model testing and a prototype field experiment (the first of its kind) were performed to examine the role of the 3D geologic structure on the block erodibility. They assessed the possibility of ultimate block failure and the most probable failure mechanism by using Monte Carlo simulations and a first-order reliability method [93]. This study was the first to consider noncubic/nonrectangular block geometries and showed how the geometry influenced a block response. The block theory method was shown to reasonably predict block stability under channel flow conditions. Figure 20 shows the spillway geometry and situation of the removable block inside a rock mass.
In 2018, Gardner developed the experimental–analytical methodology of George and proposed a new numerical methodology to evaluate rock scour in the jointed rock mass [83,94]. Gardner performed the coupled fluid–solid simulations to assess the water–rock interaction behaviour and potential of the 3D polyhedral rock block erosion. This methodology was developed on the basis of the coupled discrete element method (DEM)–lattice Boltzmann method (LBM) programme. In the first step, Gardner developed a new open-source DEM code, which is written using C++ language, to evaluate the mechanical behaviour and the kinematic response of the jointed rock mass. Then, Gardner developed a DEM code and coupled it with LBM to analyse the ejection and movement of 3D polyhedral rock blocks in water. In this methodology, various block shapes and geometries were analysed, and a comparison between its coupled solid-CFD approach with real dataset was performed.
5. Critical Analysis and Application of Different Approaches on Real Cases
To compare various approaches of hydraulic erodibility assessment, we applied the existing methods to real data and presented their results in the present section. It is not possible to compare semi-theoretical approaches with semi-analytical and numerical methods, because of the different nature of the methods.
More detailed data and in situ tests are required to analyse and compare the semi-analytical methods, such as the CSM method and the existing dataset, making it difficult to compare this approach with other approaches.
There are no clear methodology and or software for the application of numerical methods for rock erosion prediction. The flow parameter should be determined by hydraulic software and implemented to geomechanical software. The principal question is, which flow parameter should be deduced from hydraulic software and how should it be implemented in the geomechanical software because of their existing limitations. The application and comparison have been performed on the methods used most often, such as Kirsten, Annandale, Van Schalkwyk, RMEI, and eGSI. For comparison purposes, the field data collected from various case studies conducted by Pells (2016) on unlined rocky spillways are used in this comparative critical analysis. Table A1 illustrates the result of the application of various semi-theoretical approaches on several case studies. These results are obtained by using the threshold lines proposed by these five approaches.
The efficiency of the five comparative scour thresholds is determined herein according to the number of case studies with poorly evaluated scour conditions. According to the results shown in Table A1 and Figure 21a, it can be seen that the minimum committed error is related to RMEI with 41%, and the maximum error is associated with Kirsten and Annandale methods with 81% error. This error is 81, 78, 81, 51 and 41%, respectively, for the Annandale, Van Schalkwyk, Kirsten, eGSI, and RMEI approaches.
According to Figure 21b, it can be seen that the committed error for ’Negligible to Moderate‘ for all methods except eGSI is almost below 50%, and this shows that the performance of these methods for lesser erosions has less error. Conversely, for the ’Large to Extensive‘ classification, the performance of the eGSI has less error, but for the other approaches, it is extremely high.
According to Figure 21c, it can be deduced that all the compared methods, except the RMEI method, underestimate the degree of rock mass erosion. The underestimation percentage for Kirsten, Van Schalkwyk, Annandale, RMEI, and eGSI approaches are, respectively, 100, 96.5, 90, 73 and 33%. Underestimation can have hazardous consequences for hydraulic structures, and overestimation can increase costs.
6. Summary and Discussion
Since 1930, several methods have been proposed to predict the hydraulic erodibility of materials. Several theoretical, semi-theoretical, numerical, and semi-analytical approaches have been developed for assessing the hydraulic erodibility of rocks. Most of these methods are developed for soils, granular materials, and diving jet cases. Some approaches have been proposed for computing and assessing the hydraulic erodibility of rocks in unlined spillways (open channels). Studies on erodibility in spillways and scour in plunge pools have two important aspects, namely, geomechanical and hydraulic aspects. Most semi-theoretical studies use the erodibility index (i.e., Kirsten index), except for Pells’ method, in which RMEI and eGSI indices are used, to assess the geomechanical aspect of erodibility.
In semi-analytical methods, specifically, in the CSM of Bollaert, several factors, such as dynamic pressure, fatigue, fracture toughness, and stress intensity in the CFM method (for close-ended joints) and net impulsion in the DI method (for open-ended joints), are employed to compute the ultimate scour depth and time in such scouring. The QSI method of Bollaert’s CSM computes scour depth in the plunge pool walls. The channel bottoms based on the total lift (quasi-steady lift (QSL) force) are applied to a protruding block, where the QSL force depends on the flow velocity and uplift pressure. Dasgupta proposed a numerical technique in 2011. They utilised 2D UDEC for modelling the rock mass to freely assess the block evacuation and fragile crack alongside the 3D CFD programming (ANSYS FLUENT) to decide the erosive limits. The erodibility file (for example, Kirsten index) is first created to survey excavatability, and the heaviness of the erodibility list boundaries is inapplicable for evaluating erodibility in hydraulic structures. In most cases, contradictions are observed between the erodibility predictions of existing methods and the observations made after dams are used for operation. An example is the erosion observed in the drainage channel of the Mokolo Dam in South Africa, where the erosion process generated a 30 m deep gully. In most semi-theoretical methods, limited data are used to assess erodibility. Results are limited and do not cover every type of geomechanical situation, and the hydraulic conditions are observed at the dam spillways around the world. In the aforementioned methods [18,21,24], the effects of spillway geometry, especially spillway surface roughness, are not comprehensively studied. The relationship between the geomechanical and hydraulic parameters is not elucidated.
Regarding the consideration of erosive force of water, the velocity of flowing water (V), shear stress applied to a rock surface (τb), unit stream power dissipation of water (ΠUD), stress intensity (KI) and lifting force (FL) have been used in several studies as the hazard parameters during erosion. A unique method for determining the erosive force of water for rock mass erodibility evaluation is lacking. The existing methods also have several limitations and can be used only in specific cases. For example, various equations exist to determine the unit stream power dissipation of water (ΠUD), which was developed as a parameter on the basis of the internal flow conditions. Stress intensity (KI) was initially developed for metallurgical cases and used only to determine the possibility of crack propagation in intact rocks but not in rock masses. In addition, stress intensity (KI), which is used in Bollaert’s method, is based on the maximum pressure in pool bottoms, in which Bollaert’s CFM method can compute pressure heads just under the centreline of jets but not the exact pressure of water applied to joint tips. Developments for unlined spillway structures are also lacking. In Bollaert’s DI approach, which is on the basis of impulsion and Newton’s second law, the geomechanical and geometrical parameters of rock masses are not comprehensively considered, and only block size is used. Shear force (Fsh) is deemed zero owing to the vertical fracture consideration. The single rock block models and Bollaert’s CSM are restricted when the fractures directions are not symmetrical and vertical. This situation is common in volcanic and heterogeneous rock types. Two-dimensional nonrectangular obstructs are as yet prohibitive in their capacity to have contact to a rock mass, and the procedure is intrinsically 3D. Table 14 illustrates the advantages and disadvantages of various approaches. Table 15 shows the detailed information references about erodibility phenomena.
7. Conclusions and Potential Future Research Direction
Several theoretical, semi-theoretical, semi-analytical, and numerical methods have been developed for evaluating rock mass erosion in hydraulic structures. Semi-theoretical methods should develop an erodibility index based on the geomechanical and hydraulic aspects of rock mass erosion.
In the case of semi-analytical methods, a detailed evaluation of the effect of each geomechanical parameter is not yet conducted. A unique method for determining the erosive parameter of water is not yet available. The existing semi-analytical methods developed in the case of the plunge pool could not be used for the spillway case. Applying these methods to each site is necessary to identify some constants that are difficult to determine.
The results from the application of existing approaches for the evaluation of the potential risk of rock mass erosion in dam spillways show that:
- (1)
- Between semi-theoretical approaches, the Pells’ RMEI approach has less error than other semi-theoretical approaches in the same category, despite its significant committed error.
- (2)
- Regarding semi-analytical methods, the CSM approach of Bollaert can be used as a representative method to analyse and evaluate the hydraulic erodibility phenomena in plunge pool cases despite existing difficulties in the preparation of its input data for each dam site. Because of the channel flow nature of this methodology, the principles of this method could be used to develop a new analytical approach in the case of unlined spillways, which could consider the spillway geometrical parameters and rock mass geomechanical parameters.
Moreover, the utilisation of computational fluid–structure interaction systems is highly recommended to perform a numerical evaluation of rock mass erodibility in future works by considering various geometrical parameters of the rock mass and hydraulic structures.
Development of a new or modification of existing methods for erosion prediction is crucial for dam spillway design. For this, the following topics should be addressed:
- (1)
- Defining the unique hydraulic erosive parameter;
- (2)
- Determining the effect of dam spillway geometrical parameters on a hydraulic erosive parameter (different flow channel profiles);
- (3)
- Determining the effect of rock mass geometrical parameters on a hydraulic erosive parameters (block volume, joint opening, dip, and dip direction);
- (4)
- Determining the effect of geomechanical parameters on a hydraulic erosive parameter;
- (5)
- Consideration of the shear force within the joints.
Author Contributions
Conceptualization, Y.J.K.; methodology, Y.J.K. and A.S.; software, Y.J.K.; validation, Y.J.K., A.S., M.-I.F. and M.Q.; formal analysis, Y.J.K.; investigation, Y.J.K.; resources, Y.J.K. and A.S.; writing—original draft preparation, Y.J.K.; writing—review and editing, Y.J.K., A.S., M.-I.F. and M.Q.; visualization, Y.J.K., A.S., M.-I.F. and M.Q.; supervision, A.S., M.-I.F. and M.Q.; project administration, A.S., M.-I.F. and M.Q.; funding acquisition, A.S. All authors have read and agreed to the published version of the manuscript.
Funding
This research was funded by: Natural Sciences and Engineering Research Council of Canada and Hydro-Québec (NSERC, Hydro-Quebec) [CRDPJ 537350-18]. Natural Sciences and Engineering Research Council of Canada (NSERC) [RGPIN-2019-06693].
Institutional Review Board Statement
Not applicable.
Informed Consent Statement
Not applicable.
Data Availability Statement
Not applicable.
Acknowledgments
The authors would like to thank the organizations that have funded this project: Natural Sciences and Engineering Research Council of Canada (NSERC) and Hydro-Quebec, and all those who helped us to improve the quality of this review.
Conflicts of Interest
The authors declare that they have no conflict of interest regarding the content of this document.
Abbreviation A. Symbol Notation List of Semi-Theoretical Methods
| Abbreviations | Definition | Unit |
| D | Disturbance factor | - |
| Unit stream power dissipation | KW/m2 | |
| Width of a flow section | m | |
| Sf | Friction slope or the gradient of the total hydraulic energy line | m |
| Edoa | Adjustment erosion, discontinuity orientation | - |
| Ei | Young’s modulus of intact rock | GPa |
| eGSI | Erodibility geological strength index | - |
| Erm | Rock mass deformation modulus | GPa |
| GSI | Geological strength index | - |
| Ja | Joint surface alteration number | - |
| Jn | Joint set number | - |
| Jo | Joint opening | mm |
| Jr | Joint roughness number | - |
| Js | Relative block structure | - |
| Kb | Rock block size number | - |
| Kd | Joint shear strength number | - |
| LF | Likelihood factor | - |
| Ms | Compressive strength number | - |
| N | Kirsten’s index | - |
| NPES | Nature of the potentially eroding surface | - |
| Pa | Available hydraulic stream power | kW/m2 |
| RF | Relative importance factor | - |
| RMR | Rock mass rating system | - |
| RMEI | Rock mass erosion index | - |
| RQD | Rock quality designation | - |
| S | Slope | (°) |
| UCS | Unconfined compressive strength | MPa |
| Vb | Rock block volume | m3 |
| σci | Uniaxial compressive strength | MPa |
Abbreviation B. Symbol Notation List of Analytical Methods
| Abbreviations | Definition | Unit |
| c | Mean pressure wave celerity | m/s |
| f | Frequency or boundary correction factor | Hz |
| g | Gravitational acceleration | m/s2 |
| Di | Jet diameter at issuance from the dam | m |
| Dj | Jet diameter at impacting point of plunge pool | m |
| T | Uniaxial tensile strength of rock | MPa |
| Tu | Longitudinal jet turbulence intensity | % |
| UCS | Uniaxial compressive strength of rock | MPa |
| Vi | Mean jet velocity at issuance from the dam | m/s |
| Vj | Mean jet velocity at impacting point of plunge pool | m/s |
| Y | Total plunge pool water depth | m |
| ys | Unit weight of rock or particle | N/m3 |
| Pmax | Maximum instantaneous fluctuating head | m |
| Inet | Net impulsion | kN·s |
| Fu | Force under the block | kN |
| Fo | Force over the block | kN |
| Gb | Submerged weight | kN |
| Fsh | Shear force | kN |
| Tup | Nondimensional time coefficient | - |
| CI | Nondimensional dynamic impulsion coefficient | - |
| Lf | Total length of fracture | m |
Appendix A

Table A1.
Result of the application of various semi-theoretical approaches on several case studies.
| Name | ΠUD (KW/m2) | N | eGSI | RMEI | Kirsten et al. (2000) [18] | Van Schalkwyk et al. (1994b) [29] | Annandale (1995) [21] | Pells [1] (eGSI) | Pells [1] (RMEI) | Observed |
|---|---|---|---|---|---|---|---|---|---|---|
| Ant.1 | 1.7 | 867 | 47 | 1188 | No Scour | Minor | Negligible | Negligible | Minor | Minor |
| Ant.2 | 0.8 | 575 | 47 | 243 | No Scour | Negligible | Negligible | Negligible | Negligible | Negligible |
| Ant.3 | 0.7 | 867 | 47 | 1440 | No Scour | Negligible | Negligible | Negligible | Minor | Minor |
| Ant.4 | 6.3 | 1902 | 42 | 1080 | No Scour | Negligible | Negligible | Minor | Minor | Moderate |
| App.1 | 2.6 | 206 | 45 | 648 | No Scour | Minor | Negligible | Minor | Negligible | Negligible |
| App.2 | 15 | 206 | 43 | 648 | No Scour | Minor | Minor | Moderate | Minor | Minor |
| Bro.1 | 6.4 | 3720 | 67 | 1440 | No Scour | Negligible | Negligible | Negligible | Moderate | Minor |
| Bro.2 | 28 | 2753 | 67 | 1296 | No Scour | Negligible | Minor | Minor | Moderate | Moderate |
| Bro.3 | 42 | 2232 | 55 | 1152 | No Scour | Minor | Minor | Moderate | Moderate | Moderate |
| Bro.4 | 56 | 2232 | 53 | 1080 | No Scour | Minor | Minor | Moderate | Moderate | Moderate |
| Bro.5 | 28 | 5634 | 65 | 432 | No Scour | Negligible | Negligible | Negligible | Minor | Negligible |
| Bro.6 | 37 | 7018 | 77 | 144 | No Scour | Negligible | Negligible | Negligible | Negligible | Minor |
| Bro 7 | 56 | 2423 | 55 | 1440 | No Scour | Negligible | Minor | Moderate | Large | Large |
| Bur.1 | 165 | 11413 | 82 | 252 | No Scour | Negligible | Minor | Negligible | Negligible | Negligible |
| Bur.2 | 165 | 7855 | 80 | 288 | No Scour | Negligible | Minor | Negligible | Minor | Negligible |
| Bur.3 | 165 | 6087 | 60 | 972 | No Scour | Negligible | Minor | Moderate | Moderate | Moderate |
| Bur.4 | 165 | 3652 | 40 | 1890 | No Scour | Negligible | Minor | Extensive | Extensive | Large |
| Cat.1 | 60 | 3709 | 72 | 567 | No Scour | Negligible | Minor | Negligible | Minor | Minor |
| Cat.2 | 60 | 3709 | 72 | 126 | No Scour | Negligible | Minor | Negligible | Negligible | Negligible |
| Cat.3 | 60 | 3709 | 72 | 567 | No Scour | Negligible | Minor | Minor | Minor | Large |
| Cop.1 | 5.7 | 723 | 35 | 1620 | No Scour | Minor | Negligible | Minor | Moderate | Moderate |
| Cop.2 | 4.7 | 8379 | 70 | 1755 | No Scour | Negligible | Negligible | Negligible | Moderate | Minor |
| Cop.3 | 14 | 8379 | 65 | 1620 | No Scour | Negligible | Negligible | Negligible | Moderate | Moderate |
| Cop.4 | 34.7 | 3724 | 32 | 1755 | No Scour | Negligible | Minor | Large | Large | Large |
| Cop.5 | 76.1 | 3724 | 32 | 1755 | No Scour | Negligible | Minor | Extensive | Extensive | Extensive |
| Cop.6 | 47.1 | 3724 | 25 | 1755 | No Scour | Negligible | Minor | Extensive | Extensive | Extensive |
| Cop.7 | 66.1 | 3724 | 32 | 1755 | No Scour | Negligible | Minor | Moderate | Extensive | Moderate |
| Cop.8 | 95 | 7914 | 67 | 1485 | No Scour | Negligible | Minor | Minor | Large | Moderate |
| Cop.9 | 168 | 3724 | 32 | 1755 | No Scour | Negligible | Minor | Extensive | Extensive | Large |
| Cop.10 | 650 | 3724 | 25 | 1755 | Scour | Negligible | Extensive | Extensive | Extensive | Extensive |
| Cop.11 | 10 | 723 | 35 | 1620 | No Scour | Minor | Minor | Moderate | Moderate | Minor |
| Cop.12 | 97 | 8379 | 70 | 1350 | No Scour | Negligible | Minor | Minor | Large | Moderate |
| Cop.13 | 145 | 8379 | 65 | 1350 | No Scour | Negligible | Minor | Moderate | Large | Moderate |
| Dar.1 | 18 | 4510 | 52 | 504 | No Scour | Negligible | Negligible | Minor | Minor | Minor |
| Dar.2 | 18 | 4510 | 52 | 1080 | No Scour | Negligible | Negligible | Moderate | Moderate | Moderate |
| Dar.3 | 18 | 4510 | 52 | 972 | No Scour | Negligible | Negligible | Moderate | Minor | Moderate |
| Dar.5 | 9 | 4539 | 60 | 648 | No Scour | Negligible | Negligible | Minor | Minor | Minor |
References
- Pells, S. Erosion of Rock in Spillways. Ph.D. Thesis, UNSW Sydney, Sydney, Australia, 2016. Available online: http://handle.unsw.edu.au/1959.4/56008 (accessed on 8 November 2021).
- Rock, A.J. Semi-Empirical Assessment of Plunge Pool Scour: Two-Dimensional Application of Annandale’s Erodibility Index Method on Four Dams in British Columbia, Canada, A; Colorado School of Mines. Arthur Lakes Library: Golden, CO, USA, 2015. [Google Scholar]
- Bollaert, E. The Comprehensive Scour Model: Theory and Feedback from Practice. In Proceedings of the 5th International Conference on Scour and Erosion, San Francisco, CA, USA, 7–10 November 2010. [Google Scholar]
- Atkinson, B.K. Fracture Mechanics of Rock; Academic Press: Cambridge, MA, USA, 1987. [Google Scholar]
- Mason, P.J.; Arumugam, K. Free Jet Scour Below Dams and Flip Buckets. J. Hydraul. Eng. 1985, 111, 220–235. [Google Scholar] [CrossRef]
- Akhmedov, T.K. Calculation of the depth of scour in rock dowstream of a spillway. Int. Water Power Dam. Constr. 1988, 40, 25–27. [Google Scholar]
- Breusers, H.; Raudkivi, A. Scouring. IAHR Hydraulic Structures Design Manual 2; AA Balkema: Rotterdam, The Netherlands, 1991. [Google Scholar]
- Aderibigbe, O.; Rajaratnam, N. Erosion of loose beds by submerged circular impinging vertical turbulent jets. J. Hydraul. Res. 1996, 34, 19–33. [Google Scholar] [CrossRef]
- Tan, S.; Raudkivi, A. Erosion of Cohesive Soils: A Report Submitted to the National Water and Soil Conservation Authority; Department of Civil Engineering, University of Auckland: Auckland, New Zealand, 1984. [Google Scholar]
- Kamphuis, J.W. Influence of sand or gravel on the erosion of cohesive sediment. J. Hydraul. Res. 1990, 28, 43–53. [Google Scholar] [CrossRef]
- Hanson, G.J. Surface Erodibility of Earthen Channels at High Stresses Part I—Open Channel Testing. Trans. ASAE 1990, 33, 0127–0131. [Google Scholar] [CrossRef]
- Hairsine, P.B.; Rose, C.W. Modeling water erosion due to overland flow using physical principles: 1. Sheet flow. Water Resour. Res. 1992, 28, 237–243. [Google Scholar] [CrossRef]
- Moren, L.; Sjoberg, J. Rock Erosion in Spillway Channels—A Case Study of the Ligga Spillway. In 11th ISRM Congress; OnePetro: Lisbon, Portugal, 2007. [Google Scholar]
- Hahn, W.; Drain, M. Investigation of the erosion potential of kingsley dam emergency spillway. In Proceedings of the Joint Annual Meeting and Conference of AIPG, AGWT, and the Florida Section of AIPG, Orlando, FL, USA, 11–15 September 2010. [Google Scholar]
- Pells, S.E.; Pells, P.J.; Peirson, W.L.; Douglas, K.; Fell, R. Erosion of unlined spillways in rock—Does a “scour threshold” exist? In Contemporary Challenges for Dams. Proceedings of the Annual Australian National Committee on Large Dams Conference; ANCOLD: Brisbane, Australia, 2015; Volume 4. [Google Scholar]
- Annandale, G.W.; Wittler, R.J.; Ruff, J.F.; Lewis, T.M. Prototype validation of erodibility index for scour in fractured rock media. In Proceedings of the International Water Resources Engineering Conference (ASCE), Memphis, TN, USA, 3–7 August 1998. [Google Scholar]
- Annandale, G.W.; Kirsten, H.A. On the erodibility of rock and other earth materials. In Hydraulic Engineering; ASCE: Reston, VA, USA, 1994. [Google Scholar]
- Kirsten, H.A.; Moore, J.S.; Kirsten, L.H.; Temple, D.M. Erodibility criterion for auxiliary spillways of dams. Int. J. Sediment Res. 2000, 15, 93–107. [Google Scholar]
- Cengel, Y.A.; Cimbala, J.M. Fluid Mechanics: Fundamentals and Applications, 3rd ed.; CRC Press: Boca Raton, FL, USA, 2015. [Google Scholar]
- Annandale, G.W. Scour Technology: Mechanics and Engineering Practice; McGraw-Hill: New York, NY, USA, 2006. [Google Scholar]
- Annandale, G. Erodibility. J. Hydraul. Res. 1995, 33, 471–494. [Google Scholar] [CrossRef]
- Pitsiou, S. The Effect of Discontinuities on the Erodibility of Rock in Unlined Spillways of Dams; University of Pretoria: Pretoria, South Africa, 1990. [Google Scholar]
- Moore, J. The Characterization of Rock for Hydraulic Erodibility. In Technical Release; USDA: Washington, DC, USA, 1991; Volume 78. [Google Scholar]
- Van Schalkwyk, A.; Jordaan, J.; Dooge, N. Erosion of rock in unlined spillways. Int. Comm. Large Dams, Paris Q 1994, 71, 555–571. [Google Scholar]
- Bieniawski, Z. Engineering classification of jointed rock masses. Civ. Eng. South Afr. 1973, 15, 335–343. [Google Scholar]
- Barton, N.; Lien, R.; Lunde, J. Engineering classification of rock masses for the design of tunnel support. Rock Mech. Rock Eng. 1974, 6, 189–236. [Google Scholar] [CrossRef]
- Kirsten, H. A classification system for excavating in natural materials. Civ. Eng. Siviele Ing. 1982, 24, 293–308. [Google Scholar]
- Kirsten, H. Case histories of groundmass characterization for excavatability. In Rock Classification Systems for Engineering Purposes; ASTM International: West Conshohocken, PA, USA, 1988. [Google Scholar]
- Van Schalkwyk, A.; Jordaan, J.; Dooge, N. Die Erodeerbaarheid Van Verskillende Rotsformasies Onder Varierende Vloeitoestande (No. WNK Verslag No. 302/1/95). Verslag Aan Die Waternavorsingskommissie Deur Die Departement of Geologie, Universiteit Van Pretoria, South Africa; Universiteit Van Pretoria: Pretoria, South Africa, 1994. [Google Scholar]
- Dooge, N. Die Hidrouliese Erodeerbaarheid Van Rotsmassas in Ombelynde Oorlope Met Spesiale Verwysing Na Die Rol Van Naatvulmateriaal; University of Pretoria1: Pretoria, South Africa, 1993. [Google Scholar]
- Moore, J.S.; Temple, D.M.; Kirsten, H. Headcut advance threshold in earth spillways. Bull. Assoc. Eng. Geol. 1994, 31, 277–280. [Google Scholar]
- Jennings, J.; Brink, A.B.A.; Williams, A. Revised guide to soil profiling for civil engineering purposes in Southern Africa. Civil Eng. Siviele Ing. 1917, 15, 3–13. [Google Scholar]
- CECIL III, Owen Sinclair. Correlations of Rock Bolt-Shotcrete Support and Rock Quality Parametersin Scandinavian Tunnels; University of Illinois at Urbana-Champaign: Champaign, IL, USA, 1970. [Google Scholar]
- Bandpey, A.K.; Shahriar, K.; Sharifzadeh, M.; Marefvand, P. Validation of 3D discrete fracture network model focusing on areal sampling methods—A case study on the powerhouse cavern of Rudbar Lorestan pumped storage power plant, Iran. Geomech. Eng. 2018, 16, 21–34. [Google Scholar]
- Boumaiza, L.; Saeidi, A.; Quirion, M. Determining relative block structure rating for rock erodibility evaluation in the case of non-orthogonal joint sets. J. Rock Mech. Geotech. Eng. 2018, 11, 72–87. [Google Scholar] [CrossRef]
- Hoek, E.; Kaiser, P.; Bawden, W. Support of Underground Excavations in Hard Rock AA BALKEMA; Rotterdam/Brookfield: Rotterdam, The Netherlands, 1995. [Google Scholar]
- Bieniawski, Z. Rock mass classification in rock engineering applications. In Proceedings of the a Symposium on Exploration for Rock Engineering, Johannesburg, South Africa, 1–5 November 1976. [Google Scholar]
- Saeidi, A.; Eslami, E.; Quirion, M.; Seifaddini, M. Assessment of rock mass erosion in unlined spillways using developed vulnerability and fragility functions. Georisk Assess. Manag. Risk Eng. Syst. Geohazards 2019, 14, 280–292. [Google Scholar] [CrossRef]
- Douglas, K.; Pells, S.; Fell, R.; Peirson, W. The influence of geological conditions on erosion of unlined spillways in rock. Q. J. Eng. Geol. Hydrogeol. 2018, 51, 219–228. [Google Scholar] [CrossRef]
- Jaeger, C. Uber die Aehnlichkeit bei flussaulichen Modellversuchen. Wasserkr. Wasserwirtsch. 1939, 34, 269. [Google Scholar]
- Yu, C. Investigation of scour and air entrainment by falling jets downstream of dam. J. Hydraul. Eng. 1963, 2, 294–301. [Google Scholar]
- Damle, P.; Venkatraman, C.; Desai, S. Evaluation of scour below ski-jump buckets of spillways. In Proceedings of the CWPRS Golden Jubilee Symposia, Poona, India, 23–25 January 1966. [Google Scholar]
- Mirtskhulava, T. Mechanism and Computation of Local and General Scour in Non-Cohesive, Cohesive Soils and Rock Beds; International Association for Hydraulic Research: Fort Collins, CO, USA, 1967; Volume 3, pp. 169–176. [Google Scholar]
- Martins, R. Scouring of rocky river beds by free jet spillways. Int. Water Power Dam. Constr. 1975, 27, 152–153. [Google Scholar]
- Taraimovich, I.I. Deformations of channels below high-head spillways on rock foundations. Power Technol. Eng. 1978, 12, 917–923. [Google Scholar] [CrossRef]
- Mason, P.J. Effects of Air Entrainment on Plunge Pool Scour. J. Hydraul. Eng. 1989, 115, 385–399. [Google Scholar] [CrossRef]
- Liu, P. Mechanism of Free Jet’s Scour on Rocky River-Beds; Higher Education Press: Beijing, China, 1994. [Google Scholar]
- Chen, J.; Shi, B.; Wang, Q. 3-D network numerical modeling technique for random discontinuities of rock mass. Chin. J. Geotech. Eng. Chin. Ed. 2001, 23, 397–402. [Google Scholar]
- Bombardelli, F.A.; Gioia, G. Scouring of granular beds by jet-driven axisymmetric turbulent cauldrons. Phys. Fluids 2006, 18, 088101. [Google Scholar] [CrossRef] [Green Version]
- Castillo, L.G.; Carrillo, J.M. Scour, Velocities and Pressures Evaluations Produced by Spillway and Outlets of Dam. Water 2016, 8, 68. [Google Scholar] [CrossRef] [Green Version]
- Hartung, W. Die kolkbildung hinter überstromen wehren im hinblick auf eine beweglich sturzbettgestaltung. Die Wasser Wirtsch. 1959, 49, 309–313. [Google Scholar]
- Chee, S.; Padiyar, P. Erosion at the base of flip buckets. Eng. J. Can. 1969, 52, 22–24. [Google Scholar]
- Bisaz, E.; Tschopp, J. Profundidad de erosión al pie de un vertedero para la aplicación de corrección de arroyos en quebradas empinadas. In Proceedings of the Fifth Congreso Latinoamericano de Hidraulica (IAHR), Lima, Peru, 23–28 October 1972. [Google Scholar]
- Machado, L. O Sistema de Dissipacao de Energia Proposto para a Barragem de Xingo. In Transactions of the International Symposium on the Layout of Dams in Narrow Gorges; ICOLD: Rio de Janeiro, Brazil, 1982. [Google Scholar]
- Ervine, D.; Falvey, H.; Withers, W. Pressure fluctuations on plunge pool floors. J. Hydraul. Res. 1997, 35, 257–279. [Google Scholar] [CrossRef]
- Bollaert, E. Wall jet rock scour in plunge pools: A quasi-3D prediction model. Intl. J. Hydropower Dams 2012, 20. Available online: https://www.aquavision-eng.ch/index_htm_files/Quasi-3D%20scour%20model_HPD_2012.pdf (accessed on 1 October 2021).
- Bollaert, E.; Munodawafa, M.; Mazvidza, D. Kariba Dam Plunge Pool Scour: Quasi-3D Numerical Predictions. La Houille Blanche 2013, 1, 42–49. [Google Scholar] [CrossRef]
- Maleki, S.; Fiorotto, V. Blocks Stability in Plunge Pools under Turbulent Rectangular Jets. J. Hydraul. Eng. 2019, 145, 04019007. [Google Scholar] [CrossRef]
- Bollaert, E.; Schleiss, A. Transient Water Pressures in Joints and Formation of Rock Scour Due to High-Velocity Jet Impact; EPFL-LCH: Lausanne, Switzerland, 2002. [Google Scholar]
- Bollaert, E.F.; Lesleighter, E.J. Spillway rock scour experience and analysis-the Australian scene over the past four decades. In 11th National Conference on Hydraulics in Civil Engineering & 5th International Symposium on Hydraulic Structures: Hydraulic Structures and Society-Engineering Challenges and Extremes; Engineers Australia: Patton, Australia, 2014. [Google Scholar]
- Bollaert, E.F.R.; Schleiss, A.J. Physically Based Model for Evaluation of Rock Scour due to High-Velocity Jet Impact. J. Hydraul. Eng. 2005, 131, 153–165. [Google Scholar] [CrossRef]
- Bollaert, E.; Schleiss, A. Scour of rock due to the impact of plunging high velocity jets Part I: A state-of-the-art review. J. Hydraul. Res. 2003, 41, 451–464. [Google Scholar] [CrossRef]
- Bollaert, E. A comprehensive model to evaluate scour formation in plunge pools. Int. J. Hydropower Dams 2004, 11, 94–101. [Google Scholar]
- Bollaert, E.; Harris, J.; Whitehouse, R.; Moxon, S. Simplified comprehensive scour model compared to erodibility index method. In Proceedings of the ICSE 2016 8th International Conference on Scour and Erosion, Oxford, UK, 12–15 September 2016; pp. 549–558. [Google Scholar]
- Ewalds, H.; Wanhill, R. Fracture Mechanics-Delft; Delftse UM: London, UK, 1986. [Google Scholar]
- Paris, P.C. A rational analytic theory of fatigue. Trend Eng. 1961, 13, 9. [Google Scholar]
- Atkinson, B.K. Subcritical crack growth in geological materials. J. Geophys. Res. Space Phys. 1984, 89, 4077–4114. [Google Scholar] [CrossRef]
- Bollaert, E.; Morel, F.; Blancher, B.; Lucquiaud, P. Scour potential at Laouzas Dam. In Proceedings of the ICSE 8th International Conference on Scour and Erosion, Oxford, UK, 12–15 September 2016. [Google Scholar]
- Pan, Y.-W.; Li, K.-W.; Liao, J.-J. Mechanics and response of a surface rock block subjected to pressure fluctuations: A plucking model and its application. Eng. Geol. 2014, 171, 1–10. [Google Scholar] [CrossRef]
- Bollaert, E.; Annandale, G.; Schleiss, A. Scour of Rock Due to High-Velocity Jet Impact: A Physically Based Scour Model Compared to Annandale’s Erodibility Index Method; Swets & Zeitlinger: Lisse, The Netherlands, 2002; pp. 187–199. ISBN 90-5809-518-5. [Google Scholar]
- Annandale, G.W. Rock Plunge Pools: A Design Approach for Limiting Scour Extent. In Proceedings of the 2nd International Conference on Scour and Erosion (ICSE-2), Singapore, 14–17 November 2004. [Google Scholar]
- Manso, P.F.D.A. The Influence of Pool Geometry and Induced Flow Patterns in Rock Scour by High-Velocity Plunging Jets; EPFL: Lausanne, Switzerland, 2006. [Google Scholar]
- Xavier Meriade Duarte, R. Influence of Air Entrainment on Rock Scour Development and Block Stability in Plunge Pools; EPFL: Lausanne, Switzerland, 2014. [Google Scholar]
- Duarte, R.; Pinheiro, A.; Schleiss, A.J. An Enhanced Physically Based Scour Model for Considering Jet Air Entrainment. Engineering 2016, 2, 294–301. [Google Scholar] [CrossRef] [Green Version]
- Asadollahi, P. Stability Analysis of a Single Three Dimensional Rock Block: Effect of Dilatancy and High-Velocity Water Jet Impact; The University of Texas at Austin: Austin, TX, USA, 2009. [Google Scholar]
- Federspiel, M.; Bollaert, E.; Schleiss, A. Response of an intelligent block to symmetrical core jet impact. In 33rd IAHR Congress “Water Engineering for a Sustainable Environment”; IAHR: Madrid, Spain, 2009. [Google Scholar]
- Federspiel, M.P.E.A.; Bollaert, E.; Schleiss, A. Dynamic response of a rock block in a plunge pool due to asymmetrical impact of a high-velocity jet. In Proceedings of the 34th World Congress of the International Association for Hydro-Environment Research and Engineering: 33rd Hydrology and Water Resources Symposium and 10th Conference on Hydraulics in Water Engineering; Engineers Australia: Patton, Australia, 2011. [Google Scholar]
- Asadollahi, P.; Tonon, F.; Federspiel, M.P.; Schleiss, A.J. Prediction of rock block stability and scour depth in plunge pools. J. Hydraul. Res. 2011, 49, 750–756. [Google Scholar] [CrossRef] [Green Version]
- Martins, R. Contribution to the knowledge on the scour action of free jets on rocky river beds. In Proceedings of the 11th Congress on Large Dams: Madrid, Spain, 11–15 June 1973. [Google Scholar]
- Tonon, F. Analysis of single rock blocks for general failure modes under conservative and non-conservative forces. Int. J. Numer. Anal. Methods Géoméch. 2007, 31, 1567–1608. [Google Scholar] [CrossRef]
- Bollaert, E.F.R. Numerical Modeling of Scour at Bridge Foundations on Rock. Scour Eros. 2010, 767–776. [Google Scholar] [CrossRef]
- Reinius, E. Rock erosion. Int. Water Power Dam. Constr. 1986, 38, 43–48. [Google Scholar]
- George, M.F. 3D Block Erodibility: Dynamics of Rock-Water Interaction in Rock Scour; UC Berkeley: Berkeley, CA, USA, 2015. [Google Scholar]
- Beltaos, S.; Rajaratnam, N. Plane turbulent impinging jets. J. Hydraul. Res. 1973, 11, 29–59. [Google Scholar] [CrossRef]
- Hartung, F.; Häusler, E. Scours, Stilling Basins and Downstream Protection under Free Overfall Jets at Dams. In Proceedings of the 11th ICOLD, Madrid, Spain, 11–15 June 1973; Volume 12. [Google Scholar]
- Reich, F. Umlenkung eines Freien Flüssigkeitsstrahles an einer ebenen Platte. Z. Ver. Dtsch. Ing. 1927, 71, 261–264. [Google Scholar]
- Lesleighter, E.; Bollaert, E.; McPherson, B.; Scriven, D. Spillway Rock Scour Analysis-Composite of Physical & Numerical Modelling, Paradise Dam, Australia. In Hydraulic Structures and Water System Management. 6th IAHR International Symposium on Hydraulic Structures, Portland, OR, USA, 27–30 June 2016; Crookston, B., Tullis, B., Eds.; USU Library: Logan, UT, USA, 2016; pp. 343–352. ISBN 978-1-884575-75-4. [Google Scholar] [CrossRef]
- Wibowo, J.; Lin, J. Stability Analysis of Spillways: Toward a Computational Approach. In Powerpoint Presentation Taken from the Internet; USRMS: San Francisco, CA, USA, 2009. [Google Scholar]
- Goodman, R.E.; Shi, G.-H. Block Theory and Its Application to Rock Engineering; OSTI.GOV: Oak Ridge, TN, USA, 1985.
- Li, A.; Liu, P. Mechanism of rock-bed scour due to impinging jet. J. Hydraul. Res. 2010, 48, 14–22. [Google Scholar] [CrossRef]
- Dasgupta, B.; Basu, D.; Das, K.; Green, R. Development of computational methodology to assess erosion damage in dam spillways. In Proceedings of the 31st Annual United States Society on Dam Conference, San Diego, CA, USA, 11–15 April 2011. [Google Scholar]
- George, M.F.; Sitar, N. Block Theory Application to Scour Assessment of Unlined Rock Spillways; Report No UCB GT; University of California: Los Angeles, CA, USA, 2012; p. 12-02. [Google Scholar]
- George, M.F.; Sitar, N. System reliability approach for rock scour. Int. J. Rock Mech. Min. Sci. 2016, 85, 102–111. [Google Scholar] [CrossRef] [Green Version]
- Gardner, M.H. Development of a Coupled 3-D DEM-LBM Model for Simulation of Dynamic Rock-Fluid Interaction; University of California: Berkeley, CA, USA, 2018. [Google Scholar]
- Franke, P. L’affouillement: Mécanisme et Formes; Oesterreichische Wasserwirtschaft: Wien, Austria, 1960. [Google Scholar]
- Mih, W.C. Equations for Axisymmetric and Twodimensional Turbulent Jets. J. Hydraul. Eng. 1989, 115, 1715–1719. [Google Scholar] [CrossRef]
- Hoffmans, G.J. Jet scour in equilibrium phase. J. Hydraul. Eng. 1998, 124, 430–437. [Google Scholar] [CrossRef]
- Arnaboldi, C.; Artusa, D.; Avignone, F., III; Balata, M.; Bandac, I.; Barucci, M.; Beeman, J.; Brofferio, C.; Bucci, C.; Capelli, S. New Limit on the Neutrinoless β β Decay of Te 130. Phys. Rev. Lett. 2005, 95, 142501. [Google Scholar] [CrossRef] [Green Version]
- Pagliara, S.; Amidei, M.; Hager, W.H. Hydraulics of 3D Plunge Pool Scour. J. Hydraul. Eng. 2008, 134, 1275–1284. [Google Scholar] [CrossRef]
- Pagliara, S.; Hager, W.H.; Unger, J. Temporal Evolution of Plunge Pool Scour. J. Hydraul. Eng. 2008, 134, 1630–1638. [Google Scholar] [CrossRef] [Green Version]
- Hoffmans, I.G.J. Closure problem to jet scour. J. Hydraul. Res. 2009, 47, 100–109. [Google Scholar] [CrossRef]
- Bollaert, E. Penstock Scour Formation At Bluestone Dam. In Proceedings of the 31st Annual USSD Conference and Exibition, San Diego, CA, USA, 11–15 April 2011. [Google Scholar]
- Pan, H.; Wang, R.; Huang, J.; Ou, G. Study on the ultimate depth of scour pit downstream of debris flow sabo dam based on the energy method. Eng. Geol. 2013, 160, 103–109. [Google Scholar] [CrossRef]
- Huang, M.; Liao, J.; Pan, Y.; Cheng, M. Modifications of the Erodibility Index Method for the Evaluation of the Soft Bedrock Erosion. In 47th US Rock Mechanics/Geomechanics Symposium; American Rock Mechanics Association: Alexandria, VA, USA, 2013. [Google Scholar]
- Tanaka, N.; Sato, M. Scoured depth and length of pools and ditches generated by overtopping flow from embankments during the 2011 Great East Japan Tsunami. Ocean Eng. 2015, 109, 72–82. [Google Scholar] [CrossRef]
- Lai, X.; Yin, D.; Finlayson, B.; Wei, T.; Li, M.; Yuan, W.; Yang, S.; Dai, Z.; Gao, S.; Chen, Z. Will river erosion below the Three Gorges Dam stop in the middle Yangtze? J. Hydrol. 2017, 554, 24–31. [Google Scholar] [CrossRef]
- Wüthrich, D.; Chamoun, S.; Bollaert, E.; De Cesare, G.; Schleiss, A.J. Hybrid Modelling Approach to Study Scour Potential at Chancy-Pougny Dam Stilling Basin. In Advances in Hydroinformatics; Springer: Singapore, 2018; pp. 869–884. [Google Scholar]
- Wu, T.; Pan, C.; Li, C.; Luo, M.; Wang, X. A field investigation on ephemeral gully erosion processes under different upslope inflow and sediment conditions. J. Hydrol. 2019, 572, 517–527. [Google Scholar] [CrossRef]
- Bi, N.; Sun, Z.; Wang, H.; Wu, X.; Fan, Y.; Xu, C.; Yang, Z. Response of channel scouring and deposition to the regulation of large reservoirs: A case study of the lower reaches of the Yellow River (Huanghe). J. Hydrol. 2018, 568, 972–984. [Google Scholar] [CrossRef]
- Dong, Y.; Xiong, D.; Su, Z.; Duan, X.; Lu, X.; Zhang, S.; Yuan, Y. The influences of mass failure on the erosion and hydraulic processes of gully headcuts based on an in situ scouring experiment in Dry-hot valley of China. Catena 2019, 176, 14–25. [Google Scholar] [CrossRef]
- Rong, G.; Tan, J.; Zhan, H.; He, R.; Zhang, Z. Quantitative evaluation of fracture geometry influence on nonlinear flow in a single rock fracture. J. Hydrol. 2020, 589, 125162. [Google Scholar] [CrossRef]
- Palermo, M.; Pagliara, S.; Bombardelli, F.A. Theoretical Approach for Shear-Stress Estimation at 2D Equilibrium Scour Holes in Granular Material due to Subvertical Plunging Jets. J. Hydraul. Eng. 2020, 146, 04020009. [Google Scholar] [CrossRef]
- Palermo, M.; Bombardelli, F.A.; Pagliara, S.; Kuroiwa, J. Time-dependent scour processes on granular beds at large scale. Environ. Fluid Mech. 2021, 21, 791–816. [Google Scholar] [CrossRef]
- Gioia, G.; Bombardelli, F.A. Localized Turbulent Flows on Scouring Granular Beds. Phys. Rev. Lett. 2005, 95, 014501. [Google Scholar] [CrossRef] [Green Version]
- Boumaiza, L.; Saeidi, A.; Quirion, M. A method to determine relevant geomechanical parameters for evaluating the hydraulic erodibility of rock. J. Rock Mech. Geotech. Eng. 2019, 11, 1004–1018. [Google Scholar] [CrossRef]
- Boumaiza, L.; Saeidi, A.; Quirion, M. A method to determine the relative importance of geological parameters that control the hydraulic erodibility of rock. Q. J. Eng. Geol. Hydrogeol. 2021, 54, qjegh2020-154. [Google Scholar] [CrossRef]
- Koulibaly, A.S.; Saeidi, A.; Rouleau, A.; Quirion, M. Identification of Hydraulic Parameters Influencing the Hydraulic Erodibility of Spillway Flow Channels. Water 2021, 13, 2950. [Google Scholar] [CrossRef]
Figure 1.
Main mechanical processes of rock erosion and the occurrence timescale [3].
Figure 1.
Main mechanical processes of rock erosion and the occurrence timescale [3].

Figure 2.
Classifications of the scour prediction methods.

Figure 3.
(a) Variation of properties over a differential flow section in an open channel. (b) Cross-sectional view of the flow channel [19].
Figure 3.
(a) Variation of properties over a differential flow section in an open channel. (b) Cross-sectional view of the flow channel [19].

Figure 4.
(a) Original dataset as presented in the study of Van Schalkwyk [24]; (b) after inclusion of data from Moore [24]; (c) scour threshold line presented by Annandale; (d) comparison of scour threshold lines.

Figure 5.
(a) Erosion classes determined according to the eGSI index; (b) erosion classes determined according to the RMEI index [39].
Figure 5.
(a) Erosion classes determined according to the eGSI index; (b) erosion classes determined according to the RMEI index [39].

Figure 6.
Scheme of scour in semi-theoretical methods [50].
Figure 6.
Scheme of scour in semi-theoretical methods [50].

Figure 7.
Description of CSM.


Figure 9.
(a) Diversity of the mean dynamic pressure coefficient (along the jet centre line) as a performance of the dimensionless ratio of [55]; (b) nondimensional root-mean-square dynamic pressure coefficient for jet velocities higher than 20 m/s [62].

Figure 10.
Encountered rock mass layer circumstances for (a) irregularly and (b) totally jointed rocks; (c) proposed structure for the essential geometrical designs of the discontinuously jointed rock [59].
Figure 10.
Encountered rock mass layer circumstances for (a) irregularly and (b) totally jointed rocks; (c) proposed structure for the essential geometrical designs of the discontinuously jointed rock [59].

Figure 11.
CFM flowchart.

Figure 12.
DI flowchart.

Figure 13.
Conceptualisation of impulse dynamics on a block, based on the Bollaert DI method [59].
Figure 13.
Conceptualisation of impulse dynamics on a block, based on the Bollaert DI method [59].


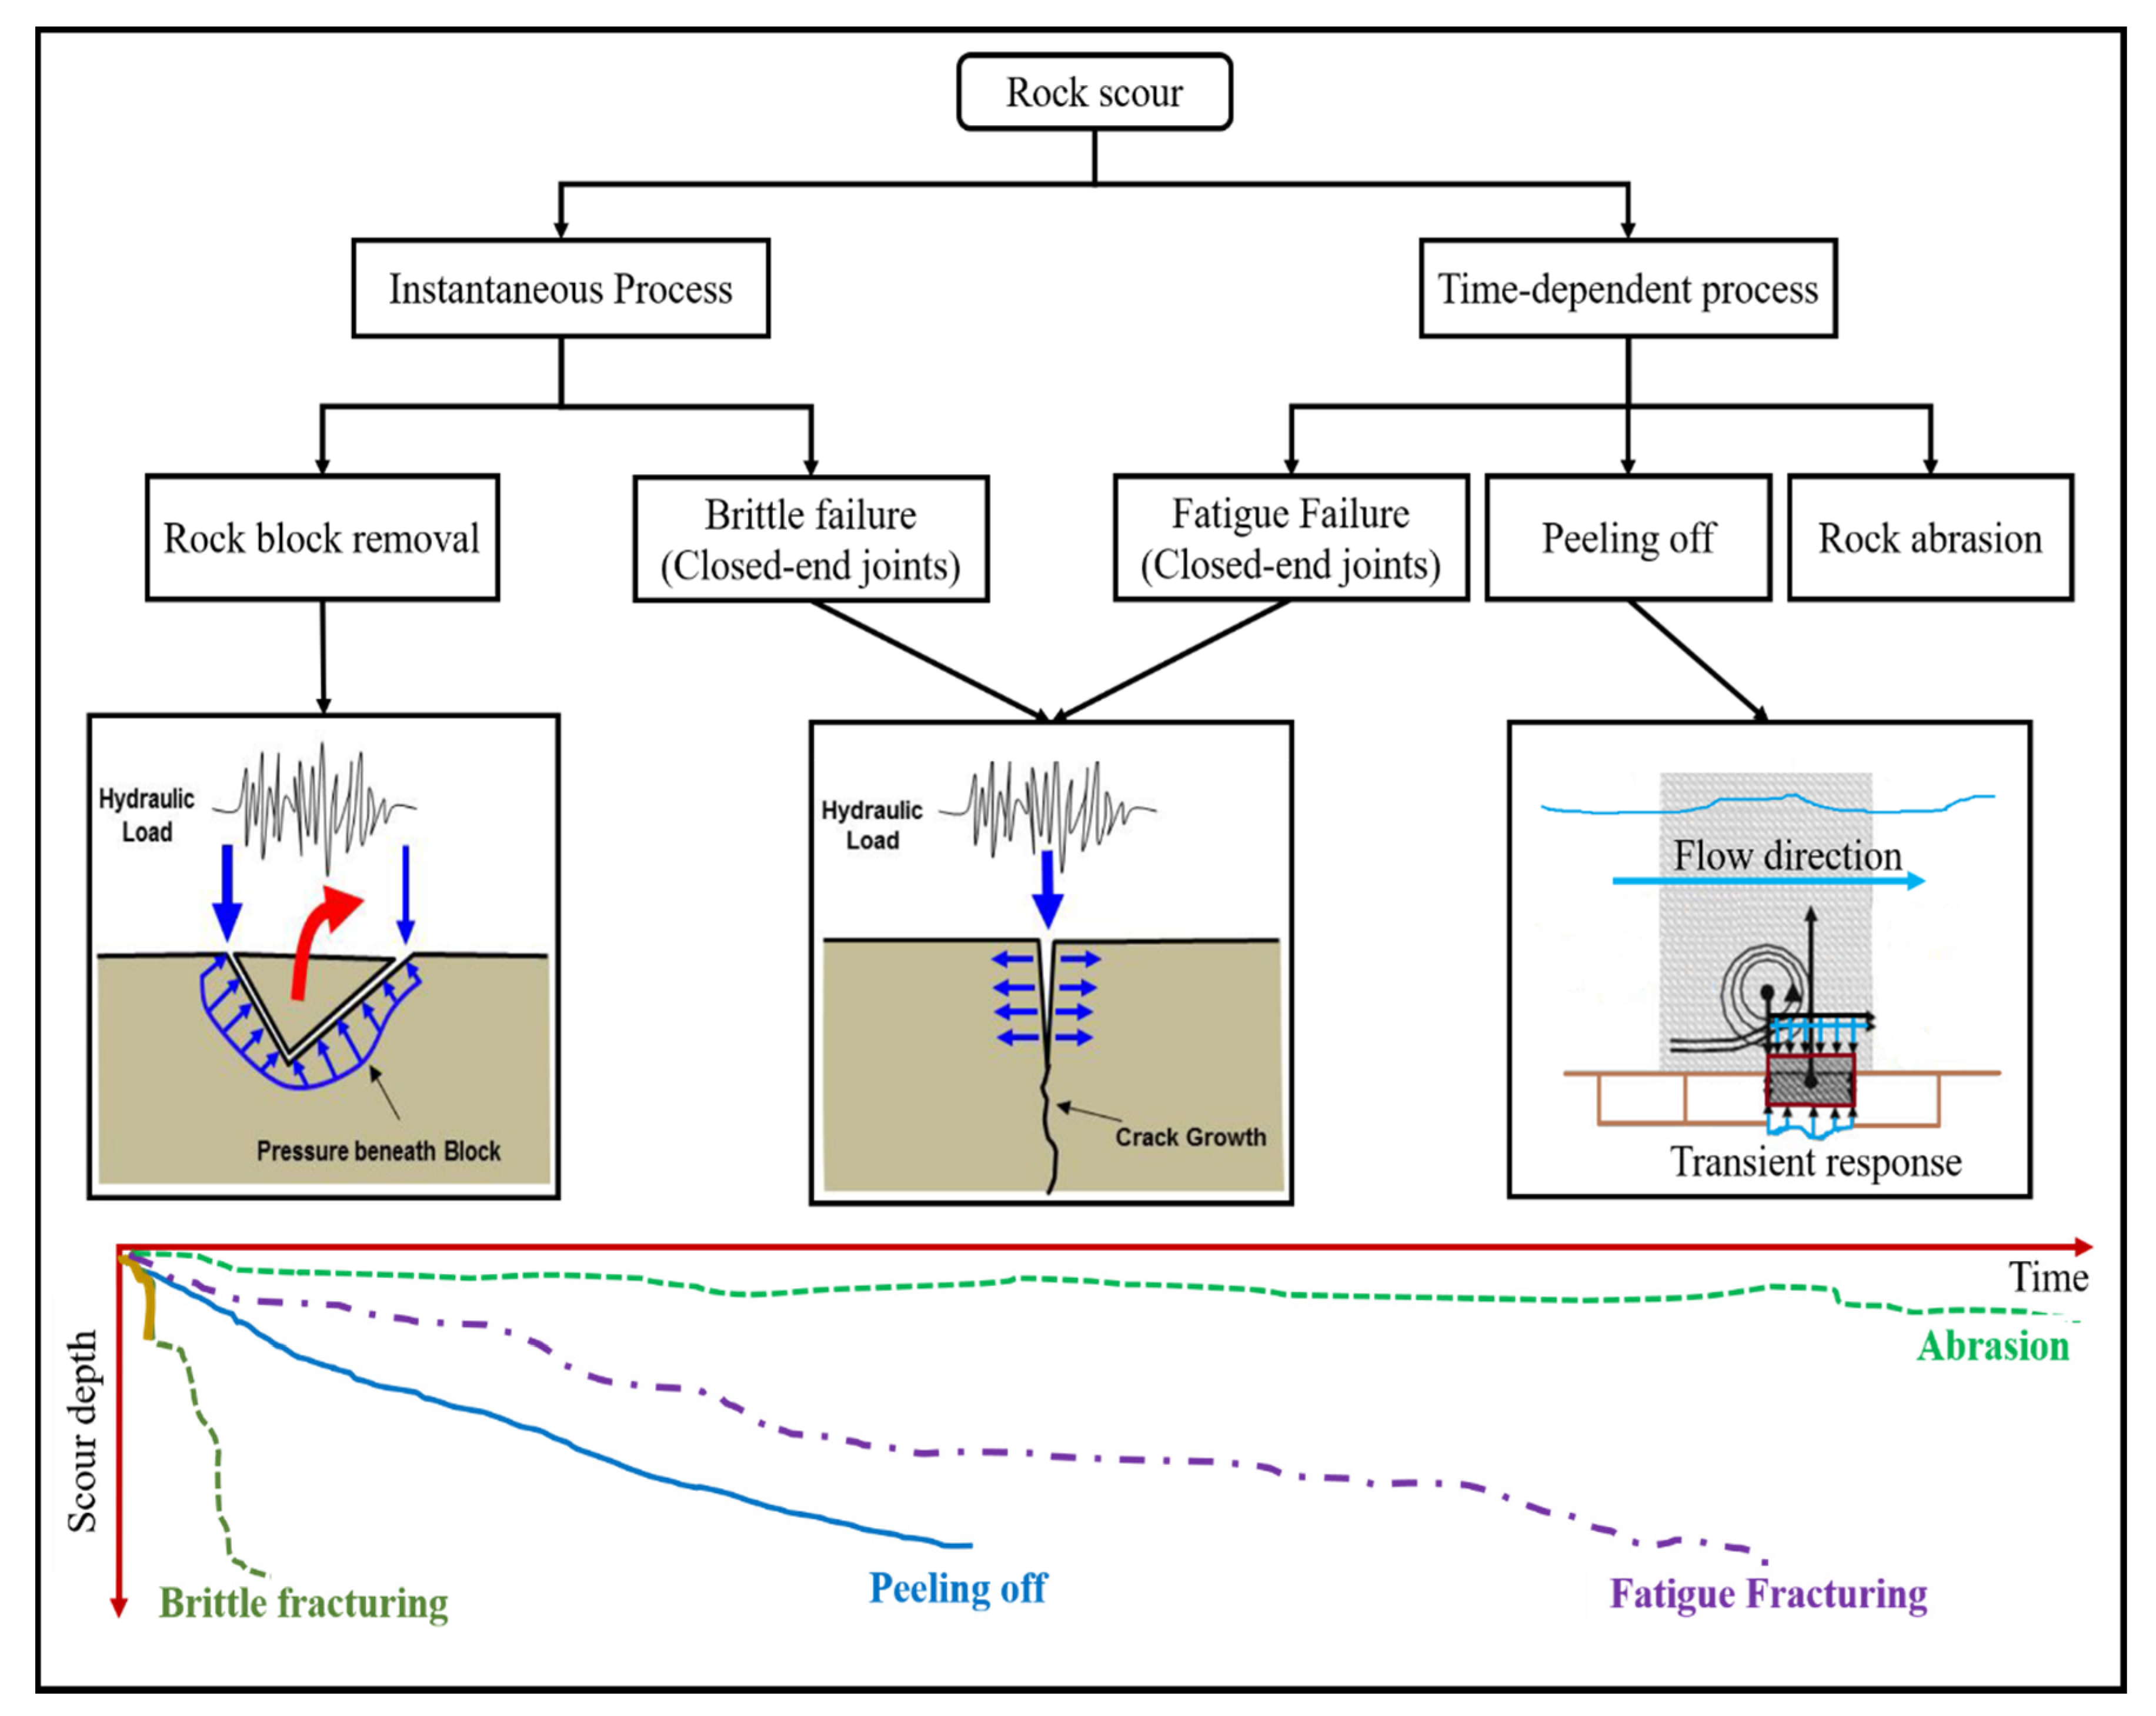
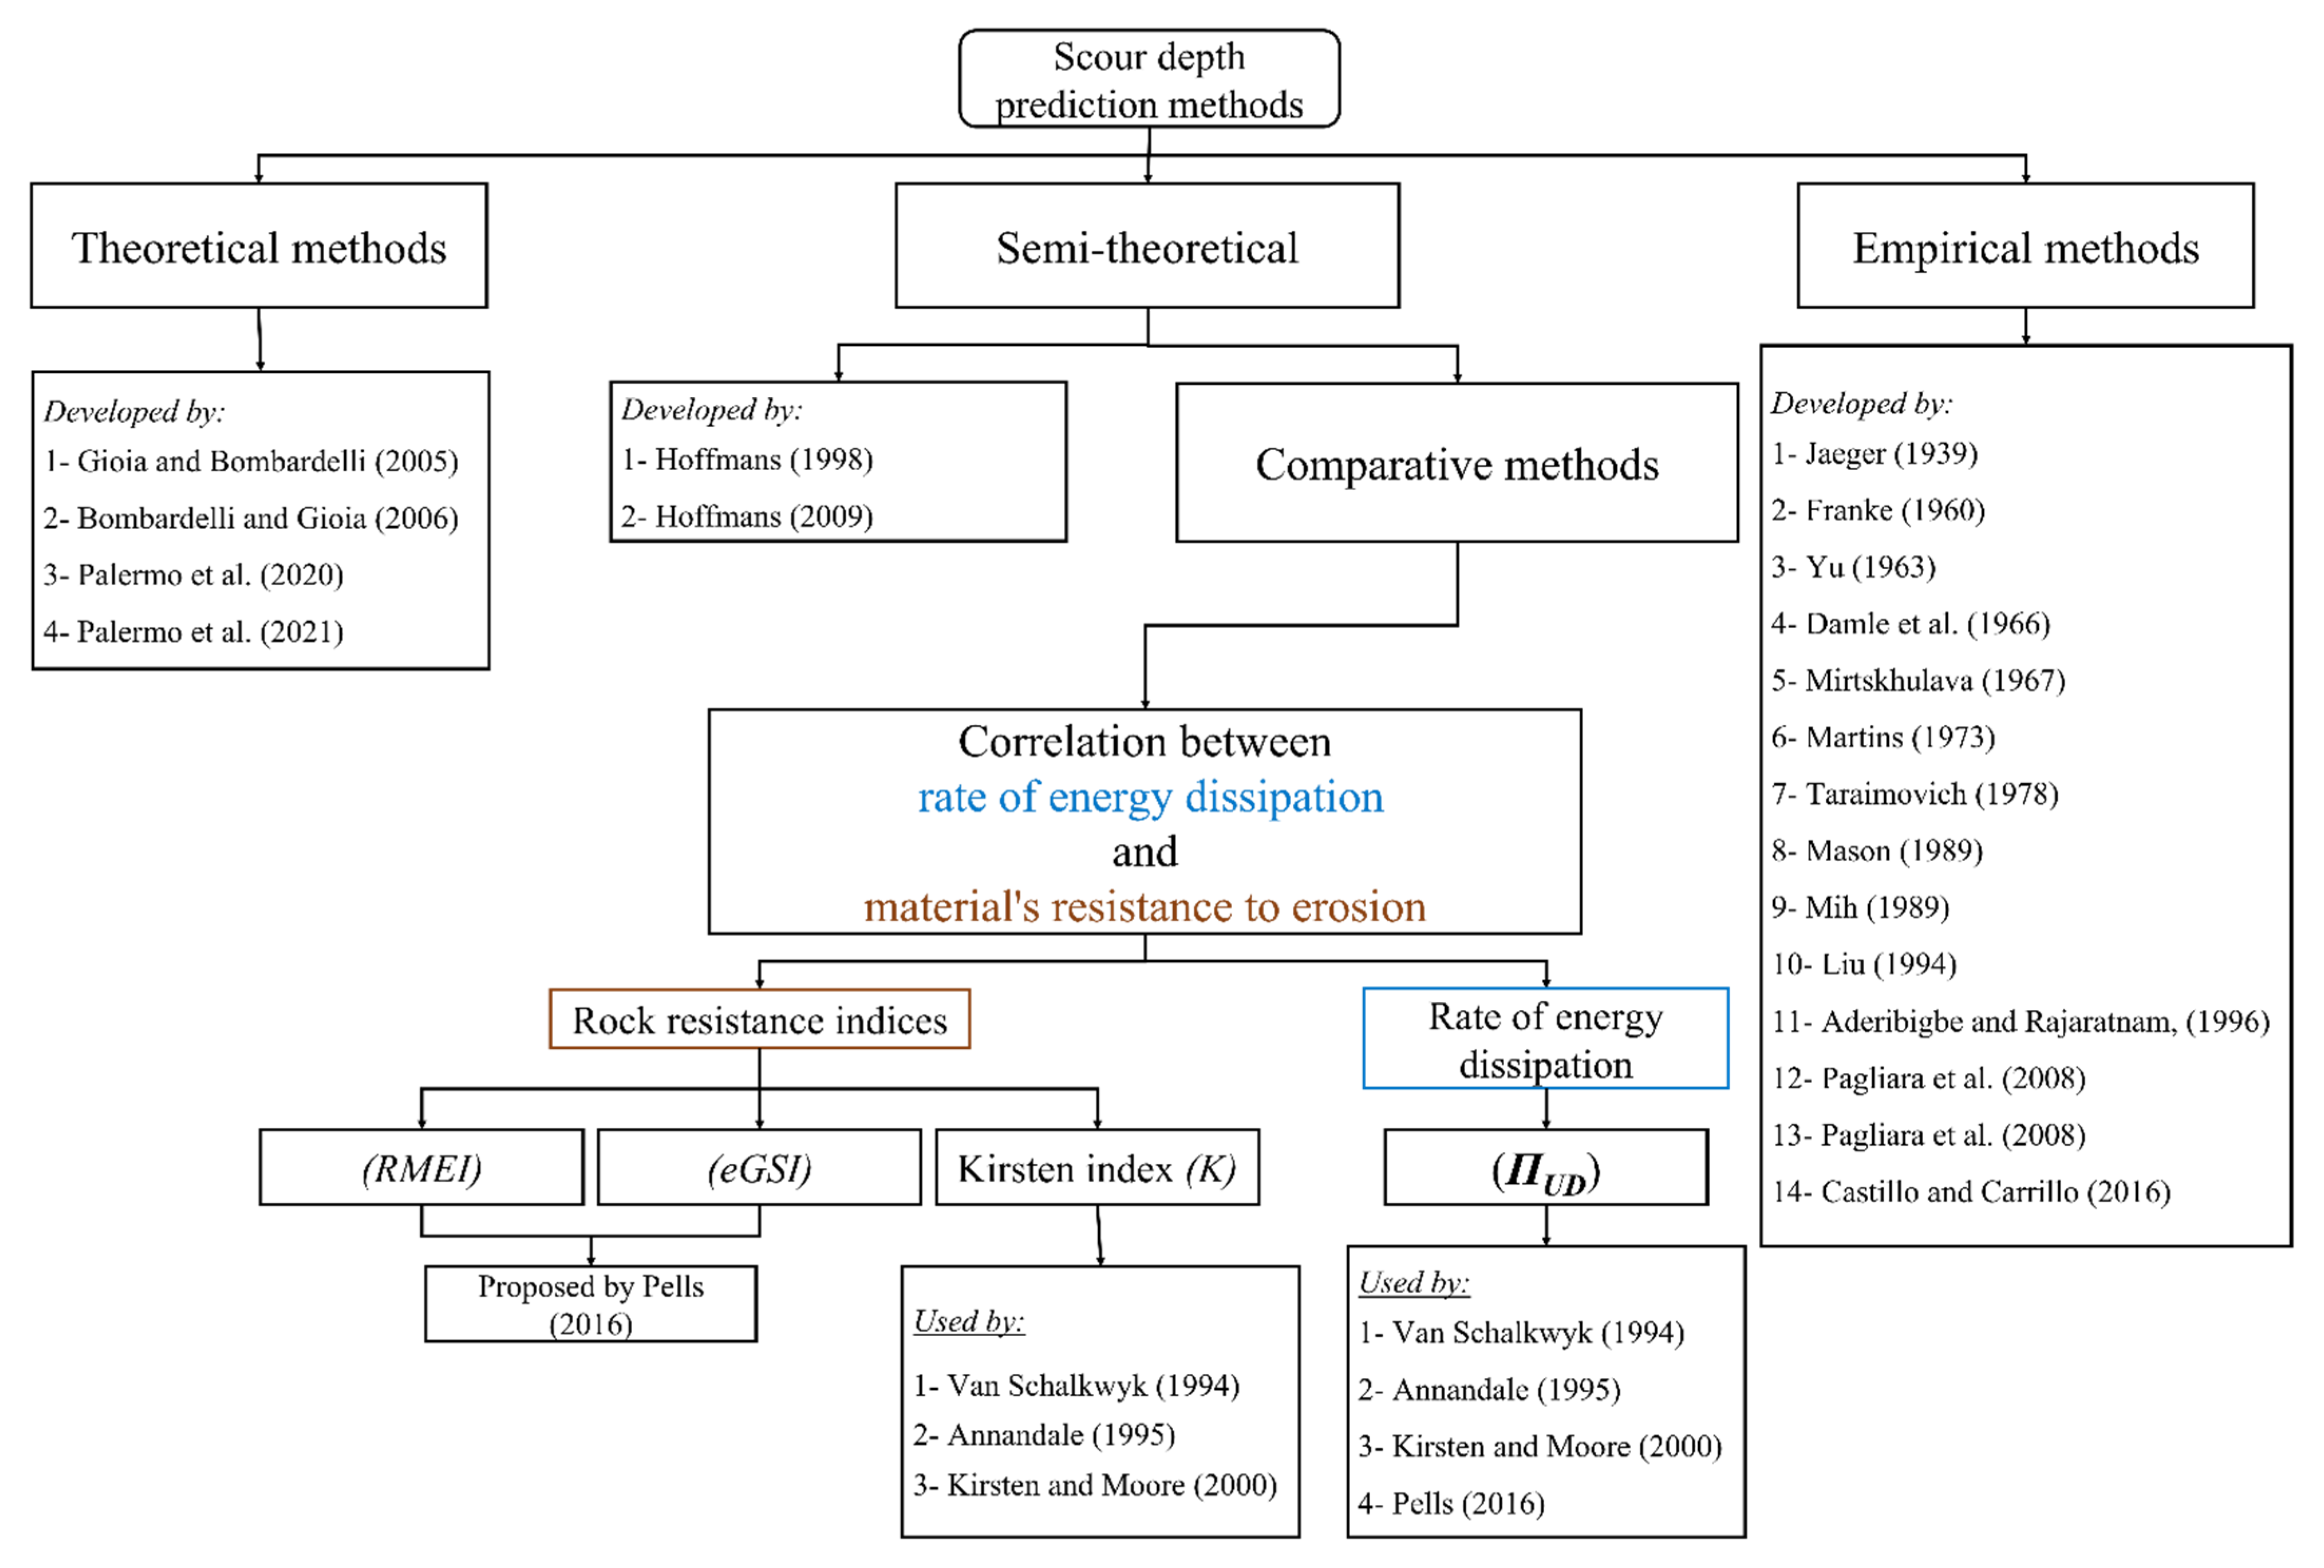
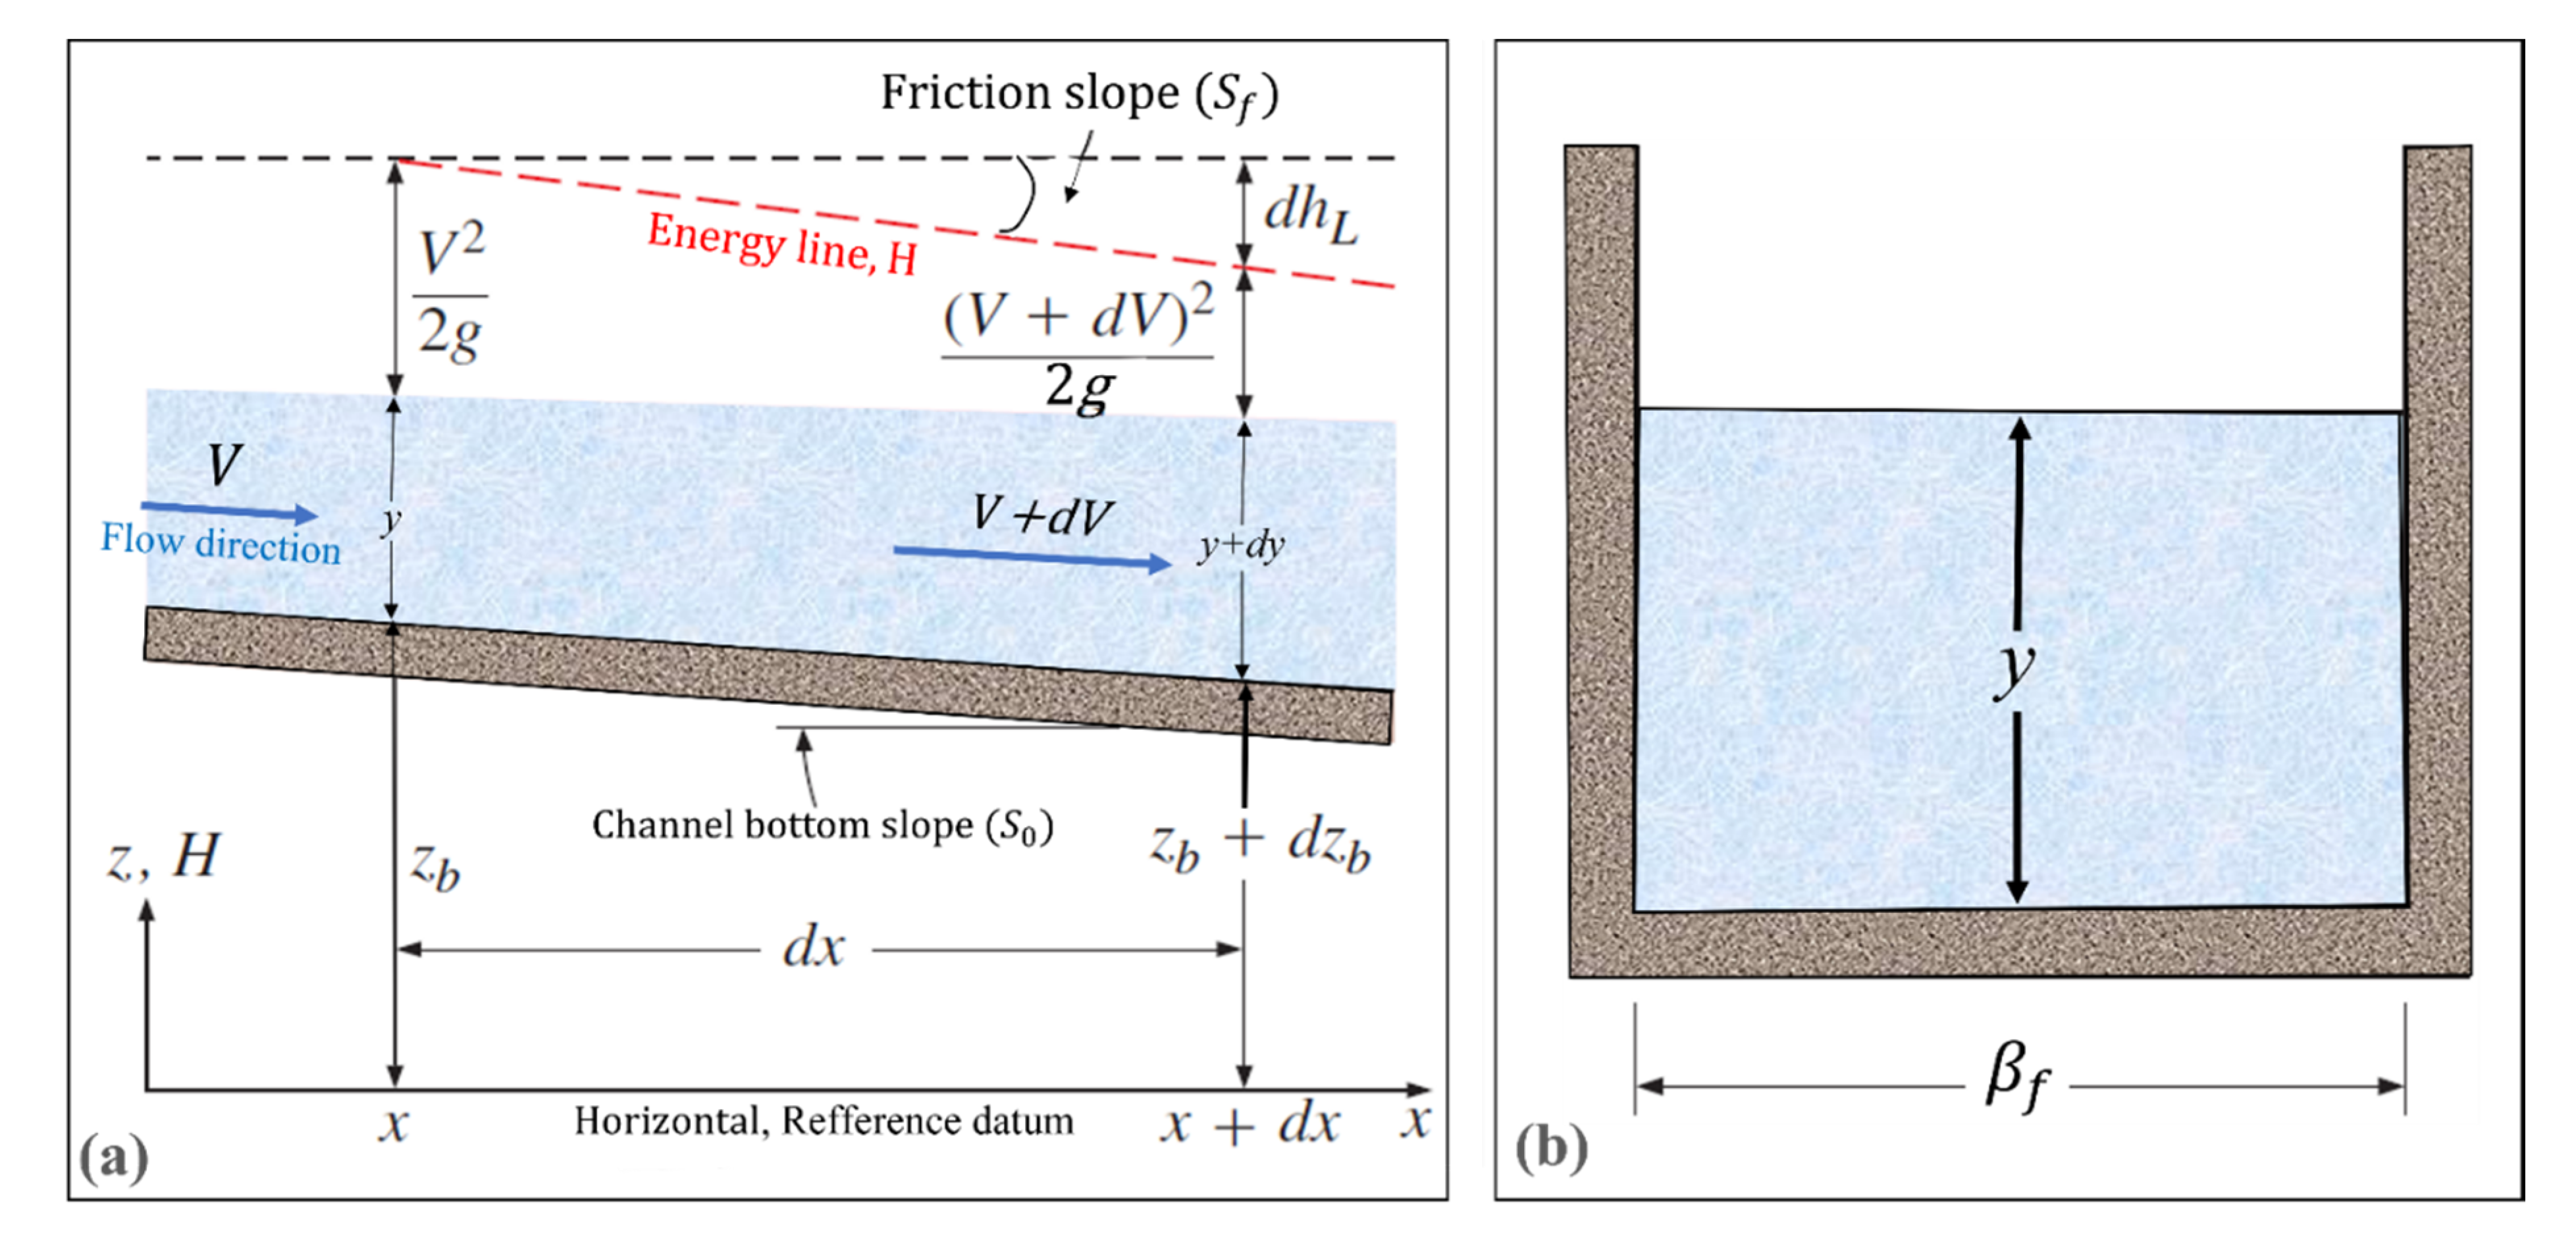
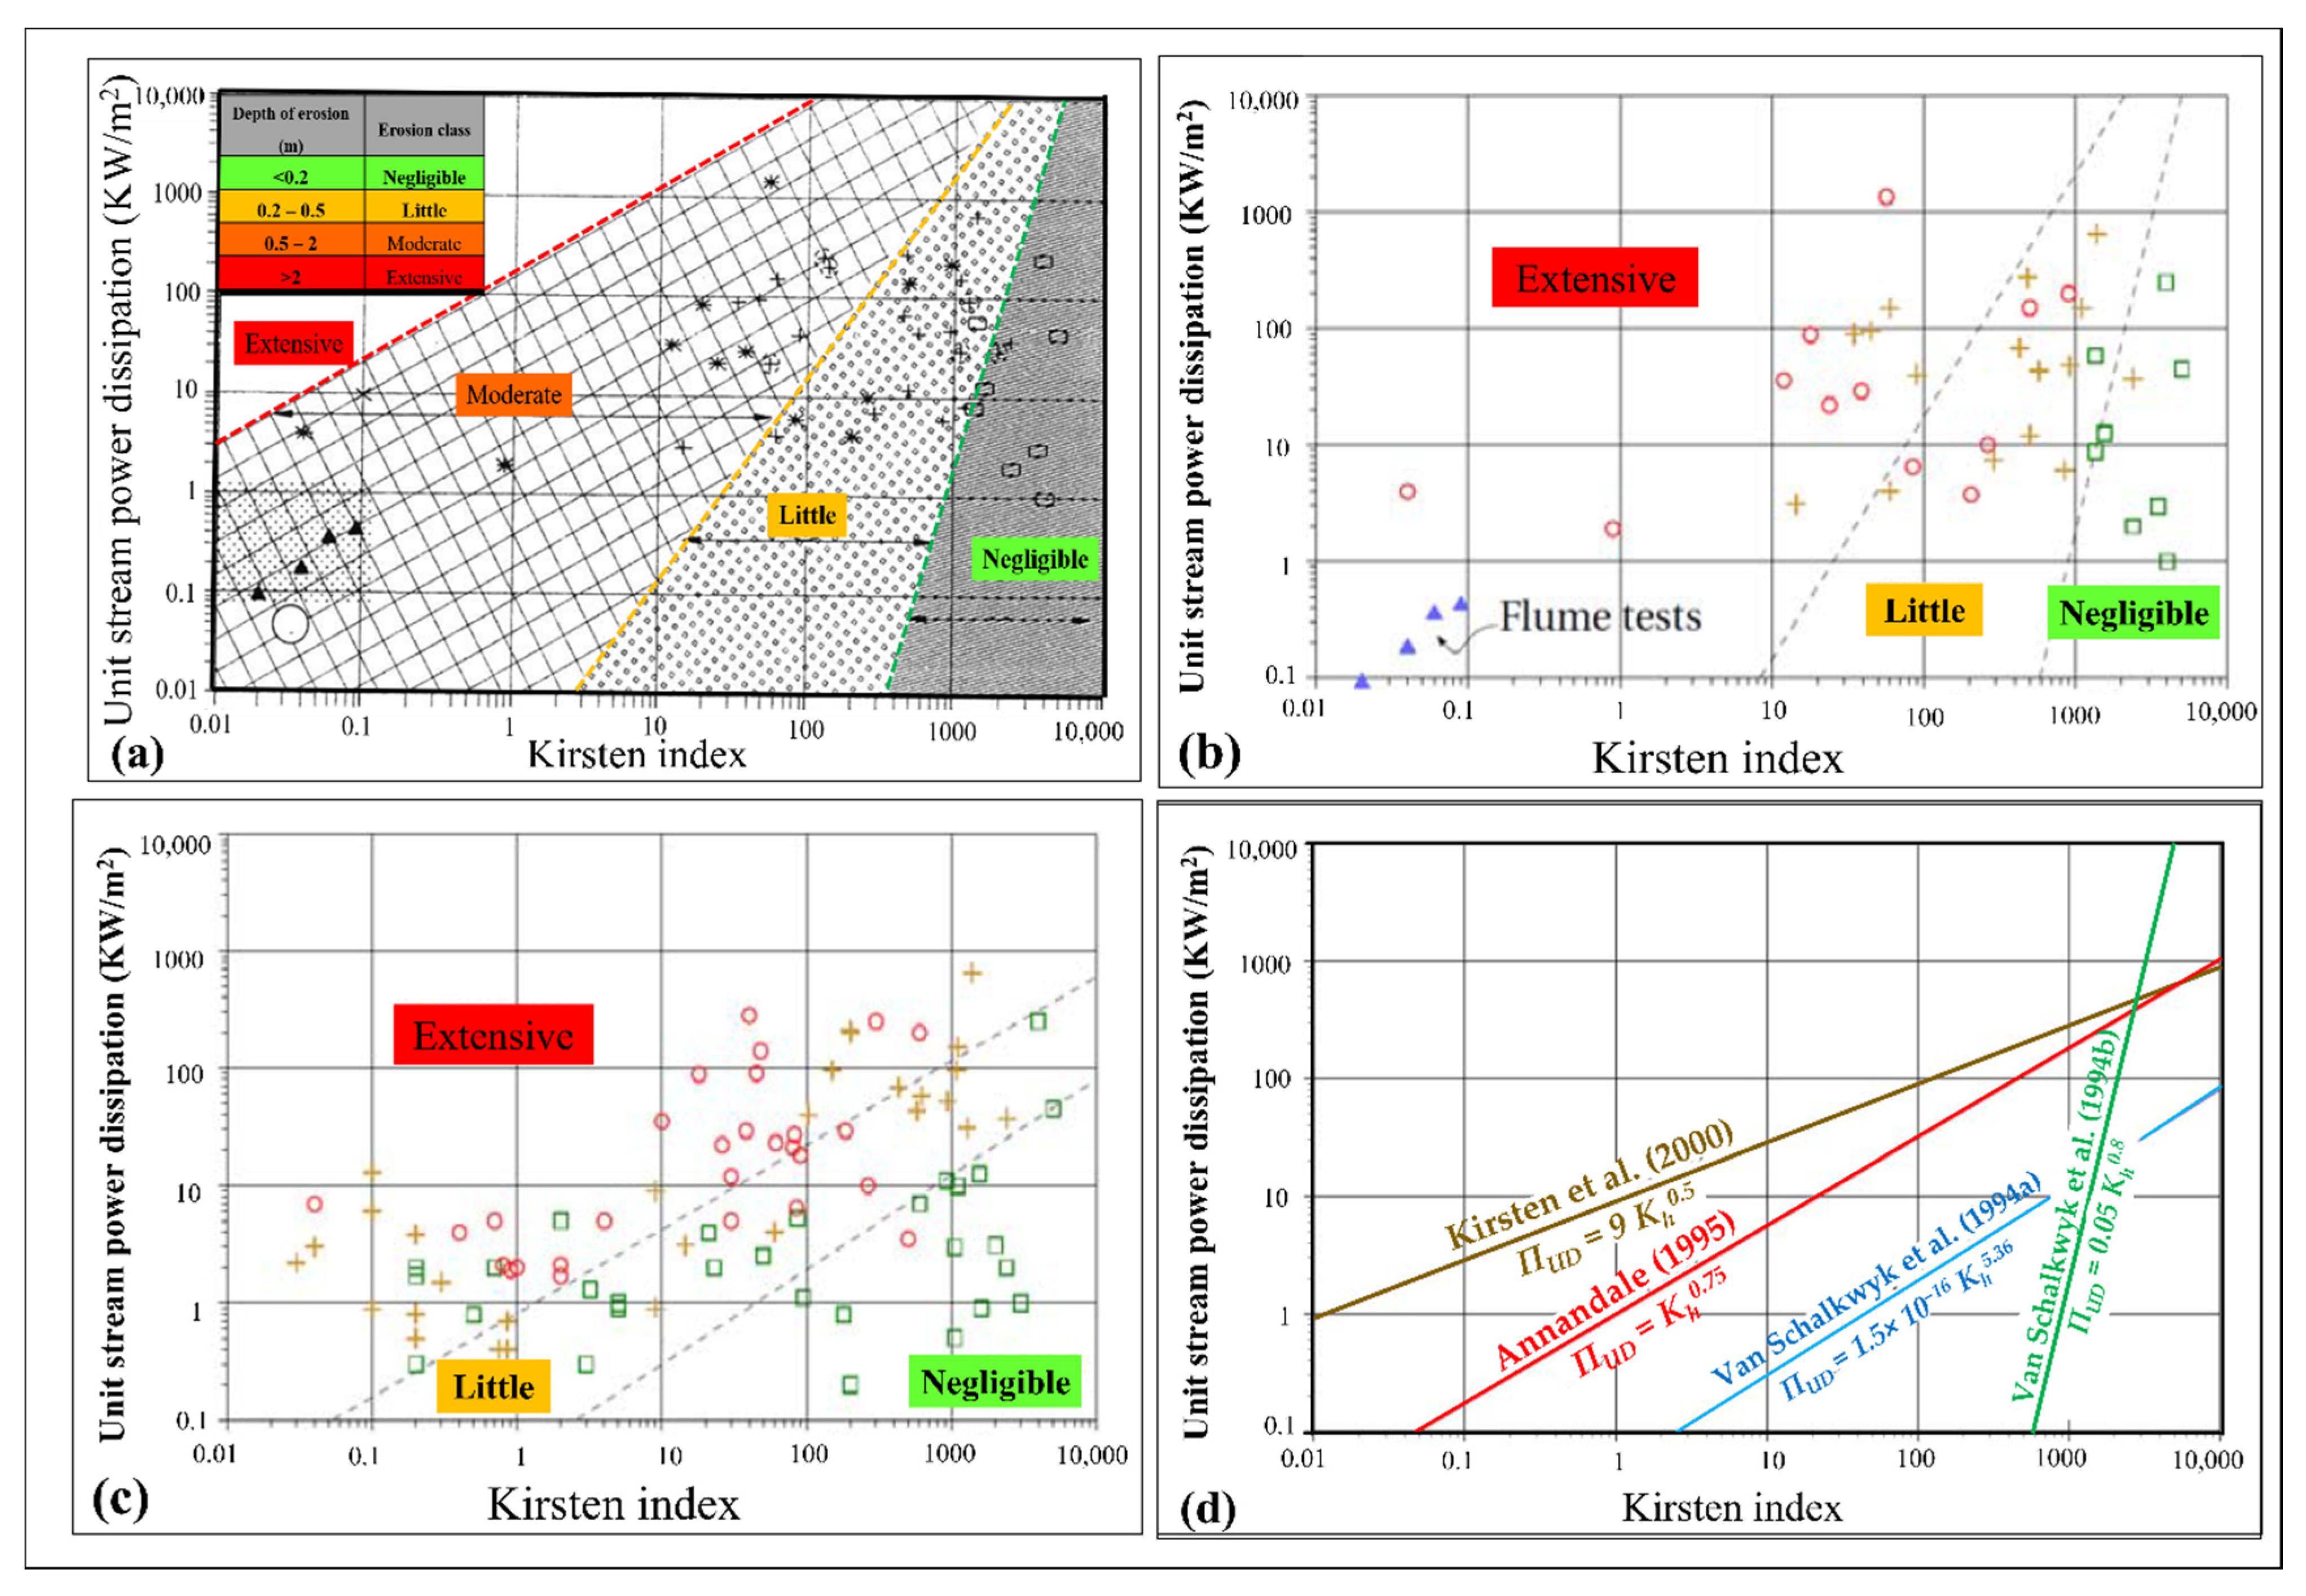
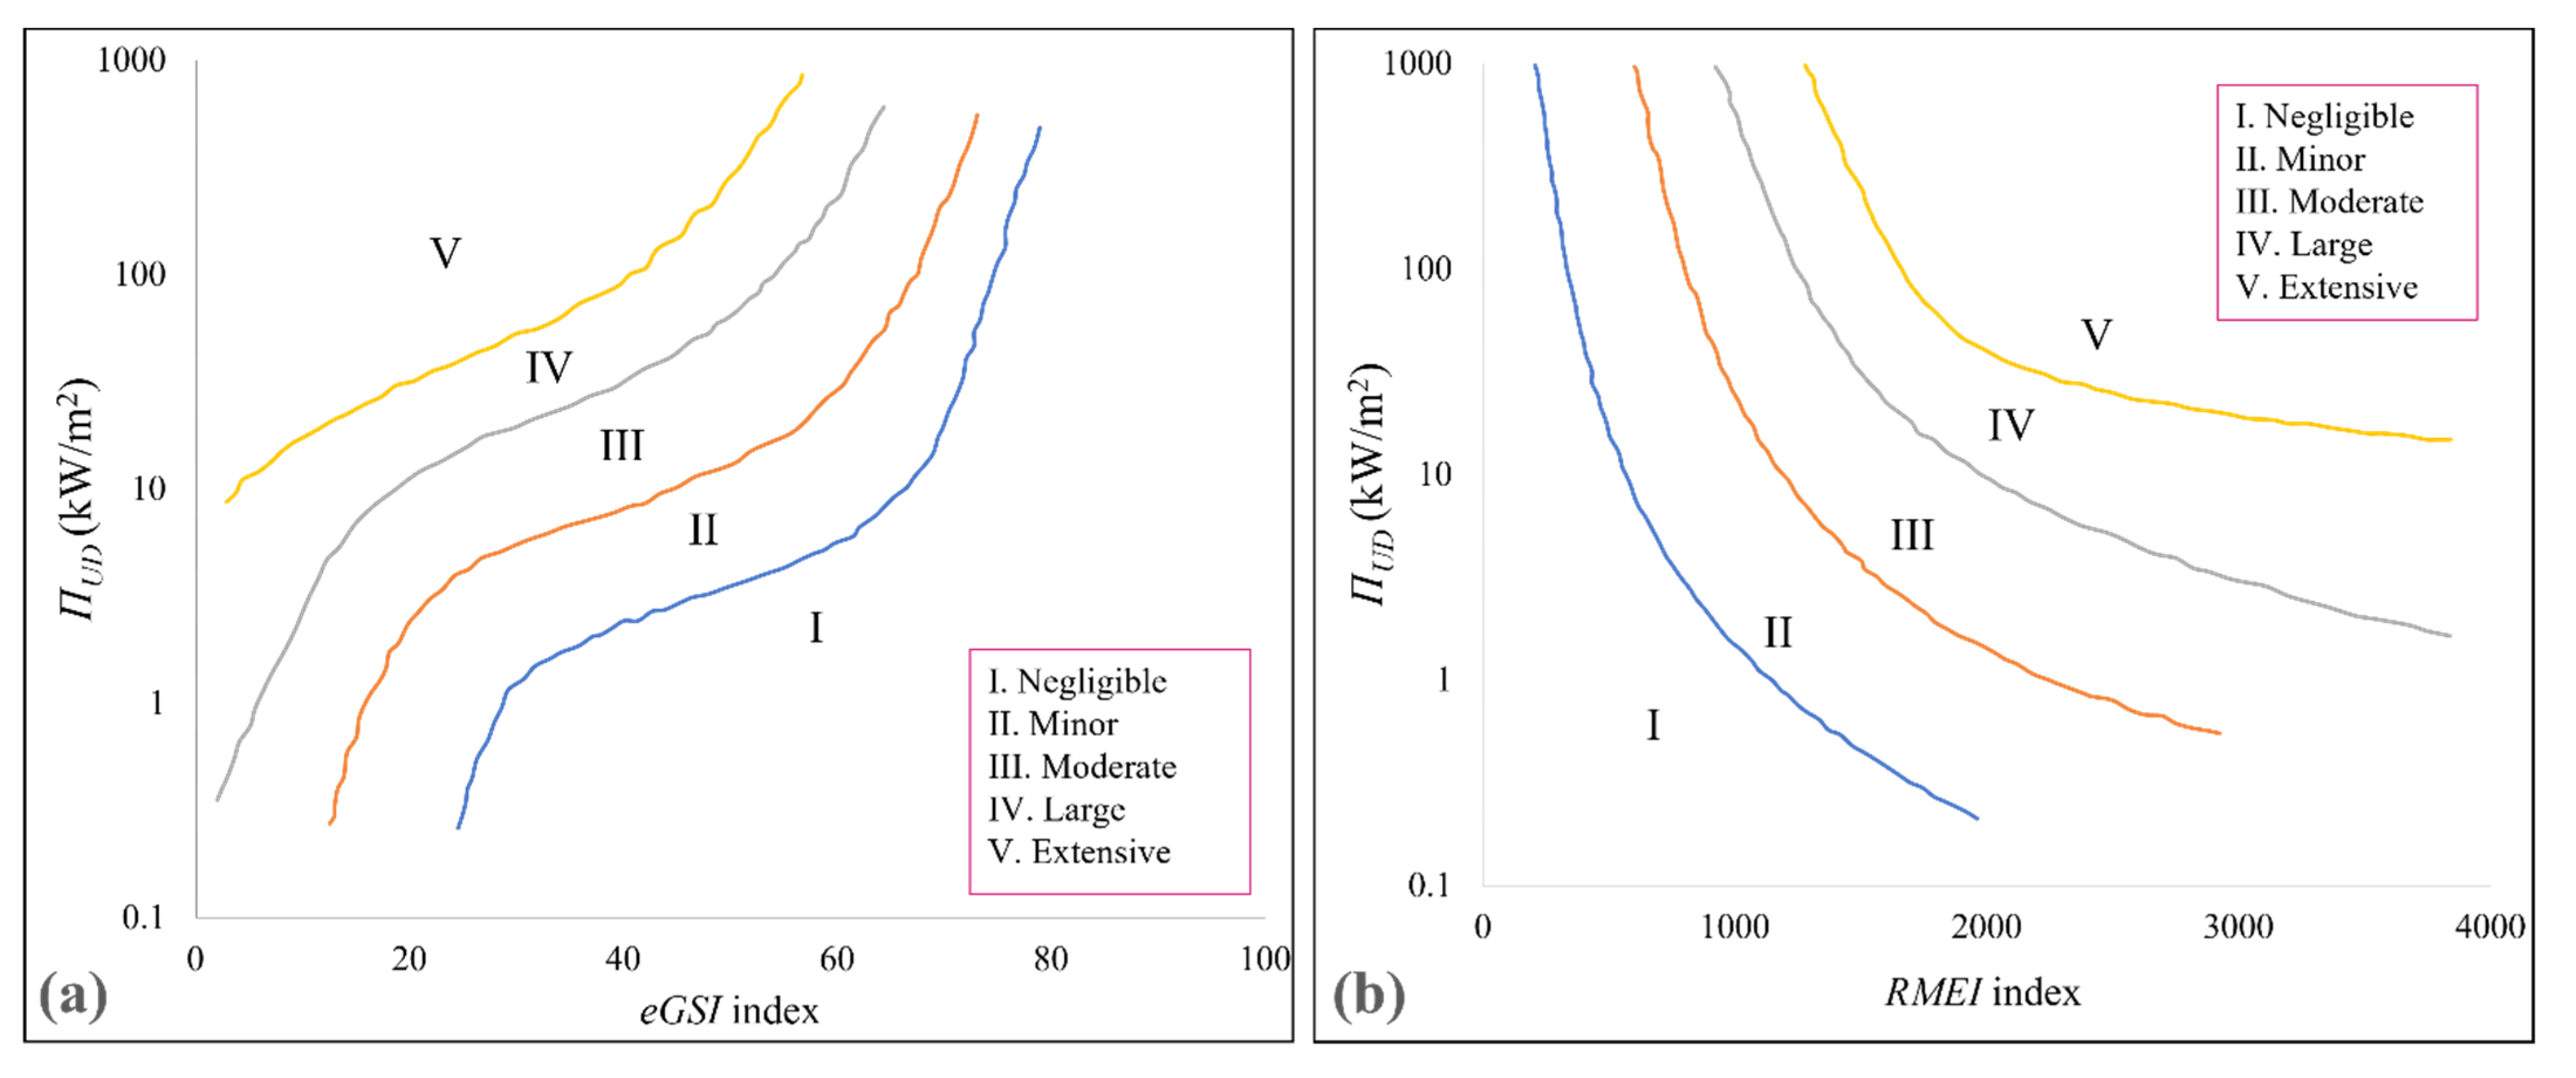
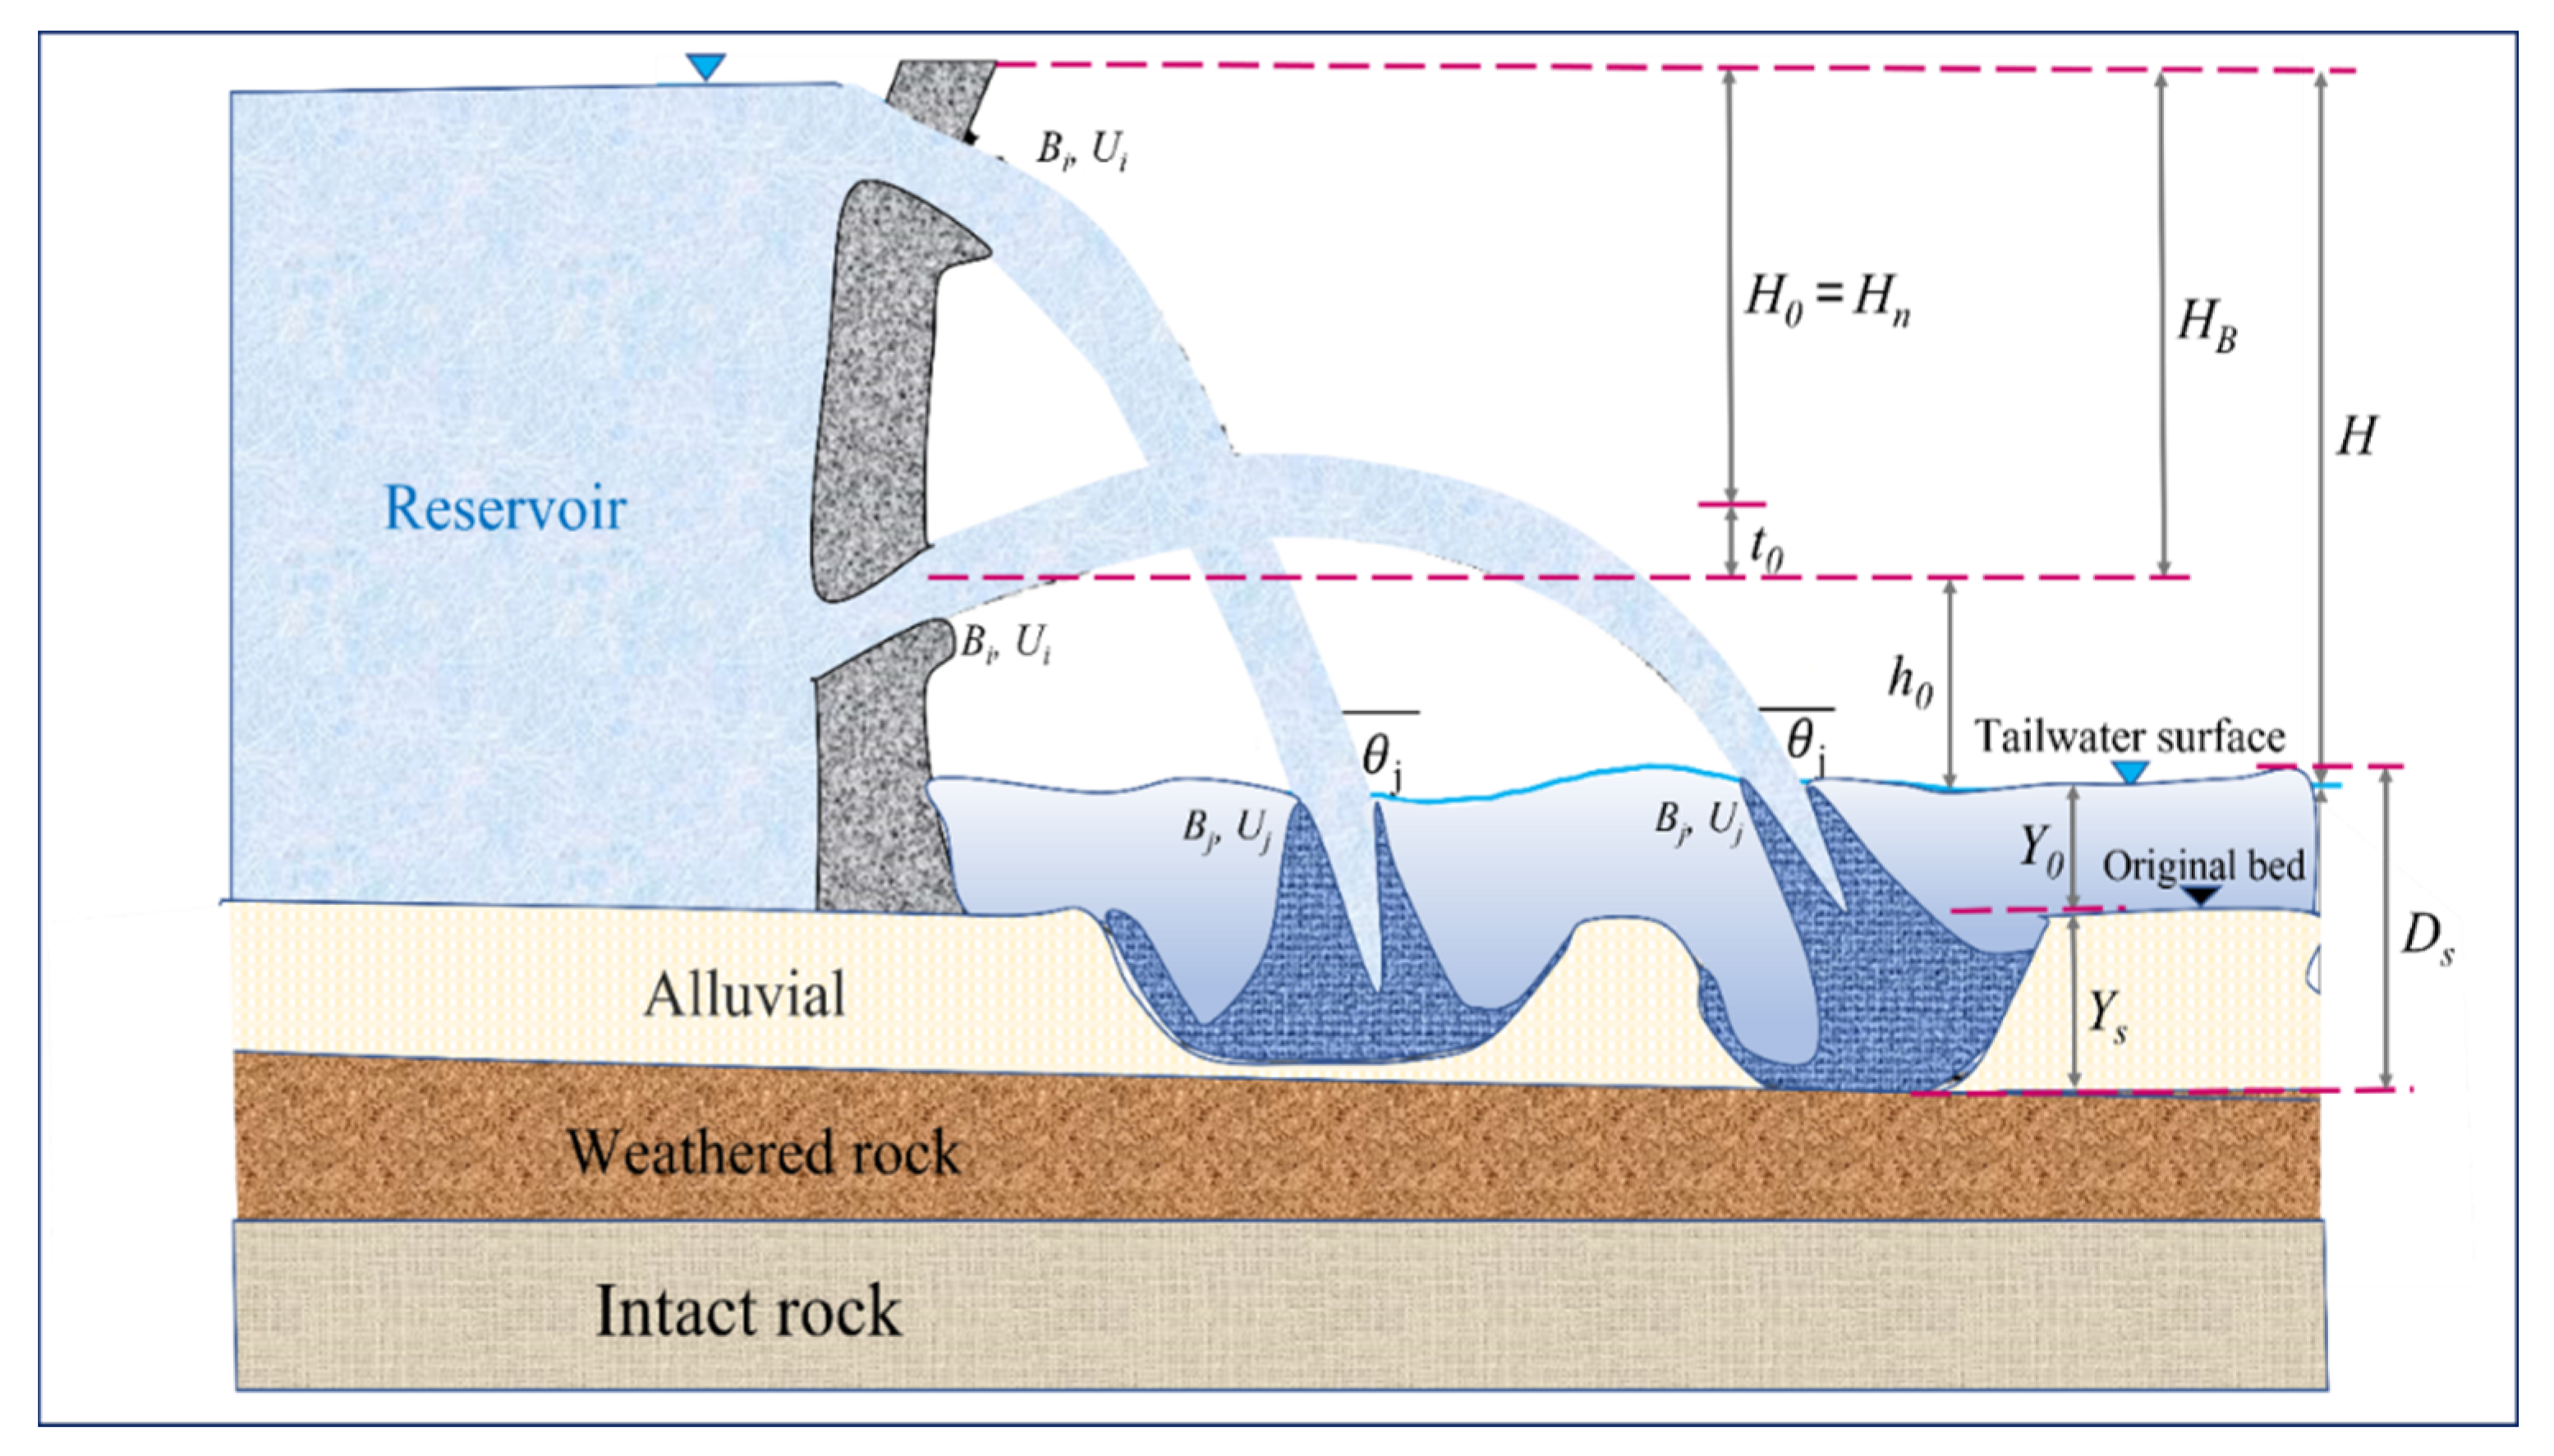
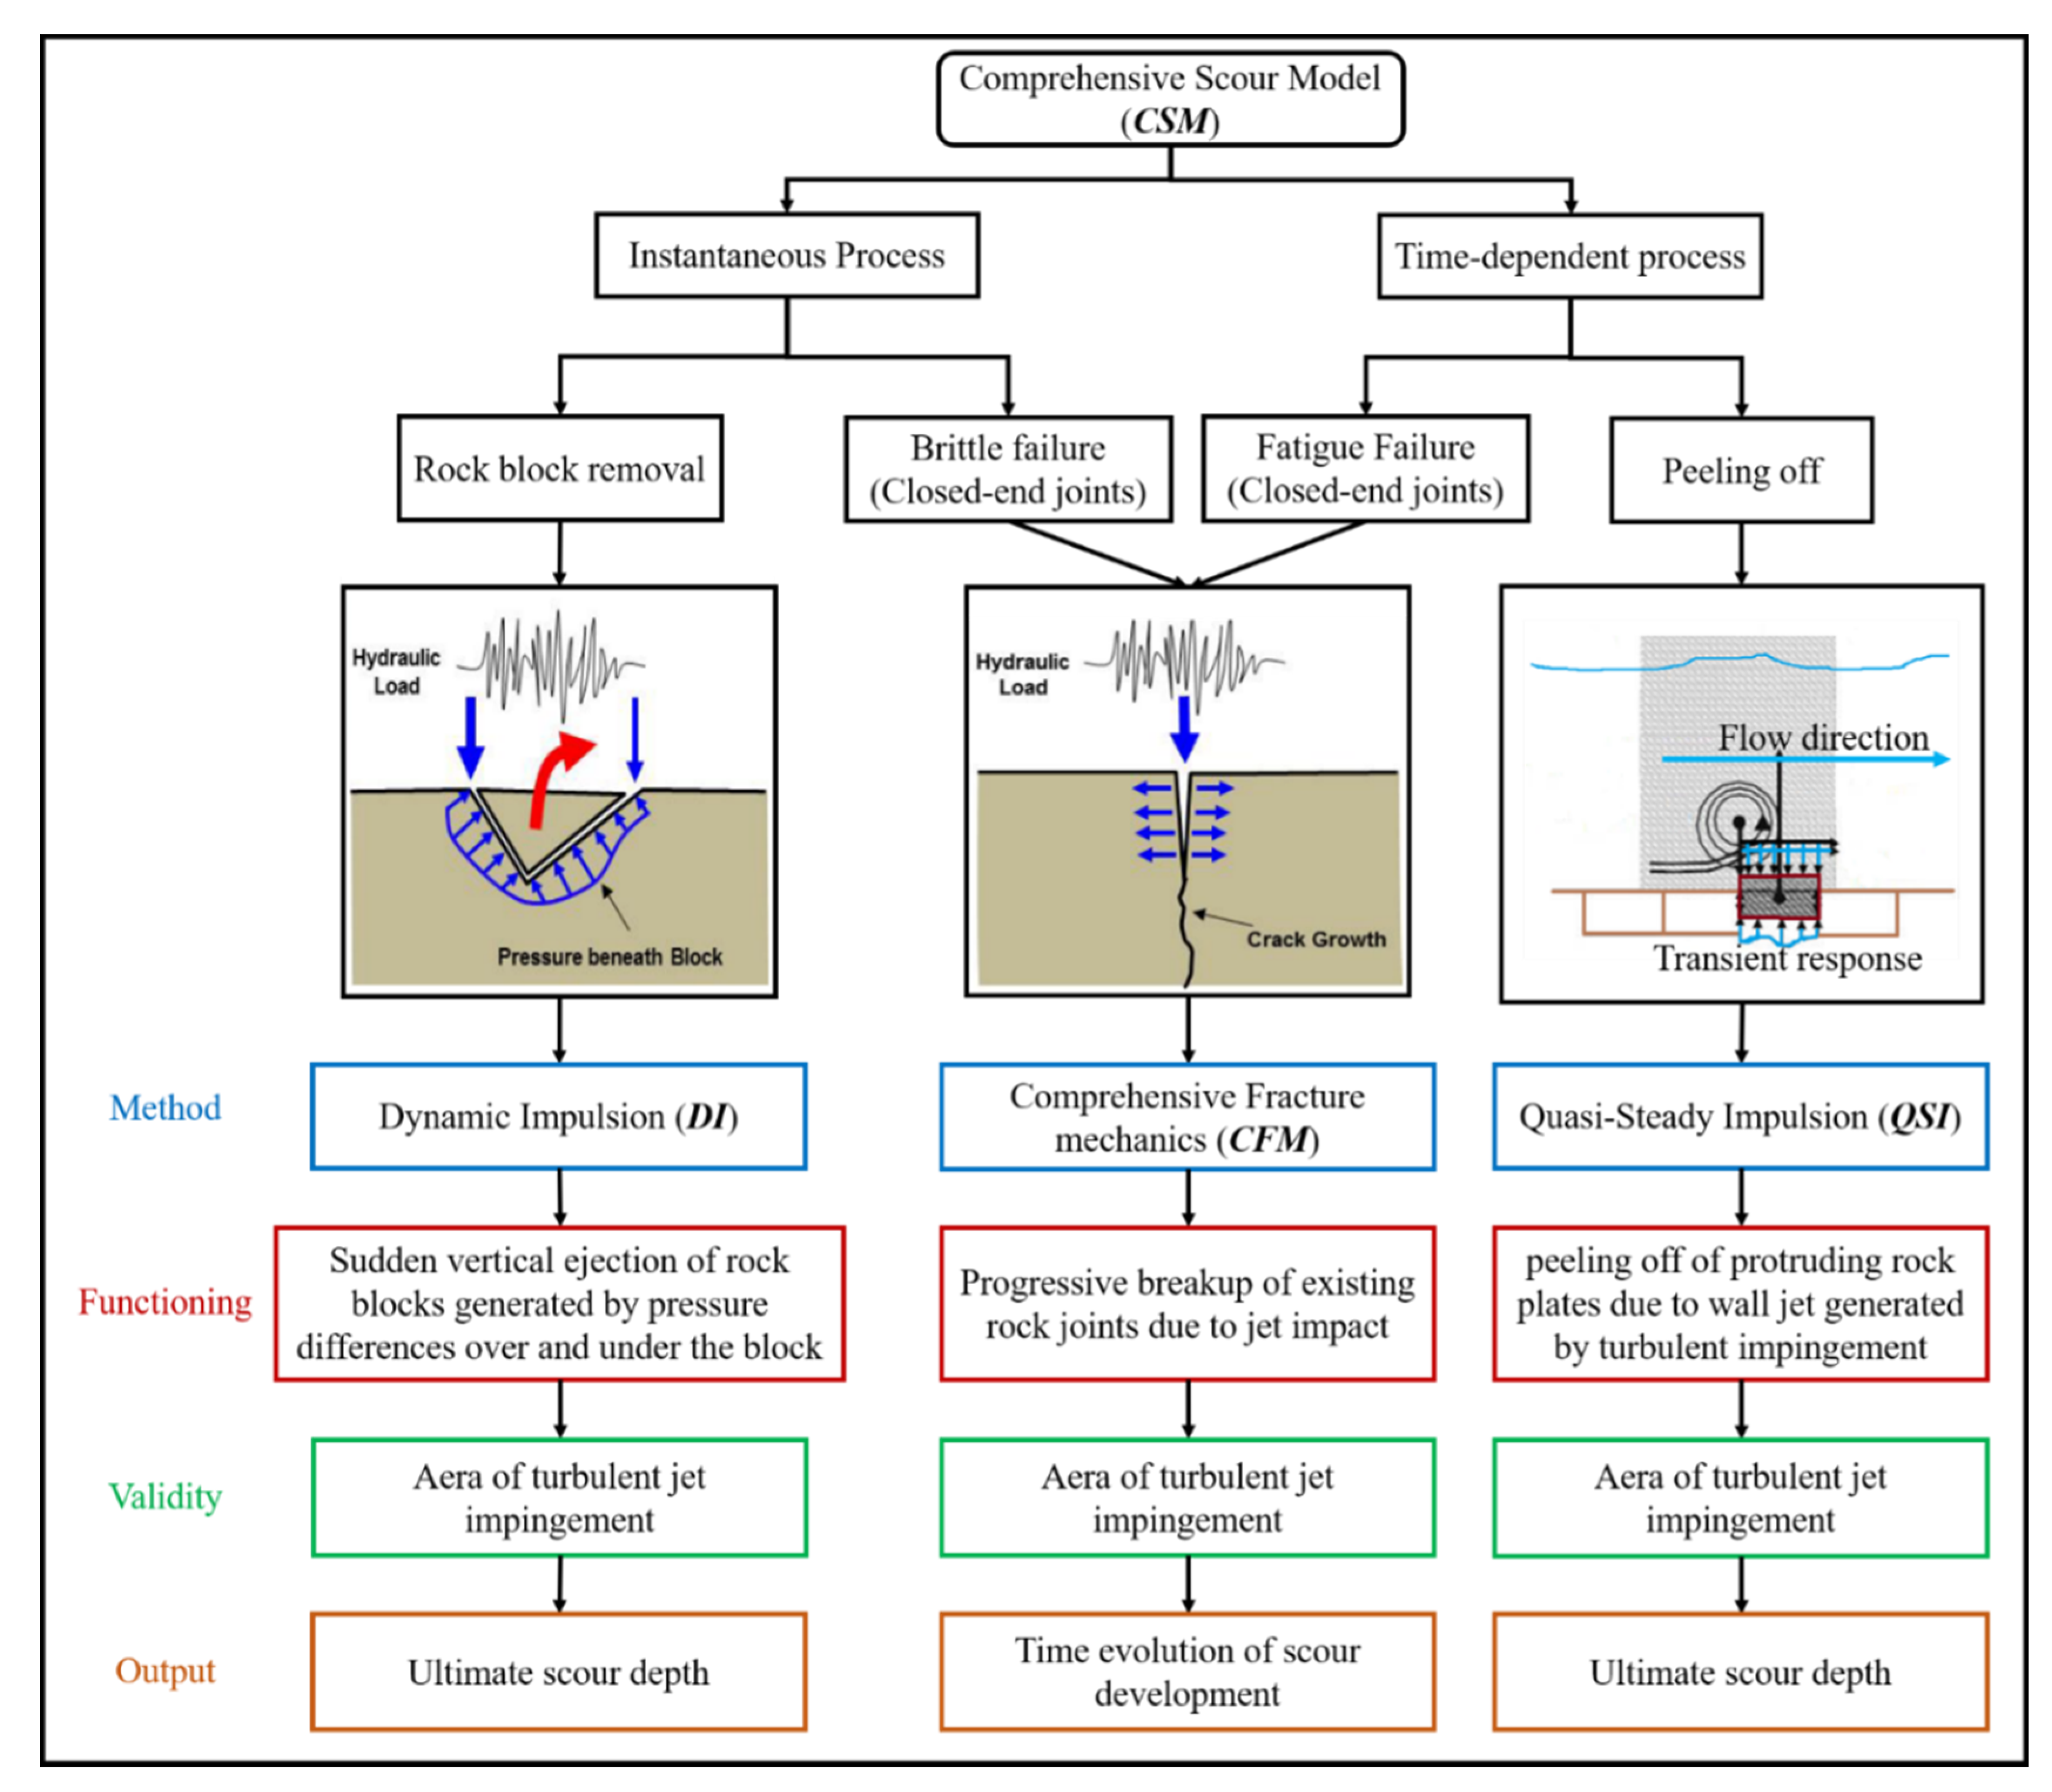
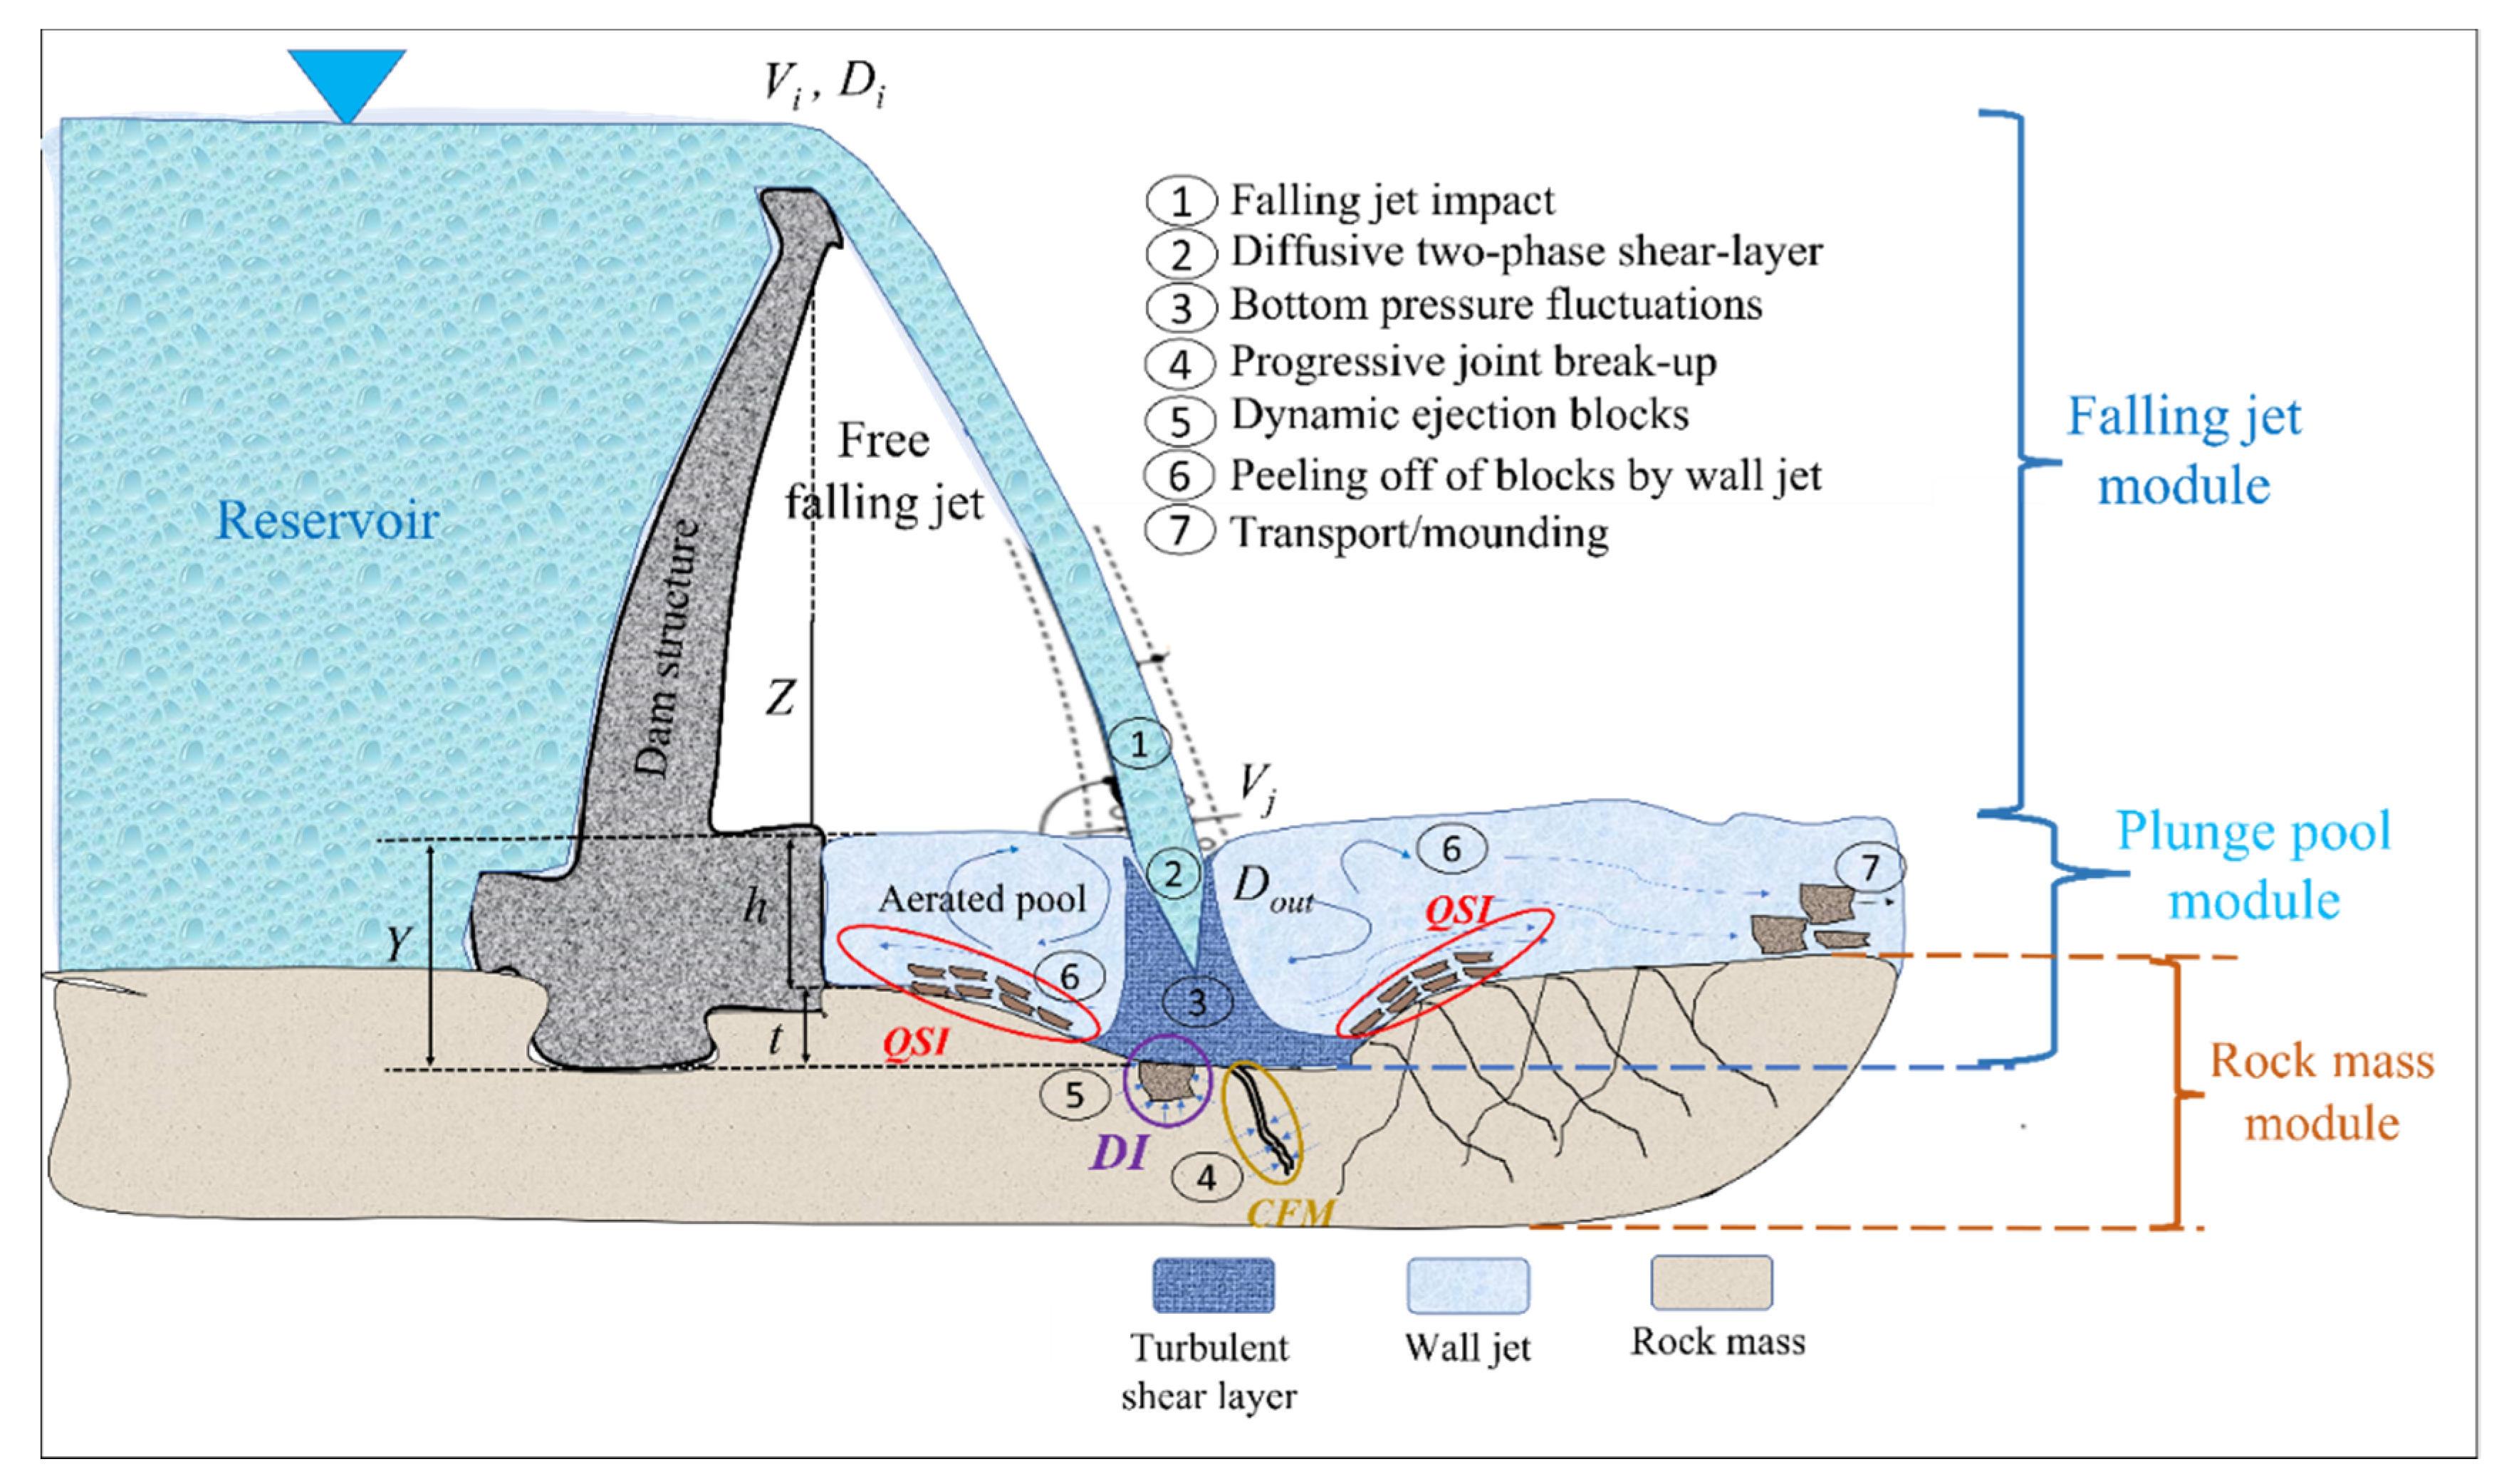
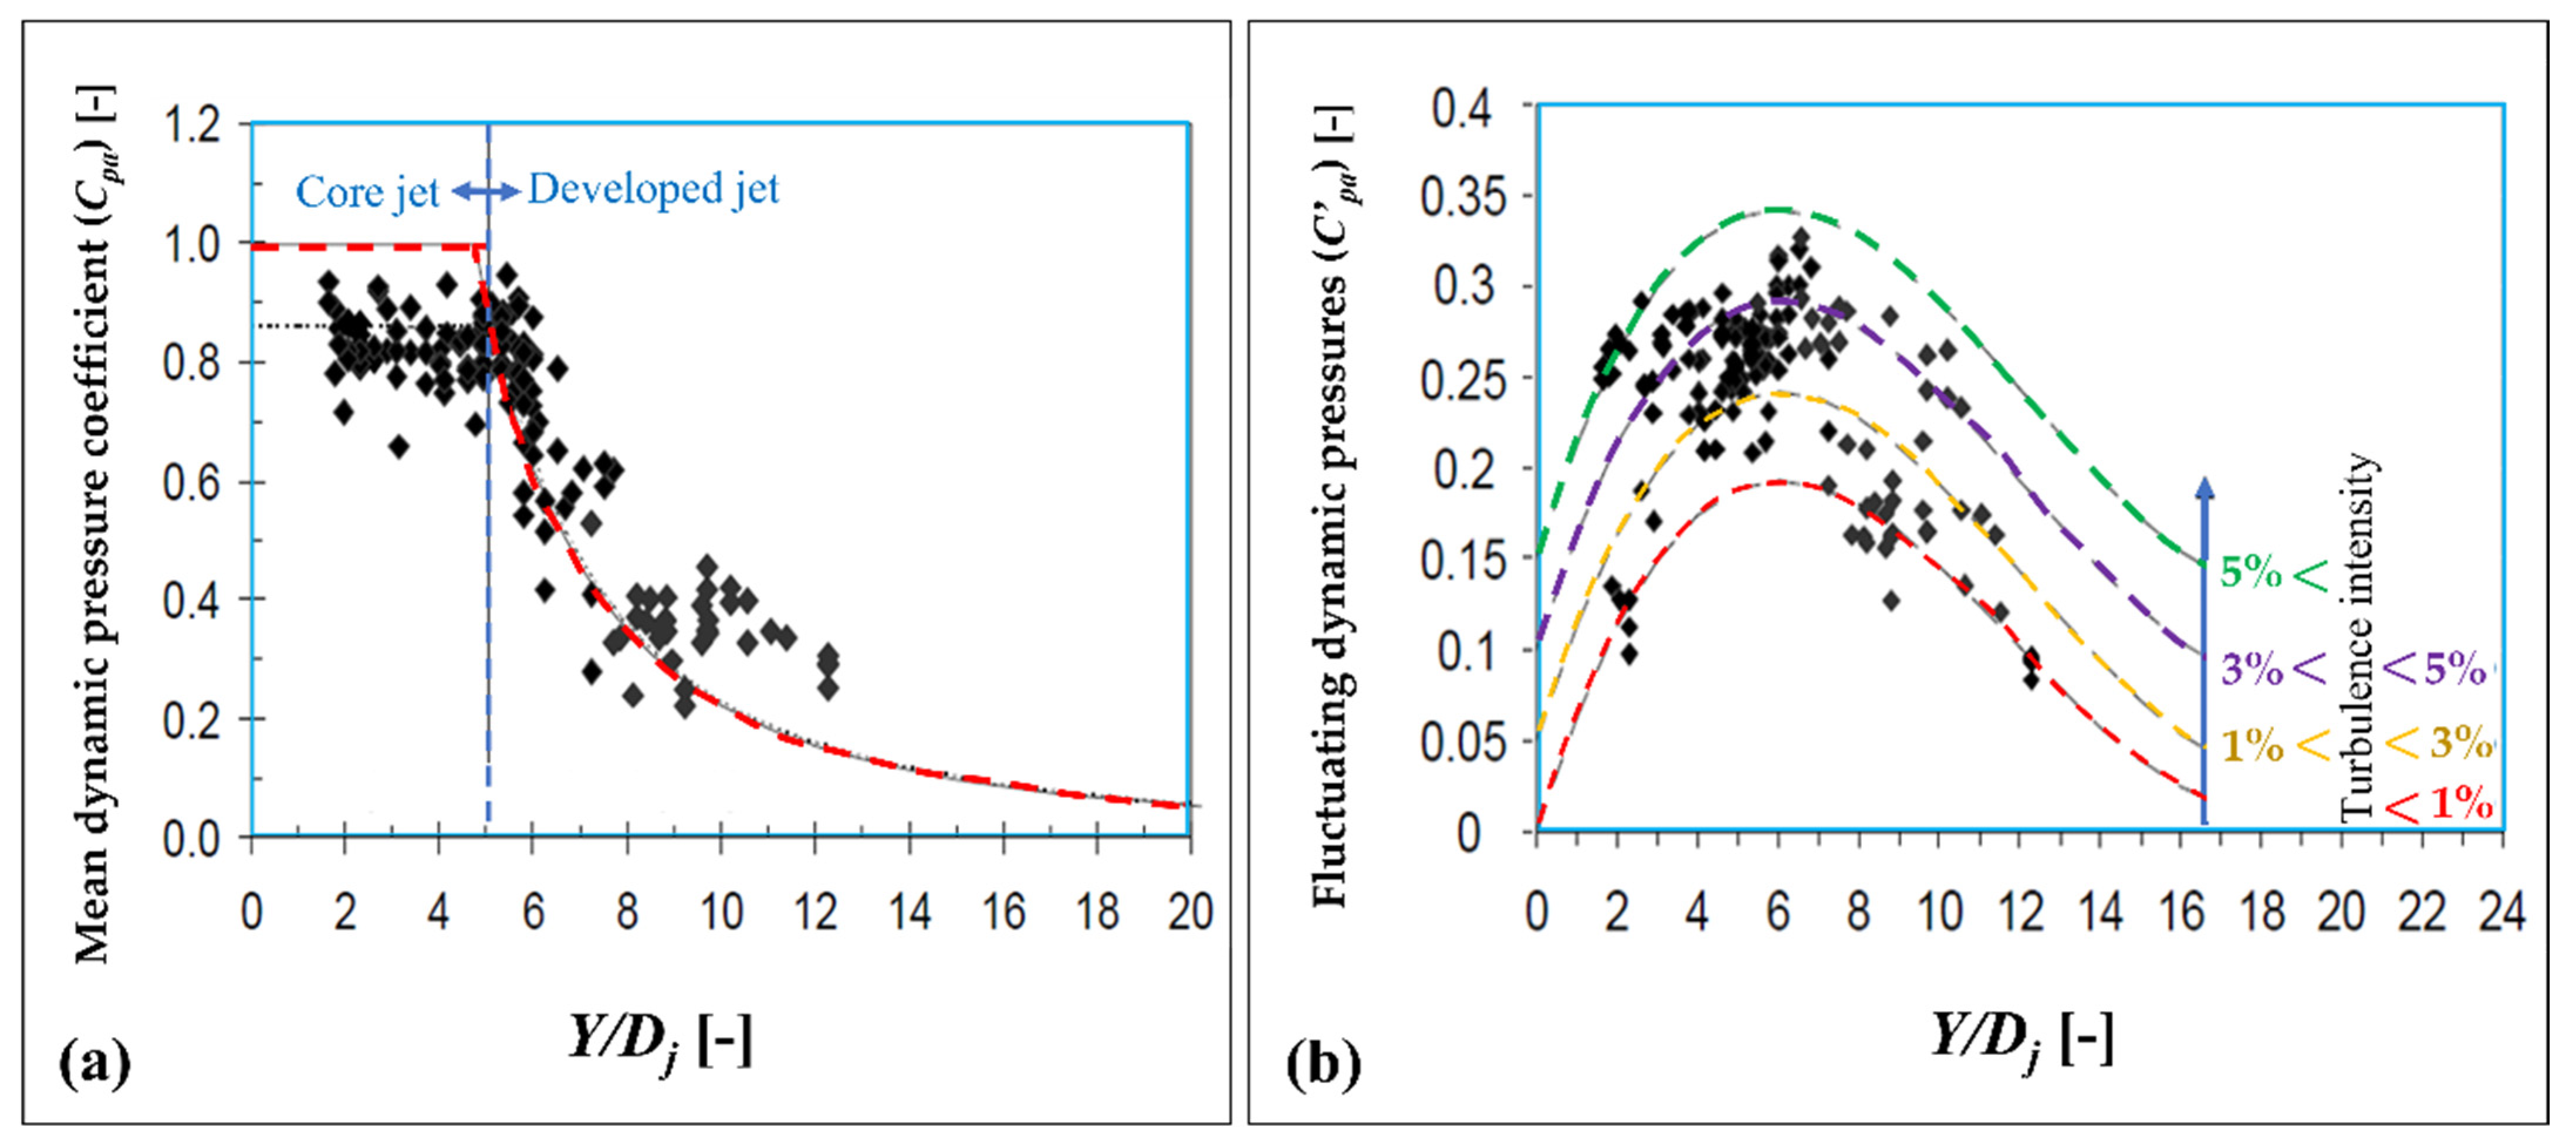
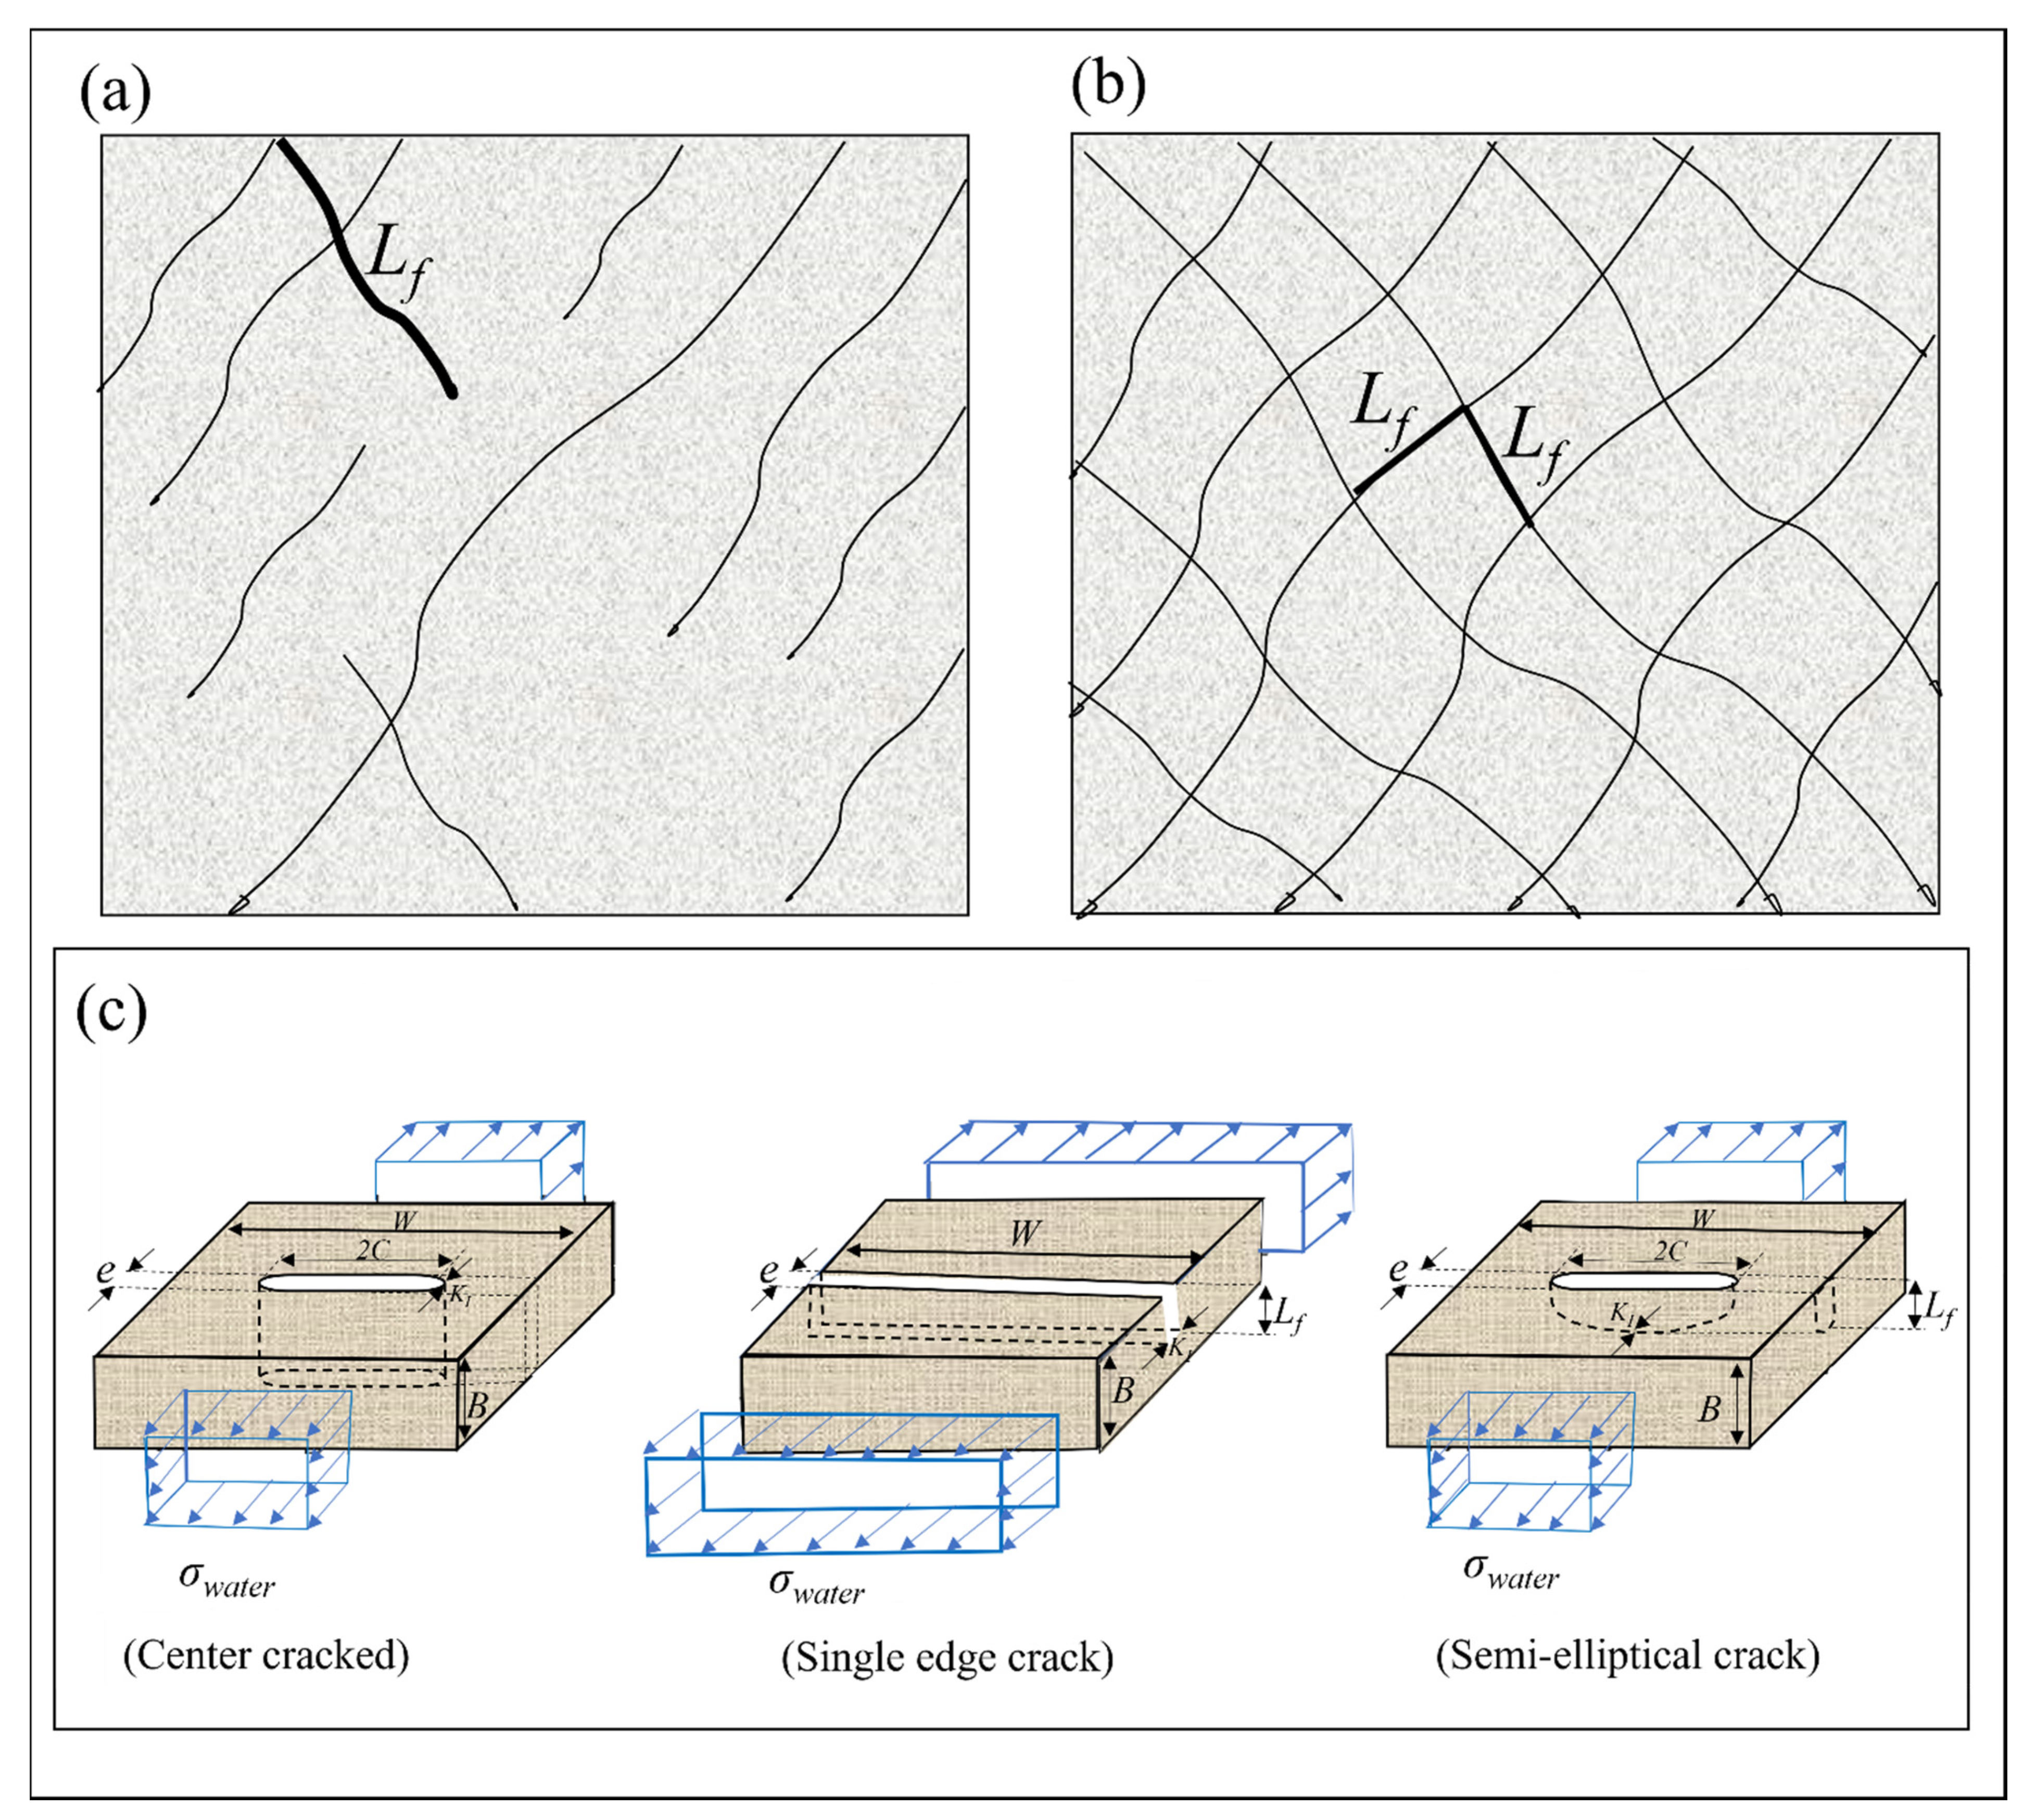
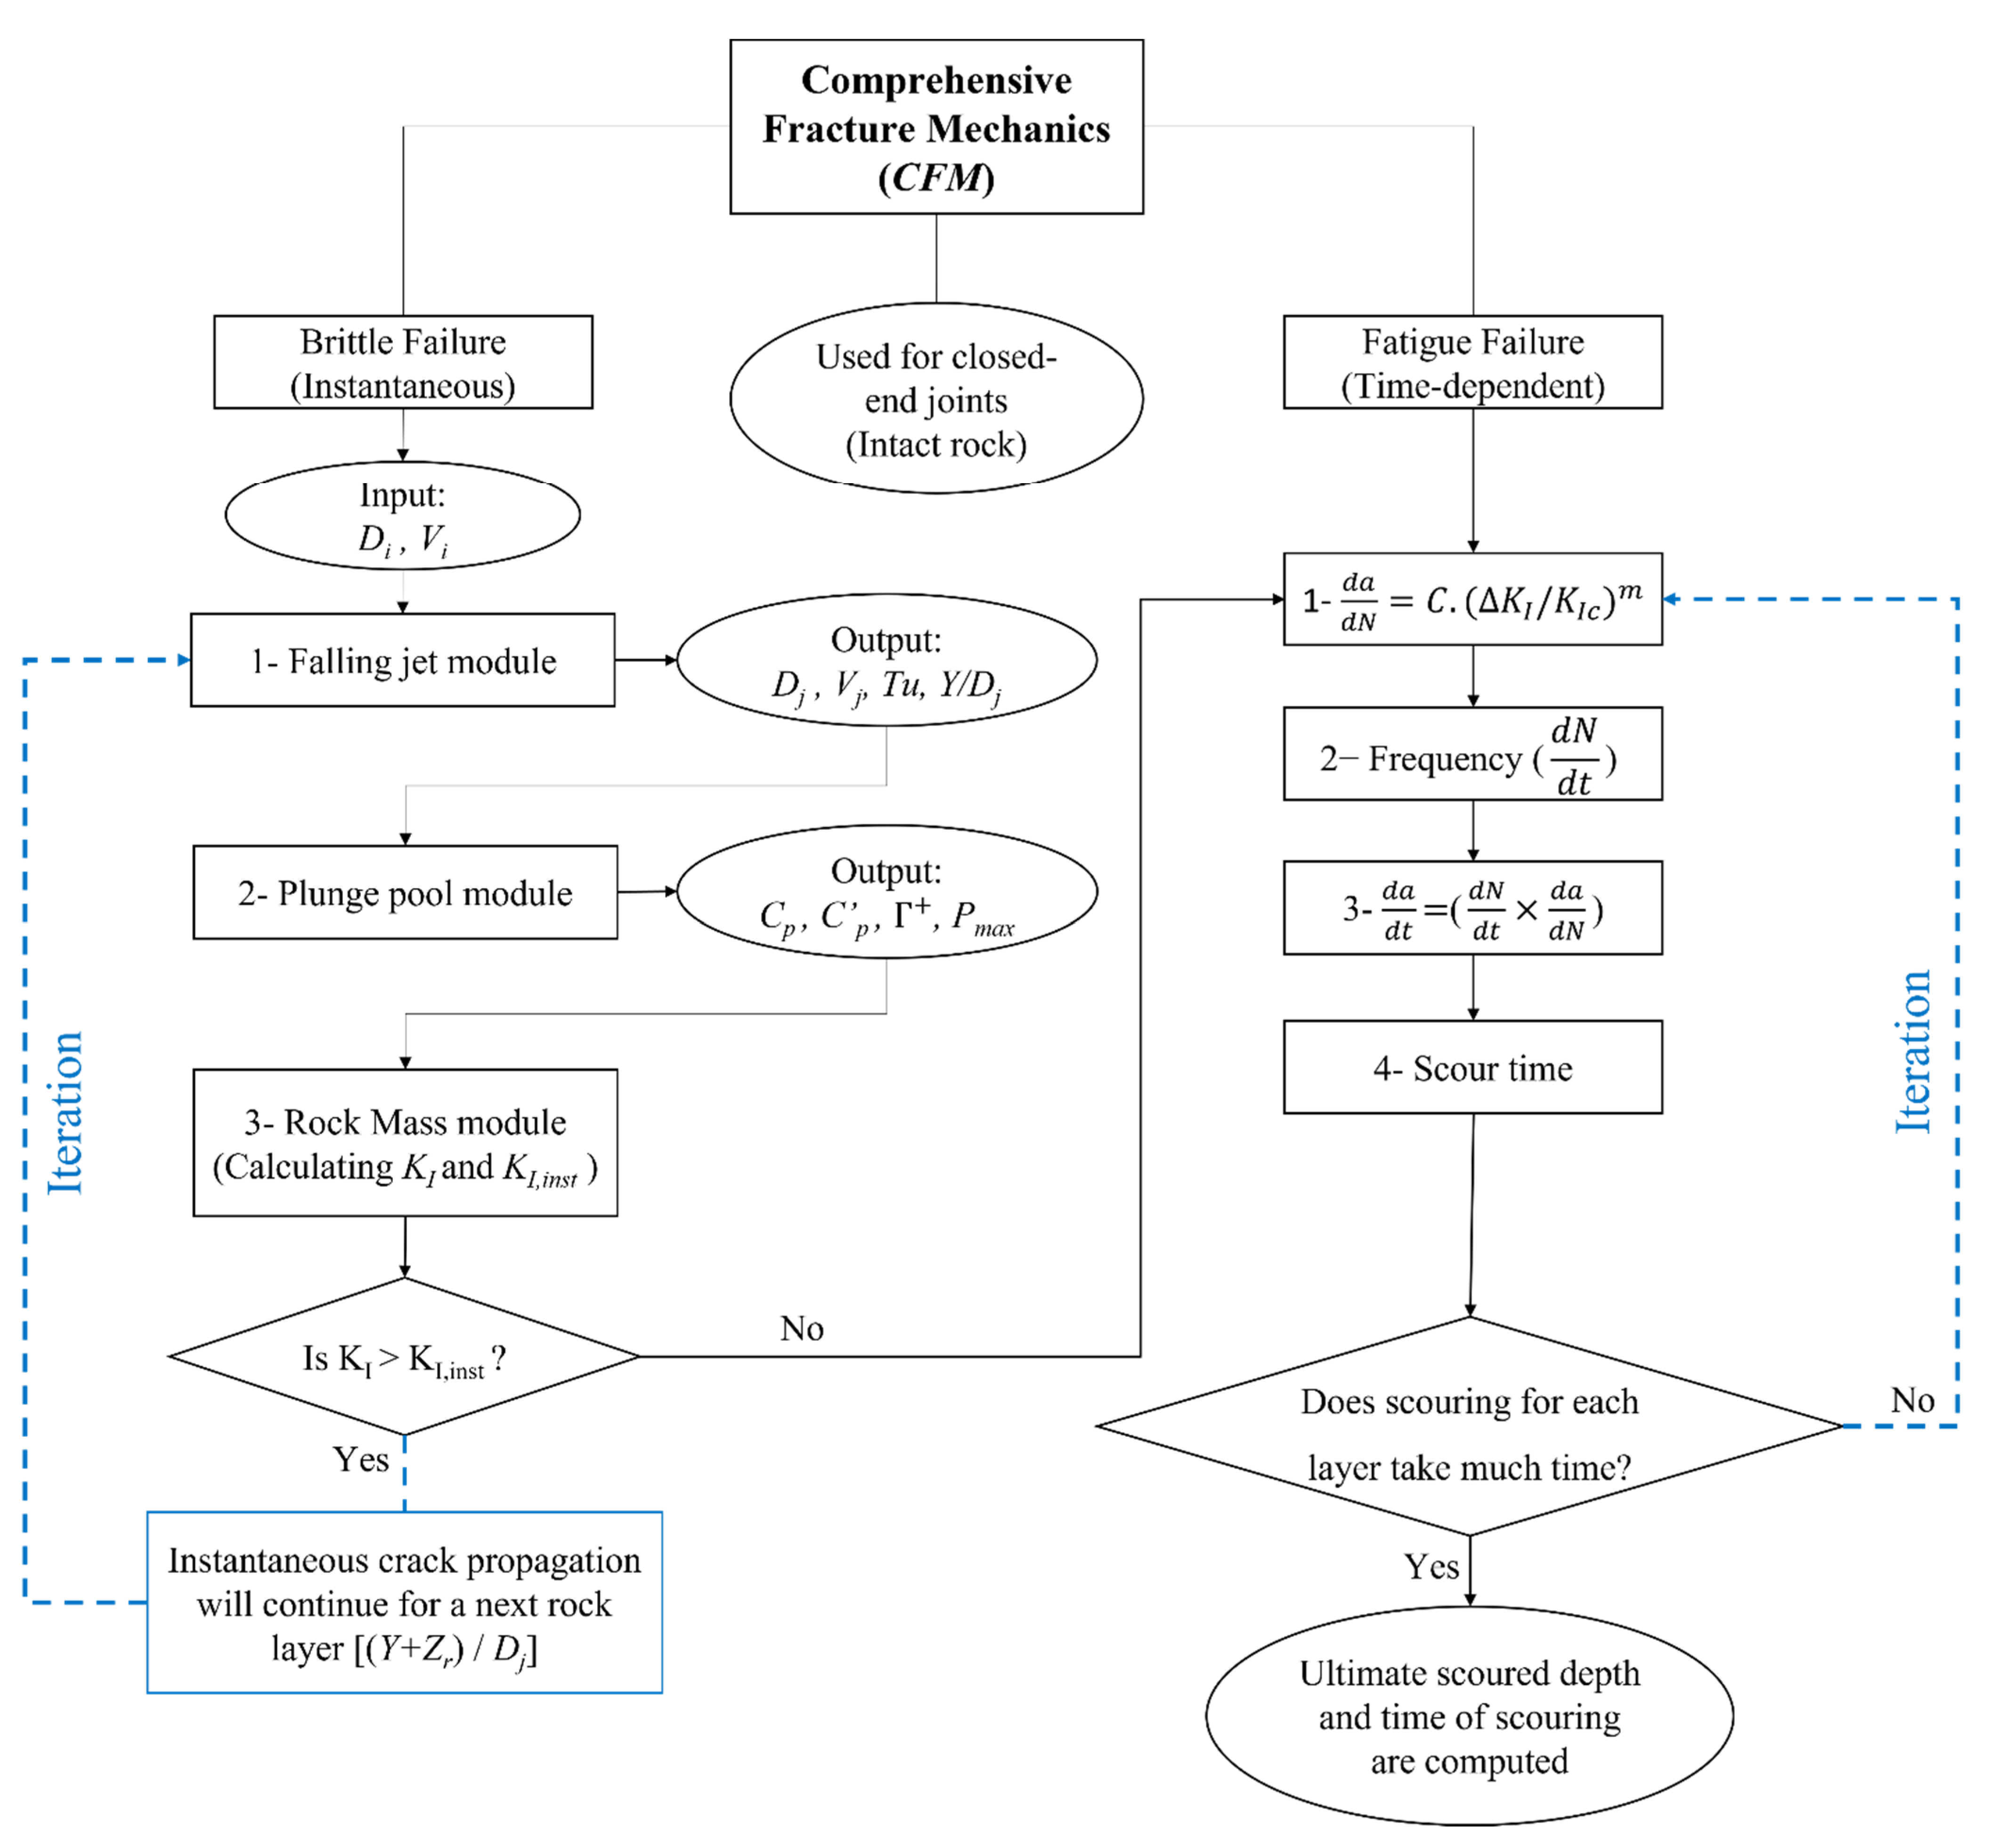
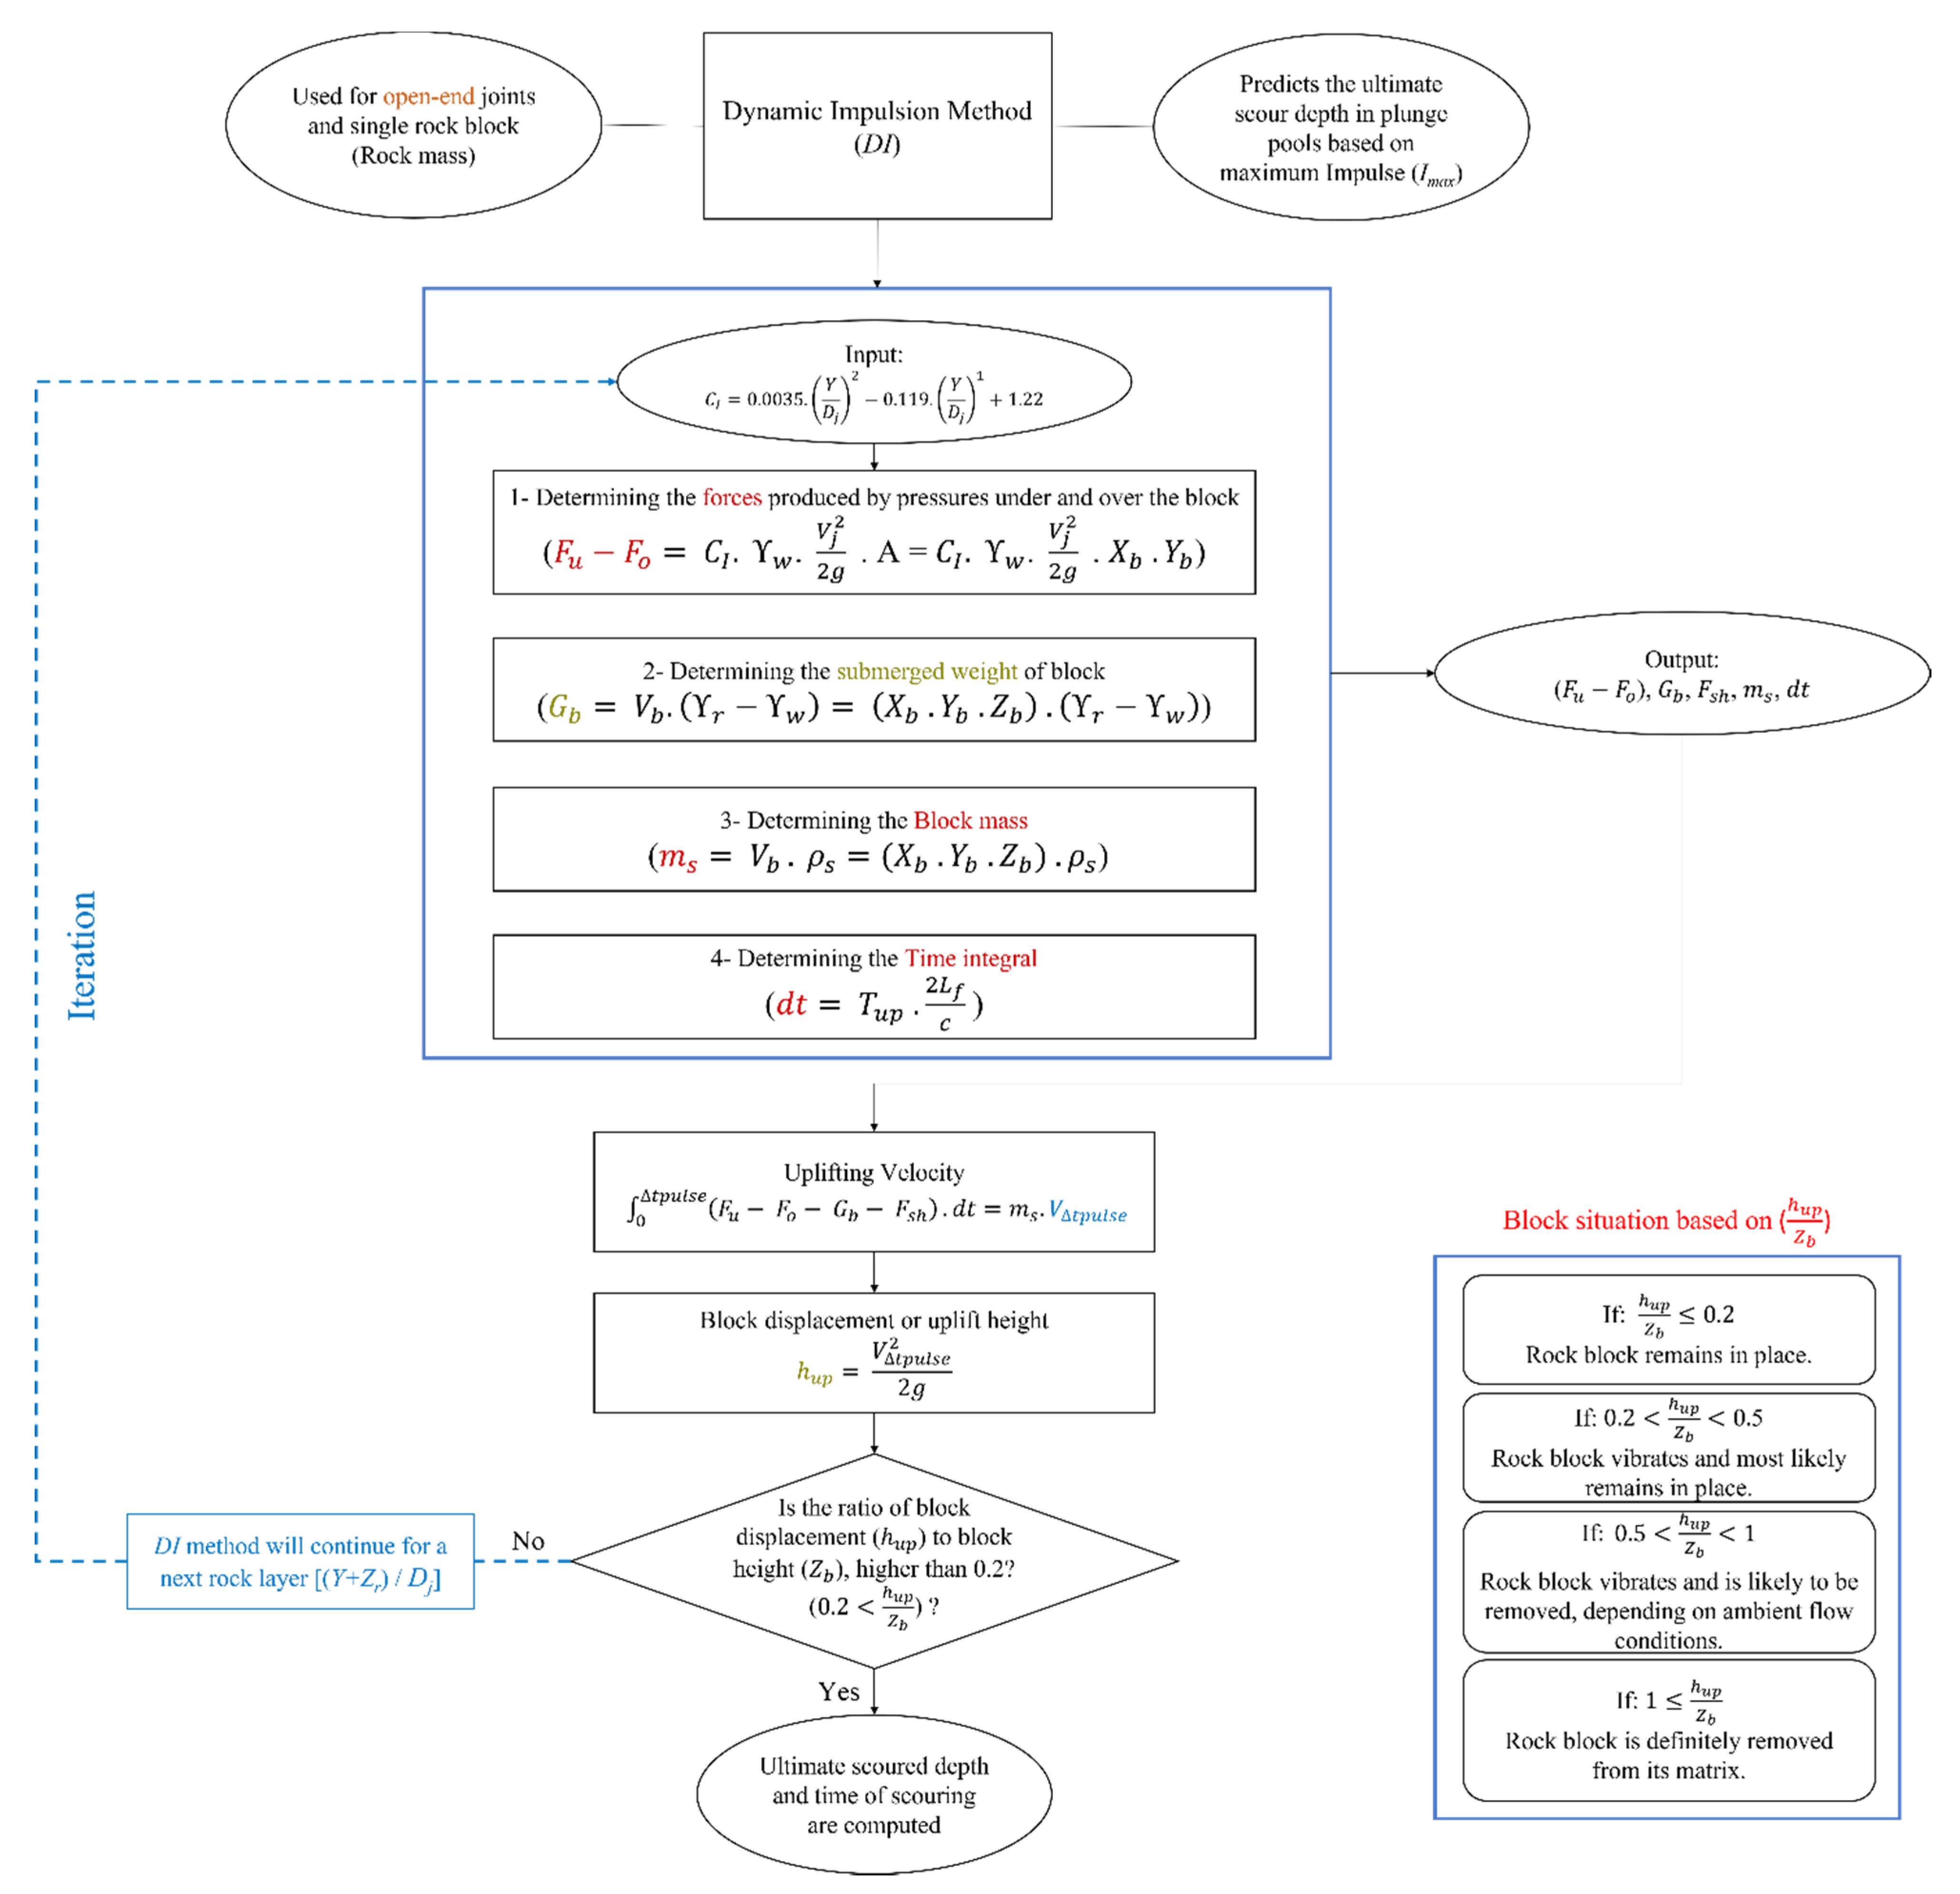
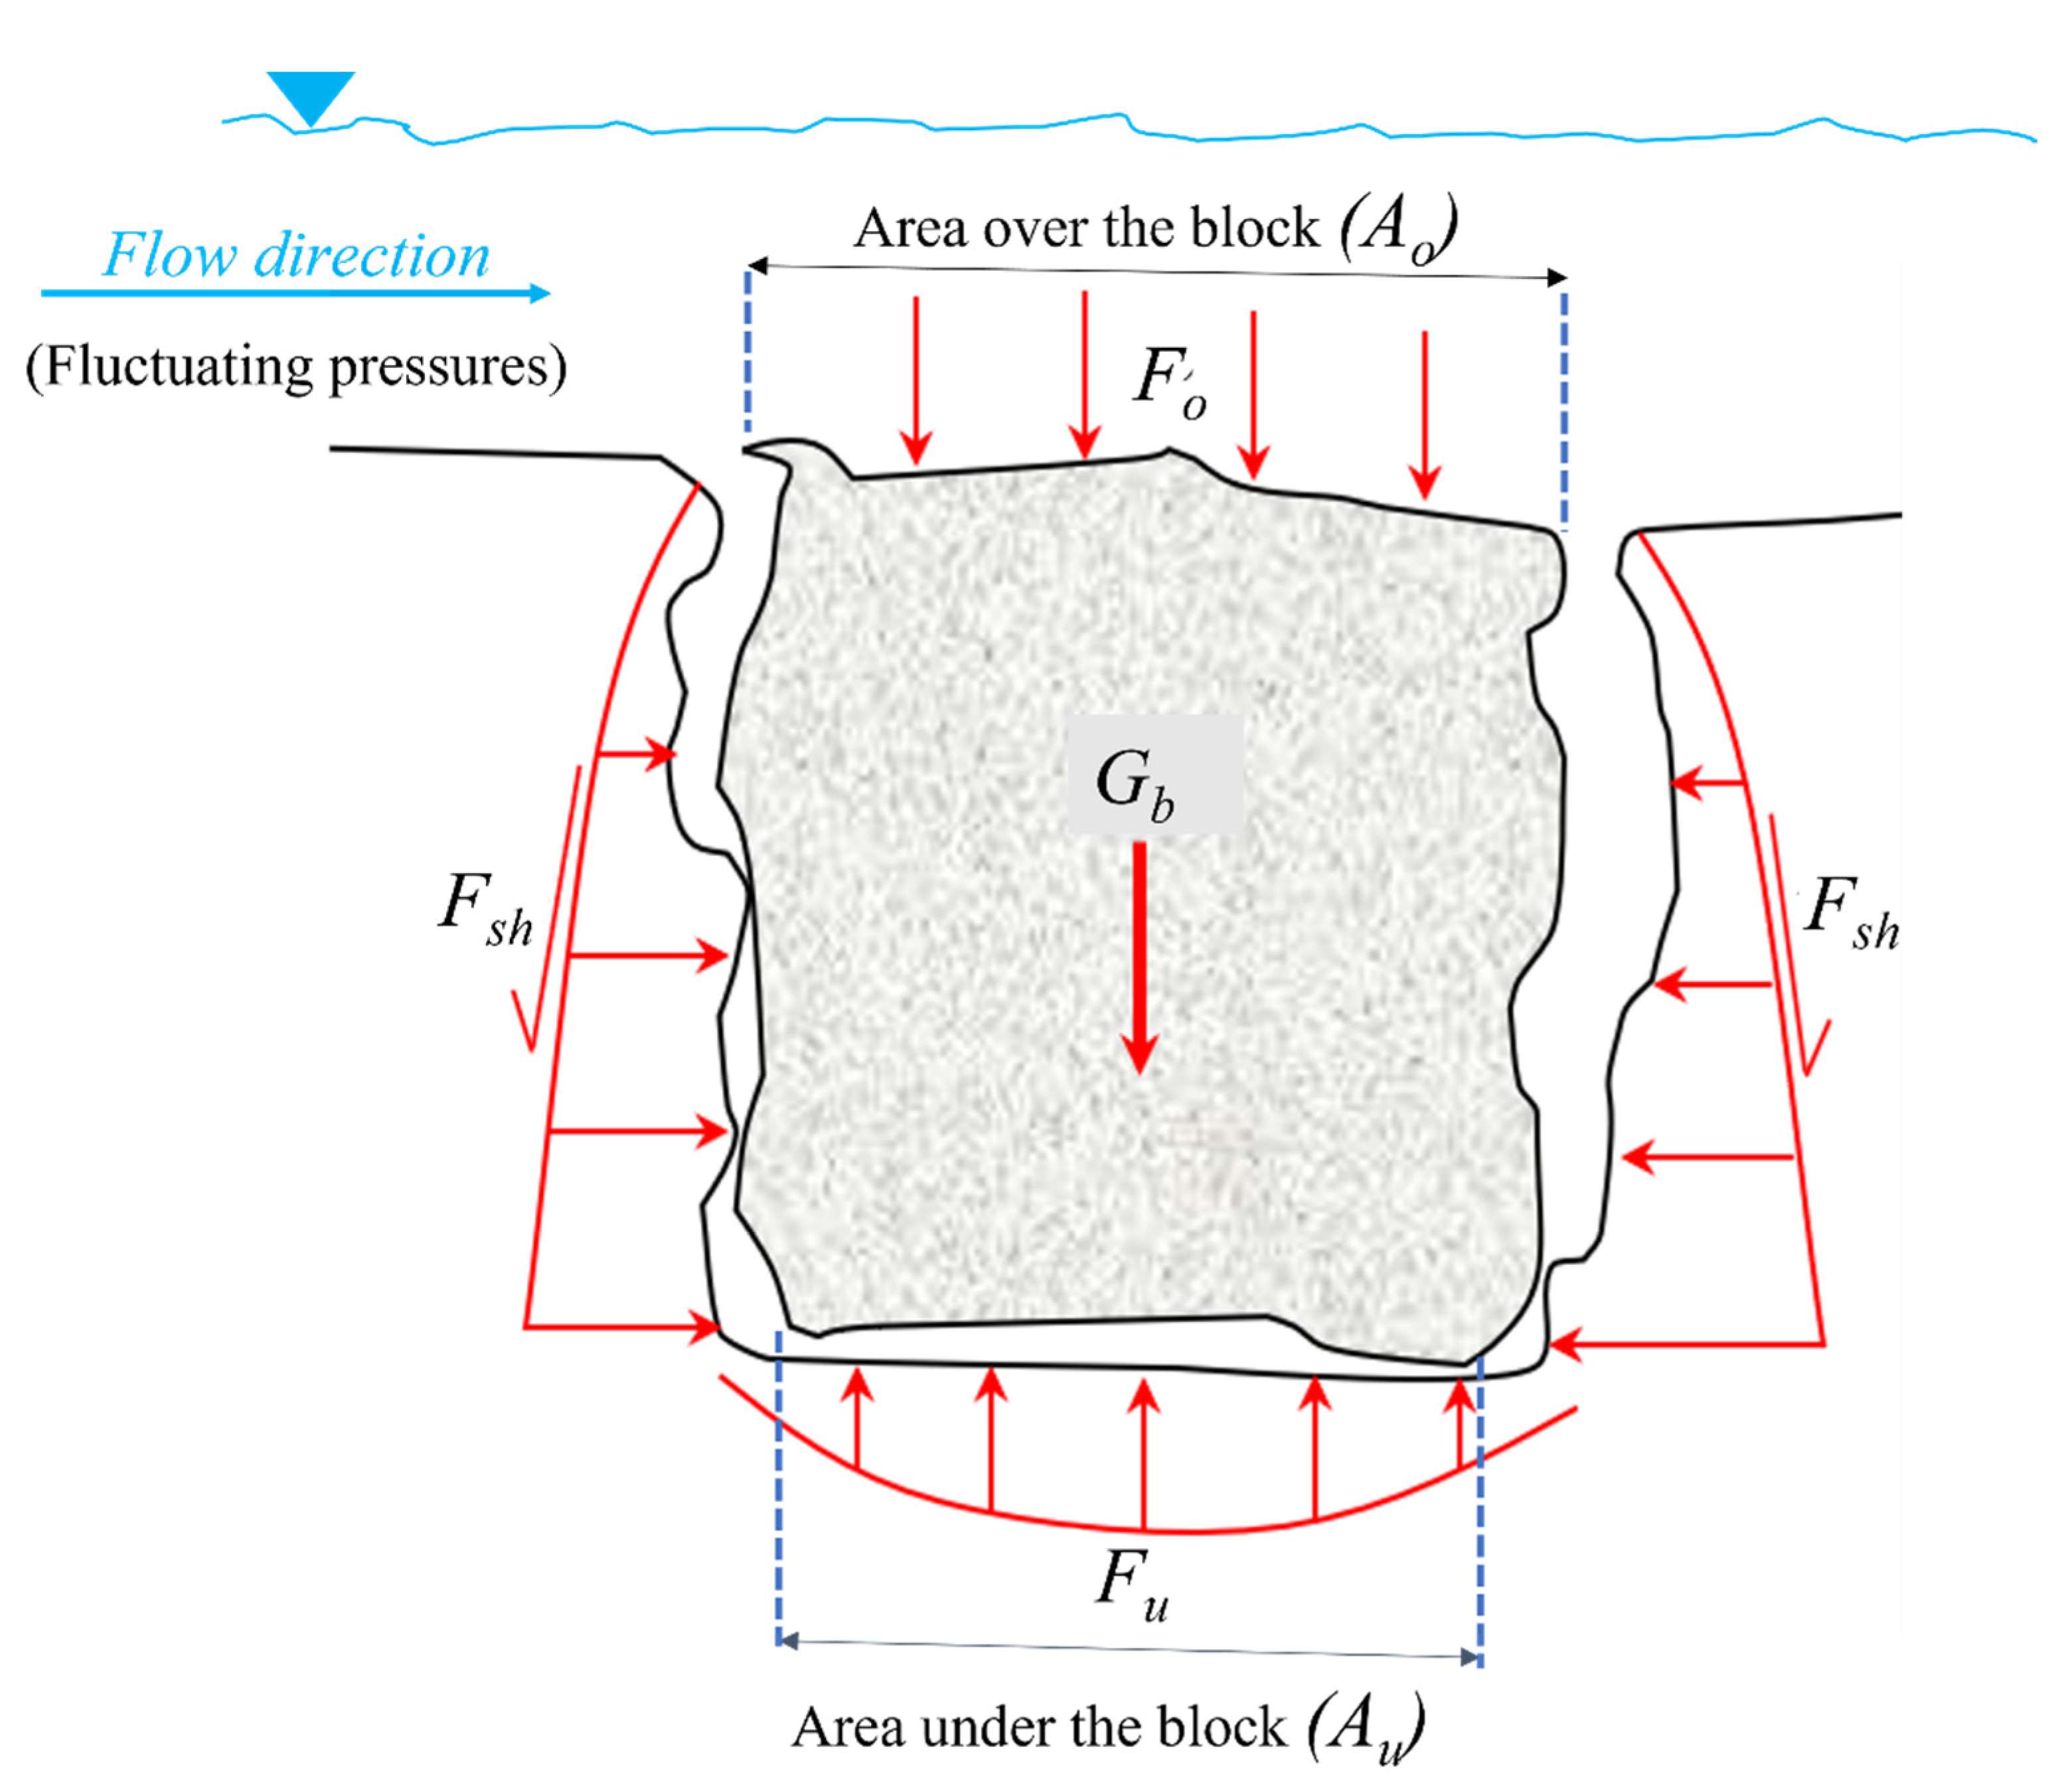
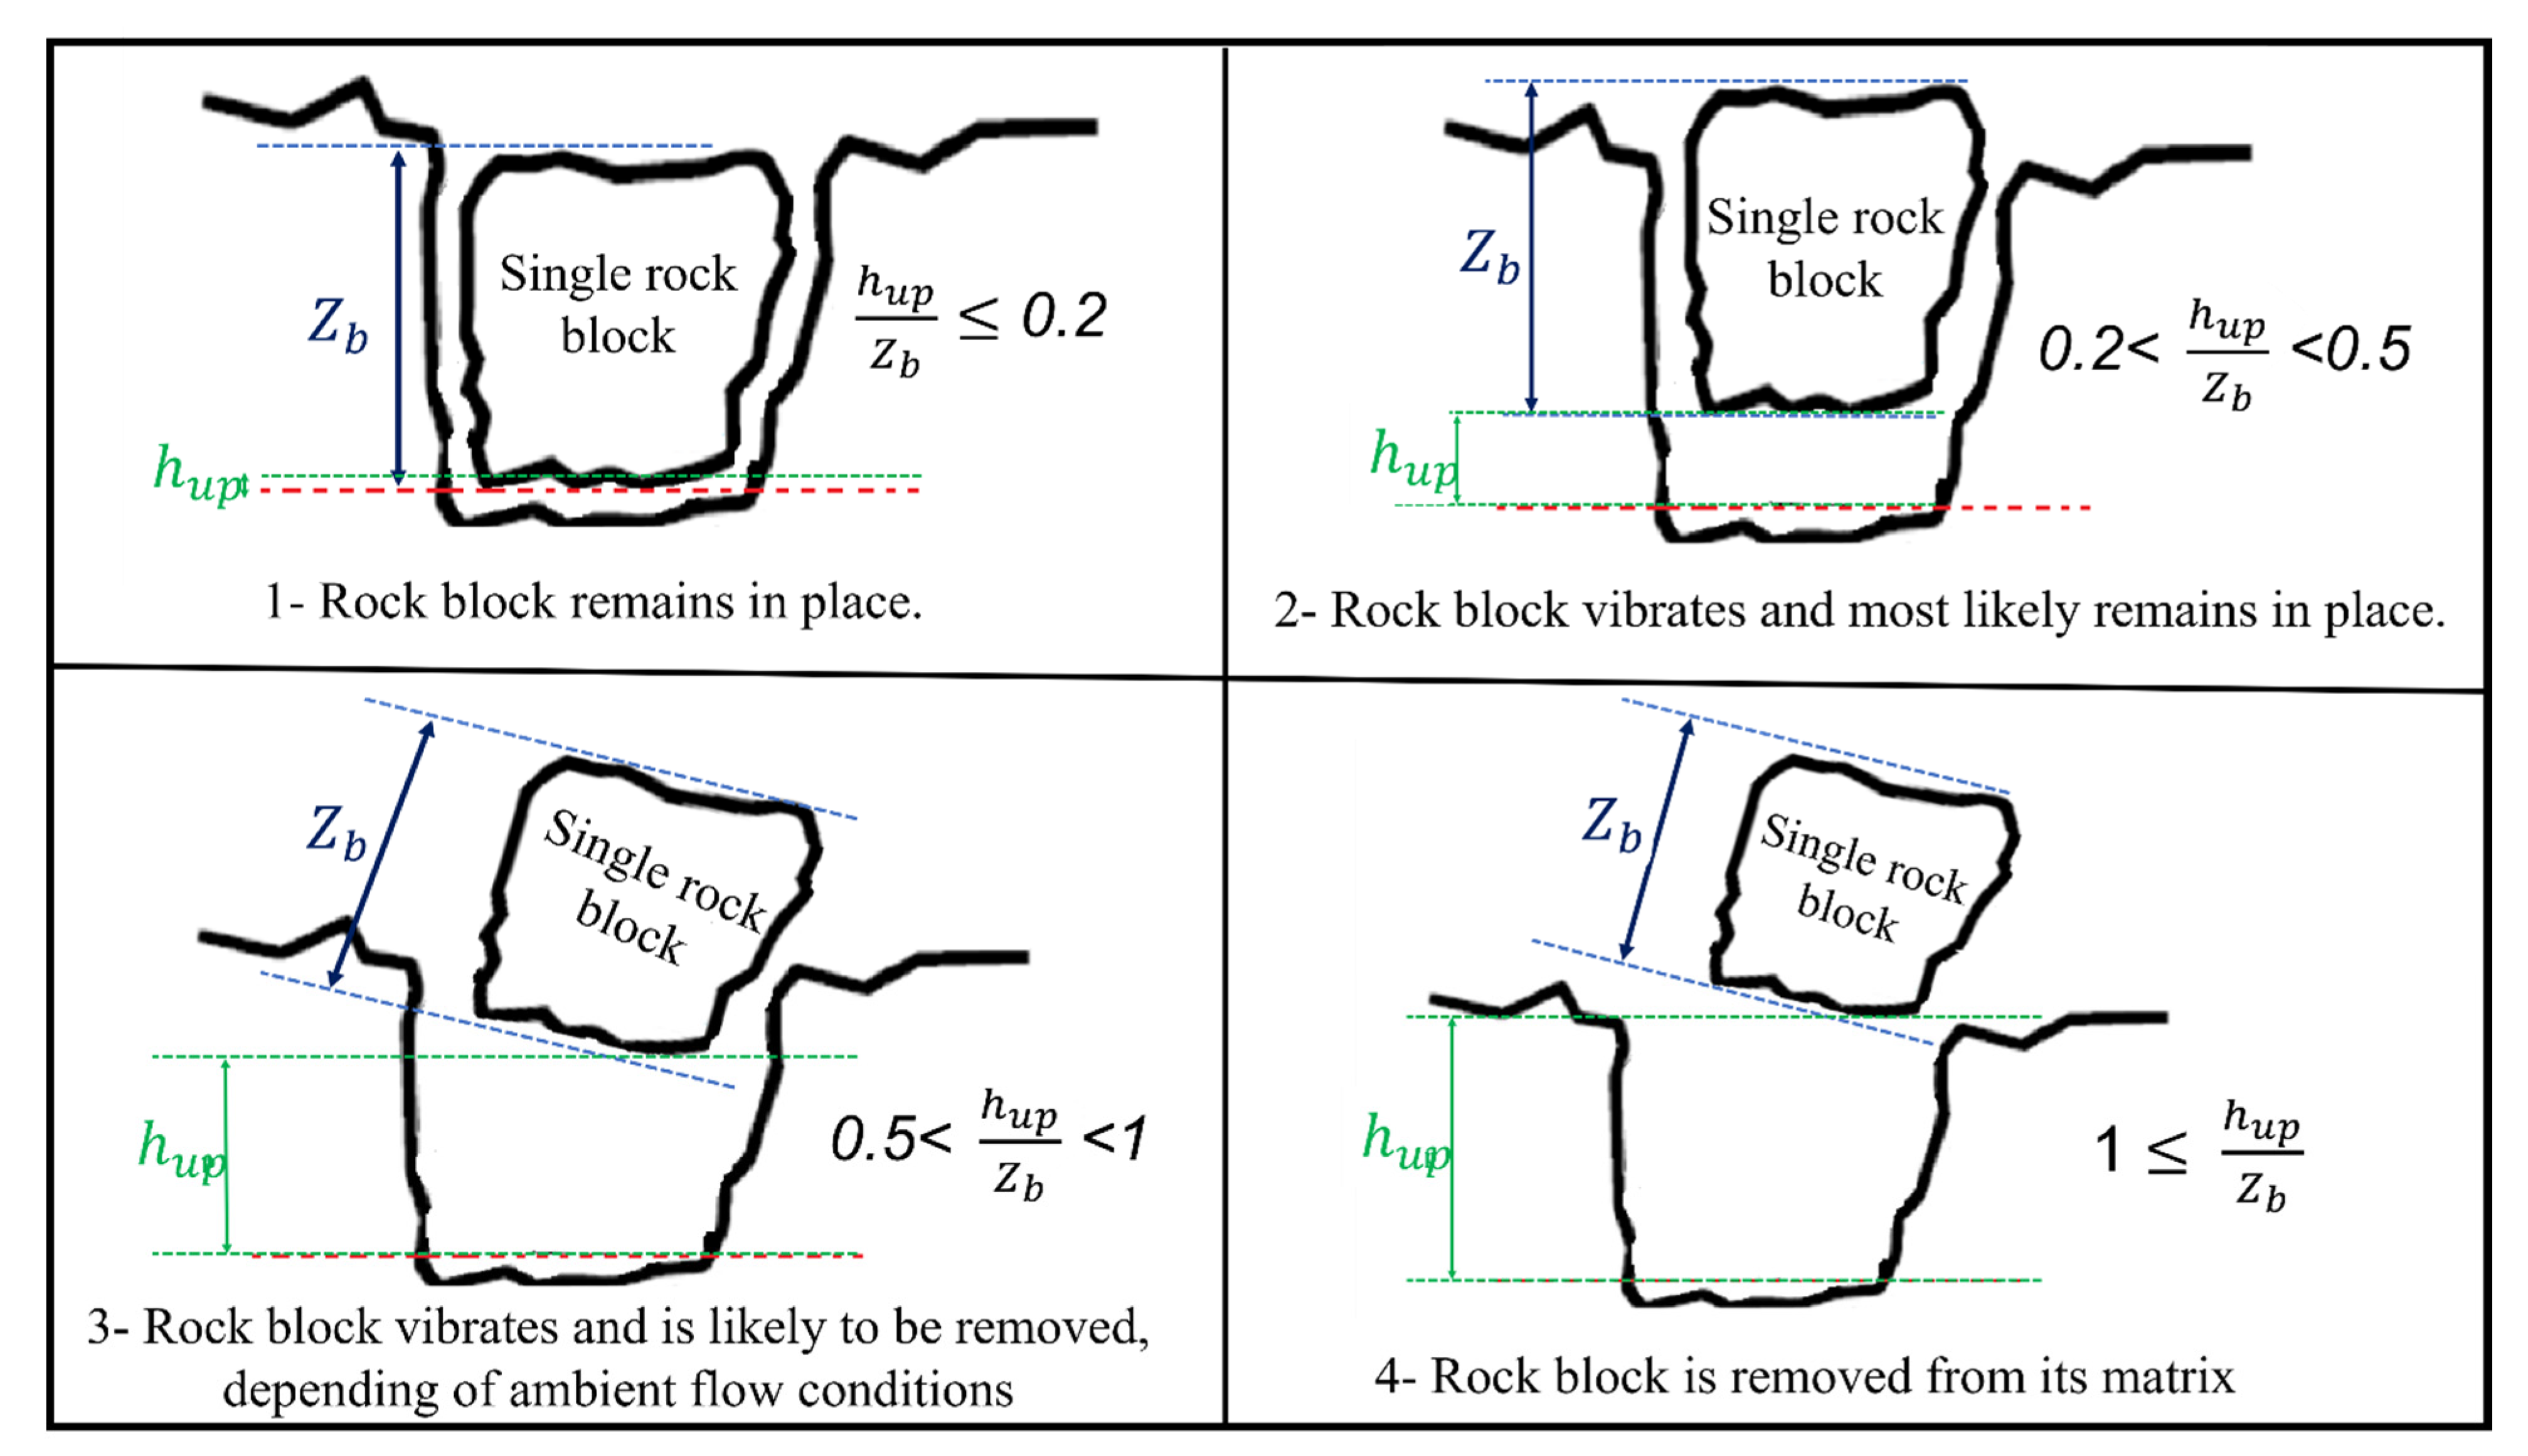
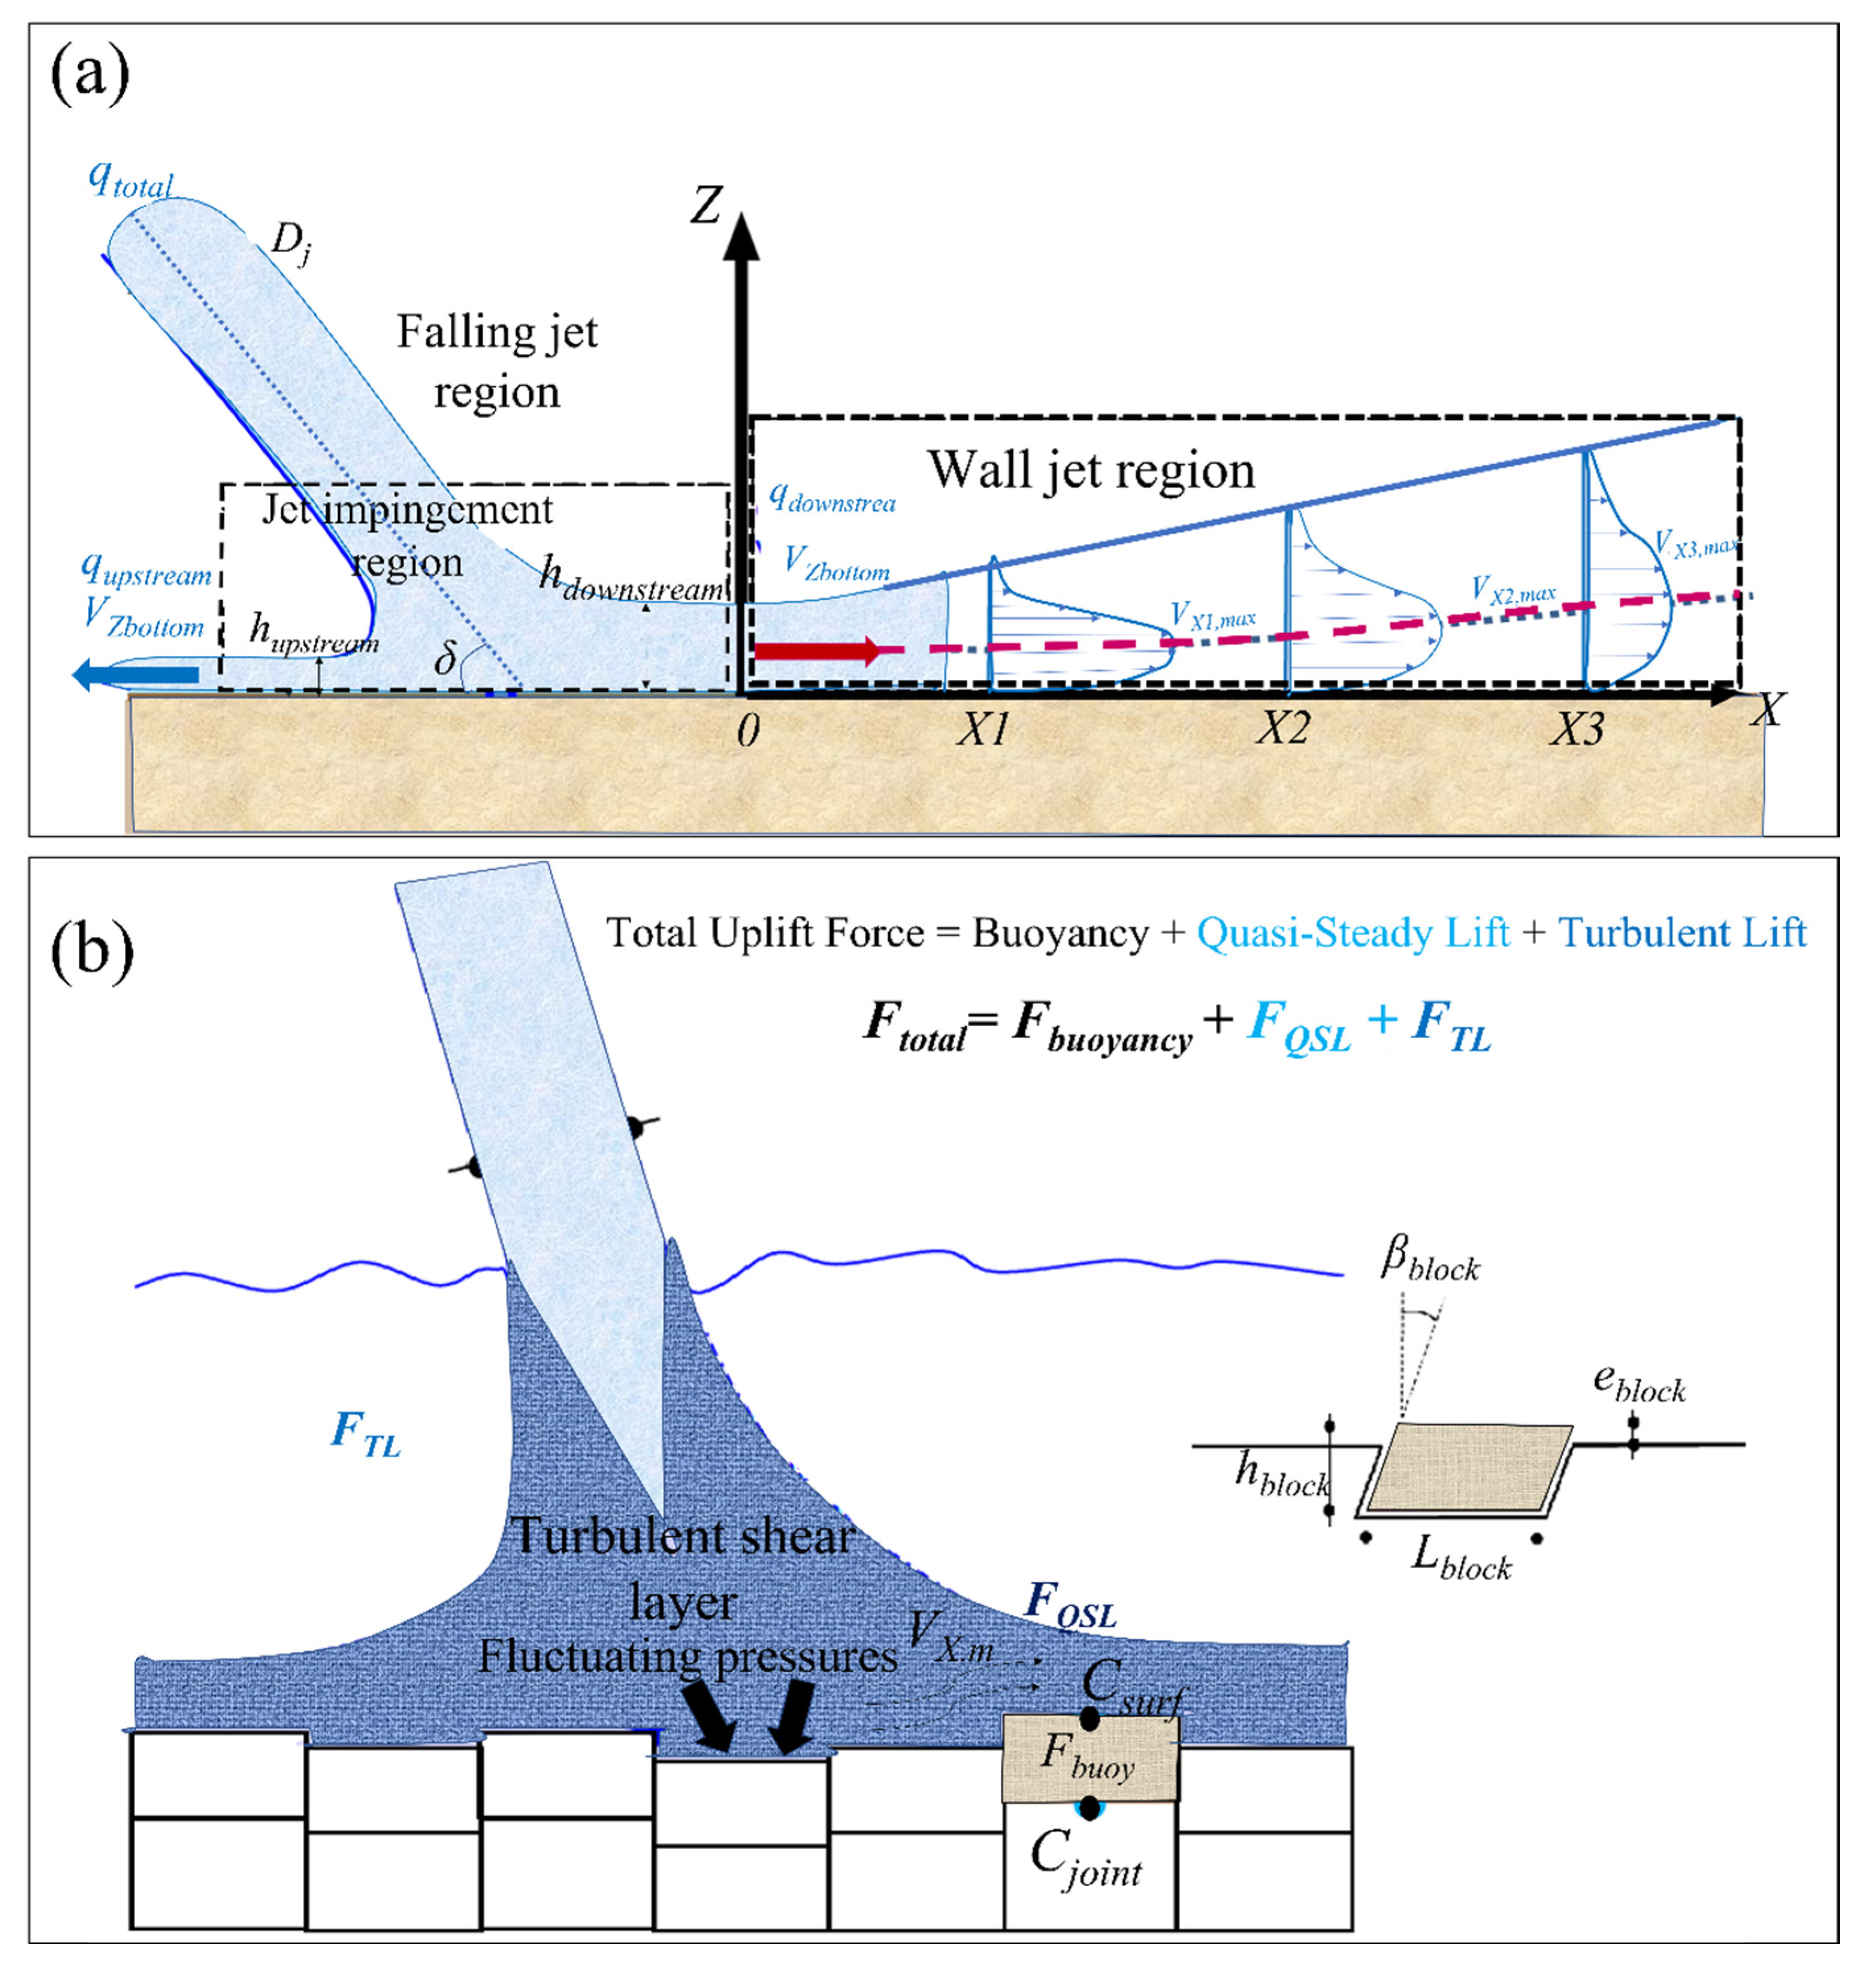
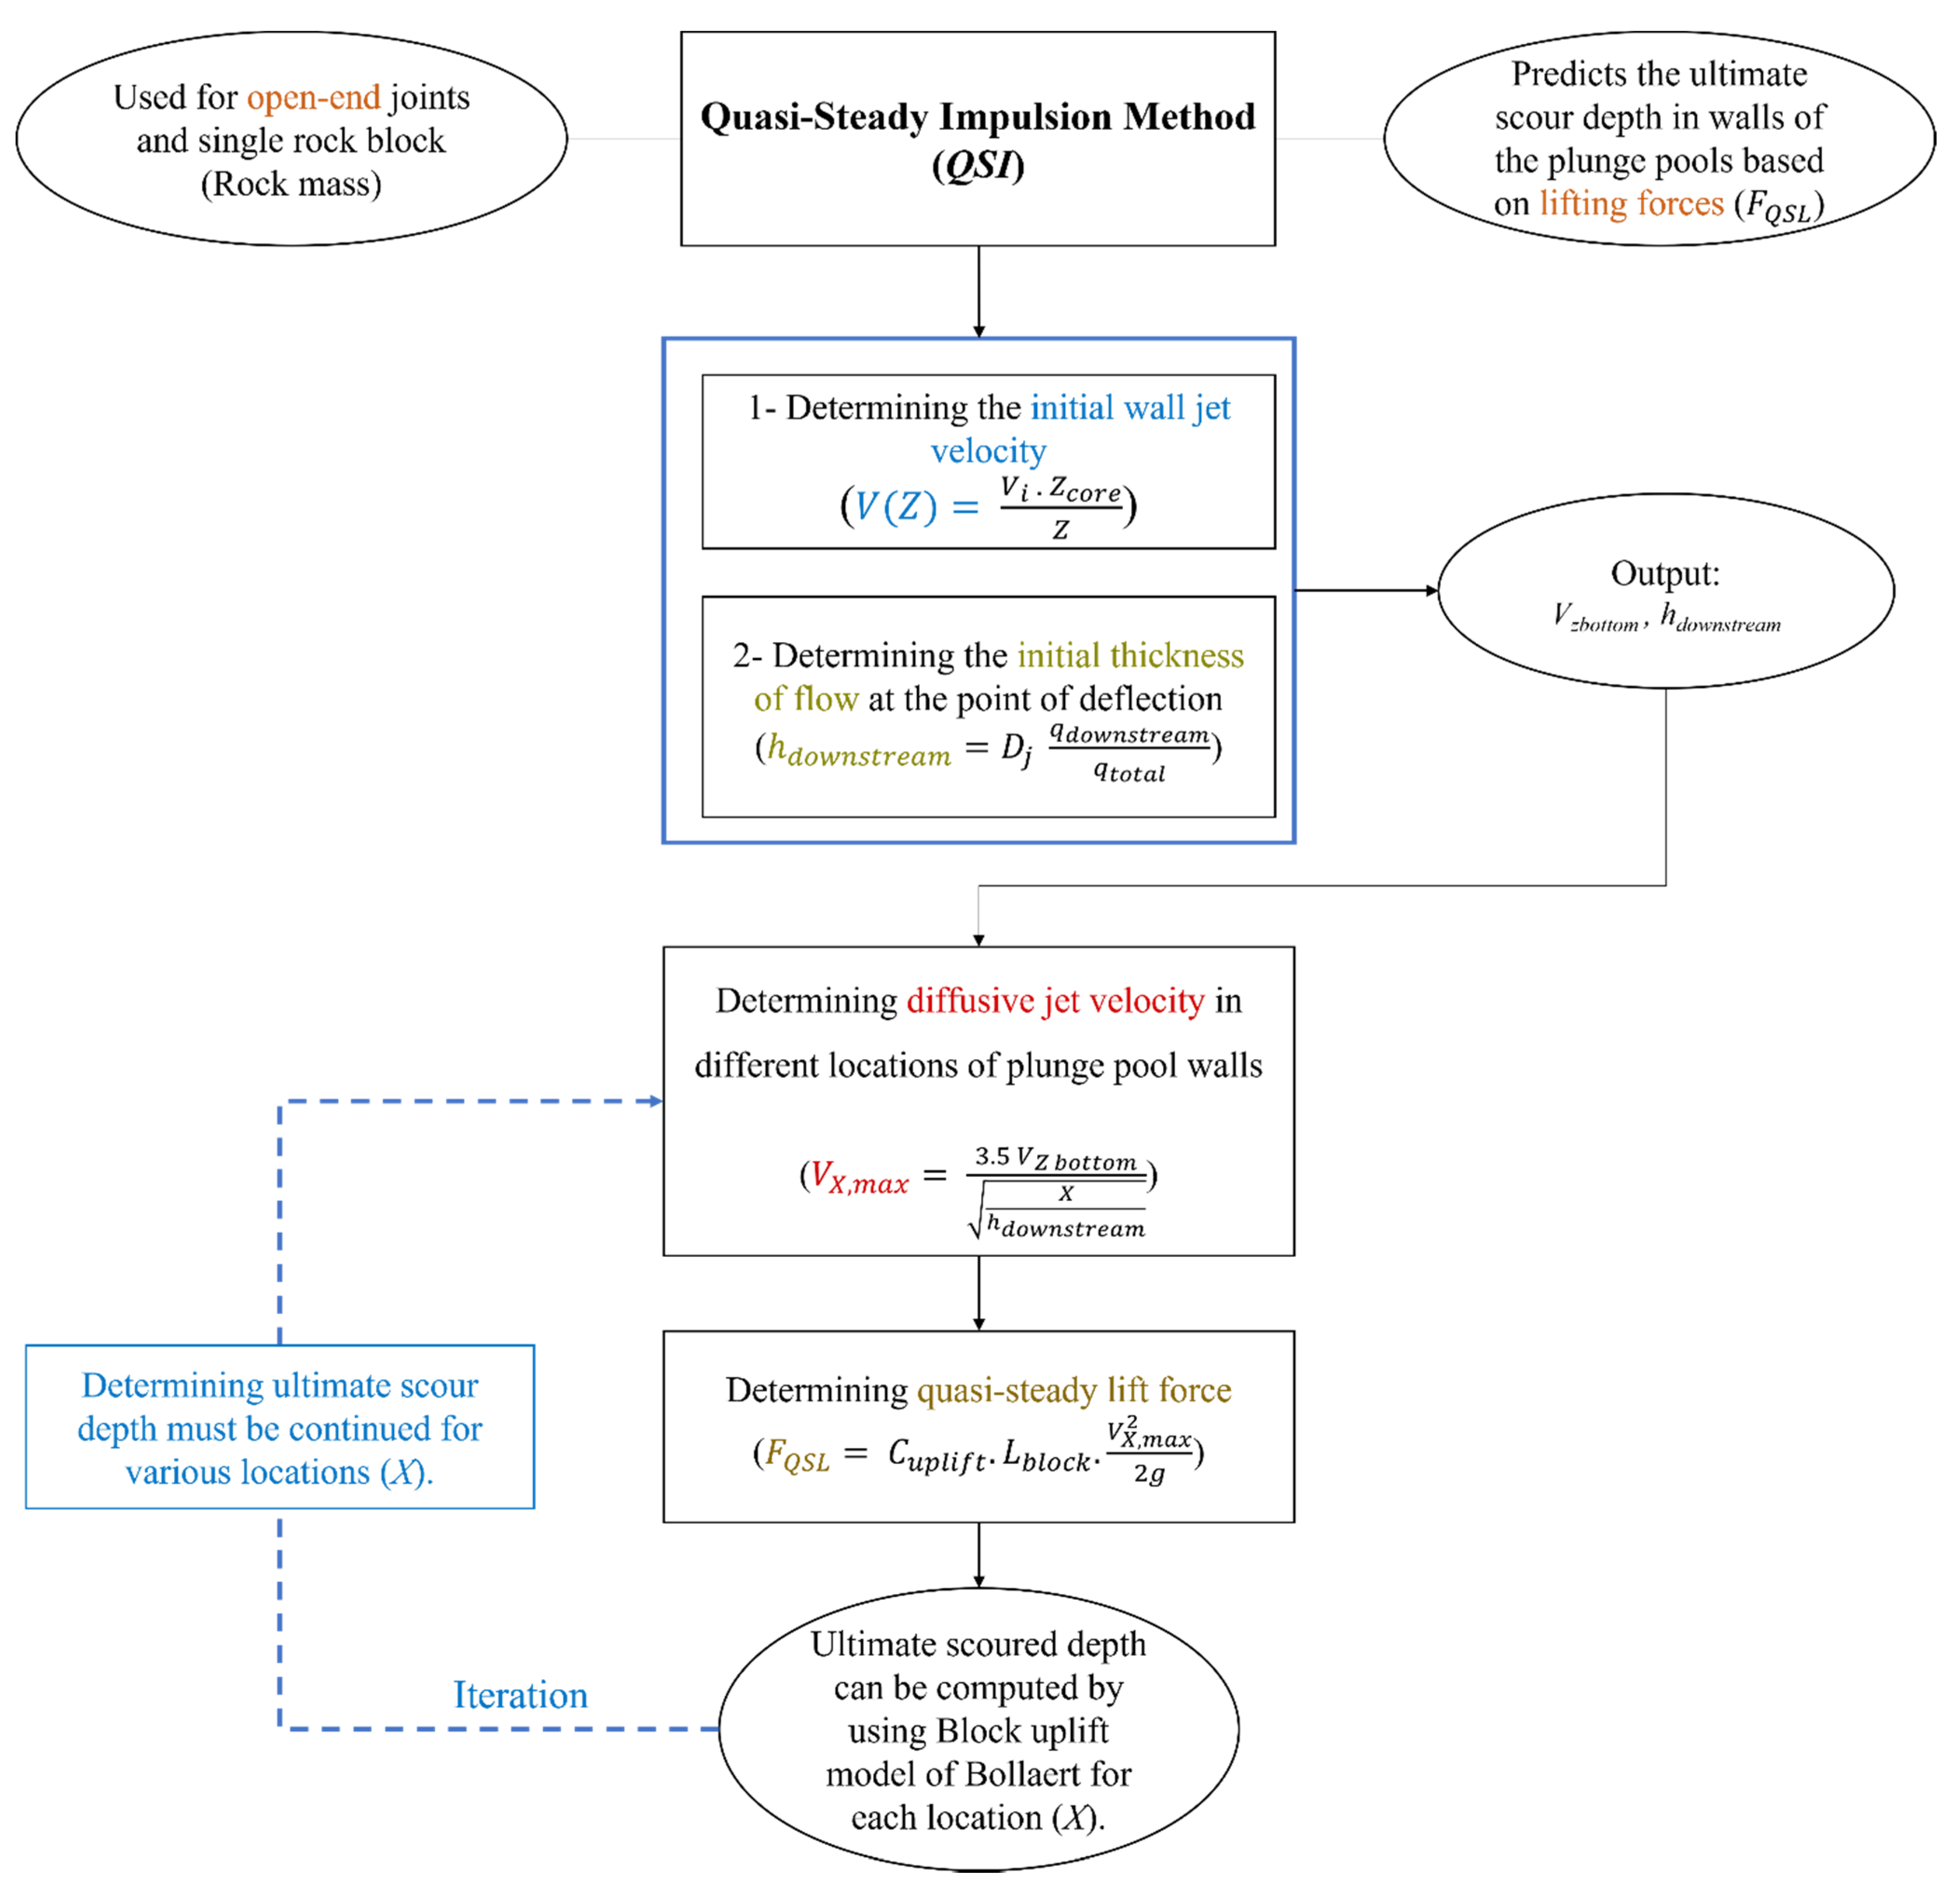
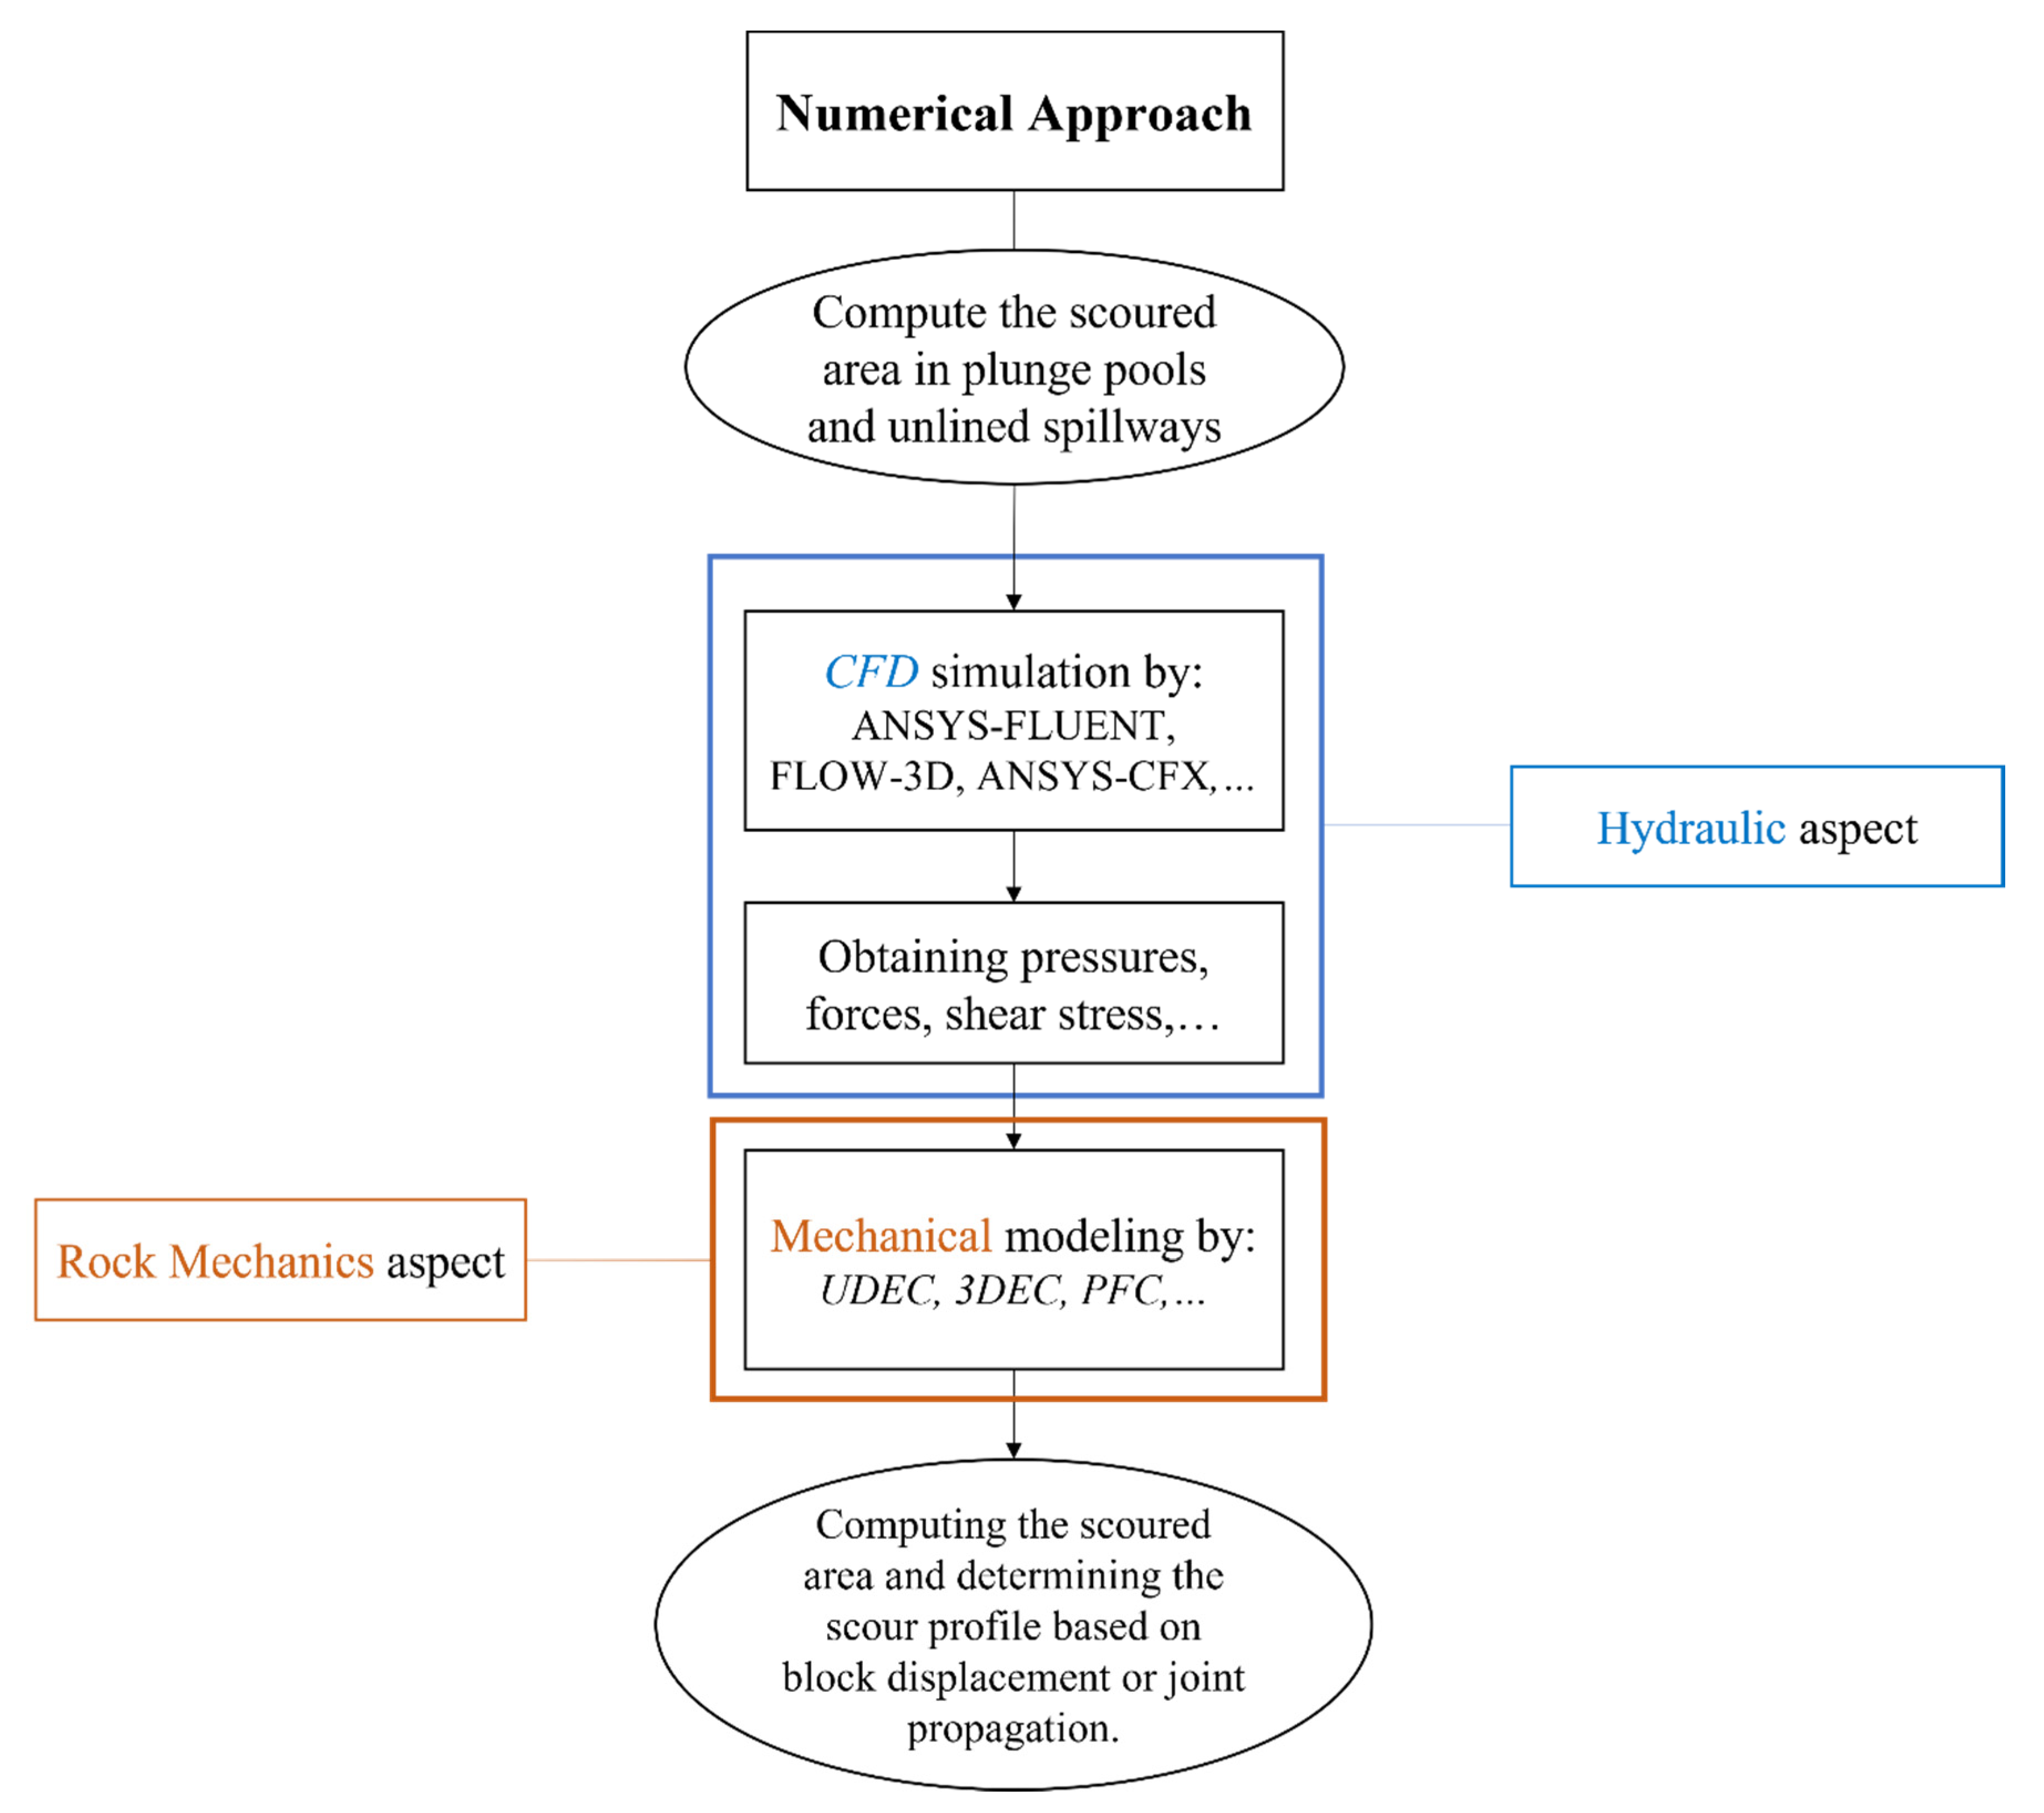
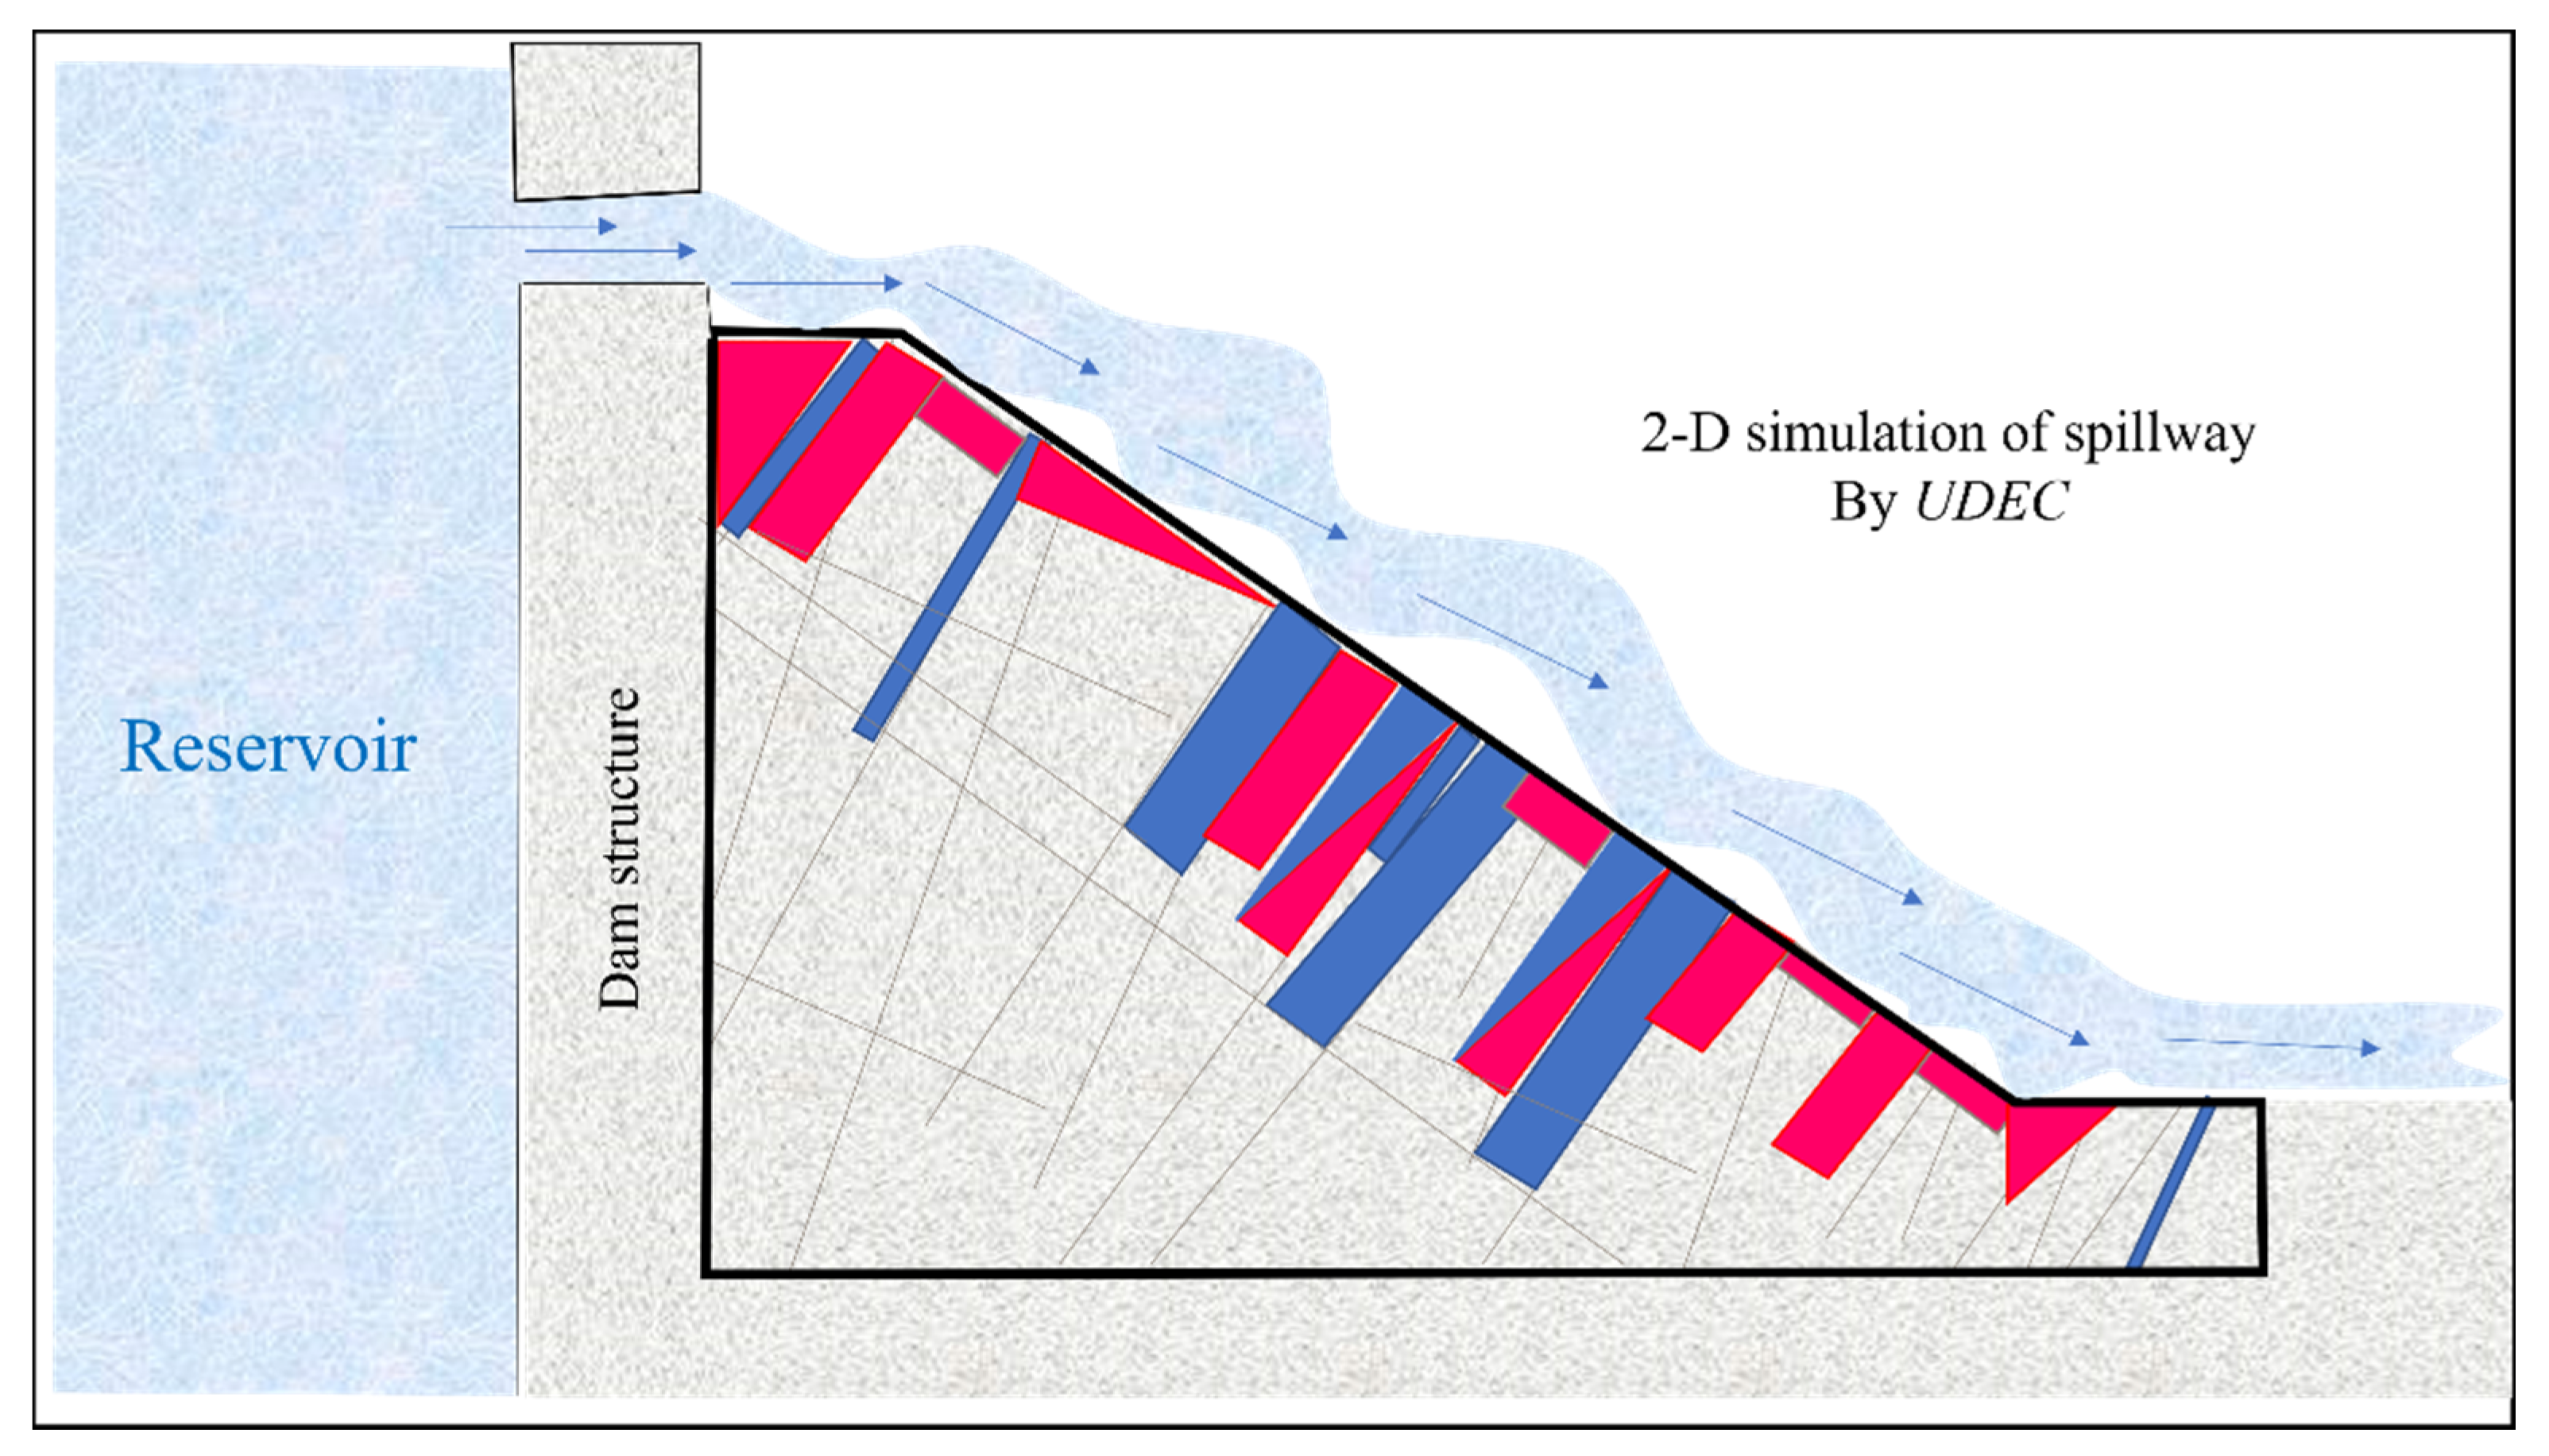
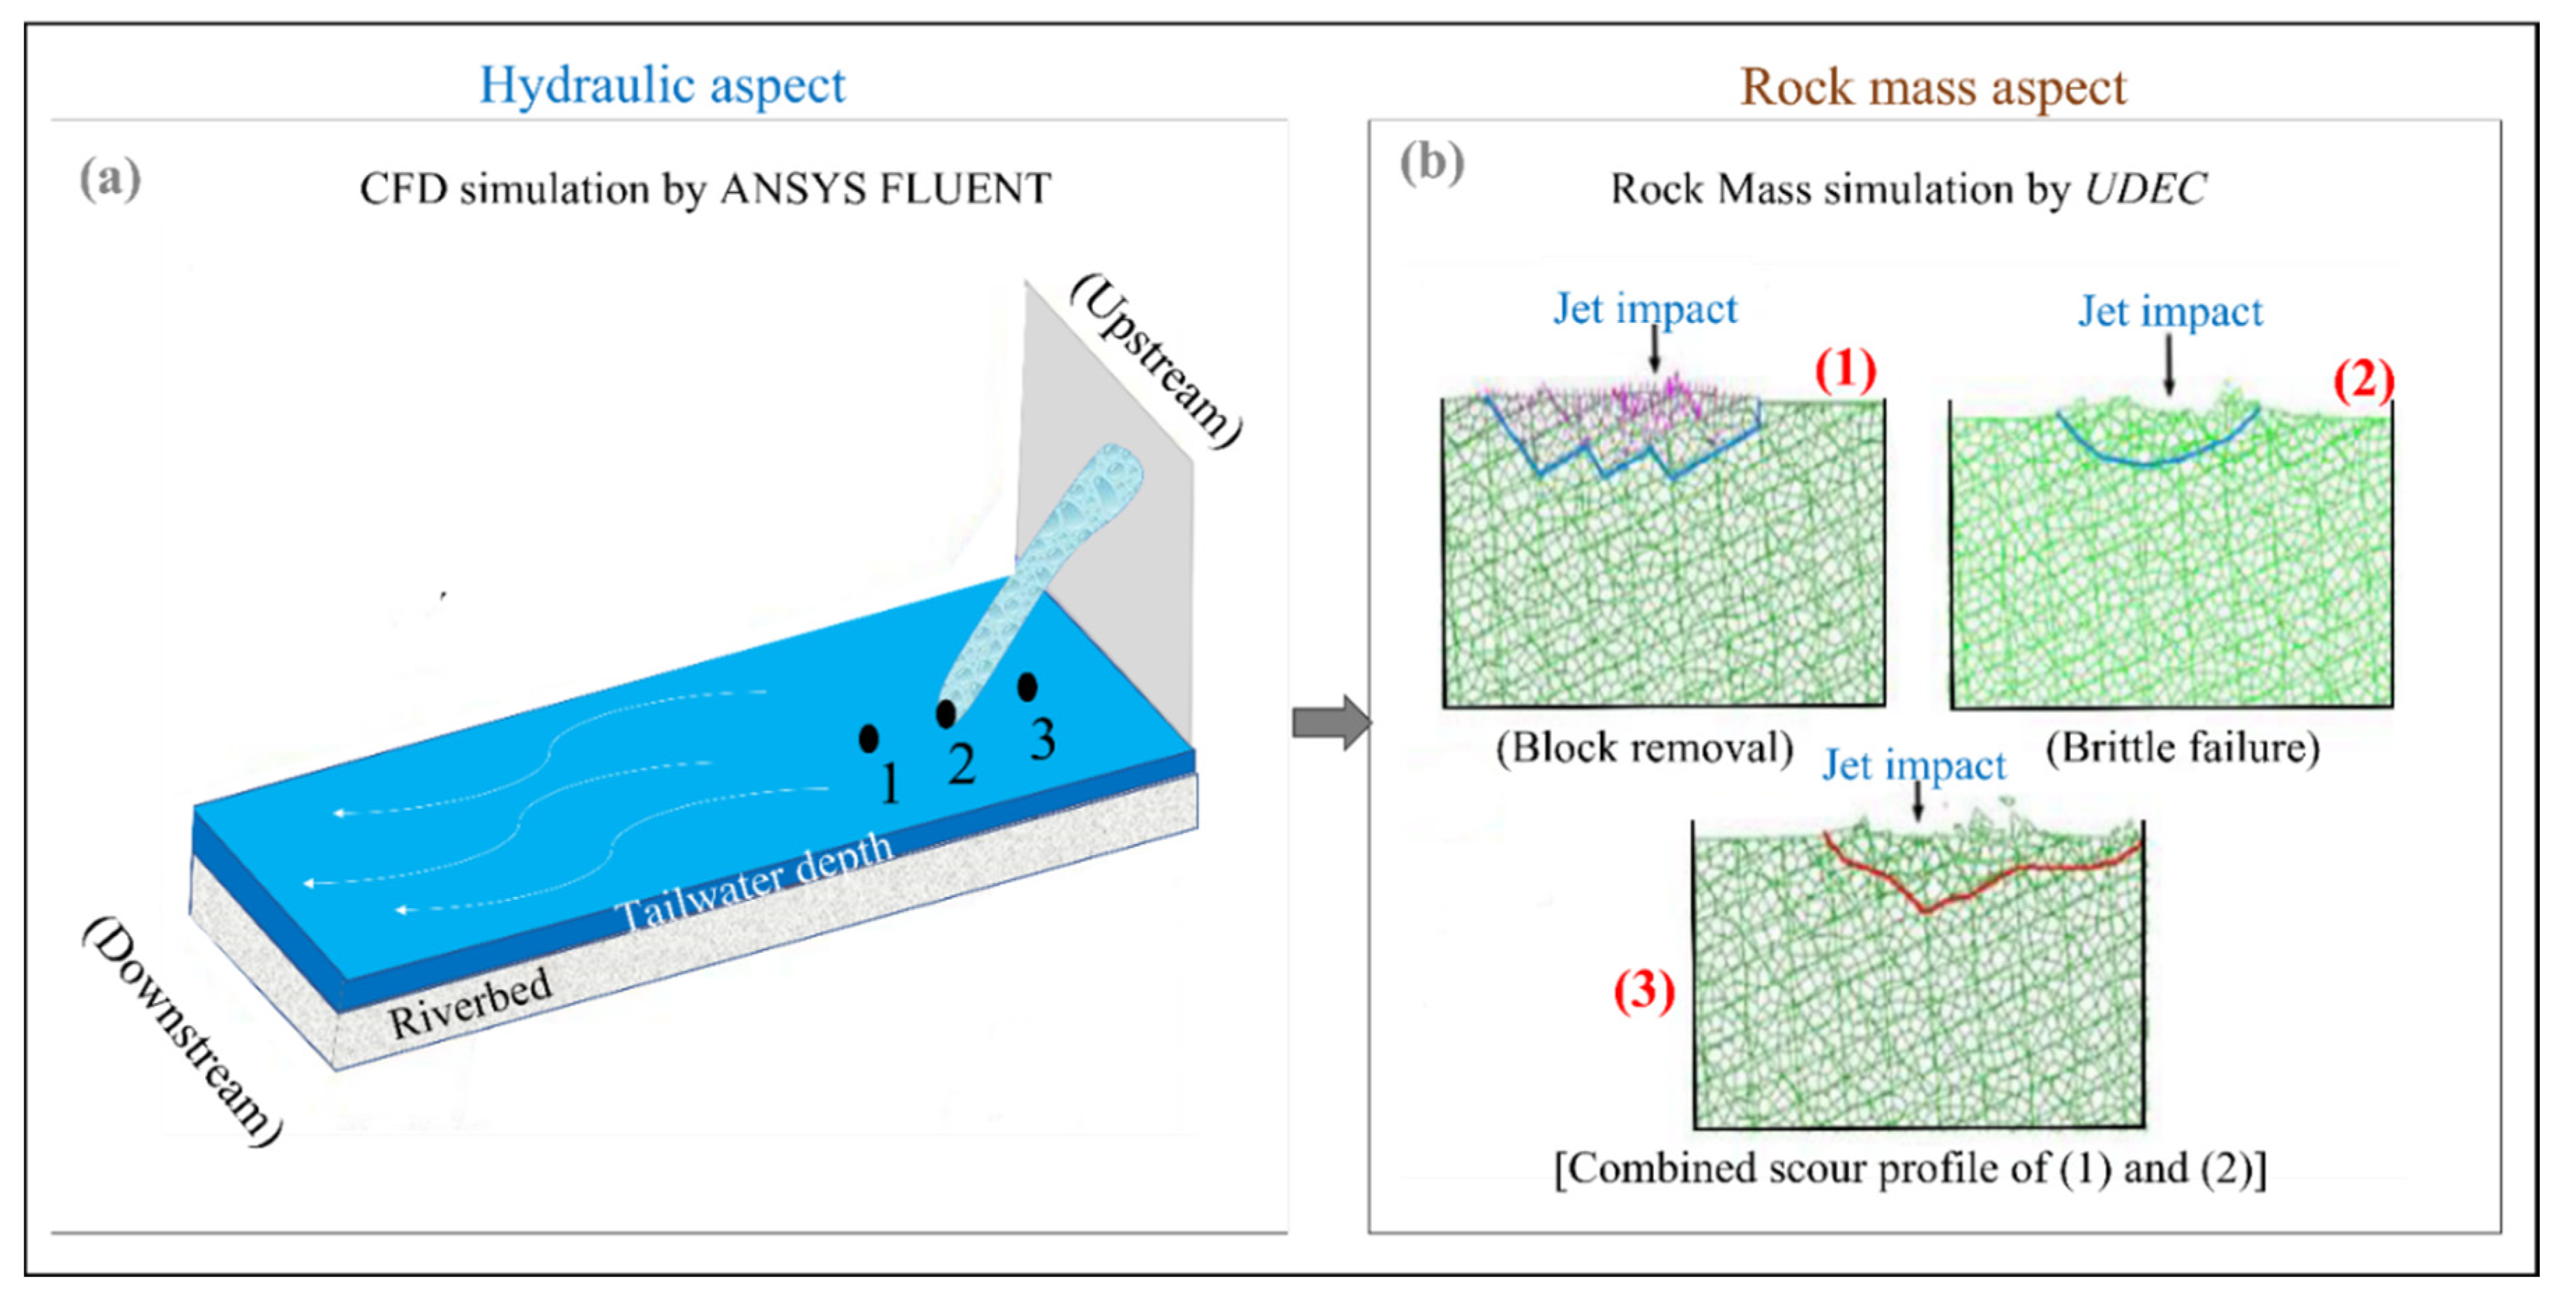
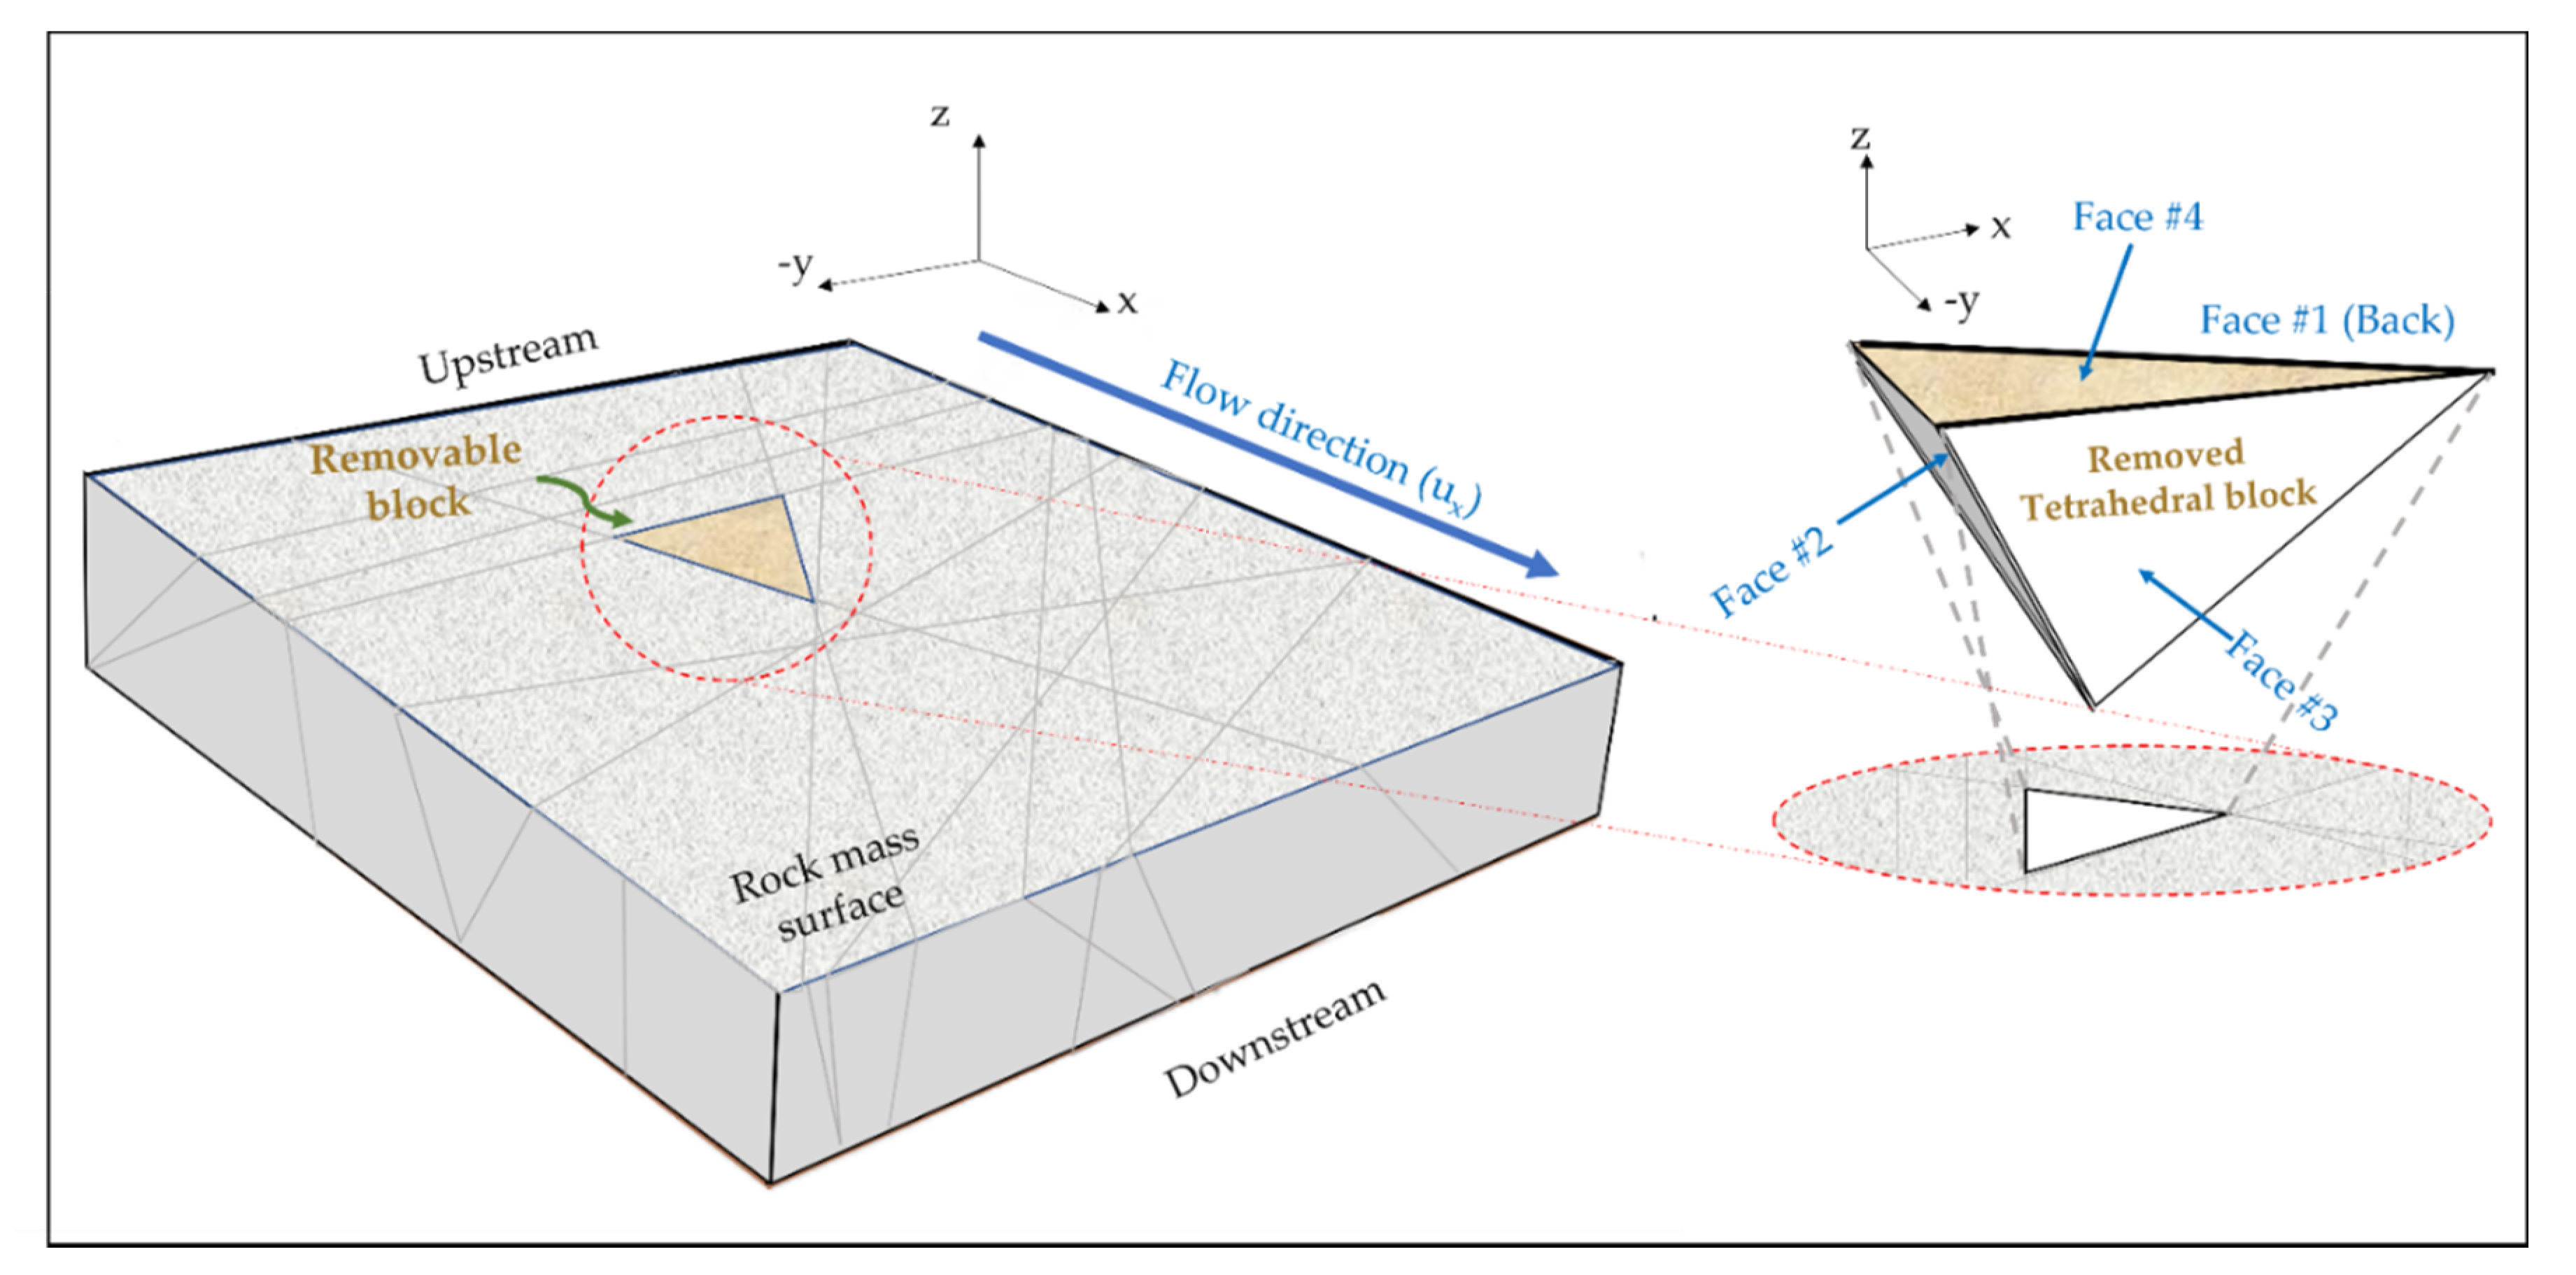
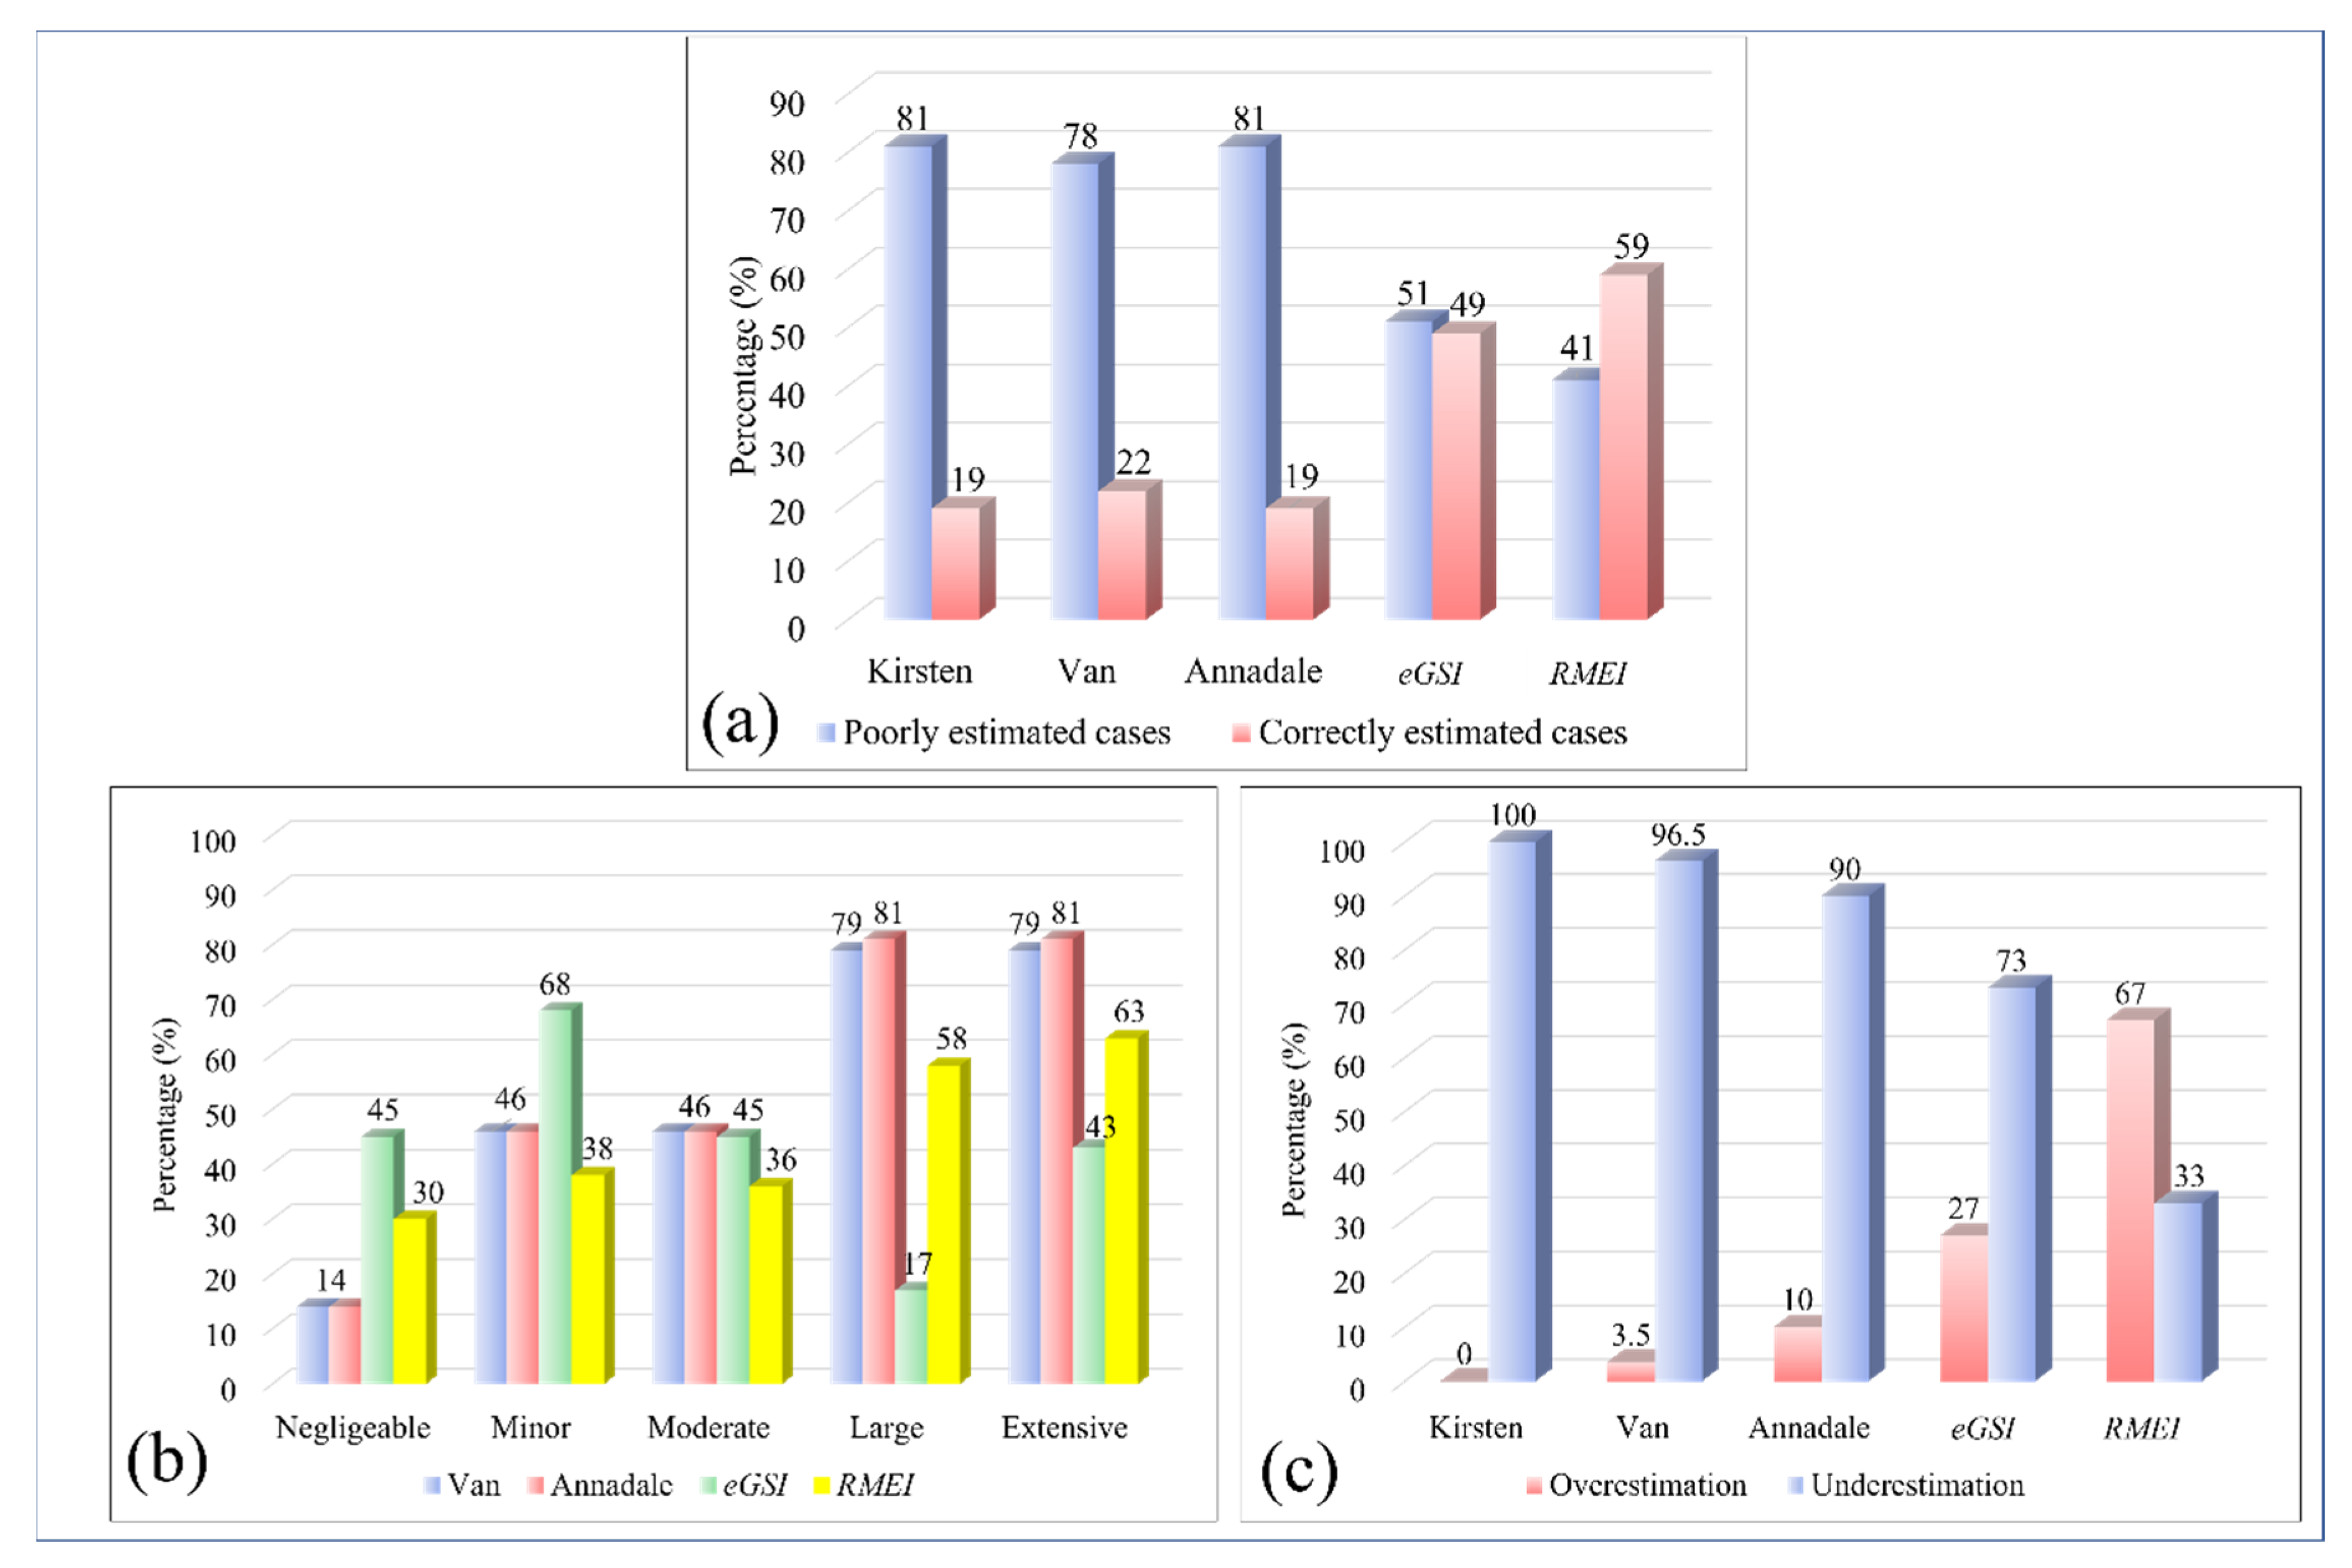
Figure 15.
(a) Plane jet deflection on a flat bottom and wall jet velocity profiles; (b) effective forces on block uplift [81].
Figure 15.
(a) Plane jet deflection on a flat bottom and wall jet velocity profiles; (b) effective forces on block uplift [81].

Figure 16.
QSI flowchart.

Figure 17.
Flowchart of the numerical approach.

Figure 18.
Two-dimensional ejectable blocks in an unlined spillway [88].
Figure 18.
Two-dimensional ejectable blocks in an unlined spillway [88].

Figure 19.
Numerical simulation of plunge pool scour [91].
Figure 19.
Numerical simulation of plunge pool scour [91].

Figure 20.
Schematic of the spillway and removable block geometry for reliability analysis [83].
Figure 20.
Schematic of the spillway and removable block geometry for reliability analysis [83].

Figure 21.
(a) The percentage of poorly estimated cases for each approach. (b) Committed errors of various methods according to different erosion classes. (c) Over- and underestimation rates of various semi-theoretical approaches.
Figure 21.
(a) The percentage of poorly estimated cases for each approach. (b) Committed errors of various methods according to different erosion classes. (c) Over- and underestimation rates of various semi-theoretical approaches.

Table 1.
Classification of the erosion extent.
| Van Schalkwyk et al. (1994a) [24] | Van Schalkwyk et al. (1994b) [29] | Kirsten et al. (2000) [18] and Annandale (1995) [21] | |||
|---|---|---|---|---|---|
| Depth of Erosion (m) | Erosion Class | Depth of Erosion (m) | Erosion Class | Depth of Erosion (m) | Erosion Class |
| 0 | None | <0.2 | None | <2 | No scour or erosion |
| 0–1 | Little | 0.2–0.5 | Little | >2 | Scour |
| 1–5 | Moderate | 0.5–2 | Moderate | ||
| >5 | Extensive | >2 | Extensive | ||
Table 2.
Scour threshold equations by different researchers.
| Analyst | Equations |
|---|---|
| Van Schalkwyk et al. (1994b) [29] | ΠUD = 0.05 Kh0.8 |
| Van Schalkwyk et al. (1994a) [24] | ΠUD = 1.5 × 10⁻¹⁶ Kh5.36 |
| Annandale (1995) [21] | ΠUD = Kh0.75 |
| Kirsten et al. (2000) [18] | ΠUD = 9 Kh0.5 |
Table 3.
Classification of erosion proposed by Pells [1].
Table 3.
Classification of erosion proposed by Pells [1].
| Maximum Depth of Erosion (m) | General Extent (m3/100 m2) | Erosion Class | Erosion Condition |
|---|---|---|---|
| <0.3 | <10 | 1 | Negligible |
| 0.3–1 | 1–30 | 2 | Minor |
| 1–2 | 30–100 | 3 | Moderate |
| 2–7 | 100–350 | 4 | Large |
| >7 | >350 | 5 | Extensive |
Table 4.
General scour formulae.
| Authors | Formulae |
|---|---|
| Jaeger (1939) [40] | |
| Yu (1963) [41] | |
| Damle et al. (1966) [42] | |
| Mirtskhulava (1967) [43] | |
| Martins (1975) [44] | |
| Taraimovich (1978) [45] | |
| Mason (1989) [46] | |
| Liu (1994) [47] | |
| Chen et al. (2001) [48] | |
| Bombardelli and Gioia (2006) [49] | |
| Castillo and Carrillo (2016) [50] |
Table 5.
Coefficients of five simplified scour formulae.
| Analysts | Г | v | w | x | y | z | d |
|---|---|---|---|---|---|---|---|
| Hartung (1959) [51] | 1.4 | 0 | 0 | 0.64 | 0.36 | 0.32 | d85 |
| Chee and Padiyar (1969) [52] | 2.126 | 0 | 0 | 0.67 | 0.18 | 0.063 | dm |
| Bisaz and Tschopp (1972) [53] | 2.76 | 0 | 0 | 0.5 | 0.25 | 1 | d90 |
| Martins (1975) [44] | 1.5 | 0 | 0 | 0.6 | 0.1 | 0 | – |
| Machado (1982) [54] | 1.35 | 0 | 0 | 0.5 | 0.3145 | 0.0645 | d90 |
Table 6.
Symbol notation list of the plunge pool semi-theoretical method.
| Abb. | Definition | Unit | Abb. | Definition | Unit |
|---|---|---|---|---|---|
| dm | Average particle size of the bed material | m | Hn | Net energy head | m |
| d90 | Bed material size, 90% is smaller in weight | - | h | Energy head at the crest weir | m |
| θT | Impingement jet angle | degree | Y0 | Tailwater depth | m |
| g | Gravitational acceleration | m/s2 | Ys | Scour depth below the original bed | m |
| β | Air–water relationship | - | q | Specific flow | m/s |
| ρ | Water density | kg/m3 | t0 | Energy loss in the duct | m |
| ρs | Density of sediment | kg/m3 | H0 | Vertical distance between outlet and tailwater level | m |
| Г+ | Experimental coefficient | - | H | Fall height | m |
| Ds | Scour depth below tailwater level | m | Hn | Net energy head; | m |
Table 7.
The range of Tu due to the type of outlet structure (left side) [61]; polynomial and regression coefficients for various Tu (right side) [62].
| Outlet Structure | Tu | Type of Jet | Tu (%) | a1 | a2 | a3 | a4 |
|---|---|---|---|---|---|---|---|
| Free overfall Ski-jump outlet Bottom, intermediate, and valve | 0–3% 3–5% 3–8% | Compact | <1 | 0.0022 | −0.0079 | 0.0716 | 0 |
| Low turbulence | 1–3 | 0.00215 | −0.0079 | 0.0716 | 0.050 | ||
| Moderate turbulence | 3–5 | 0.00215 | −0.0079 | 0.0716 | 0.100 | ||
| High turbulence | >5 | 0.00215 | −0.0079 | 0.0716 | 0.150 |
Table 8.
Input and output parameters of the falling jet and plunge pool modules [59].
Table 8.
Input and output parameters of the falling jet and plunge pool modules [59].
| Falling Jet Module | Plunge Pool Module | ||
|---|---|---|---|
| Plunge Pool Module | Output (Falling Jet) | Input (Plunge Pool) | Output |
| 1. Structure of outlet 2. Velocity of jet at issuance point (Vi) 3. Diameter of jet at issuance point (Di) 4. Initial jet turbulence intensity (Tu) 5. Energy head (Z) | 1. Location of jet impact (Xult) 2. Length of jet trajectory (L) 3. Diameters of jet impact (Dj, Dout) 4. Velocity of jet impact (Vj) 5. Turbulence intensity Tu | 1. Location of jet impact (Xult) 2. Length of jet trajectory (L) 3. Diameters of jet impact (Dj, Dout) 4. Velocity of jet impact (Vj) 5. Turbulence intensity Tu | 1. Y/Dj 2. Centreline mean pressure Cpa 3. Centreline pressure fluctuations C′pa |
Table 9.
Conditions for computing the amplification factor (Г+) [63].
Table 9.
Conditions for computing the amplification factor (Г+) [63].
| Curve of Maximum Values | Curve of Minimum Values | ||
|---|---|---|---|
| Г+ | Condition of Y/Dj | Г+ | Condition of Y/Dj |
| for Y/Dj < 8 | for Y/Dj < 8 | ||
| for 8 ≤ Y/Dj ≤ 10 | for 8 ≤ Y/Dj ≤ 10 | ||
| for 10 < Y/Dj | for 10 < Y/Dj | ||
Table 10.
Parameters of Equations (22) and (23) for the in situ fracture toughness value KI,ins [59].
Table 10.
Parameters of Equations (22) and (23) for the in situ fracture toughness value KI,ins [59].
| Type of Rock | A | B | C | D |
|---|---|---|---|---|
| Silicate | 0.0648 | 0.8693 | 0.0023 | 1.3257 |
| Carbonate | 0.3230 | −0.0405 | 0.0145 | −0.0190 |
| Quartz | 0.1283 | 0.2747 | 0.0088 | 0.1429 |
Table 11.
Net uplift stagnation pressures for the various setups of block projection and joint points [82].
Table 11.
Net uplift stagnation pressures for the various setups of block projection and joint points [82].
| Test No. | Block Configuration | Block Protrusion (βblock) | hblock/eblock | Cjoint | Csurf | Cuplift |
|---|---|---|---|---|---|---|
| 1 |  | 0° | 17–29 | 0.250 | 0.030 | 0.220 |
| 2 |  | 9° | 2–4 | 0.36–0.55 | −0.10 to 0.17 | 0.37–0.47 |
| 3 |  | 0° | 17–29 | 0.250 | 0.030 | 0.220 |
| 4 |  | 0° | 17–29 | 0.105 | 0.020 | 0.085 |
| 5 |  | 0° | 4–9 | −0.110 | 0.075 | −0.070 |
| 6 |  | −3° | 4.2–87 | −0.105 | 0.02 to 0.13 | −0.070 |
| 7 |  | 18° | 1–2.5 | 0.23–0.40 | −0.15 to 0.00 | 0.25–0.45 |
| 8 |  | 0° | 17–34 | 0.145 | 0.010 | 0.155 |
| 9 |  | 3° | 4–10 | 0.350 | 0.030 | 0.310 |
Table 12.
Upstream and downstream strayed pieces of the absolute discharge rate for various points of impingement δ [86].
Table 12.
Upstream and downstream strayed pieces of the absolute discharge rate for various points of impingement δ [86].
| Jet Angles (δ) (Degree) | 10 | 20 | 30 | 40 | 90 |
|---|---|---|---|---|---|
| qupstream | 1.5% | 6% | 7% | 12% | 50% |
| qdownstream | 98.5% | 94% | 93% | 88% | 50% |
Table 13.
Hydraulic geometrical characteristics of the experiments.
| Method Name | Type of Model | Configuration | Flow | Inclination | Method of Analysis |
|---|---|---|---|---|---|
| Manso and Schleiss (2006) [72] | Vertical jet in plunge pool | Variable: Pool bottom type, Flow characteristics Fix: Joint characteristic | Medium 120 L/s | Vertical 90˚ | Quantitative: Pressure measured in the joint and on the pool surface |
| Lesleighter and Bollaert (2016) [87] | Scale of 1:70 of Paradise Dam | - | Very High 1200 L/s | At Scale | Quantitative: Pressure and speed |
| Reinius (1986) [82] | Open channel flow, set of blocks | Variable: Dip of blocks Fix: Joint opening, Block volume | High 311 L/s | Horizontal | Quantitative: Pressure measured on one block’s faces |
| Annandale (1995) [21] | Plunging jet in a plunge pool, two layers of blocks | Fix: Block disposition, Jet characteristics | Very high 3400 L/s | 15˚ Jet flow | Quantitative: Pressure measured on the basin surface and between blocks layers |
| Bollaert and Schleiss (2002) [59] | Vertical jet in a basin, various steel joints | Variable: Flow characteristics, Types of joints Fix: Orientation of joints | Medium 120 L/s | Vertical | Quantitative: Pressure measured in the joints and on the pool surface |
| George (2015) [83] | Open channel flow, one tetrahedral block | Variable: Block orientation Fix: Channel slope, Block volume | High 300 L/s | Realistic 21˚ | Quantitative: Speed at block displacement |
Table 14.
Advantages and disadvantages of the various approaches.
| Approaches | Advantages | Disadvantages | |
|---|---|---|---|
| Semi-theoretical | Kirsten |
|
|
| Annandale | |||
| Van Schalkwyk | |||
| RMEI |
|
| |
| eGSI | |||
| Semi-analytical | CSM |
|
|
| Numerical |
|
| |
Table 15.
Detailed information references about erosion or scour in spillways, plunge pools, rivers, and gullies.
Table 15.
Detailed information references about erosion or scour in spillways, plunge pools, rivers, and gullies.
| Methods/Systems | Main Idea | P, R and S * |
|---|---|---|
| Franke (1960) [95] | – | – |
| Mih (1989) [96] | Axisymmetric and two-dimensional turbulent jets | P |
| Annandale and Kirsten (1994) [17] | Erodibility of rocks and other rock materials | R |
| Van Schalkwyk et al. (1994a) [24] | Erosion of rock in spillways | S |
| Van Schalkwyk et al. (1994b) [29] | Computing erosion in unlined spillways | S |
| Annandale (1995) [21] | Erodibility | P, S and R |
| Aderibigbe and Rajaratnam (1996) [8] | Erosion of loose beds | P |
| Annandale et al. (1998) [16] | Evaluation of erodibility in fractured zone | P and S |
| Hoffmans (1998) [97] | Jet scour in equilibrium phase | P |
| Kirsten et al. (2000) [18] | Erodibility criterion auxiliary spillways | P and S |
| Bollaert and Schleiss (2002) [59] | –Formation of rock scour due to high velocity jet impact | P |
| Bollaert and Schleiss (2003) [62] | Discussion about the Castillo method around rock scour | P |
| Bollaert (2004) [63] | CSM | P |
| Arnaboldi et al. (2005) [98] | – | – |
| Bollaert and Schleiss (2005) [61] | Assessment of the final depth of rock scour | P |
| Pagliara et al. (2008) [99] | Temporal evolution of plunge pool scour | P |
| Pagliara et al. (2008) [100] | Hydraulics of 3D plunge pool scour | P |
| Asadollahi (2009) [75] | Assessment of single 3D rock block stability by developed BS3D code | P |
| Hoffmans (2009) [101] | Closure problem to jet scour | P |
| Bollaert (2010) [3] | Discusses about physics of failure | P |
| Federspiel (2011) | Block response regarding high-velocity jet impact | P |
| Bollaert (2011) [102] | 3D scour assessment downstream of the penstocks | P |
| Bollaert (2012) [56] | Evaluation of the rock erosion at the plunge pool walls | P |
| Bollaert et al. (2013) [57] | Quasi-3D numerical predictions | P |
| Pan et al. (2013) [103] | Estimation of final scour depth | S and R |
| Huang et al. (2013) [104] | Modifications of the EIM soft bedrock erosion | P |
| Bollaert and Lesleighter (2014) [60] | Spillway rock scour | S |
| George (2015) [83] | Influence of a 3D geological structure on the erosion of blocks | P |
| Tanaka and Sato (2015) [105] | Relationship between damage and hydraulic parameters | – |
| Pells et al. (2015) [15] | Assessment of the erosion for unlined spillways case | S |
| Pells (2016) [1] | Spillways erosion evaluation | S |
| Castillo and Carrillo (2016) [50] | Evaluation of velocities, pressures, and scour for spillway cases | P and S |
| George and Sitar (2016) [93] | Evaluation of rock erosion on the basis of system reliability | S |
| Bollaert et al. (2016) [68] | Scour potential | P |
| Bollaert (2016) [64] | SCSM compared to EIM | P |
| Lai et al. (2017) [106] | Erodibility in rivers downstream of dams | R |
| Wüthrich et al. (2018) [107] | Hybrid modelling for evaluate scouring on the basis of CSM | P and S |
| Wu et al. (2019) [108] | A field investigation on erodibility | S |
| Bi et al. (2019) [109] | Channel scouring | R |
| Boumaiza et al. (2019) [35] | Relevant geomechanical parameters and non-orthogonal joint sets | – |
| Dong et al. (2019) [110] | Effect of rock mass failure on erodibility | P |
| Rong et al. (2020) [111] | Effect of fracture geometry on flowing | – |
| Saeidi et al. (2020) [38] | Rock erosion analysis using developed vulnerability and fragility functions | S |
| Palermo et al. (2020) [112] | Shear-stress estimation at 2D equilibrium scour holes | P |
| Palermo et al. (2021) [113] | Scour processes on granular beds | P |
| Gioia and Bombardelli (2005) [114] | Turbulent flows on scouring granular beds | – |
| Boumaiza et al. (2019) [115] | Relevant geomechanical parameters to assess the erodibility | S and P |
| Boumaiza et al. (2021) [116] | Relative importance of geological parameters in hydraulic erodibility assessment | S and P |
| Koulibaly et al. (2021) [117] | A review of hydraulic erosive parameters | S and P |
* P, R, and S describe plunge pool, river, and spillway, respectively.
Publisher’s Note: MDPI stays neutral with regard to jurisdictional claims in published maps and institutional affiliations. |
© 2021 by the authors. Licensee MDPI, Basel, Switzerland. This article is an open access article distributed under the terms and conditions of the Creative Commons Attribution (CC BY) license (https://creativecommons.org/licenses/by/4.0/).
Share and Cite
MDPI and ACS Style
Jalili Kashtiban, Y.; Saeidi, A.; Farinas, M.-I.; Quirion, M. A Review on Existing Methods to Assess Hydraulic Erodibility Downstream of Dam Spillways. Water 2021, 13, 3205. https://doi.org/10.3390/w13223205
AMA Style
Jalili Kashtiban Y, Saeidi A, Farinas M-I, Quirion M. A Review on Existing Methods to Assess Hydraulic Erodibility Downstream of Dam Spillways. Water. 2021; 13(22):3205. https://doi.org/10.3390/w13223205
Chicago/Turabian StyleJalili Kashtiban, Yavar, Ali Saeidi, Marie-Isabelle Farinas, and Marco Quirion. 2021. "A Review on Existing Methods to Assess Hydraulic Erodibility Downstream of Dam Spillways" Water 13, no. 22: 3205. https://doi.org/10.3390/w13223205
Note that from the first issue of 2016, this journal uses article numbers instead of page numbers. See further details here.