
Effects of Drying-Rewetting Cycles on Ferrous Iron-Involved Denitrification in Paddy Soils


1
State Key Laboratory of Water Resources and Hydropower Engineering Science, Wuhan University, Wuhan 430072, China
2
Agricultural Water Conservancy Department, Changjiang River Scientific Research Institute, Wuhan 430010, China
*
Author to whom correspondence should be addressed.
Water 2021, 13(22), 3212; https://doi.org/10.3390/w13223212
Submission received: 11 August 2021
/
Revised: 26 October 2021
/
Accepted: 8 November 2021
/
Published: 12 November 2021
(This article belongs to the Special Issue Study of the Soil Water Movement in Irrigated Agriculture Ⅱ)
Abstract
:Soil moisture status has an important effect on the process of denitrification in paddy soils. However, it is unclear how it affects the ferrous iron-involved denitrification. Here, the influence of drying-rewetting cycles on ferrous iron-involved denitrification in paddy soil were studied with batch experiments. The dynamics of nitrate, ammonia, Fe2+, Fe3+ and total organic carbon (TOC), as well as nitrous oxide (N2O) were investigated using the iron-rich paddy soil in Jiangxi province, South China. Results demonstrated that the denitrification rate dropped while ammonia nitrogen content (NH4+-N) showed a rapid accumulation in the drying period. In the rewetting period, organic carbon played two-side roles. Organic carbon and ferrous iron together provided electron donors to denitrification, and organic carbon simultaneously reduced ferric iron under anaerobic environment. There were complex interactions among organic carbon, nitrate and Fe2+/Fe3+ under drying-rewetting cycles. Soil rewetting led to denitrification flush, especially after a moderately long drying period, while excessively frequent drying-rewetting alternation was not favorable to nitrate denitrification.
1. Introduction
Intensive use of fertilizers to agricultural land can lead to nitrate contamination in both surface water and groundwater ecosystems [1]. China has been experiencing serious nitrogen pollution threats [2]. As the largest chemical fertilizer consumption nation worldwide, the consumed fertilizer in China has reached 60.22 million tons in 2015, of which the nitrogen fertilizer accounted for 40% [3]. In contrast to large plot size and mechanized farming in many countries, applying fertilizer by hand to millions of small plots is still the most popular farming method in China [4], often resulting in over-application and environmental pollution.
Denitrification, which is proved to be mainly a biological process, is defined as a dissimilatory reduction process of nitrate, nitrite, or other ionic nitrogen oxides to the gaseous oxides by aerobic bacteria under anoxic conditions [5,6]. There is denitrification in natural habitats such as lake sediments, river banks and farmland [7,8,9]. Usually, denitrification contains two forms depending on the source of reducing energy: heterotrophic denitrification and autotrophic denitrification. The former one is a process that needs organic substrates as the electron donor to reduce nitrate, while the latter one is an autotrophic process that the nitrate is degraded by sulfate, ferrous iron, or other inorganic matters [10]. Autotrophic denitrification seems more autonomous than heterotrophic process because there is no need of an external organic carbon source [11,12]. In a number of autotrophic denitrification reactants, ferrous iron is an important electron donor in the paddy soil.
Iron, as the fourth most abundant element in the Earth’s crust, is a transition metal that can contribute or accept electron during valence conversion [13,14,15]. In the drying soil, the iron is mainly ferric iron which can accept electrons from reductive substances (e.g., organic matter and hydrogen). When switching from drying status to flooding condition, there would be more ferrous iron which can devote electron ion to oxidizing substances (e.g., nitrate). Since the nitrate-dependent iron-oxidizing bacteria was detected in a lagoon, various denitrifying bacteria which can oxidize ferrous iron with nitrate have been found [16,17]. Melton et al. [18] systematically described the process of Fe2+ oxidation by nitrate with the denitrifying bacteria in the sedimentary and terrestrial environments. Mejia et al. [19] found that nitrate reduction driven by ferrous iron is an important process in the biogeochemical cycles of nitrogen, not only in anoxic environment but also in aerobic subsurface environment. Han et al. [12] proved a positive relationship between the denitrification process and ferrous iron oxidation in the paddy soil of rich iron content. However, ferrous iron, as a donation of electron, does not always promote denitrification. Baeseman et al. [20] found that the addition of ferrous and ferric iron could decrease the denitrification rate because the iron may complex strongly with organic carbon and the complexation may inhibit the nitrate reacting with ferrous iron. Overall, the denitrification involved with ferrous iron requires further understanding in the paddy soil of rich iron content.
Almost one-third of the land cover on earth is the arid and semi-arid area, where drastic soil moisture change is common [21]. In China, intermittent irrigation for paddy rice fields is popular, which also generates the drying and rewetting cycle [22]. In soils that are undergoing drying, the loss of unbound free-water leads to the substrate diffusion and enzyme activity decreasing [23,24,25]. The microbial metabolic activity is forced to reduce with decreasing soil moisture content [26,27]. On the other hand, rewetting of dry soils changes the physical properties and available substance of the soil. When the drying soil is rewetted, the rapid entry of water would break the aggregates, resulting in the release of organic carbon held within aggregates [28]. Above all, drying and rewetting events not only lead to the change of oxygen level and the soil microbial activity [26,29], but also affect the geochemical reactions and microbiological processes [6,30,31]. It is expected that drying-rewetting cycles complicate the interactions among organic carbon, nitrate and ferrous iron.
The objective of this study is to investigate the effect of drying-rewetting cycles on ferrous iron-involved denitrification in paddy soils. In this study, we designed incubation experiments with several different drying-rewetting cycles using the iron-rich soil. The goals are: (1) to reveal the interactions among organic carbon, nitrate and Fe2+/Fe3+ under drying-rewetting conditions; (2) to assess the effect of drying-rewetting cycles on soil denitrification in paddy soils.
2. Materials and Methods
2.1. Soil Samples
The paddy soil was collected after the rice harvest in De’an, Jiangxi province of China (29°16′34″ N, 115°43′38″ E). A two-crop paddy was maintained, and nitrogen fertilizer was applied at a rate of about 400 kg N (ha year)−1. Soil samples were randomly collected from five sampling sites. Surface soil (0–20 cm) samples were collected with taking care to avoid stock camps, roots and other such artefacts. The five soil samples were then air-dried and were passed through a 2 mm sieve to remove stones and plant residues. Then all the soil samples were mixed thoroughly to form a composite sample. Some physical properties of the soil are shown in Table 1.
2.2. Design of Batch Experiments
The experiments were designed following a method described by Xu and Cai [32] with some modifications. A total of 138 Erlenmeyer flasks (250 mL) were prepared and 40 g of dry soil with 30 mL of deionized water were placed into each flask for pre-incubation. All of the flasks were kept at 30 °C in the dark for 12 days. In the absence of oxygen, the microbial activity of the soil could be activated [33], and the reduction of ferric iron in soils could be accelerated. As a result of pre-incubation, there were more available ferrous iron for denitrification in the next experiments [34]. Before the experiment begins, the field water-holding capacity was measured by the cutting ring method for determination of field water-holding capacity in soil [35]. The water content of the soil in the wetting period was determined as the gravimetric water contents of saturated soils (gravimetric moisture content: 52%). The water content of the soil in the drying period was 23% gravimetric moisture content. The two water contents were chosen because they were the standard of irrigation content in the intermittent irrigation for paddy rice fields of Southern China.
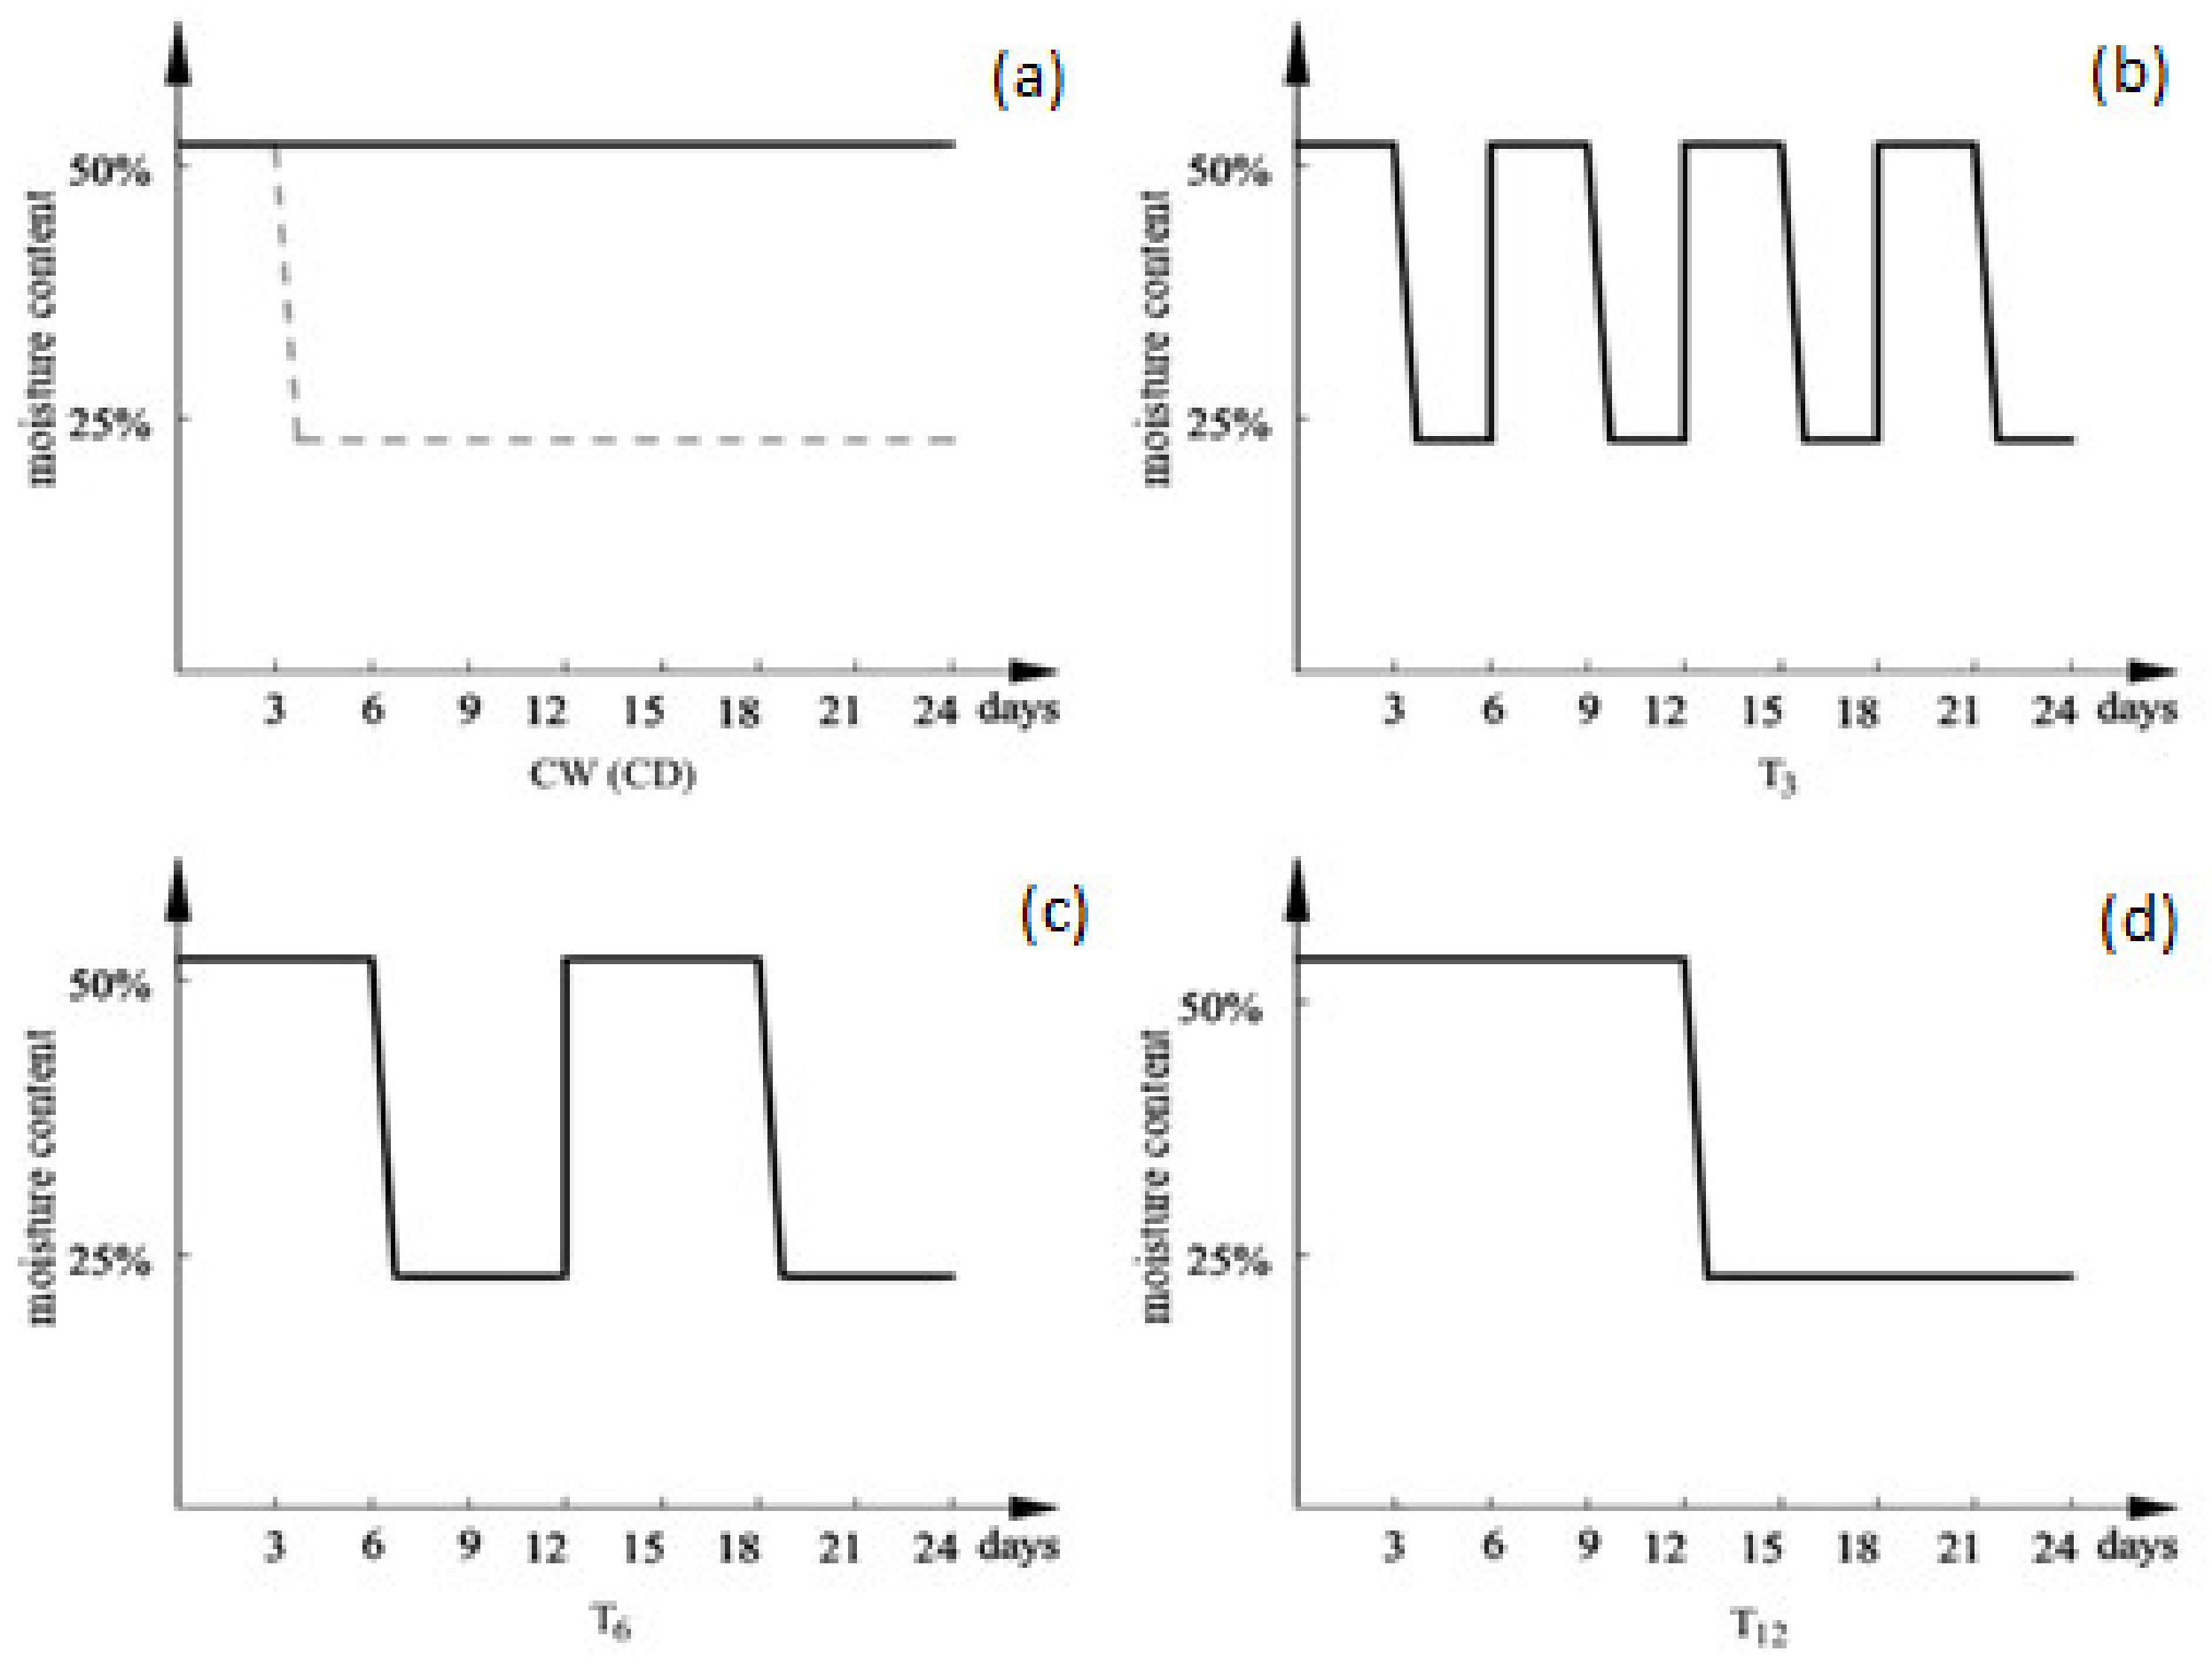
At the start of the treatment phase, 11 mL solution of KNO3 was added into the flasks so as to the original content is the same (490 mg N kg−1 soil). Three random replicates of pre-incubated flasks were chosen to obtain the physiochemical properties of the soil in the next stage of the experiment (Table 1). The changes of the soil moisture content in 5 different treatments were schematically presented in Figure 1. The soil water contents of continuously wet/dry treatments were maintained at saturated content and 80% field water-holding capacity, respectively. Three drying-rewetting treatments were designed with the same numbers of wet/dry days (both are 12 days). Thus, the treatments varied only in the drying-rewetting frequency. Above all, the experiment was composed of the following treatments: (i) continuously dry/wet treatment (CD/CW); (ii) 3-day drying-rewetting treatment (T3); (iii) 6-day drying-rewetting treatment (T6) and (iv) 12-day drying-rewetting treatment (T12).
To ensure rapid soil drying, 30 g silica gel was packaged and hung carefully in the flasks to avoid attaching to the surface of soil, in order to absorb water quickly. When the soil reached the designed content, the packaged silica gel was taken out after the gas in the flasks was measured. The silica gel could be regenerated at 105 °C using an air-blowing thermostatic oven. All of the flasks were sealed by 704 silicone sealants. At the start of the wetting period, the soils were wet to saturated content by adding reverse osmosis water with an automatic pipette, and then the flask was sealed again immediately. Acetylene (C2H2) at 10 kPa was applied into the flasks in order to inhibit nitrification and potential N2O reduction after the flasks were sealed every time. The soil water moisture was monitored by weighing the flask every day during the experiment.
N2O was sampled by using a gas-tight syringe at first and determined by gas chromatography method immediately to avoid the samples being contaminated with air. After that, the sealed flasks were destroyed and sampled for testing soil chemical properties once every three days (e.g., soil pH, NO3−, NO2−, NH4+, TOC, Fe2+ and Fe3+ contents). All soils were destructively sampled in this experiment. Three random Erlenmeyer flasks for each treatment were tested and then abandoned after sampling.
2.3. Measurements
Each gas sample was collected by using a gas-tight syringe at the beginning of every specified time point. Before collecting the gas sample, the gas-tight syringe piston would be pulled and pushed three times in order to make the gas in the flasks homogenized. Then, each gas sample was tested immediately using gas chromatograph (GC-2014C, Shimadzu, Japan). The electron detector for the N2O content of the gas chromatograph was electron capture detector (GC-ECD). The carrier gases were N2 (99.999%) and H2 (99.999%). The detector temperature for analyzing N2O was 300 °C.
Soil particle size distribution was measured by the hydrometer method. Soil pH was measured by pH-electrode method at soil-water ratio of 1:2.5 using a pH portable analyzer (PQ-40D; Hach, USA) [36]. Total nitrogen was measured by the automatic Kjeldahl analyzer. Total organic carbon (TOC) was determined by organic matter-ignition loss method using a TOC analyzer (TOC-L CPN, Shimadzu, Japan) which was equipped with solid sample combustion unit (SSM-5000A, Shimadzu, Japan) [37]. Inorganic N was extracted by adding 1M KCl solution and the concentrations of NO3−, NH4+ were measured using the extraction with potassium chloride solution-spectrophotometric method [38]. The Fe2+ and Fe3+ ions were extracted by adding 0.5 mol·L−1 HCl solution in which the aqueous solution should be degassed. The Fe2+ content was determined by using phenanthroline-spectrophotometric method without phenanthroline solution [39]. Specially, the Fe3+ content was calculated by the difference value between the Fe2+ value of the extracted liquid which was added with phenanthroline and the Fe2+ value of the extracted liquid which was added with the same deionized water.
2.4. Statistical Analyses
Statistical analyses were calculated by using SPSS 24 for Windows 10. Two-way analysis of variance (ANOVA) was carried out to determine the significant differences of Fe2+ and TOC. Multiple comparison was used to assess the relationships between the NO3−-N content and other properties such as Fe2+ and TOC content.
3. Results
3.1. Dynamics of the Soil Nitrate Nitrogen
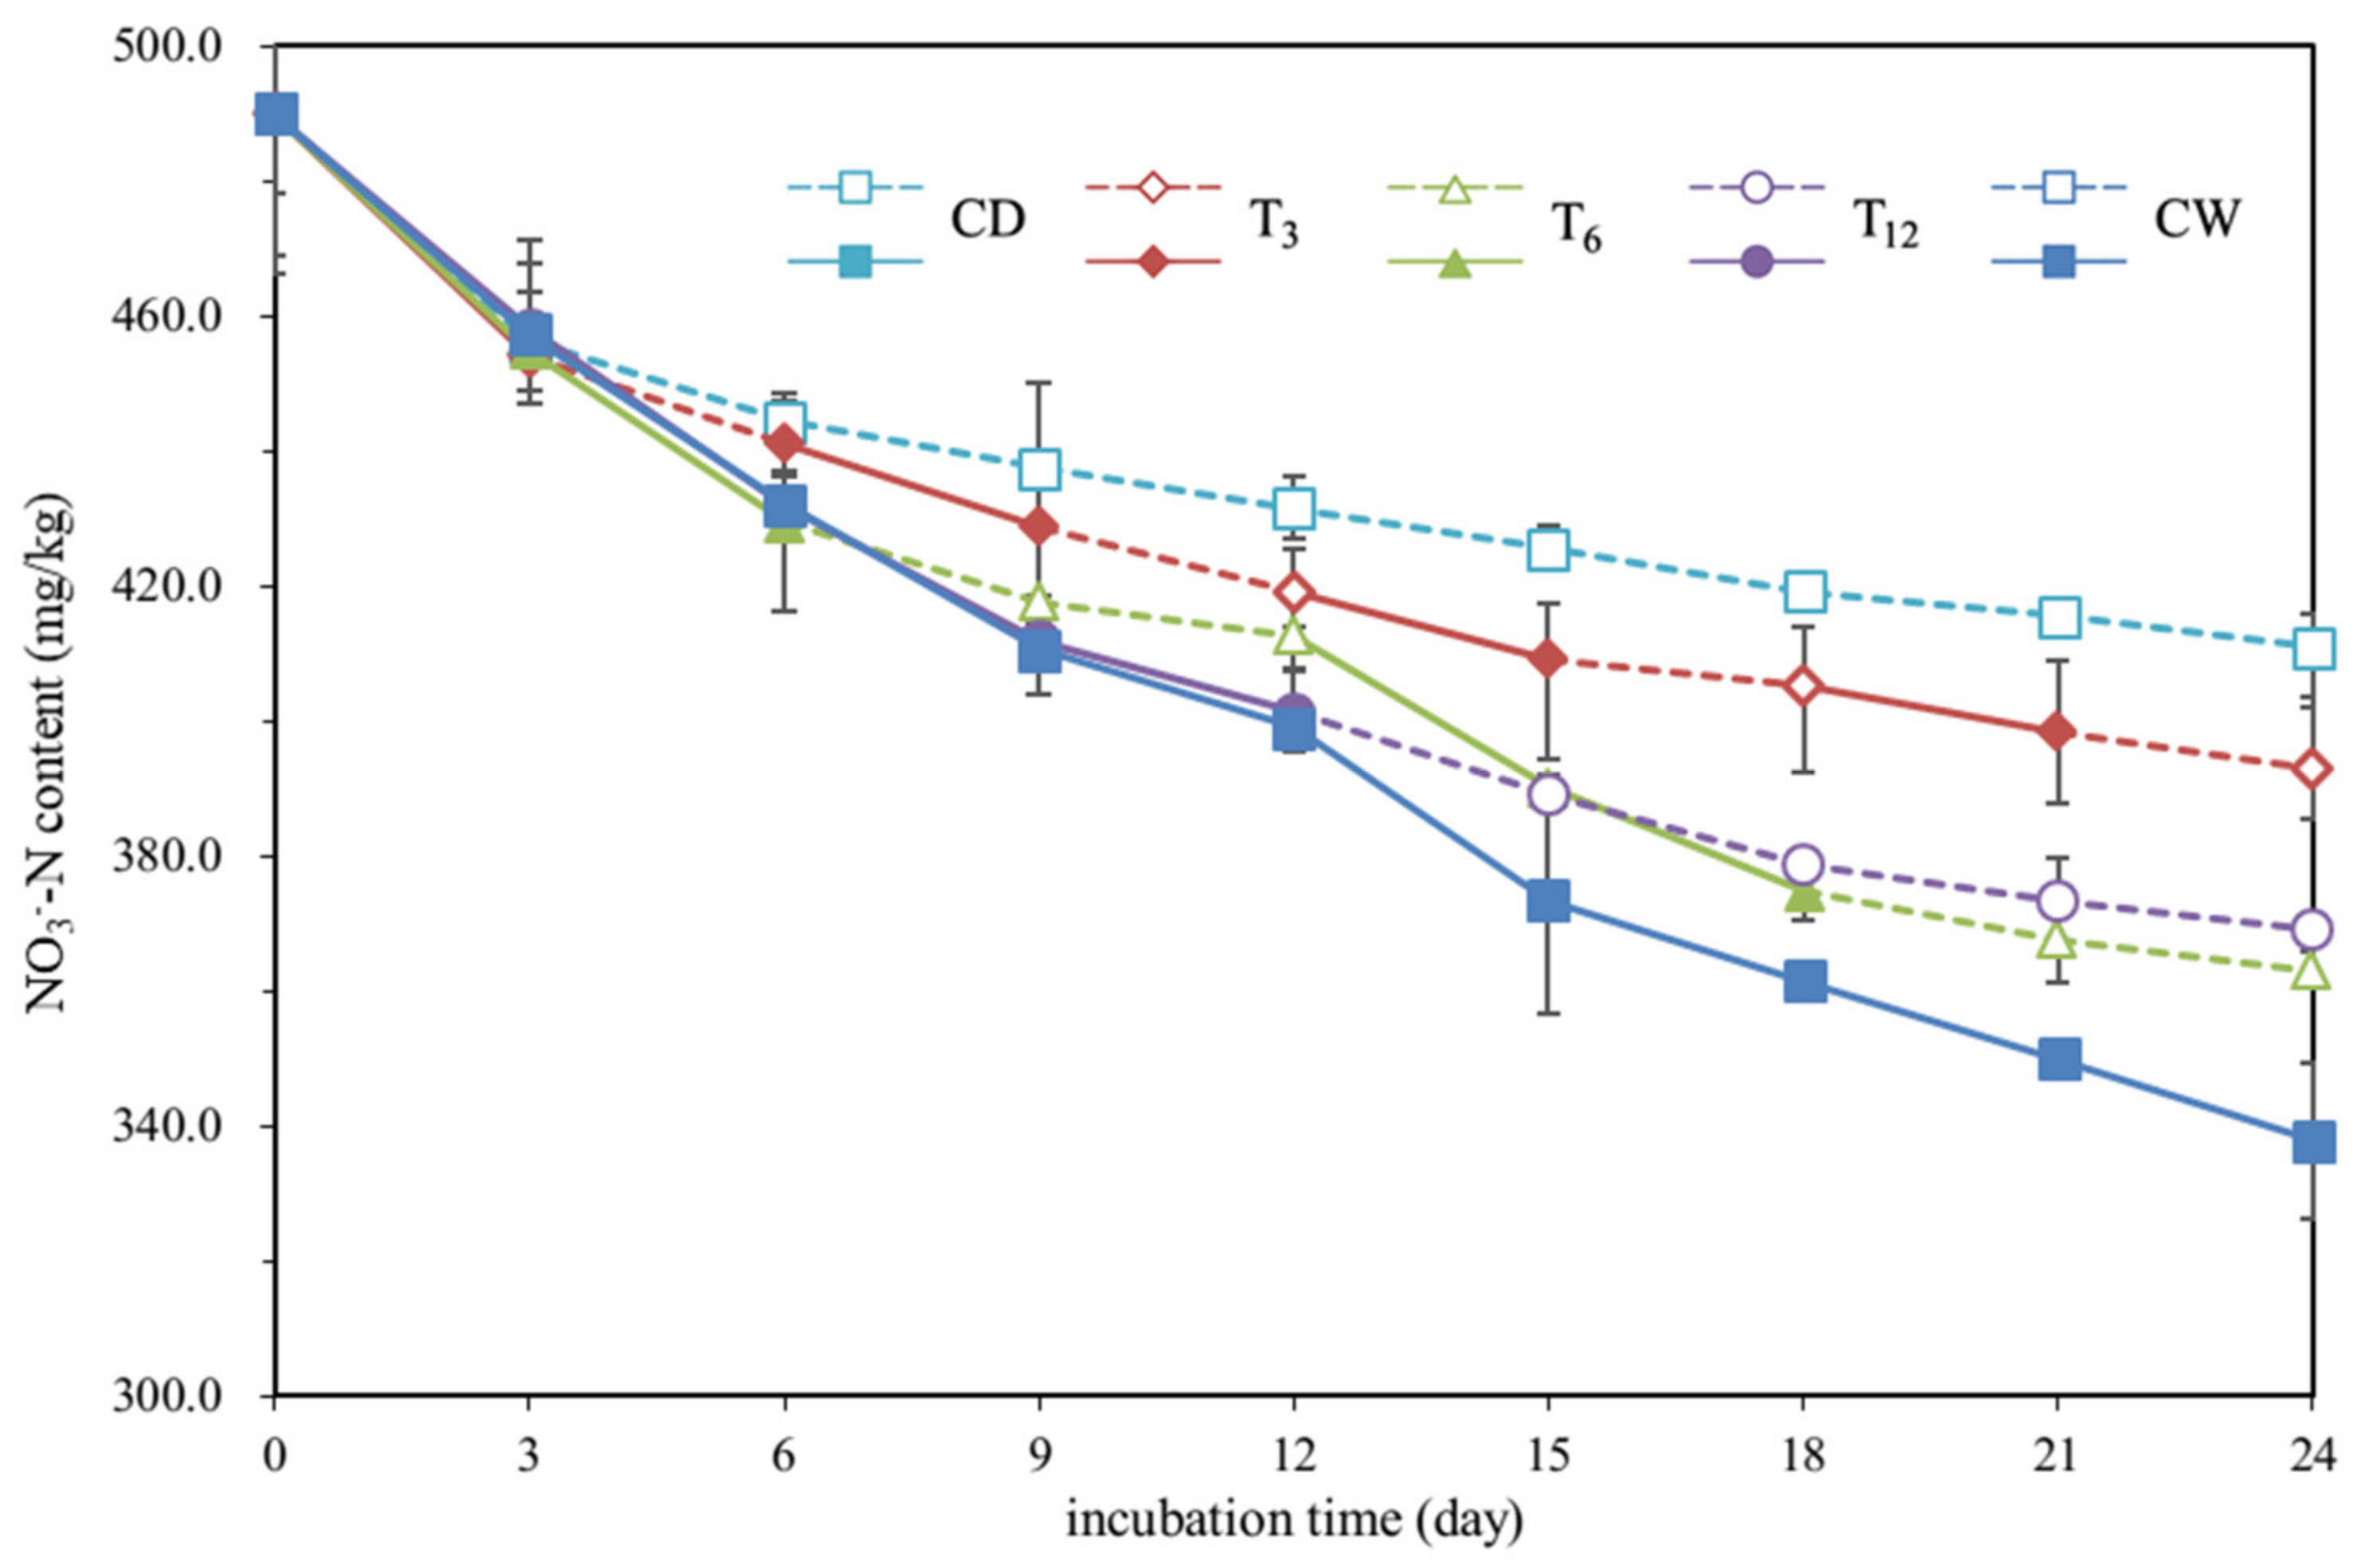
The temporal variations of soil nitrate nitrogen (NO3−-N) content under different treatments are shown in Figure 2. The nitrate contents were reduced continuously for all the treatments. A minimum reduction was observed in the continuously dry (CD) treatment, as the nitrate content dropped from 490 mg/kg to 411 mg/kg at the end of the experiment. The amount of the nitrate reduction in the continuously wet treatment was about 73 mg/kg, which was the maximum reduction in the five treatments. The final NO3−-N content from treatment T3 was lower than that from the CD treatment while higher than that from all other treatments (393 mg/kg and 411 mg/kg in treatment T3 and CD, respectively). Treatment T6 and T12 had similar NO3−-N loss in terms of the final NO3−-N content (369 mg/kg and 363 mg/kg in treatment T6 and T12, respectively). Comparing the dynamics of the nitrate in the different treatments, it is seen that more frequent drying and rewetting cycles lead to less of a drop in NO3−-N content.
The instantaneous reduction rate (IRR) of NO3−-N was defined as:
where Ct is the content of nitrate (NO3−-N) at the day t, Ct−Δt is the content of nitrate at the day t−Δt, m is the mass of the dry soil in the flask, Δt is the measured interval that is 3 days.
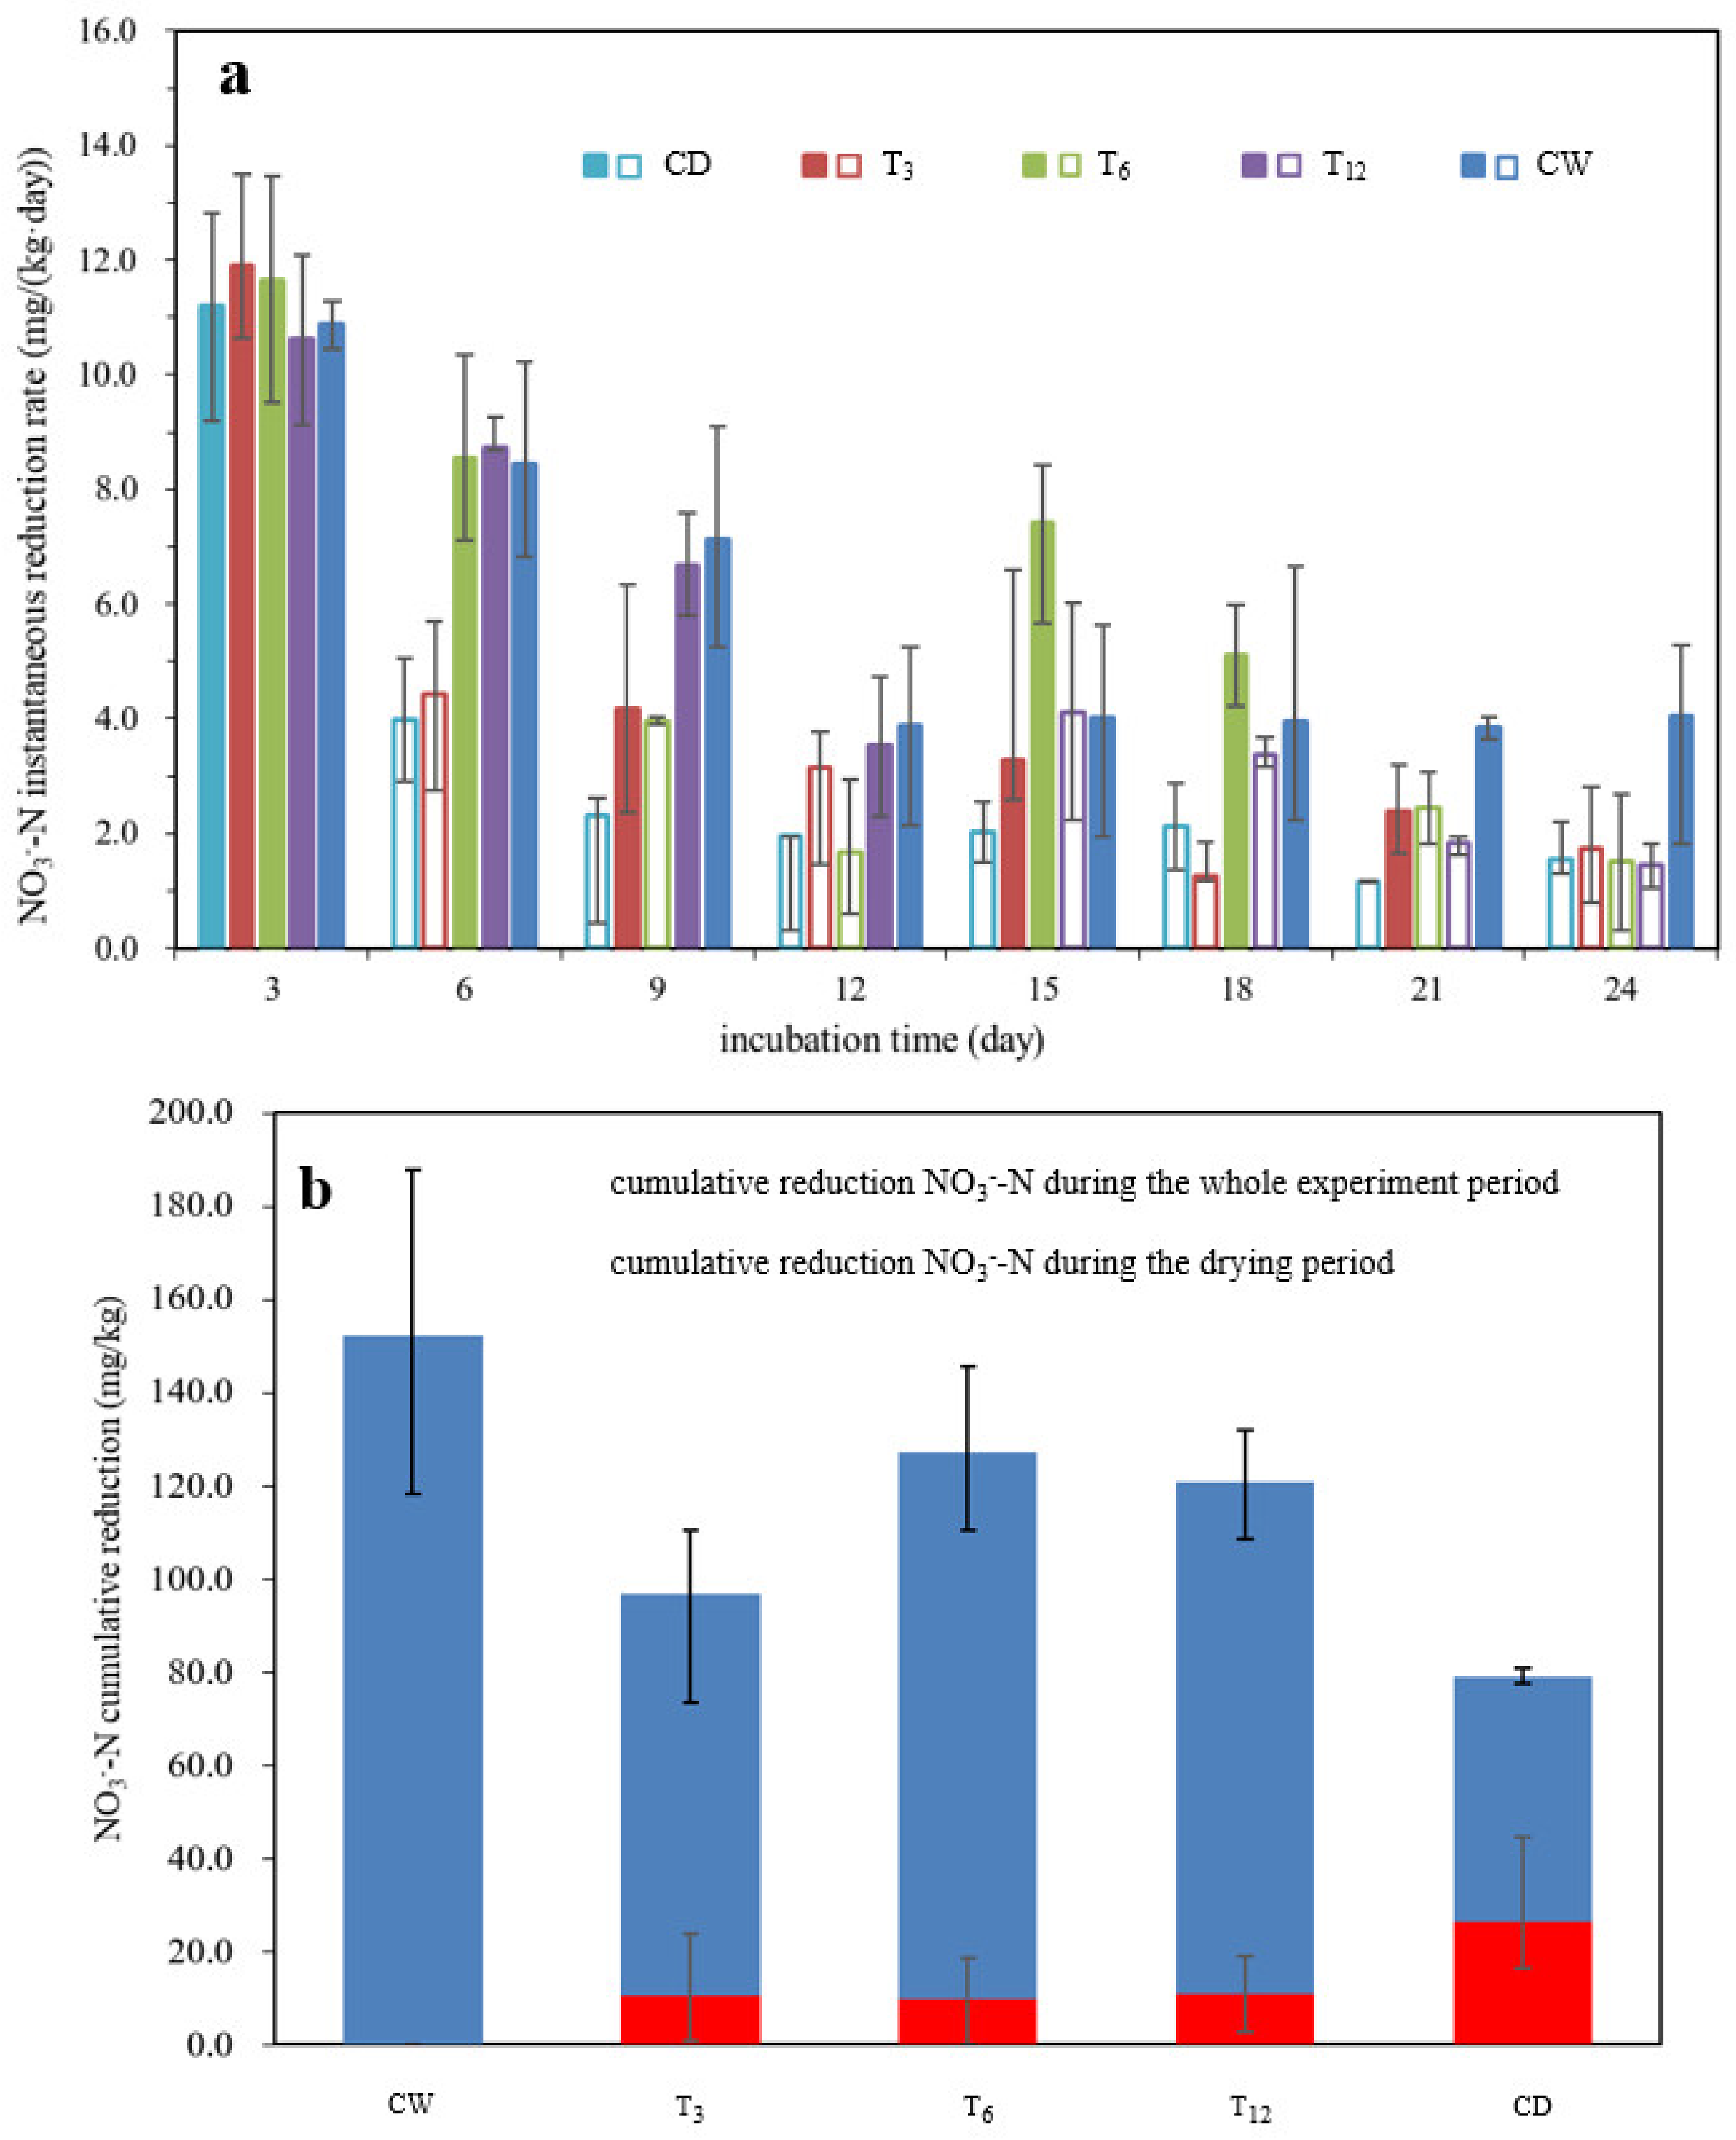
Figure 3a presents the NO3−-N instantaneous reduction rates (IRR) under different treatments. IRR declined from 10.8 mg/kg/d to 7.1 mg/kg/d in the first 9 days and remained stable (around 4 mg/kg/d) in the following process under the CW treatment. Drying-rewetting cycles imposed an impact on the reduction rate. For all the drying and rewetting treatments, IRR dropped in the dry period regardless of the dry-rewetting frequency. For the treatment T3, a pulse of IRR was observed when the soil was rewetted. Such pulse of IRR was particularly obvious in the treatment T6 when the soil was rewetted at day 12, and a significant rise of IRR was found during day 12 and 15 and remained high during day 15 and 18.
The cumulative NO3−-N reduction under different treatments in the dry and wet period, as well as the overall NO3−-N reduction, are shown in Figure 3b. The soils subject to drying-rewetting alternation generated similar cumulative NO3−-N reduction in the 12 drying days regardless of the treatments. However, it is seen that cumulative NO3−-N reduction in treatment T6 during 12 wetting days contributed most to the overall reduction. Although treatments of T3, T6 and T12 had the same number of drying and wetting days, the cumulative reduction of NO3−-N within the wetting period, as well as the contribution to the overall reduction, was different for each treatment.
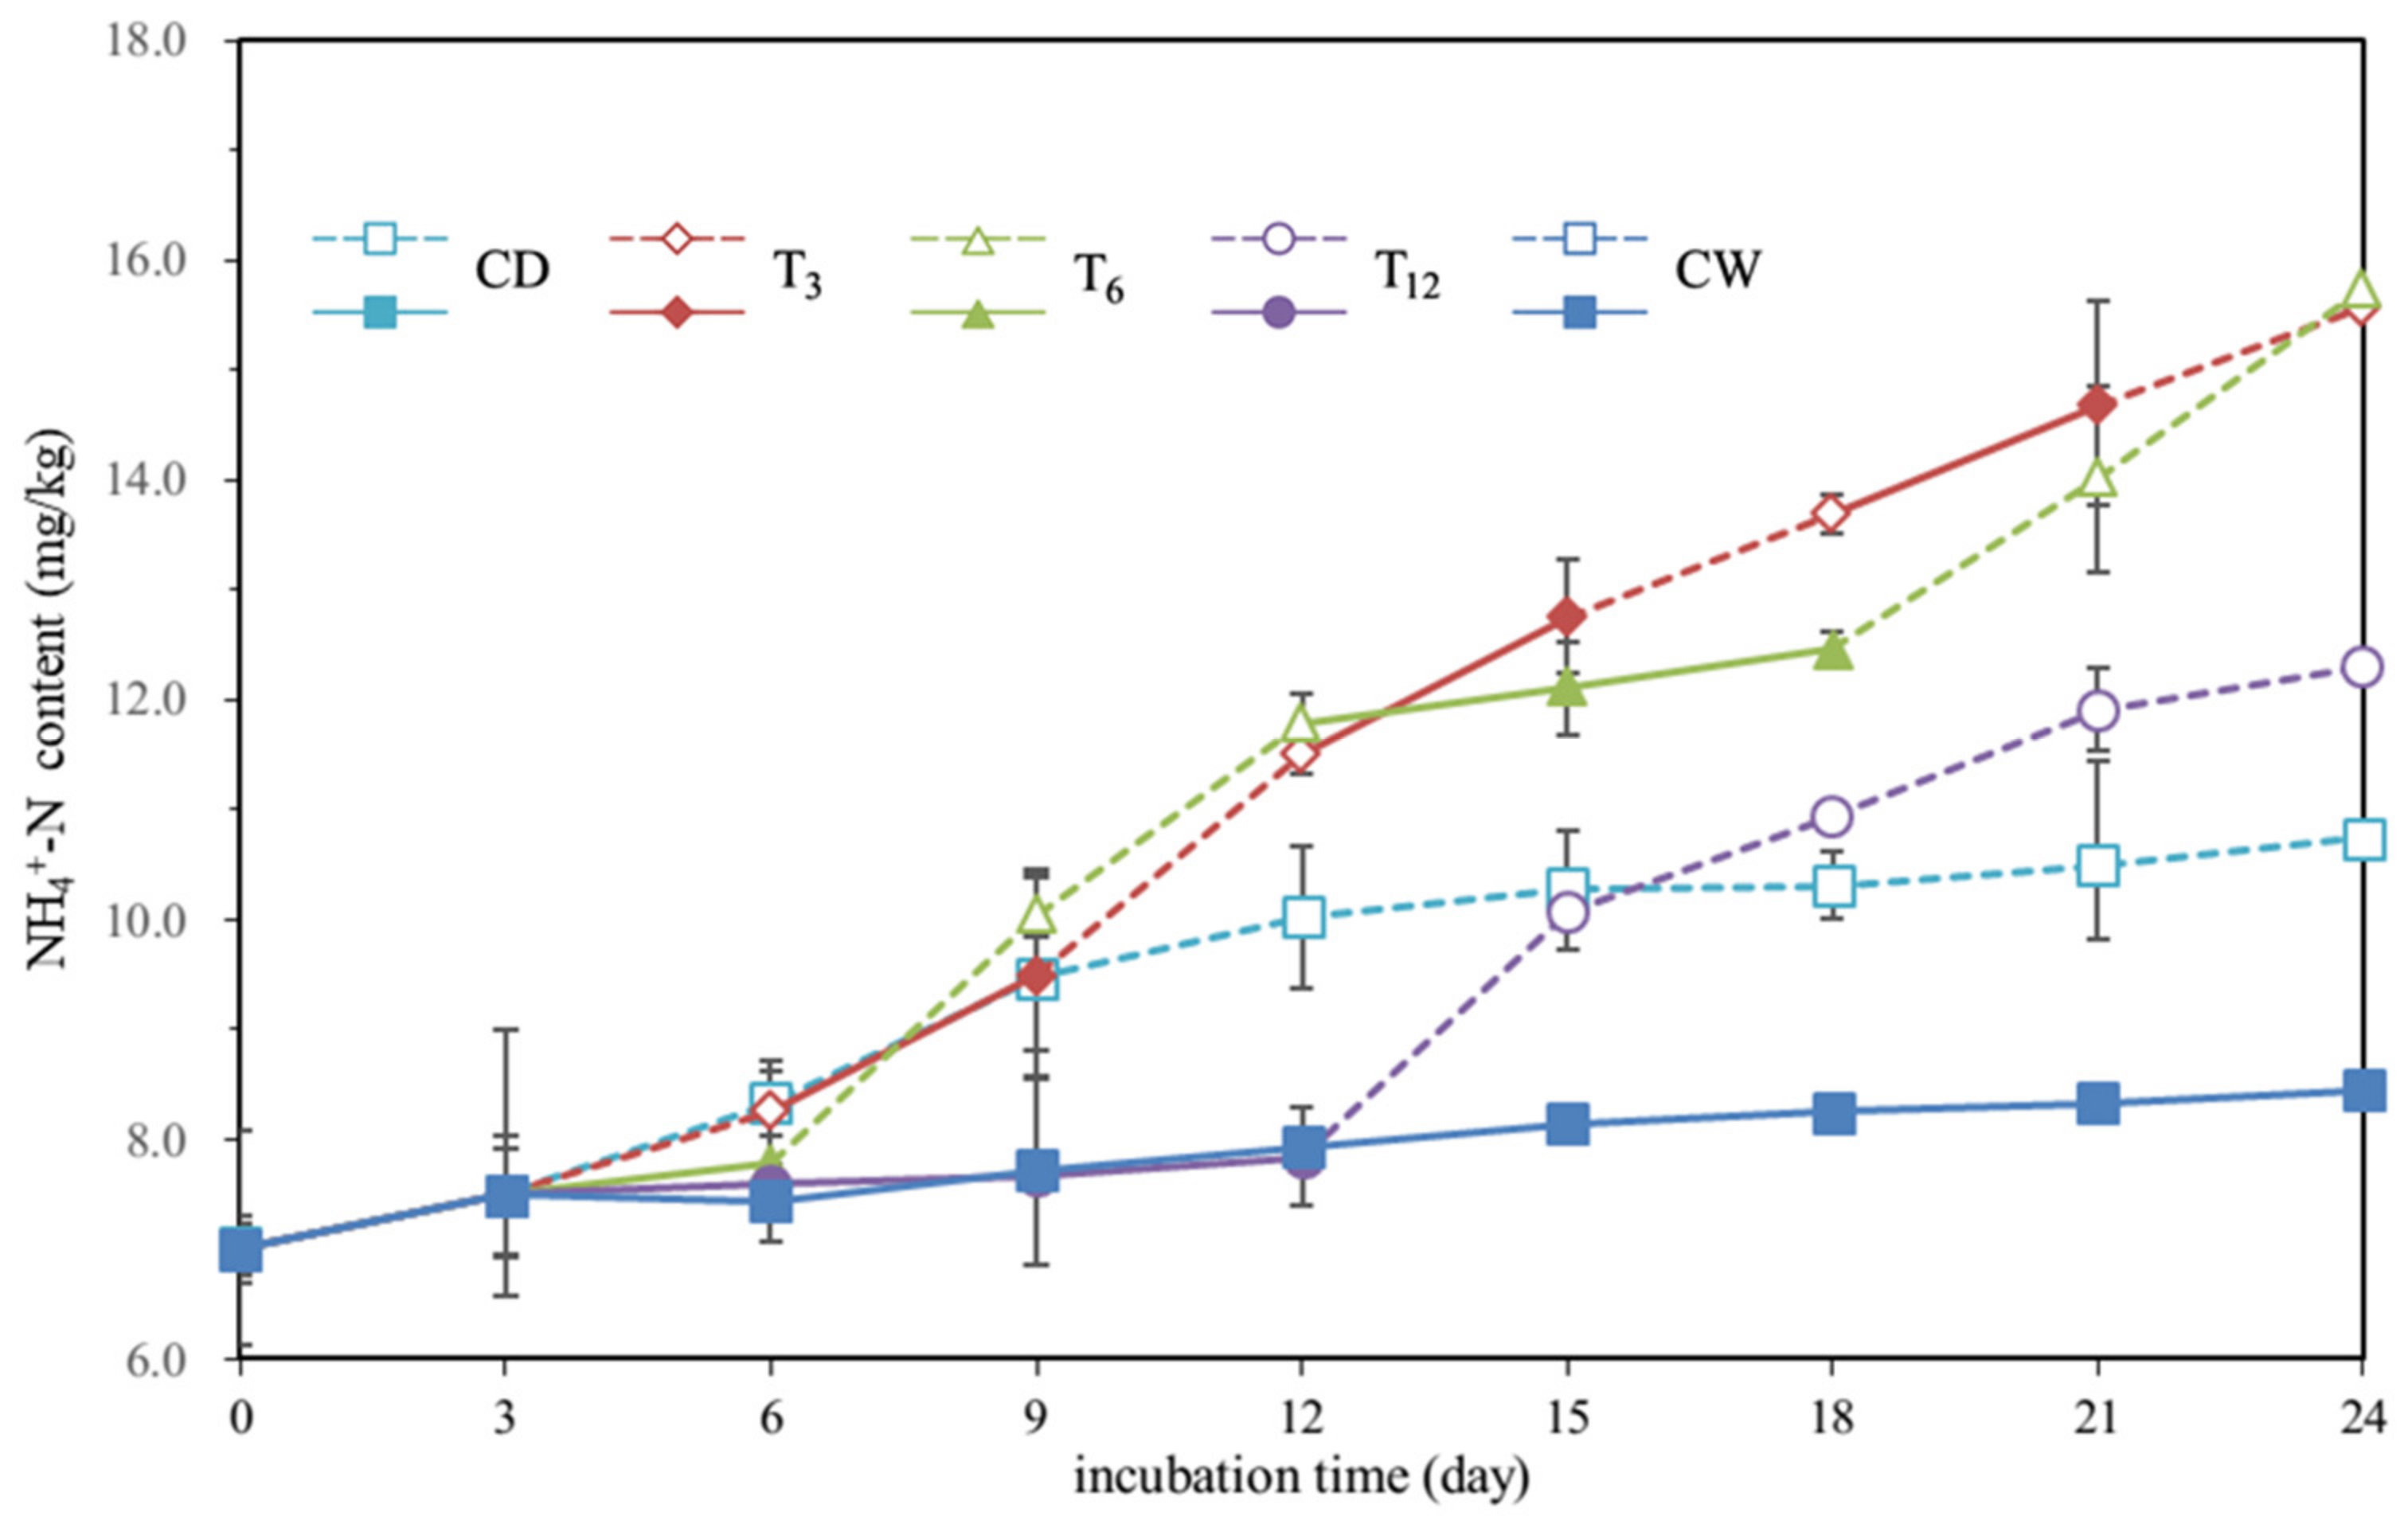
The temporal variations of the soil NH4+-N content under different treatments are shown in Figure 4. Treatments of CW and CD produced the least and second least NH4+-N accumulation, respectively. Treatments subject to drying-rewetting alternation generated more final NH4+-N than continuously dry or wet treatments. There was a pulse of NH4+-N during the drying period in treatment T6 (from 7.6 mg/kg at day 6 to 11.8 mg/kg at day 12). Similarly, the treatment T12 produced stable NH4+-N during the first 12 wet days as in the treatment CW, while a much faster increase of NH4+-N was observed during the following 12 drying days. The final NH4+-N content was twice that of the initial NH4+-N content in the treatment T12. Comparing T3 and T6 with T12, it is seen that more frequent dry-rewetting alternation led to more NH4+-N accumulation. Although treatments of T6 and T12 had similar NO3−-N loss, their NH4+-N accumulations were different and treatment T6 produced more NH4+-N than T12. It seemed that the drying process after wetting period facilitated the production of NH4+-N.
3.2. Dynamic of the Soil Ferrous Iron Content
The temporal variations of ferrous iron (Fe2+) under different treatments are presented in Figure 5. In the CD treatment, the Fe2+ content was decreasing due to the oxidation of Fe2+ driven by oxygen. In the CW treatment, although the soils were in anaerobic condition, the Fe2+ content was declining continuously. Stronger oxidation of Fe2+ was observed in the CD than in the CW. The Fe2+ content in the treatment T3 and T6 showed a dropping trend during the drying periods and a rising trend during the rewetting periods. The treatment T12 presented a similar Fe2+ changing trend as in CW during the first 12 wetting days, while a faster decrease of Fe2+ content occurred during the last 12 drying days for T12. The results also demonstrated that dry-rewetting frequency exerted an influence on the final ferrous iron content. Lower dry-rewetting frequency led to less final ferrous iron.
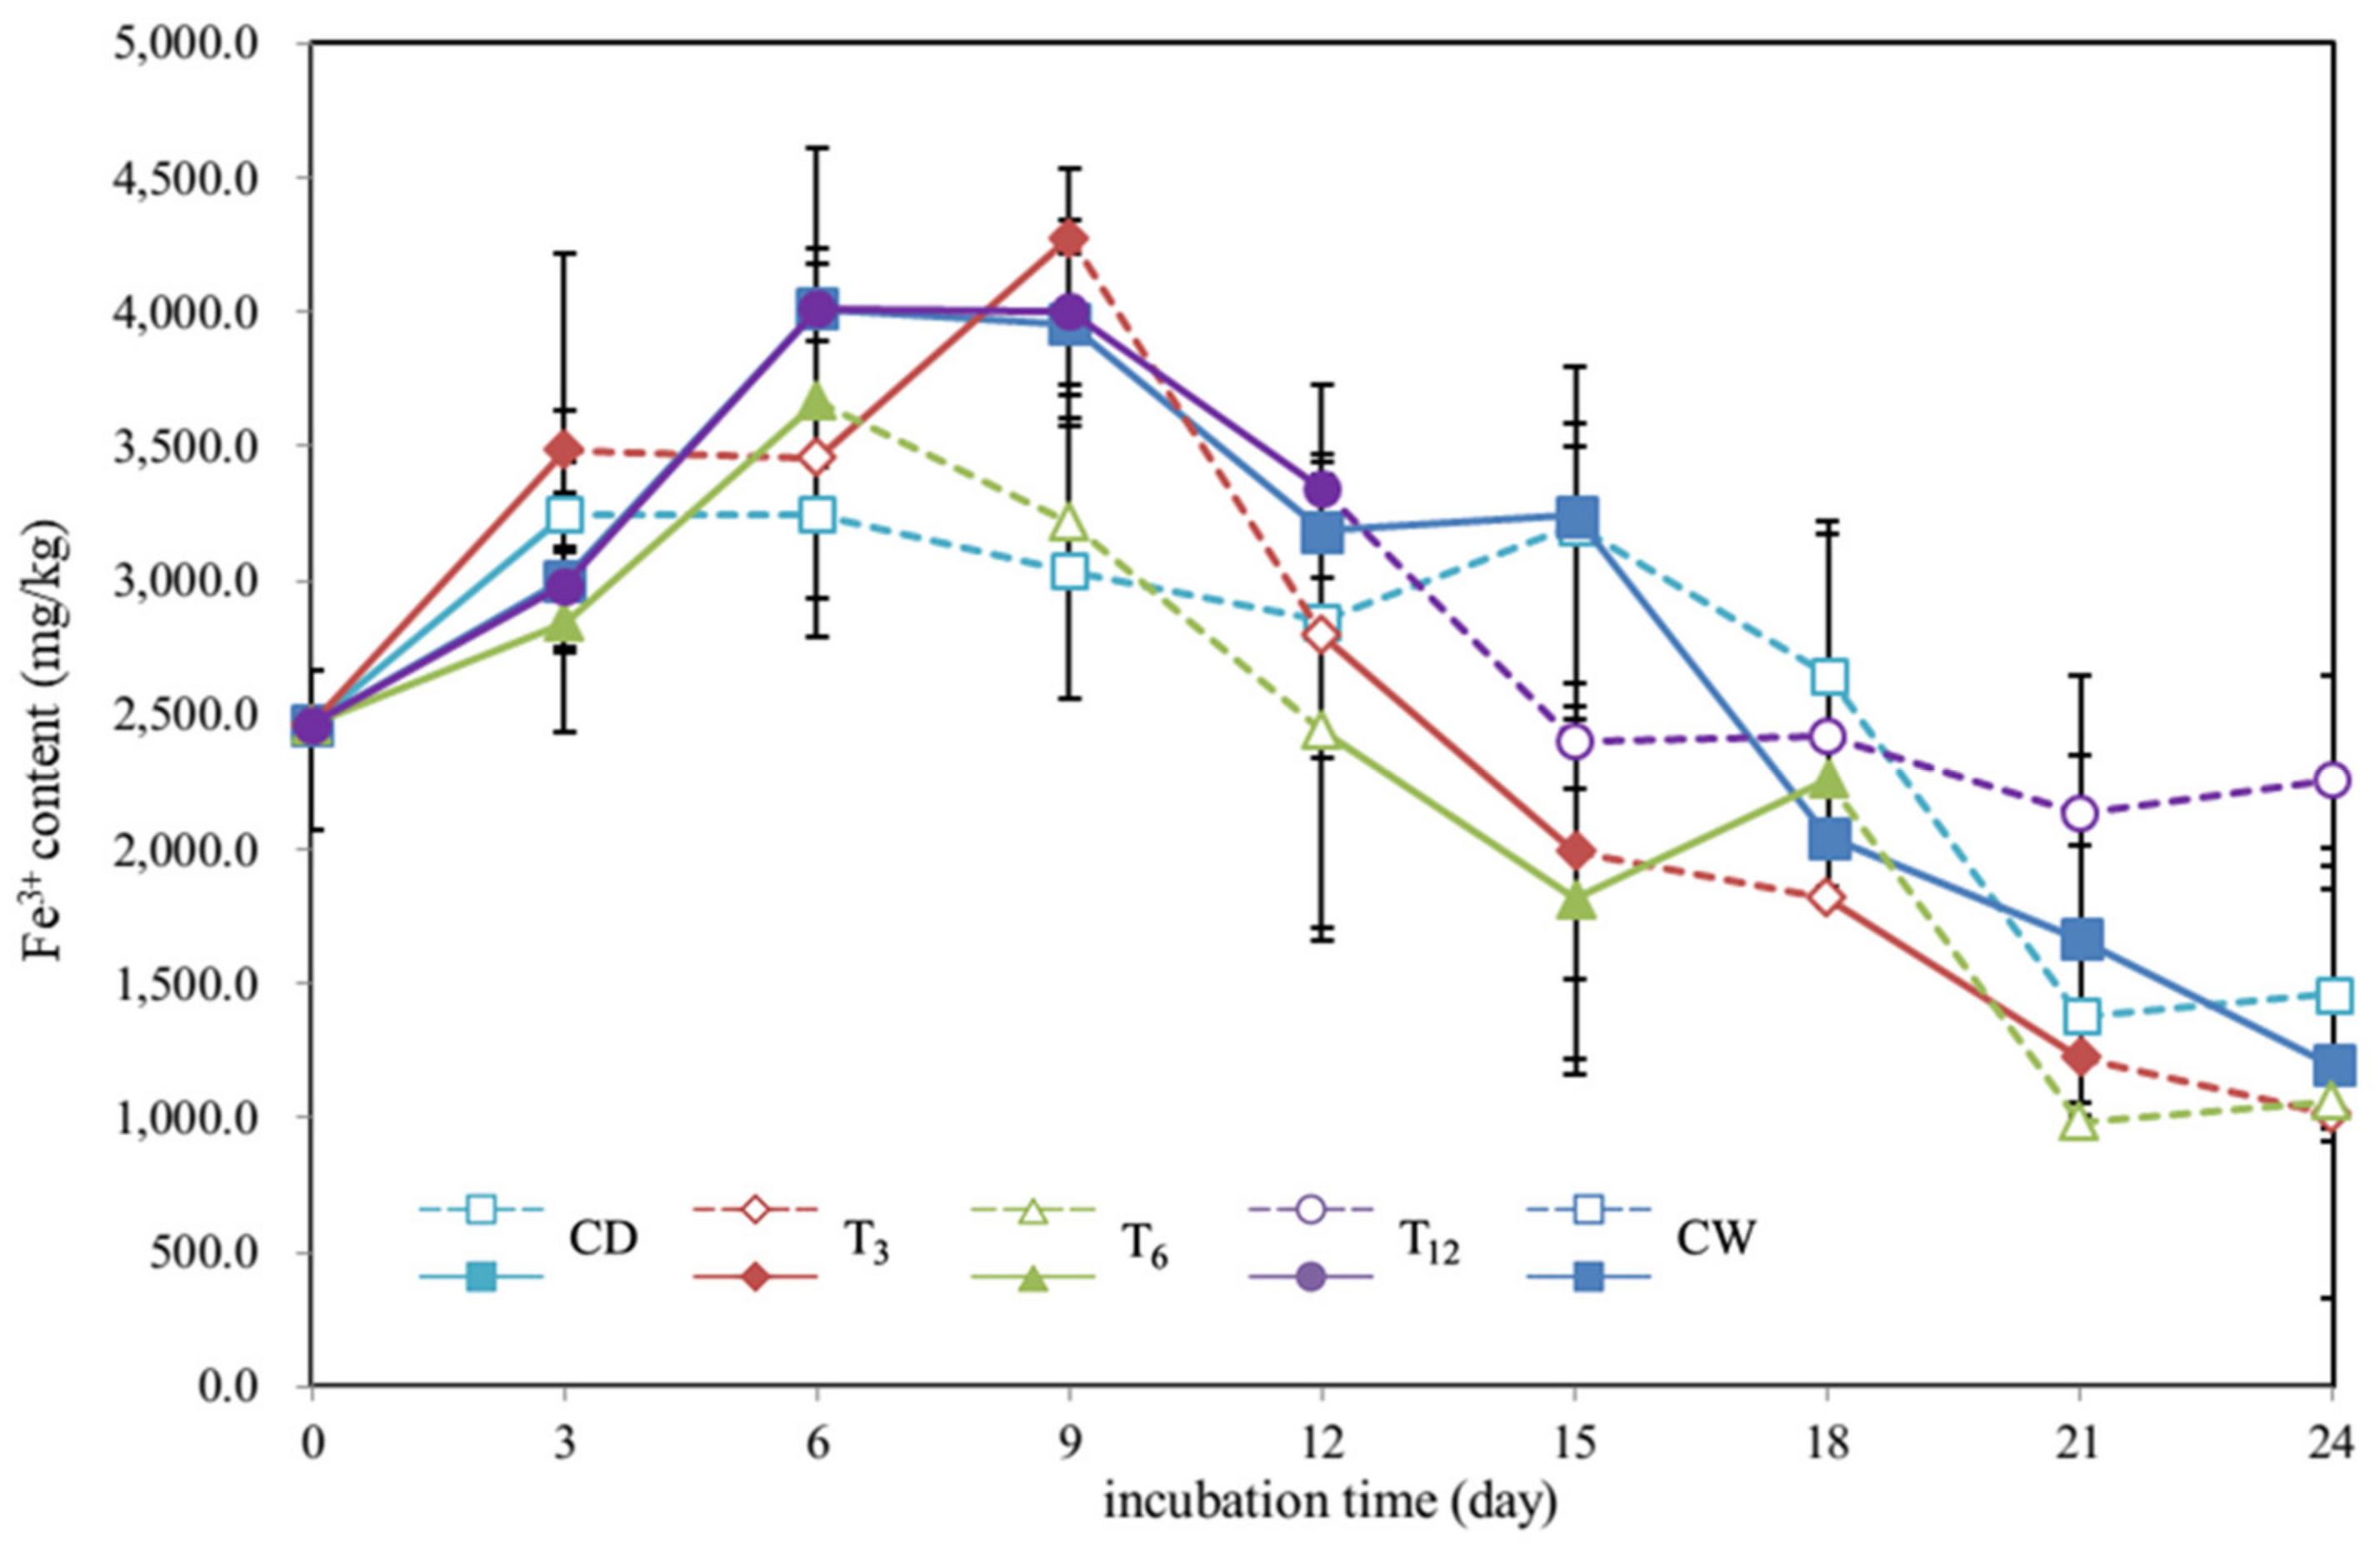
The Fe3+ content increased in the first few days and decreased in the late period for all treatments (Figure 6). In the CW treatment, as well as in the treatment T12, the Fe3+ content reached the peak at t = 6 days and then decreased continuously. In the CD treatment, the Fe3+ content was stable from t = 3 days to t = 15 days and started to drop after t = 15 days. In the treatment T3, the Fe3+ content kept rising in the first 9 days and continuously dropped after that. The Fe3+ accumulation pattern in the treatment T6 was similar to treatments of CW and T12, while there was a rise during t = 15 days and t = 18 days. Unlike the changing pattern of Fe2+, drying-rewetting cycles did not cause the fluctuation of Fe3+ content.
3.3. Dynamics of Total Organic Carbon in the Soil
The temporal variations of the total organic carbon (TOC) content under different treatments are shown in Figure 7. It is seen that the overall trend of the TOC contents was decreasing with time for all treatments. In the continuously wet treatment, the TOC content decreased quickly in the early period and declined slowly in the late period. In the continuously dry treatment, the TOC content decreased stably while at a slower rate than other treatments during the whole period. Comparing to CW and CD, the soils subject to drying-rewetting cycles had lower TOC content. However, the final TOC contents of three different drying-rewetting treatments (T3, T6 and T12) were close.
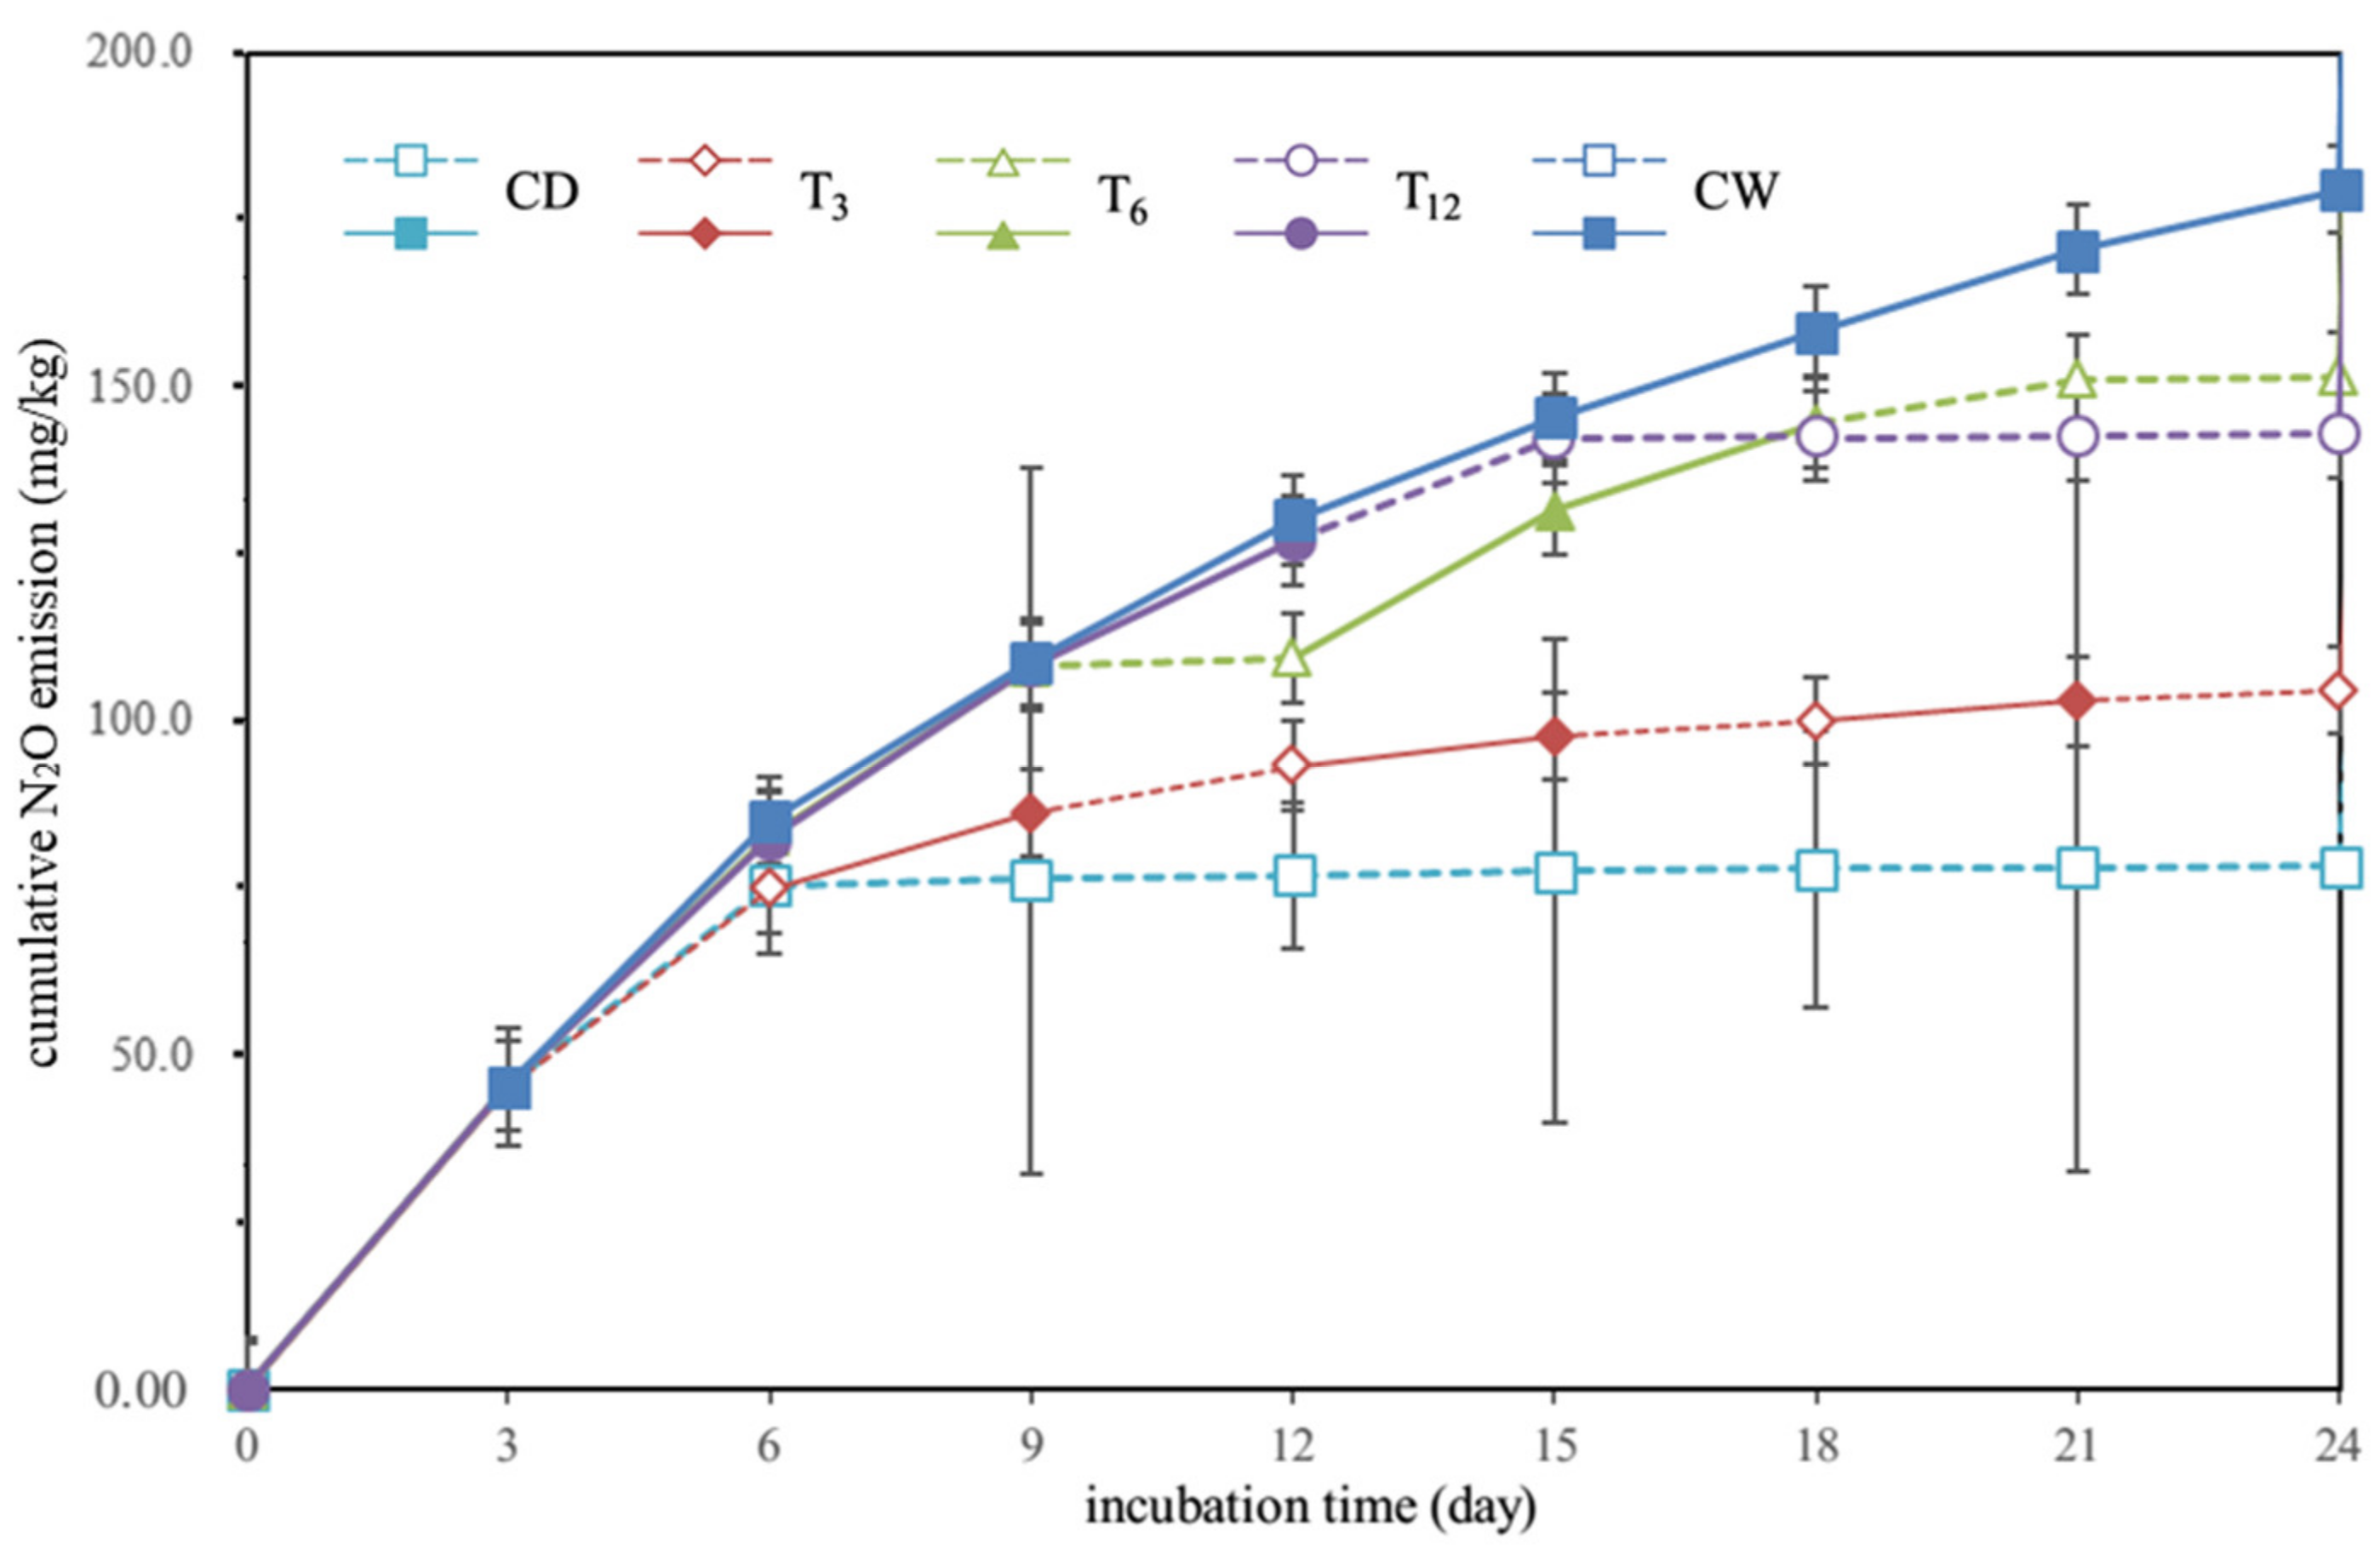
Due to the application of acetylene inhibition in the experiment, nitrous oxide (N2O) was the main gas emission (Figure 8). The accumulative N2O emission is overall consistent with NO3−-N reduction in all treatments. For instance, the nitrate loss was about 104 mg/kg (NO3−-N) in the T3 treatment. At the same time, the cumulative emission of the N2O was about 97 mg/kg (N2O-N) in this treatment. There was 7.9% mismatch in it.
4. Discussion
4.1. Nitrogen Dynamics
Drying and rewetting events affect the nitrogen transformation process from several aspects. Firstly, it could lead to the change of soil moisture content and oxygen level in soil, which eventually influences N dynamics. Secondly, the drying and rewetting process breaks the soil aggregates, resulting in the release of organic carbon held within aggregates. Thirdly, microorganism richness and community composition are affected by drying and rewetting process. Similar to respiration flush induced by rewetting dry soil [29,31], denitrification flush was also observed for treatments of T3 and T6 when the soil was rewetted (Figure 3a). The rewetting denitrification pulse may be attributed to the increase of easily available soil organic matter. The microbial mineralization of cytoplasmic solutes and the release of soil organic matter protected within microaggregates are two major sources of mineralized carbon [40]. Rewetting after a short drying period (3 days in T3) leads to slightly enhanced denitrification. However, rewetting after a moderately long drying period (6 days in T6) significantly stimulates denitrification intensity. The spike of denitrification during 12 and 18 d in T6 may be attributed to stronger mineralization of organic carbon (especially cytoplasmic solutes) after longer drying days. Thus, a moderately frequent drying-rewetting alternation generates the strongest denitrification, while excessively frequent drying-rewetting alternation may be not favorable to the population of denitrification bacteria. A decrease in microbial biomass with increased frequency of drying-rewetting cycles has been observed by previous studies [41,42].
In this study, more NH4+-N was produced under more frequent drying-rewetting treatments, which is consistent with previous studies [42]. The enhanced NH4+-N is likely due to the microbial mortality caused by water stress under drying conditions. Such NH4+-N pulse is particularly obvious after a longer wetting period. For example, there is a rise in NH4+-N during 6~12 d, 12~18 d for Treatment T6, and the NH4+-N pulse during 12~24 d for Treatment T12. For Treatment T6, it is interesting to observe that a faster NH4+-N accumulation coincides with a slower NO3−-N reduction during the drying-rewetting cycles. A stronger denitrification corresponds to a weaker NH4+-N production. For Treatment T12, the phenomenon is similar. It is likely that anaerobic bacteria (part of them are denitrification bacteria) were killed during the drying period.
There are many factors which can affect the denitrification rate for soil, including the moisture content, temperature, nitrate content, total organic carbon and so on [10]. Our results indicated that denitrification rates under different drying and rewetting cycles vary markedly. The NO3−-N content significantly correlated with the TOC content (Table 2), which agreed with the results of previous studies [11,18].
The nitrate reduction in the drying and rewetting cycles resulted in the production of N2O gases. A higher NO3−-N reduction corresponds to higher N2O emission. Correlation analysis showed that nitrate content was significantly correlated with the emission of N2O (r = −0.967, p < 0.01). Previous reported results showed that N2O was higher in the drying and rewetting treatment compared to the continuously wet treatment [14]. More extensive soil drying and more extensive rewetting stimulated N2O emission [27]. Our results seemed opposite to previous studies since the CW treatment produced the most N2O emission in this study. It is likely that with no acetylene inhibition, more N2 can be produced in the CW treatment, while acetylene in the flasks inhibits the reduction of N2O to N2 in our experiment [43]. It is reasonable since the denitrification process is a multi-step process and N2 is the end production without acetylene inhibition.
4.2. Fe Dynamics
There existed Fe2+ driven denitrification in this study since the content of Fe2+ declined continuously in the CW treatment. It is interesting to observe that the denitrification pulse was accompanied by Fe2+ content increase, which can be found in T3 (during 12~15 d, 18~21 d) and T6 (during 12~18 d). The increment of ferrous iron may be due to the reaction of ferric iron and organic carbon. Lots of archaebacteria were found in wetland and Fe3+ reduction occurred when microorganisms generated chemical substances which would promote the nonenzymatic conversion of Fe3+ to Fe2+. The reaction between iron and organic carbon can be described by the following chemical equations [44,45]. However, we observed that the increase in Fe2+ did not match with the decline in Fe3+, which was possibly attributed to the formation of poorly soluble Fe3+ products [19]:
Thus, the ferrous iron is one of the electron donors for denitrification although the ferrous iron itself was the reductive production of ferric iron with organic carbon in the anaerobic environment [19,45]. As the experiment went by, the available ferrous iron was consumed by ferrous iron-involved denitrification. However, rewetting restored the available ferrous iron at the expense of consuming more organic carbon.
Fe2+ content had been reported to be significantly with nitrate content, suggesting that Fe2+ participates in the denitrification [10,16]. The NO3−-N content significantly correlated with the Fe2+ content. The value of correlation coefficient for the relationship between nitrate content and Fe2+ content (r = 0.661, p < 0.01; Table 2) was lower than the value of correlation coefficient for the relationship between nitrate content and TOC content (r = 0.943, p < 0.01; Table 2). Overall, from the results, C, N and Fe exist as complex interactions in the experimental soils. Drying-rewetting cycles further complicate the interactions. During the rewetting period, C and Fe2+ together provide electron donors to denitrification, and C simultaneously oxidizes Fe3+. The soil organic carbon consumption under drying-rewetting cycles is much higher than that under continuously dry or wet conditions. However, the higher TOC consumption is not due to stronger denitrification, because the reduced nitrate was lower under drying and rewetting condition than under the continuously wet condition. It is attributed to stronger soil respiration and additional consumption for Fe2+ oxidization.
5. Conclusions
This paper investigated the effect of drying-rewetting cycles on ferrous iron-involved denitrification in paddy soils. The results revealed the complex interactions among organic carbon, nitrate and Fe2+/Fe3+ under drying-rewetting condition. Soil rewetting led to denitrification flush, especially after a moderately long drying period, while excessively frequent drying-rewetting alternation was not favorable to nitrate denitrification. NH4+-N accumulated fast during the drying period. Fe2+ contributed to the denitrification process. Drying-rewetting cycles led to additional consumption of organic carbon and increased the available Fe2+ for autotrophic denitrification.
Author Contributions
Y.Z., L.S. and J.H. conceived and designed the experiments; Y.Z. and B.X. executed the experiments and measured the data; Y.Z. and L.S. analyzed the data and wrote the paper; L.S. and B.X. revised the manuscript. All authors have read and agreed to the published version of the manuscript.
Funding
This work was funded by the National Natural Science Foundation of China, grant number 51979200.
Institutional Review Board Statement
Not applicable.
Informed Consent Statement
Not applicable.
Data Availability Statement
Not applicable.
Conflicts of Interest
The authors declare no conflict of interest.
References
- Ashok, V.; Hait, S. Remediation of nitrate-contaminated water by solid-phase denitrification process—A review. Environ. Sci. Pollut. Res. 2015, 22, 8075–8093. [Google Scholar] [CrossRef]
- Zhu, X.; Burger, M.; Doane, T.A.; Horwath, W.R. Ammonia oxidation pathways and nitrifier denitrification are significant sources of N2O and NO under low oxygen availability. Proc. Natl. Acad. Sci. USA 2013, 110, 6328–6333. [Google Scholar] [CrossRef] [PubMed] [Green Version]
- Liu, D.; Zhu, X.; Wang, Y. China’s agricultural green total factor productivity based on carbon emission: An analysis of evolution trend and influencing factors. J. Clean. Prod. 2021, 278, 123692. [Google Scholar] [CrossRef]
- Zhang, W.-f.; Dou, Z.-x.; He, P.; Ju, X.T.; Powlson, D.; Chadwick, D.; Norse, D.; Lu, Y.L.; Zhang, Y.; Wu, L.; et al. New technologies reduce greenhouse gas emissions from nitrogenous fertilizer in China. Proc. Natl. Acad. Sci. USA 2013, 110, 8375–8380. [Google Scholar] [CrossRef] [Green Version]
- Knowles, R. Denitrification. Microbiol. Rev. 1982, 46, 43–70. [Google Scholar] [CrossRef]
- Weber, K.A.; Achenbach, L.A.; Coates, J.D. Microorganisms pumping iron: Anaerobic microbial iron oxidation and reduction. Nat. Rev. Microbiol. 2006, 4, 752–764. [Google Scholar] [CrossRef] [Green Version]
- Dutta, T.; Carles-Brangarí, A.; Fernàndez-Garcia, D.; Rubol, S.; Tirado-Conde, J.; Sanchez-Vila, X. Vadose zone oxygen (O2) dynamics during drying and wetting cycles: An artificial recharge laboratory experiment. J. Hydrol. 2015, 527, 151–159. [Google Scholar] [CrossRef] [Green Version]
- Cho, S.; Kambey, C.; Nguyen, V. Performance of Anammox Processes for Wastewater Treatment: A Critical Review on Effects of Operational Conditions and Environmental Stresses. Water 2019, 12, 20. [Google Scholar] [CrossRef] [Green Version]
- Song, X.; Ehde, P.M.; Weisner, S.E.B. Effects of Water Depth and Phosphorus Availability on Nitrogen Removal in Agricultural Wetlands. Water 2019, 11, 2626. [Google Scholar] [CrossRef] [Green Version]
- Rivett, M.O.; Buss, S.R.; Morgan, P.; Smith, J.W.N.; Bemment, C.D. Nitrate attenuation in groundwater: A review of biogeochemical controlling processes. Water Res. 2008, 42, 4215–4232. [Google Scholar] [CrossRef]
- Zhang, M.; Zheng, P.; Li, W.; Wang, R.; Ding, S.; Abbas, G. Performance of nitrate-dependent anaerobic ferrous oxidizing (NAFO) process: A novel prospective technology for autotrophic denitrification. Bioresour. Technol. 2015, 179, 543–548. [Google Scholar] [CrossRef]
- Han, J.; Shi, L.; Wang, Y.; Chen, Z.; Xu, J. Investigation of ferrous iron-involved anaerobic denitrification in three subtropical soils of southern China. J. Soils Sediments 2018, 18, 1873–1883. [Google Scholar] [CrossRef]
- Xu, B.; Shi, L.; Zhong, H.; Wang, K. Investigation of Fe(II) and Mn(II) involved anoxic denitrification in agricultural soils with high manganese and iron contents. J. Soils Sediments 2021, 21, 452–468. [Google Scholar] [CrossRef]
- Li, X.; Zhang, W.; Liu, T.; Chen, L.; Chen, P.; Li, F. Changes in the composition and diversity of microbial communities during anaerobic nitrate reduction and Fe(II) oxidation at circumneutral pH in paddy soil. Soil Biol. Biochem. 2016, 94, 70–79. [Google Scholar] [CrossRef]
- Lovley, D.R.; Phillips, E.J.P. Novel Mode of Microbial Energy Metabolism: Organic Carbon Oxidation Coupled to Dissimilatory Reduction of Iron or Manganese. Appl. Environ. Microbiol. 1988, 54, 1472–1480. [Google Scholar] [CrossRef] [Green Version]
- Straub, K.L.; Benz, M.; Schink, B.; Widdel, F. Anaerobic, nitrate-dependent microbial oxidation of ferrous iron. Appl. Environ. Microbiol. 1996, 62, 1458–1460. [Google Scholar] [CrossRef] [Green Version]
- Tong, D.; Zhuang, J.; Chen, X. Reactive Transport and Removal of Nutrients and Pesticides in Engineered Porous Media. Water 2019, 11, 1316. [Google Scholar] [CrossRef] [Green Version]
- Melton, E.D.; Swanner, E.D.; Behrens, S.; Schmidt, C.; Kappler, A. The interplay of microbially mediated and abiotic reactions in the biogeochemical Fe cycle. Nat. Rev. Microbiol. 2014, 12, 797–808. [Google Scholar] [CrossRef]
- Mejia, J.; Roden, E.E.; Ginder-Vogel, M. Influence of Oxygen and Nitrate on Fe (Hydr)oxide Mineral Transformation and Soil Microbial Communities during Redox Cycling. Environ. Sci. Technol. 2016, 50, 3580–3588. [Google Scholar] [CrossRef] [Green Version]
- Baeseman, J.L.; Smith, R.L.; Silverstein, J. Denitrification potential in stream sediments impacted by acid mine drainage: Effects of pH, various electron donors, and iron. Microb. Ecol. 2006, 51, 232–241. [Google Scholar] [CrossRef]
- Schimel, J.; Balser, T.C.; Wallenstein, M. Microbial stress-response physiology and its implications for ecosystem function. Ecology 2007, 88, 1386–1394. [Google Scholar] [CrossRef]
- Cui, Y.; Huang, J. A Review of Researches on Efficient Agricultural Water Use in China. Bull. Chin. Acad. Sci. 2012, 26, 48–53. [Google Scholar]
- Yemadje, P.L.; Chevallier, T.; Guibert, H.; Bertrand, I.; Bernoux, M. Wetting-drying cycles do not increase organic carbon and nitrogen mineralization in soils with straw amendment. Geoderma 2016, 304, 68–75. [Google Scholar] [CrossRef]
- De Nijs, E.A.; Hicks, L.C.; Leizeaga, A.; Tietema, A.; Rousk, J. Soil microbial moisture dependences and responses to drying–rewetting: The legacy of 18 years drought. Glob. Chang. Biol. 2019, 25, 1005–1015. [Google Scholar] [CrossRef]
- Stutter, M.; Graeber, D.; Weigelhofer, G. Available Dissolved Organic Carbon Alters Uptake and Recycling of Phosphorus and Nitrogen from River Sediments. Water 2020, 12, 3321. [Google Scholar] [CrossRef]
- Borken, W.; Matzner, E. Reappraisal of drying and wetting effects on C and N mineralization and fluxes in soils. Glob. Chang. Biol. 2009, 15, 808–824. [Google Scholar] [CrossRef]
- Guo, X.; Drury, C.F.; Yang, X.; Daniel Reynolds, W.; Fan, R. The Extent of Soil Drying and Rewetting Affects Nitrous Oxide Emissions, Denitrification, and Nitrogen Mineralization. Soil Sci. Soc. Am. J. 2014, 78, 194. [Google Scholar] [CrossRef]
- Ma, R.; Cai, C.; Li, Z.; Wang, J.; Xiao, T.; Peng, G.; Yang, W. Evaluation of soil aggregate microstructure and stability under wetting and drying cycles in two Ultisols using synchrotron-based X-ray micro-computed tomography. Soil Tillage Res. 2015, 149, 1–11. [Google Scholar] [CrossRef]
- Fierer, N.; Schimel, J.P. Effects of drying–rewetting frequency on soil carbon and nitrogen transformations. Soil Biol. Biochem. 2002, 34, 777–787. [Google Scholar] [CrossRef]
- Li, Z.; Wu, L.; Zhang, H.; Luo, Y.; Christie, P. Effects of soil drying and wetting-drying cycles on the availability of heavy metals and their relationship to dissolved organic matter. J. Soils Sediments 2015, 15, 1510–1519. [Google Scholar] [CrossRef] [Green Version]
- Shi, A.; Yan, N.; Marschner, P. Cumulative respiration in two drying and rewetting cycles depends on the number and distribution of moist days. Geoderma 2015, 243–244, 168–174. [Google Scholar] [CrossRef]
- Cai, Z.; Shan, Y.; Xu, H. Effects of nitrogen fertilization on CH4 emissions from rice fields. Soil Sci. Plant Nutr. 2007, 53, 353–361. [Google Scholar] [CrossRef]
- Harrison-Kirk, T.; Beare, M.H.; Meenken, E.D.; Condron, L.M. Soil organic matter and texture affect responses to dry/wet cycles: Effects on carbon dioxide and nitrous oxide emissions. Soil Biol. Biochem. 2013, 57, 43–55. [Google Scholar] [CrossRef]
- Chen, M.; Liu, C.; Li, X.; Huang, W.; Li, F. Iron Reduction Coupled to Reductive Dechlorination in Red Soil. Soil Sci. 2014, 179, 457–467. [Google Scholar] [CrossRef]
- Ministry of Agriculture of the People’s Republic of China. Soil Testing—Cutting Ring Method for Determination of Field Water-Holding Capacity in Soil; NY/T 1121; Ministry of Agriculture of the People’s Republic of China: Beijing, China, 2010.
- Ministry of Environ-mental Protection of the People’s Republic of China. Soil-Determination of pH-Potentiometry; HJ 962; Ministry of Environ-mental Protection of the People’s Republic of China: Beijing, China, 2018.
- Ministry of Environmental Protection of the People’s Republic of China. Determination of Organic Matter-Ignition Loss Method; HJ 761; Ministry of Environmental Protection of the People’s Republic of China: Beijing, China, 2015.
- Ministry of Environmental Protection of the People’s Republic of China. Soil—Determination of Ammonium, Nitrite and Nitrate by Extraction with Potassium Chloride Solution-Spectrophotometric Methods; HJ 634; Ministry of Environmental Protection of the People’s Republic of China: Beijing, China, 2012.
- Ministry of Environmental Protection of the People’s Republic of China. Water Quality—Determination of Iron—Phenanthroline Spectro-Photometry; HJ/T 345; Ministry of Environmental Protection of the People’s Republic of China: Beijing, China, 2007.
- Fierer, N.; Schimel, J.P.; Holden, P.A. Variations in microbial community composition through two soil depth profiles. Soil Biol. Biochem. 2003, 35, 167–176. [Google Scholar] [CrossRef]
- Van Gestel, M.; Merckx, R.; Vlassak, K. Microbial biomass responses to soil drying and rewetting: The fate of fast- and slow-growing microorganisms in soils from different climates. Soil Biol. Biochem. 1993, 25, 109–123. [Google Scholar] [CrossRef]
- Morillas, L.; Durán, J.; Rodríguez, A.; Roales, J.; Gallardo, A.; Lovett, G.M.; Groffman, P.M. Nitrogen supply modulates the effect of changes in drying-rewetting frequency on soil C and N cycling and greenhouse gas exchange. Glob. Chang. Biol. 2015, 21, 3854–3863. [Google Scholar] [CrossRef]
- Zhang, J.; Müller, C.; Cai, Z. Heterotrophic nitrification of organic N and its contribution to nitrous oxide emissions in soils. Soil Biol. Biochem. 2015, 84, 199–209. [Google Scholar] [CrossRef]
- Lovley, D.R.; Coates, J.D. Novel forms of anaerobic respiration of environmental relevance. Curr. Opin. Microbiol. 2000, 3, 252–256. [Google Scholar] [CrossRef]
- Lovley, D.R.; Holmes, D.E.; Nevin, K.P. Dissimilatory Fe(III) and Mn(IV) Reduction. Adv. Microb. Physiol. 2004, 49, 219–286. [Google Scholar]
Figure 1.
Moisture content design of different drying-rewetting treatments: (a) Continuously wet (solid line), continuously dry (dotted line); (b) Drying-rewetting alternation at an interval of 3 days; (c) 6 days and (d) 12 days.
Figure 1.
Moisture content design of different drying-rewetting treatments: (a) Continuously wet (solid line), continuously dry (dotted line); (b) Drying-rewetting alternation at an interval of 3 days; (c) 6 days and (d) 12 days.

Figure 2.
The dynamic of NO3−-N content in different treatments. The solid and dotted lines represent the rewetting and drying period, respectively. The vertical bars refer to one standard deviation (n = 3).
Figure 2.
The dynamic of NO3−-N content in different treatments. The solid and dotted lines represent the rewetting and drying period, respectively. The vertical bars refer to one standard deviation (n = 3).

Figure 3.
Instantaneous reduction rate of NO3−-N in different treatments. (a) The solid and hollow boxes represent the soil in the rewetting and drying period, respectively; (b) Cumulative reduction of NO3−-N in different treatments. The vertical bars refer to one standard deviation (n = 3).
Figure 3.
Instantaneous reduction rate of NO3−-N in different treatments. (a) The solid and hollow boxes represent the soil in the rewetting and drying period, respectively; (b) Cumulative reduction of NO3−-N in different treatments. The vertical bars refer to one standard deviation (n = 3).

Figure 4.
The dynamic of NH4+-N content in different treatments. The solid and dotted lines represent the rewetting and drying period, respectively. The vertical bars refer to one standard deviation (n = 3).
Figure 4.
The dynamic of NH4+-N content in different treatments. The solid and dotted lines represent the rewetting and drying period, respectively. The vertical bars refer to one standard deviation (n = 3).

Figure 5.
The dynamic of Fe2+ content in different treatments. The solid and dotted lines represent the rewetting and drying period, respectively. The vertical bars refer to one standard deviation (n = 3).
Figure 5.
The dynamic of Fe2+ content in different treatments. The solid and dotted lines represent the rewetting and drying period, respectively. The vertical bars refer to one standard deviation (n = 3).

Figure 6.
The dynamic of Fe3+ content in different treatments. The solid and dotted lines represent the rewetting and drying period, respectively. The vertical bars refer to one standard deviation (n = 3).
Figure 6.
The dynamic of Fe3+ content in different treatments. The solid and dotted lines represent the rewetting and drying period, respectively. The vertical bars refer to one standard deviation (n = 3).

Figure 7.
The dynamic of TOC content in different treatments. The solid and dotted lines represent the rewetting and drying period, respectively. The vertical bars refer to one standard deviation (n = 3).
Figure 7.
The dynamic of TOC content in different treatments. The solid and dotted lines represent the rewetting and drying period, respectively. The vertical bars refer to one standard deviation (n = 3).

Figure 8.
The accumulated N2O emission in different treatments. The solid and dotted lines represent the rewetting and drying period, respectively. The vertical bars refer to one standard deviation (n = 3).
Figure 8.
The accumulated N2O emission in different treatments. The solid and dotted lines represent the rewetting and drying period, respectively. The vertical bars refer to one standard deviation (n = 3).


Table 1.
The chemical and physical properties of the soil used.
| Soil Site | pH | TN | TOC | NO3−-N | NH4+-N | Fe3+ | Fe2+ | Sand | Silt | Clay |
|---|---|---|---|---|---|---|---|---|---|---|
| g/kg | g/kg | mg/kg | mg/kg | g/kg | g/kg | % | % | % | ||
| De’an | 5.70 ± 0.01 | 2.23 ± 0.39 | 12.47 ± 0.20 | 1.15 ± 0.03 | 4.61 ± 0.26 | 2.03 ± 0.16 | 0.23 ± 0.01 | 26.74 ± 0.10 | 44.76 ± 0.36 | 28.50 ± 0.10 |
TN total nitrogen, TOC total organic carbon. Values are the mean ± standard deviation (n = 3). Fe3+, Fe2+ represents extractable Fe3+ and Fe2+ by 0.5 mol/L HCl extraction, respectively.
Table 2.
Correlation matrix of the chemical properties in all soil samples.
| NO3−-N | Fe2+ | Fe3+ | TOC | NH4+-N | N2O | |
|---|---|---|---|---|---|---|
| NO3−-N | 1 | |||||
| Fe2+ | 0.661 ** | 1 | ||||
| Fe3+ | −0.533 ** | −0.517 * | 1 | |||
| TOC | 0.943 ** | 0.721 ** | −0.555 ** | 1 | ||
| NH4+-N | −0.709 ** | −0.864 ** | −0.609 ** | −0.833 ** | 1 | |
| N2O | −0.967 ** | −0.550 ** | −0.385 ** | −0.900 ** | 0.611 ** | 1 |
Sample size: n = 135. ** Correlation is significant at the 0.01 level (2-tailed). * Correlation is significant at the 0.05 level (2-tailed).
Publisher’s Note: MDPI stays neutral with regard to jurisdictional claims in published maps and institutional affiliations. |
© 2021 by the authors. Licensee MDPI, Basel, Switzerland. This article is an open access article distributed under the terms and conditions of the Creative Commons Attribution (CC BY) license (https://creativecommons.org/licenses/by/4.0/).
Share and Cite
MDPI and ACS Style
Zhang, Y.; Xu, B.; Han, J.; Shi, L. Effects of Drying-Rewetting Cycles on Ferrous Iron-Involved Denitrification in Paddy Soils. Water 2021, 13, 3212. https://doi.org/10.3390/w13223212
AMA Style
Zhang Y, Xu B, Han J, Shi L. Effects of Drying-Rewetting Cycles on Ferrous Iron-Involved Denitrification in Paddy Soils. Water. 2021; 13(22):3212. https://doi.org/10.3390/w13223212
Chicago/Turabian StyleZhang, Yushuai, Baokun Xu, Jiangpei Han, and Liangsheng Shi. 2021. "Effects of Drying-Rewetting Cycles on Ferrous Iron-Involved Denitrification in Paddy Soils" Water 13, no. 22: 3212. https://doi.org/10.3390/w13223212
Note that from the first issue of 2016, this journal uses article numbers instead of page numbers. See further details here.