Article

Use of Multidisciplinary Approaches for Groundwater Recharge Mechanism Characterization in Basement Aquifers: Case of Sanon Experimental Catchment in Burkina Faso

1
Laboratoire Eaux, Hydro-Systèmes et Agriculture (LEHSA), Institut International d’Ingénierie de l’Eau et de l’Environnement (2iE), Ouagadougou BP 594, Burkina Faso
2
Service des Déchets Radioactifs et des Transferts dans la Géosphère (SEDRE), Institut de Radioprotection et Sûreté Nucléaire (IRSN), B.P. 17, CEDEX, 92262 Fontenay-aux-Roses, France
3
Institut de Génie de l’Environnement et du Développement Durable (IGEDD), Université Joseph KI-ZERBO, Ouagadougou BP 7021, Burkina Faso
*
Author to whom correspondence should be addressed.
Water 2021, 13(22), 3216; https://doi.org/10.3390/w13223216
Submission received: 27 September 2021 / Revised: 31 October 2021 / Accepted: 8 November 2021 / Published: 12 November 2021
(This article belongs to the Section Hydrogeology)

Abstract

:
In Burkina Faso, the basement aquifers represent a major asset in terms of quantity and quality, for both drinking and irrigation purposes for rural populations. They provide water resources that can guarantee the long-term needs of the populations, provided that a sustainable management policy for these resources is adopted. Yet, any groundwater resource management policy is necessarily linked to a better knowledge of aquifer recharge mechanisms, which is yet to be fully assessed in the Sahelian basement area. The objective of this study was to characterize the recharge mechanism within the experimental site of Sanon, located in the basement zone in Burkina Faso, using a coupling of hydrodynamic and chemical approaches. The hydrodynamic approach consisted of monitoring the spatial and temporal distribution of the piezometric levels of the aquifers along a north–south and east–west transect and determining soil infiltration capacity. The hydrochemical characterization of the aquifers was carried out through an analysis of groundwater samples from the concerned aquifers and daily tracing of the electrical conductivity of the aquifer water. The cross-analysis from the results of the implemented approaches shows a direct recharge mechanism through rainwater infiltration in the central valley, an indirect recharge mechanism in the lowlands, and a recharge mechanism by lateral transfers in the peripheral aquifers of the Sanon experimental catchment. The existence of a piezometric dome reveals in the central valley a zone of preferential recharge and water movement. The water of the central valley is the least mineralized with electrical conductivities below 100 µS/cm. This mineralization follows the direction of the water flow.

Graphical Abstract

1. Introduction

Groundwater is widely used by the population in Sahelian countries as an alternative to intermittent surface water [1]. In Burkina Faso, about 70% of the population depends on groundwater to meet their domestic needs [2]. However, in terms of geology, basement rocks cover almost 80% of the country [3]. The aquifers in this area contain a well-distributed water resource with little dependence on surface water [4]. Although the volume of water stored in these aquifers is not as substantial, they contribute to the socioeconomic wellbeing of both rural and urban populations [5,6]. However, the rapid population growth, the improvement of living conditions, and the increase in water use due to economic activities contribute to increasing pressure on groundwater resources [7]. In addition, the development of sectors of activity with higher pollution potential (mining industries, agriculture) constitutes threats to the quality of groundwater resources [8,9,10]. Given the importance of groundwater resources for Burkina Faso, it is critical to develop informed and sustainable management policies for these resources. However, the implementation of such management policies requires beforehand a quantification of groundwater renewable rate linked mainly in such a context to groundwater recharge [11,12,13,14].
According to the state of art, several methods have been developed for estimating aquifer recharge rates. These methods include empirical [15,16,17], physical [15,18,19], and chemical methods [12,20,21,22], as well as hydrogeological modeling [17,23,24,25,26,27]. Since each method carries its own uncertainties, some authors [17,18,28,29] have recommended a combination of several methods to estimate a robust range for the amount of groundwater recharge. The selection of specific methods depends on several factors such as the objective of the study, the consideration given to spatial and temporal scales and variability of the considered processes, the characteristics of the aquifer, and the availability of hydro-climatic data [15,30]. However, a reliable characterization of the aquifer recharge mechanism might help in developing a robust conceptualization of the recharge process [17,18,31,32] and support the development of aquifer protection policies [33,34].
Regarding the Burkina Faso basement complex, studies related to the characterization of groundwater recharge mechanism are almost nonexistent. A handful of previous attempts have mainly focused on quantifying groundwater recharge [7,35,36,37]. However, most of these studies did not consider the pathways followed by the water throughout the soil layers to the aquifer, which might lead to uncertainties in the amount of recharge estimates [17,31,32]. Second, there is still a lack of knowledge of the aquifer’s vulnerability zones [38]. Previous studies mainly focused on isotopic tracing to characterize the groundwater recharge mechanism [39,40,41,42,43,44]. In the Sahelian region of West Africa, however, few studies have explored this approach, probably because of the relatively high cost and expertise required for isotopic analyses. The characterization studies that exist were carried out in Niger and concluded that the indirect recharge process is highly influenced by the size of the drainage network [45,46]. For Abdou et al. [47], temporary streams and endorheic ponds constituted preferential recharge zones in arid or semiarid basement zones. Given the extremely complex nature of the processes involved in the occurrence of recharge and their variability across a catchment, the use of a single method to characterize the recharge mechanism may obscure the plurality of recharge types that may coexist within a site and conclude that the recharge mechanism is unique. The use of a multidisciplinary approaches could allow a better characterization of the different types of recharge that occur within a catchment.
The objective of this study was to characterize the recharge mechanism in basement rock area. In this scope, the Sanon experimental catchment (14 km2) was used as a case study. The location of the catchment area in a granitic and granitic–gneissic basement zone, representative of a large part of West Africa basement formations [48], the degradation of the landscape of the catchment area, its belonging to the Sahelian climatic zone (subject to the effects of climate change), and its long-term monitoring (since 1989) make the catchment area a very interesting observatory for this study. The main approach developed in this study focuses on the characterization of the soil–aquifer continuum using several types of data: hydraulic parameters of the soils and hydrodynamic and hydrogeochemical parameters of the aquifers.

2. Materials and Methods
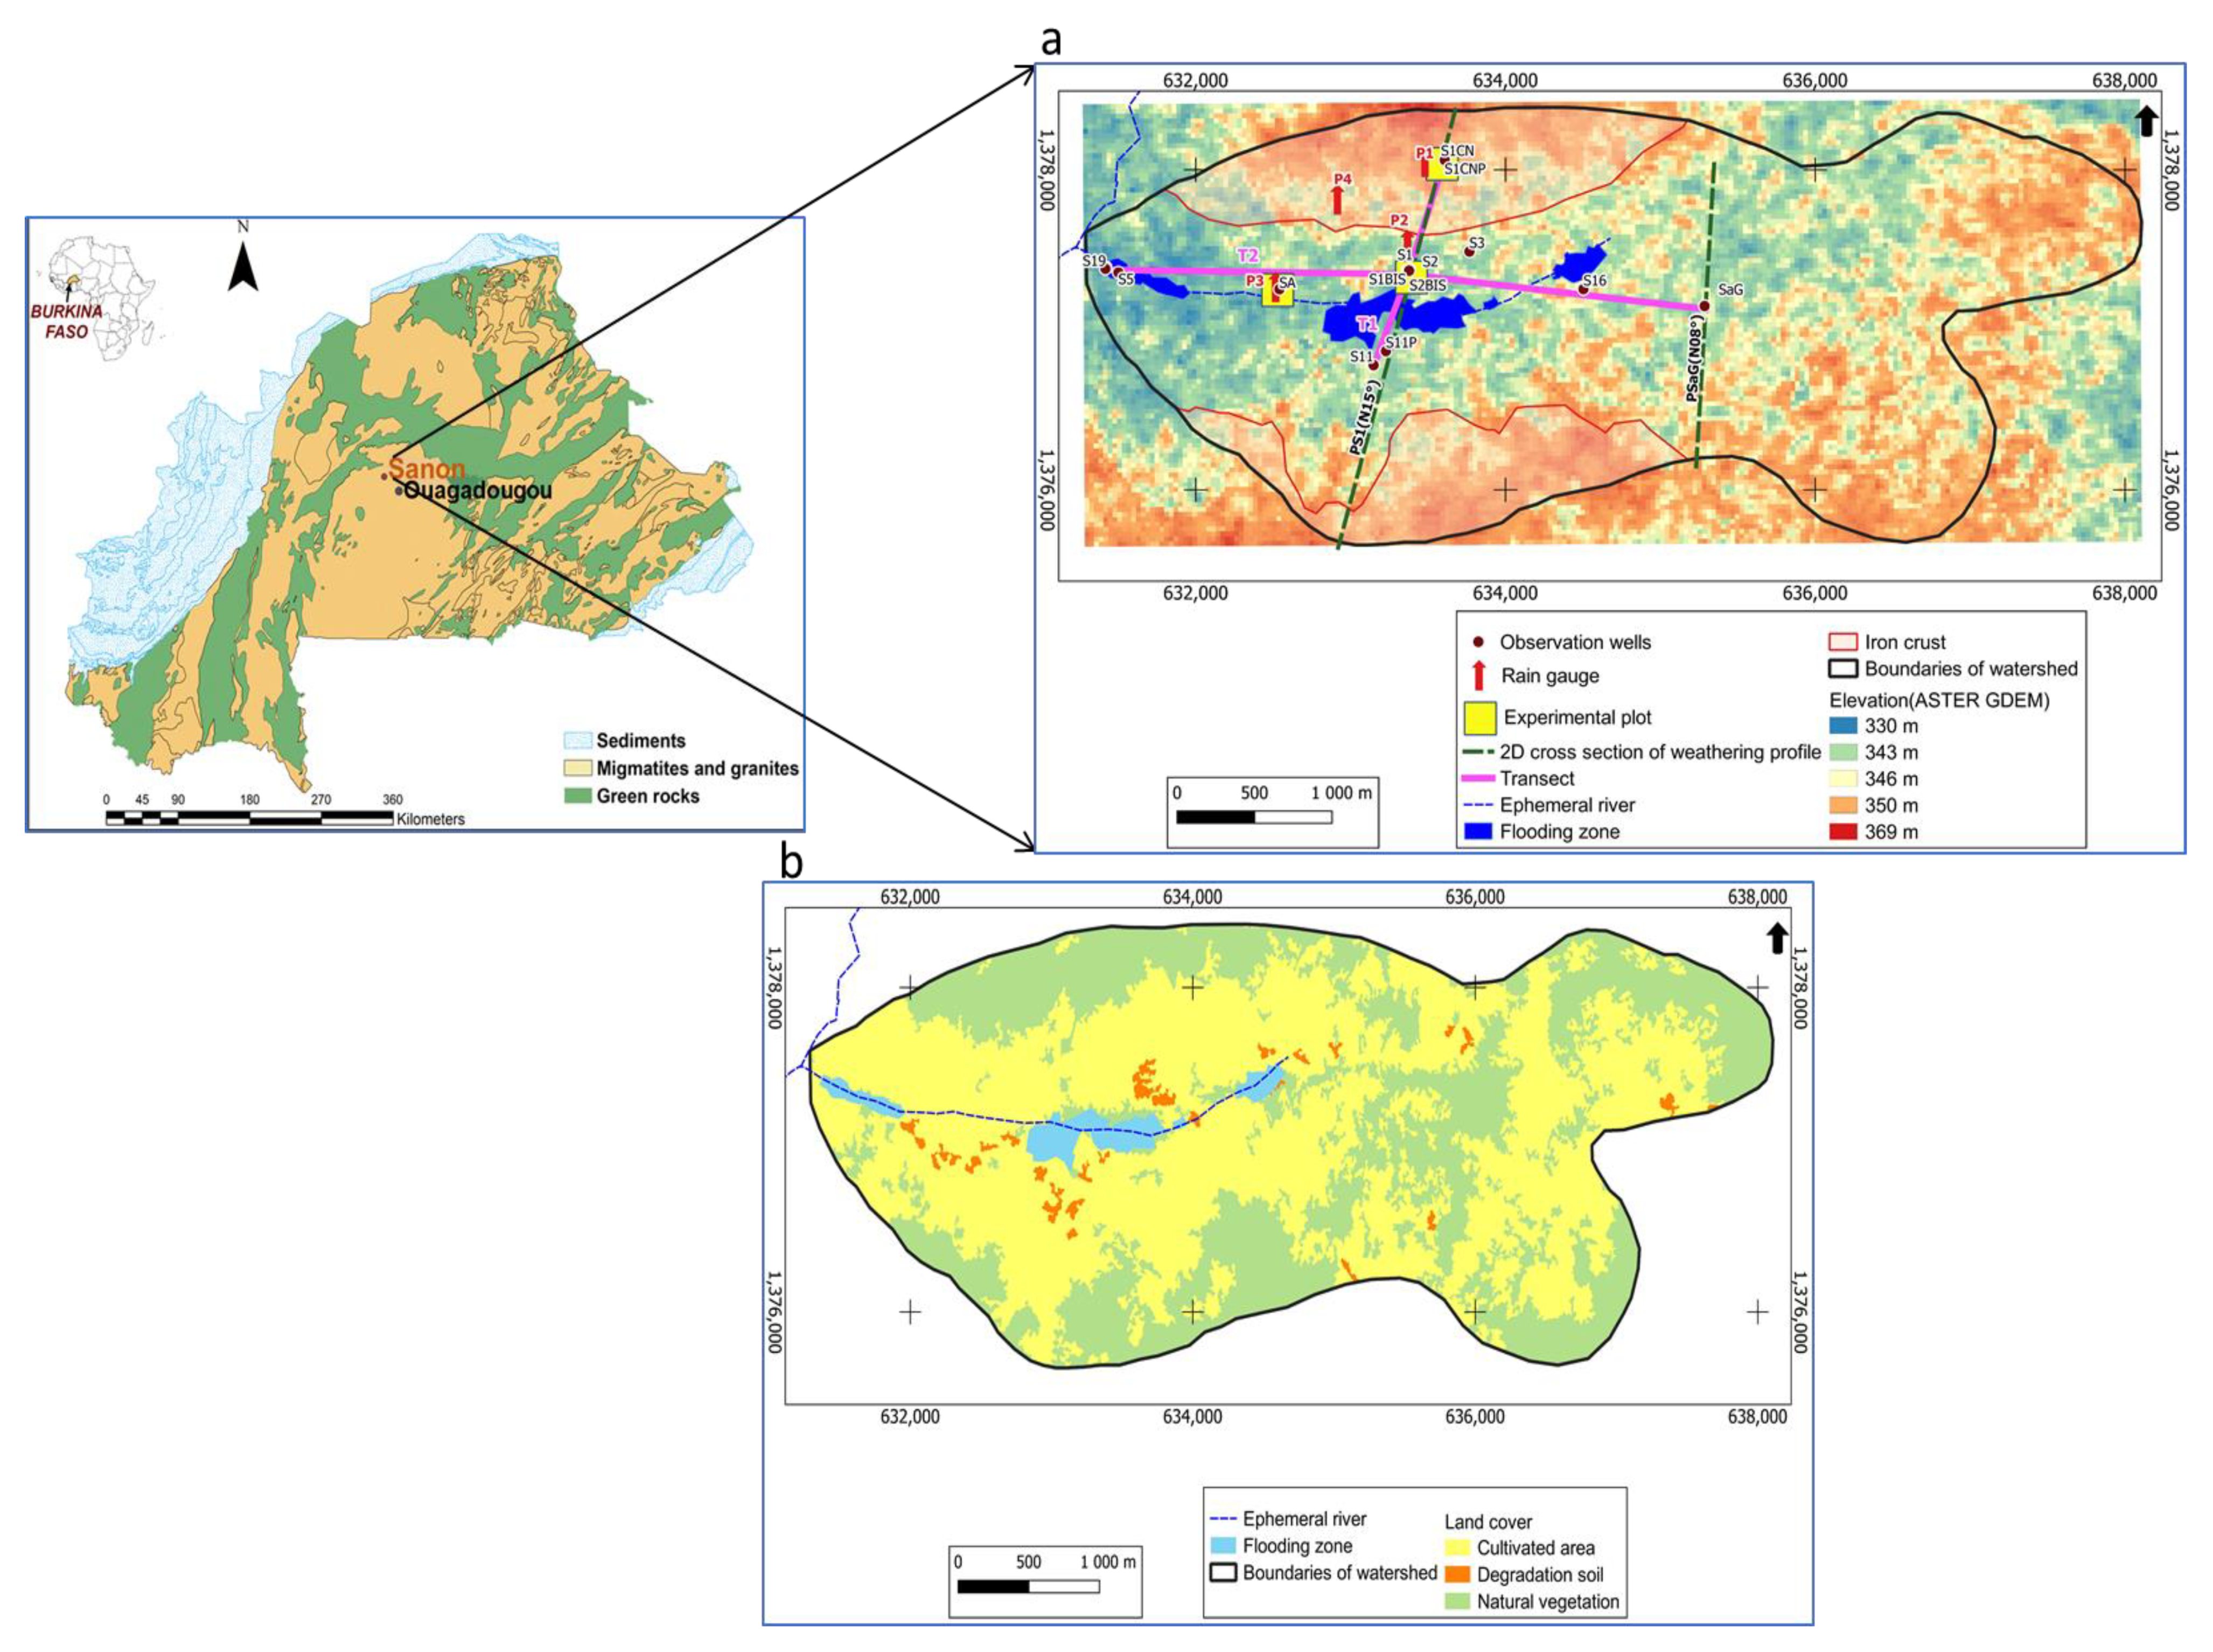
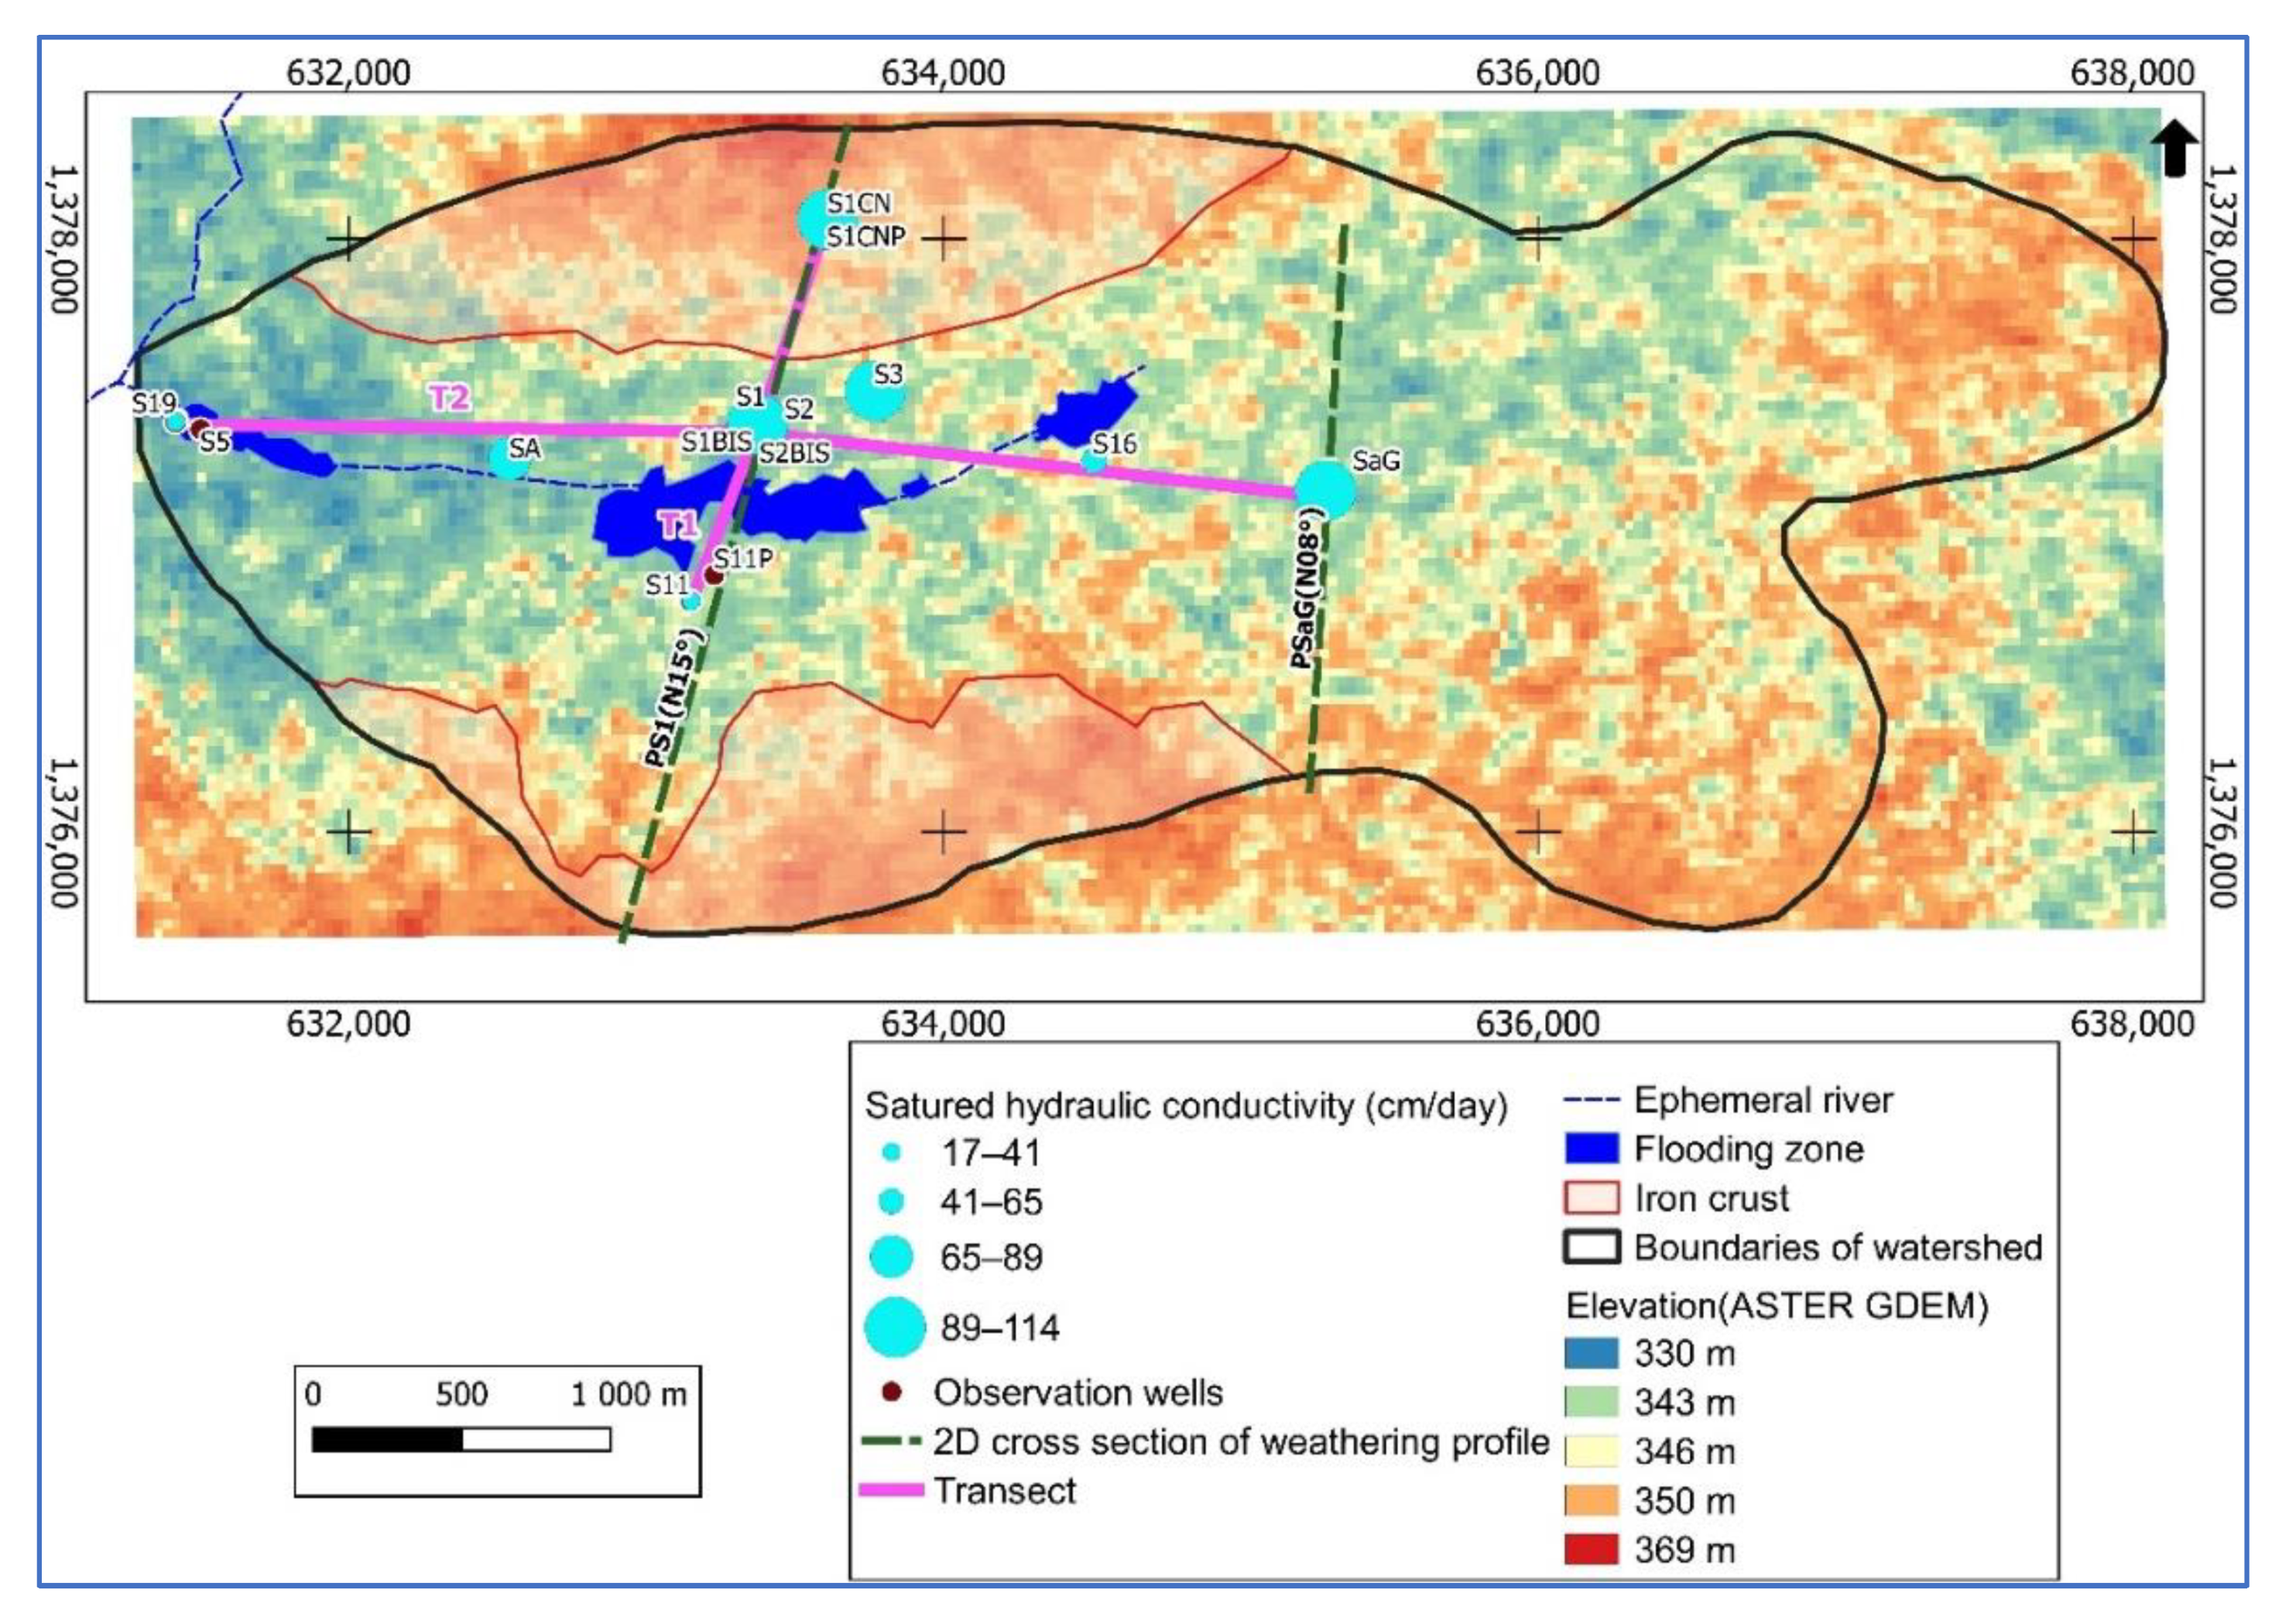
2.1. Study Site

The Sanon experimental site is located in central Burkina Faso about 40 km northwest Ouagadougou, the capital city of Burkina Faso (Figure 1). It lies between latitudes 12°26′10″ and 12°28′11″ north and longitudes 1°48′35″ and 1°43′72″ west. The study area is a rural catchment with a relatively flat central valley (average elevation is about 340 masl). The site aspect is characterized by a dominant westward slope. The soils are deep indurated tropical ferruginous leached soils with a predominantly clay–loam surface texture [49].
The Sanon catchment covers an area of 14 km2, and it is surrounded by thick lateritic iron crust hills composed of relic dismantled erosional surface at an altitude between 350 and 370 [48,50]. In the valley, the hydrographic network consists of small streams.
The climate of Sanon is semiarid [52], with a long dry season (November to June) and a short rainy season from July to October. The average annual rainfall from 1961 to 2020 was 768.6 mm with a unimodal regime in August. The average monthly temperatures vary between 25 °C in January and 33 °C in March. The annual values of potential evapotranspiration can reach 2064 mm (1980–2014). The catchment features three land-use/land-cover categories: agricultural areas, natural vegetation, and flooding zones (Figure 1b). The agricultural areas include both rainfed and dry season vegetable crops. The flooding zone at the outlet of the lowland is used for rice cultivation.
The geology of Burkina Faso is made up of rocks belonging to the West African craton consisting of the Reguibat Ridge and the Leo Ridge. These two ridges are separated by sedimentary formations that constitute the Taoudéni basin. The Leo Ridge occurs in nine West African countries, namely, Burkina Faso, Côte d’Ivoire, Ghana, Guinea, Liberia, Mali, Niger, Senegal, and Togo [53]. Depending on the era of the formations, it is possible to subdivide the Leo Ridge into two domains: (i) the Archean domain or Kénéma-Man domain characterized by two orogenic cycles: the Leonian dated 3500 to 2900 mya and the Liberian dated 3000 to 2600 mya [54]; (ii) the Proterozoic domain or Baoulé-Mossi domain where geological formations of Paleoproterozoic age (2250 to 2000 mya) are encountered. These formations are also called Birimian formations and are cut by calc-alkaline and alkaline granite plutons. They were affected by the Eburnian orogeny which refers to all the tectonic, metamorphic, and plutonic events that affected the Birimian terrains [54,55]. On a local scale, the geology of the Sanon site is composed of rocks representative of the hard rocks of West Africa. They were emplaced during the Eburnian orogeny. They are made up of antebirrimian rocks with a dominance of granitic–gneissic or even migmatic rocks within which green rocks (amphibolites) are interspersed [48,50]. The geophysical characterization carried out [56] using a 2D cross-section of weathering profiles PSAG and PS1 (Figure 1a) proposed a 2D conceptual geological model composed of a superficial reservoir of alterites and a fractured/cracked aquifer overlaid on the bedrock (Figure 2). The thickness of these alterites varies from 30 to 50 m in the valley [50]. Attempts to quantify the recharge have estimated it at a maximum of 10% of the rainfall [48,50].
The Sanon experimental site is equipped with 16 functional observation wells (Figure 1a), seven of which (S1CNP, S2, S2BIS, S3, SA, S18, and S19) capture only the alterites (shallow reservoirs), whereas five (S1CN, S1, S5, S11, and S11P) capture only the fractured layers (deep reservoirs), and four (S1Bis, S8, S16, SaG) capture both reservoirs. The objective of having well observations that capture only shallow weathering aquifers, fractured aquifers, or both is to understand the hydrodynamic and geochemical processes that take place within each type of reservoir and the dynamics of exchanges between the surface and deep reservoirs. Hydrologically, the site is provided with experimental plots (Figure 1a) that allow the estimation of the components of the water balance depending on the soil surface aspect (barren land and cultivated land) and according to the hydrographic network. Four rain gauges, P1 to P4 (Figure 1a), three of which are located close to the experimental plots, allow the evaluation of rainfall amounts within the site. Groundwater abstraction within the Sanon experimental site is not intensive, about 0.42 mm/year [57]. This quantity of groundwater is provided by hand pumps for the domestic consumption of the village inhabitants. This water abstraction also includes some water used for irrigation of six hectares on the site.

2.2. Hydrodynamic Approach

This hydrodynamic approach aims to identify areas favorable for recharge and determine the groundwater flow direction. During the 2020 rainy season (1 July to 31 October), groundwater level was monitored daily at 16 locations through observation wells (Figure 1a). To determine potential areas for surface water infiltration, soil infiltration tests were carried out on the experimental site. The double-ring infiltrometer method [58] was used to determine the saturated soil hydraulic conductivity. Nine infiltration measurements were carried out close to the observation wells, using a 9 m × 9 m grid centered around each observation well. The infiltration test was carried out over 4 h with a constant water head of 3 cm maintained on the soil surface until the constant infiltration rate was reached. Darcy’s law was applied to porous media and restricted to the vertical dimension to determine the saturated soil hydraulic conductivity (Ksat) [59,60]. For a better understanding of the spatial evolution of the groundwater levels in the catchment area, two transects, north–south direction (T1) and west–east direction (T2) (Figure 1a), were considered for the study of the distribution of groundwater levels during low- and high-water periods, as well as that of the aptitude of the soils to infiltration. Plotting groundwater-level distribution and the saturated hydraulic conductivity along the two transects helped in determining the direction of groundwater flow and to locate potential groundwater recharge areas.

2.3. Hydrochemical Approach

The recharge mechanism of Sanon aquifers was also deduced through spatiotemporal evolution of electrical conductivity and a series of major ions of the groundwater. Two water sampling campaigns were carried out from 15 observation wells and their major cation (i.e., Ca2+, Mg2+, K+, and Na+) and anion (HCO3, Cl, SO42−, and NO3) concentrations were determined. The first campaign was carried out during the low-water period (July) and the second was carried out during the high-headwater period (September). Physical parameters such as temperature (T), pH, and electrical conductivity (EC) were measured in situ using a portable multiparameter HI 9828 (T: ±0.15 °C; pH: ±0.02; EC: ±1 μS/cm). The concentrations of Ca2+, Mg2+, Cl, and HCO3 ions were obtained by volumetric analysis. A DR3900 molecular absorption spectrophotometer (HACH Lange) was used to analyze NO3 and SO42− concentrations, whereas a flame emission spectrophotometer was used to determine Na+ and K+ concentrations.
In addition, groundwater EC of nine observation wells was also monitored on a daily basis from July to October 2020, using WTW Cond 3110 SET1 (±5% EC and ±0.1 °C). Descriptive statistics of the groundwater physicochemical parameters, including the Spearman correlation study at the 5% significance level between electrical conductivity and major ions, were determined using the XLSTAT software. To assess the direction of water mineralization and its relationship with the recharge mechanism, the spatial distribution of electrical conductivity values, as well as major ions with significant and strong correlation to conductivity, were plotted along the two defined transects T1 and T2 (Figure 1a).
A hierarchical clustering analysis (HCA) was used to group the groundwater samples into clusters on the basis of similarities and dissimilarities in their physicochemical parameters. A principal component analysis (PCA) was used to search for relationships between chemical variables and to group together those that show similar behavior in order to get an idea of the evolution of the chemism of the waters of the Sanon aquifers. The hierarchical clustering analysis (HCA) method is done using Ward’s criterion and the Euclidean distance. The HCA and PCA were carried out using the XLSTAT software package (Addinsoft, Paris, France). The determination of the water facies and the calculation of ionic ratios were carried out through the DIAGRAMMES software, developed by the Hydrogeology Laboratory of Avignon, France [61].
In addition, the plotting of the daily evolution of groundwater levels, as well as the EC of nine observation wells uniformly distributed over the catchment, was used to assess spatial groundwater recharge mechanism in the Sanon catchment.

3. Results

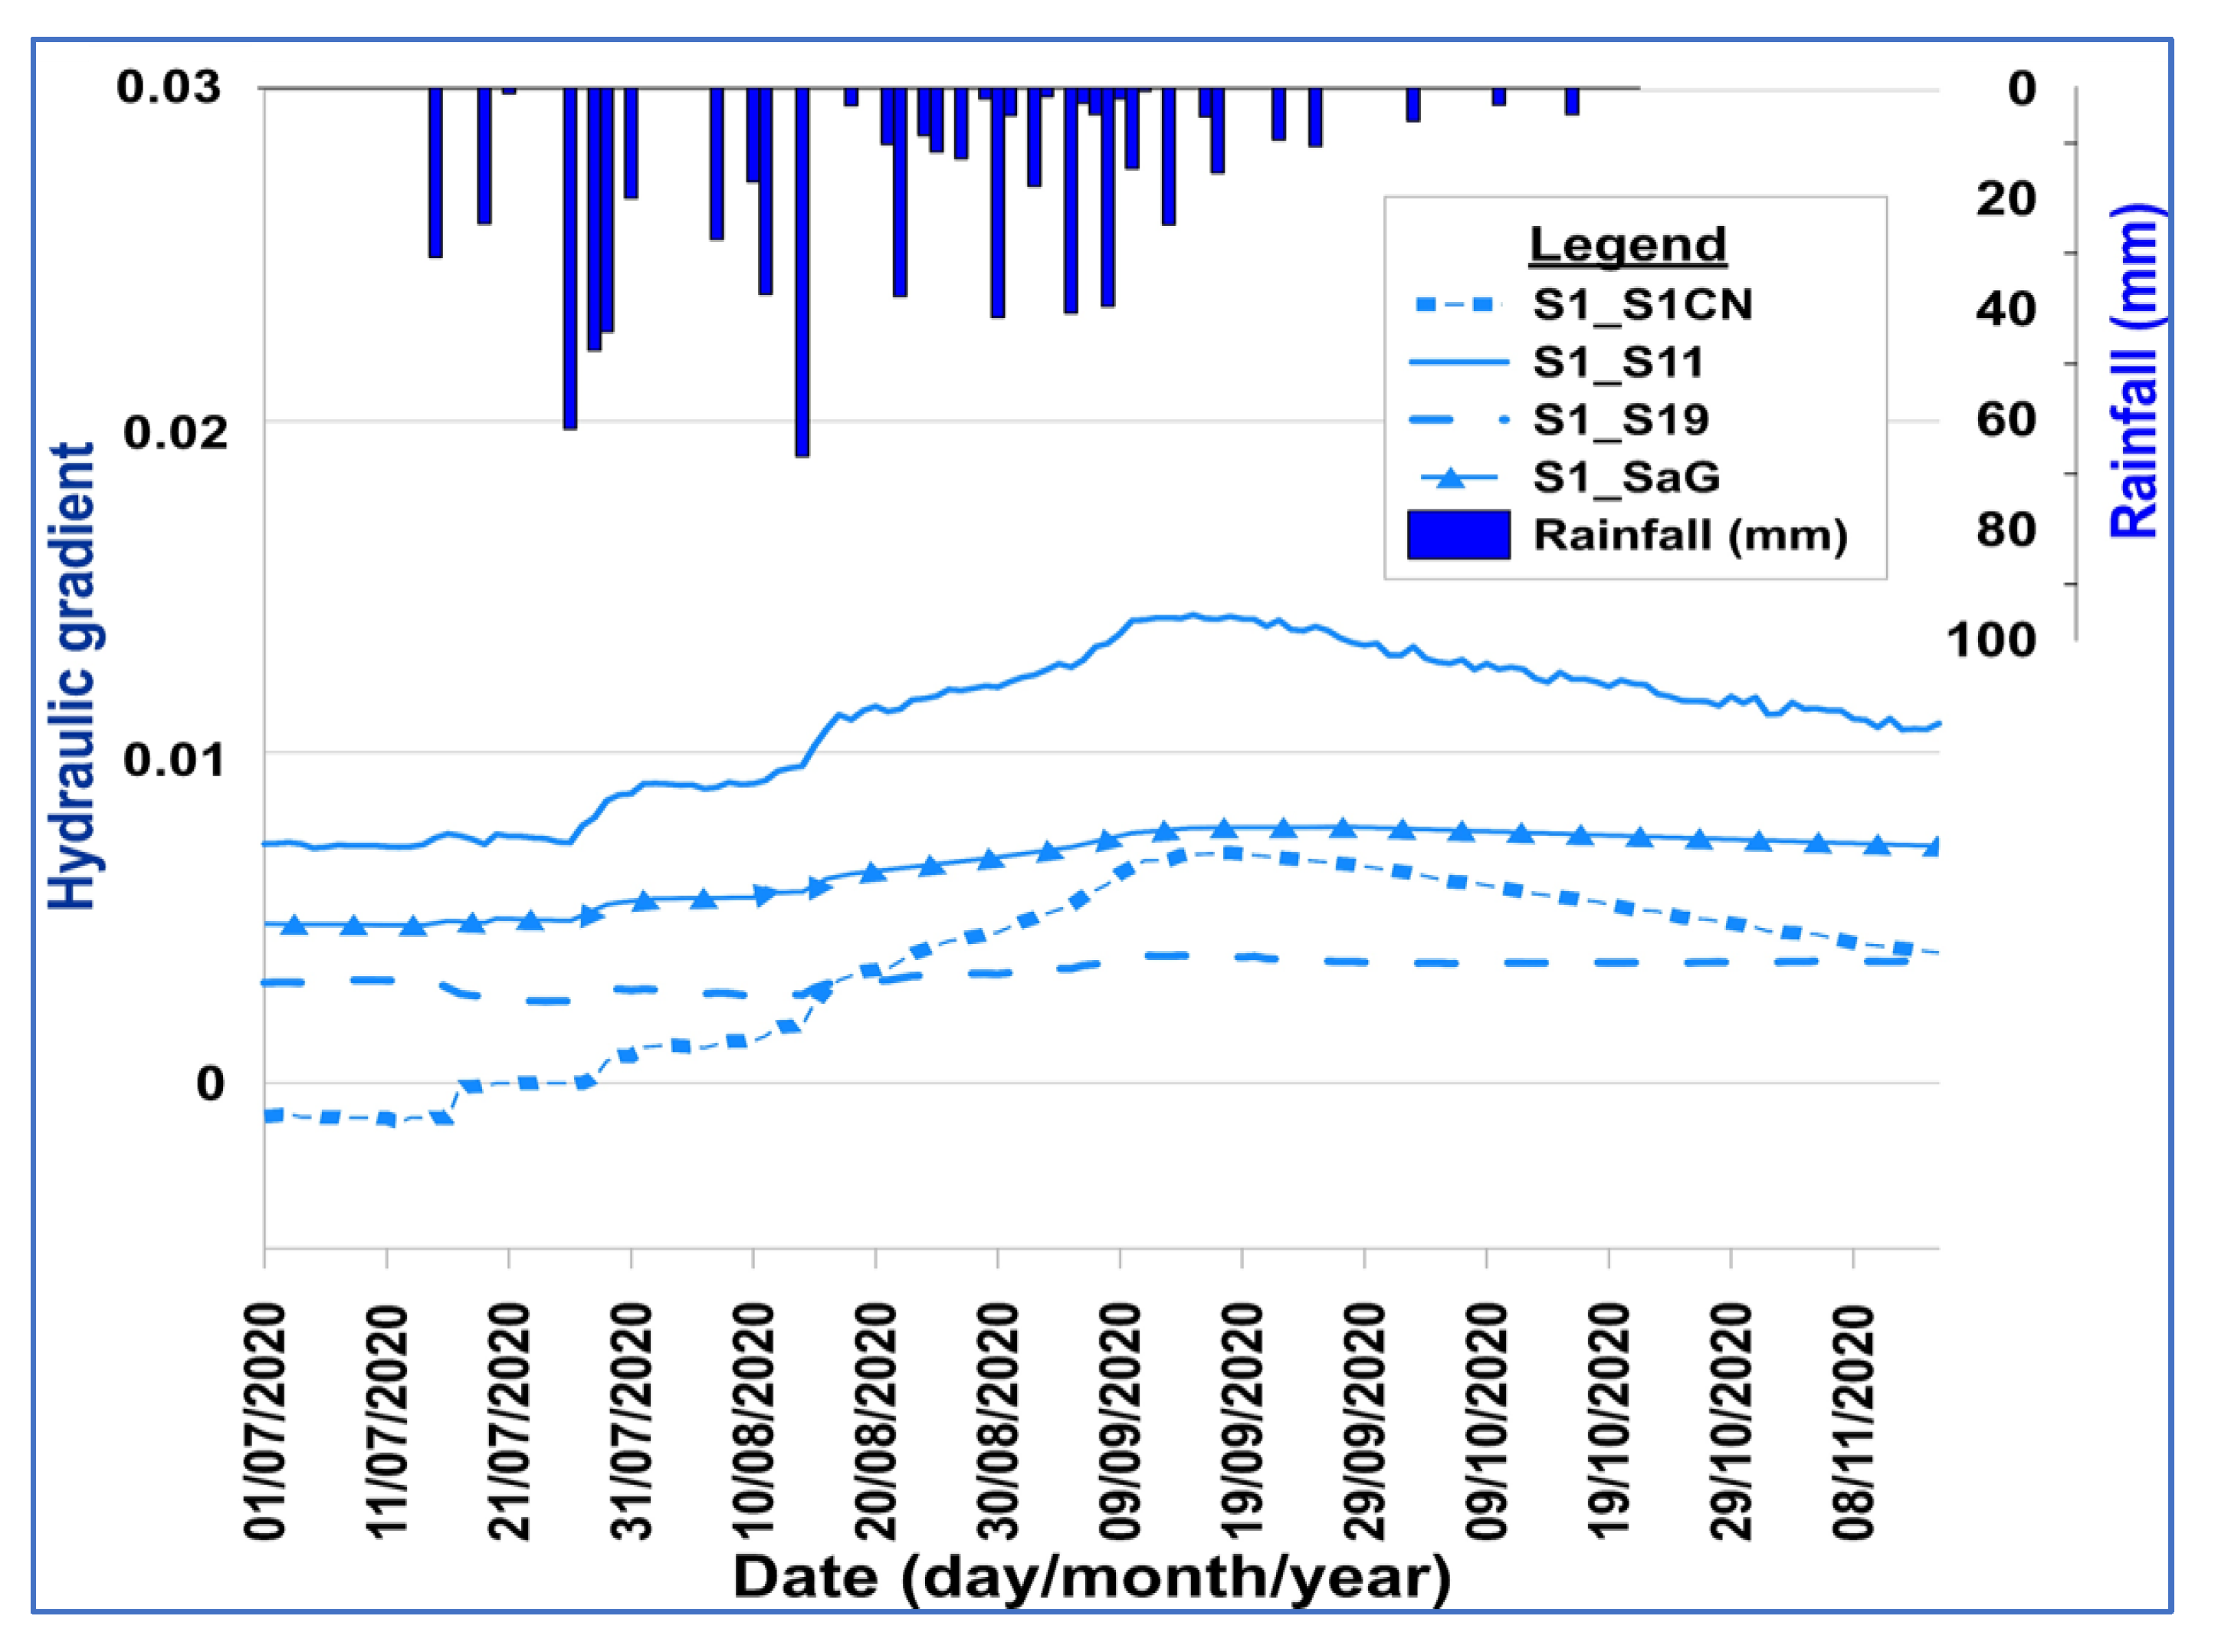
3.1. Hydrodynamic Approach

The spatial distribution of the piezometric levels along the two transects (Figure 3) showed the existence of a piezometric dome in the central valley, where the groundwater moves toward the ends of the catchment area. The largest variations were located in the central valley where the piezometric amplitudes are around 7 m (Figure 3a). The same observation can be made on the west–east transect (Figure 3b).
During low-water periods, the majority of the hydraulic gradients are positive and oriented from the central valley (position of S1) toward the extremities of the catchment area except the hydraulic gradient of the piezometers S1CN and S1 (−0.07%) (Table 1). The low-water flow is directed from the central valley toward the southern, western, and eastern ends of the catchment area, except for the S1CN–S1 section where the water flow is directed toward the central valley. During high water, the hydraulic gradient values are relatively larger, all positive, and directed toward the ends of the site. The highest gradients are established (in low and high water) between the valley aquifers (where S1 is located) and those of the southern ridge (where S11 is located). The high values of these gradients could reflect rapid transfer flows between S1 and S11.
The observation of the temporal evolution of the hydraulic gradients revealed an evolution under the influence of precipitation (Figure 4). Initially constant, the hydraulic gradients undergo a progressive increase at the beginning of precipitation until mid-September and then decrease with the precipitation decreasing. The hydraulic gradient between S1CN and S1, which was previously negative at the beginning of July, changes sign with the onset of the first rains due to the consequent rise in the piezometric level of S1. The temporal evolution of the hydraulic gradient of the aquifers of piezometers S1 and S19 shows an atypical behavior. Falls in the S1–S19 hydraulic gradient are observed during drought periods. The shallow groundwater plays a buffering role during drought periods. The stagnant water continues to increase the piezometric level of S19, but the S1 aquifer, which is very sensitive to drought, shows a drop in piezometric level, resulting in the temporal drops in hydraulic gradients.
The distribution of hydraulic conductivities at saturation suggests relatively high infiltration capacities of the soils in the eastern, northern, and central parts of the experimental site with hydraulic conductivities at saturation values higher than 89 cm/day (Figure 5). These soils correspond to gravelly soils in the northern part and to sandy soils in the central and eastern valley of the experimental site. The soils of the southern ridge are characterized by low infiltration capacities with Ksat values below 41 cm/day. These low hydraulic conductivity values are also found in the western parts of the catchment and S16. All of these soils with low infiltration capacities are clay-textured soils. The outlet of the catchment is used as a lowland rice field due to the low permeability of its soils.

3.2. Hydrochemical Approach

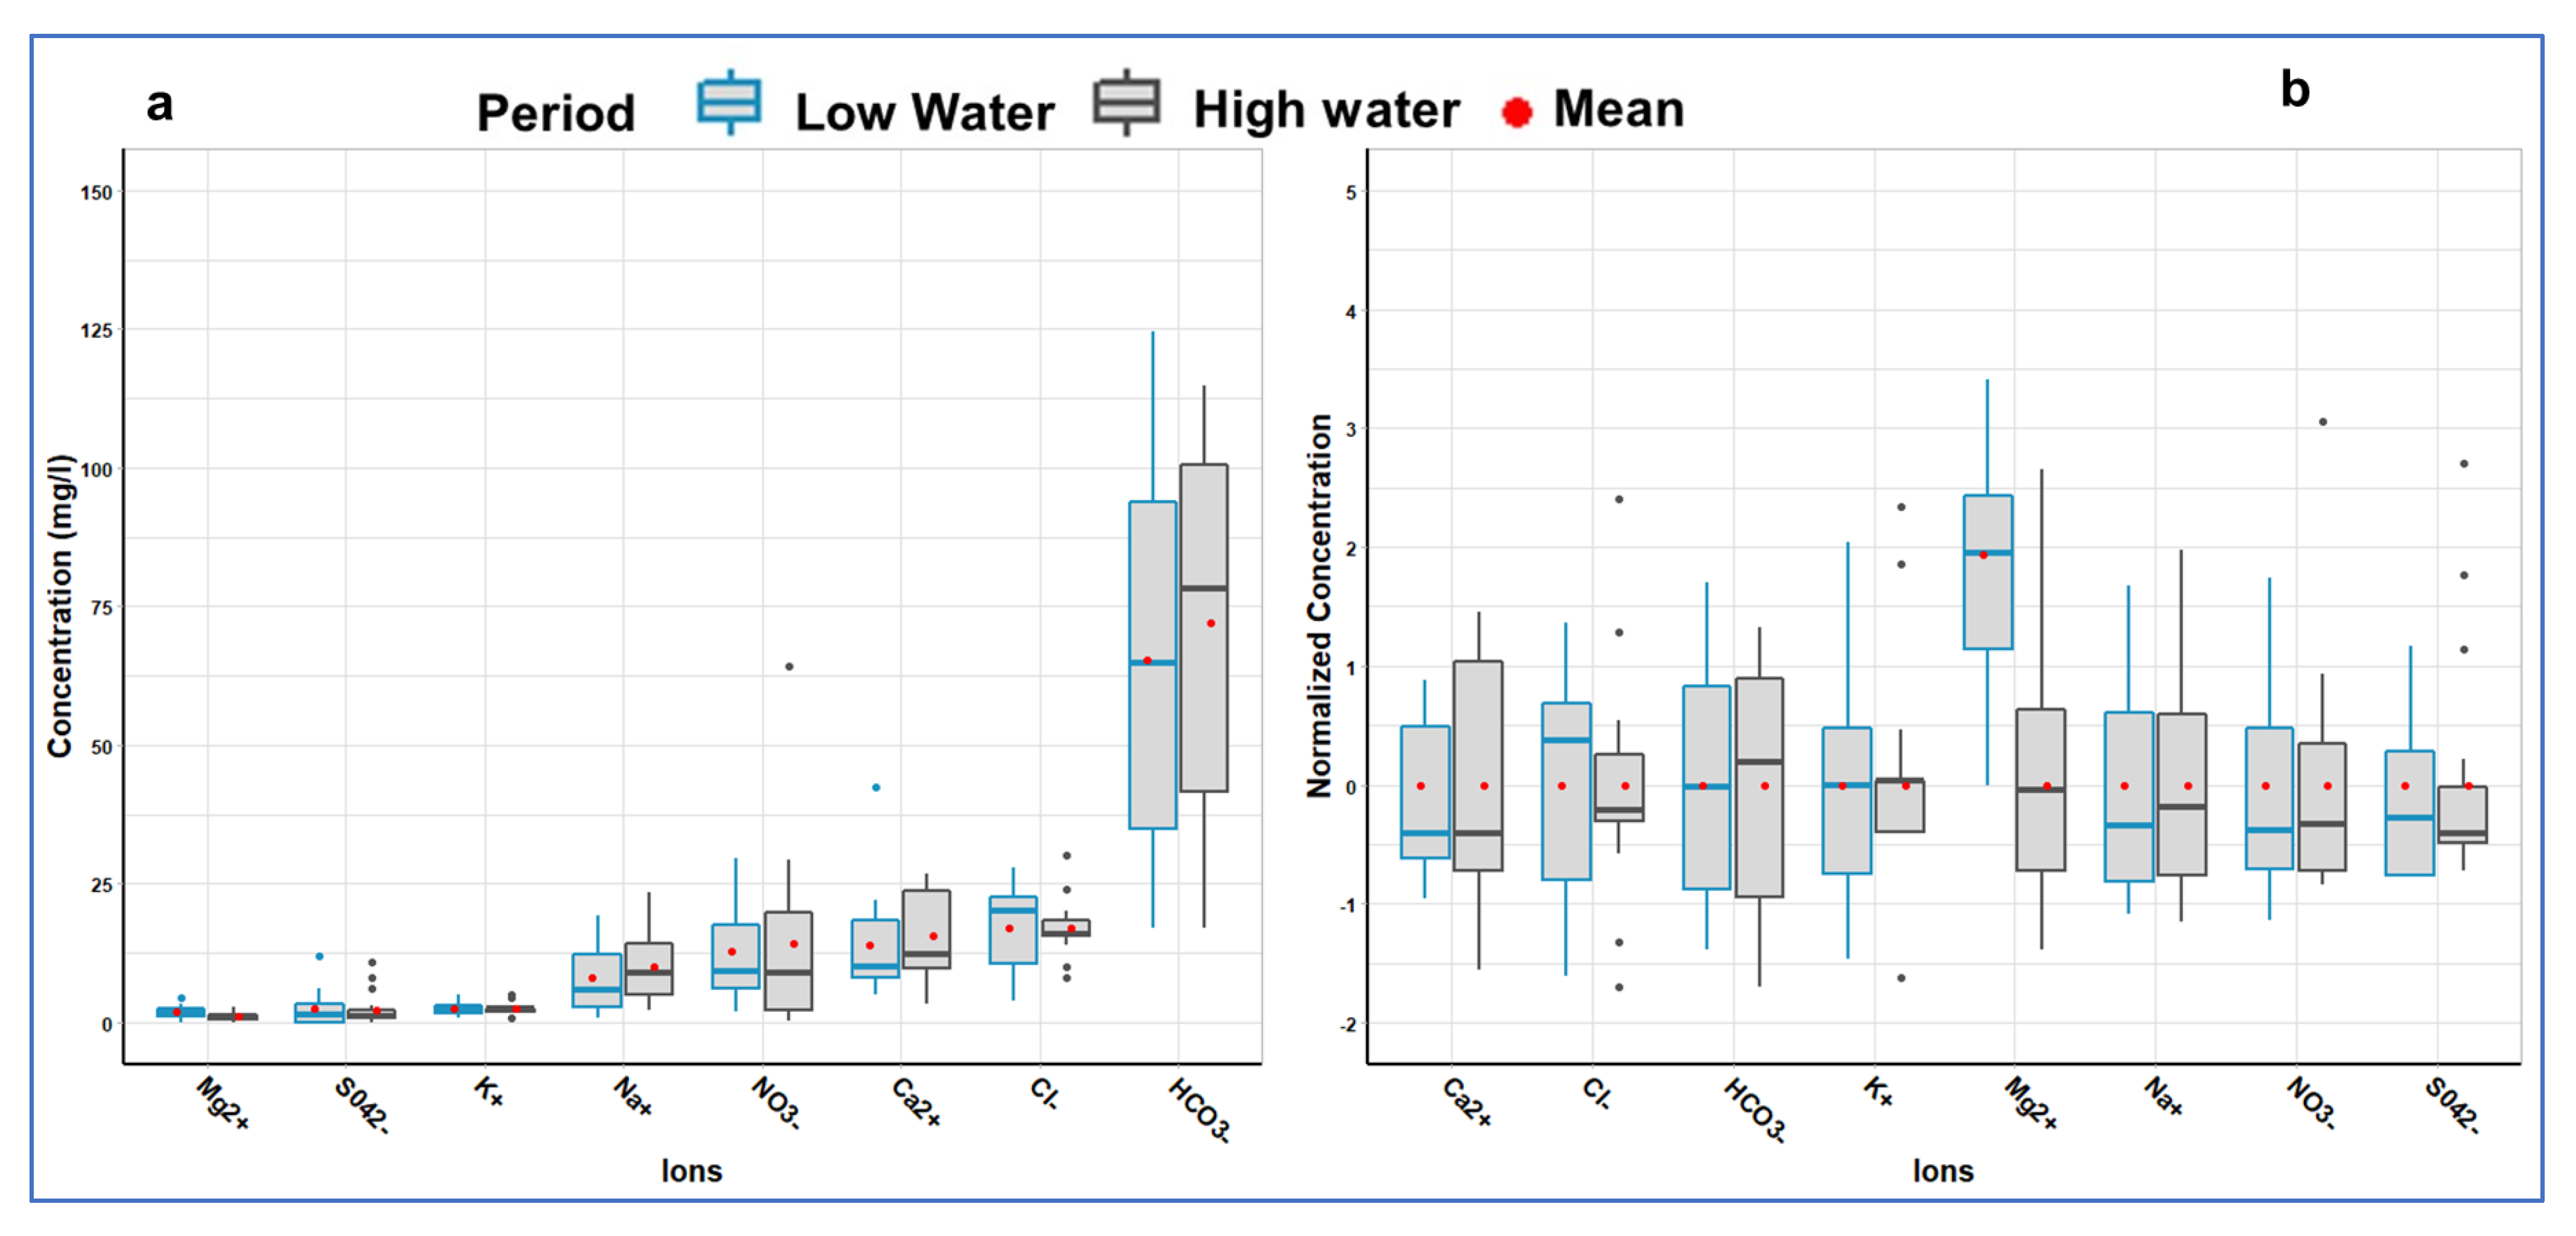
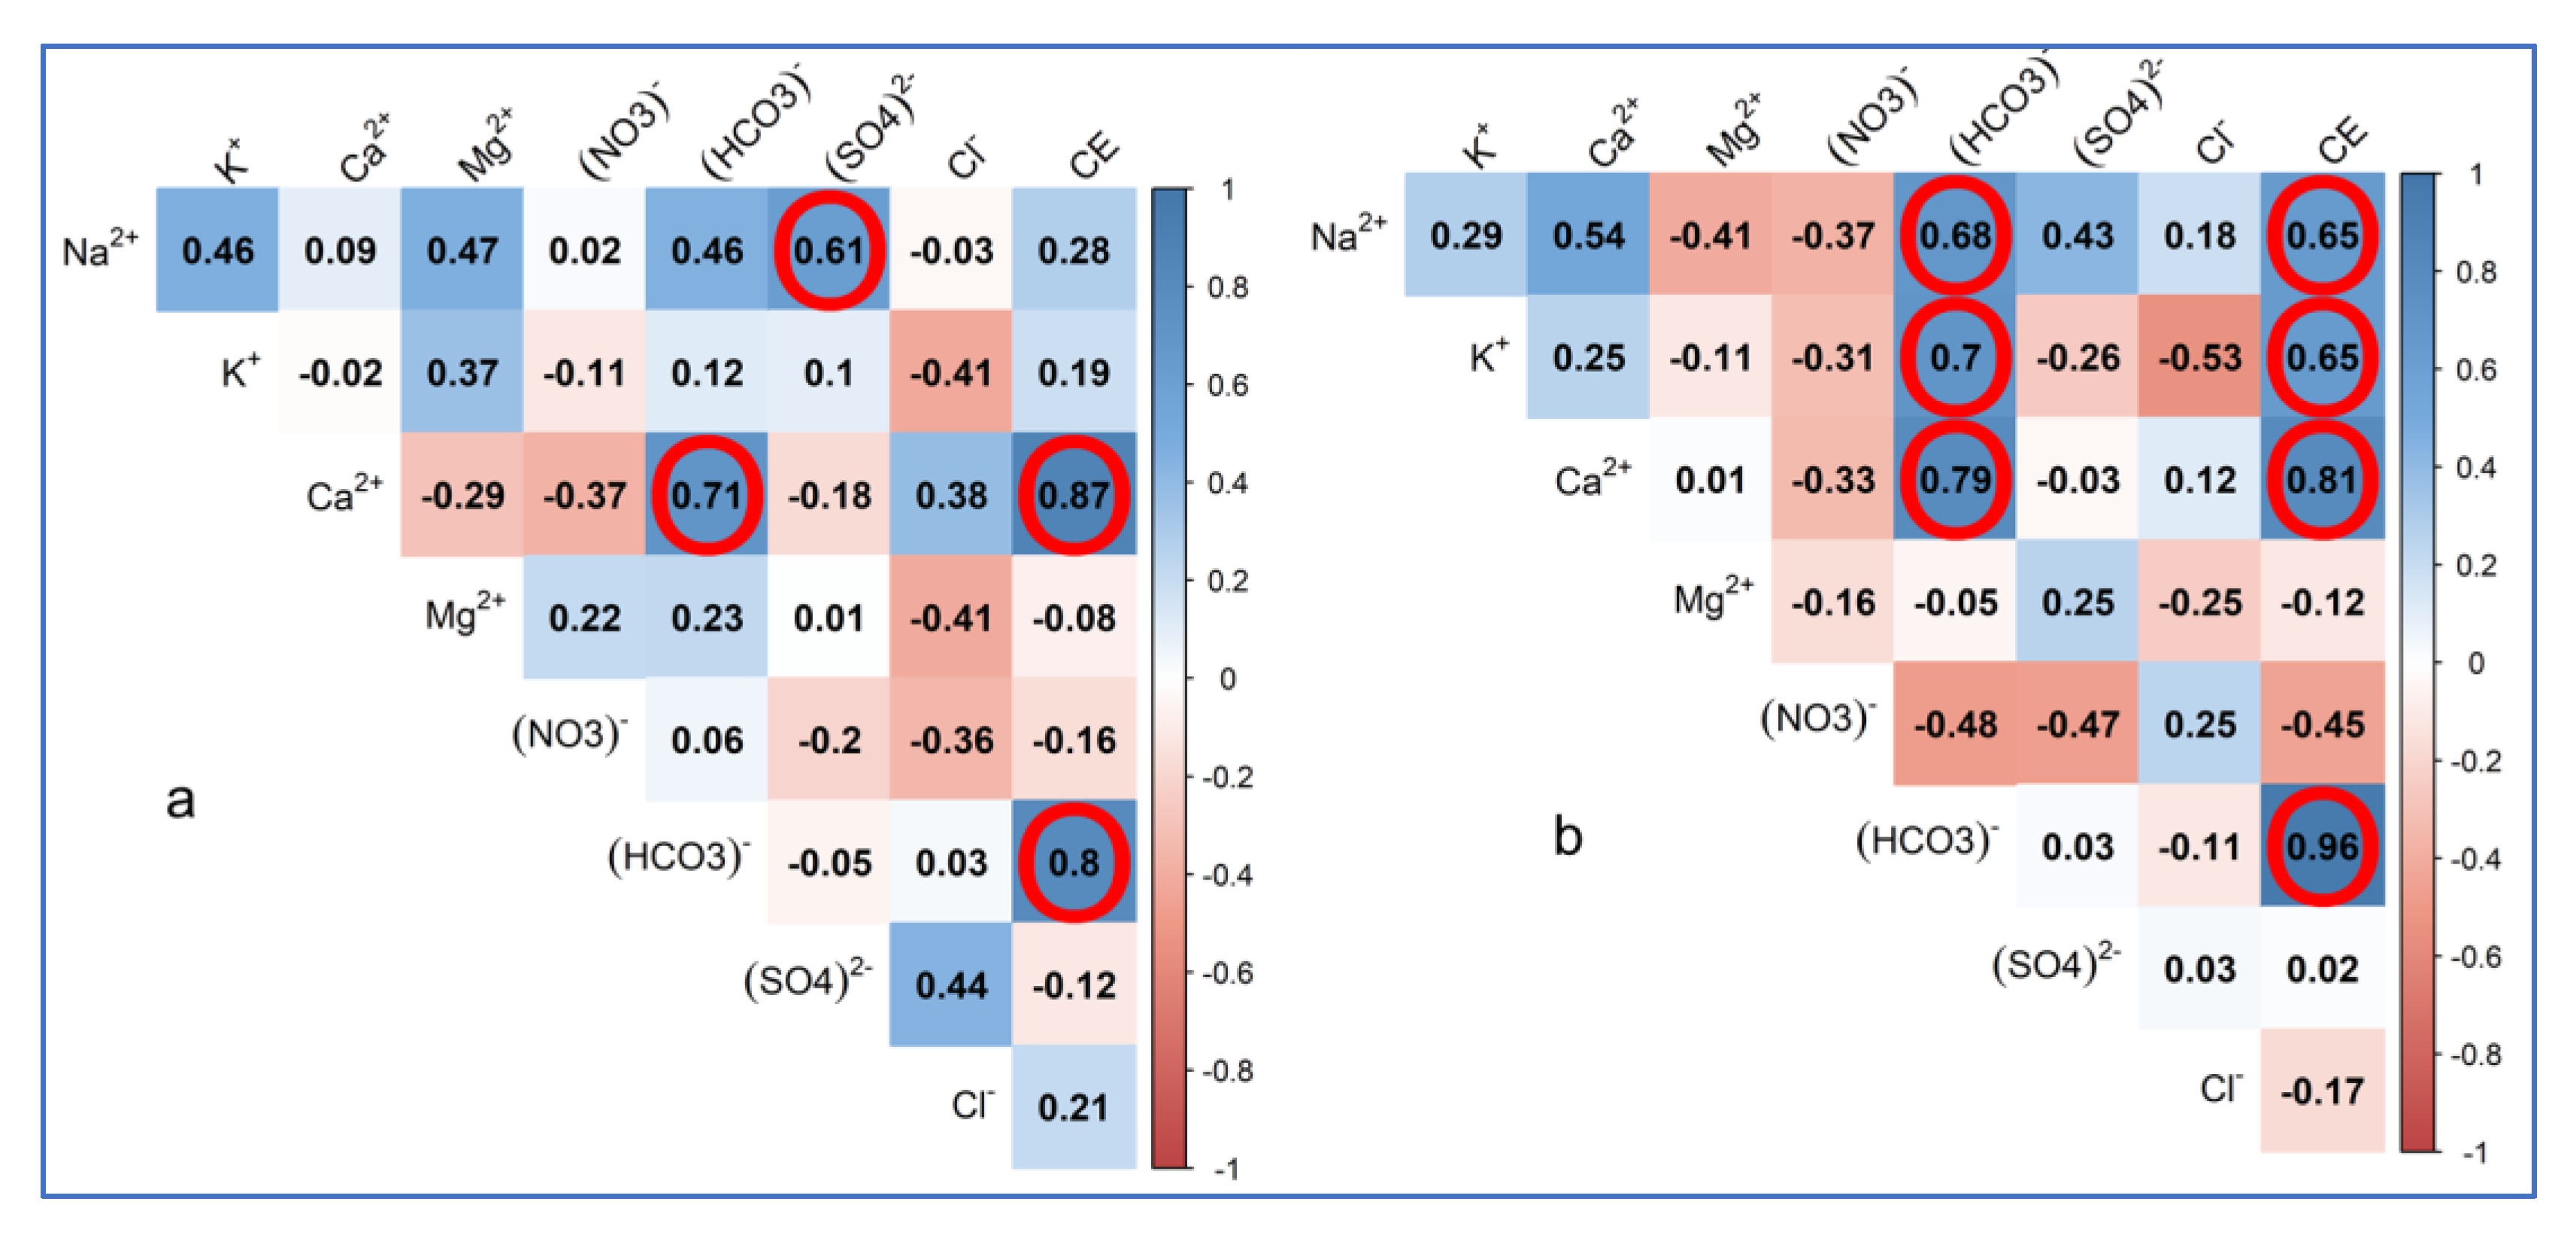
3.2.1. Electrical Conductivity and Major Ions

The electrical conductivity (EC) of the water in the piezometers varies from 61 to 300 µS/cm in low water periods and from 53.0 to 219.7 µS/cm in high water periods (Table S1 of Supplementary Materials). These electrical conductivity values are not high and reflect the low mineralization of the Sanon aquifer. The lowest values of electrical conductivity are found in the central valley (S1Bis, S2, S1, and SA) at both high and low water. The mean electrical conductivity value of alterites is lower than that of the fractured aquifers (Table 2).
Major anion concentrations were in the following order: HCO3 > Cl > NO3 > SO4, and major cation concentrations were in the following order: Ca2+ > Na+ > K+ > Mg2+ (Figure 6a). This type of anion classification has already been observed in the groundwater of Ouagadougou [62]. Figure 6b shows a highly variable distribution of the majority of the ions with medians below the mean, characteristic of a distribution elongated toward high values. These concern Cl during the high-water period in the central valley (SA) and at the catchment outlet (S19), sulfates exclusively at the catchment outlet (S18, S19, and S8), and K+ at northern ridge (S1CN and S1CNBis). A low atypical concentration of ions is also found at different places: Cl at the northern ridge (S1CN) and upstream of the outlet (S5). A high atypical value for nitrate is found in SA.

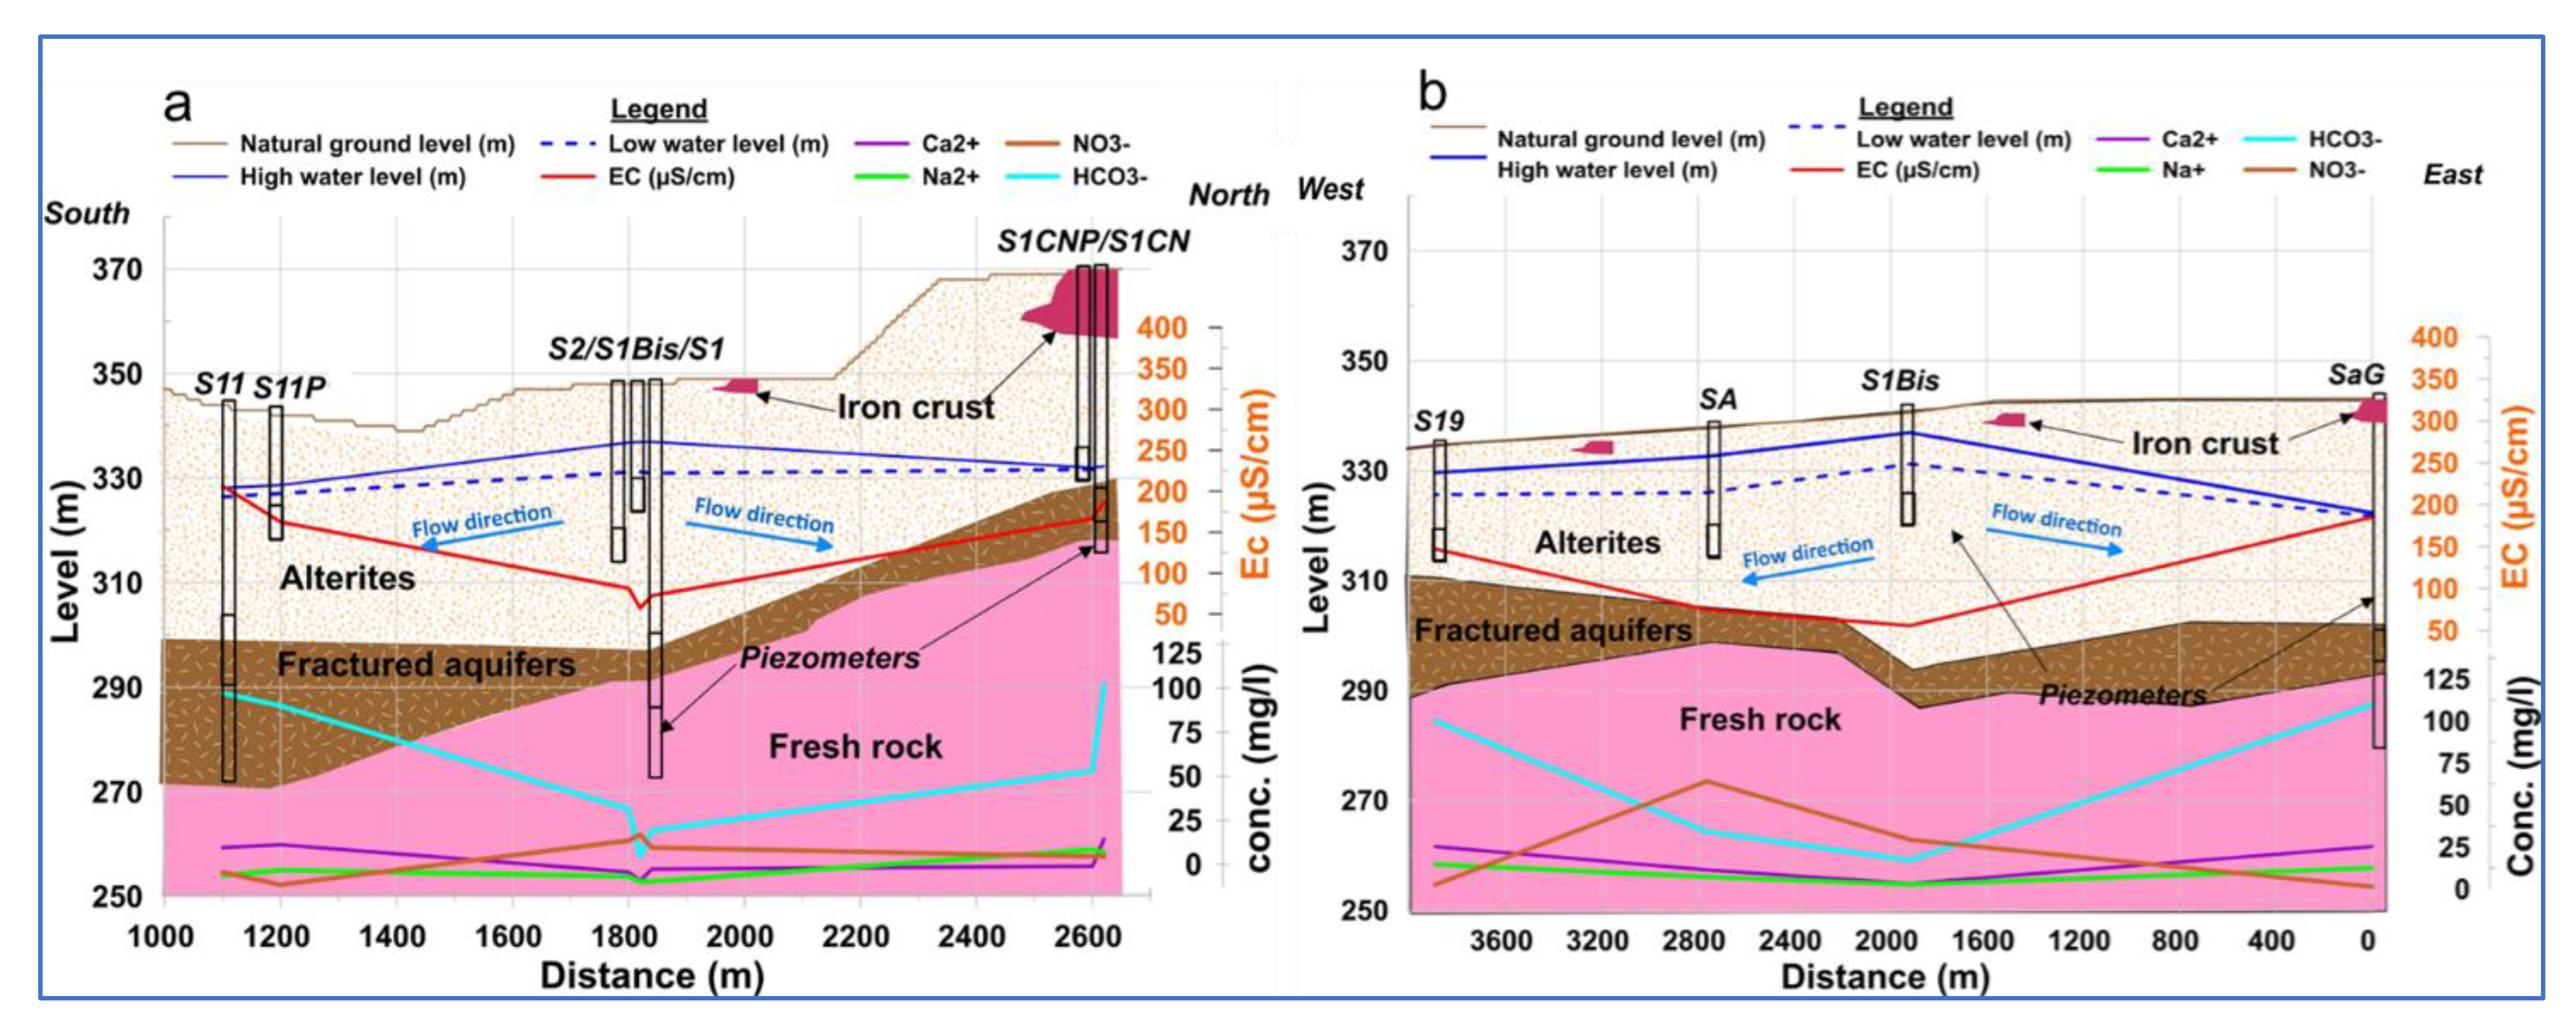
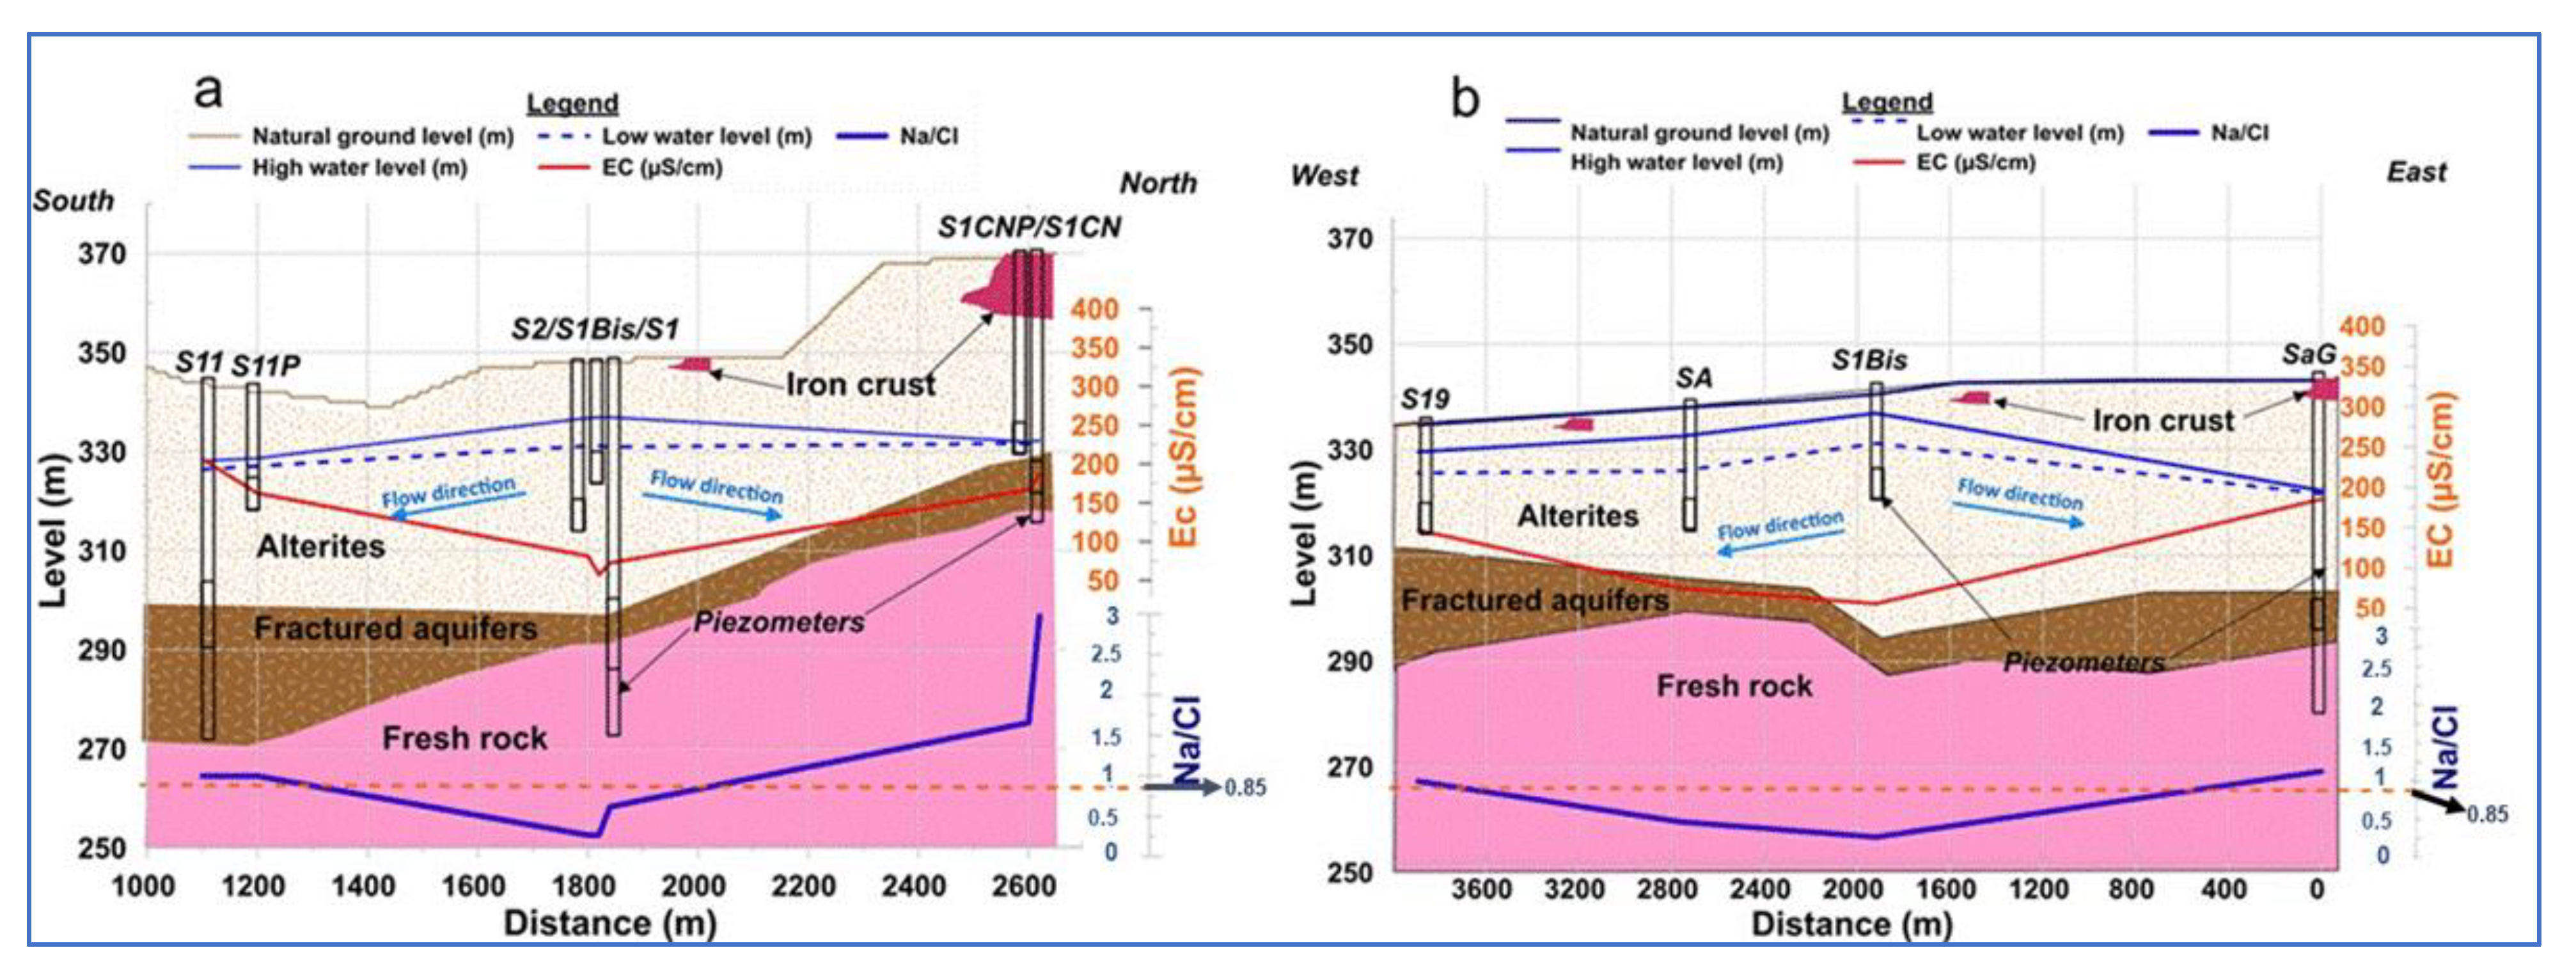
3.2.2. Spatial Tracing of Electrical Conductivity and Major Ions

The spatial distribution of the electrical conductivity along the north–south and west–east transects reveals that the low values are found in the central valley where the piezometric dome appears (Figure 7). Electrical conductivity decreases from the piezometric dome location toward the ends of the transects, where there is a progressive increase in electrical conductivity values. The mineralization of the groundwater would, therefore, follow the direction of the groundwater flow. The central valley corresponding to the piezometric dome zone with lower electrical conductivity values is the zone of preferential recharge (direct recharge) of the aquifers. Nitrates, elements of external origin to the aquifer system, have high concentrations in this zone. The presence of nitrate elements brought by the infiltration water corroborates the hypothesis of direct recharge of the aquifers in this zone.
According to [63,64], the Na/Cl molar ratio can be an indicator of the origin of Cl in groundwater. A Na/Cl ratio equal to unity indicates that Na+ and Cl ions originate from the dissolution of evaporites. A molar ratio of 0.85 indicates that the ions have a marine origin, and a Na/Cl ratio of less than 0.85 indicates the case of certain pollutions. The distribution of the Na/Cl ratio according to the transects shows values well below 0.85 in the central valley for the piezometers S2, S1Bis, and S1 on the north–south transect (Figure 8a), as well as from SA toward the outlet on the west–east transect (Figure 8b). This ratio is well above unity on the north and west ridge, reflecting ion-exchange phenomena [64].

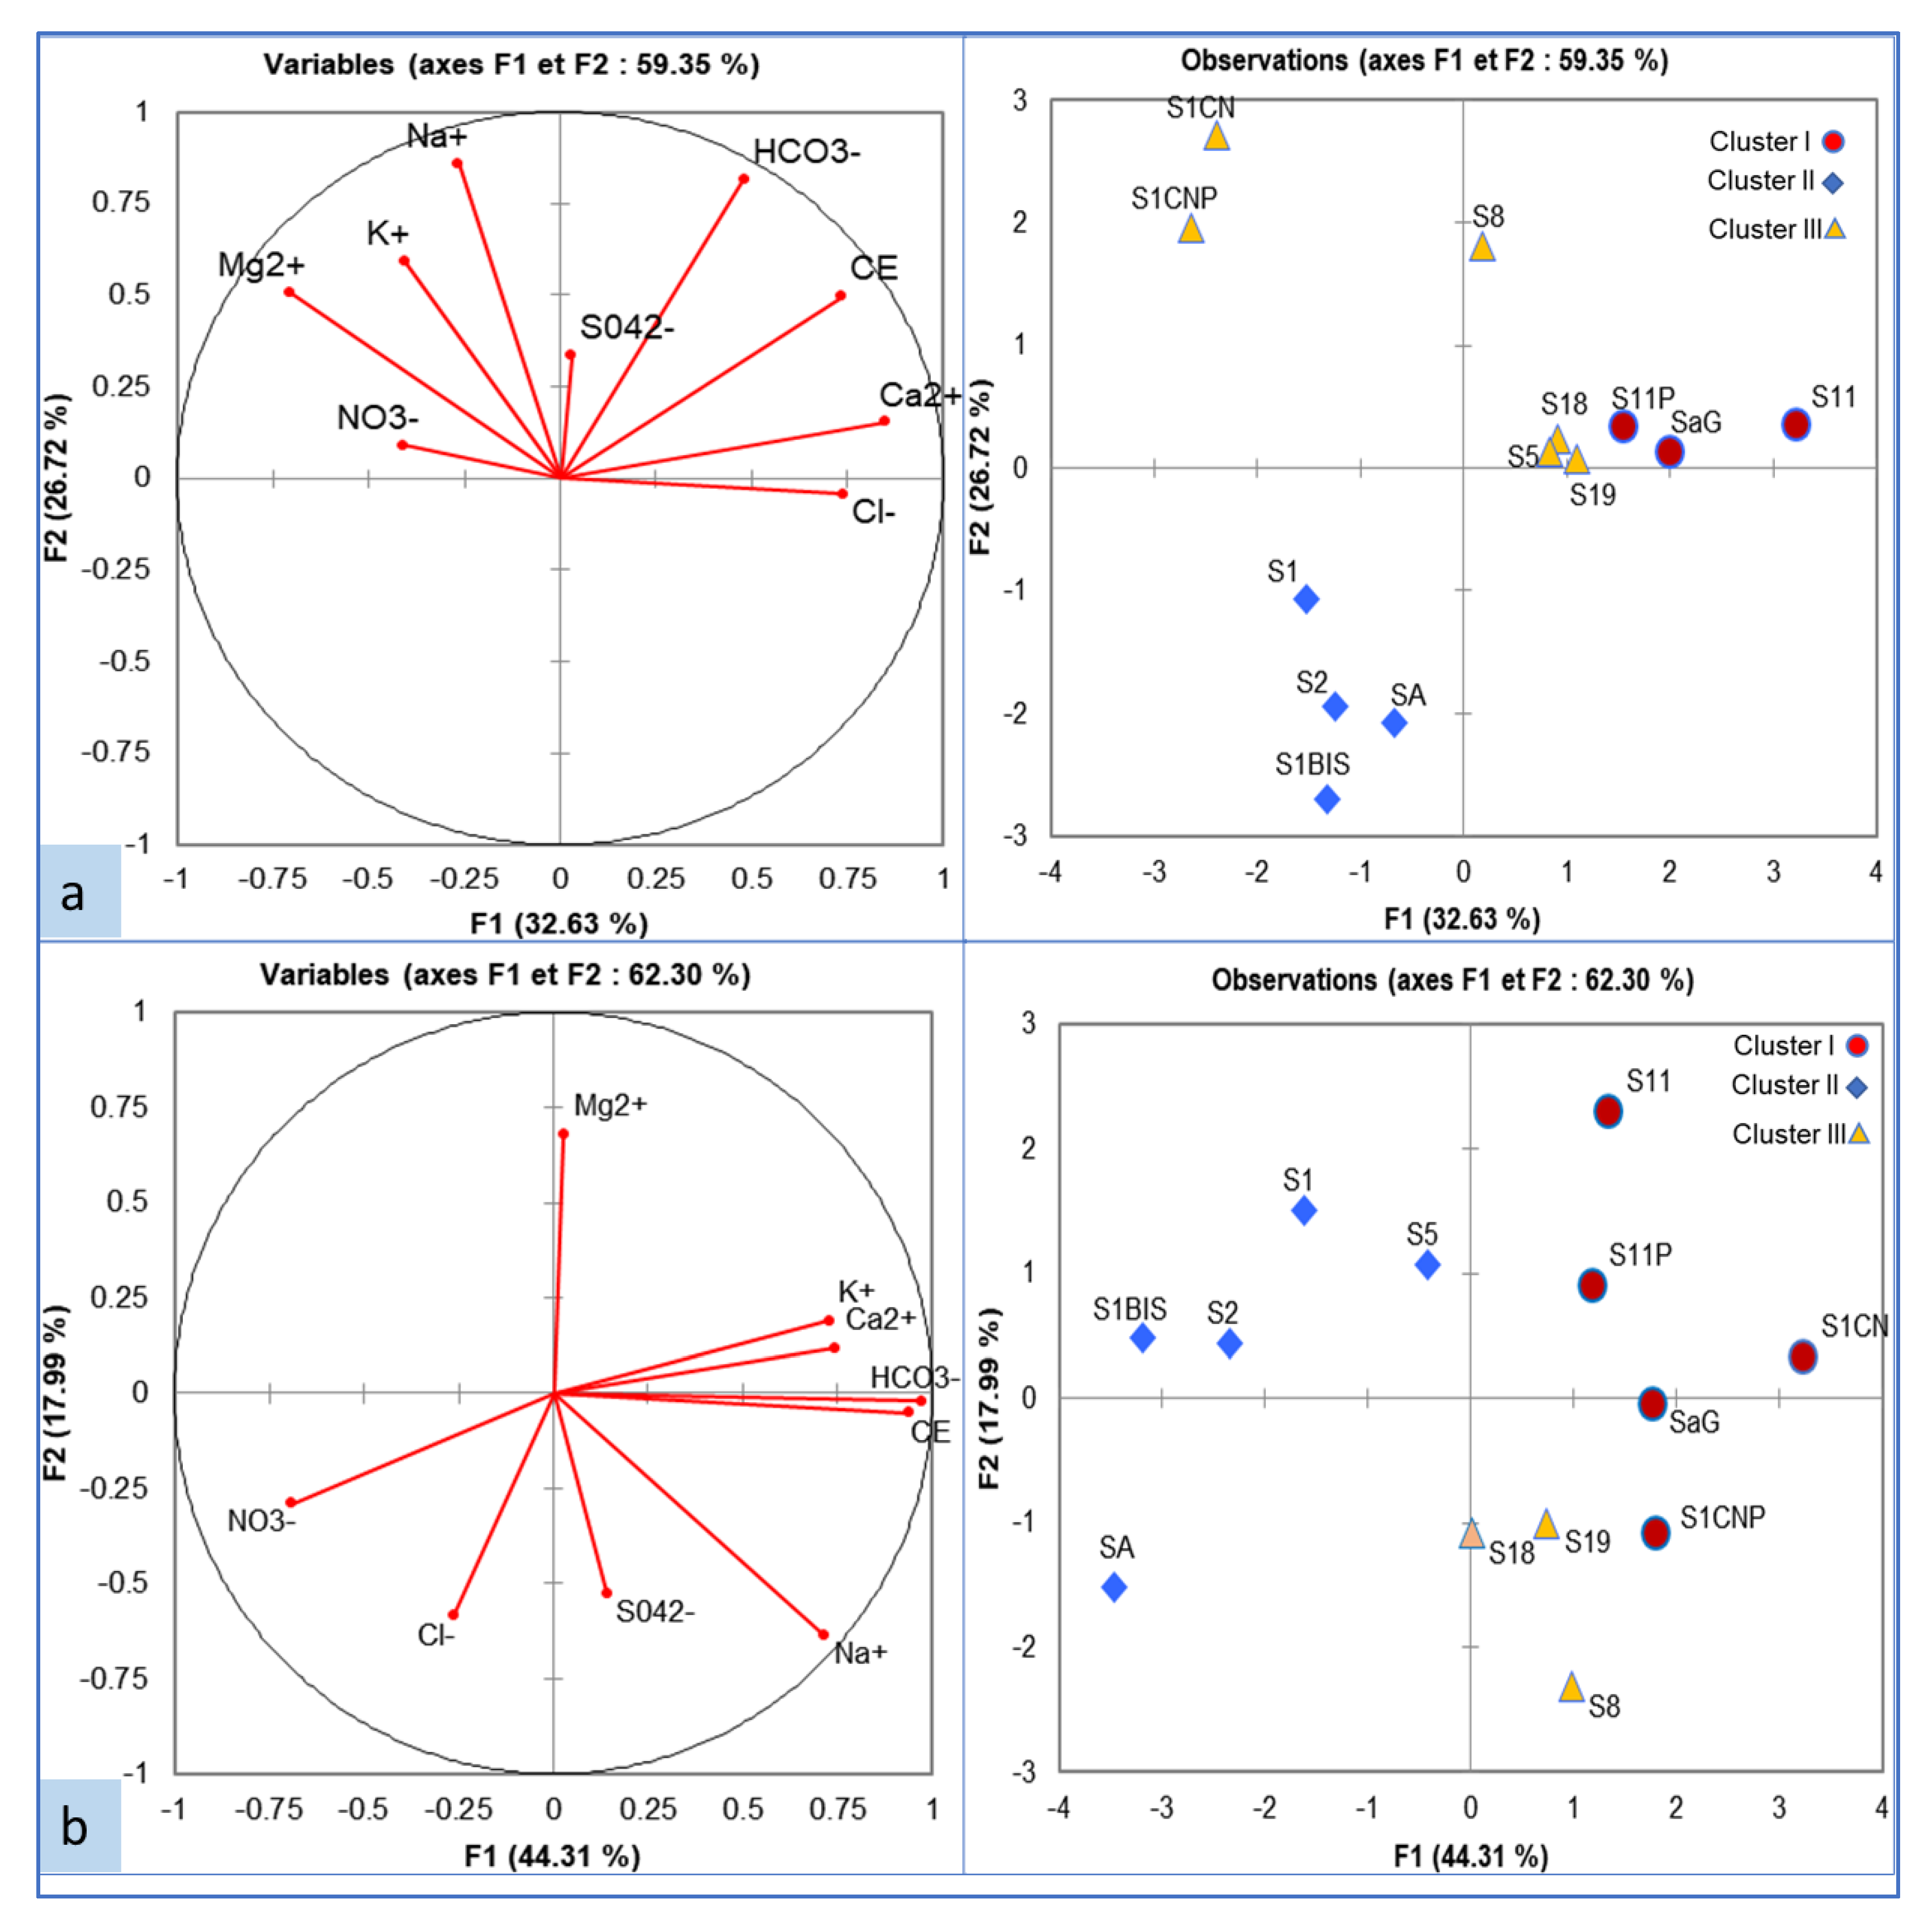
3.2.3. Groundwater Classification

During low-water periods, EC is strongly correlated with HCO3 (r = 0.80) and Ca2+ (r = 0.87) (Figure 8a). The mineralization is more related to HCO3 ions and Ca2+ ions than to the other elements, and this mineralization follows the direction of the water flow (Figure 9). A good correlation exits between Ca2+ and HCO3 (r = 0.71), between Na+ and SO4 (r = 0.61). The correlations between these elements would reflect their common origin, i.e., coming from former times, reflecting a long residence time.
In the high-water period, EC is strongly correlated with HCO3 (r = 0.96), Ca2+ (r = 0.81), and to a lesser extent Na+ (r = 0.65) and K+ (r = 0.65) (Figure 8b). These elements significantly contribute to the increase in water salinity. Moreover, Ca2+, Na+, and K+ are positively correlated and would indicate a common origin.
In periods of low and high water, Cl and NO3 ions do not show any consistent positive correlation with other ions specific to the underground system such as Na+ and Ca2+, which could reflect an external origin. Furthermore, Na+ and SO42− ions, which are correlated (r = 0.61) in low water, do not present a consequent correlation coefficient in high water (r = 0.43) and translate an enrichment of the underground medium in Na+ in high water in the deep aquifers.
The dendrogram of variables, from the hierarchical clustering analysis (HCA) method, allowed separation into three homogeneous groups (Figure 10). Group 1, characterized by high EC, HCO3, and Ca2+, is formed by piezometers S11, S11P, and SaG, located in the eastern and southern ridge (Table S2 in Supplementary Materials). Group 2, characterized by low EC values and relatively high NO3 concentrations, consists of piezometers S1, S1Bis, S2, and SA, located in the central valley. Group 3 contains relatively high Na+ and Mg+ with EC values intermediate between those of Group 1 and Group 2. It contains the piezometers S1CN and S1CNP of the northern ridge and S5, S8, S18, and S19 of the watershed outlet. During high-water periods, the S5 piezometer joins Group 2, while the S1CN and S1CNP piezometers join Group 1, following the increase in EC for the first two and the decrease in electrical conductivity for the latter.
During low-water periods, the PCA presenting the correlation between the chemical parameters of the aquifer water allowed retaining the two main axes since they presented more than 59.35% of the total variance (Figure 11a). The F1 axis which presents 32.63% of this variance is strongly correlated on the positive side with EC (0.73), Ca2+ (0.85), and Cl (0.74) and negatively correlated with Mg2+ (−0.705), K+ (−0.41), and NO3 (−0.41) (Table S3 in Supplementary Materials). This set of variables associated with F1 suggests that salinization is the main process controlling hydrochemical variability, and that the significant contribution of these ions to groundwater mineralization would come from the water–rock interaction process. The positive part of F1 corresponds to cluster I, while the negative part refers to cluster II, influenced by anthropogenic elements. The F2 axis (26.72% of the variance) is positively correlated to Na+ (0.86), HCO3 (0.81), and K+ (0.59). These variables are due to water–rock interactions (i.e., chemical weathering of silicate minerals), which results in relatively long residence times and potentially high EC. This axis corresponds to cluster III.
In high-water periods (Figure 11b), the F1 axis, which presents 44.31%, is positively correlated with EC (0.94), HCO3 (0.97), Ca2+ (0.75), K+ (0.73), and Na+ (0.72) and negatively correlated with nitrates (−0.69), potentially arising from the use of fertilizers for agricultural production. This grouping is an indicator of the dissolution of silicate minerals. The F2 axis is positively correlated with Mg2+ (0.68) and negatively correlated with S042− (−0.52) and Cl (−0.59). On F2, the clustering reflects the anthropic influence on the groundwater mineralization. The three clusters are still differentiated. However, the electrical conductivity played a major role in the reclassification of these clusters concerning the high-water period by bringing S1CN and S1CNP into cluster 1 and S5 into cluster 2.

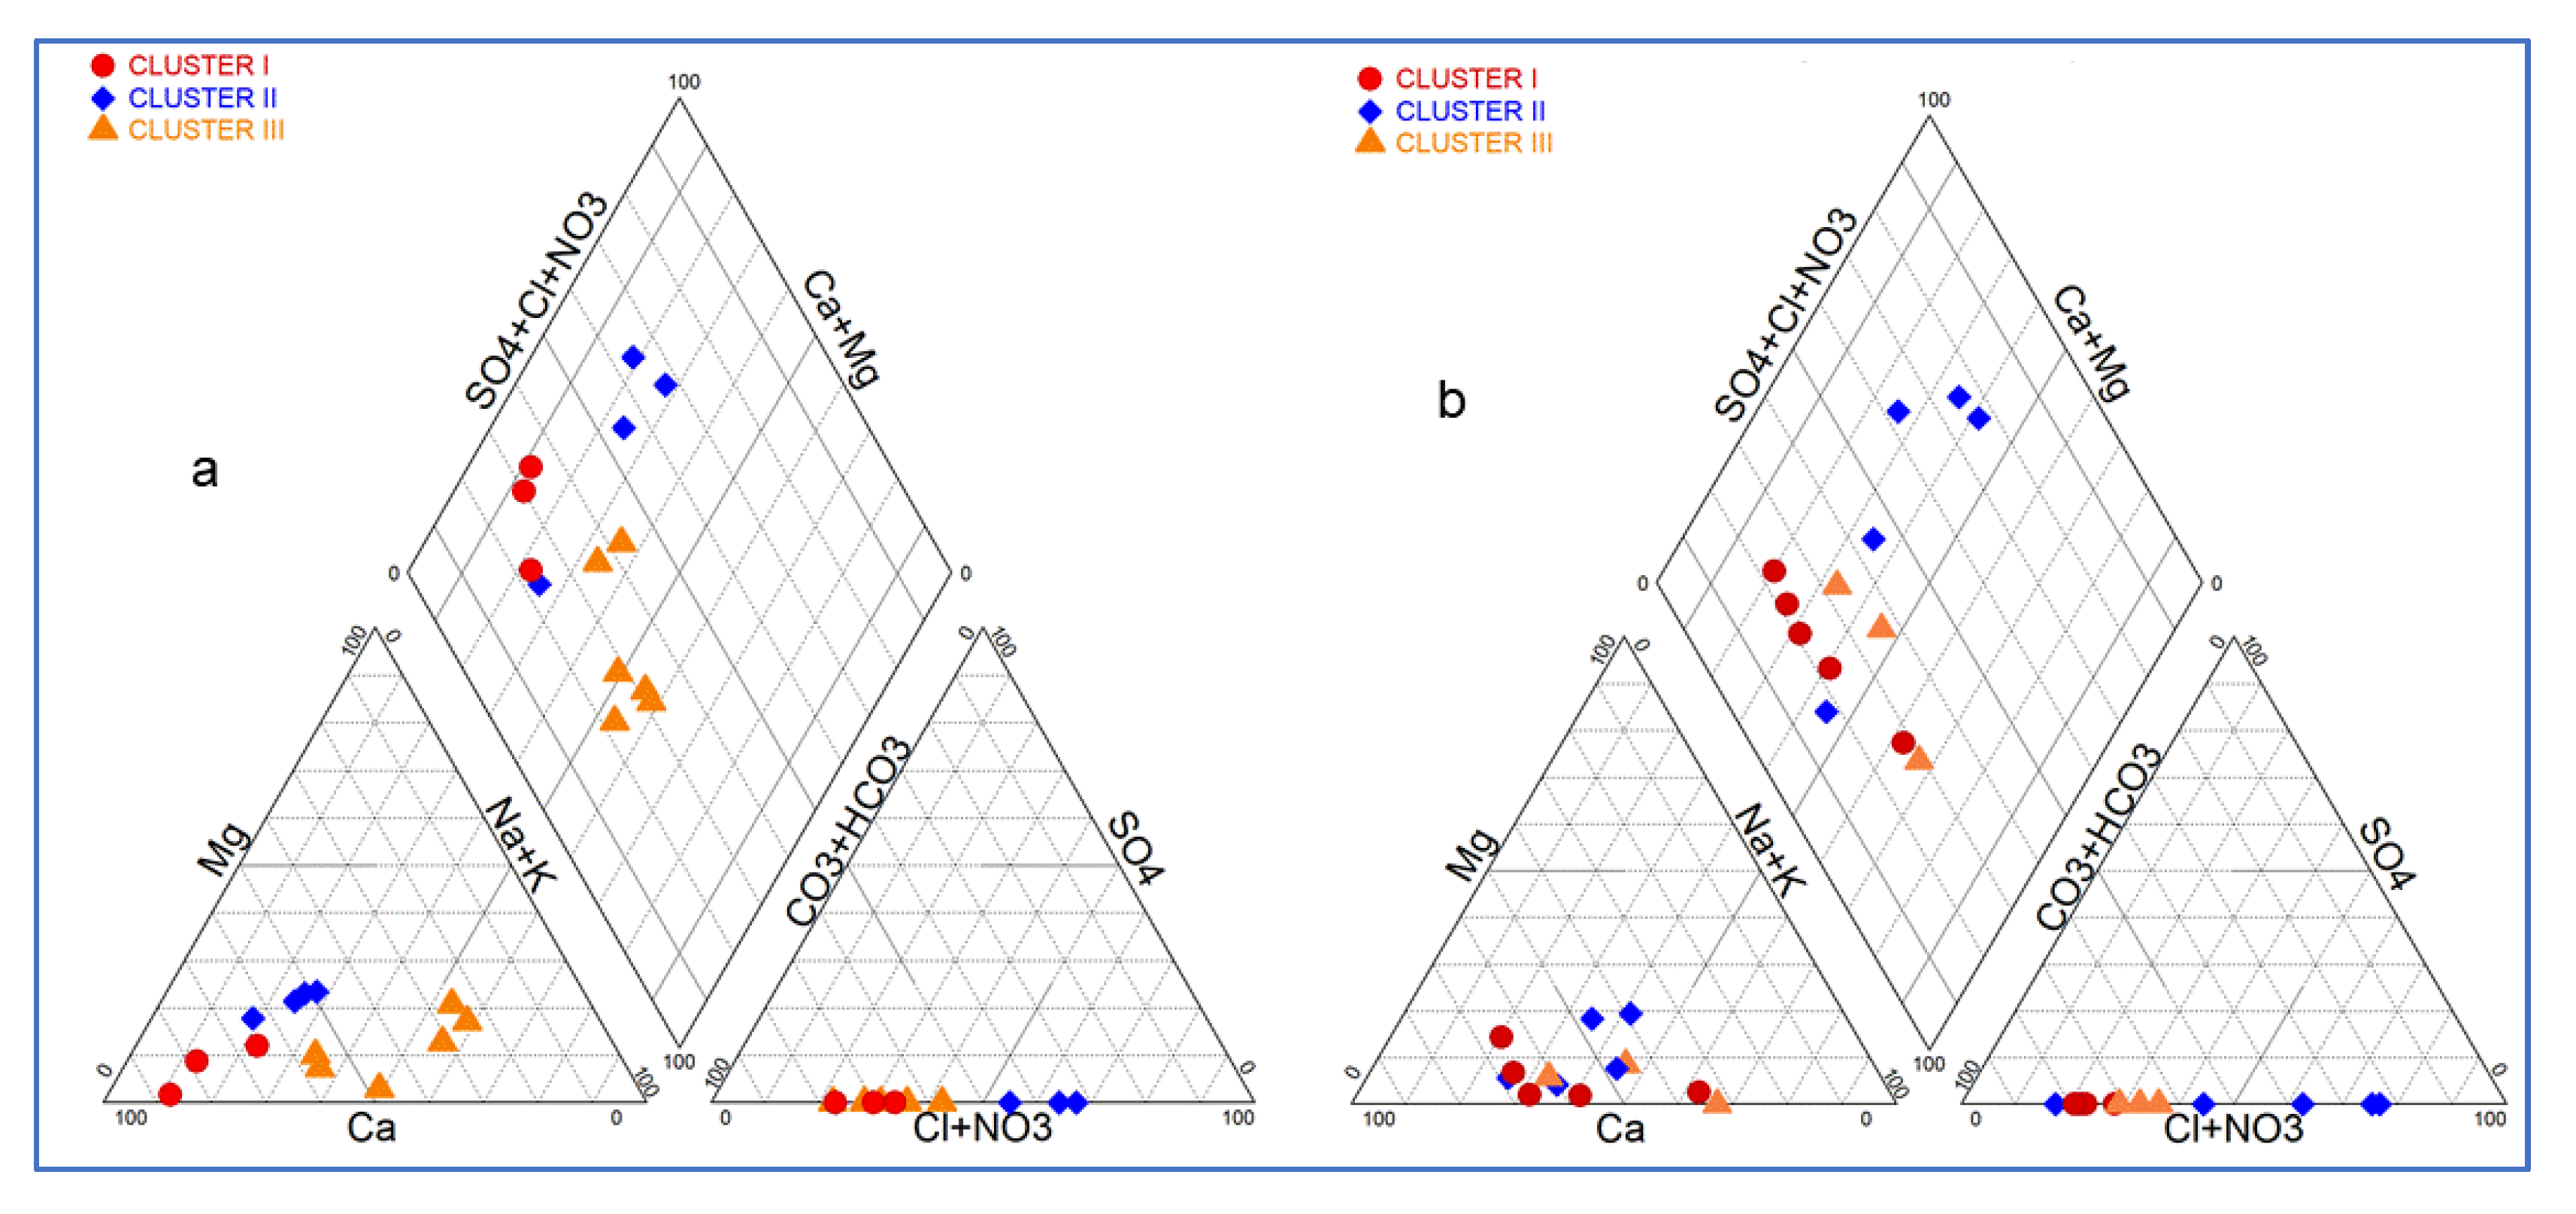
3.2.4. Groundwater Hydrochemical Facies

During low-water periods, the piper diagram (Figure 12a) shows that the waters of cluster I are exclusively magnesian calcic bicarbonate. Cluster II presents chloride and sulfate–calcium–magnesium facies and calcium–magnesium bicarbonate facies. The first facies is the most abundant, reflecting waters under the anthropic influence. Cluster III is shared almost equally between calcium–magnesium bicarbonate and sodium–potassium bicarbonate. From low water to high water (Figure 12b), the existence of the three facies is noted, although there is a migration of facies from the sodium–potassium bicarbonate to the calcium–magnesium bicarbonate due to the increase in calcium ions in the water of many observation wells (S1CN, S18) and a tendency for water from piezometer S1 to join the calcium–magnesium chloride facies, under anthropogenic influence.

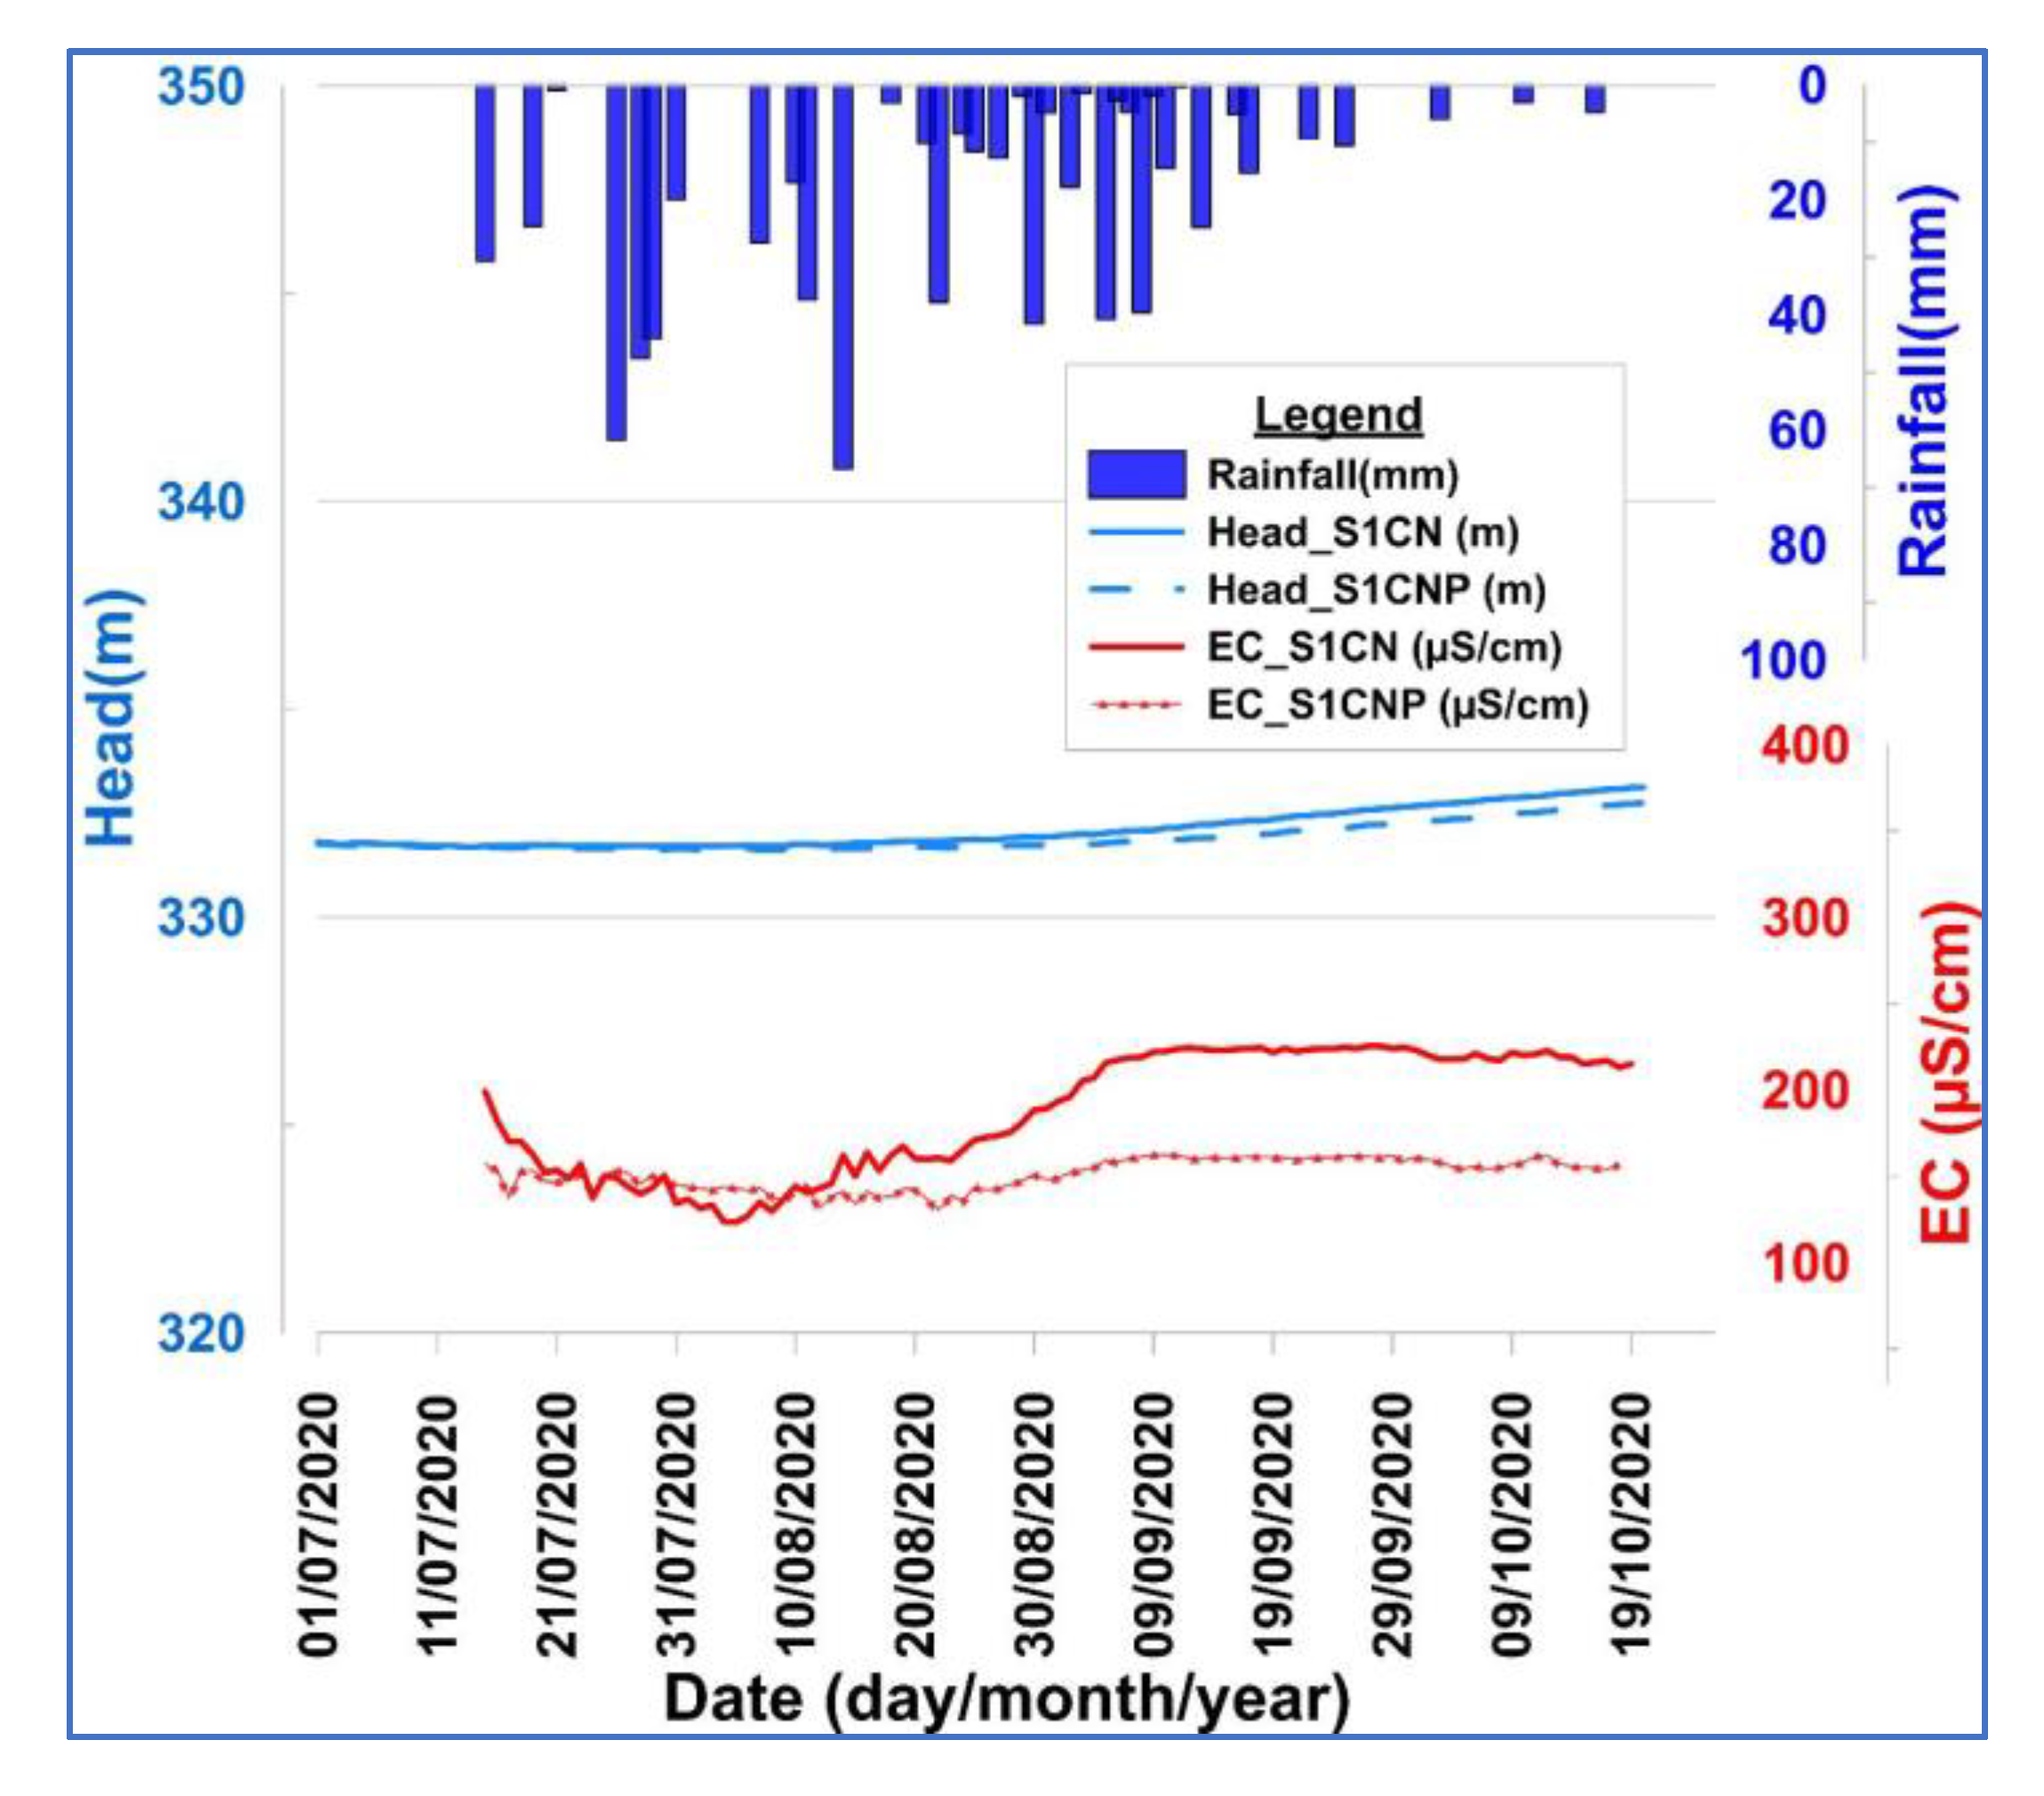
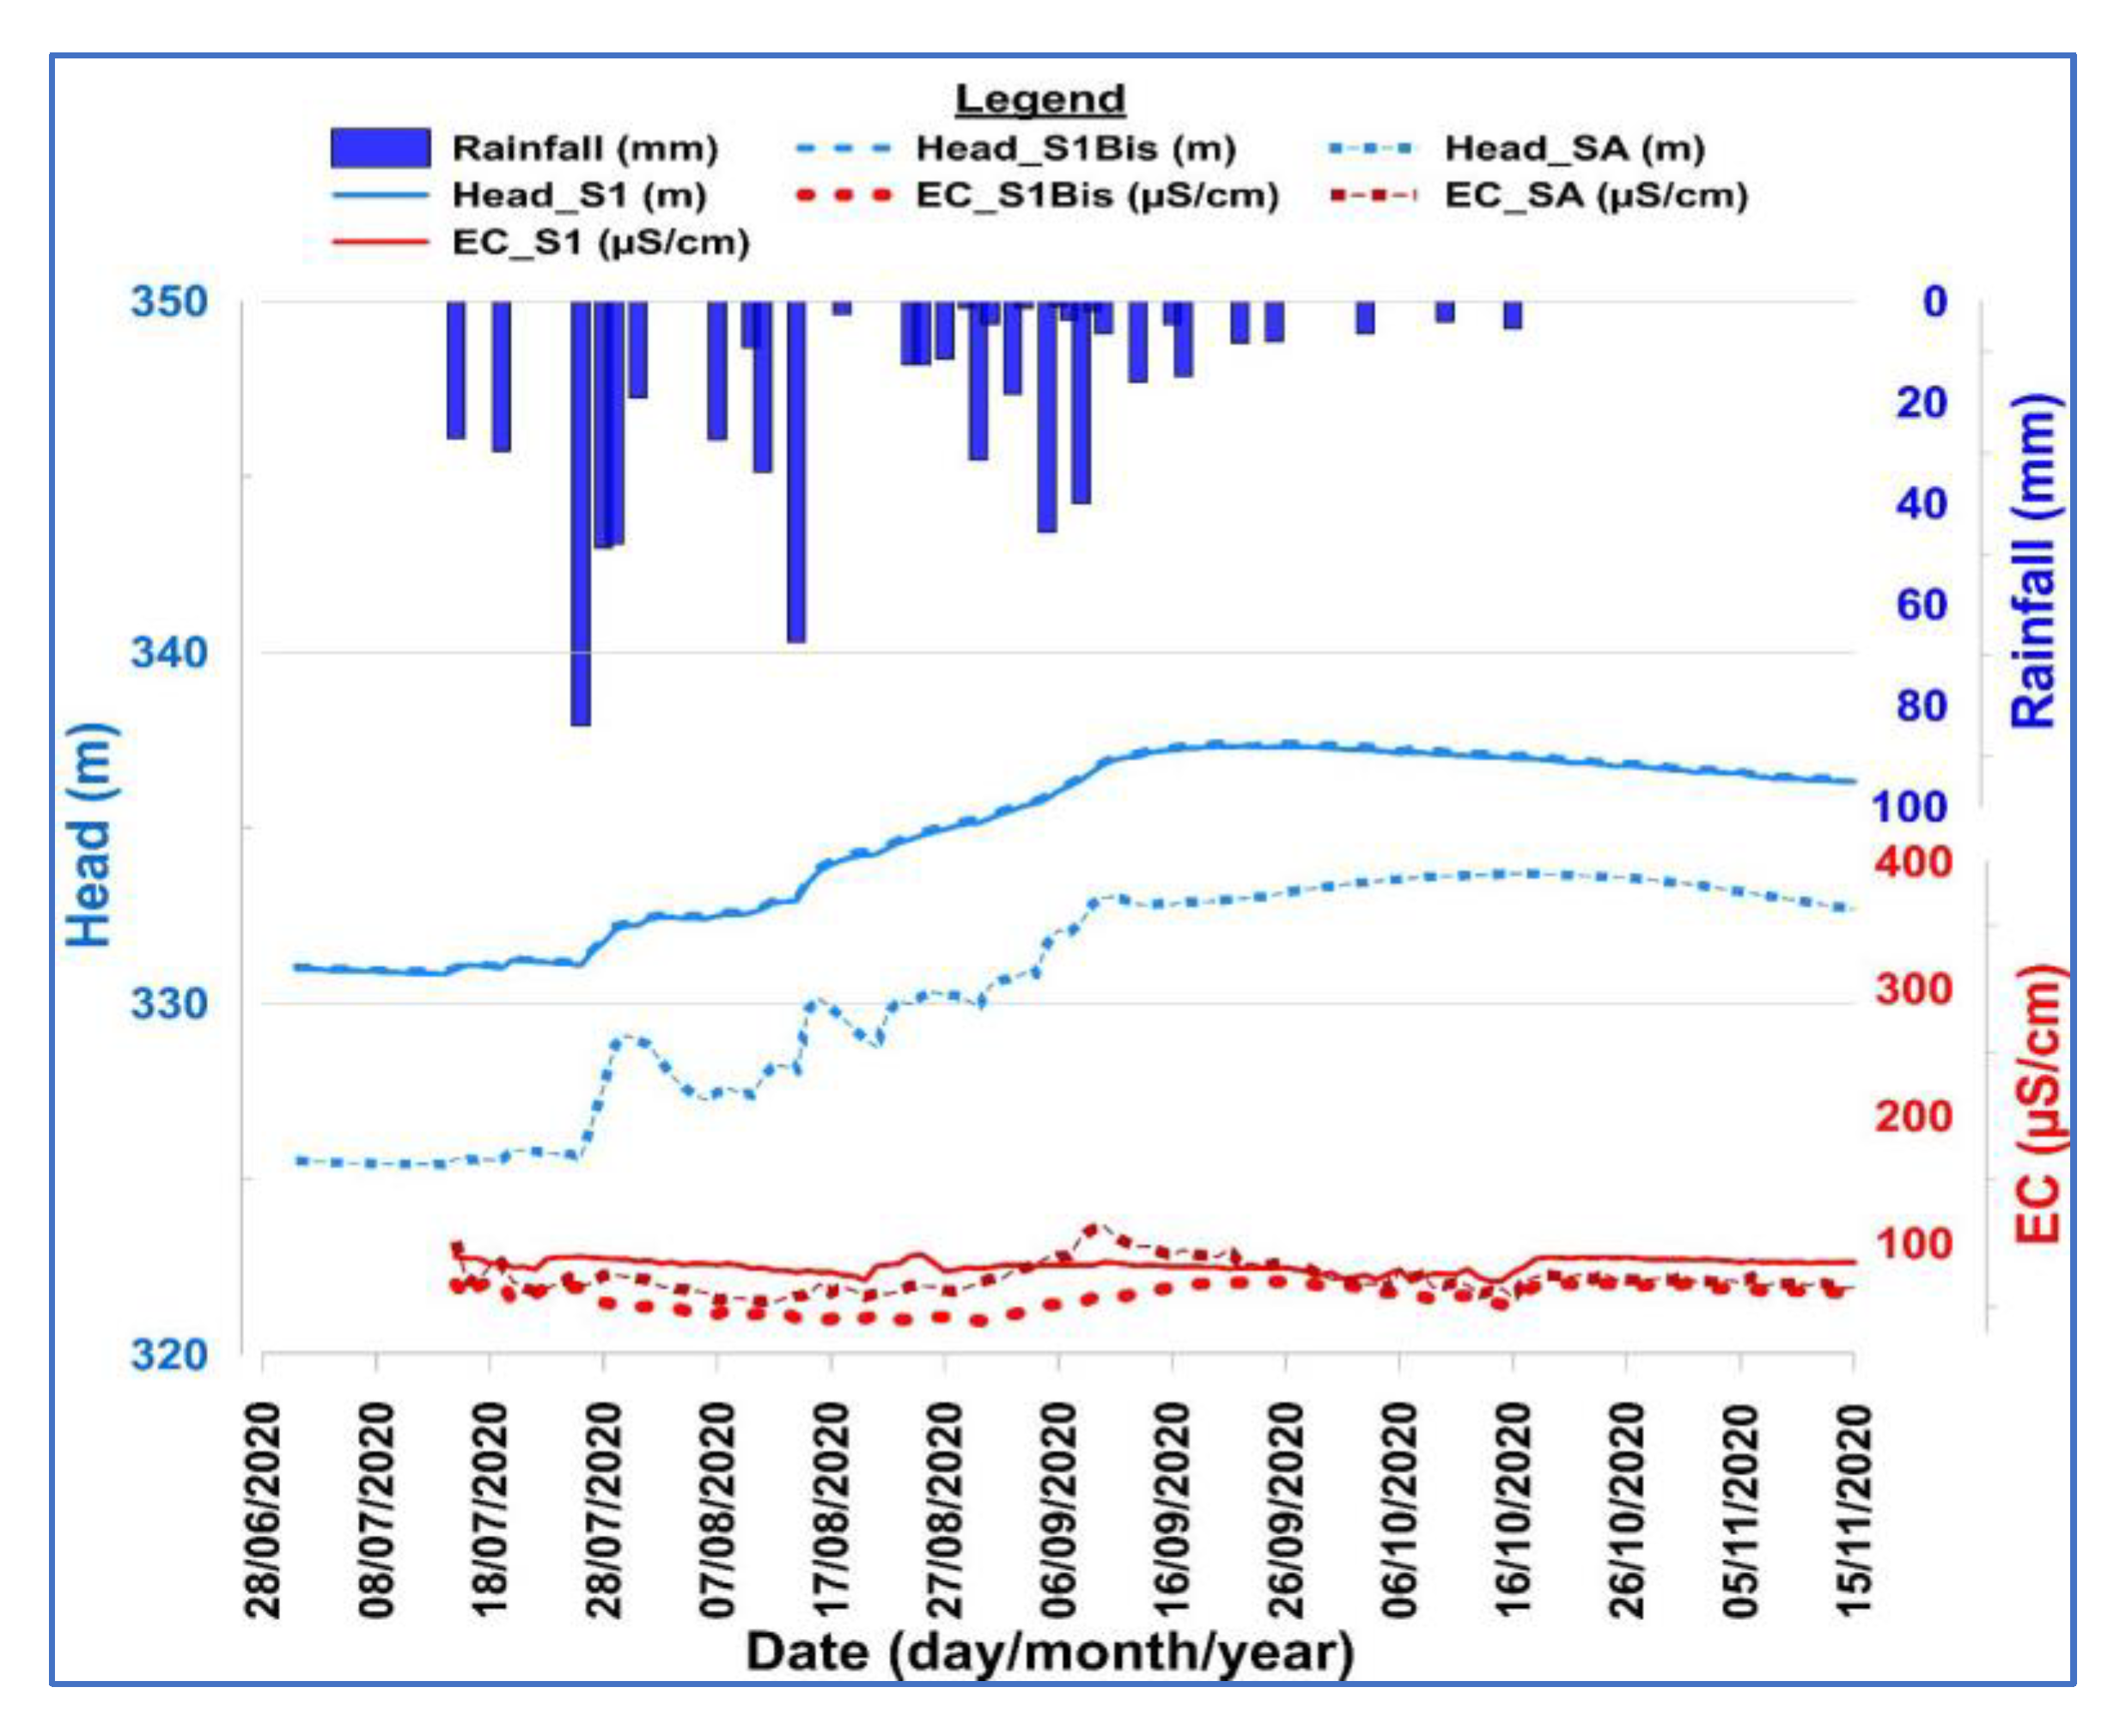
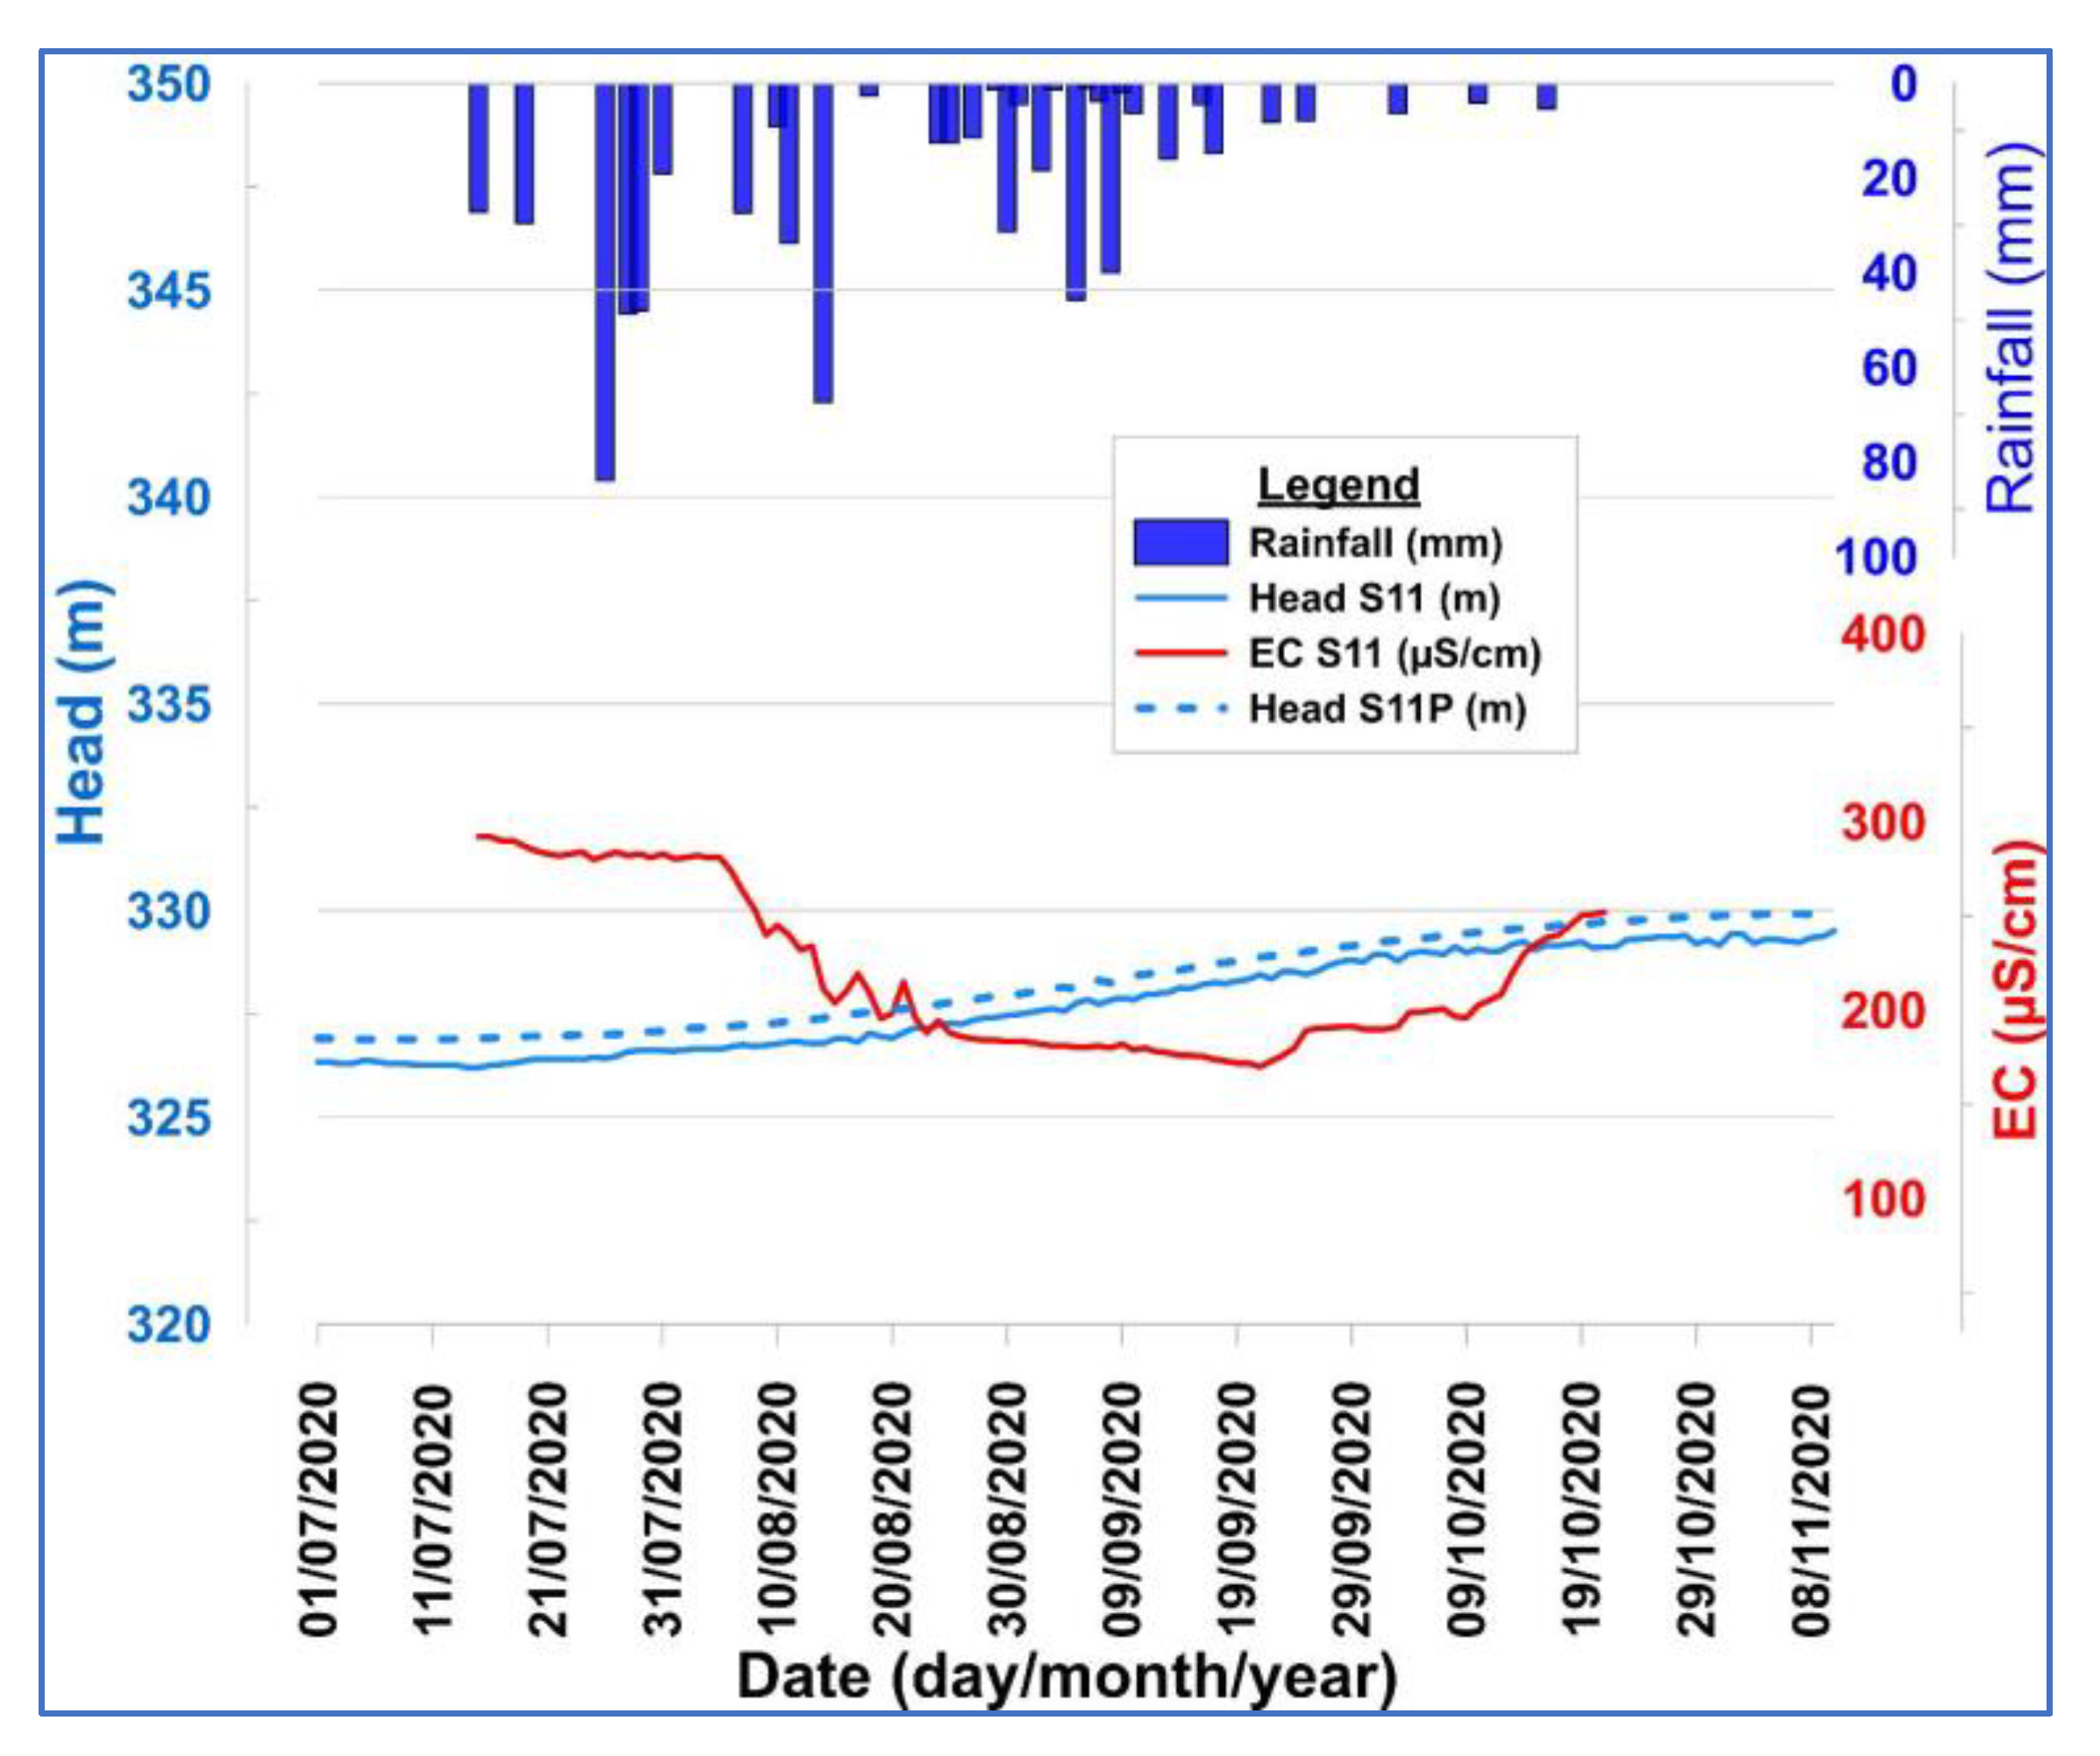
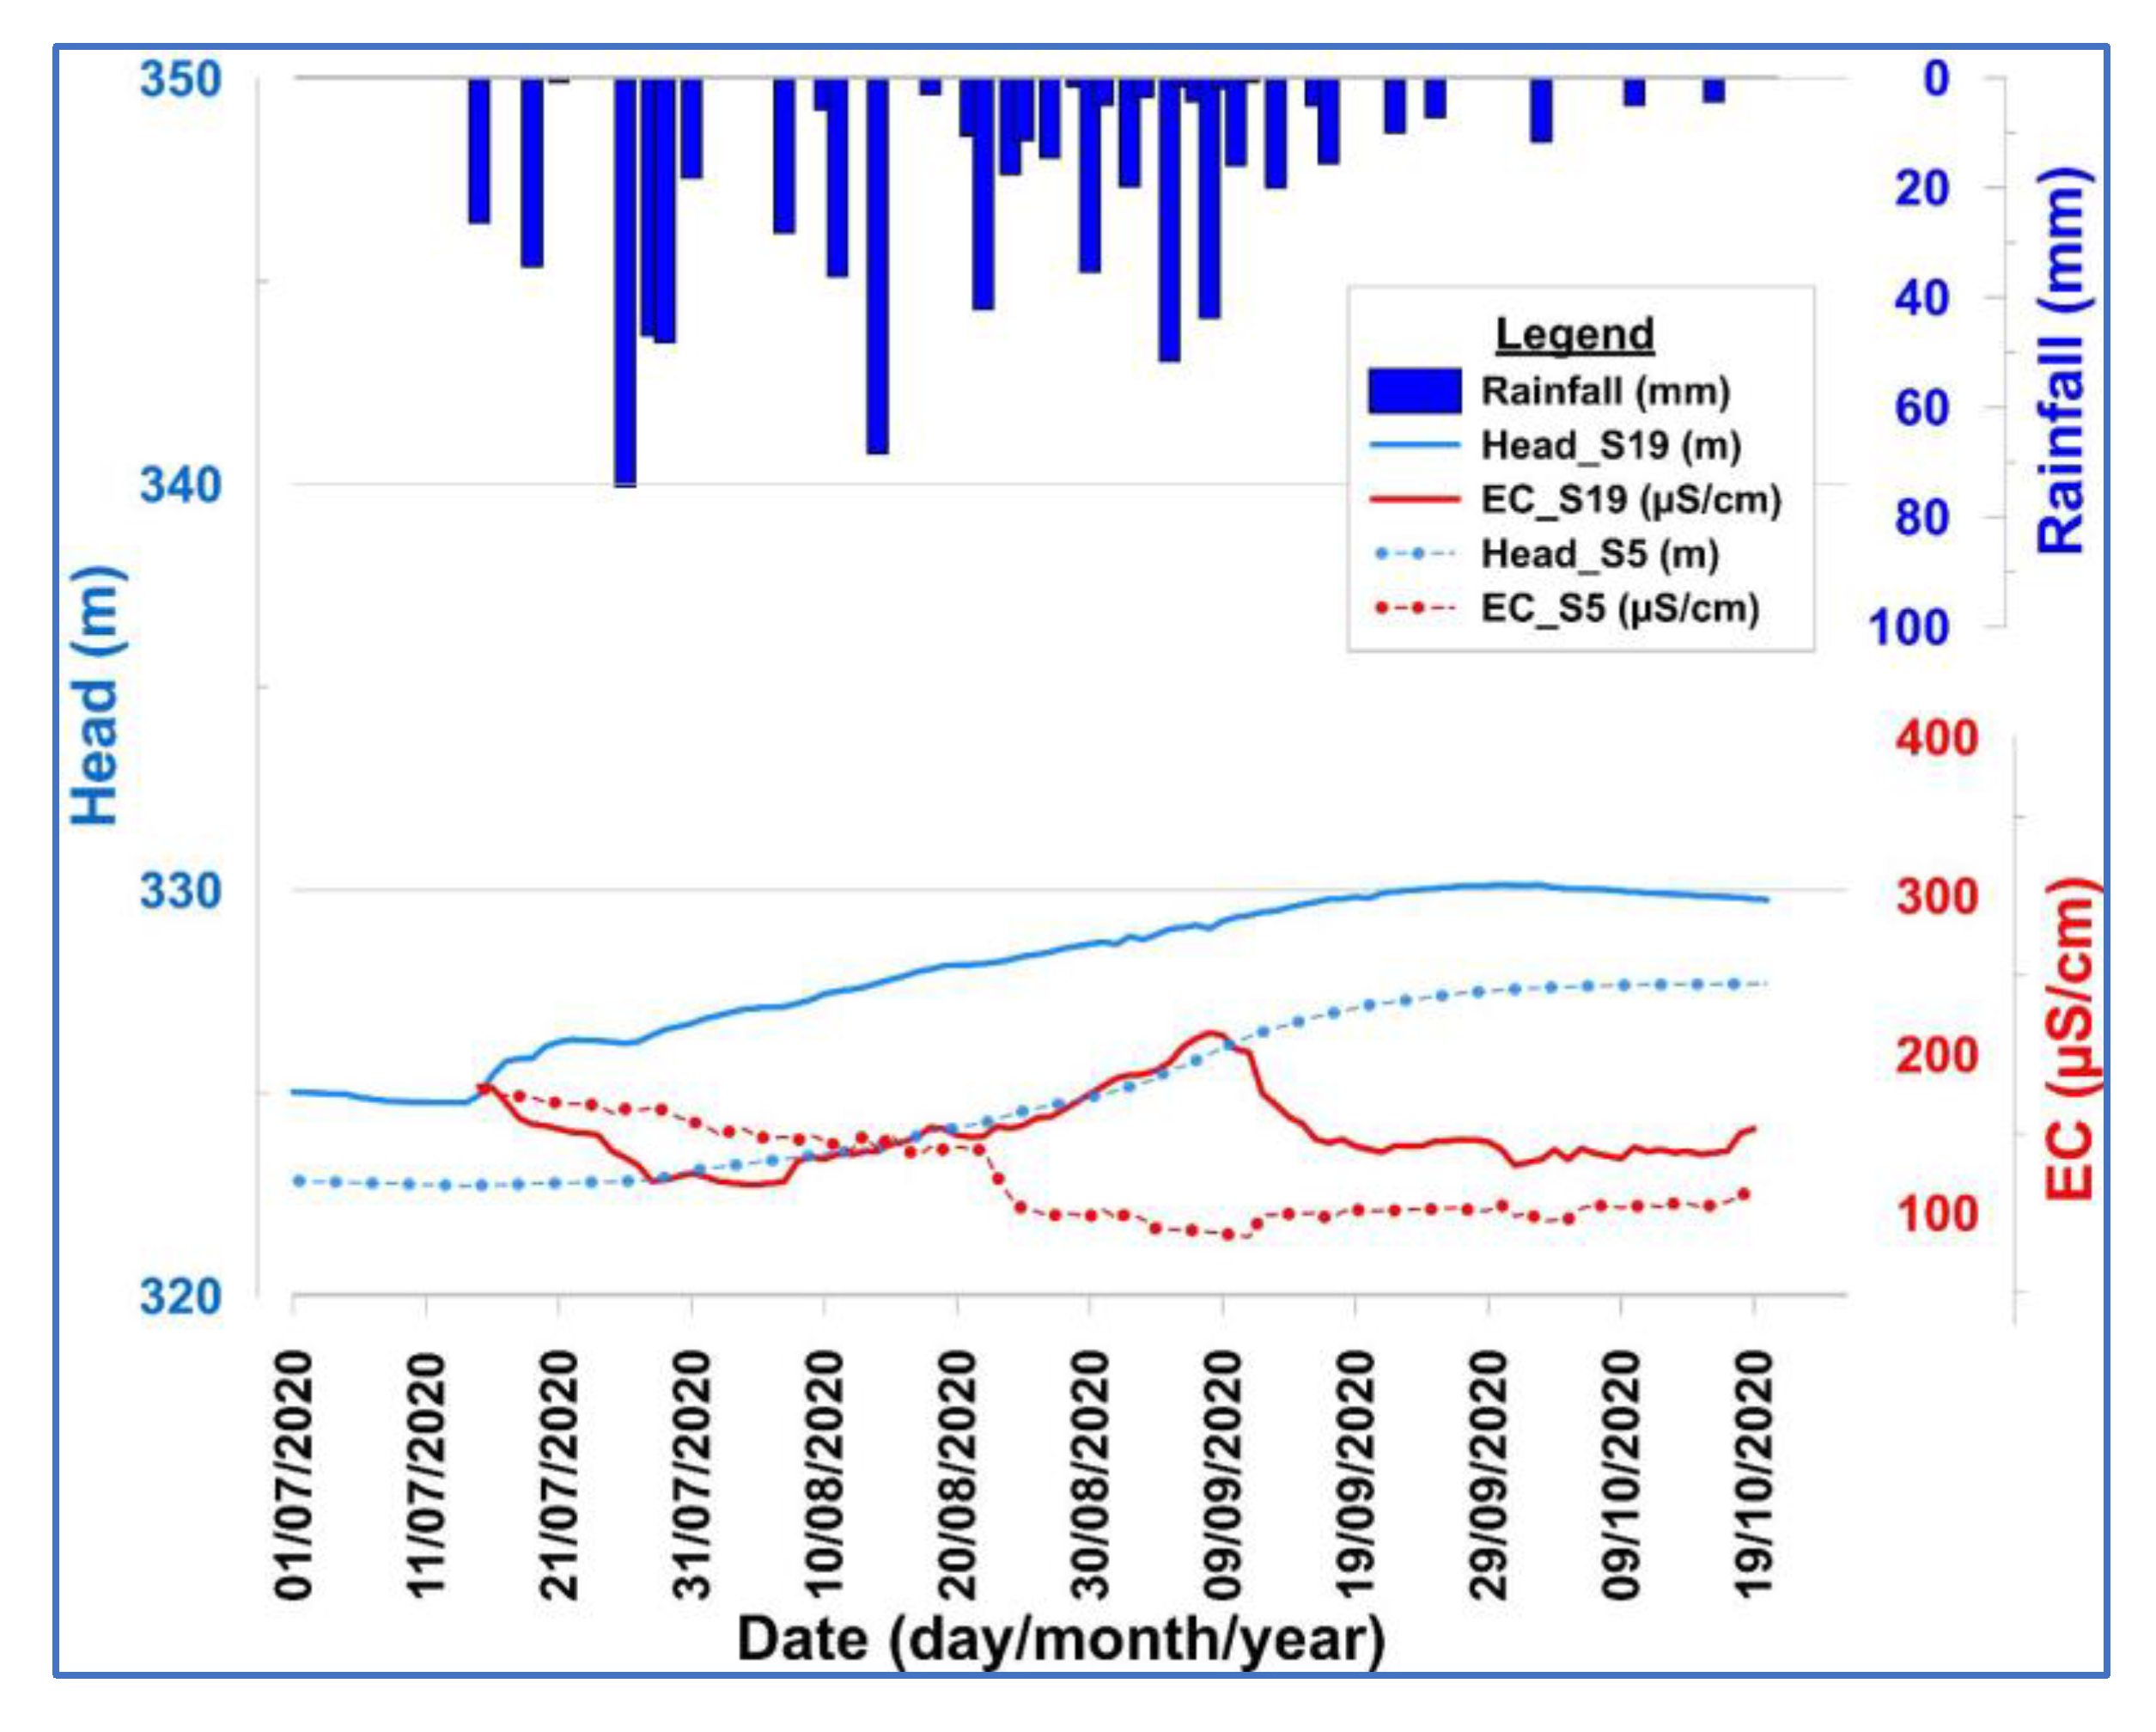
3.3. Time Tracing of Electrical Conductivity and Water Levels

3.3.1. At the Northern Ridge of the Catchment

At the northern ridge of the catchment, the evolution of groundwater levels seems to be uncorrelated to rainfall events. A detailed observation of groundwater hydrographs of the observation wells S1CN and S1CNP (less than 2 m apart), drilled in fractured and alterite reservoirs, respectively, reveals that the water table continuously rises before the beginning of the rainy season and continues to rise despite the end of the rainy season in mid-October (Figure 13). Therefore, the groundwater hydrographs show a delayed reaction for alterites compared to fractured reservoirs. This observation is reinforced by the evolution of the electrical conductivity in the two aquifers, marked by a premature drop in electrical conductivity in fractured reservoirs due to the arrival of weakly mineralized water. In contrast, the electrical conductivity in the alterite reservoir remains almost constant at the beginning of the season, followed by a slight decrease toward the end of August. This phase of decrease is due to the arrival of relatively less mineralized water in the aquifer. However, an increase in electrical conductivity is observed in early September and stabilizes until the end of the rainy season.

3.3.2. In the Central Valley and toward the Catchment Outlet

In the central valley and toward the catchment outlet, analysis of the groundwater hydrographs from observation wells S1 and S1Bis located in the central valley and SA located near the catchment outlet reveals an almost instantaneous response of the water table to rainfall events (Figure 14). The most important rainfall events resulted in significant jumps in the water table. The start of the rainy season caused a dilution effect around mid-August. The 10 day dry period from 15 to 25 August caused an increase in electrical conductivity in the alteration and fractured reservoirs. In piezometer S1Bis, it is relatively stable. From 30 August, an increase in electrical conductivity was observed in piezometers S1Bis and SA. The electrical conductivity of the water in piezometer S1 remains relatively stable. Indeed, piezometer S1 captures both shallow (weathering) and deep (fractured) reservoirs. The other two piezometers only capture shallow reservoirs. The electrical conductivities of the shallow and deep reservoirs in the central valley remain low throughout the wet period and remain below 100 µS/cm.

3.3.3. At the Southern Ridge of the Catchment

On the southern ridge of the catchment area, the evolution of groundwater levels does not seem to be correlated with rainfall events. A detailed observation of the groundwater hydrographs of the observation wells S11 and S11P (less than 100 m apart), which tap the fractured and altered reservoirs, reveals that they reacted globally to the rainy season in a staggered manner (Figure 15). The trend in the piezometric levels of both piezometers changed on the same day, i.e., on 4 August, 19 days after the start of the rainfall. The simultaneous response of the two aquifers indicates a high degree of connectivity between the shallow and deep reservoirs. The lag time is confirmed by the evolution of the electrical conductivity of the piezometer water, which is relatively constant at the beginning of the season until the beginning of August. The increase in the piezometric level is accompanied by a decrease in electrical conductivity until the end of September. The decrease in electrical conductivity is due to the mixing of the aquifer water with a low mineral load. From the end of September onward, an increase in electrical conductivity was observed despite the continuous increase in the piezometric level.

3.3.4. At the Outlet of the Catchment

At the outlet of the catchment, the evolution of groundwater levels does not seem to be correlated with rainfall events. Groundwater hydrographs from observation wells S5 and S19 (less than 50 m apart) drilled into the fractured and altered reservoirs show an increase in piezometric levels independent of the magnitude of the rainfall event (but of the rainy season as a whole) due to the buffering role played by the lowlands (Figure 16). Both aquifers are located in lowlands developed for rice cultivation. The growth of the piezometric level is more important in the alterites captured by S19 than in the fractured reservoir captured by S5. The first four rainfall events (15–26 July) did not affect the piezometric level of the fractured reservoir. The piezometric level increased at the end of the rainy season despite a significant drop in rainfall. This can be explained by the fact that a rainfall event can result in flooding of the area for several days or weeks. In S19, a decrease in electrical conductivity was observed at the beginning of the rainy season. This decrease in electrical conductivity is due to the mixing of the aquifer water with low mineralized water. From the beginning of August, the electrical conductivity increases until September. The electrical conductivity of the deep basal aquifer water collected by piezometer S5 decreased continuously from the beginning of the rainy season until mid-September when its value remained almost static until the end of the season. This behavior is thought to be due to intensive leaching induced by a large influx of water with a low chemical load.

4. Discussion

The distribution of hydraulic conductivity values shows relatively high values in the central valley (S1, S1Bis, S2, and SA). Analysis of the hydrographs of the aquifers in the area shows an almost instantaneous response of the aquifers to major rainfall events (Figure 13). This is the result of good hydraulic continuity between the permeable soils and the saturated zone of the area. Pumping tests conducted by [48,65] suggested a higher permeability in the central valley than outside the central valley (a factor of 10 difference) due to the presence of a large thickness of sandy alteration, confirmed by [37,56]. Pumping tests conducted by [65] showed storage coefficients in the order of 10−2 and hypothesized the unconfined nature of the aquifers in the central valley area. The central valley, where the piezometric dome appears (Figure 3), is a preferential direct recharge area. The description of groundwater flows at the Sanon site as being from the central valley where a dome is observed toward the ridges can be partly explained by the geometry and structure of the weathering profile described by [56] (Figure 2) in the Sahelian climate zones. This geological model provides a good explanation for the behavior of the Sanon hydrogeological catchment. Indeed, the presence of an iron crust (iron crust is in extensive and compact blocks which resist the dismantling) on the ridges facilitates the runoff of rainwater toward the central valley, which becomes the preferred groundwater recharge zone facilitated by its sandy surface structure and a gentle slope, when this is insufficient to promote erosion of the valley, and this would favor deep weathering by allowing water to persist for longer periods of time. Water accumulates within the valley and infiltrates below the surface, leading to direct recharge of the aquifers.
The authors of [56] added that this configuration is contrary to that observed in humid conditions, where the weathering profile is more complete and thicker on the ridges covered by an iron crust. The weathering profile of the Sahelian area is characterized by a low thickness of saprolite at the ridges and much greater in the valley. The iron crust is in extensive and compact blocks which resist the dismantling. However, in wet areas, the iron crust is often dislocated (existence of some residual blocks) or even completely dismantled following a lowering of the base level and a period of wetter climate.
According to the same author, from the hydrogeological point of view, the consequence of this difference in the behavior is that the topographical and hydrogeological watersheds of Sahelian areas are not superposed. In other words, the ridges do not coincide with the groundwater divides. The geochemical results support this hypothesis, firstly, by the low values of electrical conductivity found in the area (Figure 7 and Figure 13). The low mineralization of the waters can also be explained by the fact that they constitute altered environments perpetually leached by the beating of the water table seasonally renewed by rainwater [66]. Furthermore, the waters of the piezometers in the valley aquifers show the same similarities, grouped under cluster II (low EC) with chloride and sulfate–magnesium facies characteristic of the waters of the majority of piezometers. These facies are an indicator of the contribution of anthropogenic elements (nitrates and chlorides) through rainwater infiltration. The relatively high nitrate values of the water in these aquifers are shown in Figure 7. Furthermore, the low Na/Cl ratio (Figure 8) of the piezometers in the central valley confirms the external input of chlorides to the groundwater through rainwater infiltration. The recharge mechanism in the central valley is direct recharge by rainwater infiltration. It would be the place where water is moved in all directions in the basin due to the highest hydraulic load.
High values of surface hydraulic conductivity are also found in the northern and eastern ridge. However, the analysis of the hydrographs of the aquifers of the northern ridge shows the independence of the evolution of the levels concerning the rainfall. This lack of correlation suggests the existence of a hydraulic brake between the permeable soils and the saturated zone. Indeed, the geophysical characterization studies carried out by [56] revealed, on the northern ridge and discreetly on the eastern ridge, the presence of a clayey zone covered by several tens of meters of iron crust. The iron crust acts as impermeable strata preventing water percolation [67] and could justify the existence of an impermeable interface between the permeable soils and the saturated zone. Furthermore, the results of pumping tests carried out [37,65] have led to the hypothesis of a confined aquifer at this location. This hypothesis is supported by the analysis of the evolution of EC over time, which showed an early response of the deep-aquifer-captured S1CN compared to the alterites reservoir. This early response of the deep aquifer suggests a horizontal rather than a vertical transfer process. Furthermore, the waters of the S1CN, S1CNBis, and SaG piezometers show Na/Cl molar ratios greater than 1. This excess of sodium ions is due to a cation exchange phenomenon where sodium ions, adsorbed on the geological materials constituting the subsoil, are desorbed in the water to the detriment of calcium ions which substitute them [64,68,69]. The abundance of sodium ions in the fractured reservoirs would, therefore, reflect a relatively high residence time of the peripheral aquifers allowing a long contact time with the rocks favored by the low transmissivity values of the order of 10−6 m2/s [37], thus leading to an increase in conductivity. The aquifers of the northern ridge are fed by lateral transfer following a process of recharge distribution from the aquifers of the valley, where the piezometric dome is located.
Toward the southern ridge, in S11 and S11P, the low hydraulic conductivity values found reflect the presence of a less permeable clay layer (Ksat < 17 cm/day) resulting in long paths for infiltration water. Due to the relatively large thickness of the unsaturated zone (on average 14 m) and the possibility of evaporative recovery of the infiltrated water [70], the hypothesis of direct recharge in this zone is almost improbable, resulting in the relative independence of the piezometric levels from rainfall (Figure 14). Furthermore, the strong hydraulic gradients (1% at high water) between the aquifers of the central valley and those of the southern ridge, as well as the relatively high transmissivity values of 5 × 10⁻⁴ m2/s [37,65], could be at the origin of significant water flow exchanges between the valley and the southern ridge, leading to an increase in water level and a drop in hydraulic conductivity on the arrival of this weakly charged water (Figure 14). The rise in the levels of these aquifers would be due to the arrival of water from the piezometric dome zone following the direction of the hydraulic gradient according to a recharge redistribution process. Cluster I, which groups together the aquifers of piezometers S11, S11P, SaG, S1CNP, and S1CN at high water, represents the aquifers that are fed by the recharge redistribution process from the central valley.
However, for the low-permeability clay soils in the lowlands (east of the basin), flooding conditions increase the recharge rate of the aquifers. Authors have suggested that there is a quasi-linear relationship between the rate of increase in water table levels and the height of soil flooding [71,72,73]. This quasi-permanent submergence condition of the lowlands, especially in August and September, is believed to be the cause of appreciable fluctuations in the levels of the lowland aquifers compared to the ridge aquifers with soil permeability of the same order of magnitude (Ksat < 17 cm/day). These level fluctuations have an impact on the evolution of the electrical conductivity, which drops at times (Figure 15). The evolution of the electrical conductivity of the S5 aquifer shows a continuous decrease, due to intensive leaching, which causes the piezometer to evolve from Cluster III to Cluster II, characterized by low conductivity values. Furthermore, due to the existence of the hydraulic gradient between the central valley and the lowland area, a lateral supply could exist. For Cluster III, in high water, consisting of the aquifers of piezometers S8, S18, and S19, the recharge process is mixed: indirect recharge mechanism due to the presence of submergence water level and a mechanism via lateral transfers from the aquifers of the piezometric dome zone. Groundwater abstraction is not the primary discharge mechanism. Furthermore, there is no baseflow during dry season. The absence of baseflow and discharge zones caused by groundwater abstraction contributes to groundwater flows (under the effect of the hydraulic gradient) toward the ridges far from the preferential recharge zone. Even if the current investigations do not allow confirming the discharge area, one can suppose the following discharge mechanism: groundwater reaching the catchment ridges recirculates along the ridges to emerge at the outlet. In other words, the hydrogeological and hydrological outlets are superimposed. This assumption is supported by the existence of wetlands downstream at the catchment outlet.

5. Conclusions

This study incorporated several methods to characterize the hydraulic parameters of the soils, as well as the hydrodynamic and hydrogeochemical parameters of the aquifers, to identify the main recharge mechanisms in the Sanon experimental catchment. The hydraulic conductivity data obtained revealed that the most permeable soils are found in the central valley, at the northern and eastern crest of the catchment. The least permeable soils are located in the south and east of the catchment. The study of the piezometric levels showed the existence of a piezometric dome preferential zone and gradients oriented toward the extremities of the basin indicating the direction of groundwater flow. The hydrogeochemical characterization studies supported the hypothesis of preferential recharge in the central valley by revealing that the low electrical conductivities and high concentrations of nitrates and chlorides, elements of external origin, in the waters of the central valley aquifers. The daily tracing of the electrical conductivity and piezometric level of the aquifers, and the classification of the groundwater made it possible to identify three main groundwater recharge processes depending on the zone:
Group 1, characterized by high electrical conductivity, includes the aquifers of the northern, eastern, and southern ridge. These aquifers are fed by lateral transfer following the process of redistribution of the recharge according to the hydraulic gradient.
Group 2, characterized by low conductivity includes the aquifers of the central valley. The recharge mechanism is direct recharge by rainwater infiltration. Areas with high-permeability soils, low slopes, and thick sandy weathering layers, with a limited drainage network and aquifers with a high capacitive function, are areas of preferential direct recharge.
Group 3 is characterized by the aquifers of the outlet area. The recharge mechanism is mixed: indirect recharge from standing water and lateral transfer following the process of recharge redistribution according to the hydraulic gradient. The characterization of the recharge mechanism by calling on methods of characterization of the hydraulic parameters of the soils, as well as the hydrodynamic and hydrogeochemical parameters of the aquifers, makes it possible to highlight the main mechanisms of recharge in a catchment area. Its implementation requires a good geological and hydrogeological characterization of the catchment area.

Supplementary Materials

The following are available online at https://www.mdpi.com/article/10.3390/w13223216/s1: Table S1. Descriptive statistics of chemical elements; Table S2. Average values of the chemical parameters for the main clusters and well observations concerned; Table S3. Correlations between variables and factors.

Author Contributions

Conceptualization, M.B.K., M.K. and M.L.C.; methodology, M.B.K., M.K. and M.L.C.; formal analysis, M.B.K., M.K. and M.L.C.; investigation, M.B.K., M.K. and M.L.C.; resources, M.K.; data curation, O.R.Y., T.F., C.O.Z., M.D.F., B.L. and M.B.K.; writing—original draft preparation, M.B.K.; writing—review and editing, M.K., O.R.Y., M.L.C. and M.D.F.; supervision, M.K.; project administration, M.K.; funding acquisition, M.B.K. and M.K. All authors have read and agreed to the published version of the manuscript.

Funding

This research is financed by the project “Programme d’Approvisionnement En Eau et Assainissement (PAEA)” funded by the World Bank and the Burkinabe government.

Institutional Review Board Statement

Not applicable.

Informed Consent Statement

Not applicable.

Data Availability Statement

Data sharing is not applicable to this article.

Acknowledgments

This study was carried out within the context of the Water Supply and Sanitation Program (WSSP) funded by the World Bank and the Government of Burkina Faso. We would like to thank the project coordinator, Jean Mathieu Bingbouré for providing us with the necessary resources to complete this study. The authors are also grateful to the people of Sanon for their warm welcome at the experimental site.

Conflicts of Interest

The authors declare no conflict of interest.

References

  1. Belemtougri, A.P.; Ducharne, A.; Tazen, F.; Oudin, L.; Karambiri, H. Understanding key factors controlling the duration of river flow intermittency: Case of Burkina Faso in West Africa. J. Hydrol. Reg. Stud. 2021, 37, 100908. [Google Scholar] [CrossRef]
  2. MEA. Programme National d’Approvisionnement en Eau Potable (PN-AEP); Rapport National Bilan Annuel 2020; MEA: Ouagadougou, Burkina Faso, 2021.
  3. De Gramont, H.M. Amelioration de la Connaissance et de la Gestion des Eaux au Burkina Faso. P162723; Annexes 1: Diagnostic sur Les Eaux Souterraines; World Bank: Washington, DC, USA, 2017. [Google Scholar]
  4. Lachassagne, P.; Wyns, R. Aquifères de socle. Nouveaux concepts. Application à la prospection et la gestion de la ressource en eau. Géosciences 2005, 2, 32–37. [Google Scholar]
  5. Boutt, D.F.; Diggins, P.; Mabee, S. A field study (Massachusetts, USA) of the factors controlling the depth of groundwater flow systems in crystalline fractured-rock terrain. Hydrogeol. J. 2010, 18, 1839–1854. [Google Scholar] [CrossRef]
  6. Assemian, E.A.; Kouamé, F.K.; Saley, M.B.; Ta, M.Y.; Patrice, J.; Jourda, R. Étude de la productivité d’ un aquifère de socle et approche statistique pour la détermination des tranches de profondeurs potentiellement productives: Cas de la région de Bongouanou, est de la Côte d’ Ivoire Study of hard roc. J. Water Sci. 2020, 27, 81–97. [Google Scholar]
  7. Koïta, M.; Sandwidi, W.J.P.; Dara, A.E. Recharge Estimation of Hard Rock Aquifers under Sahelian Climate Conditions Using Water Table Fluctuation: Case Study of Tougou Catchment, Burkina Faso. J. Water Resour. Prot. 2017, 09, 1428–1448. [Google Scholar] [CrossRef] [Green Version]
  8. Ilboudo, S.; Toe, A.M.; Ouedraogo, R.; Ouedraogo, M.; Guissou, I.P. Ecological Risk Assessment of Pesticide Residues in Water from Desert Locust Area in Burkina Faso. Res. J. Environ. Earth Sci. 2014, 6, 227–232. [Google Scholar] [CrossRef]
  9. Bretzler, A.; Lalanne, F.; Nikiema, J.; Podgorski, J.; Pfenninger, N.; Berg, M.; Schirmer, M. Groundwater arsenic contamination in Burkina Faso, West Africa: Predicting and verifying regions at risk. Sci. Total Environ. 2017, 584–585, 958–970. [Google Scholar] [CrossRef] [PubMed]
  10. Porgo, M.; Gokyay, O. Environmental impacts of gold mining in Essakane site of Burkina Faso. Hum. Ecol. Risk Assess. 2017, 23, 641–654. [Google Scholar] [CrossRef]
  11. de Vries, J.J.; Simmers, I. Groundwater recharge: An overview of process and challenges. Hydrogeol. J. 2002, 10, 5–17. [Google Scholar] [CrossRef]
  12. Scanlon, B.; Keese, K.; Flint, A.; Flint, L.; Gaye, C.B.; Edmunds, W.; Simmers, I. Global synthesis of groundwater recharge in semiarid and arid regions. Hydrol. Process. 2006, 20, 3335–3370. [Google Scholar] [CrossRef]
  13. Yin, L.; Hu, G.; Huang, J.; Wen, D.; Dong, J.; Wang, X.; Li, H. Groundwater-recharge estimation in the Ordos Plateau, China: Comparison of methods. Hydrogeol. J. 2011, 19, 1563–1575. [Google Scholar] [CrossRef]
  14. Manna, F.; Walton, K.M.; Cherry, J.A.; Parker, B.L. Mechanisms of recharge in a fractured porous rock aquifer in a semi-arid region. J. Hydrol. 2017, 555, 869–880. [Google Scholar] [CrossRef]
  15. Flint, A.L.; Flint, L.E.; Kwicklis, E.M.; Fabryka-Martin, J.T.; Bodvarsson, G.S. Estimating recharge at Yucca Mountain, Nevada, USA: Comparison of methods. Hydrogeol. J. 2002, 10, 180–204. [Google Scholar] [CrossRef]
  16. Hamza, M.H.; Added, A.; Rodríguez, R.; Abdeljaoued, S.; Ben Mammou, A. A GIS-based DRASTIC vulnerability and net recharge reassessment in an aquifer of a semi-arid region (Metline-Ras Jebel-Raf Raf aquifer, Northern Tunisia). J. Environ. Manag. 2007, 84, 12–19. [Google Scholar] [CrossRef]
  17. Walker, D.; Parkin, G.; Schmitter, P.; Gowing, J.; Tilahun, S.A.; Haile, A.T.; Yimam, A.Y. Insights From a Multi-Method Recharge Estimation Comparison Study. Groundwater 2019, 57, 245–258. [Google Scholar] [CrossRef] [PubMed] [Green Version]
  18. Scanlon, B.R.; Healy, R.W.; Cook, P.G. Choosing appropriate techniques for quantifying groundwater recharge. Hydrogeol. J. 2002, 10, 18–39. [Google Scholar] [CrossRef]
  19. Fernández-Mejuto, M.; Andreu, J.M.; García-Sánchez, E.; Palencia, R. An Assessment of Groundwater Recharge at A Regional Scale for Sustainable Resource Management: Province of Alicante (SE Spain). Water 2021, 13, 862. [Google Scholar] [CrossRef]
  20. Zagana, E.; Obeidat, M.; Kuells, C.; Udluft, P. Chloride, hydrochemical and isotope methods of groundwater recharge estimation in eastern Mediterranean areas: A case study in Jordan. Hydrol. Process. 2007, 21, 2112–2123. [Google Scholar] [CrossRef]
  21. Sibanda, T.; Nonner, J.C.; Uhlenbrook, S. Comparison of groundwater recharge estimation methods for the semi-arid Nyamandhlovu area, Zimbabwe. Hydrogeol. J. 2009, 17, 1427–1441. [Google Scholar] [CrossRef]
  22. Marei, A.; Khayat, S.; Weise, S.; Ghannam, S.; Sbaih, M.; Geyer, S. Estimation de la recharge hydrogéologique par la méthode du bilan massique des chlorures en Cisjordanie, Palestine. Hydrol. Sci. J. 2010, 55, 780–791. [Google Scholar] [CrossRef]
  23. Sophocleous, M. Groundwater recharge and sustainability in the High Plains aquifer in Kansas, USA. Hydrogeol. J. 2005, 13, 351–365. [Google Scholar] [CrossRef]
  24. Dripps, W.R.; Hunt, R.J.; Anderson, M.P. Estimating recharge rates with analytic element models and parameter estimation. Ground Water 2006, 44, 47–55. [Google Scholar] [CrossRef] [PubMed]
  25. Hashemi, H.; Berndtsson, R.; Kompani-Zare, M.; Persson, M. Natural vs. artificial groundwater recharge, quantification through inverse modeling. Hydrol. Earth Syst. Sci. 2013, 17, 637–650. [Google Scholar] [CrossRef] [Green Version]
  26. Moiwo, J.P.; Tao, F. Groundwater recharge and discharge analysis for Land use conditions suitable for the hydrology and ecology of semiarid regions. Hydrol. Res. 2014, 45, 563–574. [Google Scholar] [CrossRef]
  27. Yifru, B.A.; Chung, I.M.; Kim, M.G.; Chang, S.W. Assessment of groundwater recharge in agro-urban watersheds using integrated SWAT-MODFLOW model. Sustainability 2020, 12, 6593. [Google Scholar] [CrossRef]
  28. Healy, R.W.; Cook, P.G. Using groundwater levels to estimate recharge. Hydrogeol. J. 2002, 10, 91–109. [Google Scholar] [CrossRef]
  29. Misstear, B.D.R.; Brown, L.; Johnston, P.M. Estimation of groundwater recharge in a major sand and gravel aquifer in Ireland using multiple approaches. Hydrogeol. J. 2009, 17, 693–706. [Google Scholar] [CrossRef]
  30. Heppner, C.S.; Nimmo, J.R.; Folmar, G.J.; Gburek, W.J.; Risser, D.W. Multiple-methods investigation of recharge at a humid-region fractured rock site, Pennsylvania, USA. Hydrogeol. J. 2007, 15, 915–927. [Google Scholar] [CrossRef]
  31. Misstear, B.D.R. Groundwater Recharge Assessment: A Key Component of River Basin Management. Natl. Hydrol. Semin. 2000, 51–58. [Google Scholar]
  32. Lerner, D.N. Identifying and quantifying urban recharge: A review. Hydrogeol. J. 2002, 10, 143–152. [Google Scholar] [CrossRef]
  33. Xu, Y.; Beekman, H.E. Groundwater Recharge Estimation in Southern Africa; UNESCO: Paris, France, 2003; Volume 64, ISBN 9292200003. [Google Scholar]
  34. Wright, S.N.; Novakowski, K.S. Groundwater recharge, flow and stable isotope attenuation in sedimentary and crystalline fractured rocks: Spatiotemporal monitoring from multi-level wells. J. Hydrol. 2019, 571, 178–192. [Google Scholar] [CrossRef]
  35. Koussoubé, Y. Hydrogéologie en Milieu de Socle Cristallin du Burkina Faso. Cas du Bassin Versant du Bas-Fond de Bidi (Province du Yatenga). Ph.D. Thesis, Université Cheikh Anta Diop de Dakar, Dakar, Senegal, 1996. [Google Scholar]
  36. Sandwidi, W.J.P. Groundwater Potential to Supply Population Demand within the Kompienga dam Basin in Burkina Faso. Ph.D. Thesis, Universitäts und Landesbibliothek Bonn, Bonn, Germany, 2007; p. 132. [Google Scholar]
  37. Soro, D.D. Caractérisation et Modélisation Hydrogéologique d’un Aquifère en Milieu de Socle Fracturé: Cas du Site Expérimental de Sanon (Région du Plateau Central au Burkina Faso). Ph.D. Thesis, International Institute of Water and Environmental Engineering, Pierre and Marie Curie-Paris VI University, Paris, France, 2017. [Google Scholar]
  38. Robins, N.S. Recharge: The key to groundwater pollution and aquifer vulnerability. Geol. Soc. Spec. Publ. 1998, 130, 1–5. [Google Scholar] [CrossRef]
  39. Zongyu, C.; Zhenlong, N.; Zhaoji, Z.; Jixiang, Q.; Yunju, N. Isotopes and Sustainability of Ground Water. Ground Water 2005, 43, 485–493. [Google Scholar] [CrossRef]
  40. Demlie, M.; Wohnlich, S.; Ayenew, T. Major ion hydrochemistry and environmental isotope signatures as a tool in assessing groundwater occurrence and its dynamics in a fractured volcanic aquifer system located within a heavily urbanized catchment, central Ethiopia. J. Hydrol. 2008, 353, 175–188. [Google Scholar] [CrossRef]
  41. Ma, J.; Ding, Z.; Edmunds, W.M.; Gates, J.B.; Huang, T. Limits to recharge of groundwater from Tibetan plateau to the Gobi desert, implications for water management in the mountain front. J. Hydrol. 2009, 364, 128–141. [Google Scholar] [CrossRef]
  42. Saha, D.; Dwivedi, S.N.; Roy, G.K.; Reddy, D.V. Investigation sur le flux de nappe et sur le mécanisme de recharge d’un système aquifère du socle basée sur les isotopes: Cas de la zone urbaine de Ranchi, Inde. Hydrogeol. J. 2013, 21, 1101–1115. [Google Scholar] [CrossRef]
  43. Kamtchueng, B.T.; Fantong, W.Y.; Wirmvem, M.J.; Tiodjio, R.E.; Fouépé Takounjou, A.; Asai, K.; Bopda Djomou, S.L.; Kusakabe, M.; Ohba, T.; Tanyileke, G.; et al. A multi-tracer approach for assessing the origin, apparent age and recharge mechanism of shallow groundwater in the Lake Nyos catchment, Northwest, Cameroon. J. Hydrol. 2015, 523, 790–803. [Google Scholar] [CrossRef] [Green Version]
  44. Wang, P.; Zhang, F.; Chen, Z. Characterization of recharge processes and groundwater flow paths using isotopes in the arid Santanghu basin, Northwest China. Hydrogeol. J. 2020, 28, 1037–1051. [Google Scholar] [CrossRef]
  45. Leduc, C.; Taupin, J.; Le Gal, C. Estimation de la recharge de la nappe phréatique du Continental Terminal (Niamey, Niger). Géosci.Surf. 1996, 323, 599–605. [Google Scholar]
  46. Desconnets, J.C.; Taupin, J.D.; Lebel, T.; Leduc, C. Hydrology of the HAPEX-Sahel Central Super-Site: Surface water drainage and aquifer recharge through the pool systems. J. Hydrol. 1997, 188–189, 155–178. [Google Scholar] [CrossRef]
  47. Abdou Babaye, M.S.; Orban, P.; Ousmane, B.; Favreau, G.; Brouyère, S.; Dassargues, A. Characterization of recharge mechanisms in a Precambrian basement aquifer in semi-arid south-west Niger. Hydrogeol. J. 2019, 27, 475–491. [Google Scholar] [CrossRef] [Green Version]
  48. Compaore, G. Évaluation de la Fonction Capacitive des Altérites, Site Expérimental de Sanon: Socle Granito-Gneissique Sous Climat de Type Soudano-Sahélien. Ph.D. Thesis, Université d’Avignon, Avignon, France, 1997. [Google Scholar]
  49. BUNASOLS. Rapport d’Inspection Morphopédologique et Résultats d’Analyses Granulométriques des Prélèvements des sols du Site Expérimental de Sanon; BUNASOLS: Ouagadougou, Burkina Faso, 2020. [Google Scholar]
  50. BRGM-Aquater. Exploitation des Eaux Souterraines en Socle Cristallin et Valorisation Agricole: Pilote Expérimental en Milieu Rural Pour les Zones Soudano-Sahéliennes et Sahéliennes; Rapport 33576; BRGM (Bureau de Recherches Géologiques et Minières): Orléans, France, 1991. [Google Scholar]
  51. IGB. Base de Données d’Occupation des Terres (BDOT) 2012; IGB: Ouagadougou, Burkina Faso, 2012. [Google Scholar]
  52. Peel, M.C.; Finlayson, B.L.; McMahon, T.A. Updated world map of the Köppen-Geiger climate classification. Hydrol. Earth Syst. Sci. 2007, 11, 1633–1644. [Google Scholar] [CrossRef] [Green Version]
  53. Lompo, M. Paleoproterozoic structural evolution of the Man-Leo Shield (West Africa). Key structures for vertical to transcurrent tectonics. J. Afr. Earth Sci. 2010, 58, 19–36. [Google Scholar] [CrossRef]
  54. Feybesse, J.-L.; Billa, M.; Guerrot, C.; Duguey, E.; Lescuyer, J.-L.; Milesi, J.-P.; Bouchot, V. The paleoproterozoic Ghanaian province: Geodynamic model and ore controls, including regional stress modeling. Precambrian Res. 2006, 149, 149–196. [Google Scholar] [CrossRef]
  55. Castaing, C.; Chevremont, P.; Donzeau, M.; Egal, E.; Le Mentour, J.; Thiéblemont, D.T.M.; Guerrot, C.; Billa, M.; Itard, Y.; Delpont, G.K.J. Notice Explicative de la Carte Géologique et Minière du Burkina Faso à 1/1,000,000; Bureau de Recherches Géologiques et Minières: Orléans, France, 2003. [Google Scholar]
  56. Soro, D.D.; Koïta, M.; Biaou, C.A.; Outoumbe, E.; Vouillamoz, J.M.; Yacouba, H.; Guérin, R. Geophysical demonstration of the absence of correlation between lineaments and hydrogeologically usefull fractures: Case study of the Sanon hard rock aquifer (central northern Burkina Faso). J. Afr. Earth Sci. 2017, 129, 842–852. [Google Scholar] [CrossRef] [Green Version]
  57. Koïta, M.; Yonli, H.F.; Soro, D.D.; Dara, A.E.; Vouillamoz, J.M. Groundwater storage change estimation using combination of hydrogeophysical and groundwater table fluctuation methods in hard rock aquifers. Resources 2018, 7, 5. [Google Scholar] [CrossRef] [Green Version]
  58. Boivin, P. Caracterisation de l’infiltrabilité d’un sol par la méthode MUNTZ, Variabilite de la mesure. Bull. Eros. 1990, 10, 14–24. [Google Scholar]
  59. Peugeot, C. Influence de L’encroutement Superficiel du sol sur le Fonctionnement Hydrologique d’un Versant Sahelien (Niger). Experimentations in Situ et Modelisation. Ph.D. Thesis, Université Joseph Fourier, Grenoble, France, 1995. [Google Scholar]
  60. Zouré, C.O. Étude des Performances Hydrologiques des Techniques Culturales dans un Contexte de Changement Climatique en Zone Sahélienne du Burkina. Ph.D. Thesis, Institut International d’Ingénierie de l’Eau et de l’Environnement (2iE), Ouagadougou, Burkina Faso, 2019. [Google Scholar]
  61. Simler, R. DIAGRAMMES: Manuel d’Utilisation; Laboratoire d’Hydrogéologie d’Avignon: Avignon, France, 2014. [Google Scholar]
  62. Ouandaogo-Yameogo, S. Ressources en eau Souterraine du Centre Urbain de Ouagadougou au Burkina Faso, Qualité et Vulnérabilité. Ph.D. Thesis, Université d’Avignon et des Pays de Vaucluse, Avignon, France, 2008. [Google Scholar]
  63. Müller, D.; Blum, A.; Hart, A.; Hookey, J.; Kunkel, R.; Scheidleder, A.; Tomlin, C.; Wendland, F. Final Proposal for a Methodology to Set up Groundwater Threshold Values in Europe. BRIDGE Deliverable D18. 2006. 63p. Available online: http://nfp-at.eionet.europa.eu/Public/irc/eionet-circle/bridge/library?l=/deliverables/bridge_groundw-205pdf/_EN_1.0_&a=d (accessed on 15 March 2021).
  64. Thomas, C.; Orban, P.; Brouyère, S. Caractérisation de la Concentration de Référence de Certains Paramètres Chimiques Présents Naturellement da ns les Masses d’ eau Souterraine Captives du Socle et du Crétacé ( BR01 ) et du Landénien ( BR03 ) en Région de Bruxelles-Capitale; Bruxelles Environnement: Brussels, Belgium, 2016. [Google Scholar]
  65. Koïta, M.; Yonli, H.F.; Soro, D.D.; Dara, A.E.; Vouillamoz, J.M. Taking into account the role of the weathering profile in determining hydrodynamic properties of hard rock aquifers. Geosciences 2017, 7, 89. [Google Scholar] [CrossRef] [Green Version]
  66. Kotchoni, D.O.V. Recharge des Aquifères de Socle du Bénin: Identification des Processus, Quantification et Analyse de L’évolution Temporelle. Ph.D. Thesis, Université d’Abomey Calavi, Abomey-Calavi, Benin, 2019; 126p. [Google Scholar]
  67. Das, S. Delineation of groundwater potential zone in hard rock terrain in Gangajalghati block, Bankura district, India using remote sensing and GIS techniques. Model. Earth Syst. Environ. 2017, 3, 1589–1599. [Google Scholar] [CrossRef] [Green Version]
  68. Stigter, T.Y.; Van Ooijen, S.P.J.; Post, V.E.A.; Appelo, C.A.J.; Carvalho Dill, A.M.M. A hydrogeological and hydrochemical explanation of the groundwater composition under irrigated land in a Mediterranean environment, Algarve, Portugal. J. Hydrol. 1998, 208, 262–279. [Google Scholar] [CrossRef]
  69. Capaccioni, B.; Didero, M.; Paletta, C.; Didero, L. Saline intrusion and refreshening in a multilayer coastal aquifer in the Catania Plain (Sicily, Southern Italy): Dynamics of degradation processes according to the hydrochemical characteristics of groundwaters. J. Hydrol. 2005, 307, 1–16. [Google Scholar] [CrossRef]
  70. Favreau, G.; Leduc, C.; Marlin, C.; Guéro, A. Une dépression piézométrique naturelle en hausse au Sahel (Sud-Ouest du Niger)A rising piezometric depression in the Sahel (southwestern Niger). C. R. Geosci. 2002, 334, 395–401. [Google Scholar] [CrossRef]
  71. Matsuno, Y.; Nakamura, K.; Masumoto, T.; Matsui, H.; Kato, T.; Sato, Y. Prospects for multifunctionality of paddy rice cultivation in Japan and other countries in monsoon Asia. Paddy Water Environ. 2006, 4, 189–197. [Google Scholar] [CrossRef]
  72. Iwasaki, Y.; Nakamura, K.; Horino, H.; Kawashima, S. Évaluation des facteurs influençant les variations piézométriques en utilisant des simulations des eaux souterraines considérant l’infiltration verticale à partir de rizières associant riz et céréales en rotation au Japon. Hydrogeol. J. 2014, 22, 1841–1855. [Google Scholar] [CrossRef] [Green Version]
  73. Zhang, G.; Feng, G.; Li, X.; Xie, C.; Pi, X. Flood effect on groundwater recharge on a typical silt loam soil. Water 2017, 9, 523. [Google Scholar] [CrossRef] [Green Version]
Figure 1. Location of the Sanon experimental catchment area in central Burkina Faso. (a) Elevation, hydrography, location of observation wells, rain gauges (P1 to P4), and 2D cross-sections of the weathering profile (PSaG and PS1); (b) land cover in the Sanon catchment area [51].
Water 13 03216 g001
Figure 2. The 2D geological model and associated electrical resistivity values (adapted from [37,56]). S1CN, S1CNP, S1, S2, S11, and SaG are observation wells.
Water 13 03216 g002
Figure 3. Evolution of piezometric levels and water flow direction (low and high water) along two transects: (a) north–south transect T1 and (b) west–east transect T2.
Water 13 03216 g003
Figure 4. Temporal evolution of the hydraulic gradients of the Sanon aquifers.
Water 13 03216 g004
Figure 5. Classes of saturated soil hydraulic conductivity Ksat according to the position of the piezometers.
Water 13 03216 g005
Figure 6. Plotting of statistical values of concentration of major ions of water sampled from observation wells during low- and high-water periods Sanon site: (a) raw concentration in mg/L and (b) normalized concentration.
Water 13 03216 g006
Figure 7. Spatial evolution of electrical conductivity and major ions along the two transects: (a) north–south transect and (b) west–east transect.
Water 13 03216 g007
Figure 8. Spatial distribution of conductivity and Na/Cl ratios along the two transects: (a) north–south transect and (b) west–east transect.
Water 13 03216 g008
Figure 9. Spearman’s rho correlation coefficients. Circled values are significant at the 5% level: (a) low water, and (b) high water.
Water 13 03216 g009
Figure 10. Dendrogram of individuals: (a) low water and (b) high water.
Water 13 03216 g010
Figure 11. Principal component analysis (PCA) of groundwater: (a) low water and (b) high water; on the left, the projection of variables on the F1–F2 plane; on the right, the projection of individuals on the F1–F2 plane.
Water 13 03216 g011
Figure 12. Piper diagram: (a) low water and (b) high water.
Water 13 03216 g012
Figure 13. Groundwater hydrographs versus electrical conductivity in relation to rainfall at the northern ridge.
Water 13 03216 g013
Figure 14. Groundwater hydrographs versus electrical conductivity in relation to rainfall at the central valley and toward the outlet.
Water 13 03216 g014
Figure 15. Groundwater hydrographs versus electrical conductivity in relation to rainfall at the southern ridge.
Water 13 03216 g015
Figure 16. Groundwater hydrographs versus electrical conductivity in relation to rainfall at the outlet of the catchment.
Water 13 03216 g016
Table 1. Hydraulic gradients between the aquifers in the central valley where piezometer S1 is located and those at the end of the catchment area (north with S1CN, south with S11, east with SaG, and west with S19).
Pair of Observation WellsHydraulic Gradient (%)
Low WaterHigh Water
S1–S1CN−0.070.70
S1–S110.701.00
S1–SaG0.300.40
S1–S190.300.40
Table 2. Average values of electrical conductivity according to aquifer type.
ParameterAlteritesFractured AquifersAll Aquifers
EC (µS/cm)114.20153.89128.73
Publisher’s Note: MDPI stays neutral with regard to jurisdictional claims in published maps and institutional affiliations.

