Article

Gross Primary Production of Rainfed and Irrigated Potato (Solanum tuberosum L.) in the Colombian Andean Region Using Eddy Covariance Technique

by
Fabio Ernesto Martínez-Maldonado
1,*,
Angela María Castaño-Marín
1,*,
Gerardo Antonio Góez-Vinasco
1 and
Fabio Ricardo Marin
2
1
Corporación Colombiana de Investigación Agropecuaria—Agrosavia, Centro de Investigación Tibaitatá, Km 14 Vía Mosquera, Bogotá 250047, Cundinamarca, Colombia
2
“Luiz de Queiroz” College of Agriculture, University of São Paulo, Piracicaba 13418-900, SP, Brazil
*
Authors to whom correspondence should be addressed.
Water 2021, 13(22), 3223; https://doi.org/10.3390/w13223223
Submission received: 13 October 2021 / Revised: 4 November 2021 / Accepted: 5 November 2021 / Published: 13 November 2021
(This article belongs to the Section Water, Agriculture and Aquaculture)

Abstract

:
Potato farming is relevant for global carbon balances and greenhouse emissions, of which gross primary productivity (GPP) is one of the main drivers. In this study, the net carbon ecosystem exchange (NEE) was measured using the Eddy Covariance (EC) method in two potato crops, one of them with an irrigation system, the other under rainfed conditions. Accurate NEE partition into GPP and ecosystem respiration (RECO) was carried out by fitting a light response curve. Direct measurements of dry weight and leaf area were performed from sowing to the end of canopy life cycle and tuber bulking. Agricultural drought in the rainfed crop resulted in limited GPP rate, low leaf area index (LAI), and low canopy carbon assimilation response to the photosynthetically active radiation (PAR). Hence, in this crop, there was lower efficiency in tuber biomass gain and NEE sum indicated net carbon emissions to atmosphere (NEE = 154.7 g C m−2 ± 30.21). In contrast, the irrigated crop showed higher GPP rate and acted as a carbon sink (NEE = −366.6 g C m−2 ± 50.30). Our results show, the environmental and productive benefits of potato crops grown under optimal water supply.

1. Introduction

According to Agrimonde (Scenarios and Challenges for Feeding the World in 2050), the increasing rate of agricultural production will be considerably lower than in previous decades, with an estimate of 1.15% per year for the 2003–2050 period [1]. Hence, more than 9000 million people will have to be fed in 2050 [2]; to meet the demand for food in 2050, agriculture will have to produce almost 70% more [3]. Potato crops have been increasing their production since 2012, more in the developing world than in developed countries [4]. The environmental cost to achieve this purpose could be very high, considering that agriculture is a major contributor to global greenhouse gas (GHG) emissions [5]. However, agriculture also represents a carbon sink, capturing atmospheric carbon dioxide (CO2) into the biomass and soil. [6] This is the paradox of agriculture, from the point of view of climate change, which can contribute to both climate change and its mitigation. In terms of mitigation, a key ecosystem process to decrease the atmospheric CO2 is to remove it from the atmosphere by increasing the vegetation carbon sequestration or uptake [7] during photosynthesis, as gross primary productivity (GPP). However, GPP can greatly vary across biomes, as it is strongly influenced by multiple meteorological drivers [8]. In optimal water availability conditions, the photosynthetic photon flux density (PPFD) is the main factor driving GPP [9]. However, under water-limited conditions, Soil Water Content (SWC) deficit leads to a depression of the rate of carbon uptake [10], hence, reductions in GPP. Under water-limited conditions, an SWC increase could increase GPP, indicating that irrigated agriculture has a potential role as a carbon sink [9]. Irrigation systems could slow down the return of stored carbon as CO2 via respiration and improve the photosynthetic input of carbon [11]. However, about 82% of the total agricultural land in the world is under rainfed agricultural systems [12], and potato crop fields are no exception. In Colombia (2019), 78% of the total area potato production had no irrigation. These differences in crop water management might imply differences in GPP and CO2 sink potential that are currently unknown.
Several methods have been used to estimate GPP, using an extrapolating chamber and biometric measurements [13], also canopy process modeling [14]. However, the eddy covariance (EC) technique has been recognized as the most efficient method for measuring fluxes of energy, CO2, other GHG gases, and water between the terrestrial biosphere and the atmosphere, on an ecological scale [15], and at the whole production system level. Previous potato GPP estimations using the EC method in non-tropical conditions have reported high carbon uptake of potatoes and relatively larger magnitudes of GPP than other crop sites [16]. However, there is a lack of detailed information about carbon balances and key factors that control GPP related to water availability and management. Additionally, the available studies were carried out in non-tropical conditions, which may imply different biophysical and eco-physiological responses of the growing agroecosystems to climate drivers.
Potato is an important agroecosystem for worldwide carbon and GHG balances due to its sizeable cultivated area (more than 19 million hectares) [17] and its extraordinary adaptive range. In Colombia and the world, potato is the primary source of income of thousands of small-scale producers and the most crucial staple food, playing a significant role in the maintenance of food security and nutritional status [18].
This study reports CO2 fluxes and GPP determinations from rainfed and irrigated potato fields in Cundinamarca, Colombia. We hypothesized that the GPP responses are largely determined by the soil water content (SWC) as a direct consequence of irrigation practices. The following questions are addressed in this study: (1) What are the differences in GPP between rainfed and irrigated systems, and how do they impact the NEE? (2) How are the differences in GPP related to differences in crop growth between the two potato production systems?

2. Materials and Methods

2.1. Site Description and Crop Management

The study was carried out in two sites of the Colombian Andean region, in the western Savanna province of the department of Cundinamarca. The evaluation of the potato rainfed production system (hereinafter Rainfed) was carried out in a 6 hectares (ha) commercial plot (4.87033° N, −74.1294° W; ~2572 m above sea level). The potato irrigated production system (hereinafter Irrigated) was evaluated in a 3.11 ha commercial lot, under a fixed-sprinkler irrigation system (4.888668° N, −74.18668° W; ~2609 m above sea level). Both potato (Solanum tuberosum L.) production systems used the Diacol Capiro variety. The sowing date for Rainfed was 1 August 2020, and the sowing date for Irrigated was 22 January 2021. The plant density was 33,333 pl ha−1 for both production systems. The two sites are located over a fluvio-lacustrine plain with a flat landscape, an average annual temperature of 12–14 °C, and annual precipitation between the 800–1000 mm bimodally distributed. The June–August and December–February periods have the lowest rainfall, due to the double passage of the Intertropical Convergence Zone (ITCZ). The soil of the two production systems is deep and well-drained, with the presence of volcanic ash corresponding to the Andisol order [19]. Potato cultivation can be established at any time of the year due to Colombia’s climate offer due to its geographical location. Common practices include sowing vegetative or asexual seeds, foliar and soil fertilization, weed control, hilling (earthing up), insecticide, and fungicide treatment, haulm cutting, chemical dehaulming, and harvesting.

2.2. Microclimate and Eddy Covariance (EC) Measurements

Net carbon exchange and microclimatic variables were continuously recorded using an Eddy Covariance (EC) tower. In Rainfed, the EC station was installed on 13 August 2020, 12 days post-planting (DPP), while in Irrigated, the EC station was installed on 3 February 2021 (12 DPP). The EC measurements for Rainfed went until the end of the canopy life cycle, 22 November 2020 (113 DPP). The EC measurements for Irrigated went until the end of the canopy life cycle, 9 June 2021 (138 DPP).
The EC tower included an IRGASON with an open-path gas analyzer (EC 150, Campbell Scientific, Inc., Logan, UT, USA) and a 3D sonic anemometer (CSAT3A, Campbell Scientific, Inc., Logan, UT, USA), both are operated by a separated electronic module (EC100, Campbell Scientific, Inc., Logan, UT, USA). Raw data was recorded at a 10 Hz sampling frequency using a high-performance datalogger (CR1000X, Campbell Scientific, Inc., Logan, UT, USA). The tower height for both locations was calculated according to the equation hEC = Zd + 4 (hc − Zd) [20]; where, hEC = EC installation height, Zd = zero plane displacement (0.63 m) and hc = average height of the crop (0.9 m). The IRGASON was placed at a 1.7 m height. The IRGASON azimuth was 45° for Rainfed and 175° for Irrigated, corresponding to the prevailing wind directions recorded by the sonic anemometer, three weeks before starting evaluations.
The following sensors were also installed: a Net Radiometer, to measure the incoming and outgoing short-wave and long-wave radiation (Rn), NR-LITE2 (Kipp & Zonen B.V., Delft, The Netherlands) at a height of 2 m, three sensors for the measurement of photosynthetically active radiation (PAR) (CS310, Apogee Instruments, Inc., Logan, UT, USA) positioned at a height of 0.5, 1, and 2.2 m; a pyranometer sensor (CS301, Apogee Instruments, Inc., Logan, UT, USA) at a height of 2 m that measures the total incident radiation; two temperature (Tair) and a relative humidity air sensor (HR) installed at a height of 1 and 2 m, respectively (HygroVUE™ 10, Campbell Scientific, Inc., Logan, UT, USA); two multiparameter smart sensors (CS655, Campbell Scientific, Inc., Logan, UT, USA) installed at a depth of 9 cm and 15 cm to monitor soil volumetric water content (SWC), bulk electrical conductivity, and soil temperature, and four type E thermocouples (TCAV-Averaging Soil Thermocouple Probe, Campbell Scientific, Inc., Logan, UT, USA). Soil heat flux density, G (W m−2), was obtained using the average value between the measurements of two HFP01 sensors (Hukseflux Thermal Sensors B.V., Delftechpark, Delft, The Netherlands), installed 88 cm apart at a depth of 8 cm. Climatic data were recorded every 5 min and averages were integrated on a half-hourly basis. Precipitation data were collected every day using a rain gauge connected to a datalogger (Oregon Scientific, Inc., Tualatin, OR USA) at the height of 2 m.

2.3. Biometric Measurements

The sampling of plants using sequential harvesting was performed after sowing, during the crop growth, every eleven or twelve days. Ten randomly selected plants were uprooted for growth analysis after 25, 37, 47, 54, 65, 75, 85, 98, 105, and 116 DPP in Rainfed; and 33, 46, 57, 70, 80, 96, 110, 122, 135, and 152 DPP in Irrigated. The total leaf area and fresh weight of each sample were measured. Plant material was placed in paper bags and dried in a forced-air drying oven to constant weight at 70 °C. Total dry weight (DW) and tubers dry weight (TDW) were fitted to the logistic growth model, as follows:
D W t = a 1 1 + b 1 e c 1 t   ,   T D W t = a 2 1 + b 2 e c 2 t
where a 1 ,   b 1 ,     c 1 are the model parameters for DW, a 2 ,   b 2 ,   c 2 are the model parameters for TDW, and t is DPP.
The leaf area index (LAI) and the absolute growth rate (AGR) were calculated as indicated in [21]. Leaf area duration (LAD) for each growth stage was calculated by integration of individual LAD values obtained, as follows:
L A D = L A I i + 1 + L A I i 2   t i + 1 t i

2.4. Data Processing and Quality Control

Raw data time series were recorded at 10 Hz, as well as corrected fluxes of CO2. Latent heat and sensible heat were calculated on a half-hourly basis, using the EasyFlux® CRBasic software (Campbell Scientific, Inc., Logan, UT, USA), installed in the CR1000X datalogger. The corrections and procedures applied to the data were despike, filter high-frequency time series data, coordinate rotation using planar fit method [22], frequency corrections using co-spectra [23], correction for air density fluctuations using [24], data quality classifications (QC) [20], and calculation of footprint characteristics [25,26].
Further postprocessing of fluxes included fetch filter (removing records in which fetch 90 was larger than the upwind distance from the tower to the edge of the area of study), outlier detection and removal was done using the MAD method [27], and a QC filter, where only the records with QC < 6 were kept [20].

2.5. Gap-Filling Methods

After applying the data filters, the diurnal gaps accounted for 35% of Rainfed and 54% of Irrigated. The gap-filling for both EC and meteorological data was performed in R [28], according to the algorithm described in [29], considering the covariation of the fluxes with the meteorological variables and their temporal autocorrelations.

2.6. NEE Partitioning

Negative values represent fluxes from the atmosphere to the surface, while positive values represent fluxes moving from the surface to the atmosphere. Therefore, the ecosystem respiration (RECO) is defined as a positive value, while the gross primary production (GPP) is defined as a negative value. Nighttime values of NEE are equal to RECO due to the absence of photosynthetic activity at night, while diurnal NEE is the algebraic sum of GPP and RECO. The non-linear Mitscherlich light-response function (Equation (3)) parametrized NEE against the photosynthetically active radiation PAR and was the method used to partition diurnal NEE (Global radiation > 1 W m−2) into RECO and GPP [30,31].
N E E = F c s a t + R d × 1 e × P A R i n c F c s a t + R d + R d
where Fcsat is the CO2 uptake at light saturation (µmol CO2 m−2 s−1), Rd is the respiration term, and α is the quantum efficiency (µmol CO2 µmol−1 photons) or the initial slope of the light response curve. At each day, a set of parameters was calculated using non-linear regression on a subset of NEE and PARinc data within a moving window of 15 days centered on each day. Then, for each diurnal half an hour of the same day, the GPP was estimated by subtracting Rd from the non-linear Mitscherlich light-response function, and RECO was calculated by subtracting the estimated GPP from the measured NEE.

2.7. Uncertainty and Statistical Analysis

The uncertainty associated to random sampling errors and gap-filling procedures was determined using a Monte Carlo simulation with 100 iterations [32]. For each iteration, the starting point was the gap-free dataset in which gaps were randomly inserted in the same proportion as the original data. Random noise was added to the remaining data, simulating random error, which is known to follow a double exponential distribution with parameter σ δ depending on the magnitude of NEE (Equation (4)) [33].
σ δ = 0.62 + 0.63 N E E ,   N E E > 0 1.42 0.19 N E E ,   N E E < 0
Each of the datasets with synthetic gaps and noise was passed through the gap-filling and NEE partition procedures described above, and sums of gap-filled NEE, GPP, and RECO were calculated. Then, uncertainty for each half-hourly flux was calculated as the confidence interval for the mean of the 100 obtained values. The mean of the 100 sums of each flux was obtained, and cumulative uncertainty was determined as the confidence interval of the sums of NEE, GPP, and RECO, with α = 0.05.

2.8. Energy Balance Closure

The plausibility of EC flux data was evaluated through the energy balance closure. Under ideal conditions, according to the first thermodynamics law, the sum of all energy fluxes is zero. Therefore, the energy balance for the studied systems is given by:
H + λ E = R n G G s
where H is the sensible heat flux, λE is the latent heat flux, both of which were most directly measured using the eddy covariance (EC) technique, G is the soil heat flux at the surface, and Gs is the soil energy storage term. G and Gs were quantified by two heat-flux plates: soil temperature and soil water content sensors installed at a depth of 0–20 cm [34,35]. Daily sums of H, λE, G and Gs were calculated, Band a linear regression model was parametrized as follow:
H d + λ E d = β 0 + β 1 R n d G d G s d
where d subscript indicates daily flux sum, β0 is the intercept, and β1 is the slope representing the magnitude of the balance closure.

3. Results

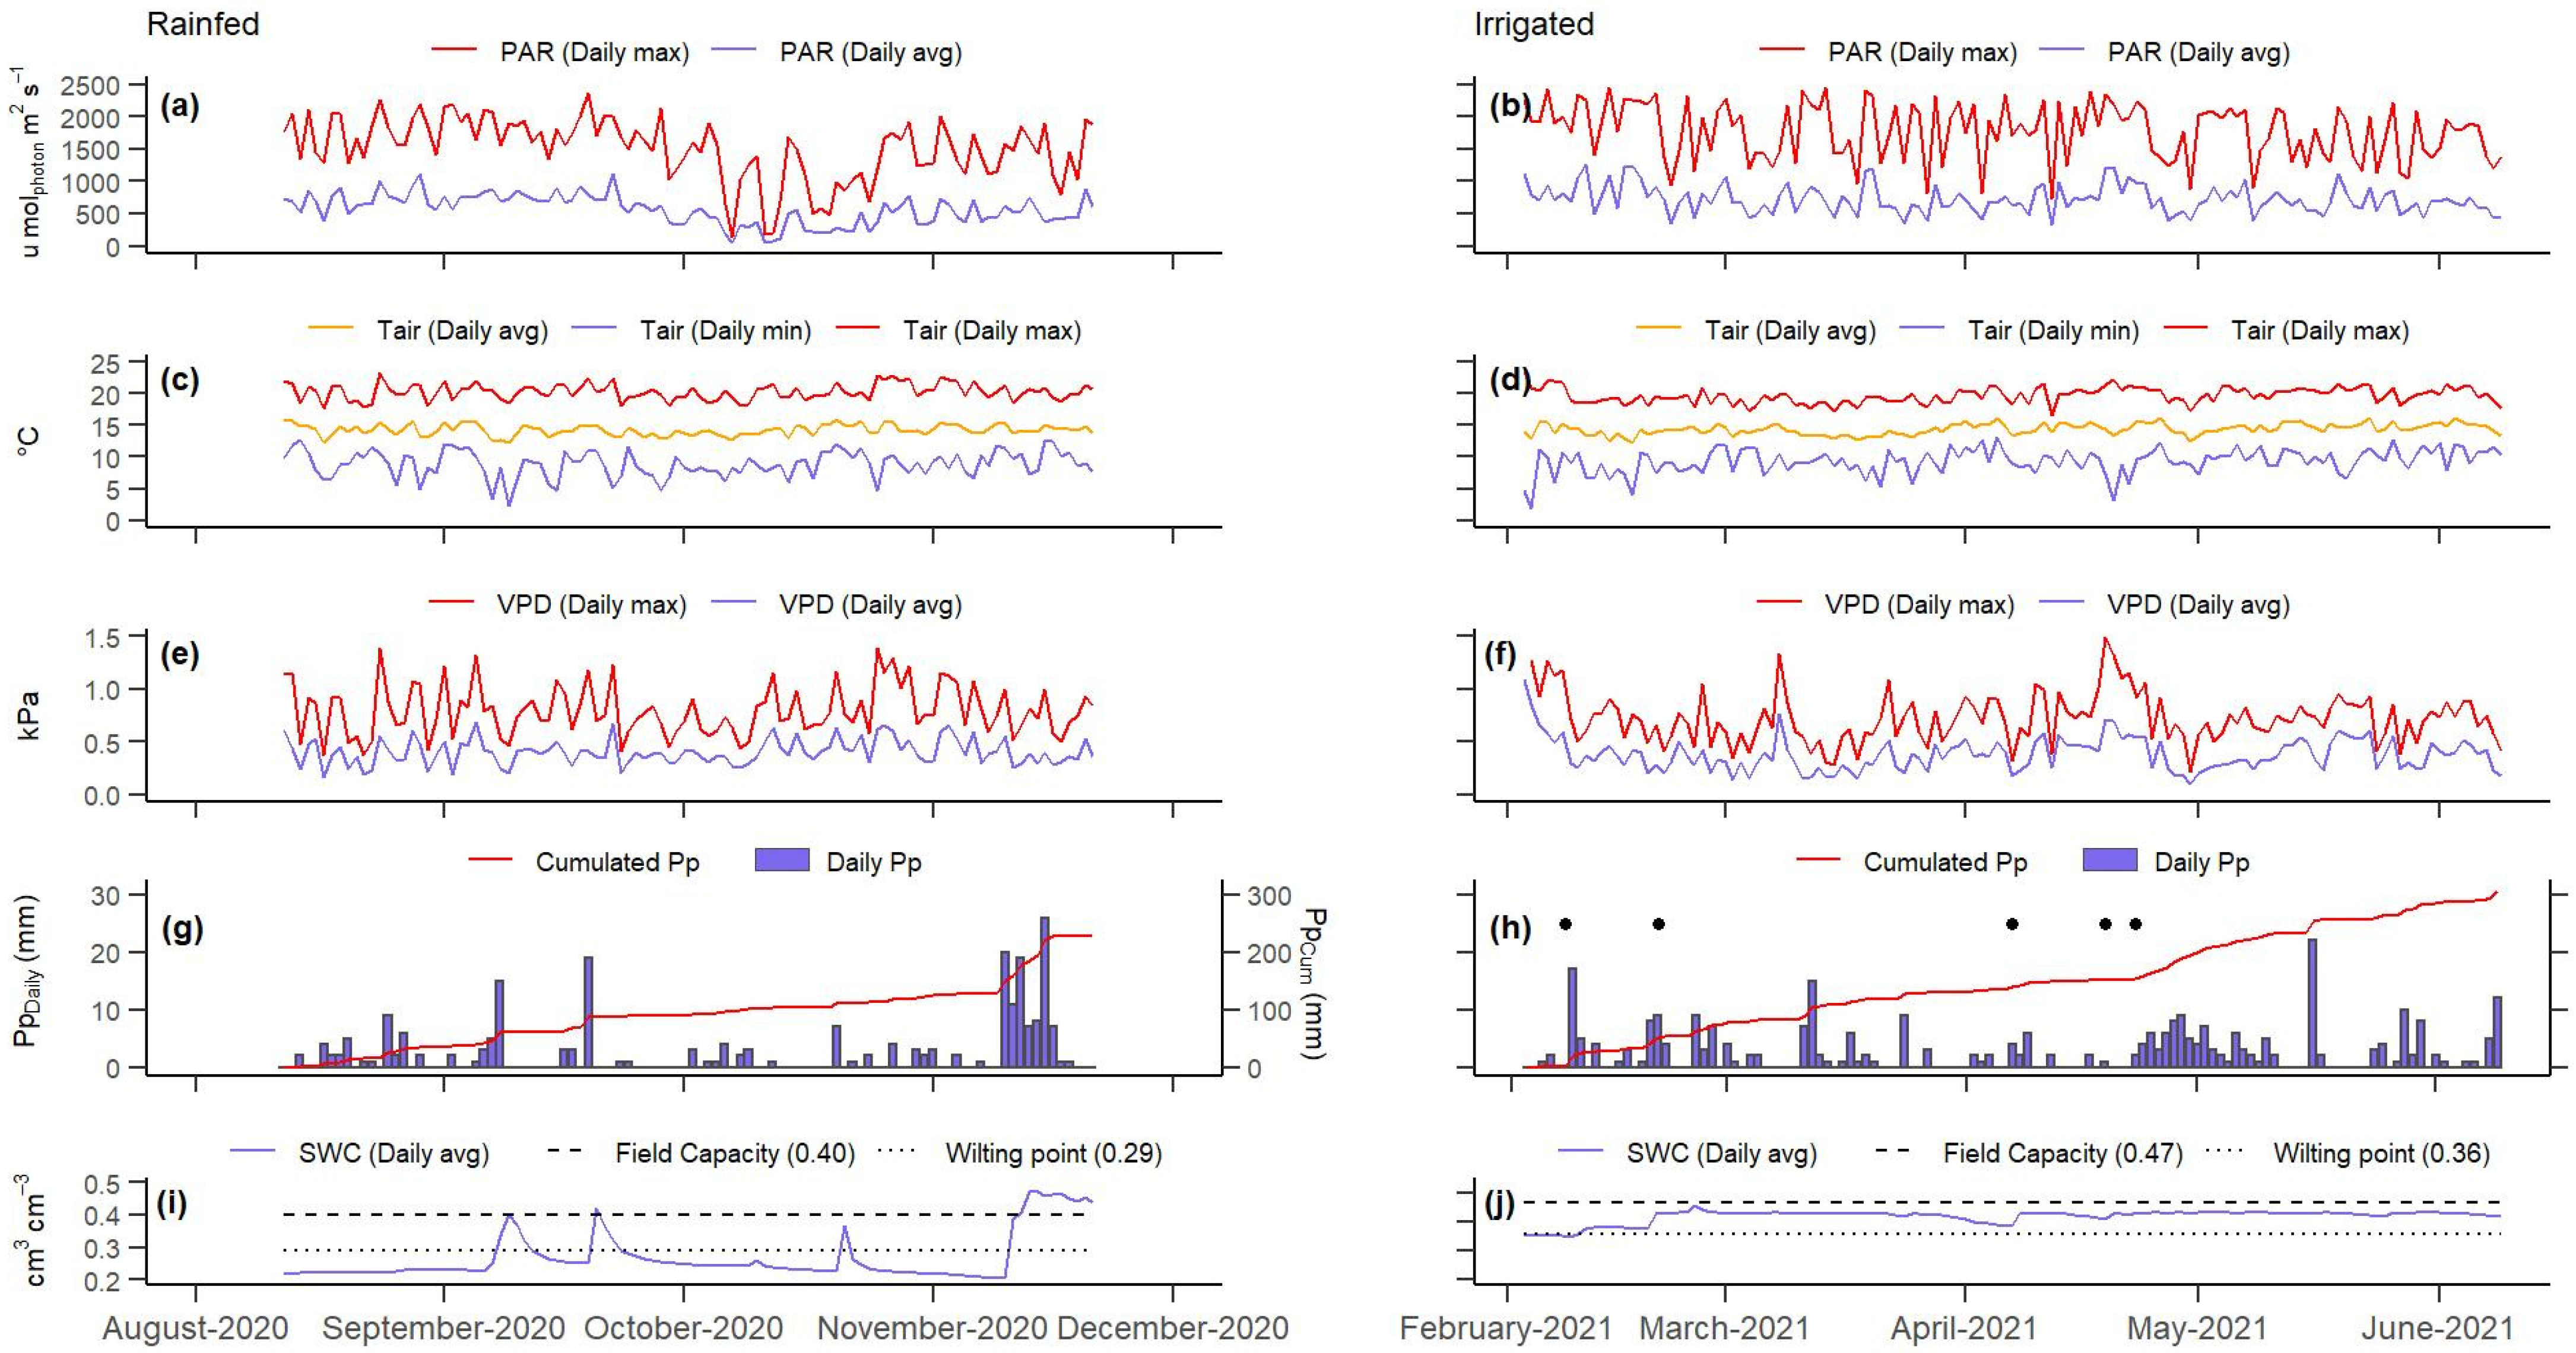
3.1. Meteorological Conditions

Figure 1 shows microclimate behavior for Rainfed and Irrigated. PAR was observed on both sites mainly as diffuse radiation, which was evident because of variations over time. This is typical for the study area, characterized by high cloud cover. The average of daily mean PAR was significantly higher (p < 0.05) in Irrigated (724.5 ± 216.7 µmol photons m−2 s−1) compared to Rainfed (567.9 ± 230.7 µmol photons m−2 s−1). Nevertheless, the average daily mean (Tmean) and the maximum air temperature (Tmax) were higher in Rainfed (Tmean: 16.80 °C ± 0.92, Tmax: 20.32 °C ± 1.29) than in Irrigated (Tmean: 16.51 °C ± 1.02, Tmax: 19.73 °C ± 1.23). The average daily maximum vapor pressure deficit (DPV) was higher in Rainfed (0.80 KPa ± 0.24) compared to Irrigated (0.73 KPa ± 0.25), while the average daily mean DPV did not show a significant difference in Rainfed (0.40 KPa ± 0.12) and Irrigated (0.38 KPa ± 0.16).
Low water availability in Rainfed (SWC < WP) was the determinant for solar radiation to be directed more for air heating than evapotranspiration [34]. The accumulated precipitation for Rainfed was 229 mm, with a non-uniform time distribution, including events of consecutive dry days and high precipitations, observed by the end of the crop cycle, reaching 98 mm in one week (101 to 107 DPP). The accumulated precipitation for Irrigated (306 mm) was higher and more uniformly distributed, however, a drier lapse occurred, from 13 March to 22 April 2021 (50–90 DPP). The decision to irrigate the crop was made after identifying soil water deficit using a water balance calculated according to FAO-56 [36] and monitoring the soil tensiometers installed inside each plot.

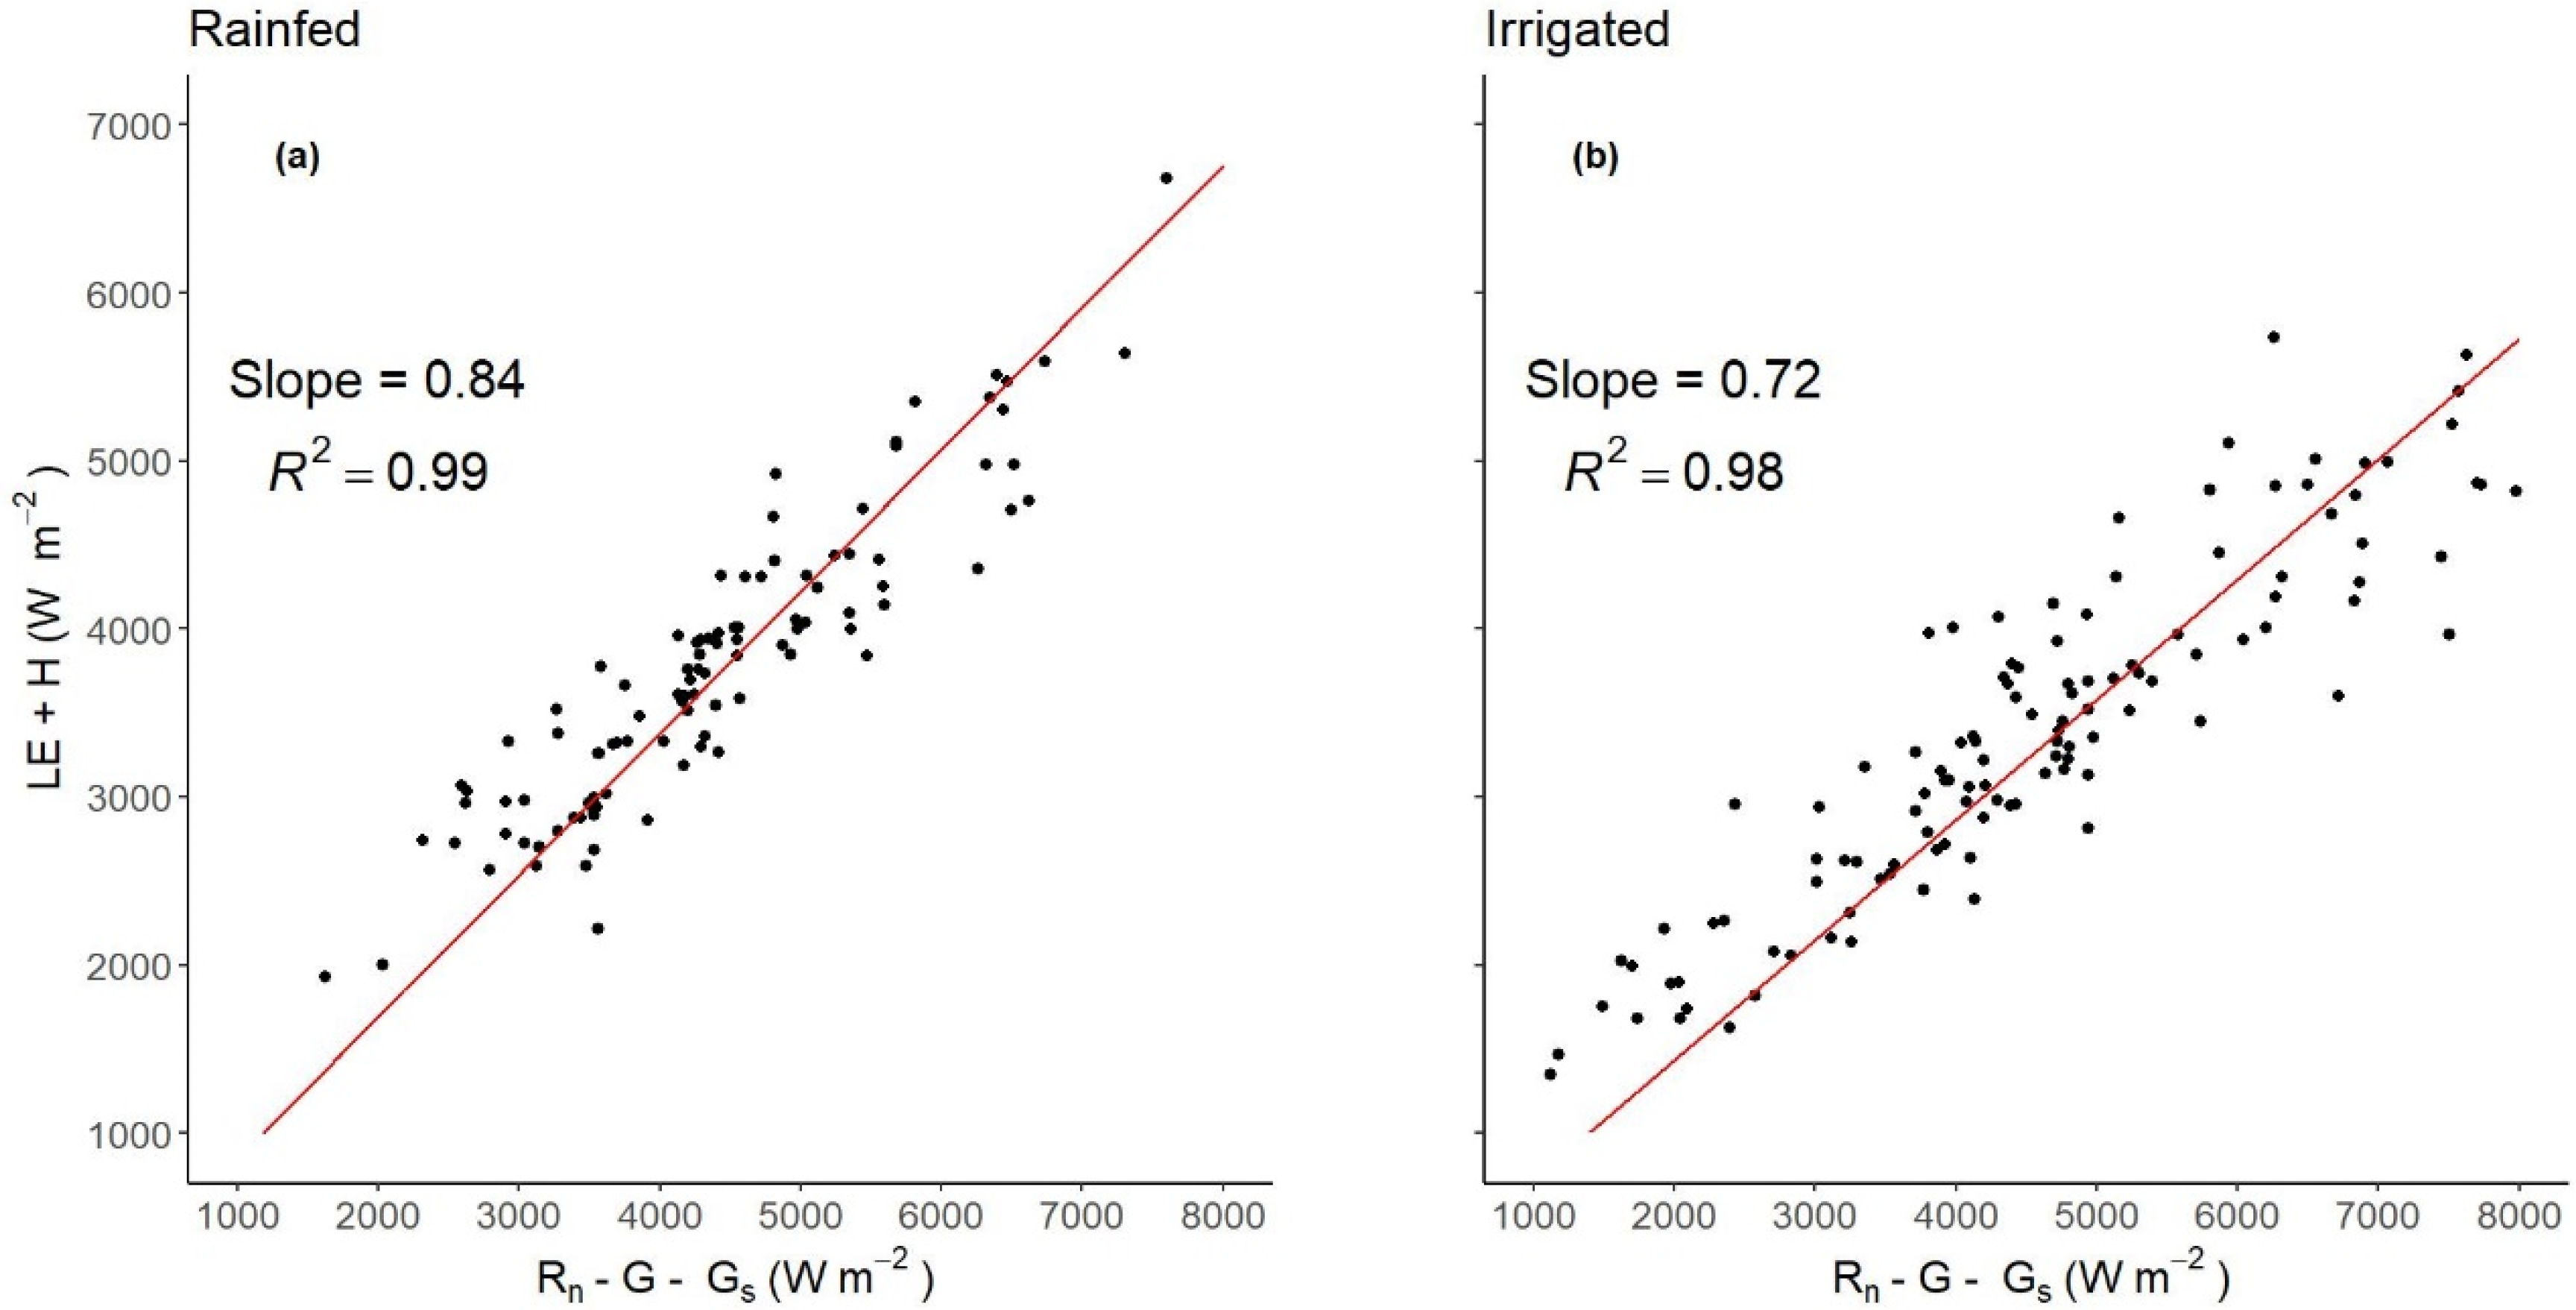
3.2. Energy Balance Closure and Uncertainty

The slope of the regression between the energy fluxes (H + LE) and the available energy (Rn-G-Gs) (Figure 2) indicates an energy balance closure of 0.84 for Rainfed and 0.72 for Irrigated. These values are consistent with several studies made more than two decades ago, which concluded that the range of suitable ratios of the linear regression slope lies between 0.7 and 1 [37,38,39]. In this study, the imbalance may be mainly attributed to nighttime low turbulence conditions, as has been found in previous studies [37,39].

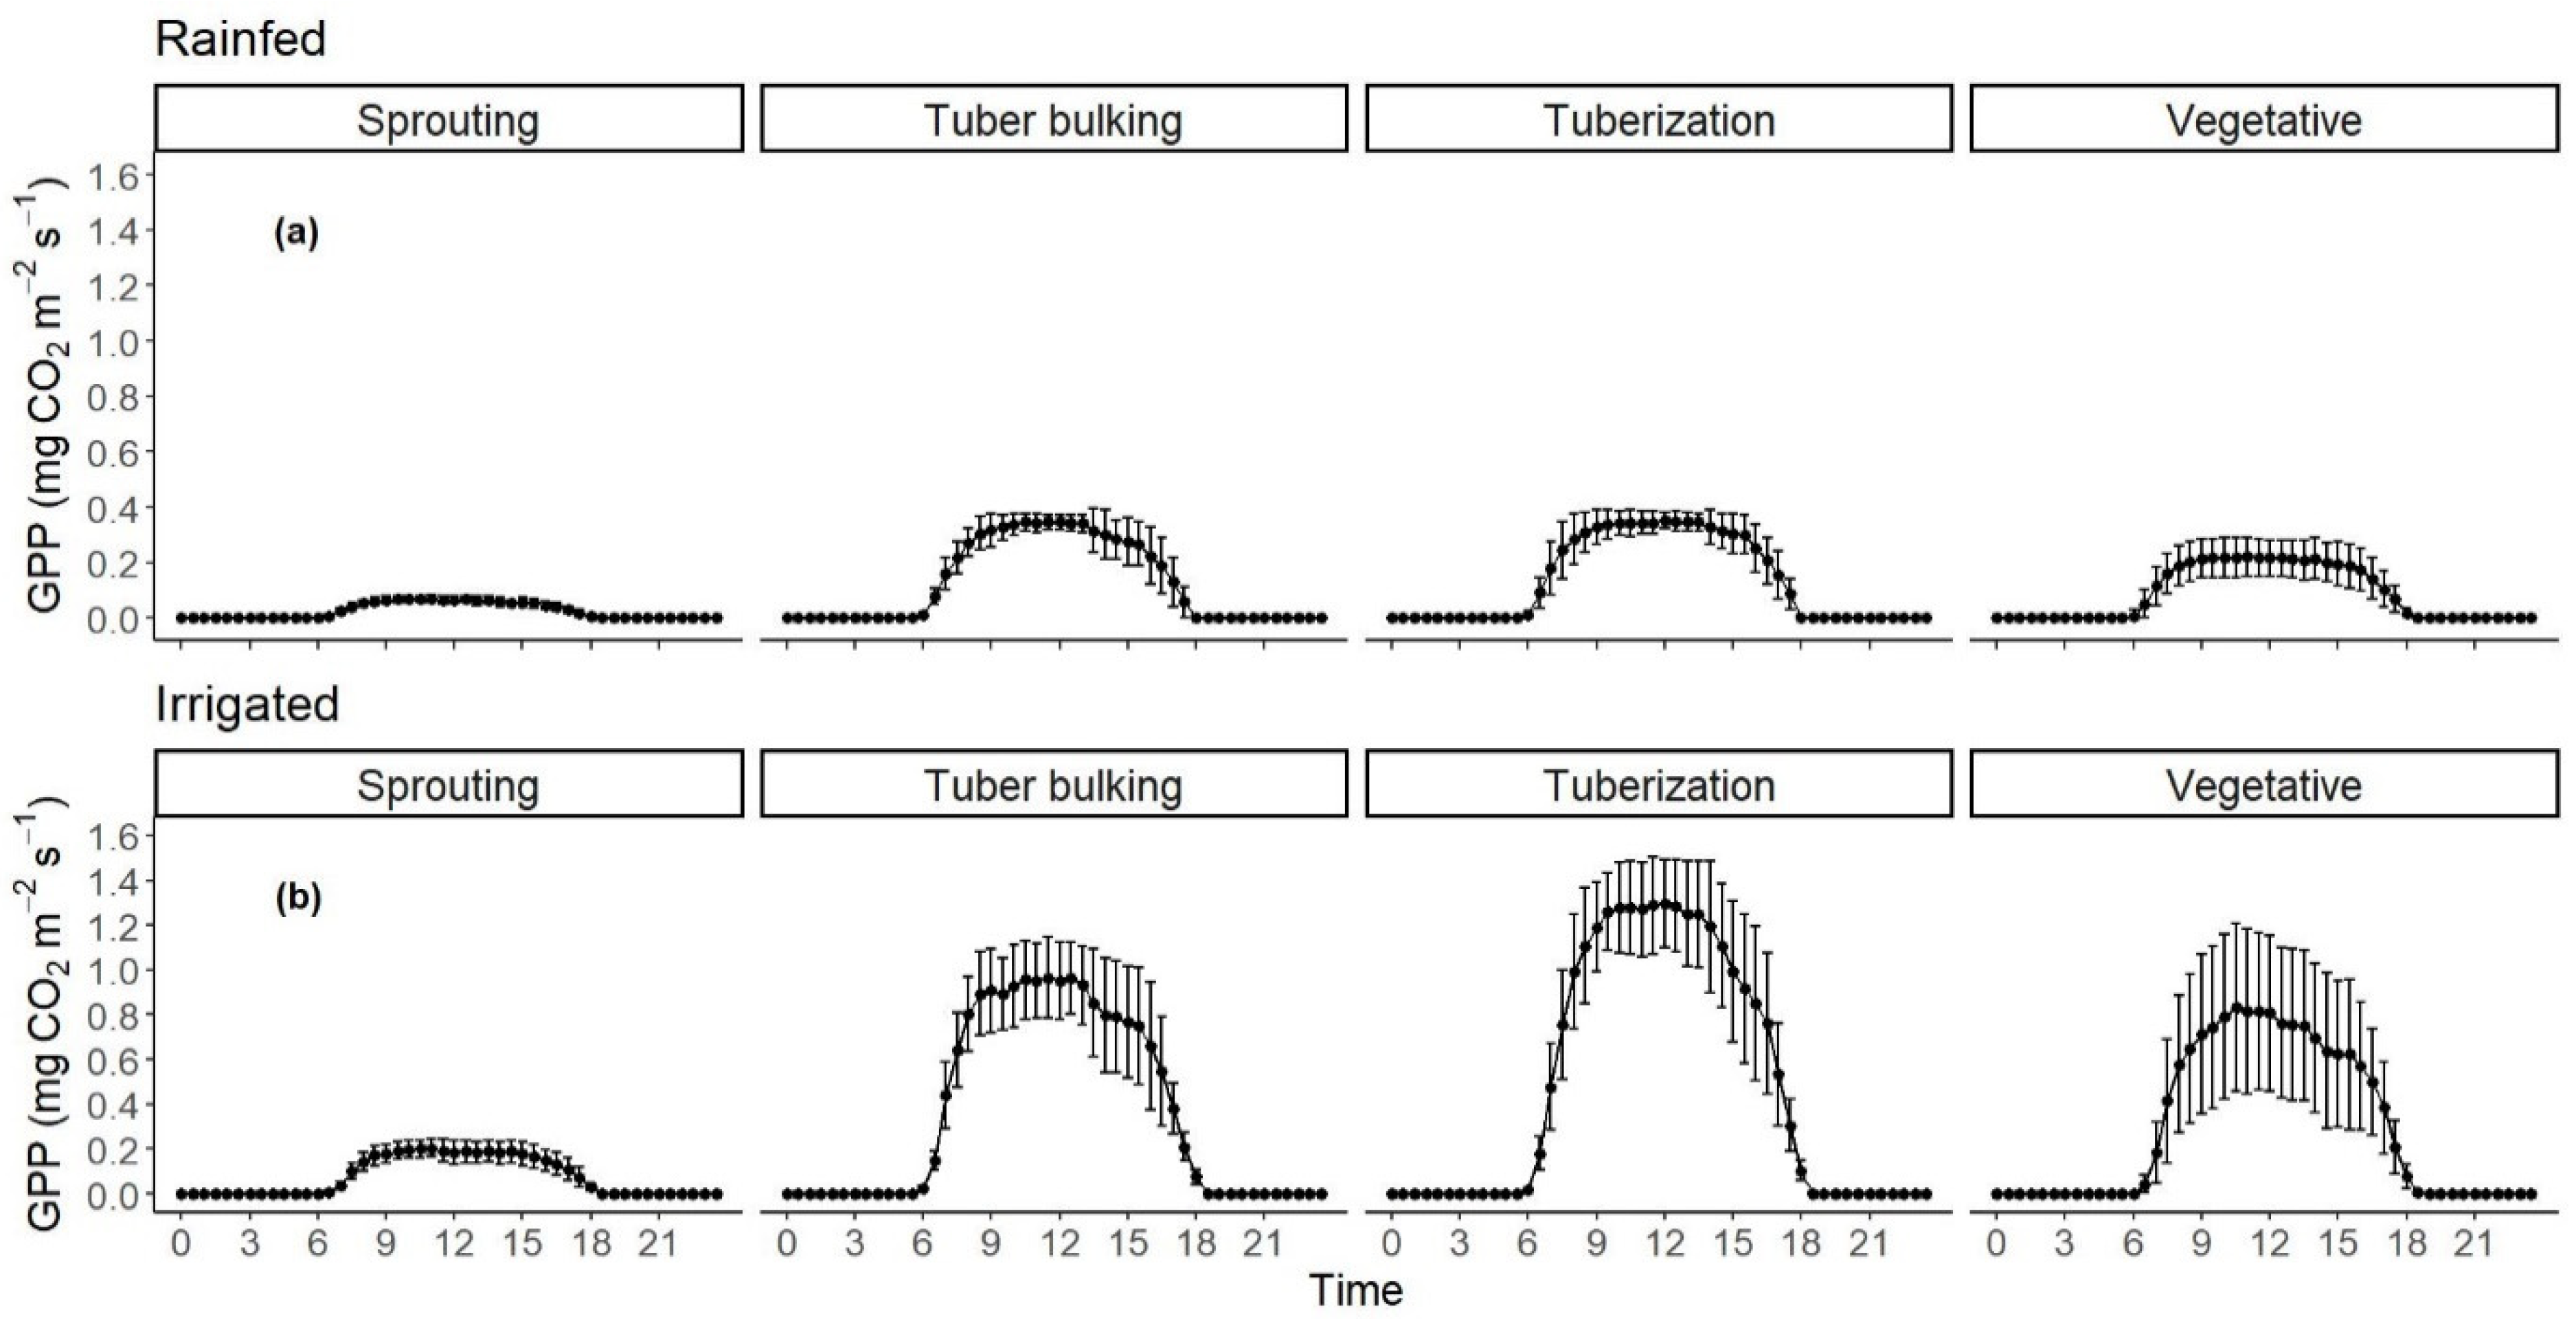
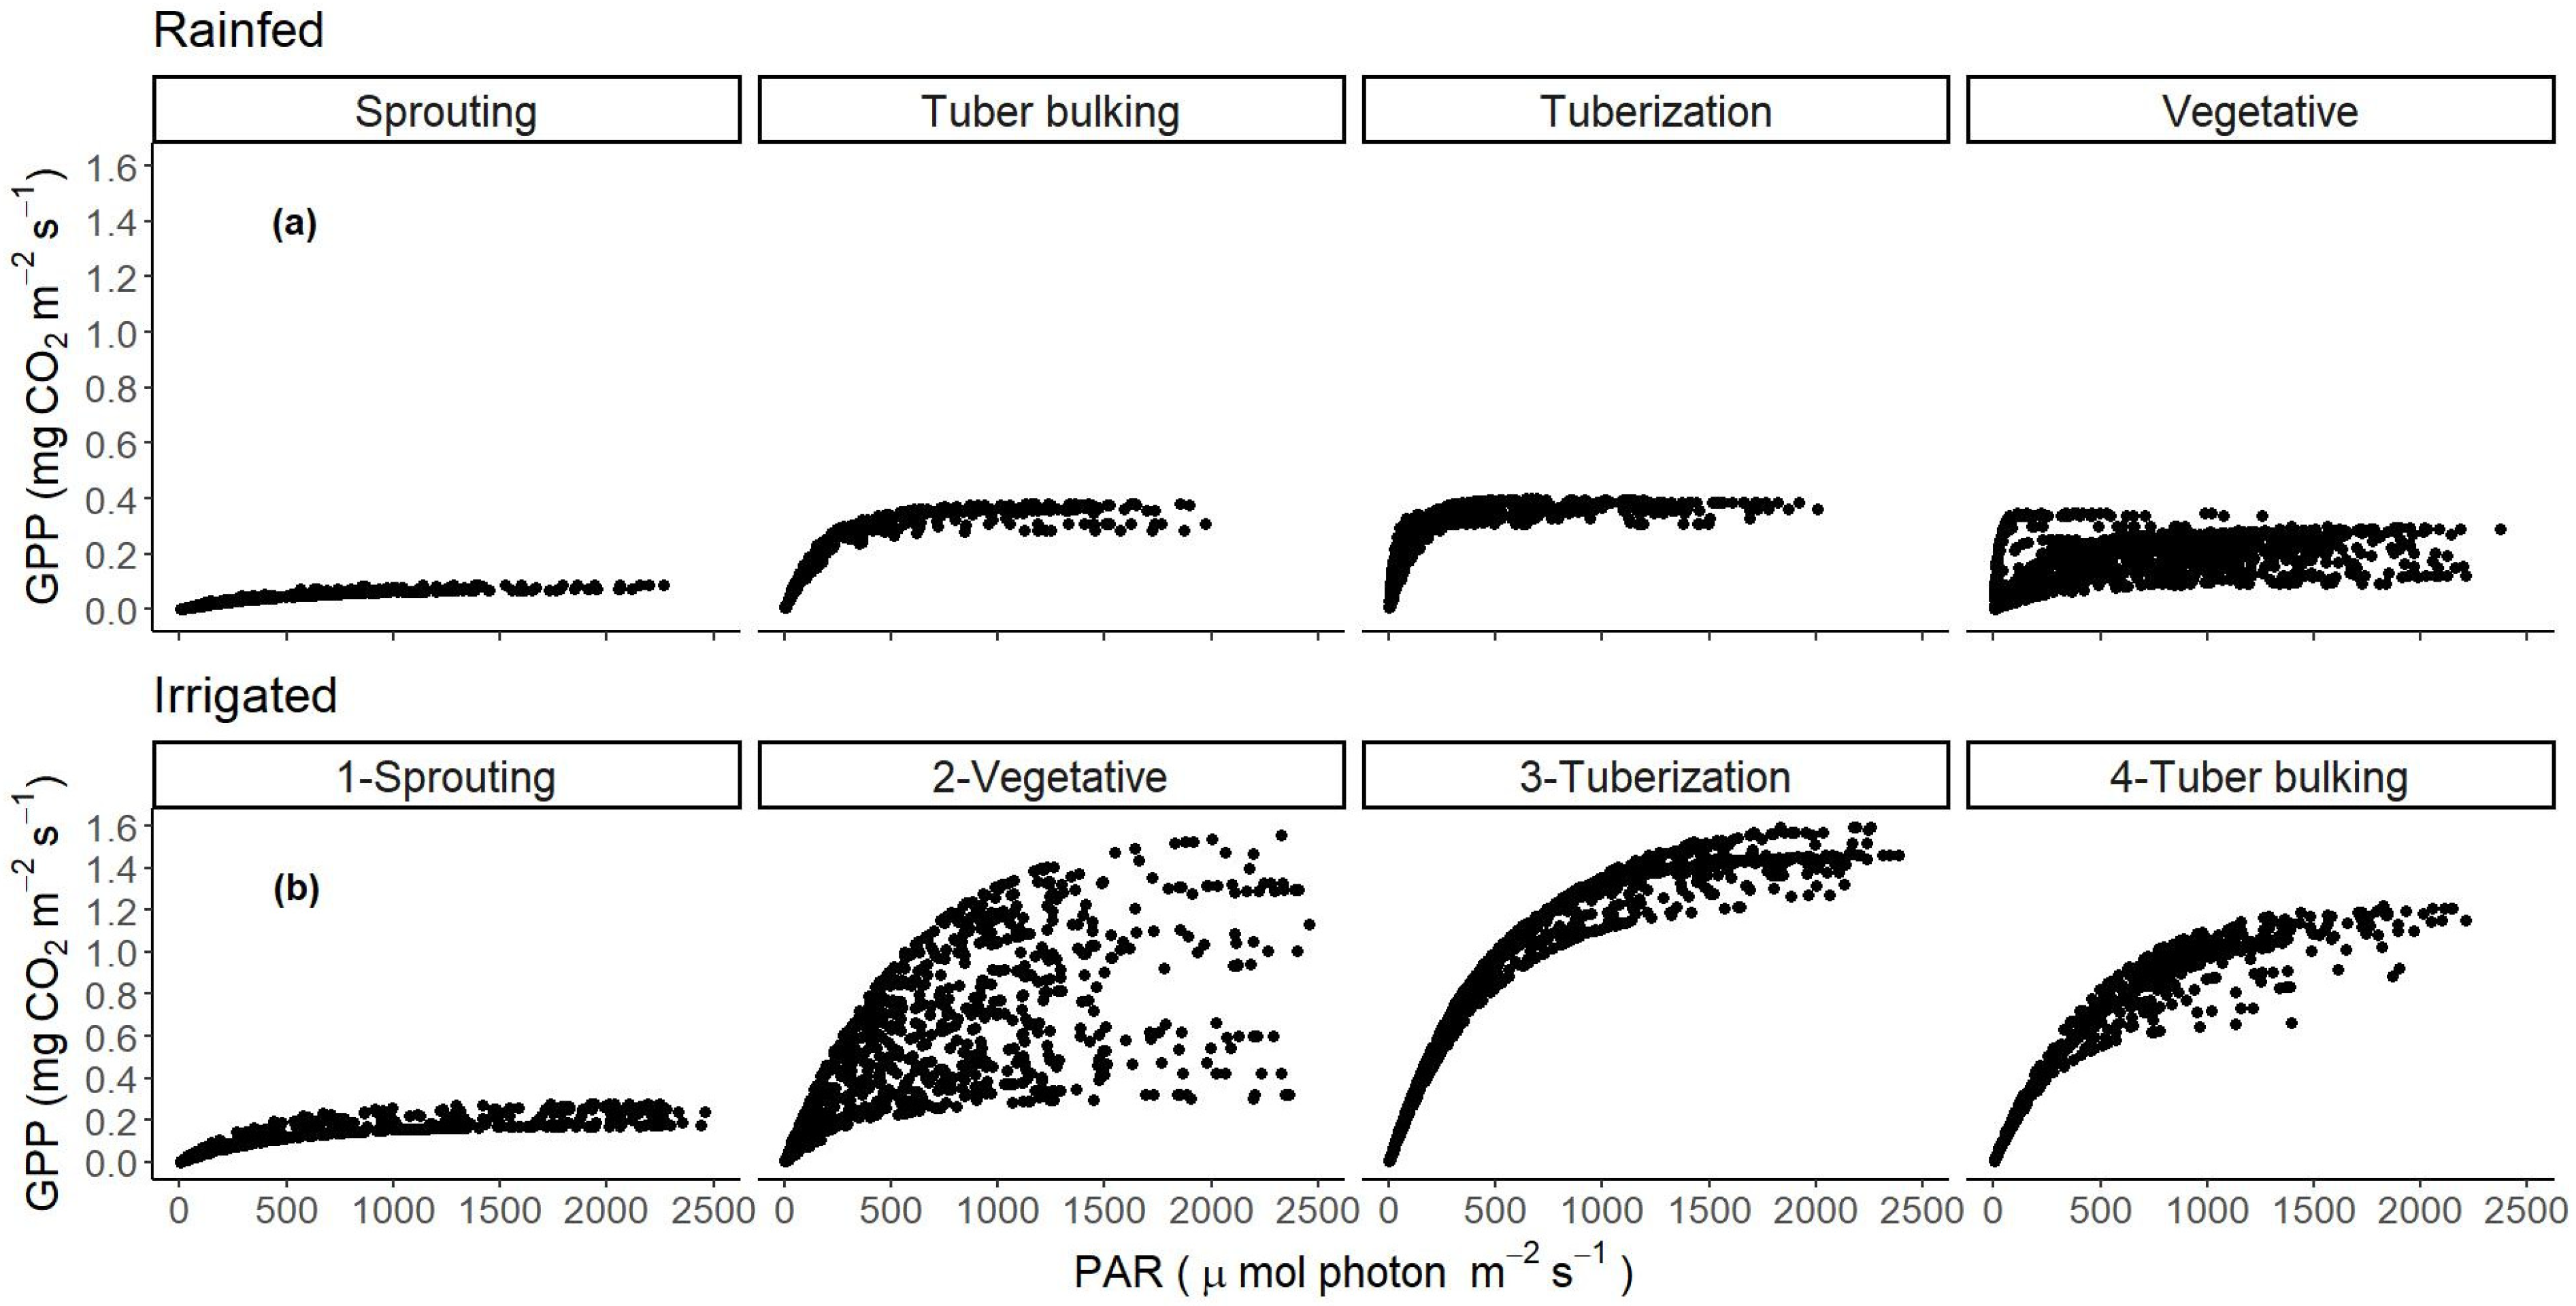
3.3. Carbon Fluxes, Daily Averages, Maximums, and Sums of NEE, GPP, and RECO in the Different Growth Stages for Non-Irrigated and Irrigated Crops

Table 1 shows the behavior of fluxes throughout the growth stages. In Rainfed, the sum of NEE from sowing to tuber bulking had a positive value, indicating CO2 emissions to the atmosphere (154.7 g C m−2 ± 30.21). In contrast, Irrigated behaved as a CO2 sink (sum of NEE = −366.6 g C m−2 ± 50.30). In Rainfed, the daily NEE average was negative and close to zero during the tuberization stage (−0.03 g C m−2 d−1 ± 0.29). Irrigated had negative NEE daily means and sums in all stages, except during sprouting, which can be explained by the absence of aerial biomass in potato plants.
In general, the highest values for each flux were found during the tuberization stage on both crops. Nevertheless, in Rainfed, the highest RECO was observed during the vegetative stage. GPP in Irrigated (−1043.6 g C m−2 d−1 ± 23.96) was 4.37 times higher than in Rainfed (−239.9 g C m−2 d−1 ± 5.33), and RECO was 1.71 times higher in Irrigated than in Rainfed, due to the larger amount of respiration contributed by the higher aerial biomass in Irrigated.

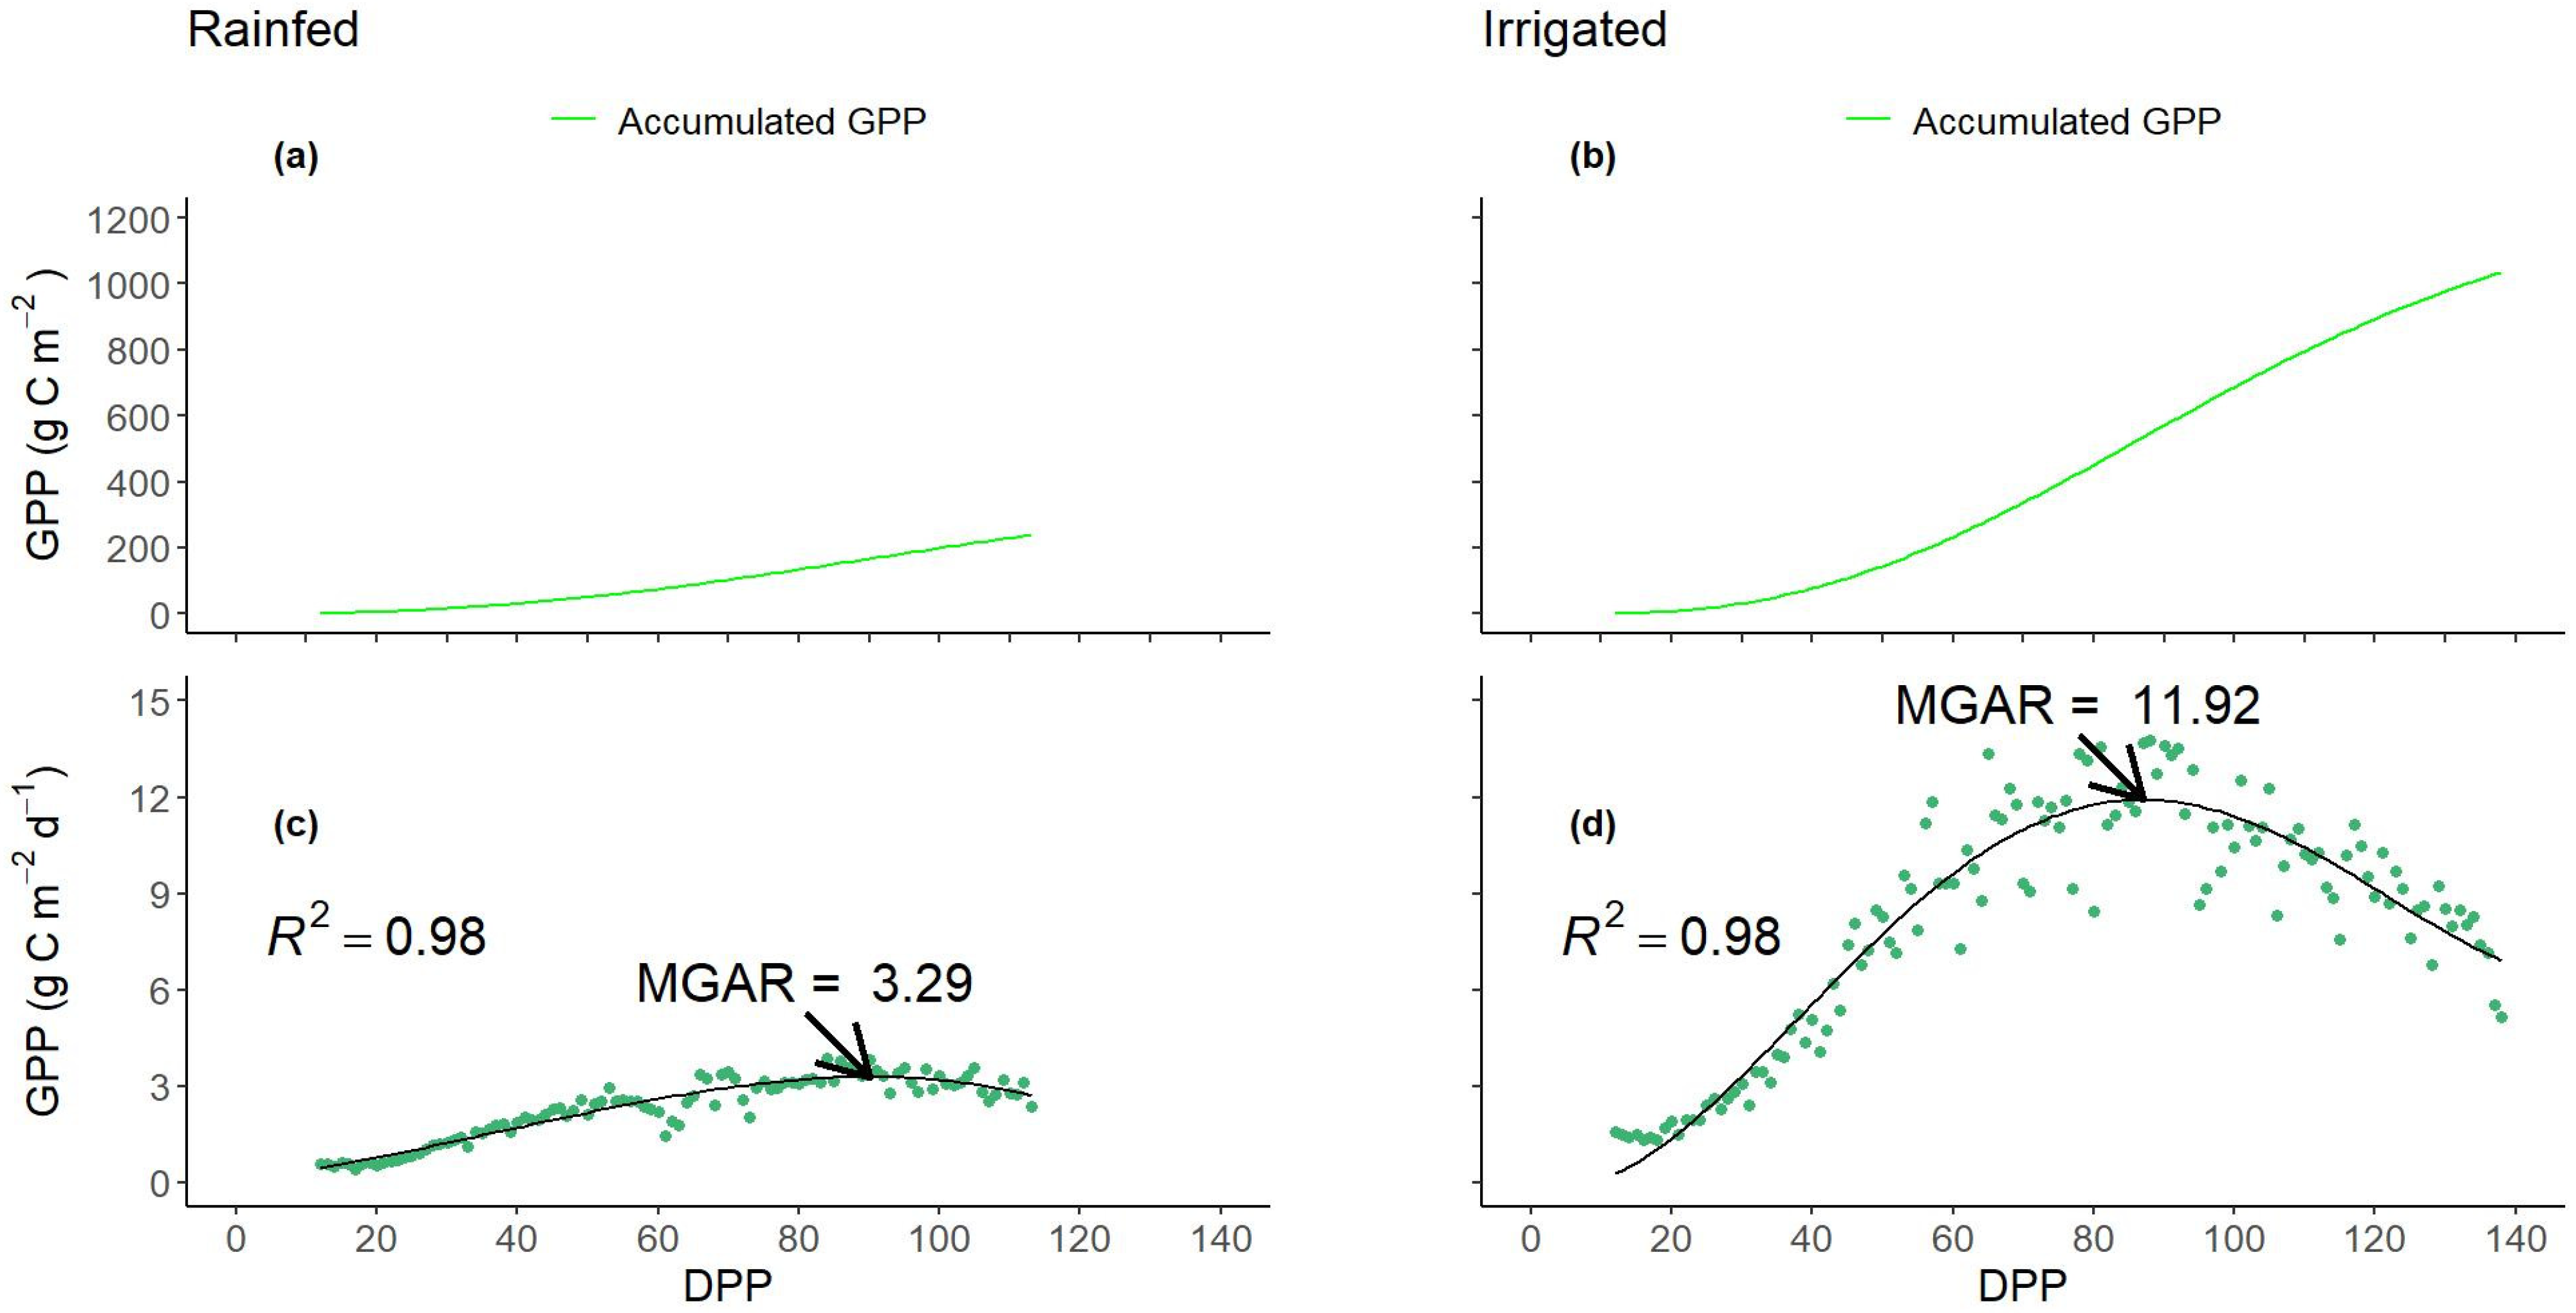
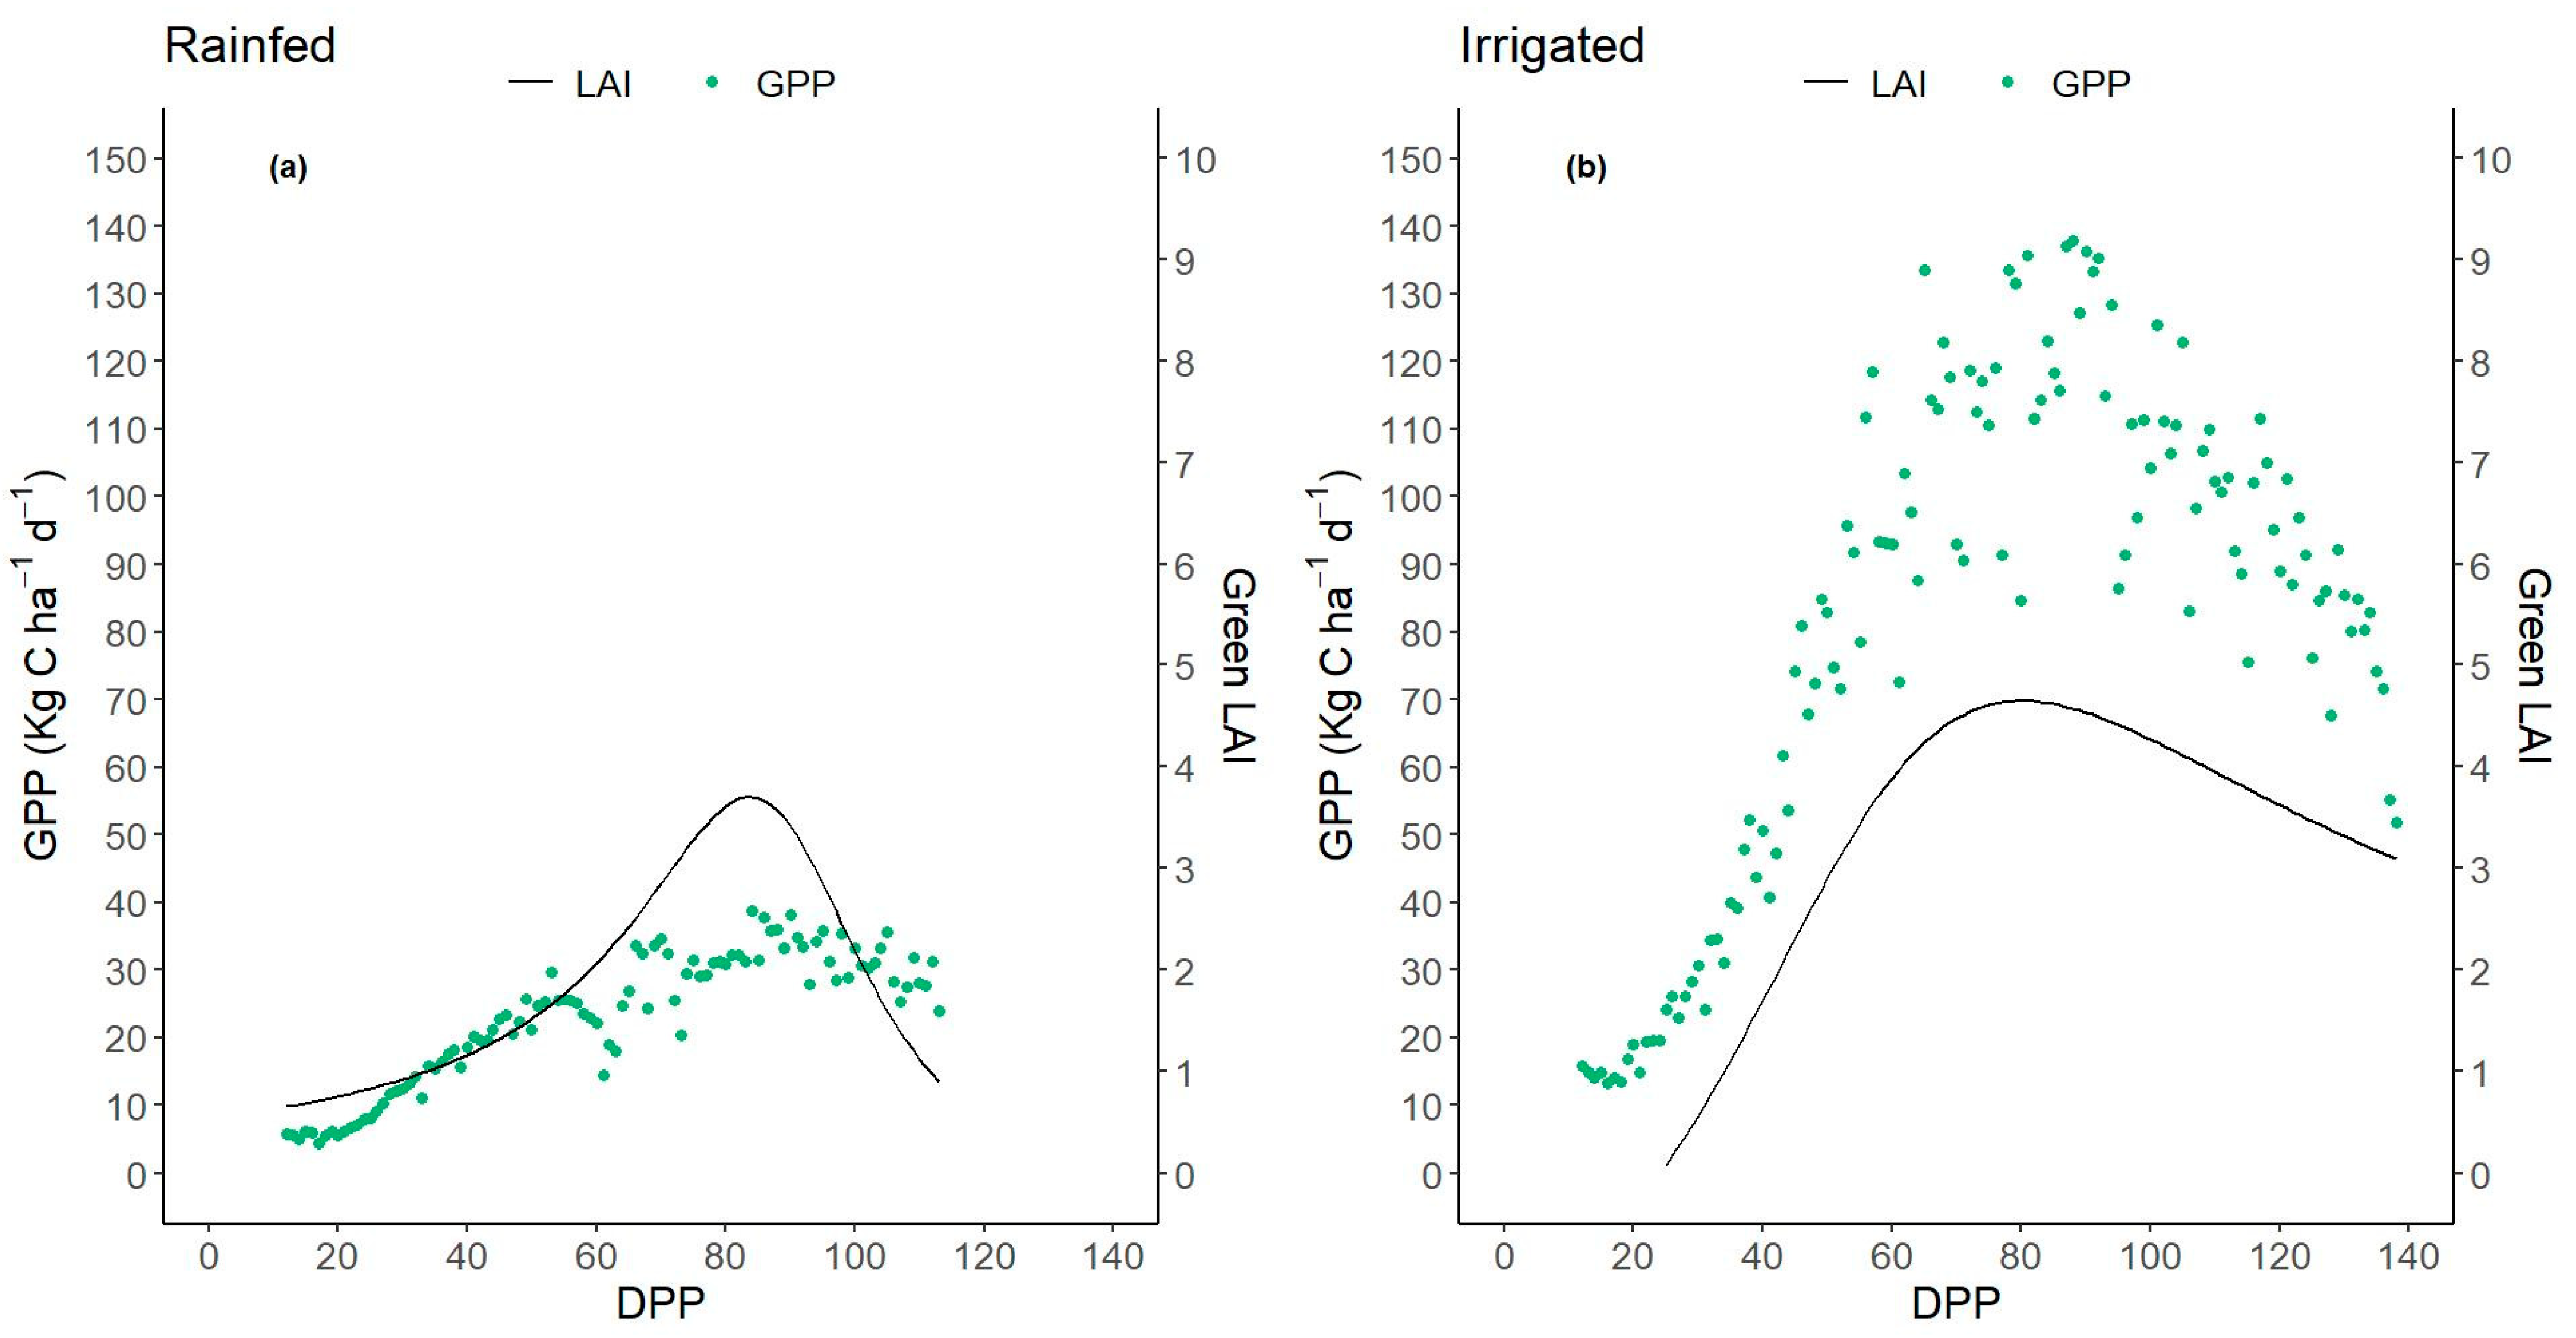
3.4. Dynamics of Daily and Accumulated Gross Primary Production—GPP

Daily and accumulated GPP were greater in Irrigated compared to Rainfed throughout the crop growth. In Irrigated, the maximum GPP accumulation rate (MGAR) (11.92 Kg C ha−1 d−1) occurred at 88 DPP, when the accumulated GPP was 551.38 Kg C ha−1. In Rainfed the MGAR was 3.29 Kg C ha−1 d−1, at 90 DPP, when the accumulated GPP was 166.45 Kg C ha−1. After reaching the MGAR until the end of the canopy life cycle, the accumulated GPP was also higher in Irrigated (492.2 Kg C ha−1) than in Rainfed (73.45 Kg C ha−1), which indicates that there was a generalized depletion of the GPP under no irrigation conditions (Figure 3).
Variations of the half-hourly GPP mean throughout the day and across growth stages were observed on each evaluation site. In Irrigated, there were higher carbon fixing rates through the day (half-hourly GPPs) for all growth stages. Tuberization stage rates increased progressively along the day, reaching a maximum of 1.30 ± 0.19 mg CO2 m−2 s−1 between 9 and 13 h. In vegetative and tuber bulking stages, half-hourly GPP maximums (0.83 ± 0.37 mg CO2 m−2 s−1 y 0.96 ± 0.18 mg CO2 m−2 s−1, respectively) were also found between 9 and 13 h, however, they were not significatively different (p > 0.05). In Rainfed, half-hourly GPPs were lower in the sprouting and vegetative stages compared to the tuberization and tuber bulking stages. At each growth stage, GPP values between 9 and 16 h were constant and did not exceed 0.35 mg CO2 m−2 s−1 (Figure 4).
Figure 5 shows the behavior of GPP as a response to the incident PAR. In Irrigated, the incident PAR and growth stages influenced half-hourly GPPs, while in Rainfed, there was no evidence of difference among growth stages. PAR Saturation was defined as the PAR value in GPP that reaches 95% of asymptote. In Irrigated, PAR saturation values were 1494 µmol photons m−2 s−1, 1439 µmol photons m−2 s−1, 1454 µmol photons m−2 s−1, and 1543 µmol photons m−2 s−1. GPPs at PAR saturation were 0.21 mg CO2 m−2 s−1, 0.88 mg CO2 m−2 s−1, 1.41 mg CO2 m−2 s−1, and 1.09 mg CO2 m−2 s−1 for sprouting, vegetative, tuberization, and tuber bulking stages, respectively. In Rainfed, light saturation occurred at lower values (1522 µmol photons m−2 s−1, 354 µmol photons m−2 s−1, 225 µmol photons m−2 s−1, and 576 µmol photons m−2 s−1 for sprouting, vegetative, tuberization and tuber bulking, respectively), and GPPs at PAR saturation did not exceed 0.34 mg CO2 m−2 s−1 in any growth stage.

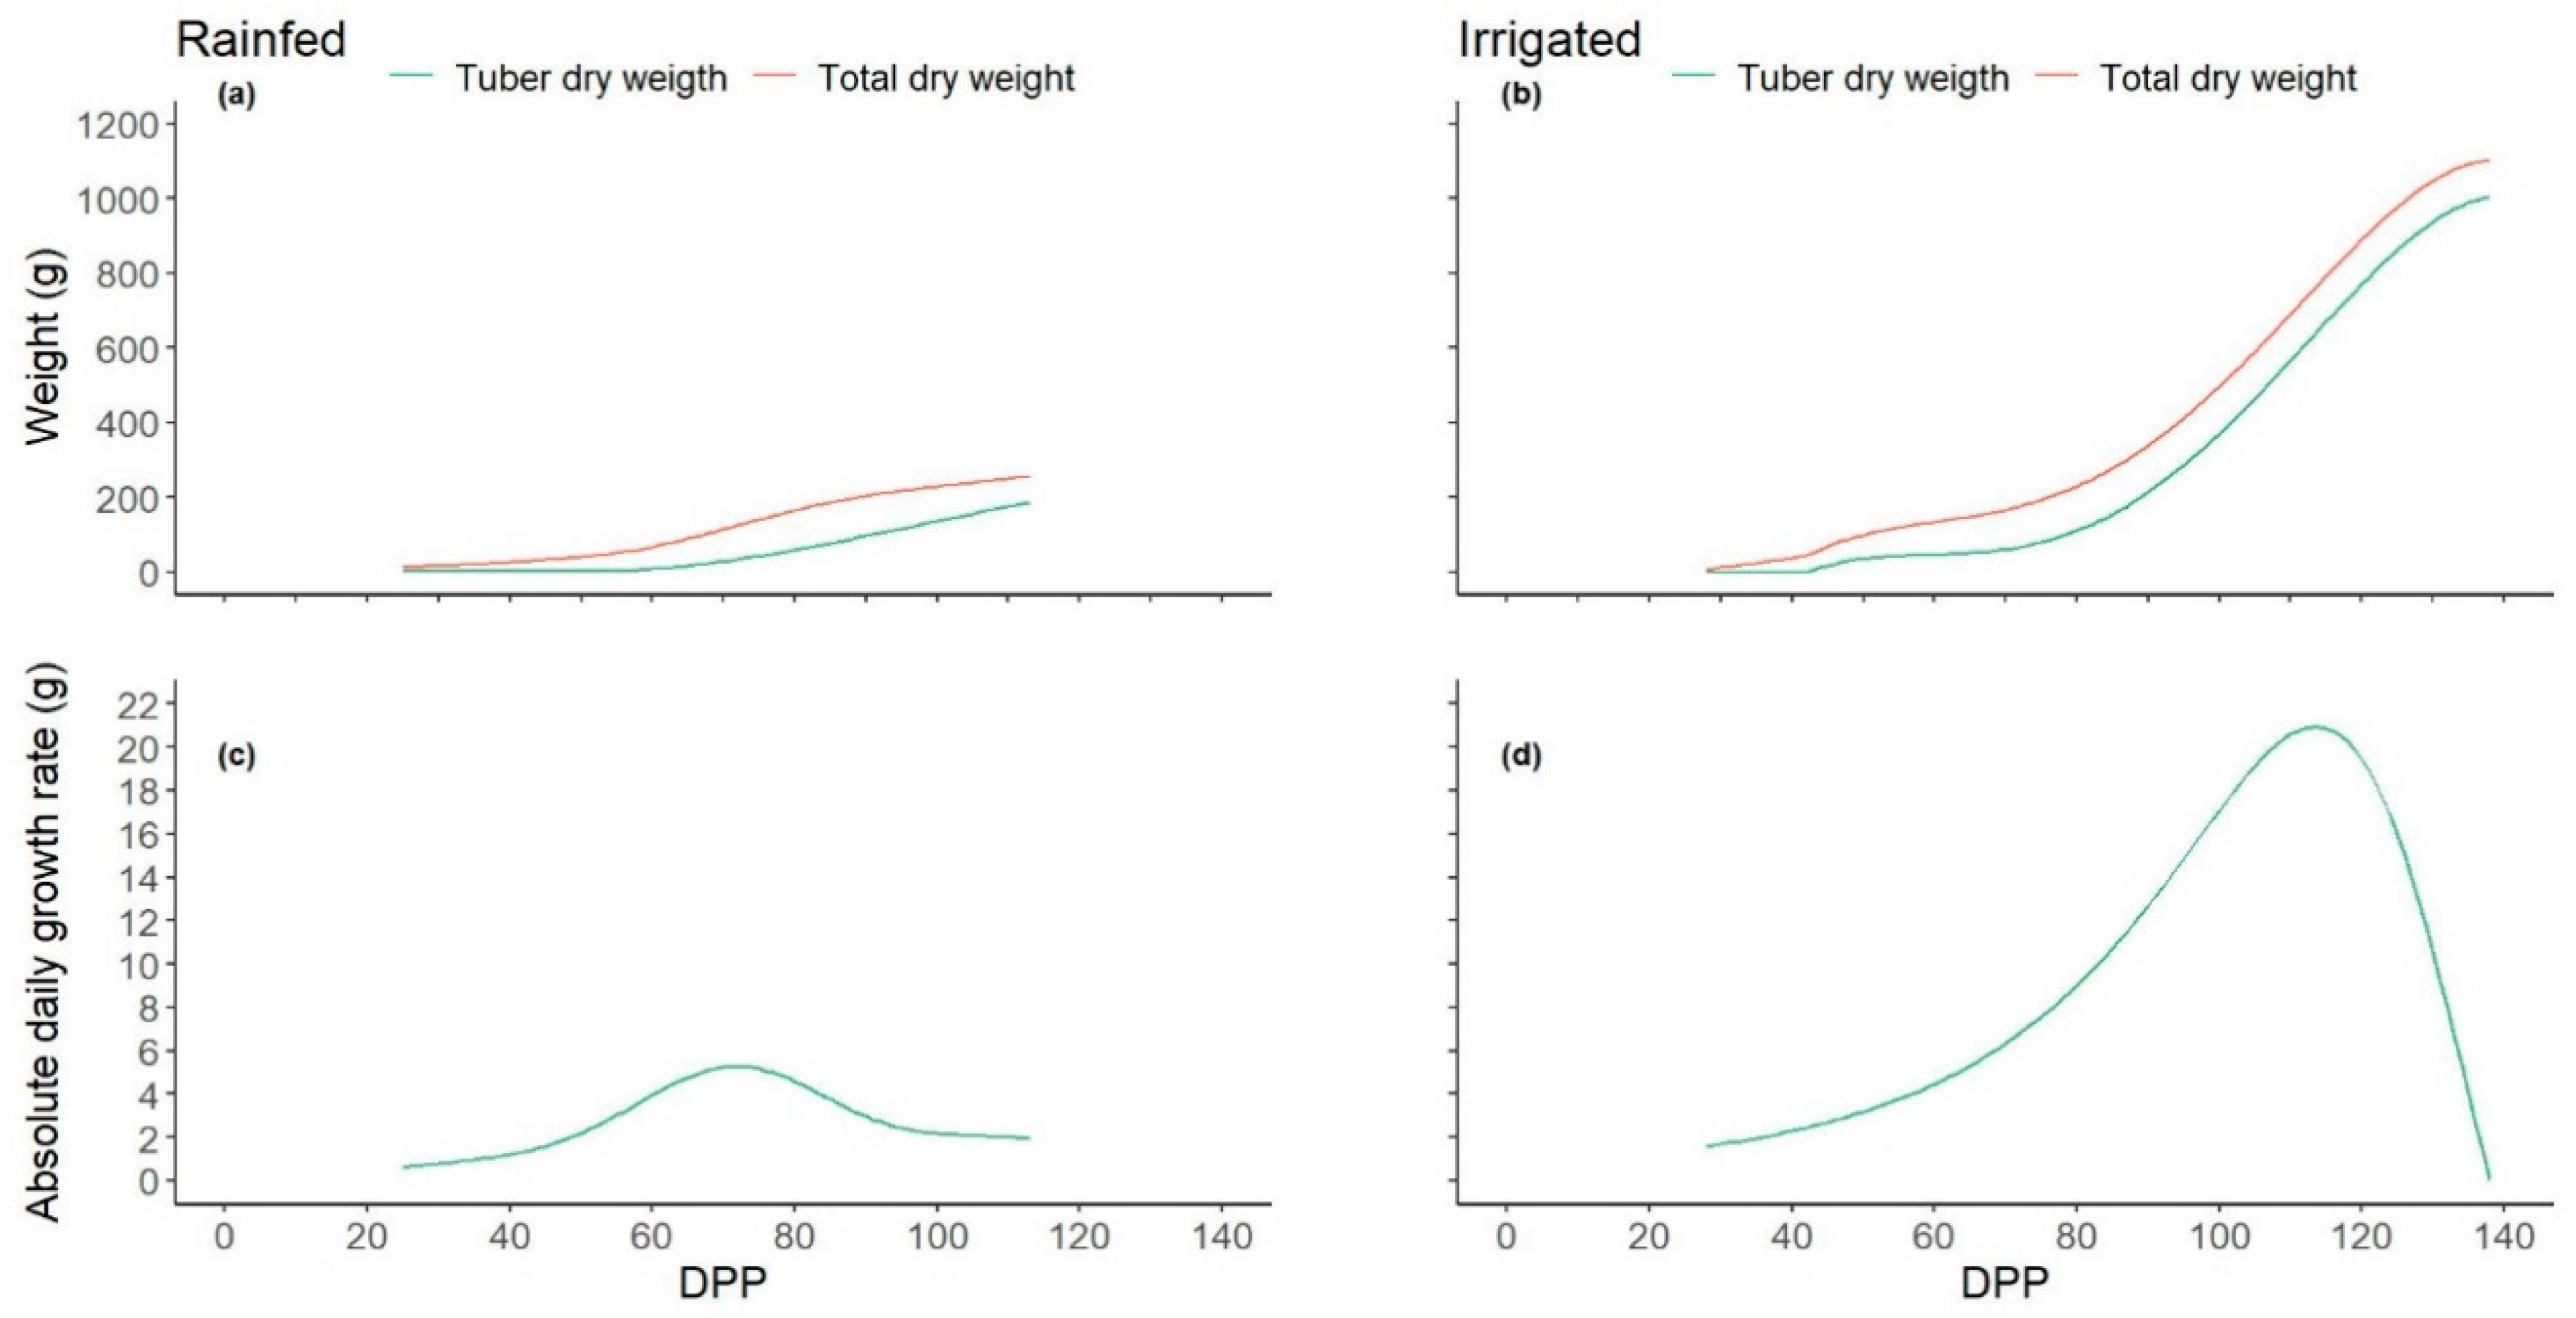
3.5. GPP and Growth Relationships

The LAI showed a phase of accelerated increase from sprouting to around 80 DDP, when the LAI maximums were reached. The maximum LAI in Irrigated (4.7) was 23.9% higher than in Rainfed (3.5). In Irrigated, the daily GPP had the same trend as LAI, increasing up to 115 kg C ha−1 d−1, when the LAI reached its maximum, then decreased to values around 70 kg C ha−1 d−1 by the end of tuber bulking stage. In Rainfed, the daily GPPs had lower values compared to Rainfed, therefore, the daily GPP did not show the same trend as the LAI. On the day when the LAI was maximum, the daily GPP showed a maximum value of 38.7 kg C ha−1 d−1 (Figure 6).
In Irrigated, the plants reached an averaged maximum DW and TDW of 1103 g and 1004 g, respectively. AGR increased progressively until 114 DPP (when the crop reached 82% of the canopy life cycle) with a maximum of 20.95 g d−1. From 115 to 138 DPP, the daily dry biomass accumulation rate decreased progressively until a minimum value of 0.05 g d−1. In Rainfed, DW and TDW values were lower than in Irrigated. Averaged maximum DW and TDW were 256.8 g and 186.8 g, respectively. Maximum AGR (5.25 g d−1) was observed 72 DPP, when the crop reached 64% of the canopy life cycle. From 73 DPP to 113 DPP (the end of the canopy life cycle), AGR dropped to 1.94 g d−1 (Figure 7).
Higher leaf area durations (LAD) were observed in Irrigated, compared to Rainfed. In Irrigated, LAD was 1.3, 1.5, and 3 times LAD in Rainfed for vegetative, tuberization, and tuber bulking stages, respectively (Table 2).

4. Discussion

Water management practices are an important factor for GPP gain or loss in productive systems, particularly in crops grown under rainfed conditions, where there are inherent limitations related to drought-induced GPP losses [40]. Our results show that GPP in Irrigated was 337.5% higher than in Rainfed (with a difference of 803.7 g C m−2), and the sum of NEE was negative (sink) in Irrigated and positive (source) in Rainfed, which evidences the influence of soil water conditions on carbon dynamics [41,42]. In Irrigated, the SWC was kept close to field capacity, while in Rainfed, the SWC was, most of the time, below the easily available water and even below the wilting point. The conditions described for Rainfed are related to agricultural drought [43], which is compatible with a higher VPD max, a higher T mean, and a higher T max than in Irrigated.
In general, half-hourly GPPs were intricately linked to the carbon demand in each of the growth stages, reaching maximums of daily sums of GPP in the tuberization stage, around 90 DPP for both, Irrigated and Rainfed. For each of the growth stages, averaged half-hourly GPPs were significantly greater compared to Rainfed (p < 0.05), which agrees with drought-induced GPP losses reported in potato crops by [44,45] and in other species [40,41,46,47,48,49,50,51,52,53].
Half-hourly GPP variation throughout the day is associated with incident PAR [44,54,55,56]; such variation has also been reported for potatoes [54,57]. In this study, an asymptotic exponential curve of GPP Vs. PAR was fitted on each growth stage, which shows that carbon flux at PAR saturation (95% of asymptote) was greater in Irrigated than in Rainfed (p < 0.05), with PAR values around 1450 µmol m−2 s−1 in Irrigated and 250 µmol m−2 s−1 in Rainfed.
The mean PAR in Irrigated was higher throughout the crop growth than in the rainfed site. However, although there is a lower PAR in rainfed, this condition does not affect the response of the GPP, due to saturation of the photosynthesis transduction phase occurring at low PAR values. This results in a restricted carbon fixing, which may be attributed to the fact that in a highly water-restricted scenario, non-stomatal restrictions depend on the severity of the water stress [58], which are related to reduced mesophyll conductance, and photochemical and enzymatic constraints [59]. At this point, the injury of the photosynthetic apparatus, destruction of chlorophyll components, disorganization of chloroplast’s ultrastructure and enzyme inactivation, and photo-inhibition [60,61] cause a permanent decline in carbon assimilation [58,61]. These non-stomatal limitations were also reported for potato crops in [62] at the Lonzée Terrestrial Observatory.
Variations in GPP with respect to LAI were evident along growth stages related to LAI evolution and canopy formation. The highest GPP data dispersion was observed in the vegetative stage, when there was a progressive canopy growth, with the presence of leaves of different ages, and therefore, with differences in light use efficiency. Conversely, in the tuberization stage, when the maximum LAI is reached, the canopy is homogeneous and fully formed, which reflects in the lower data dispersion.
Several authors have reported LAI as one of the main causes of daily GPP variation [63,64,65]. In Irrigated, daily GPP dynamics showed the same trend as LAI, evidencing that there exists an efficient feedback regulation mechanism between GPP and LAI, where carbon fluxes are mainly destined to GPP, which guarantees canopy growth and expansion. The canopy, in turn, is highly functional to photosynthetic processes increasing GPP since, in addition to a larger leaf area, the leaves do not show irreversible limitations for carbon assimilation, have a high response to PAR, and greater duration of the leaf area. Conversely, In Rainfed, there was no correspondence between GPP and LAI trends. In this case, the available leaf area is less efficient for photosynthesis, the crop shows early senescence, and is barely functional for GPP growth. In this sense, reference [44] reported that reductions in daily GPP evolution during crop growth may be related to leaf senescence and reduced LAI.
LAI functionality and its relationship with GPP can be observed in the growth analysis carried out in both study sites. In Irrigated, synergistic growth of LAI and GPP allowed higher efficiency for DW and TDW gain. Before reaching the maximum LAI (tuberization stage, 81 DPP), all the plant organs are in active growth, so there are higher carbon requirements and a higher available leaf area to fix it. After the maximum LAI, carbon allocation favors tuber bulking over other organs. In Rainfed, GPP and LAI limitations resulted in lower DW and TDW, resulting in less time for active growth, cell division, and expansion. Early decrease of AGR and canopy senescence indicate low carbon demand and fewer organs (stems and leaves) acting as reservoirs, which contribute to the lack of synergy between daily GPP and LAI.

5. Conclusions

Reliable results regarding carbon fluxes in two potato crop sites under intertropical conditions in Colombia were obtained using the Eddy Covariance method. The crops, under very different soil water content, were evaluated from sowing to tuber bulking. Gross primary productivity was closely linked to water availability for plants. In irrigated potato, GPP was 337.5% greater than in rainfed potato, with low precipitations, which results in big differences in the net carbon ecosystem exchange (NEE) by the end of each crop cycle. The Irrigated crop acted as an atmospheric carbon sink (NEE = −366.6 g C m−2 ± 50.30), while the rainfed crop behaved as a source (NEE = 154.7 g C m−2 ± 30.21), which is related to the differences in PAR at light saturation in rainfed (225 µmol m−2 s−1) and in irrigated at the tuberization stage (1450 µmol m−2 s−1). Consequently, in the rainfed crop, there was a low carbon destination to the structures and organs forming the plants, resulting in a reduction of the total dry matter and tuber yield. Our results show the environmental and productive benefits of potato crops grown under optimal water supply, becoming a fundamental basis to further studies evaluating the effects of other crop practices on carbon dioxide emissions.

Author Contributions

Conceptualization, A.M.C.-M., F.E.M.-M. and G.A.G.-V.; methodology, F.E.M.-M., A.M.C.-M., G.A.G.-V. and F.R.M.; software, G.A.G.-V.; formal analysis, F.E.M.-M., A.M.C.-M. and G.A.G.-V.; investigation, F.E.M.-M., A.M.C.-M. and G.A.G.-V.; resources, A.M.C.-M.; data curation, A.M.C.-M., F.E.M.-M.; writing—original draft, F.E.M.-M., A.M.C.-M. and G.A.G.-V.; writing—review and editing, F.R.M., F.E.M.-M., A.M.C.-M. and G.A.G.-V.; supervision, A.M.C.-M. and F.R.M.; project administration, A.M.C.-M.; funding acquisition, A.M.C.-M. All authors have read and agreed to the published version of the manuscript.

Funding

This research was funded by the Fondo de Ciencia, Tecnología e Innovación del Sistema General de Regalías, administered by the Fondo Nacional de Financiación para Ciencia, Tecnología e Innovación—Francisco José de Caldas, Programa Colombia BIO, Gobernación de Cundinamarca and Ministerio de Ciencia, Tecnología e Innovación (MINCIENCIAS), and Corporación Colombiana de Investigación Agropecuaria (AGROSAVIA).

Institutional Review Board Statement

Not applicable.

Informed Consent Statement

Not applicable.

Data Availability Statement

Not applicable.

Acknowledgments

This work is part of a larger project in Corporación Colombiana de Investigación Agropecuaria (AGROSAVIA) named Sistema de Información Agroclimática del cultivo de la papa en la region de Cundinamarca, Colombia (SIAP). We thank Zahara Lucia Lasso Paredes, Jose Alfredo Molina Varón, Douglas Andrés Gómez Latorre, Diego Fernando Sánchez Rivas, Óscar Dubán Ocampo Páez, and Jhon Alexander Martínez Morales for their contribution in the equipment installation process, and farmers Santiago Forero and Alejandro Forero for providing a suitable lot for the study.

Conflicts of Interest

The authors declare no conflict of interest.

References

  1. Paillard, S.; Treyer, S.; Dorin, B. Agrimonde–Scenarios and Challenges for Feeding the World in 2050; Paillard, S., Treyer, S., Dorin, B., Eds.; Springer: Dordrecht, The Netherlands, 2014; ISBN 978-94-017-8744-4. [Google Scholar]
  2. FAO. The Future of Food and Agriculture Trends and Challenges; FAO—Food and Agriculture Organization of the United Nations: Roma, Italy, 2017; ISBN 978-92-5-109551-5. [Google Scholar]
  3. Kole, C. Genomic Designing of Climate-Smart Cereal Crops; Springer Nature Switzerland AG 2020: New Delhi, India, 2020; ISBN 978-3-319-97414-9. [Google Scholar]
  4. Ortiz, O.; Mares, V. The Historical, Social, and Economic Importance of the Potato Crop. Compend. Plant Genomes 2017, 1–10. [Google Scholar] [CrossRef]
  5. Smith, L.G.; Kirk, G.J.D.; Jones, P.J.; Williams, A.G. The greenhouse gas impacts of converting food production in England and Wales to organic methods. Nat. Commun. 2019, 10, 1–10. [Google Scholar] [CrossRef] [Green Version]
  6. Martin-Gorriz, B.; Martínez-Alvarez, V.; Maestre-Valero, J.F.; Gallego-Elvira, B. Influence of the Water Source on the Carbon Footprint of Irrigated Agriculture: A Regional Study in South-Eastern Spain. Agronomy 2021, 11, 351. [Google Scholar] [CrossRef]
  7. Verma, S.B.; Dobermann, A.; Cassman, K.G.; Walters, D.T.; Knops, J.M.; Arkebauer, T.J.; Suyker, A.E.; Burba, G.G.; Amos, B.; Yang, H.; et al. Annual carbon dioxide exchange in irrigated and rainfed maize-based agroecosystems. Agric. For. Meteorol. 2005, 131, 77–96. [Google Scholar] [CrossRef] [Green Version]
  8. Litton, C.M.; Giardina, C.P. Below-ground carbon flux and partitioning: Global patterns and response to temperature. Funct. Ecol. 2008, 22, 941–954. [Google Scholar] [CrossRef]
  9. Rambal, S.; Lempereur, M.; Limousin, J.M. How drought severity constrains GPP and its partitioning among carbon pools in a Quercus ilex coppice? Biogeosciences Discuss. 2014, 11, 8673–8711. [Google Scholar] [CrossRef]
  10. Li, X.; Ramírez, D.A.; Qin, J.; Dormatey, R.; Bi, Z.; Sun, C.; Wang, H.; Bai, J. Water restriction scenarios and their effects on traits in potato with different degrees of drought tolerance. Sci. Hortic. 2019, 256. [Google Scholar] [CrossRef]
  11. Blom-Zandstra, G.; Verhagen, J. Potato production systems in different agro ecological regions and their relation with climate change. Wagening. Res. Rep. 2015, 614, 32. [Google Scholar]
  12. Cassman, K.G.; Wood, S. Chapter 26 Cultivated Systems. In Millennium Ecosystem Assessment: Global Ecosystem Assessment Report on Conditions and Trends; World Research Institute: Washington, DC, USA, 2005; ISBN 1-59726-040-1. [Google Scholar]
  13. Malhi, Y.; Aragão, L.E.O.C.; Metcalfe, D.B.; Paiva, R.; Quesada, C.A.; Almeida, S.; Anderson, L.; Brando, P.; Chambers, J.Q.; da Costa, A.C.L.; et al. Comprehensive assessment of carbon productivity, allocation and storage in three Amazonian forests. Glob. Chang. Biol. 2009, 15, 1255–1274. [Google Scholar] [CrossRef]
  14. Wagle, P.; Xiao, X.; Suyker, A.E. Estimation and analysis of gross primary production of soybean under various management practices and drought conditions. ISPRS J. Photogramm. Remote Sens. 2015, 99, 70–83. [Google Scholar] [CrossRef] [Green Version]
  15. Baldocchi, D.D. Assessing the eddy covariance technique for evaluating carbon dioxide exchange rates of ecosystems: Past, present and future. Glob. Chang. Biol. 2003, 9, 479–492. [Google Scholar] [CrossRef] [Green Version]
  16. Anthoni, P.M.; Knohl, A.; Rebmann, C.; Freibauer, A.; Mund, M.; Ziegler, W.; Kolle, O.; Schulze, E.D. Forest and agricultural land-use-dependent CO2 exchange in Thuringia, Germany. Glob. Chang. Biol. 2004, 10, 2005–2019. [Google Scholar] [CrossRef]
  17. Centro Internacional de la Papa (CIP) Hechos y Cifras Sobre la Papa 2017, 2. Available online: https://cgspace.cgiar.org/bitstream/handle/10568/87957/CIP-Hechos-y-cifras-sobre-la-papa-Espanol-2017.pdf?sequence=1&isAllowed=y (accessed on 29 September 2021).
  18. Mosquera Vásquez, T.; Del Castillo, S.; Gálvez, D.C.; Rodríguez, L.E. Breeding Differently: Participatory Selection and Scaling Up Innovations in Colombia. Potato Res. 2017, 60, 361–381. [Google Scholar] [CrossRef] [Green Version]
  19. U.S. Department of Agriculture-USDA. Natural Resources Conservation Services—NRCS Claves para la Taxonomía de Suelos; XII; Estado de México. 2014; ISBN 0926487221. Available online: https://www.nrcs.usda.gov/Internet/FSE_DOCUMENTS/nrcs142p2_051546.pdf (accessed on 29 September 2021).
  20. Foken, T.; Leuning, R.; Oncley, S.R.; Mauder, M.; Aubinet, M. Corrections and Data Quality Control. In A Practical Guide to Measurement and Data Analysis; Springer Science + Business Media B.V.: Bayreuth, Germany, 2012; pp. 85–131. ISBN 9789400723511. [Google Scholar]
  21. Hunt, R. BASIC GROWTH ANALYSIS; Academic Division of Unwin Hyman Ltd.: London, UK, 1990; Volume 148, ISBN 9780044453734. [Google Scholar]
  22. Wilczak, J.M.; Oncley, S.P.; Stage, S.A. Sonic anemometer tilt correction algorithms. Bound. Layer Meteorol. 2001, 99, 127–150. [Google Scholar] [CrossRef]
  23. Moncrieff, J.B.; Massheder, J.M.; De Bruin, H.; Elbers, J.; Friborg, T.; Heusinkveld, B.; Kabat, P.; Scott, S.; Soegaard, H.; Verhoef, A. A system to measure surface fluxes of momentum, sensible heat, water vapour and carbon dioxide. J. Hydrol. 1997, 188–189, 589–611. [Google Scholar] [CrossRef]
  24. Webb, E.K.; Pearman, G.I.; Leuning, R. Correction of flux measurements for density effects due to heat and water vapour transfer. Q. J. R. Meteorol. Soc. 1980, 106, 85–100. [Google Scholar] [CrossRef]
  25. Kljun, N.; Calanca, P.; Rotach, M.W.; Schmid, H.P. A simple two-dimensional parameterisation for Flux Footprint Prediction (FFP). Geosci. Model Dev. 2015, 8, 3695–3713. [Google Scholar] [CrossRef] [Green Version]
  26. Kormann, R.; Meixner, F.X. An analytical footprint model for non-neutral stratification. Bound.-Layer Meteorol. 2001, 99, 207–224. [Google Scholar] [CrossRef]
  27. Papale, D.; Reichstein, M.; Aubinet, M.; Canfora, E.; Bernhofer, C.; Kutsch, W.; Longdoz, B.; Rambal, S.; Valentini, R.; Vesala, T.; et al. Towards a standardized processing of Net Ecosystem Exchange measured with eddy covariance technique: Algorithms and uncertainty estimation. Biogeosciences 2006, 3, 571–583. [Google Scholar] [CrossRef] [Green Version]
  28. R Core Team. R: A Language and Environment for Statistical Computing. Available online: http://www.R-project.org/2021 (accessed on 10 August 2021).
  29. Reichstein, M.; Falge, E.; Baldocchi, D.; Papale, D.; Aubinet, M.; Berbigier, P.; Bernhofer, C.; Buchmann, N.; Gilmanov, T.; Granier, A. On the separation of net ecosystem exchange into assimilation and ecosystem respiration : Review and improved algorithm. Glob. Chang. Biol. 2005, 11, 1424–1439. [Google Scholar] [CrossRef]
  30. Falge, E.; Baldocchi, D.; Olson, R.; Anthoni, P.; Aubinet, M.; Bernhofer, C.; Burba, G.; Ceulemans, R.; Clement, R.; Dolman, H.; et al. Gap filling stratergies for defansible annual sums of net ecosystem exchange. Agric. For. Meteorol. 2001, 107, 43–69. [Google Scholar] [CrossRef] [Green Version]
  31. Tagesson, T.; Fensholt, R.; Cropley, F.; Guiro, I.; Horion, S.; Ehammer, A.; Ardo, J. Dynamics in carbon exchange fluxes for a grazed semi-arid savanna ecosystem in West Africa. Agric. Ecosyst. Environ. 2015, 205, 15–24. [Google Scholar] [CrossRef] [Green Version]
  32. Richardson, A.D.; Hollinger, D.Y. A method to estimate the additional uncertainty in gap-filled NEE resulting from long gaps in the CO 2 flux record. Agric. For. Meteorol. 2007, 147, 199–208. [Google Scholar] [CrossRef]
  33. Richardson, A.D.; Hollinger, D.Y.; Burba, G.G.; Davis, K.J.; Flanagan, L.B.; Katul, G.G.; Munger, J.W.; Ricciuto, D.M.; Stoy, P.C.; Suyker, A.E.; et al. A multi-site analysis of random error in tower-based measurements of carbon and energy fluxes. Agric. For. Meteorol. 2006, 136, 1–18. [Google Scholar] [CrossRef] [Green Version]
  34. Campbell, G.S.; Norman, J.M. An Introduction to Environmental Biophysics, 2nd ed.; Springer: Pullman, WA, USA, 1998; Volume 6, ISBN 0387949372. [Google Scholar]
  35. Chi, J.; Waldo, S.; Pressley, S.; O’Keeffe, P.; Huggins, D.; Stöckle, C.; Pan, W.L.; Brooks, E.; Lamb, B. Assessing carbon and water dynamics of no-till and conventional tillage cropping systems in the inland Pacific Northwest US using the eddy covariance method. Agric. For. Meteorol. 2016, 218–219, 37–49. [Google Scholar] [CrossRef] [Green Version]
  36. Allen, R.G.; Pereira, L.S.; Raes, D.; Smith, M. FAO Irrigation and Drainage Paper No. 56-Crop Evapotranspiration 1998, 300. Available online: http://www.climasouth.eu/sites/default/files/FAO%2056.pdf (accessed on 29 September 2021).
  37. Mauder, M.; Foken, T.; Cuxart, J. Surface-Energy-Balance Closure over Land: A Review; Springer: Garmisch-Partenkirchen, Germany, 2020; Volume 177, ISBN 0123456789. [Google Scholar]
  38. Callañaupa Gutierrez, S.; Segura Cajachagua, H.; Saavedra Huanca, M.; Flores Rojas, J.; Silva Vidal, Y.; Cuxart, J. Seasonal variability of daily evapotranspiration and energy fluxes in the Central Andes of Peru using eddy covariance techniques and empirical methods. Atmos. Res. 2021, 261, 105760. [Google Scholar] [CrossRef]
  39. Wilson, K.; Goldstein, A.; Falge, E.; Aubinet, M.; Baldocchi, D.; Berbigier, P.; Bernhofer, C.; Ceulemans, R.; Dolman, H.; Field, C.; et al. Energy balance closure at FLUXNET sites. Agric. For. Meteorol. 2002, 113, 223–243. [Google Scholar] [CrossRef] [Green Version]
  40. Chen, S.; Huang, Y.; Wang, G. Detecting drought-induced GPP spatiotemporal variabilities with sun-induced chlorophyll fluorescence during the 2009/2010 droughts in China. Ecol. Indic. 2021, 121, 107092. [Google Scholar] [CrossRef]
  41. Fu, Z.; Ciais, P.; Bastos, A.; Stoy, P.C.; Yang, H.; Green, J.K.; Wang, B.; Yu, K.; Huang, Y.; Knohl, A.; et al. Sensitivity of gross primary productivity to climatic drivers during the summer drought of 2018 in Europe: Sensitivity of GPP to climate drivers. Philos. Trans. R. Soc. B Biol. Sci. 2020, 375, 1–11. [Google Scholar] [CrossRef] [PubMed]
  42. Şaylan, L.; Kimura, R.; Munkhtsetseg, E.; Kamichika, M. Seasonal variation of carbon dioxide fluxes over irrigated soybean (Glycine max L.). Theor. Appl. Climatol. 2011, 105, 277–286. [Google Scholar] [CrossRef]
  43. Labedzki, L.; Bąk, B. Meteorological and agricultural drought indices used in drought monitoring in Poland: A review. Meteorol. Hydrol. Water Manag. 2014, 2, 13. [Google Scholar]
  44. Aubinet, M.; Moureaux, C.; Bodson, B.; Dufranne, D.; Heinesch, B.; Suleau, M.; Vancutsem, F.; Vilret, A. Carbon sequestration by a crop over a 4-year sugar beet/winter wheat/seed potato/winter wheat rotation cycle. Agric. For. Meteorol. 2009, 149, 407–418. [Google Scholar] [CrossRef]
  45. Ruidisch, M.; Nguyen, T.T.; Li, Y.L.; Geyer, R.; Tenhunen, J. Estimation of annual spatial variations in forest production and crop yields at landscape scale in temperate climate regions. Ecol. Res. 2015, 30, 279–292. [Google Scholar] [CrossRef]
  46. Ciais, P.; Reichstein, M.; Viovy, N.; Granier, A.; Ogée, J.; Allard, V.; Aubinet, M.; Buchmann, N.; Bernhofer, C.; Carrara, A.; et al. Europe-wide reduction in primary productivity caused by the heat and drought in 2003. Nature 2005, 437, 529–533. [Google Scholar] [CrossRef]
  47. Van der Molen, M.K.; Dolman, A.J.; Ciais, P.; Eglin, T.; Gobron, N.; Law, B.E.; Meir, P.; Peters, W.; Phillips, O.L.; Reichstein, M.; et al. Drought and ecosystem carbon cycling. Agric. For. Meteorol. 2011, 151, 765–773. [Google Scholar] [CrossRef]
  48. Stocker, B.D.; Zscheischler, J.; Keenan, T.F.; Prentice, I.C.; Seneviratne, S.I.; Peñuelas, J. Drought impacts on terrestrial primary production underestimated by satellite monitoring. Nat. Geosci. 2019, 12, 264–270. [Google Scholar] [CrossRef]
  49. Dufranne, D.; Moureaux, C.; Vancutsem, F.; Bodson, B.; Aubinet, M. Comparison of carbon fluxes, growth and productivity of a winter wheat crop in three contrasting growing seasons. Agric. Ecosyst. Environ. 2011, 141, 133–142. [Google Scholar] [CrossRef]
  50. Geruo, A.; Velicogna, I.; Kimball, J.S.; Du, J.; Kim, Y.; Colliander, A.; Njoku, E. Satellite-observed changes in vegetation sensitivities to surface soil moisture and total water storage variations since the 2011 Texas drought. Environ. Res. Lett. 2017, 12. [Google Scholar] [CrossRef] [Green Version]
  51. Berninger, F. Effects of drought and phenology on GPP in Pinus sylvestris: A simulation study along a geographical gradient. Funct. Ecol. 1997, 11, 33–42. [Google Scholar] [CrossRef]
  52. Doughty, R.; Xiao, X.; Wu, X.; Zhang, Y.; Bajgain, R.; Zhou, Y.; Qin, Y.; Zou, Z.; McCarthy, H.; Friedman, J.; et al. Responses of gross primary production of grasslands and croplands under drought, pluvial, and irrigation conditions during 2010–2016, Oklahoma, USA. Agric. Water Manag. 2018, 204, 47–59. [Google Scholar] [CrossRef]
  53. Xie, X.; Li, A.; Tan, J.; Jin, H.; Nan, X.; Zhang, Z.; Bian, J.; Lei, G. Assessments of gross primary productivity estimations with satellite data-driven models using eddy covariance observation sites over the northern hemisphere. Agric. For. Meteorol. 2020, 280, 107771. [Google Scholar] [CrossRef]
  54. Zhao, L. Improved determination of daytime net ecosystem exchange of carbon dioxide at croplands. Biogeosciences Discuss. 2012, 9, 2883–2919. [Google Scholar] [CrossRef]
  55. Gitelson, A.A.; Gamon, J.A. The need for a common basis for defining light-use efficiency: Implications for productivity estimation. Remote Sens. Environ. 2015, 156, 196–201. [Google Scholar] [CrossRef] [Green Version]
  56. Emmel, C.; D’Odorico, P.; Revill, A.; Hörtnagl, L.; Ammann, C.; Buchmann, N.; Eugster, W. Canopy photosynthesis of six major arable crops is enhanced under diffuse light due to canopy architecture. Glob. Chang. Biol. 2020, 26, 5164–5177. [Google Scholar] [CrossRef]
  57. Quan, N. Greenhouse Gas Exchange above Potato and Pea Fields in the Lower Fraser Valley in British Columbia, Canada, THE UNIVERSITY OF BRITISH COLUMBIA. 2021. Available online: https://open.library.ubc.ca/soa/cIRcle/collections/ubctheses/24/items/1.0395480 (accessed on 2 September 2021).
  58. Kamanga, R.M.; Mbega, E.; Ndakidemi, P. Drought Tolerance Mechanisms in Plants: Physiological Responses Associated with Water Deficit Stress in Solanum lycopersicum. Adv. Crop Sci. Technol. 2018, 06, 1–8. [Google Scholar] [CrossRef]
  59. Varone, L.; Ribas-Carbo, M.; Cardona, C.; Gallé, A.; Medrano, H.; Gratani, L.; Flexas, J. Stomatal and non-stomatal limitations to photosynthesis in seedlings and saplings of Mediterranean species pre-conditioned and aged in nurseries: Different response to water stress. Environ. Exp. Bot. 2012, 75, 235–247. [Google Scholar] [CrossRef]
  60. Mafakheri, A.; Siosemardeh, A.; Bahramnejad, B.; Struik, P.C.; Sohrabi, E. Effect of drought stress on yield, proline and chlorophyll contents in three chickpea cultivars. Aust. J. Crop Sci. 2010, 4, 580–585. [Google Scholar]
  61. Li, W.; Zhang, S.; Shan, L. Responsibility of non-stomatal limitations for the reduction of photosynthesis-response of photosynthesis and antioxidant enzyme characteristics in alfalfa (Medicago sativa L.) seedlings to water stress and rehydration. Front. Agric. China 2007, 1, 255–264. [Google Scholar] [CrossRef]
  62. Beauclaire, Q.; Gourlez, L.; Motte, D.; Bernard, H.; Bernard, L. Proofs of non-stomatal limitations of potato photosynthesis during drought by using in-situ eddy covariance data 2021, 1–2. Available online: file:///C:/Users/MDPI/AppData/Local/Temp/EGU2020-5183-print.pdf (accessed on 29 September 2021).
  63. Wang, J.; Xiao, X.; Bajgain, R.; Starks, P.; Steiner, J.; Doughty, R.B.; Chang, Q. Estimating leaf area index and aboveground biomass of grazing pastures using Sentinel-1, Sentinel-2 and Landsat images. ISPRS J. Photogramm. Remote Sens. 2019, 154, 189–201. [Google Scholar] [CrossRef] [Green Version]
  64. Duursma, R.A.; Kolari, P.; Permki, M.; Pulkkinen, M.; Mkel, A.; Nikinmaa, E.; Hari, P.; Aurela, M.; Berbigier, P.; Bernhofer, C.; et al. Contributions of climate, leaf area index and leaf physiology to variation in gross primary production of six coniferous forests across Europe: A model-based analysis. Tree Physiol. 2009, 29, 621–639. [Google Scholar] [CrossRef] [Green Version]
  65. Ramezani, M.R.; Massah Bavani, A.R.; Jafari, M.; Binesh, A.; Peters, S. Investigating the leaf area index changes in response to climate change (case study: Kasilian catchment, Iran). SN Appl. Sci. 2020, 2, 1–11. [Google Scholar] [CrossRef] [Green Version]
Figure 1. Meteorological measurements for Rainfed (12 August–22 November 2020) and Irrigated (3 February–9 June 2021). (a,b) photosynthetic active radiation, µmol photons m−2 s−1 (PAR); (c,d) air temperature, °C (Tair); (e,f) vapor pressure deficit, kPa (VPD); (i,j) soil water content, cm3 cm−3 (SWC), measured at 0–20 cm depth, are shown as daily mean values; (g,h) daily and cumulated precipitation, mm (Pp), is shown as daily sum, black dots indicate irrigation times.
Water 13 03223 g001
Figure 2. Energy balance closure for (a) Rainfed and (b) Irrigated sites.
Water 13 03223 g002
Figure 3. Accumulated and daily gross primary productivity (GPP) in (a) Rainfed and (b) Irrigated, and maximum GPP accumulation rate (MGAR) in (c) Rainfed, and (d) Irrigated potato crop. The black arrow indicates the point of MAGR (maximum GPP accumulation rate).
Water 13 03223 g003
Figure 4. Half-hourly variation of gross primary production (GPP) of (a) Rainfed and (b) Irrigated potato crop in four different growth stages (sprouting, vegetative, tuberization, tuber bulking). Half-hourly averages are plotted. Vertical bars indicate the standard deviation.
Water 13 03223 g004
Figure 5. Half-hourly gross primary production (GPP) Versus incident PAR in four different growth stages (sprouting, vegetative, tuberization, tuber bulking) in (a) Rainfed and (b) Irrigated potato crop.
Water 13 03223 g005
Figure 6. Gross primary productivity (GPP) and leaf area index (LAI) versus days post planting (DPP) in (a) Rainfed and (b) Irrigated potato crop.
Water 13 03223 g006
Figure 7. Dry weight (DW) and tuber dry weight (TDW) in (a) Rainfed and (b) Irrigated; absolute growth rate (AGR) in (c) Rainfed and (d) Irrigated.
Water 13 03223 g007
Table 1. Mean, maximum, and sum of carbon fluxes throughout growth stages at Rainfed and Irrigated.
a Carbon FluxesSproutingVegetativeTuberizationTuber Bulking
RainfedIrrigatedRainfedIrrigatedRainfedIrrigatedRainfedIrrigated
NEEMean4.39 (±0.39)2.92 (±0.30)1.93 (±0.27)−1.96 (±0.34)−0.03 (±0.29)−5.55 (±0.46)0.35 (±0.27)−3.02 (±0.39)
Max.4.13 (±0.37)1.95 (±0.30)−0.30 (±0.30)−7.07 (±0.50)−0.52 (±0.30)−8.36 (±0.50)−0.26 (±0.28)−4.82 (±0.44)
sum57.04 (±5.11)46.7 (±4.80)88.8 (±12.5)−76.6 (±13.3)0.72 (7.80)−260.9 (±21.82)5.67 (±4.38)−75.6 (±9.83)
GPPMean−0.60 (±0.06)−1.77 (±0.01)−2.06 (±0.03)−6.88 (±0.15)−3.20 (±0.08)−11.3 (±0.28)−3.01 (±0.07)−8.47 (±0.19)
Max.−0.80 (±0.05)−2.61 (±0.02)−3.46 (±0.09)−13.4 (±0.34)−3.87 (±0.11)−13.8 (±0.37)−3.57 (±0.09)−11.16(±0.29)
sum−7.82 (±0.75)−28.28 (±0.09)−94.8 (±1.19)−268 (±6.02)−86.4 (±2.17)−529.9 (±13.05)−48.2 (±1.14)−211.8 (±4.860)
RECOMean4.99 (±0.34)4.69 (±0.31)3.99 (±0.25)4.91 (±0.19)3.23 (±0.21)5.72 (±0.19)3.37 (±0.20)5.45 (±0.20)
Max.5.26 (±0.38)5.06 (±0.36)4.97 (±0.31)6.29(±0.16)4.26 (±0.19)7.75(±0.16)3.80 (±0.18)7.38 (±0.18)
sum64.9 (±4.36)75.04 (±4.89)184 (±11.3)191.5 (±7.33)87.1 (±5.63)268.9 (±8.77)53.9 (±3.24)136.2 (±4.96)
a Carbon flux units for mean, maximum, and sum are g C m−2 d−1, g C m−2 d−1, and g C m−2, respectively for NEE, GPP, and RECO. Negative values indicate carbon fixation by the crop from the atmosphere and positive emissions by the ecosystem.
Table 2. Leaf area duration days in Rainfed and Irrigated, classified by growth stage.
Growth StageRainfed (Days)Irrigated (Days)
Vegetative67.9589.11
Tuberization78.73117.03
Tuber Bulking29.2585.52
Publisher’s Note: MDPI stays neutral with regard to jurisdictional claims in published maps and institutional affiliations.

