Article

Solvothermal Synthesis of ZnO Nanoparticles for Photocatalytic Degradation of Methyl Orange and p-Nitrophenol

1
Institute of Environment and Ecology, Shandong Normal University, Jinan 250358, China
2
School of Environmental and Municipal Engineering, Qingdao University of Technology, Qingdao 266525, China
3
Key Laboratory for Liquid-Solid Structural Evolution and Processing of Materials, Shandong University, Jinan 250061, China
4
College of Geography and Environment, Shandong Normal University, Jinan 250358, China
*
Authors to whom correspondence should be addressed.
These authors are co-first authors on this work.
Water 2021, 13(22), 3224; https://doi.org/10.3390/w13223224
Submission received: 9 October 2021 / Revised: 21 October 2021 / Accepted: 9 November 2021 / Published: 13 November 2021

Abstract

:
The photocatalytic degradation of organic pollutants is an effective method of controlling environmental pollution. ZnO nanoparticles (ZnO NPs) were prepared by the solvothermal method and characterized by scanning electron microscopy (SEM), energy dispersive spectroscopy (EDS), X-ray diffraction (XRD), X-ray photoelectron spectroscopy (XPS), and UV–visible diffuse reflectance spectroscopy (UV–Vis DRS). The results showed that the ZnO NPs had a uniform size of 25–40 nm, hexagonal wurtzite structure, and a band gap of 2.99 eV. The photocatalytic degradation of methyl orange (MO) and p-nitrophenol (PNP) was used as a model reaction to evaluate the photocatalytic activity of ZnO NPs. The photocatalytic degradation rates (pseudo-first-order kinetics) of MO and PNP were 92% (0.0128 min1) and 56.2% (0.0042 min1), respectively, with a 25 W ultraviolet lamp, MO/PNP concentration = 20 mg/L, ZnO NPs dose = 1.5 g/L, and time = 180 min. The photocatalytic mechanism of ZnO NPs and degradation pathways of MO and PNP were also proposed. The results provide valuable information and guidance for the treatment of wastewater via photocatalytic methods.

1. Introduction

Energy and environmental issues are the two major limitations that restrict the sustainable development of humankind and have become a focus for all countries in the world. Photocatalytic technology has become an important technical means of solving energy and environmental problems worldwide because of its ability to directly use sunlight to drive the photolysis of water to produce hydrogen, perform organic synthesis, and degrade pollutants [1]. Photocatalytic technology has several advantages. Photocatalysis uses green solar energy and mild reaction conditions, it is easy to operate, it can effectively reduce the consumption of nonrenewable energy, and it generates less secondary pollution than traditional chemical processes. Additionally, the semiconductor catalyst itself is nontoxic and harmless, easy to obtain, and stable; it exhibits performance and recyclability and has other advantages [2].
At present, semiconductor photocatalysts mainly include TiO2, CdS, ZnS, and SiO2. Among them, TiO2 is the most widely used. However, traditional TiO2 photocatalysts have a very low sunlight utilization rate [2]. During photocatalysis, the electron–hole pair recombination rate generated by the representative TiO2 is high. The large-scale application of traditional photocatalysts in actual water treatment is uneconomical, and these disadvantages limit the development prospects of traditional TiO2 photocatalysts. However, ZnO, a new generation of direct band gap, wide-bandgap semiconductors, has a band gap of 3.37 eV, an exciton binding energy of 60 meV, and the advantages of simple preparation, high stability, and low cost [3]. ZnO is considered a suitable TiO2 substitute because its photodegradation mechanism has been proven to be similar to that of TiO2 [4]. According to reports, ZnO is sometimes more efficient than TiO2, and its effect on advanced oxidation of bleaching wastewater from pulp mills and photocatalytic oxidation of phenol is especially remarkable [5,6]. Moreover, ZnO has a direct band gap and band edge position similar to those of TiO2, and the electron mobility is 10–100 times higher than that of TiO2, thereby reducing the efficiency of electron transfer [7]. Therefore, ZnO has been indicated to have great potential in a wide range of photocatalysis and photoelectrochemical applications. The methods for regulating the growth of nanostructured ZnO mainly include hydrothermal synthesis, chemical vapour precipitation, and the sol-gel method [8,9,10]. Common methods of improving the photocatalytic activity of ZnO include doping metals and nonmetals, depositing precious metals, constructing heterojunctions, and coupling carbon materials [11]. Yunlong Zhou prepared nano-ZnO/bamboo charcoal composites, which had a photocatalytic activity of 92.3% for the degradation of methyl orange (MO) under UV light for 40 min [12]. Umar prepared ZnO balls that had a photocatalytic activity of 100% for the degradation of methylene blue (MB) under UV light over 70 min [13].
Although there are many methods of synthesizing ZnO nanomaterials, most of the synthesis methods have complicated steps, and some require surfactants or structure-directing agents to control the morphology during synthesis. Moreover, the photocatalytic performance of ZnO and its relationships to size and morphology are not very clear thus far. Pengfei Cheng synthesized sea urchin-like layered ZnO-TiO2 photocatalysts by a hydrothermal method. The ZnO-TiO2 photocatalyst is a 3D urchin-shaped TiO2 nanosphere with 1D ZnO nanospindles (UTZ) on the surface, ranging in diameter from 1.5 mm to 2.5 mm. The degradation rate of MO by the ZnO-TiO2 photocatalyst was up to 100% under UV lamp irradiation for 30 min [14]. Peng Zhang synthesized ZnO@C gemel hexagonal microrods with thin hydrothermal carbon (HTC) layers by a hydrothermal method. The rate of degradation of ZnO@C to MB was close to 100% within 40 min under UV lamp irradiation [15]. Rashidi synthesized ZnO nanostructures by a solvothermal (ethanol) method using molybdate phosphoric acid. When the conditions were changed, 100 nm nanoparticles and 250 nm microrod structures were synthesized. These particles showed high performance in the photocatalytic degradation of MO and decolorized by almost 100% in only 20 min [16,17].
Therefore, in this work, a simple solvothermal synthesis method without the introduction of surfactants and agents was used to prepare small ZnO NPs with a sphere-like morphology and a large visible response edge of 415 nm. The specific objectives were (1) to prepare ZnO NPs via a solvothermal method, (2) to evaluate the photocatalytic activity of ZnO NPs by degradation of MO and p-nitrophenol (PNP), and (3) to propose the photocatalytic mechanism of ZnO NPs and degradation pathways of MO and PNP.

2. Experimental

2.1. Reagents and Materials

Dihydrate and zinc acetate (Zn(AC)2·2H2O), sodium hydroxide (NaOH), ethanol (C2H6O), and methyl orange (C14H14N3NaO3S, MO) were purchased from Sinopharm Chemical Reagent Co., Ltd. P-nitrophenol (PNP) was purchased from Tianjin Damao Chemical Reagent Co., Ltd. All of these reagents were of AR grade and used without further purification. Deionized water was used to prepare all the solutions.

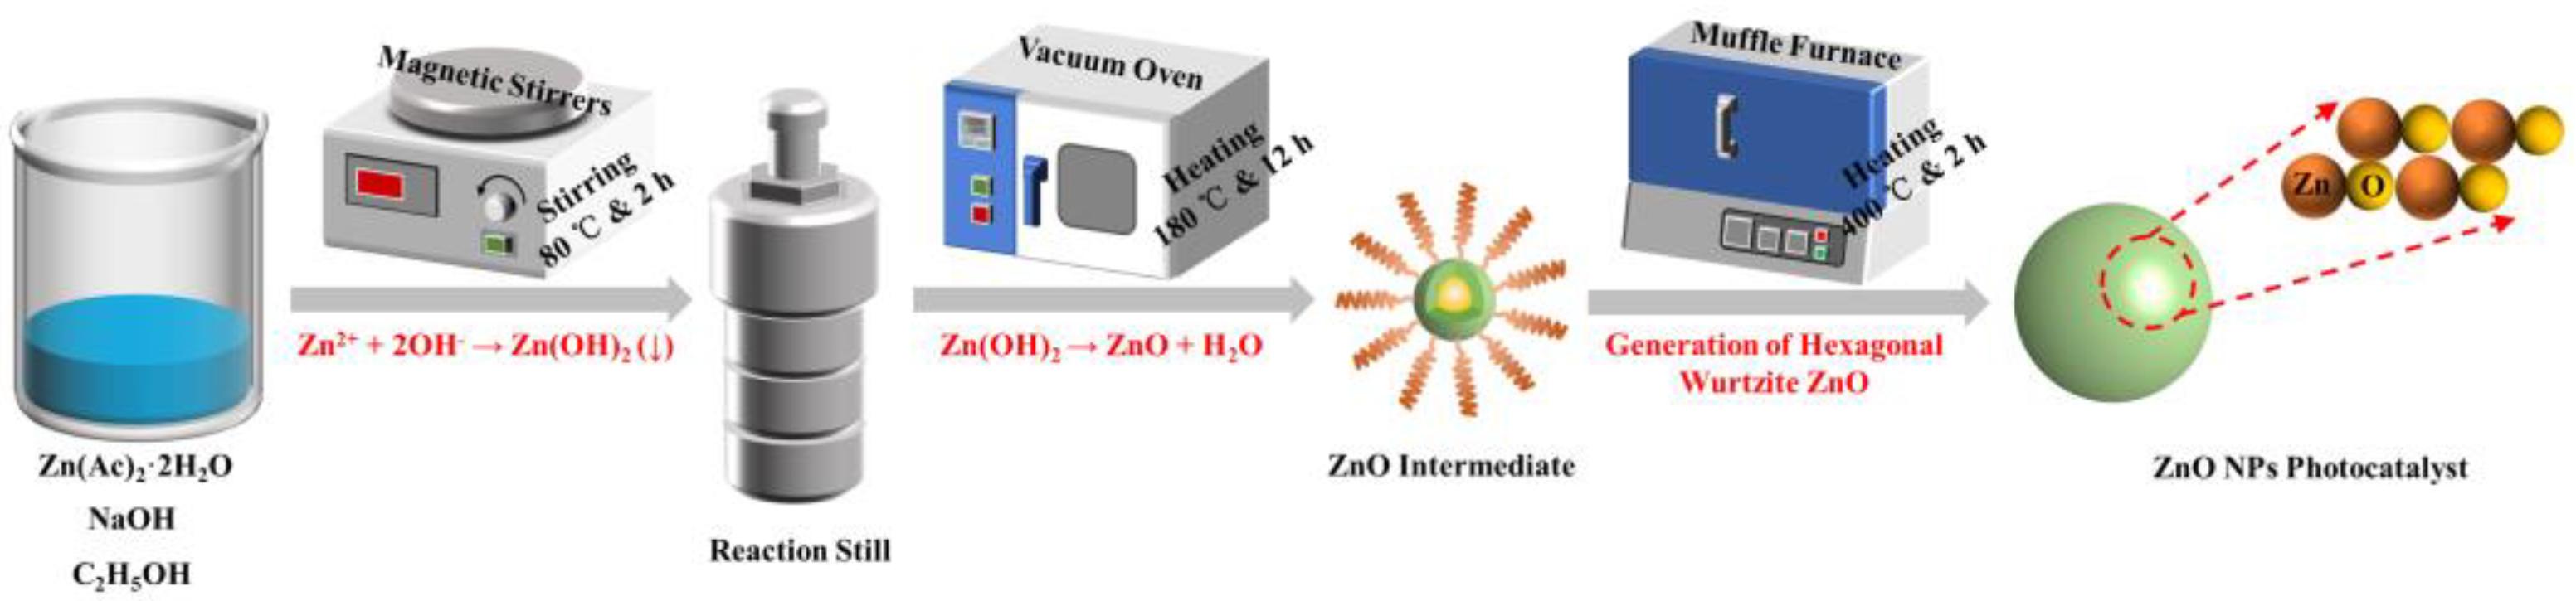
2.2. Preparation of ZnO NPs

ZnO NPs were prepared by the solvothermal method as follows: 0.22 g Zn(AC)2·2H2O and 0.064 g NaOH were added to 80 mL ethanol, and the mixture was magnetically stirred at 80 °C for 2 h. A white precipitate gradually formed. The mixture was directly transferred to a 100 mL Teflon autoclave, sealed and stored at 180 °C for 12 h. After the reaction, the autoclave was cooled naturally to room temperature. The mixture was centrifuged and washed with deionized water and ethanol for more than 5 times. The solid precipitates were dried for 3 h in a high-temperature oven at 80 °C, calcined for 2 h in a muffle furnace at 400 °C, cooled to room temperature, and ground to obtain ZnO NPs. Figure 1 shows the preparation process of ZnO NPs.

2.3. Characterization of ZnO NPs

Scanning electron microscopy (SEM) images with energy dispersive spectroscopy (EDS) were obtained on a QUANTA Q400 thermal-field emission scanning electron microscope and used to determine the morphology and aggregation status of the prepared ZnO NPs.
X-ray diffraction (XRD) patterns were recorded on a Bruker D8 Advance X-ray diffractometer with Cu Kα radiation (λ = 1.5418 Å) and used to determine the crystal structure and phase composition of the prepared ZnO NPs.
X-ray photoelectron spectroscopy (XPS) measurements were performed using a Thermo ESCALAB 250Xi system with an Al Kα X-ray source. All of the binding energies were referenced to the C 1s peak at 284.8 eV, which corresponded to the surface adventitious carbon.
Absorption spectra were obtained by UV–visible diffuse reflectance spectroscopy (UV-3600) using BaSO4 as a reference.

2.4. Photocatalytic Activity Test

The photocatalytic activity of ZnO NPs was monitored by the degradation of MO/PNP in aqueous solution. In all photocatalytic experiments, an appropriate amount of photocatalyst was added to 50 mL of MO/PNP solution at a concentration of 20 mg/L. The samples were placed in a photocatalytic reaction apparatus and stirred magnetically in a dark room for 30 min to ensure adsorption balance. A 25 W ultraviolet lamp was used as the light source, and 1.5 mL equal samples were taken every 30 min to remove the particles by centrifugation. The absorbance of the filtrate was recorded on a TU-1900 ultraviolet spectrophotometer, on which the absorbance of MO was recorded at λ = 464 nm and that of PNP was recorded at λ = 317 nm. Finally, the filtrate was analysed. According to the relationship between the absorbance and concentration, the concentration of MO was calculated according to the Beer–Lambert Law, and the removal rate (RR) was calculated as follows:
RR = (C0Ct)/C0 × 100%
where C0 is the initial concentration of MO/PNP in water in mg/L, and Ct is the mass concentration of MO/PNP in water when the reaction time is t (min) in mg/L.

3. Results and Discussion

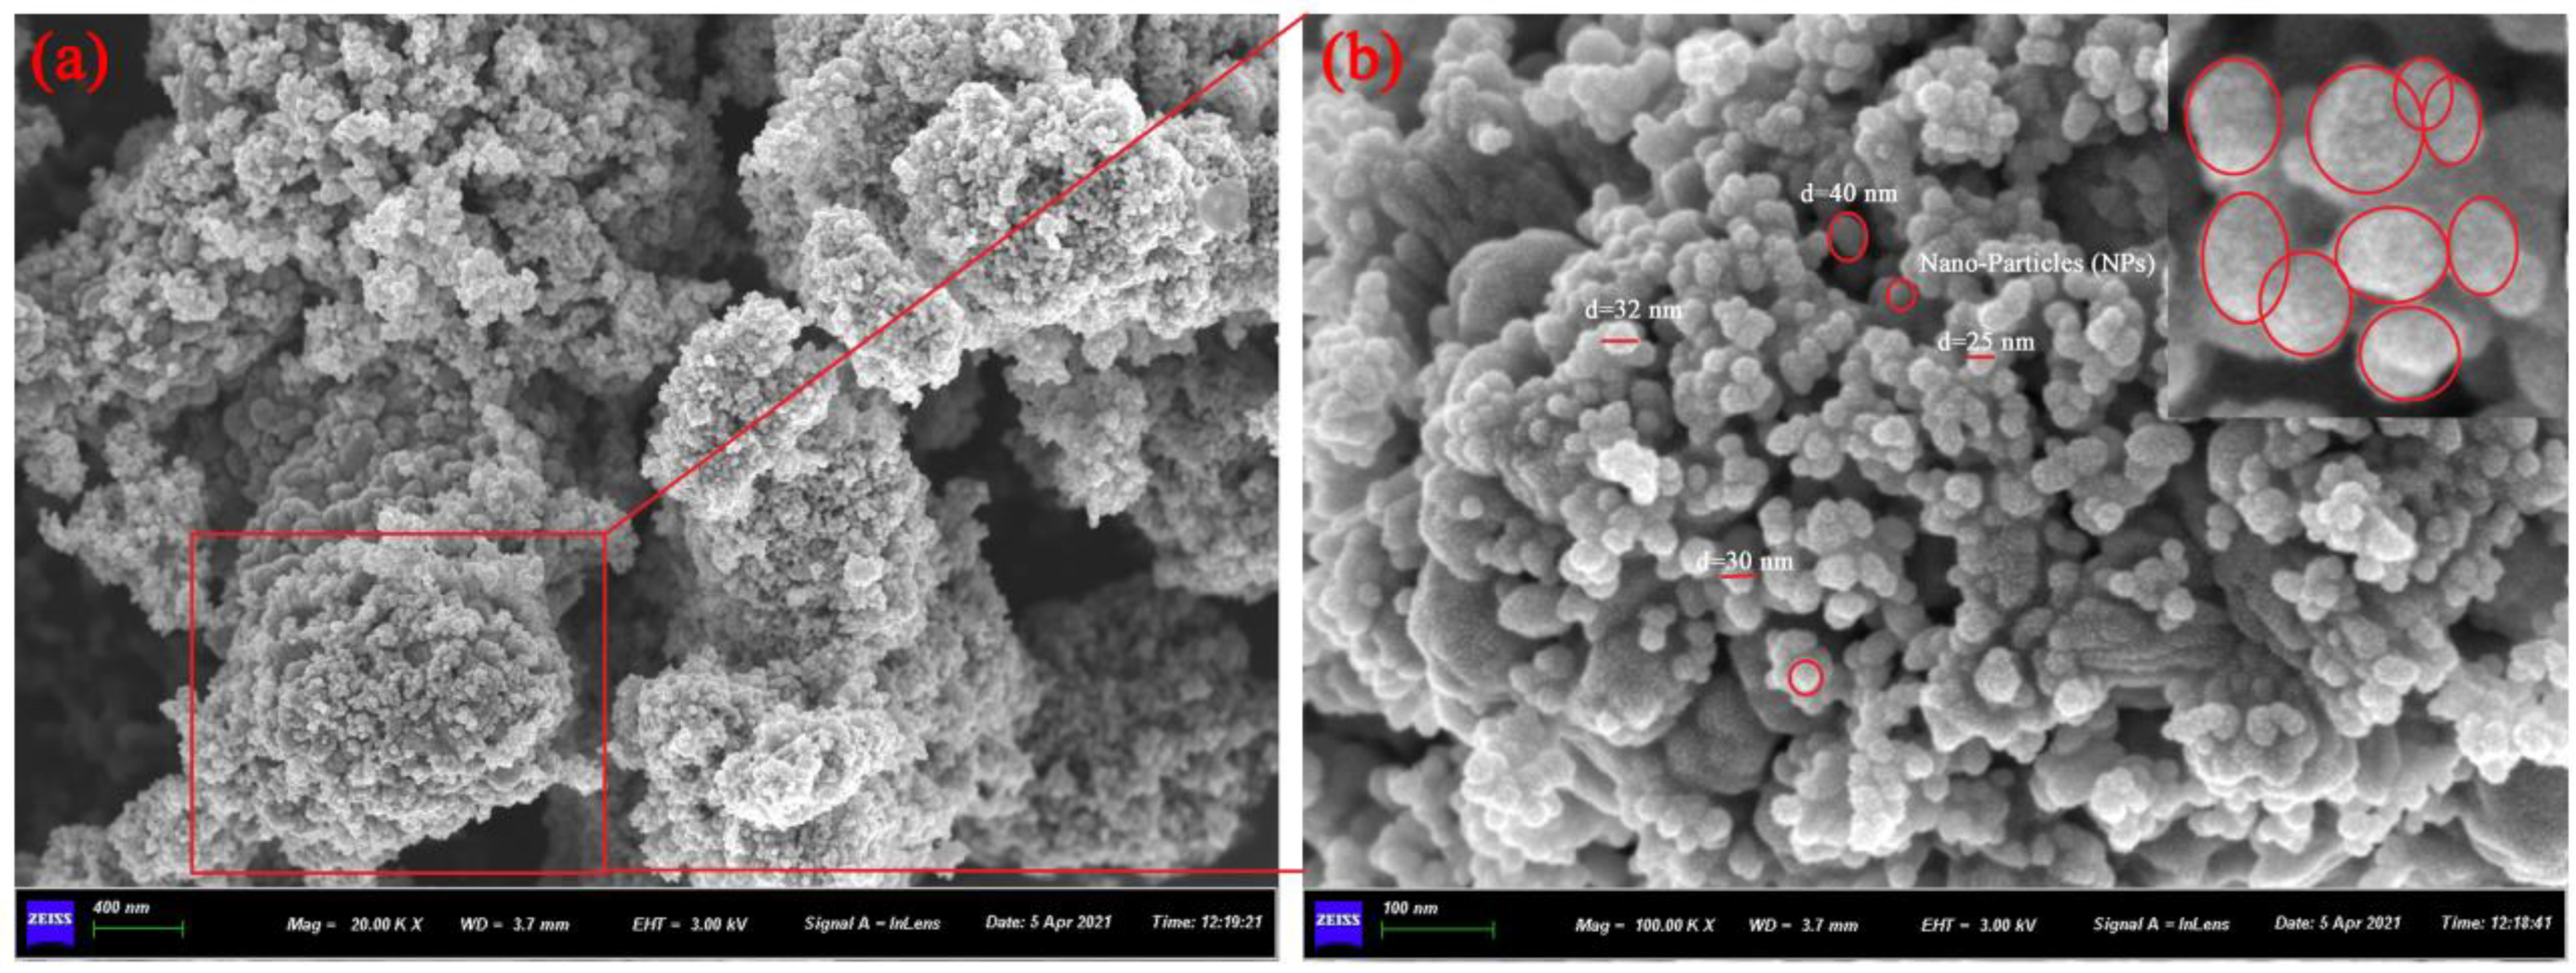
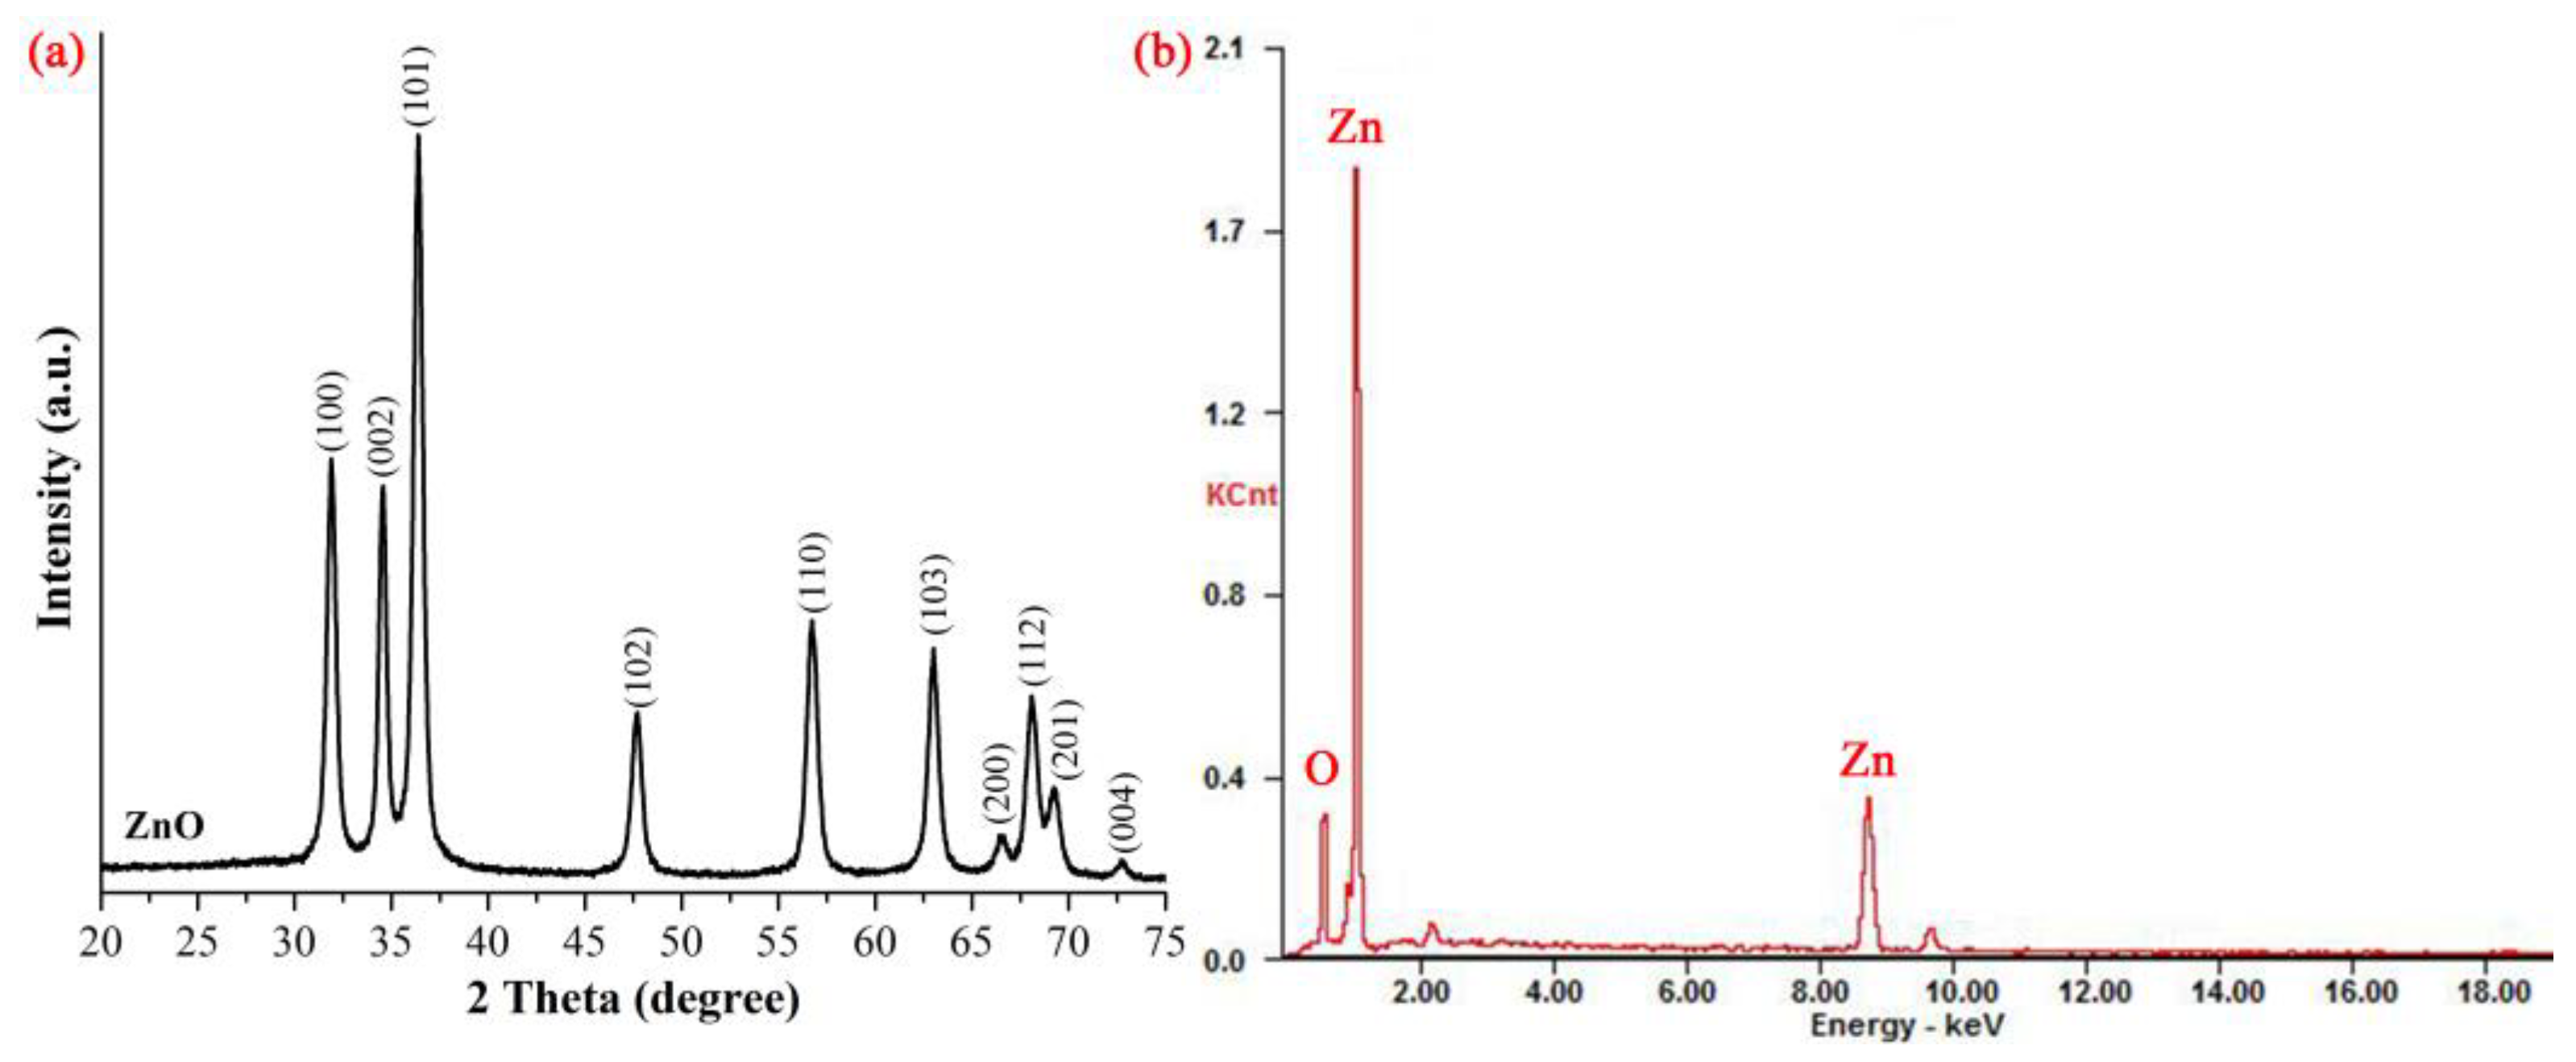
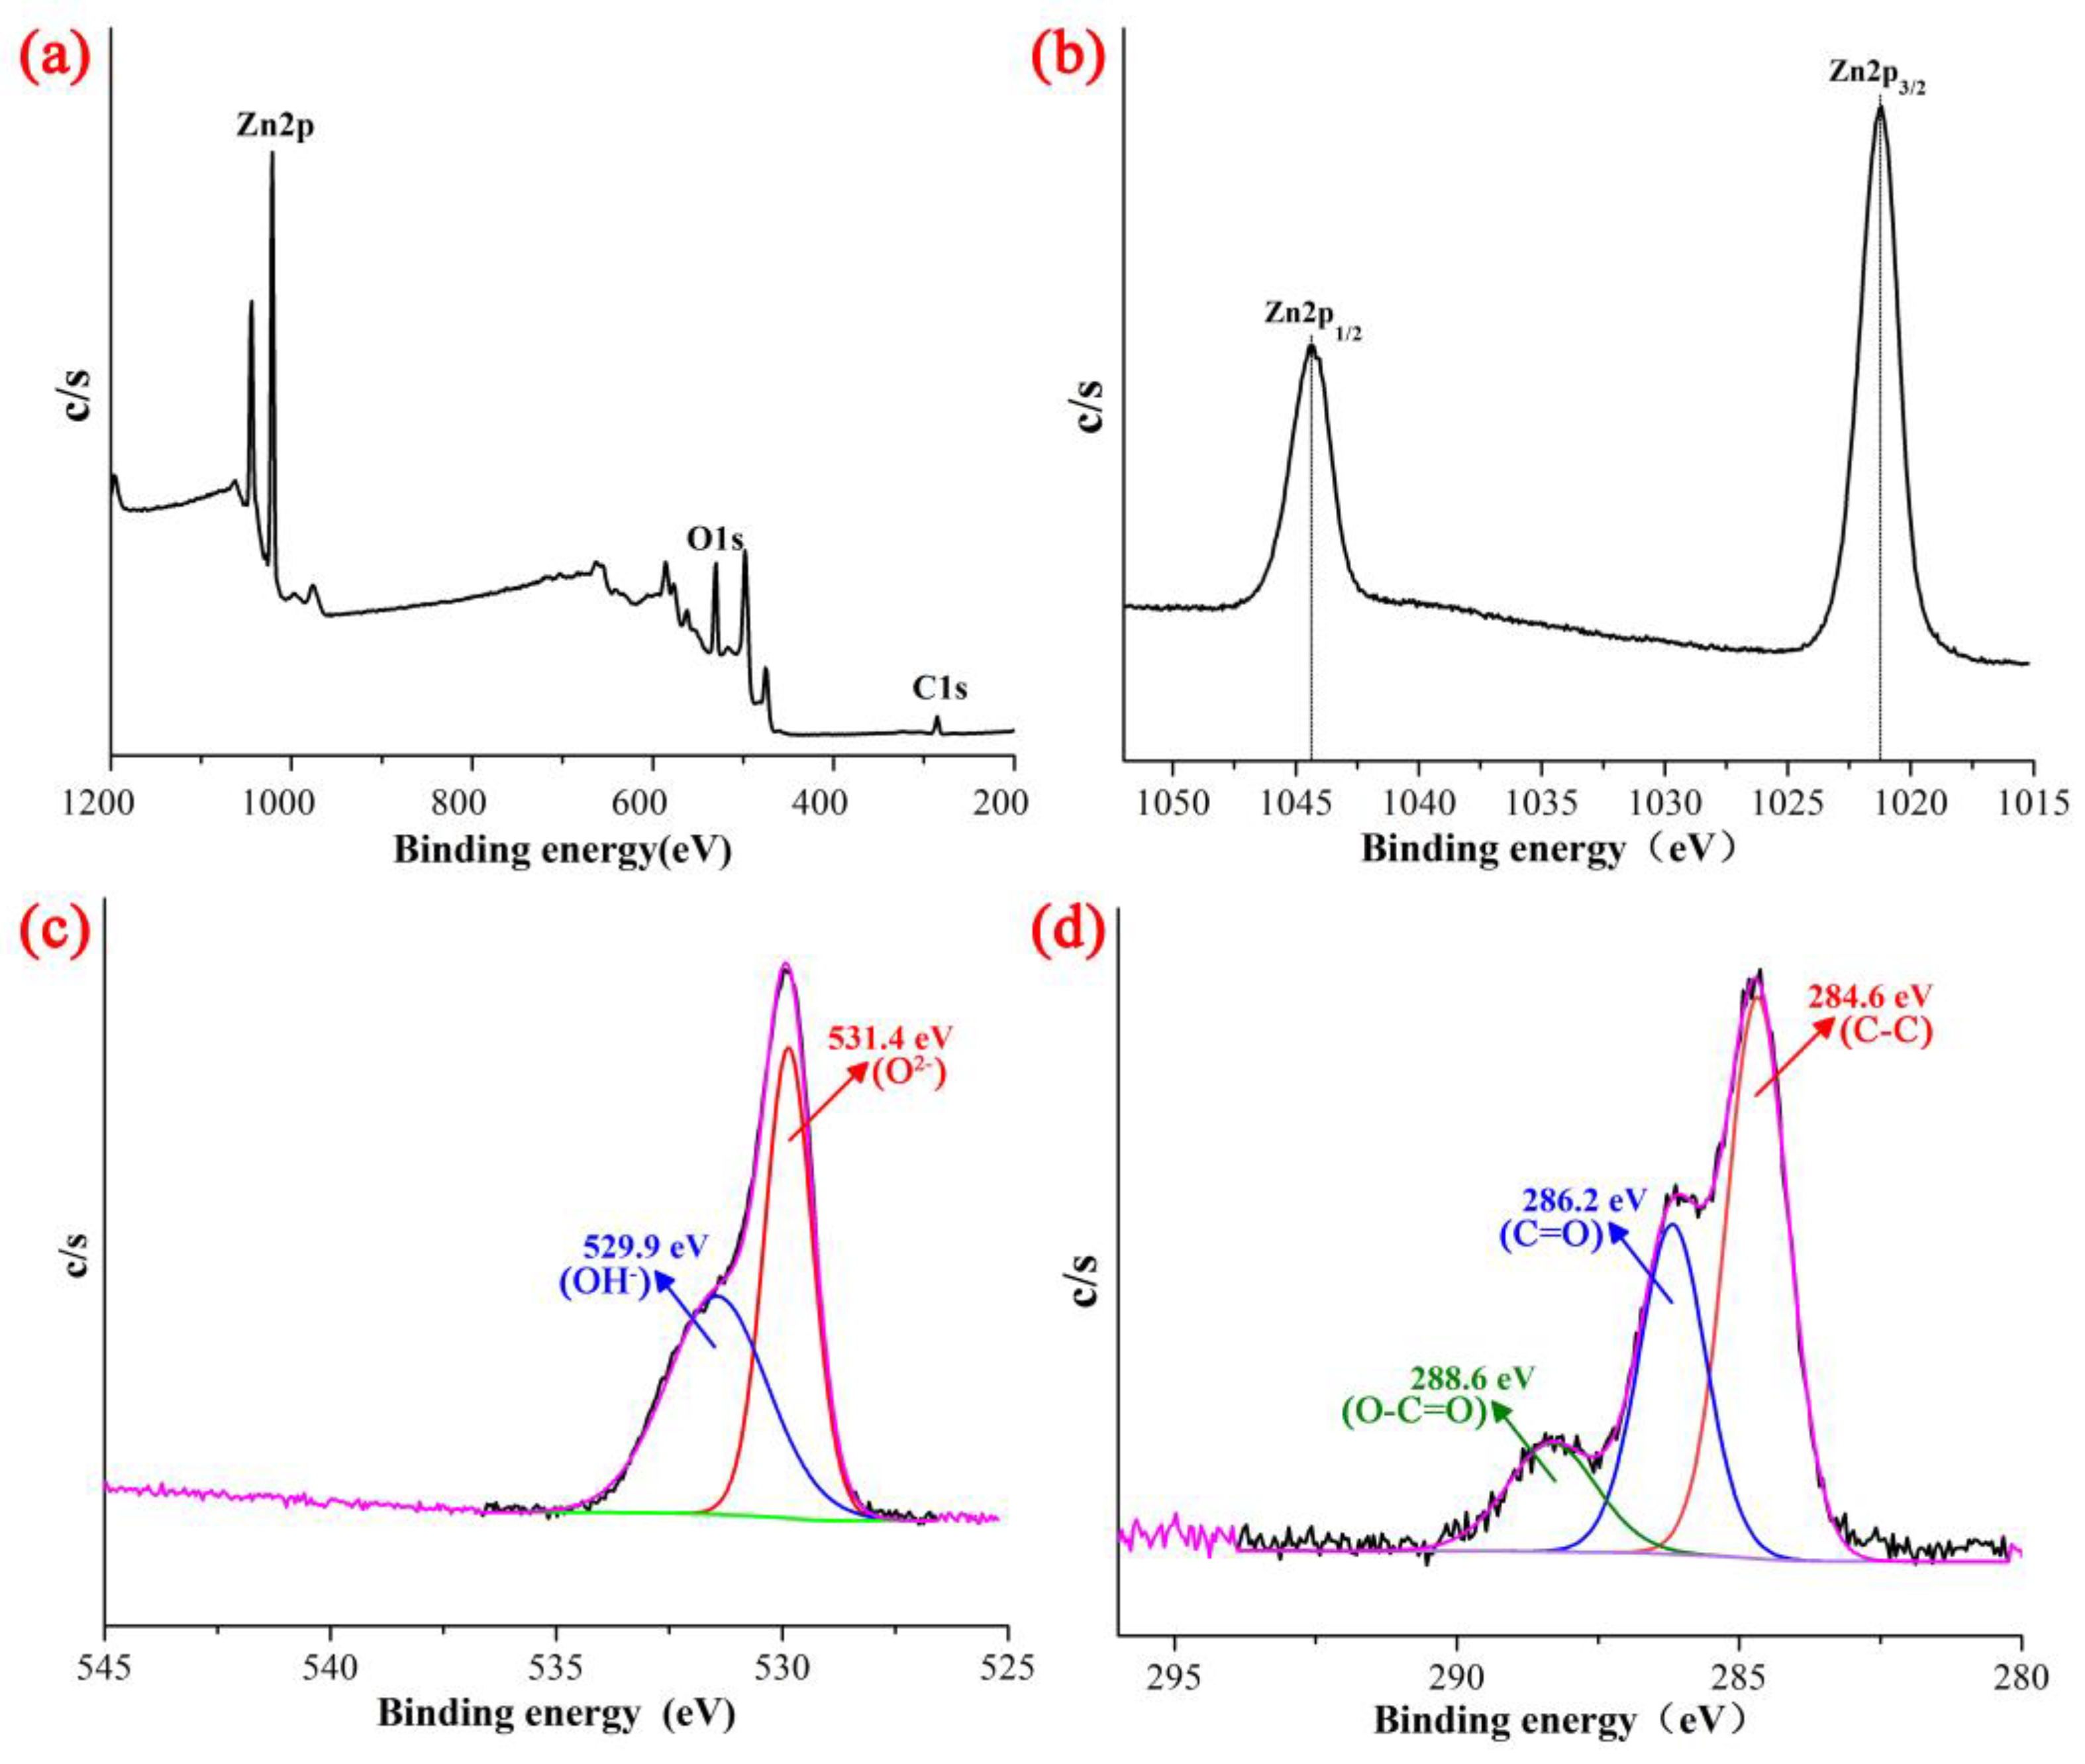
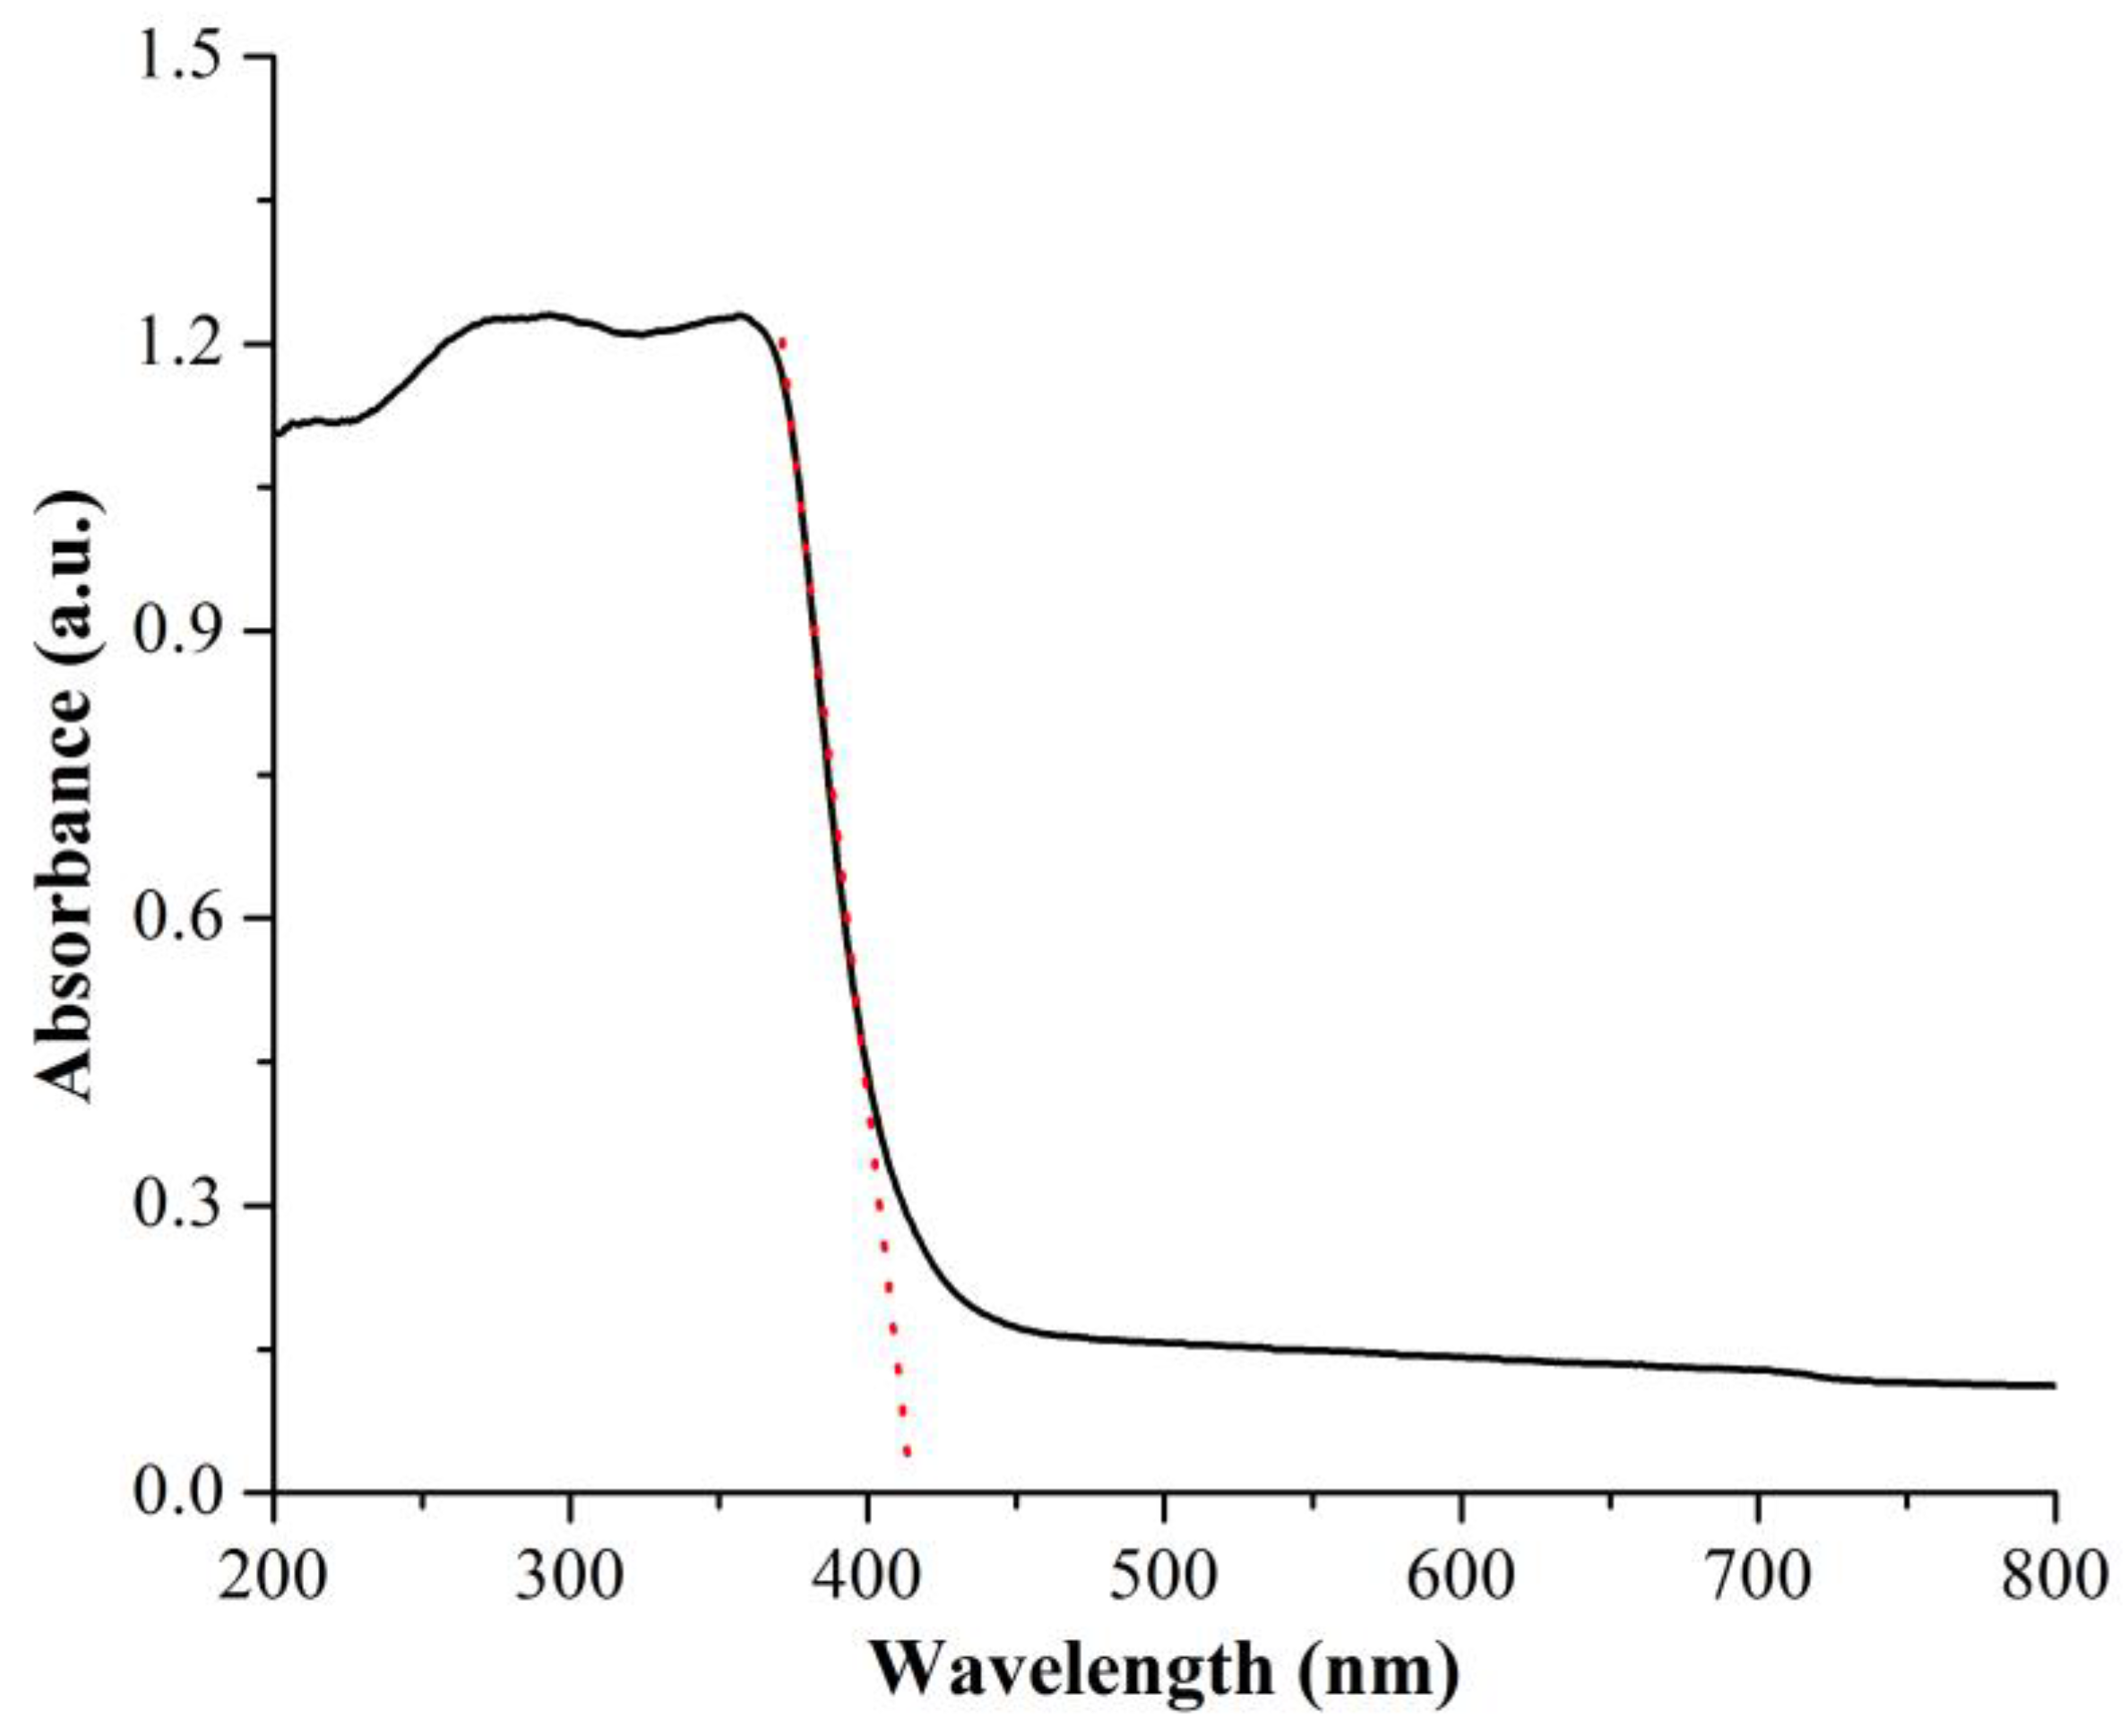
3.1. Characterization of ZnO NPs

Morphology analysis: the morphology and structure of the obtained ZnO were characterized by SEM. Figure 2 shows that the diameter of ZnO NPs was approximately 25–40 nm. The grown nanoparticles were almost spherical. The particle size was relatively uniform, while the structure between the particles was loose, and there were many voids. This loose structure composed of nanoparticles is conducive to improving the photocatalytic performance of the material [18].
XRD pattern analysis: Figure 3a shows the XRD patterns of the ZnO NPs, which are consistent with the data in PDF no. 01-070-8070. The crystal structure and phase purity of the sample are demonstrated. The diffraction peaks at 2θ = 31.8°, 34.4°, 36.3°, 47.6°, 56.6°, 62.9°, 66.4°, 68.0°, 69.1°, and 72.6° correspond to the (100), (002), (101), (102), (110), (103), (200), (112), (201), and (004) crystallographic planes, respectively. The sharp peaks imply a well-crystallized ZnO material. No additional impurity peaks were detected, indicating the high purity of the ZnO NPs. In this pattern, all the detectable peaks can be attributed to the hexagonal wurtzite structure. The grain size of ZnO NPs can be calculated by the Scherrer equation:
D = /(cosθ·B1/2)
where D is the grain size of the nanomaterial; K is the Scherrer constant of the diffraction peak; the value of ZnO was equal to 0.89; λ is the wavelength of X-ray, 0.15418 nm; θ is Bragg diffraction Angle; and B1/2 is half the width of the diffraction peak [19]. According to the crystal plane of anatase (101) corresponding to ZnO NPs at 36.3°, the grain size of ZnO NPs is calculated as 0.1696 nm. The grain size of 0.1696 nm is too small compared with the ZnO NPs particles obtained by SEM image (25–40 nm). This is due to the size of ZnO NPs from the SEM images being the agglomerates of unit cells (0.1696 nm from XRD).
Element composition: the EDS analysis results are shown in Figure 3b and Table 1. The ZnO NPs prepared by the solvothermal synthesis method only contained Zn and O and did not contain other impurities. The relative weight percentages of Zn and O in the ZnO NPs were 84.27% and 15.73%, respectively, and the atomic percentages were 56.74 and 43.26%, respectively. XPS was used to analyse the chemical state and elemental composition of the ZnO NPs, and the results are shown in Figure 4. The percentages of O and Zn atoms in the ZnO NPs were 39.16% and 41.28%, respectively, which is close to a 1:1 ratio. As shown in Figure 4b, the Zn 2p spectrum of ZnO has two peaks at 1044.7 and 1021.5 eV, and the binding energy interval between these two lines is 23.2 eV, which is within the standard reference value range of the ZnO wurtzite structure. This result indicates that Zn ions are present in the normal Zn2+ valence state in the nanocomposites [20]. As shown in Figure 4c, the O 1s spectrum of ZnO has two peaks at 531.4 and 529.9 eV. The main peak at 529.9 eV is related to the lattice oxygen species (O2−) in the Zn-O bond of the wurtzite structure, while the main peak at 531.4 eV is related to the chemically adsorbed oxygen species (OH). The relative surface hydroxyl content is 1.07. The C 1s spectrum of ZnO in Figure 4d has three peaks at 284.6 eV, 286.2 eV, and 288.6 eV, as does the standard C 1s spectrum that shows (C-C), (C=O), and (O-C=O) bonds. There is no XPS signal corresponding to the Zn-C bond in the Zn 2p orbital or the C 1s orbital (approximately 281 eV), indicating that carbon is not doped in the ZnO NPs [21,22].
UV–Vis DRS: Figure 5 shows the UV–Vis absorption spectra of the prepared ZnO NPs. ZnO has a strong response to UV light at wavelengths of less than 390 nm but has a low response in the visible light range at wavelengths of more than 390 nm. The spectra display sharp, fundamental absorption in the ultraviolet–visible region with a band-gap absorption edge of 415 nm, which can be assigned to the intrinsic band-gap absorption of ZnO due to the electronic transition from the valance band to the conduction band. According to the equation Eg = hc/λ = 1240/λ (where h is the Planck constant (4.13566743 × 10⁻¹⁵ eV·s), c is the light velocity (3 × 10⁸ m/s) and λ is the wavelength), the energy gap of ZnO NPs is 2.99 eV [23].

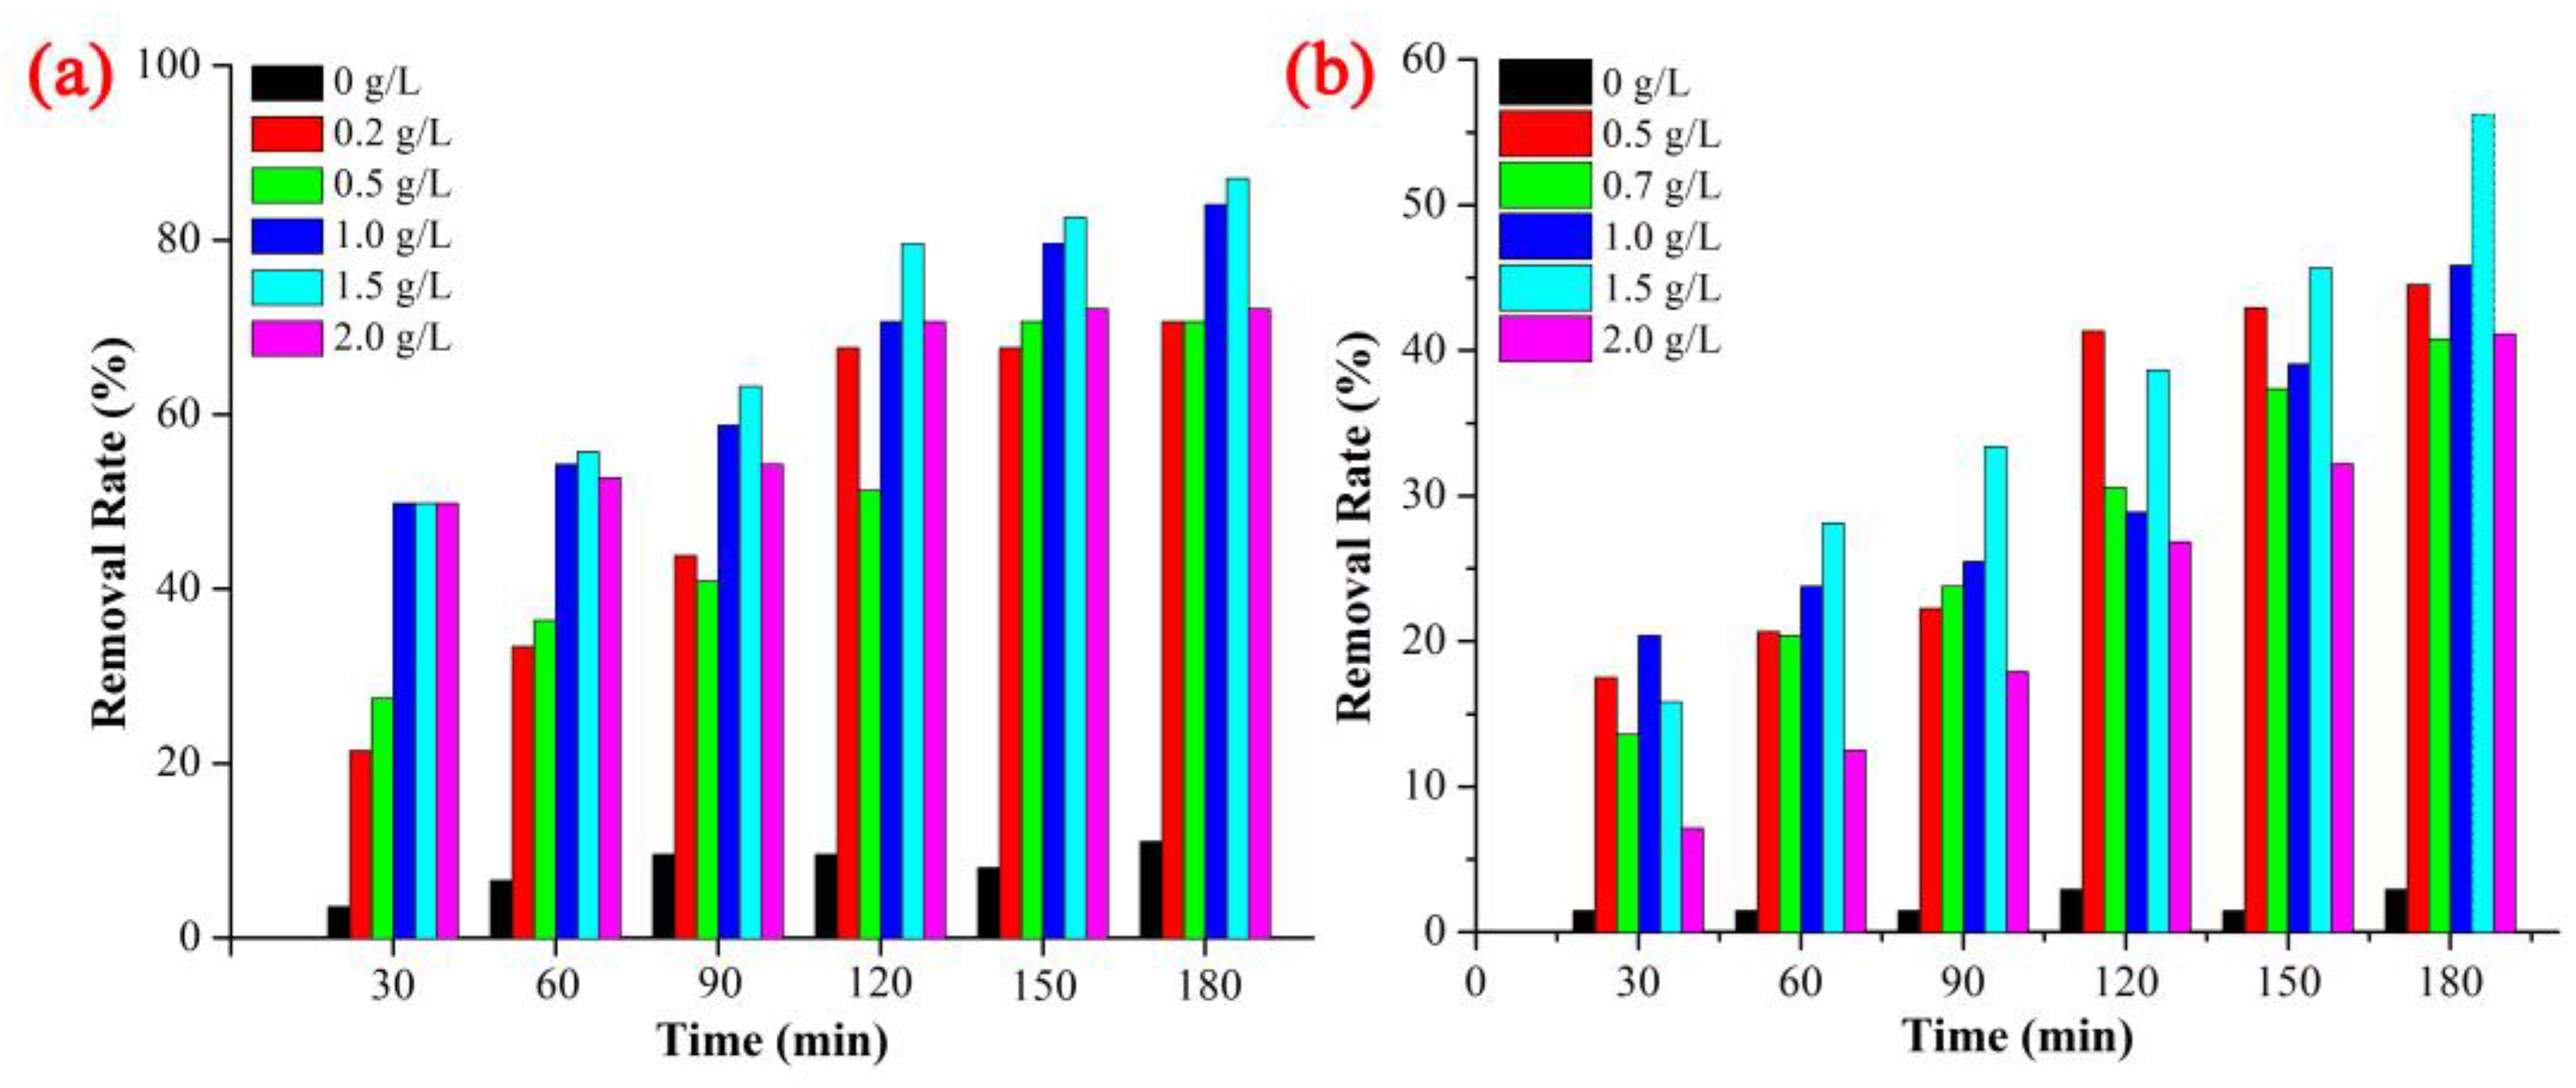
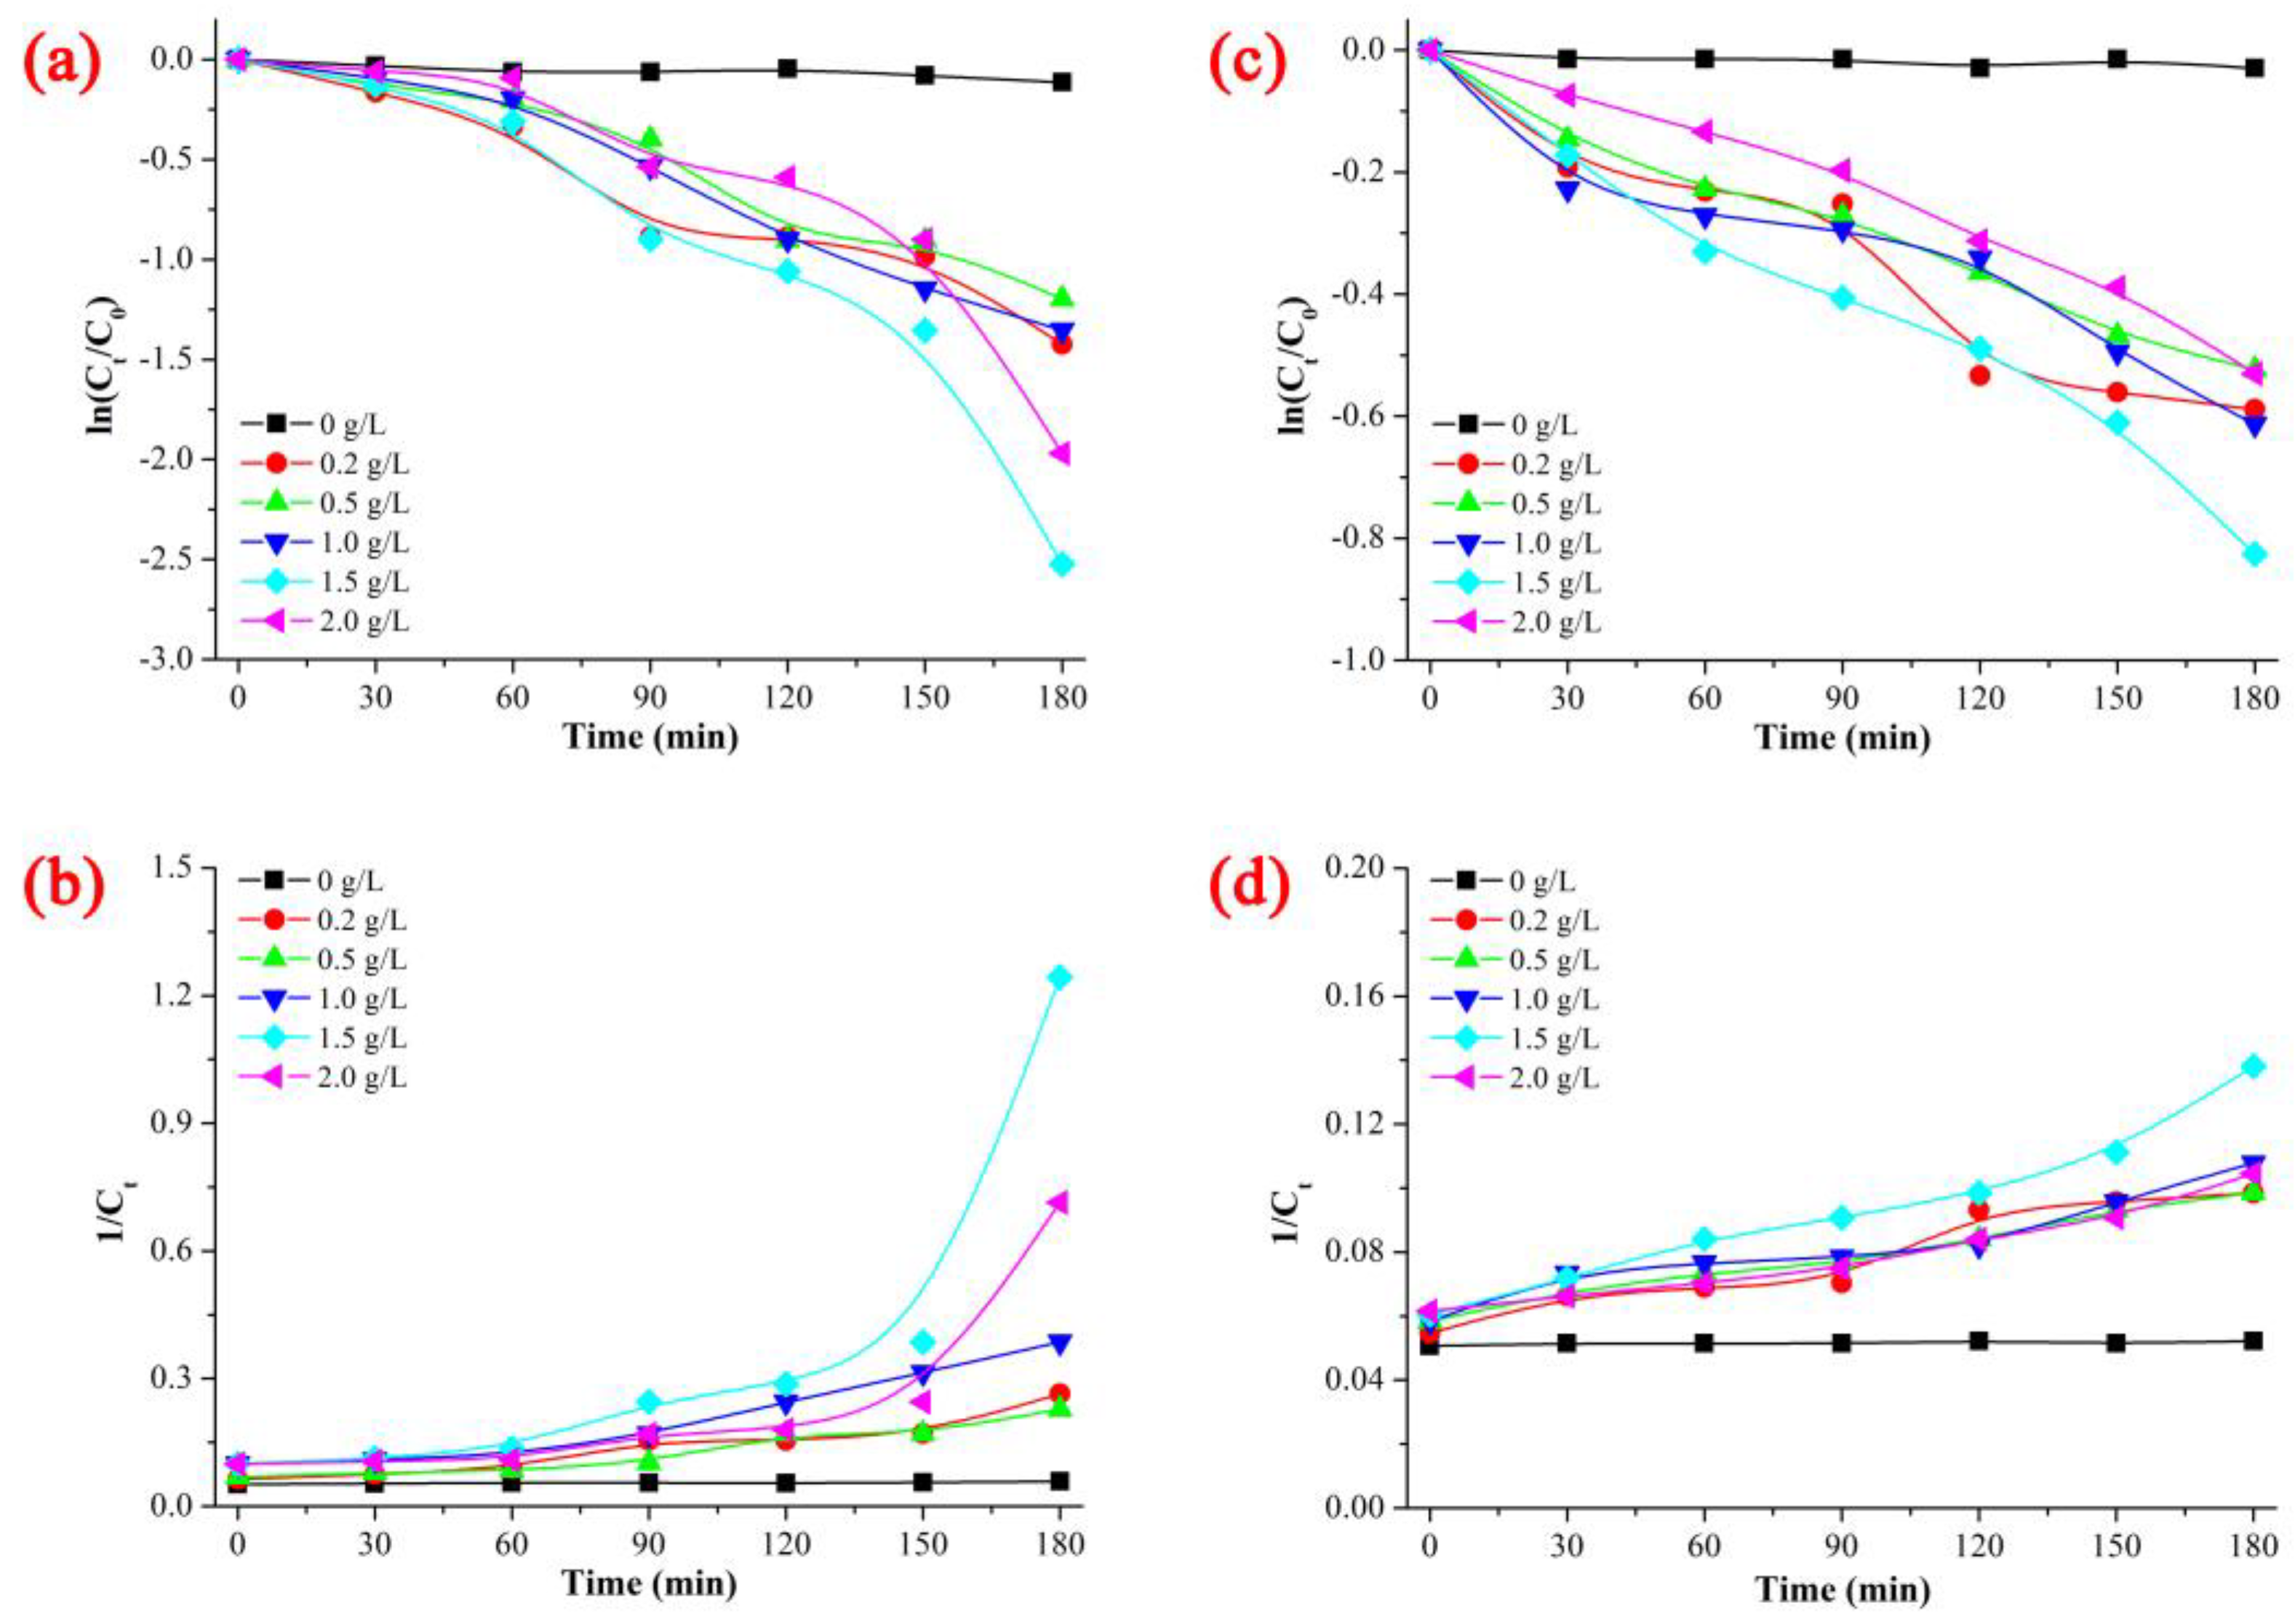
3.2. Photocatalytic Activity and Degradation Kinetics of ZnO NPs

The photocatalytic activity of ZnO NPs was evaluated by detecting the degradation of MO and PNP in aqueous solution under UV lamp irradiation. Figure 6a shows the photocatalytic degradation results of MO in the presence of ZnO. The amount of catalyst is a very important factor in photocatalytic oxidation [24]. The mass concentration of MO was fixed at 20 mg/L, and the dose of ZnO was changed to compare the influence on the degradation rate of MO after 180 min, as shown in Figure 6a. The blank experiment without added catalyst showed that the degradation rate had no obvious change after reaction for 180 min. The photodegradation rate of MO increased with an increasing ZnO dose in the range of 0.2–1.5 g/L. When the catalyst concentration was 2.0 g/L, the photodegradation rate of MO decreased with an increasing catalyst amount. Figure 6b shows the photocatalytic degradation of PNP in the presence of ZnO. The mass concentration of PNP was fixed at 20 mg/L, and the dose of ZnO was changed to compare the influence of the ZnO dose on the degradation rate of PNP after 180 min, as shown in Figure 6b. The blank experiment without catalyst showed that the degradation rate had no obvious change after reaction for 180 min. The photodegradation rate of PNP increased with an increasing ZnO dose in the range of 0.2–1.5 g/L. When the catalyst dose was 2.0 g/L, the photodegradation rate of PNP decreased with an increasing catalyst amount.
These results indicate that when the amount of catalyst is small, the concentration of catalyst in the reaction system is small, the adsorption capacity of the degraded material is weak, and the ultraviolet light of the system cannot be fully utilized. Therefore, the photocatalytic activity is poor, and the rate of pollutant degradation is low. With the increase in the amount of catalyst, the amount of adsorption on the degraded materials increases, and the number of electron–hole pairs generated by ZnO increases, which is beneficial for improving the photocatalytic activity of ZnO in the photocatalytic reaction — and the degradation rate of pollutants increases. However, when there is too much catalyst, the turbidity of the solution increases and the transmittance decreases, and the ZnO NPs cause the reflection of incident light, which affects the utilization rate of the light source; the number of electron–hole pairs decrease, leading to the photocatalytic activity of the catalyst and the degradation rate of pollutants.
In this paper, the pseudo-first-order and pseudo-second-order kinetics models were used to evaluate the degradation kinetics of MO and PNP with different doses of ZnO NPs [25]. The kinetics equations were as follows:
ln(Ct/C0) = −k1′appt + b1
1/Ct = −k2′appt + b2
where k1′app and k2′app are the degradation kinetic constants of the pseudo-first-order kinetics model and pseudo-second-order kinetics model, C0 is the initial concentration of MP and PNP (mg/L), Ct is the actual concentration of MO and PNP (mg/L) at a certain reaction time t (min), b1 and b2 are the constants for the pseudo-first-order kinetics model and pseudo-second-order kinetics model.
Figure 7 and Table 2 showed the photocatalytic degradation kinetics results of MO and PNP using ZnO NPs as a photocatalyst. The results indicated both the pseudo-first-order kinetics model and pseudo-second-order kinetics model were not represented in the photocatalytic degradation behaviours of MO and PNP using ZnO NPs as a photocatalyst. The maximum values of kinetics were 0.0128 min−1 (MO, pseudo-first-order kinetics, ZnO dose = 1.5 g/L), 0.0049 (mg/L)−1·min−1 (MO, pseudo-second-order kinetics, ZnO dose = 1.5 g/L), 0.0042 min−1 (PNP, pseudo-first-order kinetics, ZnO dose = 1.5 g/L), and 0.0004 (mg/L)−1·min−1 (PNP, pseudo-second-order kinetics, ZnO dose = 1.5 g/L), respectively.
In this experiment, the ZnO NPs showed good photocatalytic stability. The photocatalytic degradation rate of MO decreased from 92% to >80%, and the degradation rate of PNP decreased from 56.2% to >50% after 5 times of reuse, with ZnO dose = 1.5 g/L.

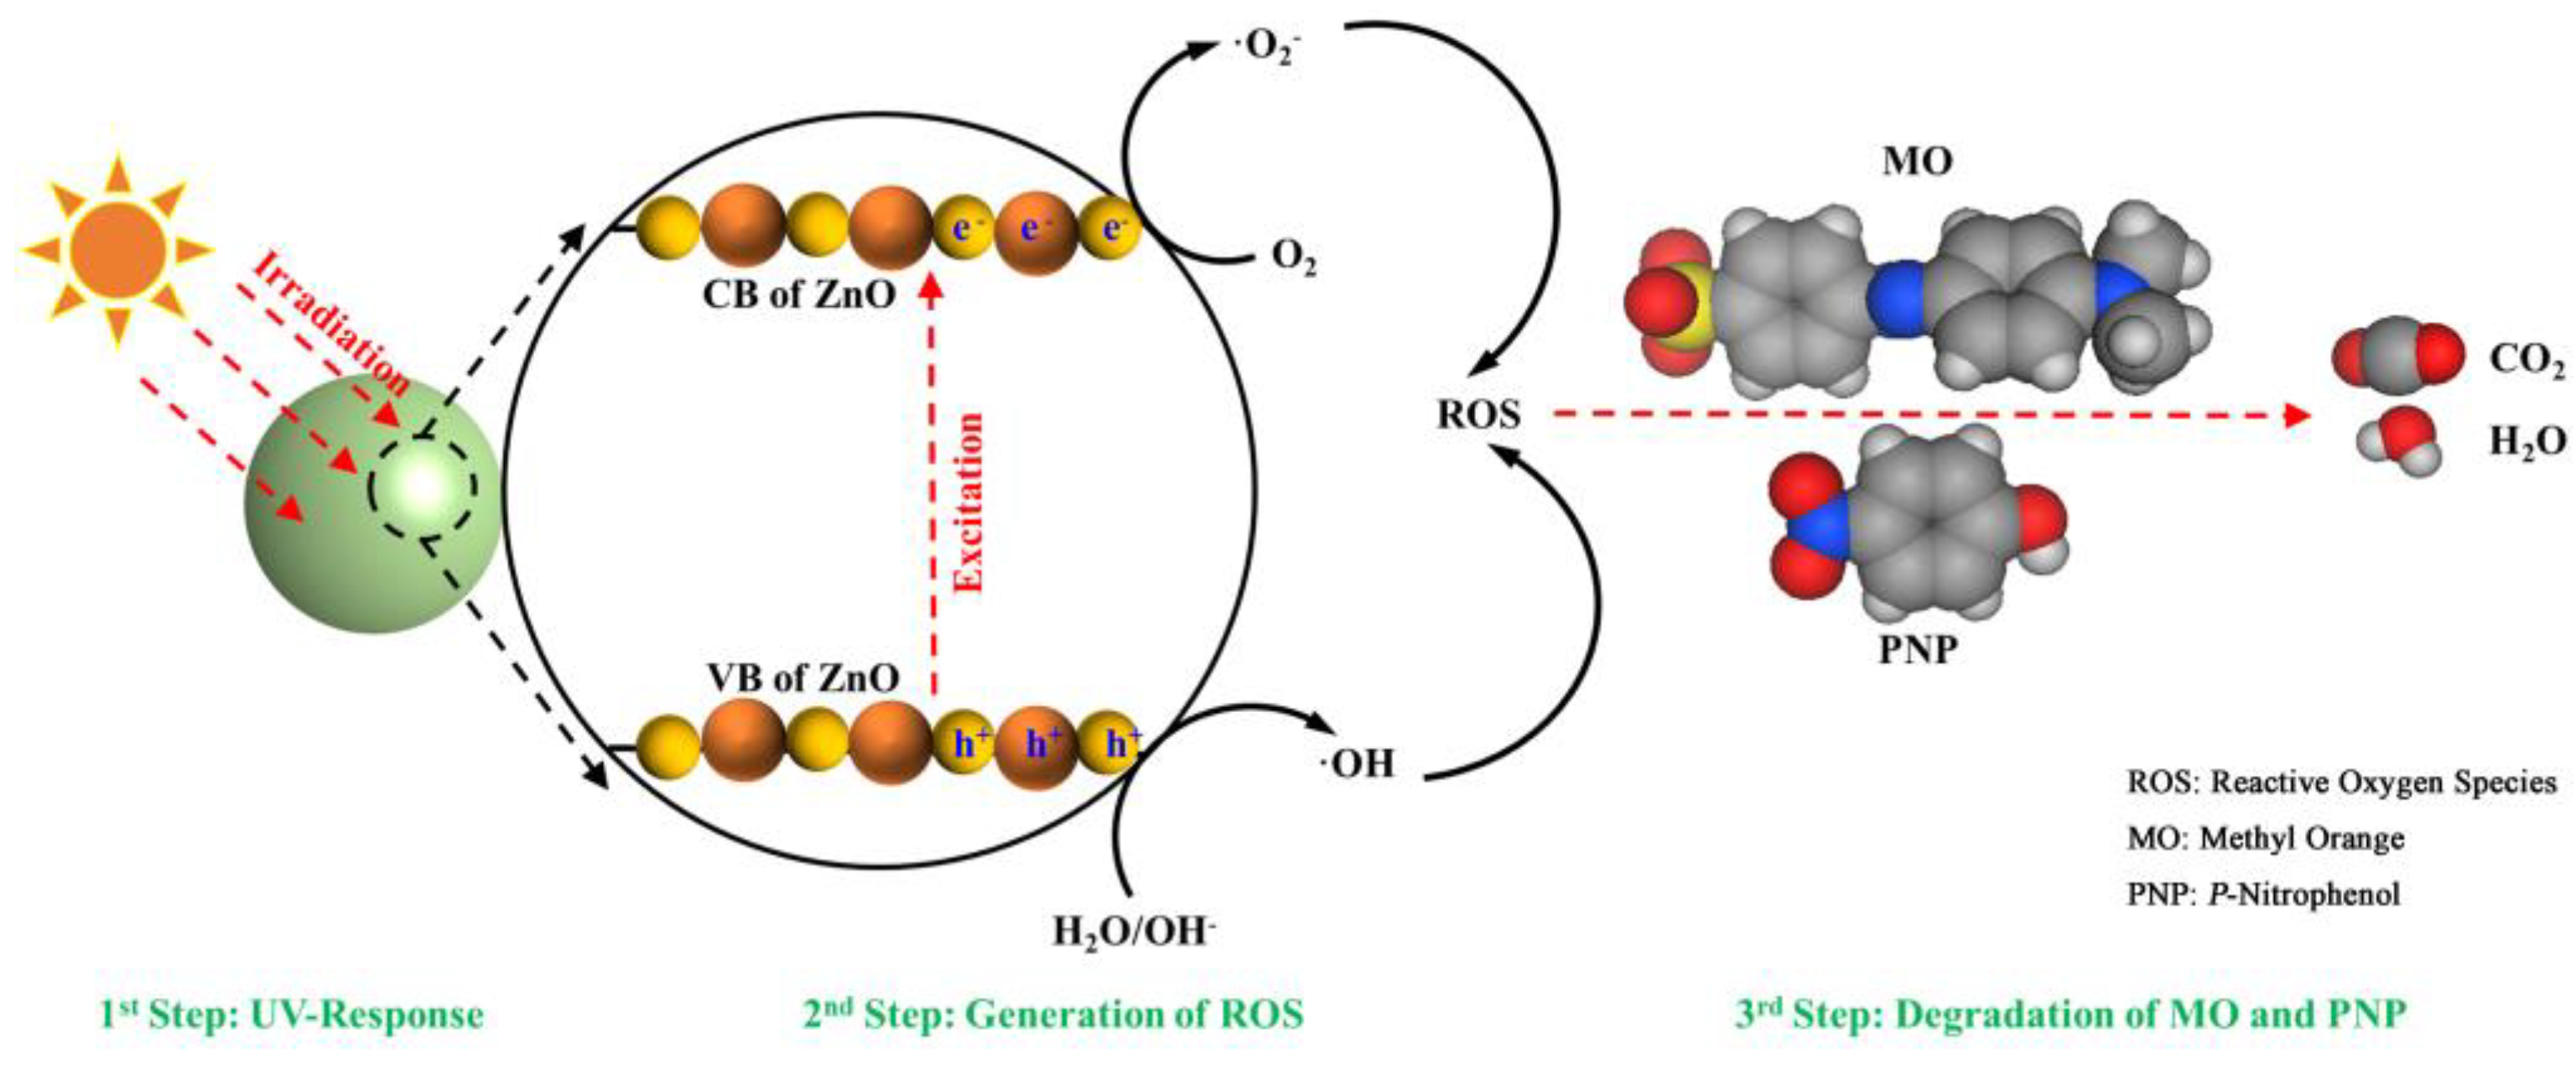
3.3. Photocatalytic Mechanism of ZnO NPs

The band structure of the ZnO NPs consists of a low-energy valence band filled with electrons and a high-energy conduction band not filled with electrons, and there are gaps between the valence band and conduction band. When the ZnO photocatalyst is irradiated by light with an energy greater than or equal to the band gap, the electron absorption energy in the valence band is excited to transition to the conduction band, and the corresponding holes are generated in the valence band, forming electron–hole pairs [26,27,28]. The electron–hole pair migrates to the particle surface under the action of a space electric field. The hole can react with H2O and OH- to generate the hydroxyl radical ·OH, and the electron can react with O2 to generate the superoxide radical ·O2. ·OH and ·O2 are the key reactive oxygen species (ROS) in the photocatalytic progress of ZnO NPs. These ROS (·OH and O2) have strong oxidation abilities and can react with organic pollutants. The pollutant then degrades into CO2, H2O, and other substances [29]. Figure 8 illustrates the entire process clearly. The specific reaction process is shown in the following equations:
ZnO + Irradiation → ZnO (e + h+)
H2O/OH + h+ → ·OH
O2 + e → ·O2
MO/PNP + ROS → H2O + CO2

3.4. Degradation Pathways of MO and PNP

The MO oxidation reaction is divided into three stages: the first is the cleavage of the azo bond, which leads to the formation of aromatic intermediate products with conjugated structures, such as 2,5-nitrophenol, PNP, hydroquinone, and quinone. The sulfonic acid is simultaneously reduced to sulfinic acid. This process can be summarized as bond-breaking oxidation. The second stage is the ring-opening of the aromatic intermediates, which produces various short-chain carboxylic acids, and some intermediates lose amine groups and add a hydroxyl group to the benzene ring [30]. The final stage is the complete oxidation process, where organic matter is completely oxidized to CO2, H2O, and other small molecules by superoxide radicals [31]. Figure 9 shows the possible degradation pathway of MO. In the first stage, the N=N azo bond is broken to form an HN-NH single bond. The second stage is demethylation, in which a -CH3 group is removed from the N. The third stage is the breaking of the HN-NH single bond, and all the methyl groups on the right side of the molecule fall off and become phenolic organic compounds. Finally, all of these small organic acids are mineralized into H2O and CO2 under the action of superoxide free radicals.
The degradation path of PNP is as follows: the electron–hole pair generated by the excitation of ZnO has a strong oxidizing effect on free radicals. The initial step of degradation is the electrophilic addition of hydroxyl radicals to the matrix to generate p-nitrogen. The catechol, benzoquinone, and nitrogen-containing compounds, and some of the nitro groups (-NO2) in PNP are reduced to amino groups (-NH2). The subsequent hydroxylation of the oxidation byproducts produces polyhydroxy cyclic compounds, such as pyrogallol and 2,3-dihydroxy-1,4-benzoquinone. These compounds have low stability and therefore undergo oxidative ring-opening reactions to form unsaturated dibasic acids. A further decarboxylation reaction leads to the release of carbon dioxide and shortens the carbon chain, and finally, these small acidic molecules are converted into CO2 and H2O [32]. Figure 10 shows three possible degradation pathways of PNP. First, PNP loses nitro groups (-NO3) to form phenol, which then undergoes ring-opening to form oxalic acid under the action of superoxide radicals. In the second pathway, hydroxyl groups replace the nitro groups (-NO3) on the PNP to form hydroquinone, which is then oxidized by carbonylation under the action of superoxide radicals to form p-benzoquinone, and finally, the ring is opened to form oxalic acid. The third pathway is the addition of -OH to the hydroxyl ortho of PNP and subsequent removal of the nitro groups (-NO3) under the action of superoxide radicals; finally, the ring is opened to form oxalic acid. Eventually, oxalic acid is completely mineralized into H2O and CO2 by the superoxide radicals.

3.5. Environmental Impact

As a semiconductor photocatalyst with excellent properties, nano-ZnO has been widely studied by researchers in the fields of materials, catalysis, energy environment, and optics. Moreover, ZnO nanostructures with different morphologies have different physical and chemical properties, and the effects of applying them to photocatalytic degradation of pollutants are also different. The ZnO NPs prepared in this article are simple to prepare, and it is also easy to obtain the materials used in preparation. No surfactant or structure-directing agent is introduced, and the whole preparation process is relatively environmentally friendly. The ZnO NPs prepared in this paper have high photocatalytic performance. The photocatalytic degradation rates of MO and PNP can reach 96% and 60.9% in 180 min, respectively, and have good degradation effects. Table 3 and Table 4 summarize the degradation effects of the different photocatalysts on MO and PNP.

4. Conclusions

In summary, this article describes a simple solvothermal method of preparing ZnO NP photocatalysts with spherical morphology and excellent performance. The preparation method is simple, the materials used for preparation are easy to obtain, no surfactant or structure directing agent is introduced, and the whole preparation process is relatively environmentally friendly. According to the SEM images, the size of the ZnO NPs was uniform, with a diameter of approximately 25–40 nm. Under ultraviolet light irradiation, both MO and PNP showed higher degradation efficiency in aqueous solution. This study also investigated the effects of different doses on the photocatalytic activity and explained the photocatalytic mechanism of ZnO and the degradation pathways of two organic pollutants. The maximum values of kinetics were 0.0128 min−1 (MO, pseudo-first-order kinetics, ZnO dose = 1.5 g/L), 0.0049 (mg/L)−1·min−1 (MO, pseudo-second-order kinetics, ZnO dose = 1.5 g/L), 0.0042 min−1 (PNP, pseudo-first-order kinetics, ZnO dose = 1.5 g/L) and 0.0004 (mg/L)−1·min−1 (PNP, pseudo-second-order kinetics, ZnO dose = 1.5 g/L), respectively. Therefore, ZnO NPs have great potential in the field of wastewater treatment. They can be used as photocatalysts to remove MO and PNP and solve environmental problems.

Author Contributions

Conceptualization, Y.W.; methodology, Y.W., C.Y. and Y.L. (Yonglin Liu); validation, Y.W., Y.F. and F.D.; investigation, Y.W., Y.Q. and H.Z.; resources, Y.L. (Yuzhen Liu) and W.W.; data curation, Y.W.; writing—original draft preparation, Y.W., C.Y. and Y.L. (Yonglin Liu); writing—review and editing, Y.L. (Yuzhen Liu) and W.W.; supervision, Y.L. (Yuzhen Liu) and W.W.; project administration, W.W.; funding acquisition, F.D., W.W. and F.D. All authors have read and agreed to the published version of the manuscript.

Funding

This work was supported by the National Natural Science Foundation of China (41672340 and 52173286).

Institutional Review Board Statement

Not applicable.

Informed Consent Statement

Not applicable.

Data Availability Statement

No new data were created or analyzed in this study. Data sharing is not applicable to this article.

Acknowledgments

The authors would like to express their sincere gratitude to the unidentified reviewers and editors for their generous efforts in reviewing and improving the manuscript.

Conflicts of Interest

The authors declare no conflict of interest.

References

  1. Fujishima, A.; Honda, K. Electrochemical photolysis of water at a semiconductor electrode. Nature 1972, 238, 37–38. [Google Scholar] [CrossRef] [PubMed]
  2. Gole, J.L.; Stout, J.D.; Burda, C.; Lou, Y.B.; Chen, X.B. Highly efficient formation of visible light tunable TiO2-xNx photocatalysts and their transformation at the nanoscale. J. Cheminform. 2004, 108, 1230–1240. [Google Scholar]
  3. Mukhopadhyay, S.; Das, P.P.; Maity, S.; Ghosh, P.; Devi, P.S. Solution grown ZnO rods: Synthesis, characterization and defect mediated photocatalytic activity. Appl. Catal. B-Environ. 2015, 165, 128–138. [Google Scholar] [CrossRef]
  4. Dindar, B.; Icli, S. Unusual photoreactivity of zinc oxide irradiated by concentrated sunlight. J. Photochem Photobiol. A 2001, 140, 263–268. [Google Scholar] [CrossRef]
  5. Yeber, M.C.; Rodriguez, J.; Freer, J.; Baeza, J.; Duran, N.; Mansilla, H.D. Advanced oxidation of a pulp mill bleaching wastewater. Chemosphere 1999, 39, 1679–1688. [Google Scholar] [CrossRef]
  6. Song, K.Y.; Park, M.K.; Kwon, Y.T.; Lee, H.W.; Chung, W.J.; Lee, W.I. Preparation of transparent particulate MoO3/TiO2 and WO3/TiO2 films and their photocatalytic properties. Chem. Mater. 2001, 13, 2349–2355. [Google Scholar] [CrossRef]
  7. Chen, H.M.; Chen, C.K.; Chang, Y.C.; Tsai, C.W.; Liu, R.S.; Hu, S.F.; Chang, W.S.; Chen, K.H. Quantum dot monolayer sensitized ZnO nanowire-array photoelectrodes: True efficiency for water splitting. Angew. Chem. Int. Ed. 2010, 49, 5966–5969. [Google Scholar] [CrossRef]
  8. Chu, H.O.; Wang, Q.; Shi, Y.J.; Song, S.G.; Liu, W.G.; Zhou, S.; Gibson, D.; Alajlani, Y.; Li, C. Structural, optical properties and optical modelling of hydrothermal chemical growth derived ZnO nanowires. T. Nonferr. Metal. Soc. 2020, 30, 191–199. [Google Scholar] [CrossRef]
  9. Baskoutas, S. Zinc oxide nanostructures: Synthesis and characterization. Materials 2018, 11, 873. [Google Scholar] [CrossRef] [Green Version]
  10. Luevano-Hipolito, E.; Martinez-de la Cruz, A.; Cuellar, E.L. Performance of ZnO synthesized by sol-gel as photocatalyst in the photooxidation reaction of NO. Environ. Sci. Pollut. Res. 2016, 24, 6361–6371. [Google Scholar] [CrossRef]
  11. Yu, W.L.; Zhang, J.F.; Peng, T.Y. New insight into the enhanced photocatalytic activity of N-, C- and S-doped ZnO photocatalysts. Appl. Catal. B-Environ. 2016, 181, 220–227. [Google Scholar] [CrossRef]
  12. Zhou, Y.L.; Hu, Z.B.; Tong, M.X.; Zhang, Q.L.; Tong, C.Q. Preparation and photocatalytic performance of bamboo-charcoal-supported nano-ZnO composites. Mater. Sci. 2018, 24, 49–52. [Google Scholar] [CrossRef] [Green Version]
  13. Umar, A.; Chauhan, M.S.; Chauhan, S.; Kumar, R.; Kumar, G.; Al-Sayari, S.A.; Hwang, S.W.; Al-Hajry, A. Large-scale synthesis of ZnO balls made of fluffy thin nanosheets by simple solution process: Structural, optical and photocatalytic properties. J. Colloid. Interf. Sci. 2011, 363, 521–528. [Google Scholar] [CrossRef]
  14. Cheng, P.F.; Wang, Y.L.; Xu, L.P.; Sun, P.; Su, Z.S.; Jin, F.M.; Liu, F.M.; Sun, Y.F.; Lu, G.Y. High specific surface area urchin-like hierarchical ZnO-TiO2 architectures: Hydrothermal synthesis and photocatalytic properties. Mater. Lett. 2016, 175, 52–55. [Google Scholar] [CrossRef]
  15. Zhang, P.; Li, B.B.; Zhao, Z.B.; Yu, C.; Hu, C.; Wu, S.J.; Qiu, J.S. Furfural-induced hydrothermal synthesis of ZnO@C gemel hexagonal microrods with enhanced photocatalytic activity and stability. ACS Appl. Mater. Interfaces 2014, 6, 8560–8566. [Google Scholar] [CrossRef] [PubMed]
  16. Rashidi, H.; Ahmadpour, A.; Bamoharram, F.F.; Zebarjad, S.M.; Heravi, M.M.; Tayari, F. Controllable one-step synthesis of ZnO nanostructures using molybdophosphoric acid. Chem. Pap. 2013, 68, 516–524. [Google Scholar] [CrossRef]
  17. Chen, X.B.; Shen, S.H.; Guo, L.J.; Mao, S.S. Semiconductor-based photocatalytic hydrogen generation. Chem. Rev. 2010, 110, 6503–6570. [Google Scholar] [CrossRef]
  18. Tian, L.; Yang, X.F.; Lu, P.; Williams, I.D.; Wang, C.H.; Ou, S.Y.; Liang, C.L.; Wu, M.M. Hollow single-crystal spinel nanocubes: The case of zinc cobalt oxide grown by a unique kirkendall effect. Inorg. Chem. 2008, 47, 5522–5524. [Google Scholar] [CrossRef]
  19. Mohamed, M.A.; Salleh, W.N.W.; Jaafar, J.; Ismail, A.F. Structural characterization of N-doped anatase-rutile mixed phase TiO2 nanorods assembled microspheres synthesized by simple sol-gel method. J. Sol-Gel. Sci. Technol. 2015, 74, 513–520. [Google Scholar] [CrossRef] [Green Version]
  20. Akir, S.; Hamdi, A.; Addad, A.; Coffinier, Y.; Boukherroub, R.; Omrani, A.D. Facile synthesis of carbon-ZnO nanocomposite with enhanced visible light photocatalytic performance. Appl. Surf. Sci. 2017, 400, 461–470. [Google Scholar] [CrossRef]
  21. Osman, H.; Su, Z.; Ma, X.L.; Liu, S.S.; Liu, X.Y.; Abduwayit, D. Synthesis of ZnO/C nanocomposites with enhanced visible light photocatalytic activity. Ceram. Int. 2016, 42, 10237–10241. [Google Scholar] [CrossRef]
  22. Yang, C.X.; Wang, X.N.; Ji, Y.J.; Ma, T.; Zhang, F.; Wang, Y.Q.; Ci, M.W.; Chen, D.T.; Jiang, A.X.; Wang, W.L. Photocatalytic degradation of methylene blue with ZnO@C nanocomposites: Kinetics, mechanism, and the inhibition effect on monoamine oxidase A and B. Nanoimpact 2019, 15, 100174. [Google Scholar] [CrossRef]
  23. Iqbal, T.; Zahra, S.K.; Khan, M.A.R.; Shafique, M.; Raza, S.R.A.; Andleeb, S. Microplasma-assisted electrochemical synthesis of ZnO nanostructures for photocatalytic and antibacterial applications. Phys. Scripta 2021, 96, 125801. [Google Scholar] [CrossRef]
  24. Lopez-Munoz, M.J.; Revilla, A.; Alcalde, G. Brookite TiO2-based materials: Synthesis and photocatalytic performance in oxidation of methyl orange and As(III) in aqueous suspensions. Catal. Today 2015, 240, 138–145. [Google Scholar] [CrossRef]
  25. Pinna, M.; Binda, G.; Altomare, M.; Marelli, M.; Dossi, C.; Monticelli, D.; Spanu, D.; Recchia, S. Biochar nanoparticles over TiO2 nanotube arrays: A green Co-catalyst to boost the photocatalytic degradation of organic pollutants. Catalysts 2021, 11, 1048. [Google Scholar] [CrossRef]
  26. Liu, S.; Su, Z.L.; Liu, Y.; Yi, L.Y.; Chen, Z.L.; Liu, Z.Z. Mechanism and purification effect of photocatalytic wastewater treatment using graphene oxide-doped titanium dioxide composite nanomaterials. Water-Sui. 2021, 13, 1915. [Google Scholar] [CrossRef]
  27. Wang, Z.C.; Hou, Q.Y.; Guan, Y.Q.; Sha, S.L.; Chen, M.X. Influence of (Li/Na/K) doping and point defect (VAl, Hi) on the magnetic and photocatalytic performance of AlN: A first-principles study. Mater. Chem. Phys. 2021, 268, 124706. [Google Scholar] [CrossRef]
  28. Ong, C.B.; Ng, L.Y.; Mohammad, A.W. A review of ZnO nanoparticles as solar photocatalysts: Synthesis, mechanisms and applications. Renew. Sust. Energ. Rev. 2018, 81, 536–551. [Google Scholar] [CrossRef]
  29. Ochiai, T.; Fujishima, A. Photoelectrochemical properties of TiO2 photocatalyst and its applications for environmental purification. J. Photochem. Photobiol. C 2012, 13, 247–262. [Google Scholar] [CrossRef]
  30. Pargoletti, E.; Pifferi, V.; Falciola, L.; Facchinetti, G.; Depaolini, A.R.; Davoli, E.; Marelli, M.; Cappelletti, G. A detailed investigation of MnO2 nanorods to be grown onto activated carbon. High efficiency towards aqueous methyl orange adsorption/degradation. Appl. Surf. Sci. 2019, 472, 118–126. [Google Scholar] [CrossRef] [Green Version]
  31. Huang, F.M.; Chen, L.; Wang, H.L.; Feng, T.Z.; Yan, Z.C. Degradation of methyl orange by atmospheric DBD plasma: Analysis of the degradation effects and degradation path. J. Electrostat. 2012, 70, 43–47. [Google Scholar] [CrossRef]
  32. Dai, Q.Z.; Lei, L.C.; Zhang, X.W. Enhanced degradation of organic wastewater containing p-nitrophenol by a novel wet electrocatalytic oxidation process: Parameter optimization and degradation mechanism. Sep. Purif. Technol. 2008, 61, 123–129. [Google Scholar] [CrossRef]
  33. Alharthi, M.N.; Ismail, I.; Bellucci, S.; Khdary, N.H.; Salam, M.A. Biosynthesis microwave-assisted of zinc oxide nanoparticles with ziziphus jujuba leaves extract: Characterization and photocatalytic application. Nanomater. Basel 2021, 11, 1682. [Google Scholar] [CrossRef] [PubMed]
  34. Peng, F.; Zhu, H.; Wang, H.; Yu, H. Preparation of Ag-sensitized ZnO and its photocatalytic performance under simulated solar light. Korean J. Chem. Eng. 2007, 24, 1022–1026. [Google Scholar] [CrossRef]
  35. Chen, C.C.; Liu, J.F.; Liu, P.; Yu, B.H. Investigation of photocatalytic degradation of methyl orange by using nano-sized ZnO catalysts. Adv. Chem. Eng. Sci. 2011, 1, 9–14. [Google Scholar] [CrossRef] [Green Version]
  36. Feng, Q.; Li, S.Y.; Ma, W.H.; Fan, H.J.; Wan, X.H.; Lei, Y.; Chen, Z.J.; Yang, J.; Qin, B. Synthesis and characterization of Fe3O4/ZnO-GO nanocomposites with improved photocatalytic degradation methyl orange under visible light irradiation. J. Alloys Compd. 2018, 737, 197–206. [Google Scholar] [CrossRef]
  37. Zhang, W.P.; Xiao, X.Y.; Li, Y.; Zeng, X.Y.; Zheng, L.L.; Wan, C.X. Liquid-exfoliation of layered MoS2 for enhancing photocatalytic activity of TiO2/g-C3N4 photocatalyst and DFT study. Appl. Surf. Sci. 2016, 389, 496–506. [Google Scholar] [CrossRef]
  38. Lu, L.L.; Shan, R.; Shi, Y.Y.; Wang, S.X.; Yuan, H.R. A novel TiO2/biochar composite catalysts for photocatalytic degradation of methyl orange. Chemosphere 2019, 222, 391–398. [Google Scholar] [CrossRef]
  39. Abu Hanif, M.; Akter, J.; Islam, M.A.; Sapkota, K.P.; Hahn, J.R. Visible-light-driven enhanced photocatalytic performance using cadmium-doping of tungsten (VI) oxide and nanocomposite formation with graphitic carbon nitride disks. Appl. Surf. Sci. 2021, 565, 150541. [Google Scholar] [CrossRef]
  40. Tsuji, M.; Matsuda, K.; Tanaka, M.; Kuboyama, S.; Uto, K.; Wada, N.; Kawazumi, H.; Tsuji, T.; Ago, H.; Hayashi, J. Enhanced photocatalytic degradation of methyl orange by Au/TiO2 nanoparticles under neutral and acidic solutions. Chemistryselect 2018, 3, 1432–1438. [Google Scholar] [CrossRef]
  41. Kadam, V.V.; Shanmugam, S.D.; Ettiyappan, J.P.; Balakrishnan, R.M. Photocatalytic degradation of p-nitrophenol using biologically synthesized ZnO nanoparticles. Environ. Sci. Pollut. Res. 2021, 28, 12119–12130. [Google Scholar] [CrossRef] [PubMed]
  42. Gangarajula, Y.; Kedharnath, R.; Gopal, B. Investigation of photocatalytic activity of pure strontium hydroxyapatite and its Ti-substituted and TiO2 loaded forms. Appl. Catal. A-Gen. 2015, 506, 100–108. [Google Scholar] [CrossRef]
  43. Chen, Y.; Sun, F.Q.; Huang, Z.J.; Chen, H.; Zhuang, Z.F.; Pan, Z.Z.; Long, J.F.; Gu, F.L. Photochemical fabrication of SnO2 dense layers on reduced graphene oxide sheets for application in photocatalytic degradation of p-Nitrophenol. Appl. Catal. B-Environ. 2017, 215, 8–17. [Google Scholar] [CrossRef]
  44. Lakshmi, K.; Kadirvelu, K.; Mohan, P.S. Photo-decontamination of p-nitrophenol using reusable lanthanum doped ZnO electrospun nanofiber catalyst. J. Mater. Sci.-Mater. Electron. 2018, 29, 12109–12117. [Google Scholar] [CrossRef]
  45. Sun, J.W.; Xu, J.S.; Grafmueller, A.; Huang, X.; Liedel, C.; Algara-Siller, G.; Willinger, M.; Yang, C.; Fu, Y.S.; Wang, X.; et al. Self-assembled carbon nitride for photocatalytic hydrogen evolution and degradation of p-nitrophenol. Appl. Catal. B-Environ. 2017, 205, 1–10. [Google Scholar] [CrossRef]
  46. Abazari, R.; Mahjoub, A.R.; Salehi, G. Preparation of amine functionalized g-C3N4@H/SMOF NCs with visible light photocatalytic characteristic for 4-nitrophenol degradation from aqueous solution. J. Hazard. Mater. 2019, 365, 921–931. [Google Scholar] [CrossRef]
Figure 1. Preparation of ZnO NPs.
Water 13 03224 g001
Figure 2. SEM images of ZnO NPs. (a) agglomeration, (b) nano-particles.
Water 13 03224 g002
Figure 3. XRD patterns (a) and EDS (b) of ZnO NPs.
Water 13 03224 g003
Figure 4. XPS spectra of ZnO NPs (a), Zn 2p (b), O 1s (c) and C 1s (d).
Water 13 03224 g004
Figure 5. UV–Vis DRS of ZnO NPs.
Water 13 03224 g005
Figure 6. Effect of ZnO NPs dose on the photocatalytic degradation of MO (a) and PNP (b).
Water 13 03224 g006
Figure 7. Pseudo-first-order kinetics model and pseudo-second-order kinetics model of MO (a,b) and PNP (c,d) using ZnO NPs.
Water 13 03224 g007
Figure 8. Photocatalytic mechanism of ZnO NPs.
Water 13 03224 g008
Figure 9. Degradation pathway of MO.
Water 13 03224 g009
Figure 10. Degradation pathway of MO.
Water 13 03224 g010
Table 1. Elementary composition of ZnO NPs according to EDS and XPS.
ZnO NPsAt% from EDSAt% from XPS
Zn56.7441.28
O43.2639.16
C 19.55
Zn/O atomic ratio1.311.05
Table 2. Pseudo-first-order and pseudo-second-order kinetics of MO and PNP using ZnO NPs.
PollutantZnO NPs Dose
(g/L)
Pseudo-First-OrderPseudo-Second-Order
k1′app
(min−1)
R2k2′app
((mg/L)−1·min−1)
R2
MO00.00050.81310.000030.8129
0.20.00770.94540.00100.8935
0.50.00700.94440.00090.9028
1.00.00820.96880.00170.9268
1.50.01280.89660.00490.6219
2.00.00960.81090.00260.5965
PNP00.00010.61200.0000060.6114
0.50.00330.92180.00030.9206
0.70.00280.98380.00020.9889
1.00.00290.92300.00020.9206
1.50.00420.97880.00040.9534
2.00.00290.98040.00020.9575
Table 3. Summary of the degradation of MO by different photocatalysts.
CatalystsPreparationLightTimePhotocatalytic ActivityReferences
ZnO NPssolvothermalUV180 min92%This work
ZnO ballsbiosynthesissolar irradiation100 min100%[33]
leaf-like ZnOmicrowave heating1000 W, Xe lamp60 min69.5%[34]
pseudo-spherical ZnOprecipitation300 W, mercury lamp120 min50%[35]
ZnO/bamboo charcoalprecipitationUV40 min92.3%[12]
Fe3O4/ZnO-GOchemical300 W,
Xe lamp
30 min93%[36]
TiO2/g-C3N4/MoS2solvothermalXe lamp60 min96.5%[37]
TiO2/biochar compositehydrolysis500 W,
Hg lamp
160 min96.88%[38]
Cd-doped WO3@g-C3N4metal-doped300 W,
Xe lamp
80 min42.90%[39]
Au/TiO2 nanoparticlesmicrowave-polyolUV20 min96%[40]
Table 4. Summary of the degradation of PNP with different photocatalysts.
CatalystsPreparationLightTimePhotocatalytic ActivityReferences
ZnO NPssolvothermalUV180 min56.2%This work
ZnObiologicallyUV480 min82.5%[41]
TiO2-hydroxyapatitereflux methodUV660 min100%[42]
SnO2-rGOphotochemicalUV80 min95.6%[43]
La-ZnOhydrothermalUV150 min92%[44]
Self-assembled carbon nitridetemplate-free500 W,
Hg lamp
80 min90%[45]
g-C3N4@H/SMOF NCssonochemicalVisible light120 min75%[46]
Publisher’s Note: MDPI stays neutral with regard to jurisdictional claims in published maps and institutional affiliations.

