
Relative Contribution of Climate Change and Anthropogenic Activities to Streamflow Alterations in Illinois


1
Department of Agricultural and Biological Engineering, University of Illinois at Urbana-Champaign, Urbana, IL 61801, USA
2
Department of Environmental Engineering, Seoul National University of Science and Technology, Seoul 01811, Korea
3
Illinois State Water Survey, Prairie Research Institute, Urbana, IL 61801, USA
*
Author to whom correspondence should be addressed.
Water 2021, 13(22), 3226; https://doi.org/10.3390/w13223226
Submission received: 5 October 2021
/
Revised: 8 November 2021
/
Accepted: 12 November 2021
/
Published: 14 November 2021
(This article belongs to the Special Issue Hydrological Processes in Small Catchments—Runoff and Sediment Yield in Changing Environment)
Abstract
:Rainfed agricultural systems have become more vulnerable to climate change due to their significant dependence on natural precipitation. Drastic changes in precipitation, superimposed with anthropogenic activities, including land use land cover change, can modify the hydrologic response, especially in agricultural watersheds. In this study, Fisher Information and cumulative sum charts (CUMSUM) methods were applied to detect the hydrologic regime shifts in six watersheds in Illinois, USA. The regime shift analysis identified shifts in streamflow regime in three agricultural watersheds, mainly around the 1970s; whereas, no significant change in streamflow was observed for forest-dominated watersheds. Furthermore, the Budyko framework was used to determine the relative contribution in streamflow alterations (i.e., regime shifts in streamflow) for the agricultural watersheds, which evidenced significant shifts in streamflow. The Budyko analysis inferred that alterations in streamflow could be primarily attributed to anthropogenic activities with a comparatively lower contribution from climate in agricultural watersheds. The relative contribution from anthropogenic activities were 71.66%, 81.46%, and 74.04%; whereas, the relative contribution from climate were 28.34%, 18.54%, and 25.96% for the Sangamon, Vermillion, and Skillet agricultural watersheds, respectively. The techniques used and the results obtained from the study would be helpful for future research in assessing the vulnerability and impact of management practices in a highly managed agricultural watershed.
1. Introduction
Hydrological processes are affected by various atmospheric and surface drivers. While climate has been identified as the most potent atmospheric driver, land use and land cover (LULC) changes and soil types also alter the surface hydrological processes [1,2,3,4,5]. The soil type and its properties are assumed to remain constant over time, while climate and LULC are evolving gradually. The climate is an inherently variable process, but its major signatures can be considered stationary for a short period of time. However, in recent decades, that assumption has been undermined by the anthropogenic global changes that have introduced new variability in the climate, a phenomenon expected to continue and intensify in the future. It has been established that climate change will increase the moisture-carrying capacity of the atmosphere, altering the precipitation amount and its pattern [6,7]. Similarly, an increasing population and its necessity for resources of survival have brought about continuous changes in LULC distribution globally. Significant changes include the transformation from forested and agricultural land to urban and semi-urban areas [8]. These changes affect the permeability of the soil surface and, subsequently, the partitioning of runoff into the surface and sub-surface flow. Even in the agriculture-intensive regions such as the US Midwest, cropping intensification and installation of an artificial drainage system are expected to change various surface hydrological processes [2,3,5].
There have been various studies to determine the impacts of climate change and LULC changes on surface hydrology [3,4,5,9,10,11,12,13,14]. However, these studies have produced conflicting conclusions that make it difficult to generalize the findings to a larger geographical scale. In the US Midwest, hydrologic response to precipitation change has increased as a consequence of the removal of wetlands and the introduction of artificial drainage systems [5]. An analytical study of multiple watersheds in Minnesota showed a modern drainage system and the loss of depressions as the major factor influencing water yield ahead of precipitation and land-use changes [3]. On the other hand, it was shown in a modeling study that climate change is the predominant factor influencing runoff hydrology changes [9]. A modeling study in two Minnesota watersheds showed increasing precipitation to be the major driver of streamflow changes [10]. The study carried out by [4] studied the relationship between precipitation and runoff in 21 watersheds from Minnesota and Iowa. They reported that, while the anthropogenically induced land-use change has influenced the modification of the hydrological pattern of the Midwest, precipitation has remained the primary driver of streamflow and the increased streamflow in the recent period was due to the increase in the precipitation in the same period. These studies indicate that the interaction of climate change and LULC changes on surface hydrology are localized by geography, hydrological characteristics, and LULC types. These findings reflect that further detailed research across various geographies is necessary, both for improved understanding of the linkages and feedback between the climate, land-use changes, and streamflow patterns, especially in the US Midwest, and for the robust decision making for policy interventions.
The Midwestern United States is a key producer of corn and soybeans supplanting small grains [15]. Installation of extensive subsurface tile drainage for maintaining a suitable water table in the crop root zone has led to significant alterations in the hydrologic response towards precipitation and streamflow in the region, which is not well studied at the regional scale. Most of the studies carried out in the upper Midwest to analyze the impacts of climate change and land management practices have focused on the watersheds within the states of Minnesota and Iowa [4], but similar analyses for the other parts of the Midwest and the rest of the US are sparse, to our knowledge [1,16]. This study is an attempt to bridge that research gap by analyzing rainfall and runoff trends in six watersheds in Illinois, another Midwestern state. The main objectives of this study are the following:
- To identify if the precipitation and streamflow have undergone temporal change using trend analysis methods.
- To identify the regime shifts in streamflow and precipitation at watershed scale using Fisher Information and CUSUM method.
- To find out the relative contribution of climate and anthropogenic activities towards the regime shifts using Budyko analysis.
Since Illinois is the second-largest producer of corn in the US [17], the study of the hydrological regime and its shift can inform water and agriculture management policies for Illinois.
2. Materials and Methods
2.1. Study Area
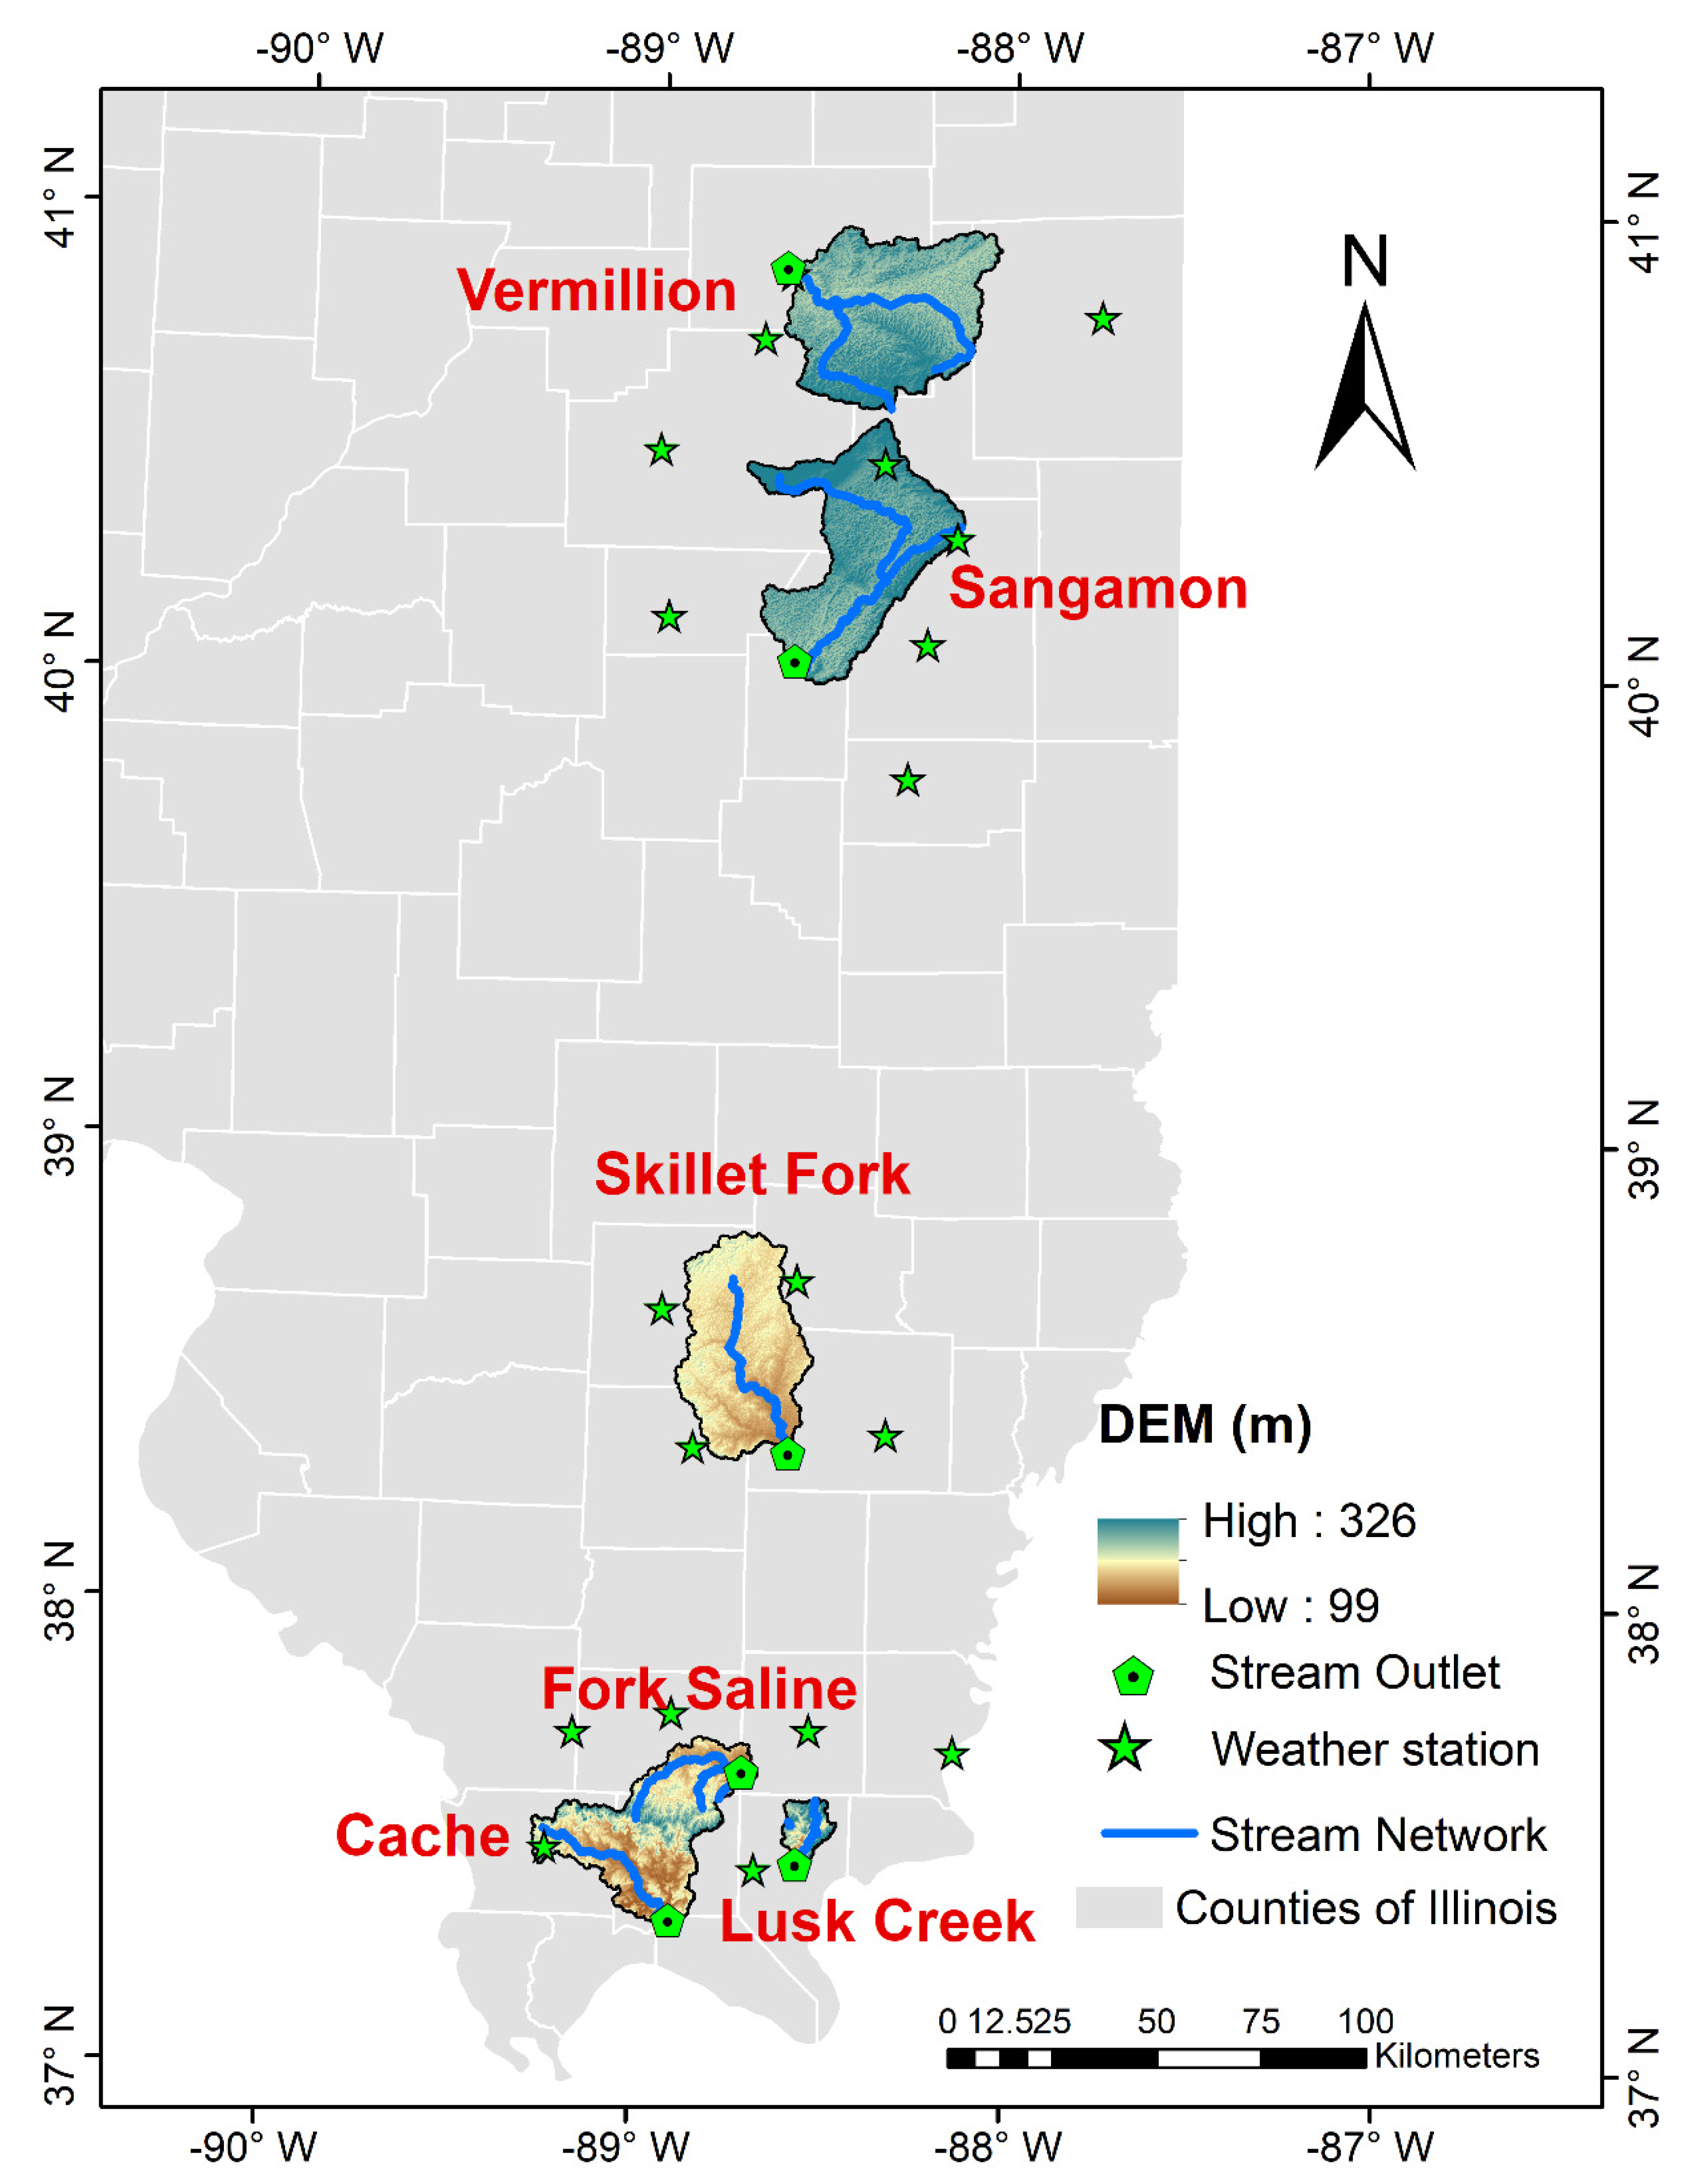
Considering the quality and quantity (temporal duration) of the available data, six different HUC-8 watersheds within the state of Illinois were chosen as samples for this study. The six watersheds, i.e., Vermillion, Upper Sangamon, Skillet Fork, Lusk Creek, Fork Saline, and Cache, represent different LULC and soil conditions (Table 1). Of the six watersheds, the first three are predominantly agricultural watersheds, and the remaining three are dominated by forest and grassland (Figure 1). The Vermillion and Sangamon watersheds are located in the previous prairie zones, while Skillet Fork lies in the savannah zone. The remaining three southern watersheds are located in the previously densely forested region. The elevation varies from 99 m to 326 m (Figure 1); whereas the area of the watersheds ranges from ~111 km2 to ~1500 km2 (Table 1). The mean annual precipitation varies from 356 to 1553 mm in the watersheds located in the northern part of Illinois (i.e., Vermillion, Sangamon and Skillet Fork); whereas, it varies from ~774–1830 mm in the southern watersheds (i.e., Fork Saline, Cache and Lusk Creek).
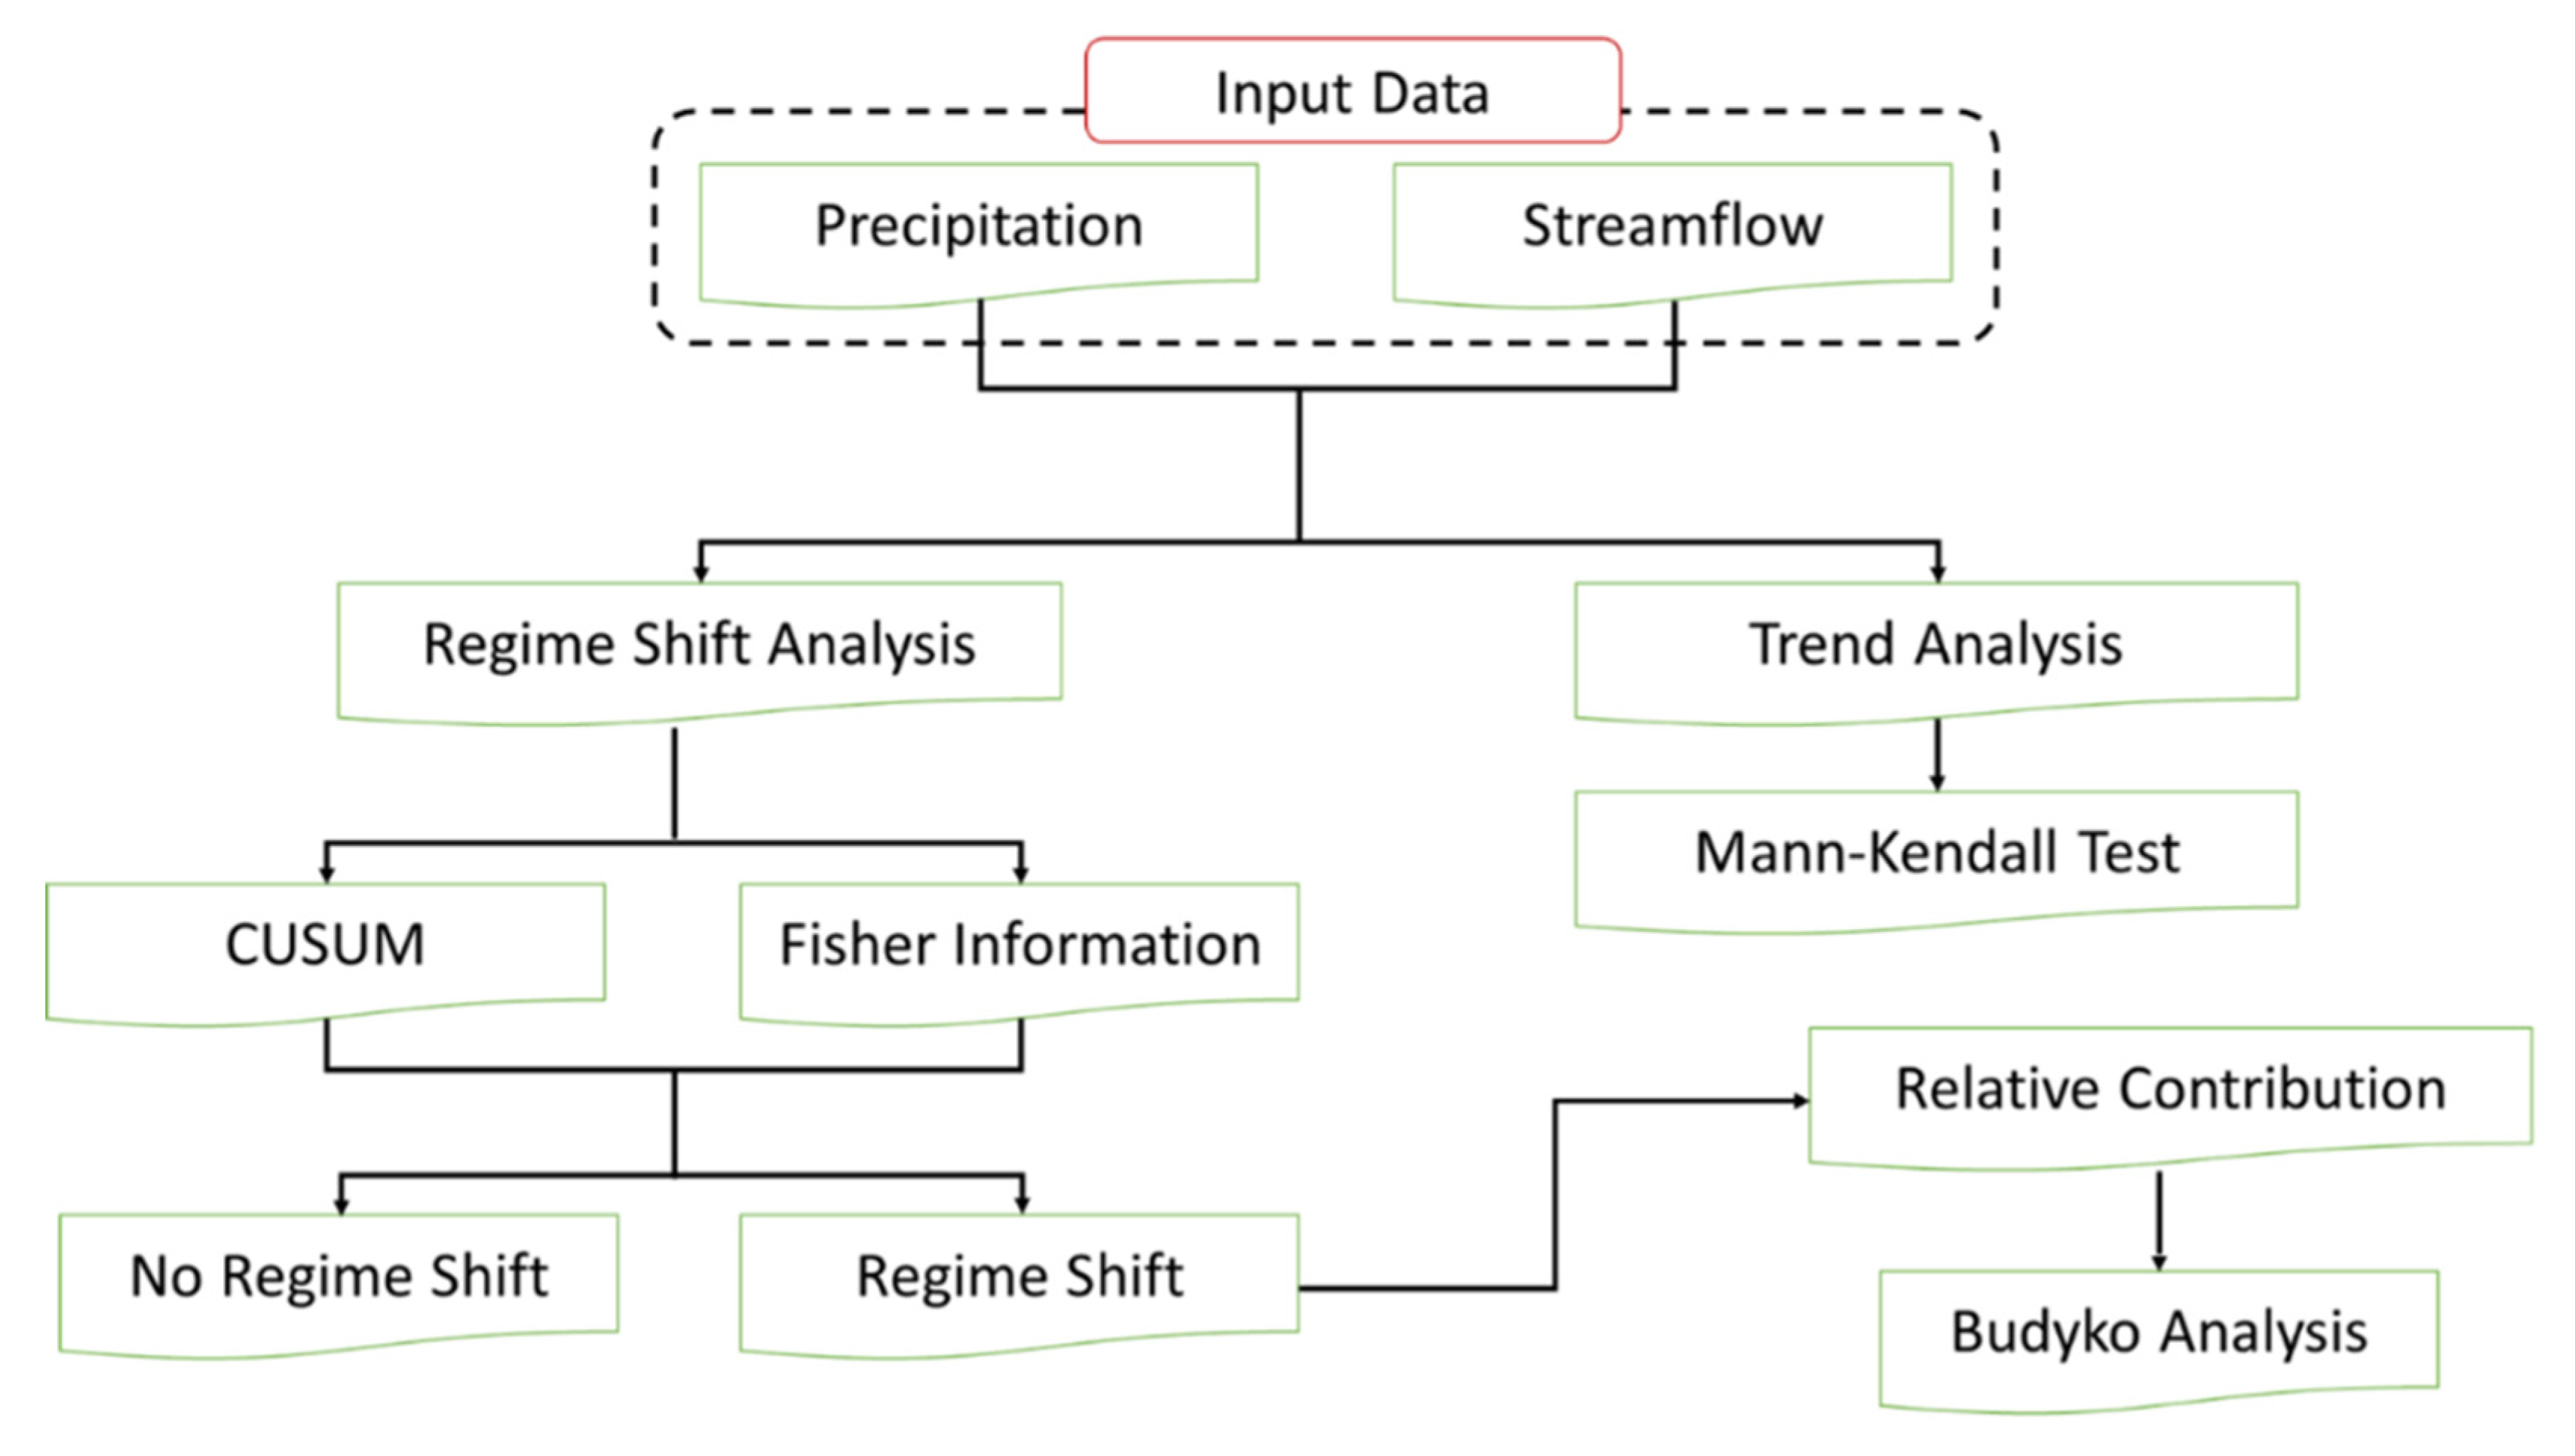
2.2. Input Data
This study employs exploratory data analysis and other well-established statistical and analytical tools for determining if the hydrological processes in the selected watersheds in Illinois have been affected by climate change and land management practices or not. Exploratory data analysis extracts information from the data itself, with an immense advantage of confining simplifying assumptions, if any, to a minimum. Daily precipitation data was obtained from MRCC [18], and daily runoff data was obtained from USGS [19] located at the outlet of each studied watershed. The precipitation data from all the weather stations located within and around a watershed were averaged using the Thiessen polygon method to calculate the precipitation time series at the watershed scale. These two datasets, obtained from direct measurements, are used as primary data in the study. In addition to these primary data, the runoff ratio was used as secondary data, derived from the primary data. Runoff ratio is the ratio of runoff and precipitation, which normalizes the runoff from different precipitation events. The data for potential evapotranspiration (PET) was obtained from the Water and Atmospheric Resources Monitoring Program (WARM) [20].
2.3. Methodology
2.3.1. Mann-Kendall Trend Test
One of the objectives of this study was to determine if the climatic and hydrologic properties have remained time invariant or if they have undergone any changes over time. The Mann-Kendall trend test [21,22] was used for this purpose. The null hypothesis for the Mann-Kendall test was that there was no trend in the data, assuming the data are independent and randomly ordered. This test determined if there was any shift in the mean value of the time series. Any change in the mean value of the precipitation would have been indicative of the change in the climate of the watershed. If a similar change is detected in runoff, that would mean the dependence of runoff on climate. On the other hand, any change in runoff in spite of the stationarity in precipitation would be indicative of strong impact of LULC change on hydrological processes. If no change was detected in both precipitation and runoff over time, that would mean that the climate has remained stationary, and the runoff has not been affected by LULC changes either.
2.3.2. Change Point Analysis
Once it had been established that there was a significant trend in the time series dataset, the next step was to identify whether the change occurred as a single (or finitely more) shift in the dataset, or if it took place as gradual process. In context of this study, identifying a single change point in the runoff dataset for the agricultural watersheds helped to compare the change point timeline with the changes in tile practices in the watersheds. The change-point analysis method used in this study was introduced by [23]. The main advantage of using this method lies in its independence from the distribution of the dataset. The method combines cumulative sum charts (CUMSUM) and bootstrap sampling to detect the change-point. The first step of this method involves constructing CUMSUM chart by adopting the following procedure:
- Calculation of average of the time series dataset: , where
- Calculation of cumulative sums by adding the difference between the current time series value and the average calculated in the previous step to the previous sum as follows:It is to be noted here that the cumulative sum of the differences always ends at zero, i.e., .
- CUMSUM chart is a chart of against time. Segment of the chart with positive slope represents a period where the values are above and the section of the chart with negative slope represents a period where the values are below . A sudden change in the slope of the CUMSUM chart is an indication of a sudden shift in the dataset or a change in the average.
- The magnitude of change is calculated as follows:
- However, the existence of sudden shift in the CUMSUM chart is not enough to confidently ascertain that sudden change took place. A significance level can be determined for the apparent change by analyzing bootstrap resamples. A single bootstrap is generated by randomly reordering to create a set of data . This process is also called sampling without replacement (SWOR).
- Next, the bootstrap CUMSUM is calculated, and its denoted as . Maximum, minimum, and difference of the bootstrap CUMSUM are calculated and denoted as .
- A bootstrap analysis involves generating a large number of bootstrapped samples and counting the number of bootstraps for which is less than . If is the number of bootstrap samples generated and is the number of bootstraps for which , then the significance level that a shift occurred is calculated as follows:
Typically, a significance level of 90–95% is required for establishing that a significant change-point exists.
2.3.3. Regime Shift Analysis Using Fisher Information
Fisher information (FI) was applied to find out the regime shift in streamflow as well as in precipitation time series in addition to the combined cumulative sum charts (CUMSUM) method. FI is defined in terms of the probability of observing the state of a system [24]. The FI can be defined as follows:
where, s and p(s) refer to the system state and probability of observing a system state, respectively. This implies that, with increase in probability of the observing state (p(s)), FI will also increase. [25] also proposed one methodology in order to determine FI numerically, which is expressed as follows:
where, is the amplitude of the change in system state.
Generally, the mean (μFI), standard deviation (σFI), and coefficient of variation of FI (cvFI) are used as indicators in order to identify stable regimes and regime shifts. Stable regimes are characterized by relatively high mean values of FI along with little to no variation, expressed by standard deviation of FI (↑μFI and ↓σFI) [26,27]; whereas, a regime shift can be characterized by a declining trend in FI between two stable regimes. Typically, during a regime shift, a high value of variation in FI is observed (↑σFI, ↑cvFI) [28]. In this study, the streamflow and the precipitation system were considered for FI analysis. A time window of 10 years was considered for calculating the FI; whereas, the time increment for the time window is considered as 1 year. As there may be more fluctuation of FI at annual scale, smooth FI was also calculated using moving average method for a time window of 5 years, for a better understanding of regime shift of the system.
2.3.4. Relative Contribution of Climate Variability and Anthropogenic Activities in Streamflow Alteration
The Budyko hypothesis [29,30] proposed one single parameter (ω) equation for long-term water and energy balance as follows:
where AET denotes actual evapotranspiration, P denotes precipitation, PET denotes potential evapotranspiration, and ω is a parameter that captures the climate–vegetation topography characteristics. AET is calculated by taking the difference between long-term annual average of precipitation and streamflow, considering the net change in storage in the watershed is zero when considering a time scale of at least 10 years.
The Budyko equation, mentioned above, could be written in the following form:
Now climate variability ( and anthropogenic activities ( that caused a change in streamflow ( can be written as follows:
where,
3. Results
3.1. Temporal Variation in Precipitation and Runoff
The precipitation and runoff data, aggregated on an annual scale, were analyzed using Mann-Kendall’s trend test for the six sample watersheds at various temporal scales (Figure S1). For the precipitation data, a significant trend (at a 95% significance level) was observed, only for the Skillet Fork watershed. For the remaining five watersheds, it was observed that the precipitation remained statistically stable over 50 (and more) years. Mann-Kendall trend test on runoff data revealed that the runoff increased significantly for only two watersheds, i.e., Skillet Fork and Vermillion.
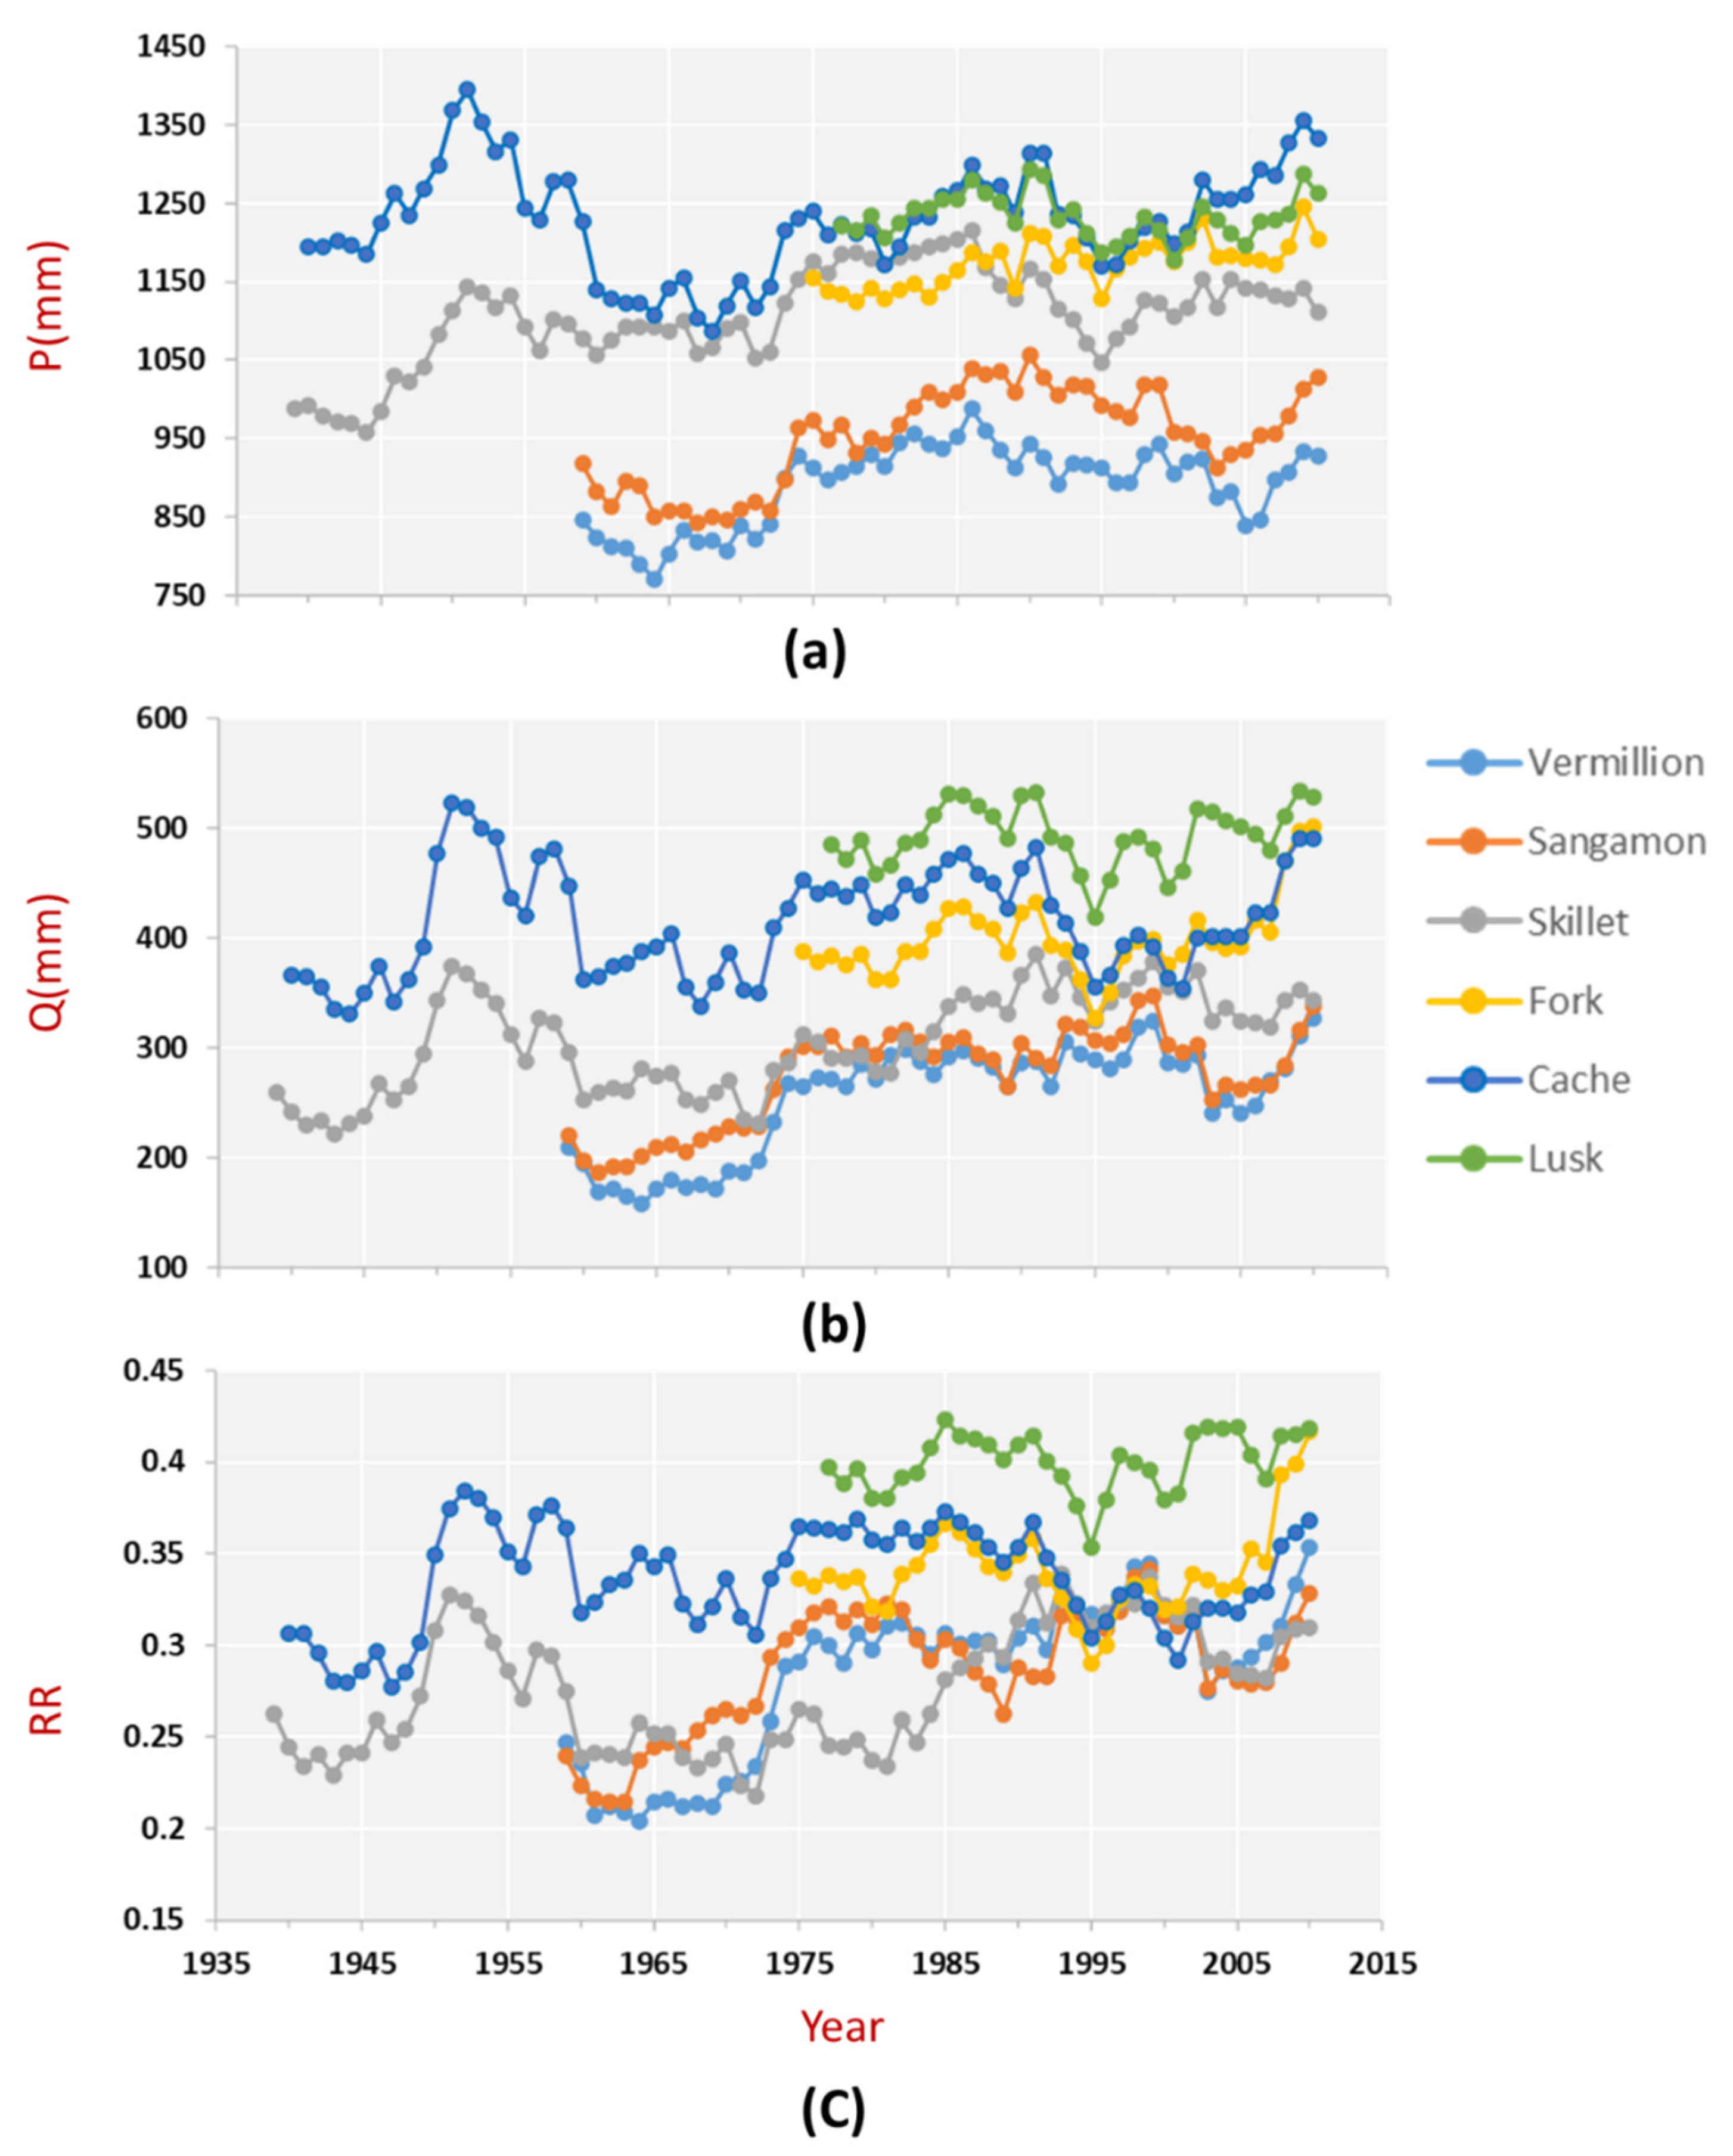
The data was further processed to produce a 10-year moving average to remove the noise in the data (Figure 3). It was noted that most of these watersheds received a similar amount of precipitation, except for the Sangamon and Vermillion Watersheds, which received slightly lower precipitation as compared with other watersheds. It should be noted that the long-term annual average precipitation in Illinois gradually decreases from the south to the north directions. At this scale, various crests and troughs can be observed in the precipitation data, which are indicative of changes in precipitation. The first short period trough is observed in the late 1930s. A more sustained trough, spanning almost more than two decades, was observed in the 60s and the 70s. It is interesting that the annual pattern of runoff closely matches the annual pattern of precipitation. The pattern of crests and troughs in the runoff closely corresponds to the pattern of the precipitation. Even though the temporal pattern of the precipitation and runoff is similar, it can be observed that the pattern in the runoff amount between different watersheds is different from the pattern of corresponding precipitation amounts for the same watersheds.
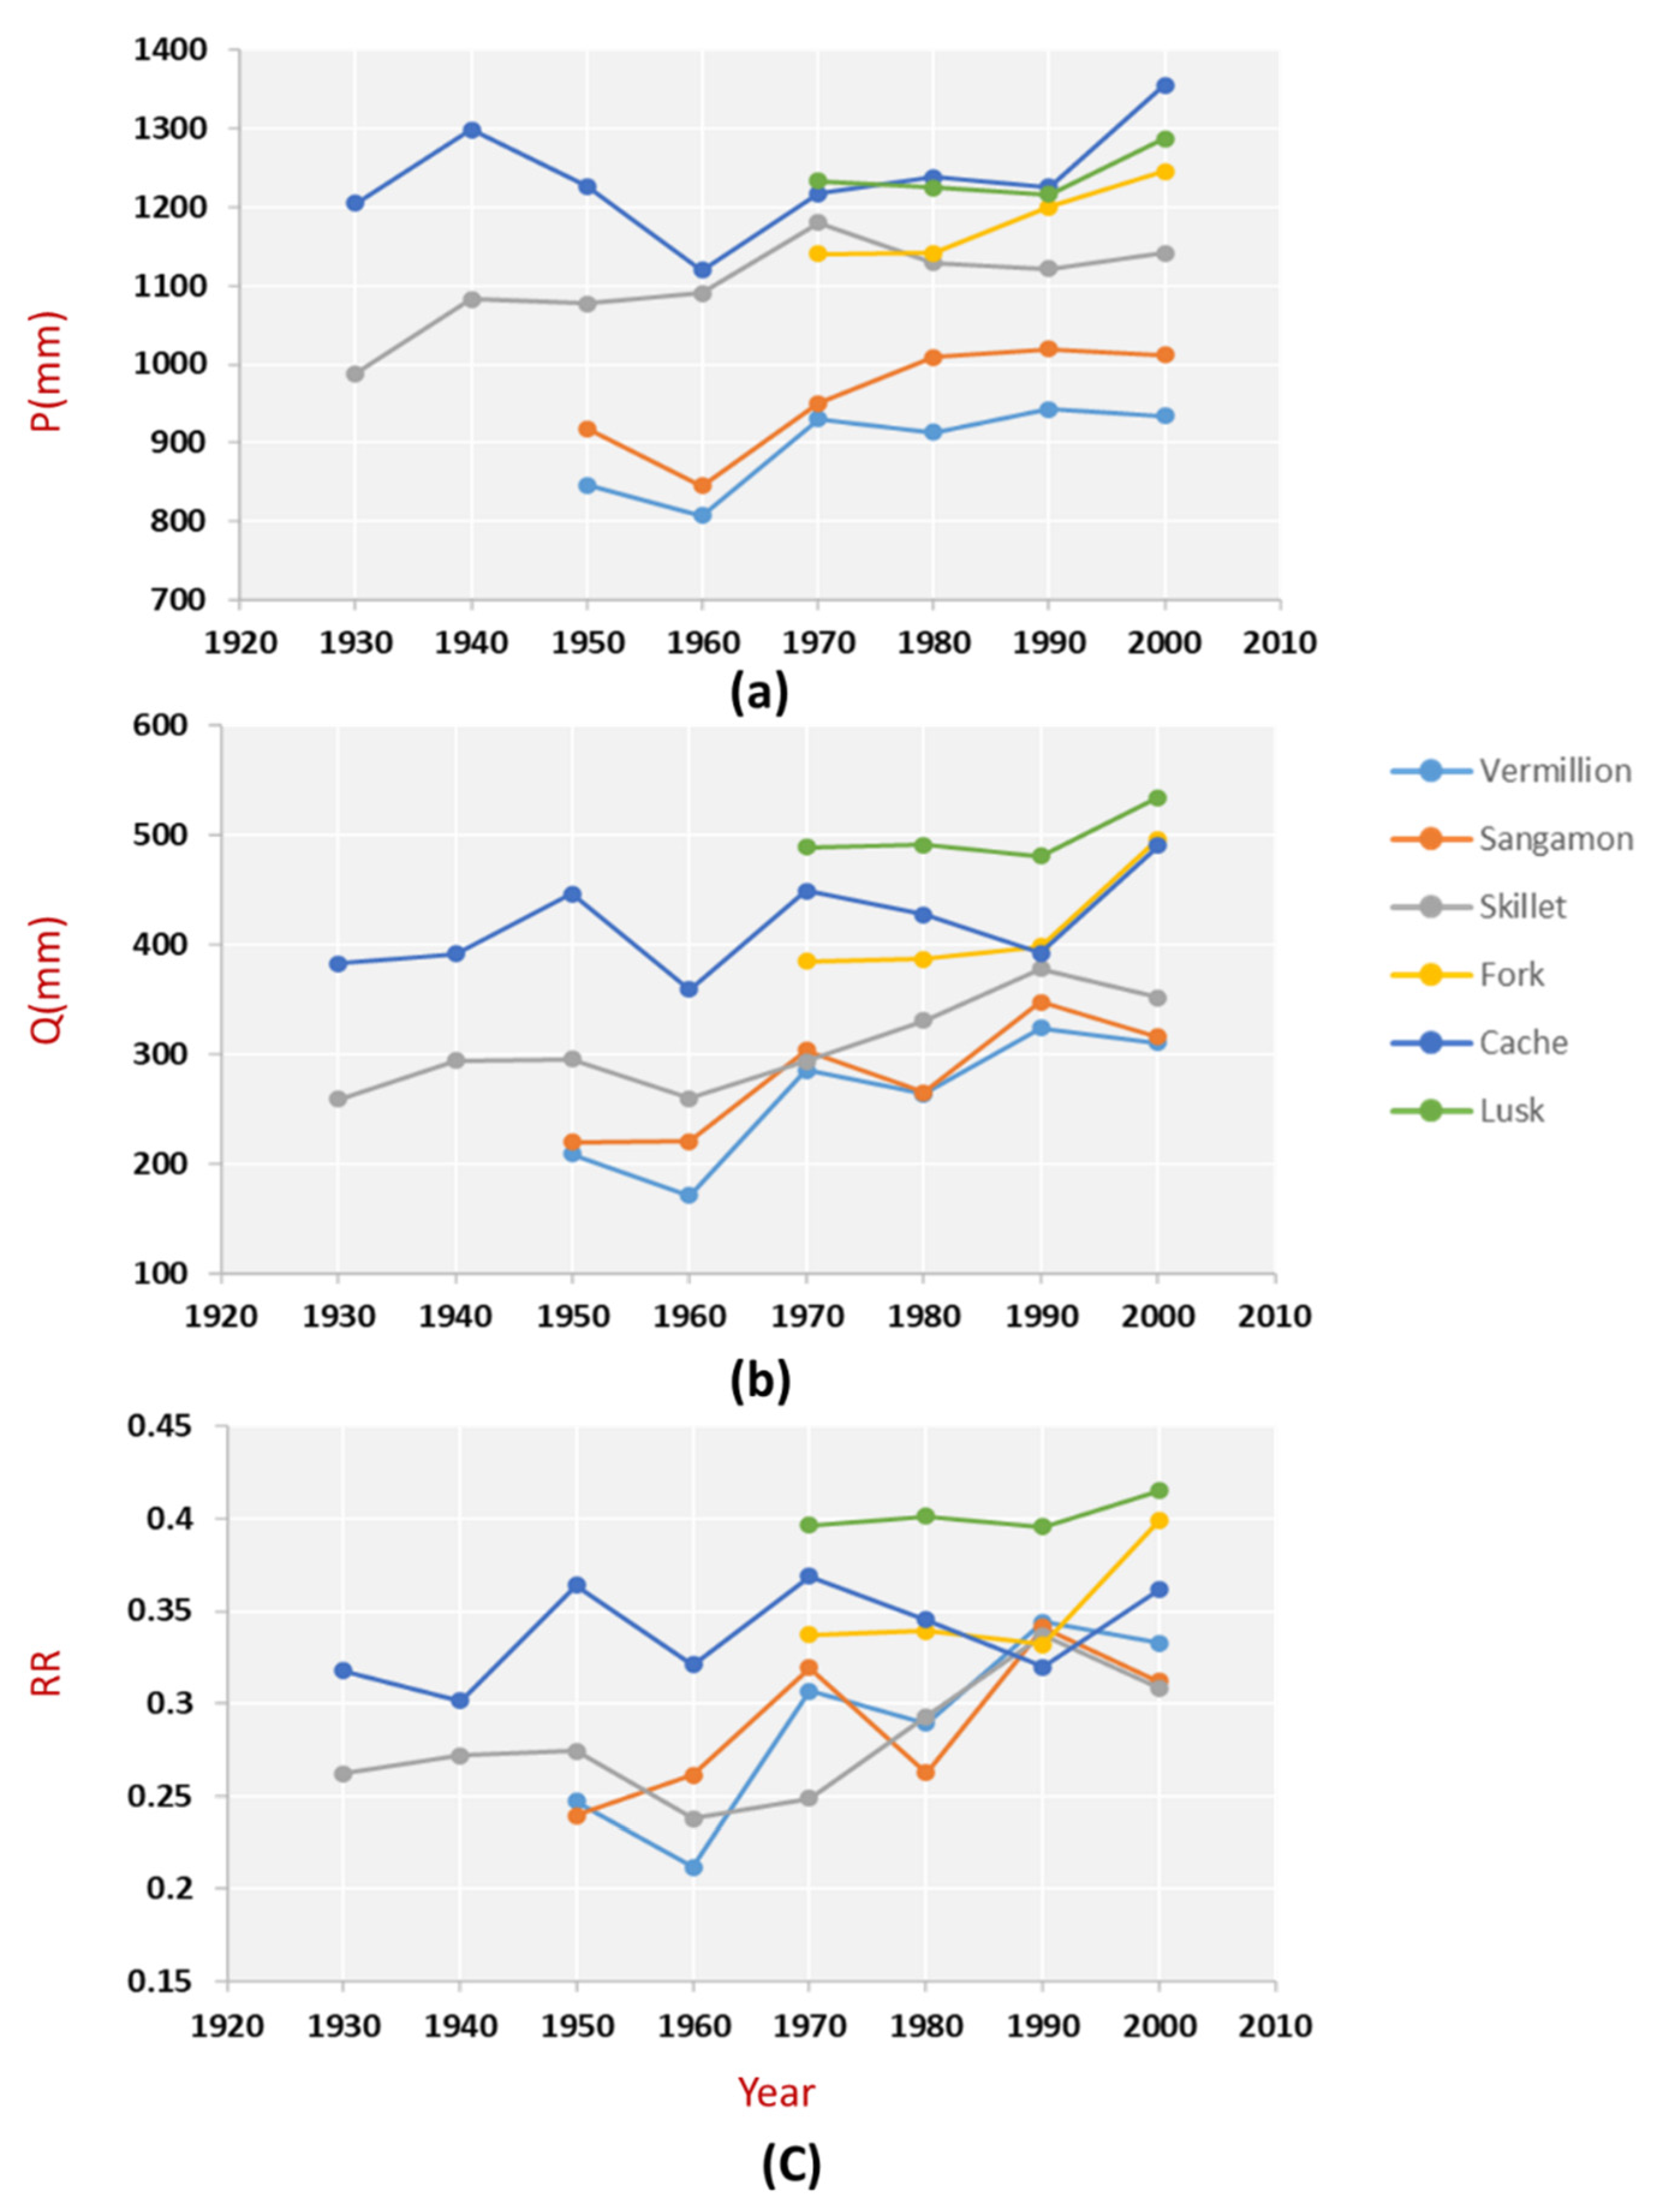
Furthermore, the decadal pattern in the precipitation and runoff was also studied. While the precipitation pattern was similar for most of the watersheds, the distinction among the runoffs was evident (Figure 4). For example, the runoff from the Vermillion watershed was the lowest among the six watersheds. Sangamon, another agriculturally intensive watershed, also produced lower runoff than other watersheds but had a similar pattern and amount to those of Vermillion. On the other hand, the Lusk Creek watershed, a heavily forested—and hence, pristine watershed—produced the highest runoff. A closer analysis showed that the amount of runoff produced by each watershed was inversely proportional to the amount of agricultural land in the watershed. Thus, the lesser the area of agricultural land in the watershed, the larger the conversion of precipitation into the runoff.
In the context of the discrepancy between the precipitation into the watershed and the runoff produced by the watershed, it is necessary to determine the closure of the water balance. This closure, as discussed earlier, is provided by the evapotranspiration (ET) that can be represented by the difference between the precipitation and runoff. It can be inferred from Figure 4 that the amount of ET is also related to the LULC type of the watershed. Vermillion, representing one end of the spectrum, had a very high ET and Lusk creek, representing the other end, had much lower ET.
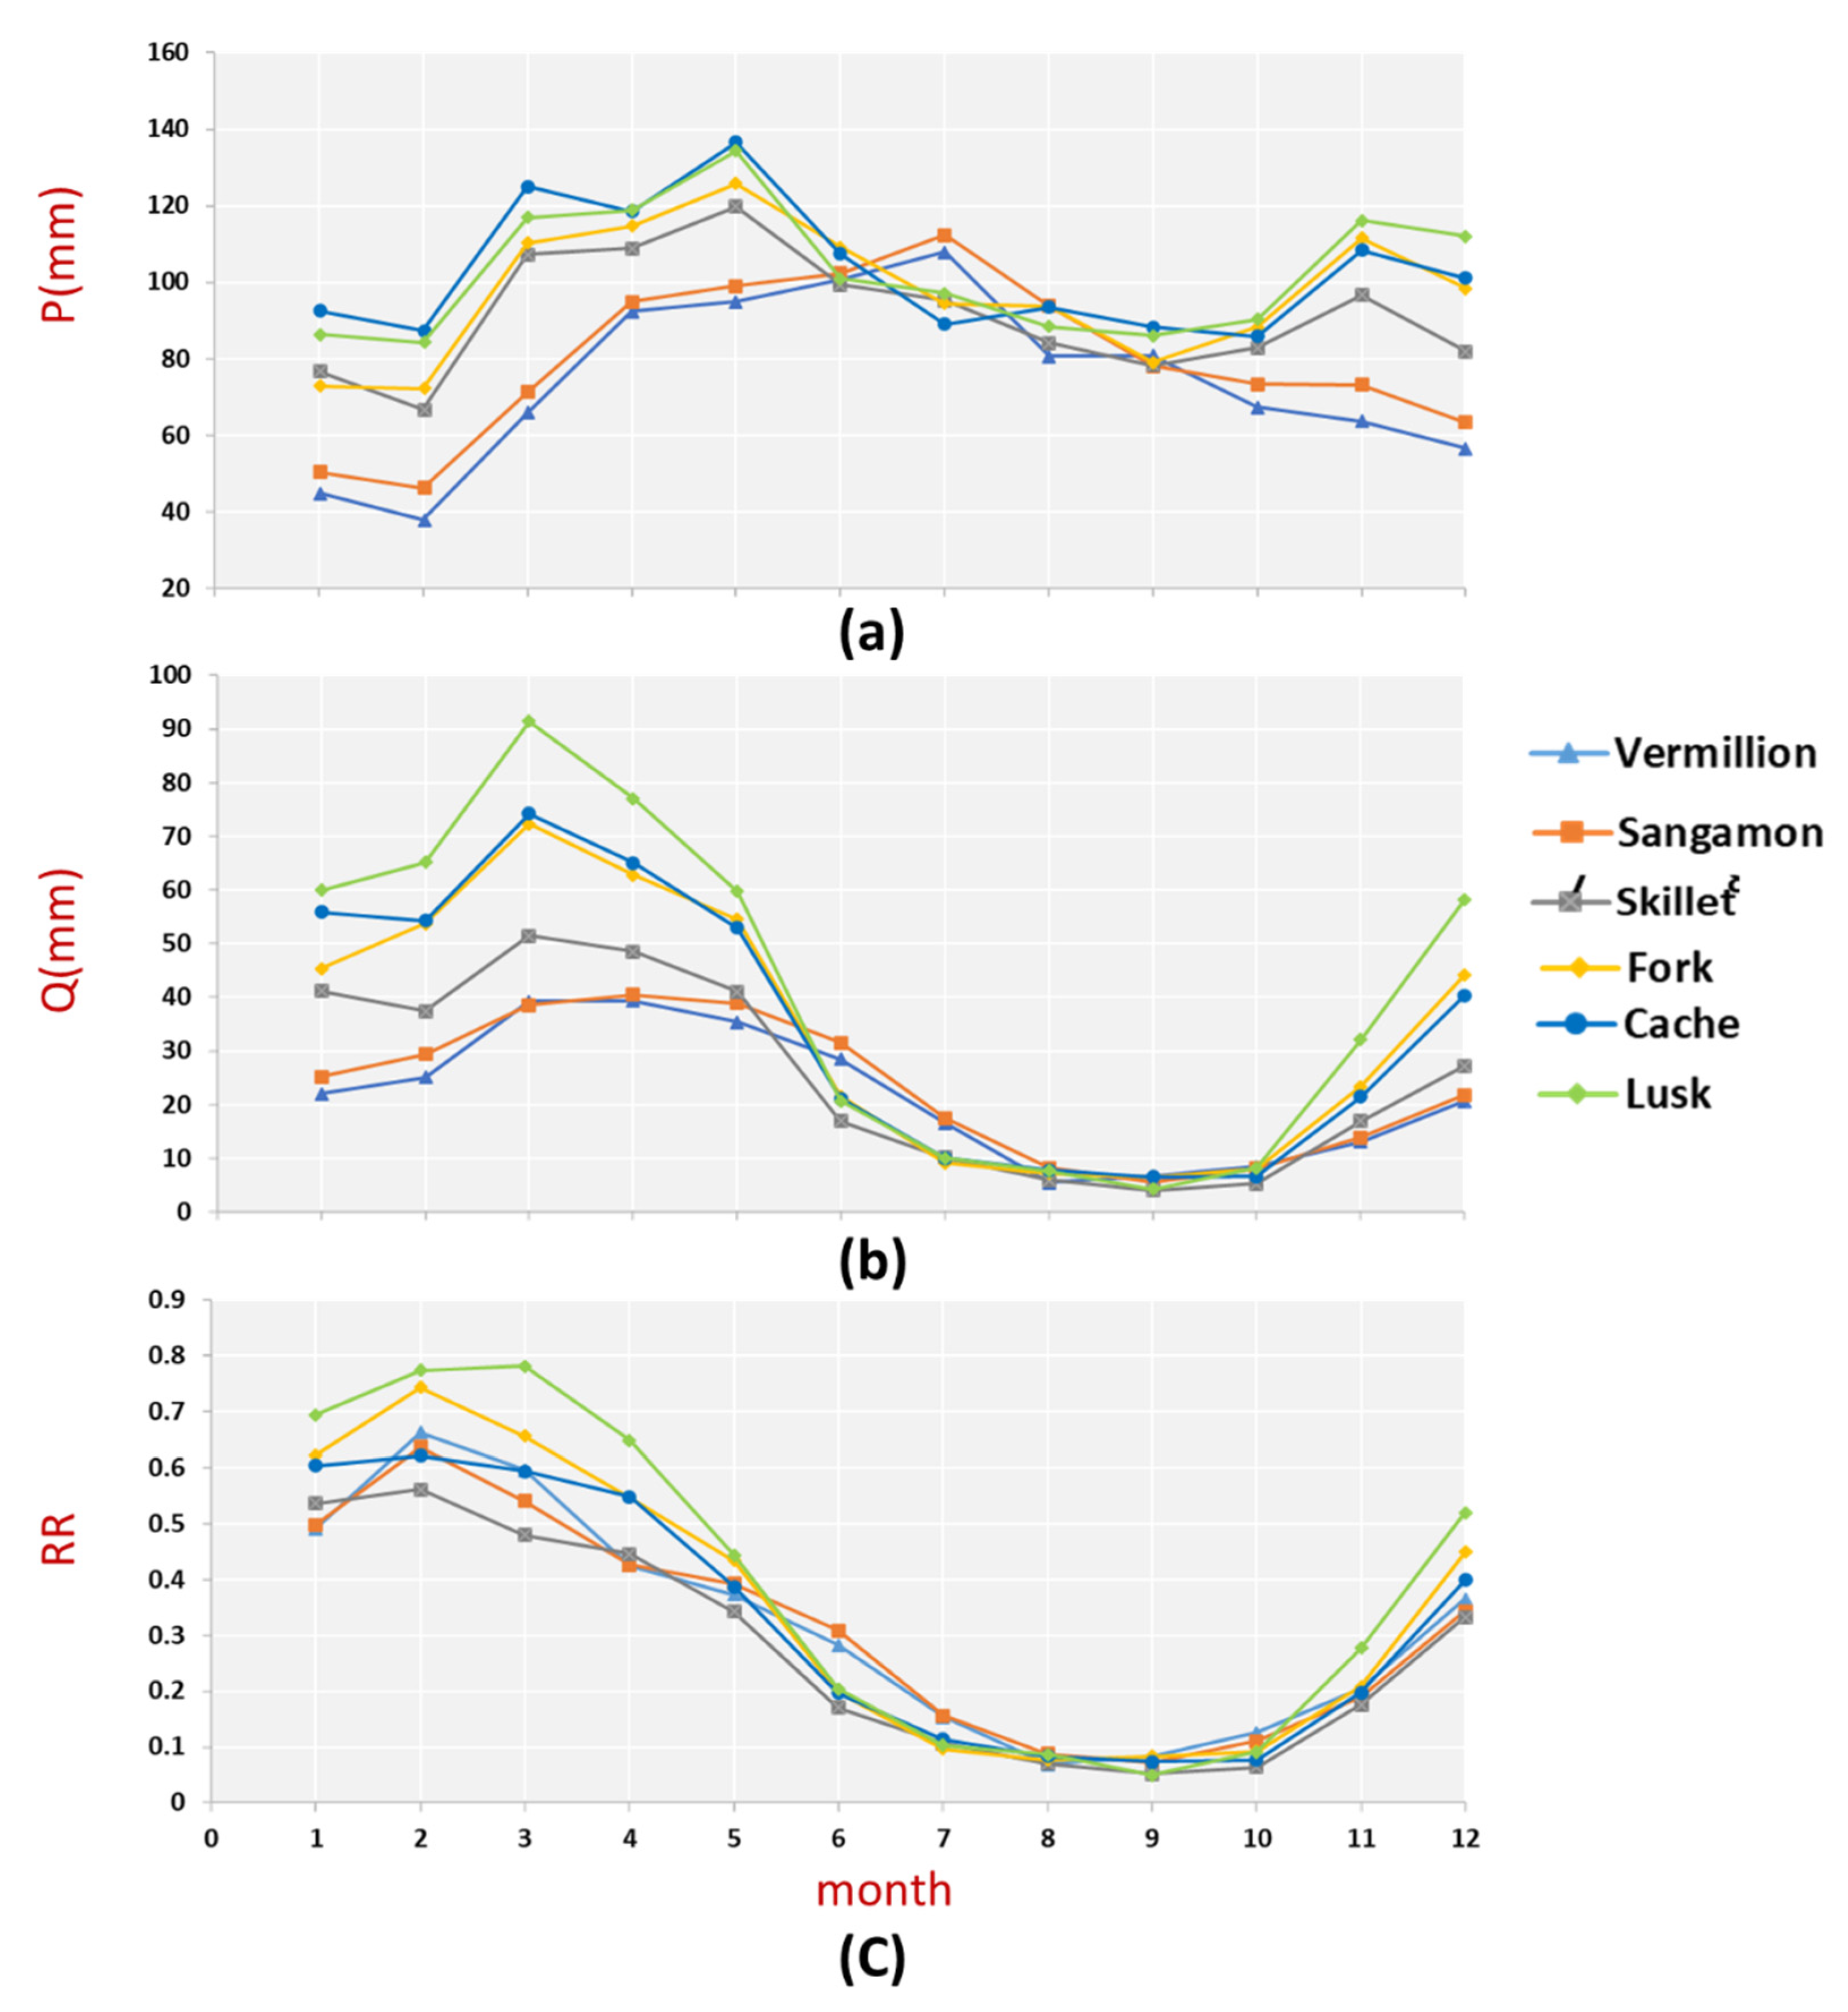
Following the study of the inter-annual and inter-decadal patterns and variability between and within the studied watersheds, within-year seasonal variability was also studied. The long-term monthly distribution of the three parameters discussed above is shown in Figure 5. It can be seen from the precipitation plot that most watersheds received a similar amount of precipitation, except for the Sangamon watershed. The precipitation was highest during the spring and early summer months, after which it fell to its lowest value during the later stages of summer and then picked up again during the winter snowfall period. The Cache watershed received the highest spring precipitation, and Sangamon received the lowest. The inter-watershed volumetric pattern in precipitation, observed at annual and decadal scales, was replicated on the seasonal scale as well. Volumetrically, the seasonal runoff also replicated the same pattern as that displayed by annual and decadal runoff.
From the total runoff hydrograph in Figure 5, it can be observed that the runoff is highest during the spring months and lowest during the fall months. The summer months constitute the attenuation of the hydrograph. The runoff was found to increase again in the winter months in response to an increase in monthly precipitation during those months. However, delving further into analyzing the seasonal pattern, an interesting story starts to manifest itself, which points towards the potential impact of LULC on runoff. Despite receiving a comparable amount of precipitation, the agricultural watersheds produce much lower runoff than the pristine watersheds during the months with high precipitation. On the other hand, the runoff depths between different watersheds are comparable during the low flow months. The falling limb of the hydrograph represents the attenuation of flow from higher depth to lower depth. The slope of the falling limb is found to be much milder for the agricultural watersheds than for the forested watersheds. This behavioral pattern of the falling limb is indicative of the fact that the agricultural watersheds harbor a larger capacity to store water than the forested watersheds, and they release the stored water much more slowly. On the other hand, most of the runoff in the pristine watershed takes place as surface flow without much storage, and this storage is depleted much faster during the attenuation period.
3.2. Trend in Time Series and Regime Shift Analysis
From the Mann-Kendall test, a significant trend in precipitation time series was observed for the Skillet watershed but not for other watersheds. At the same time, a significant trend in runoff was observed for the Sangamon, Vermillion, and Skillet watersheds. The remaining three forest-dominated watersheds did not have any significant trend in the runoff. The trends established in this study were at a 95% significance level.
A distinct change point for streamflow pattern was detected for the three watersheds with dominant agricultural practices from both methods. For the Sangamon and Vermillion watersheds, a distinct change point for streamflow was detected in 1972 with a significance level of 99% using the CUMSUM method that employed 10,000 bootstrap samples. Whereas 1981 and 1977 were found to be the shifting points for Sangamon and Vermillion, respectively, using the FI method. Further, a shift in precipitation regime was identified in 1979, followed by a shift in streamflow in 1981 for Sangamon and 1974, followed by a shift in streamflow in 1977 for Vermillion using the FI method. The results from the change point analysis are summarized in Table 2.
It is noteworthy that, for both watersheds with very similar land usage patterns, the shift in the annual runoff dataset was observed within a narrow temporal window (1972 for both the watersheds using the CUMSUM method; whereas, 1981 and 1977 using FI method). For Skillet watershed, the change point in runoff was detected in the year 1981, but only with a significance level of 91%, whereas 1974 was detected as the change point using the FI method. Since the Skillet watershed also had a significant trend in precipitation, the precipitation time series was also analyzed for detecting change points. The change point analysis pointed to 1966 as the year with maximum cumulative change. However, it should be noted that the significance level of the change was found to be only 69% with a 10000 bootstrap resampling. With such a low significance level, the null hypothesis that there is no distinct change point in the precipitation time series could not be rejected. Further, the FI method was also not able to find any shift in precipitation time series for the Skillet watershed. For the remaining three non-agricultural watersheds, neither significant trend was observed (as discussed earlier), and accordingly, no change point could be established. The CUMSUM charts for runoff time series of the Sangamon, Vermillion, and Skillet watersheds have been shown in Figure 6, and the regime shift analysis using Fisher Information is shown in Figure 7.
3.3. Relative Contribution in Streamflow Alteration
A distinct shift in streamflow regime was noted for all three watersheds where agriculture is the dominant land-use type in the earlier section. The relative contribution analysis was performed, with respect to the change points in streamflow, identified by both CUMSUM and FI method, and the results are summarized in Table 3. The relative contribution from climate was found to be lower (~30–36% for CUMSUM and ~19–28% for FI) for all the agricultural watersheds. The major contribution in streamflow alteration was observed from anthropogenic activities for both the methods for all the watersheds (~64–70% for CUMSUM and ~72–81% for FI). The highest contribution from anthropogenic activities (least contribution from climate) in streamflow change was observed for both the methods in the Vermillion watershed, which has about 91% of agricultural land.
4. Discussion
In the earlier section, it was observed that the annual runoff volume has changed in the recent years for the agricultural watersheds, but not for the forested (and non-agricultural watersheds). In this section, we have tried to identify the driver of such a shift in runoff in those watersheds.
4.1. Impact of Precipitation
From the Mann-Kendall trend test, it was established that, among the six studied watersheds, only one watershed (Skillet) had a significantly increasing annual precipitation. Nevertheless, a significant increase in annual runoff was observed for the Vermillion, Sangamon, and Skillet watersheds around the 1970s. Previous studies also highlighted a significant change in streamflow around the 1970s [33,34]. Change point analysis for annual precipitation and streamflow also helped further establish the above finding. Both CUMSUM and FI detected significant change points in streamflow in the three watersheds, but only a statistically insignificant change point in precipitation in one basin (Skillet). Although the findings are similar from both the methods, the difference in change points can be attributed to the different algorithms used for these methods. This suggested that alteration in streamflow could not be majorly attributed to change in precipitation. However, when the precipitation and runoff data were analyzed for seasonal variability within an annual window, it was observed that there is seasonal dependence of runoff on the precipitation. Any seasonal pattern of precipitation was closely replicated by runoff. The major crops in this crop dominated watersheds are corn and soybeans. In order to provide sufficient water to the root zone, extensive amount of subsurface tile drainage is implemented in this region which has modified the hydrologic response of the agricultural landscapes to large extent. This engineered system, as a result, has increased the streamflow in this region. The year 1975 is also highlighted as a change point, when plastic tile drains were introduced in the upper Midwest to replace clay tiles. Therefore, shifts in streamflow between 1971 and 1981 in the cropland-dominated watersheds can be attributed to the subsurface drainage system.
Further analysis using the Budyko framework also showed that contribution from the climate, including precipitation in streamflow alteration, was not high for the agricultural watersheds (i.e., Sangamon, Vermillion, and Skillet). Even for the Skillet watershed, where the precipitation showed a significant positive trend, the contribution of climate change, calculated using the Budyko framework, was found to be small. Hence, these analyses have established that anthropogenic activity (land-use change) is the main driver of the hydrological regime shift in agricultural watersheds. On the other hand, no shift in hydrological regime was detected for forested watersheds that have remained mostly untouched and unaltered by anthropogenic activities. This contrast in hydrological response between the agricultural watersheds with high human activities and forested watersheds also bolsters the theory that anthropogenic intervention is the primary driver of hydrological changes and not climate change. However, Wang and Hejazi [1] found climate change to be the major driver in significant change in mean annual streamflow for majority of the watersheds, using Model Parameter Estimation Experiment (MOPEX) data in the USA, where the contribution from human activities was spatially heterogeneous.
4.2. Impact of Land Management Practices
In the agricultural watersheds of the US Midwest, land use and management practices have changed significantly in recent decades. Recently, the Midwest has experienced an increase in cropping intensity due to global demand for its agricultural products [35], amplified by the increase in the price of the agricultural commodity [36], and more recently, increasing interest in biofuel production [37]. Furthermore, the 1970s saw a transition from clay tile drains to more efficient plastic tile drains, along with an increase in tile-drained acreage. The primary purpose of these drain tiles is to support crop production by drawing down the depth of the water table below the root zone of the plants. The tile drains facilitate the rapid removal of water from the upper layers of the soil. This reduces the residence time of water in the soil and, therefore, contributes to increased runoff. Hence, the changes in runoff observed in agricultural watersheds can be attributed to the effects of tiles. Similar other studies have also shown that, despite a rapid increase in corn yields in the US between 1949 and 1989, there has been a simultaneous decrease in the ET and a subsequent increase in agricultural runoff due to the presence of the tile drains [2,3].
The relative contribution analysis using the Budyko framework also showed that the major contribution in streamflow alteration in agricultural watersheds (i.e., Sangamon, Vermillion, and Skillet) could be attributed to human activities. On the other hand, no such increase in runoff was observed in the pristine (forested and grassland) watersheds. This discrepancy between the runoff behavior of agricultural watersheds and pristine watersheds also confirms that the watersheds with minimum human interference have not undergone many hydrological changes, and at the same time, bolsters the evidence for the role of the tile drains in agricultural counterparts.
4.3. Impact of Soil Types and Slope of the Watershed
It was observed from the annual and decadal analyses that the agricultural watersheds have consistently produced lower runoff than their naturally endowed counterparts, despite having received a comparable amount of precipitation. When the runoff was normalized by precipitation received by using the runoff ratio (RR), it was still observed that the agricultural watersheds produced lower runoff per unit of precipitation. It was also noteworthy from the analysis of the runoff hydrograph for each watershed that the agricultural watersheds had a milder slope of the falling limb of the hydrograph during the summer months than that of the watersheds dominated by forests. From the mild slope of the falling limb of the hydrograph, it can be inferred that the residence of moisture in the soil is longer, and therefore, its release is slow during the dry summer period in the tile-drained agricultural watersheds.
Such discrepancy in the behavior between the watersheds with two distinctly different types of land uses can be attributed to the combination of two factors—the soil type and the slope of the watershed. As already shown in Table 2, the predominant soil order in Vermillion and Sangamon, the two agriculture-majority watersheds, is Mollisols. Mollisols [38] are hydric soils found in the grassland vegetation and formed under the condition of saturation, flooding, or ponding. This soil is also characterized by its larger clay content with poor drainage capacity. Thus, this soil can hold more water and retain it for a longer time. This hydrophilic property of the Mollisols has been replicated in the shape of the runoff hydrograph for these two watersheds. On the other hand, the predominant soil order for the rest of the watersheds is Alfisols [39]. The majority of Alfisols are formed under hardwood forest cover, and despite being rich in clay content, have well-developed natural drainage due to the interception of the roots of the forest trees. Therefore, the soils with Alfisols release water much faster than their counterparts dominated by Mollisols. The drainage pattern in the sample pristine watersheds mirrors the properties of Alfisols.
It is not just the distinction of soil types between the watersheds that caused the variability in runoff ratio. The slope of the watershed also plays a driving role. The agricultural watersheds in central Illinois have a low slope. And on the other hand, the southern forested watersheds have a higher slope than the agricultural watersheds. The Lusk Creek watershed has the highest slope, and its high slope is reflected in its high runoff ratio. The Fork Saline watershed has the second-highest slope followed by the Cache River watershed. Accordingly, they have a higher runoff ratio than the agricultural watersheds, but not as high as the runoff ratio of the Lusk Creek watershed. The agricultural watersheds have a low runoff ratio, with the Vermillion watershed having the lowest runoff ratio. Thus, it can be inferred that soil type and order, along with the slope of the watershed, play a significant role in runoff production in the basins of Illinois.
5. Conclusions
In this study, exploratory statistical tools were deployed to identify the sources of changes in the hydrological regime and interpret its implications in six watersheds, which were different from each other in terms of various watershed characteristics (i.e., land use, soil type). We studied the nature of change in streamflow dynamics in agricultural watersheds and identified that there were shifts in streamflow regimes, mainly in the 1970s. In contrast, the runoff in non-agricultural watersheds remained largely unchanged. Budyko analysis showed that alterations in streamflow could be majorly attributed to anthropogenic activities including installation of tile drainage which altered the hydrologic pathways of surface runoff significantly; whereas, climate including precipitation had a lower influence in the agricultural watersheds. The seasonality in runoff was found largely to be driven by the seasonality in precipitation. At the same time, the inter-annual and periodic changes in runoff were found to be independent of the precipitation. By the process of exclusion, it was determined that the inter-annual changes in runoff were a function of changes in land management practices. In watersheds with less human intervention, and hence, low changes in land use and management, no evidence of runoff changes were detected. This fact underscores the effects of land use and management changes on runoff. In addition, the runoff volume and pattern responded strongly to the soil type and its drainage properties in the respective watersheds. Also, the dominant soil type of the watershed, which is time-invariant over the period of this study, determines the behavior of its surface hydrology. This understanding has encouraged us to consider if the change in soil type has the potential to offset minor changes in land use. Therefore, this study highlights the importance of assessing and quantifying the relative impacts of climate, land use, and soil type, especially in highly managed agricultural landscapes, using simplified yet effective approach. The techniques used and results obtained from this study will be useful in better understanding the relative impact of climate and anthropogenic activities on streamflow in heavily managed agricultural watersheds under climate change.
Supplementary Materials
The following are available online at https://www.mdpi.com/article/10.3390/w13223226/s1, Figure S1: Annual time series of (a) precipitation and (b) streamflow for Vermillion, Sangamon, Skillet, Fork, Cache, and Lusk watersheds.
Author Contributions
Conceptualization, V.D. and R.B.; methodology, M.K., V.D. and H.J.; formal analysis, M.K. and V.D.; writing—original draft preparation, V.D. and M.K.; writing—review and editing, R.B., H.J. and M.M.; supervision, R.B.; project administration, R.B.; funding acquisition, R.B. All authors have read and agreed to the published version of the manuscript.
Funding
This work was partially supported by the National Institute of Food and Agriculture, U.S. Department of Agriculture, Hatch project (No. ILLU-741-337).
Institutional Review Board Statement
Not applicable.
Informed Consent Statement
Not applicable.
Data Availability Statement
The data used in this study can be provided by the authors if requested.
Conflicts of Interest
The authors declare no conflict of interest.
References
- Wang, D.; Hejazi, M. Quantifying the relative contribution of the climate and direct human impacts on mean annual streamflow in the contiguous United States. Water Resour. Res. 2011, 47, W00J12. [Google Scholar] [CrossRef] [Green Version]
- Frans, C.; Istanbulluoglu, E.; Mishra, V.; Munoz-Arriola, F.; Lettenmaier, D.P. Are climatic or land cover changes the dominant cause of runoff trends in the Upper Mississippi River Basin? Geophys. Res. Lett. 2013, 40, 1104–1110. [Google Scholar] [CrossRef]
- Schottler, S.P.; Ulrich, J.; Belmont, P.; Moore, R.; Lauer, J.W.; Engstrom, D.R.; Almendinger, J.E. Twentieth century agricultural drainage creates more erosive rivers. Hydrol. Process. 2014, 28, 1951–1961. [Google Scholar] [CrossRef]
- Gupta, S.C.; Kessler, A.C.; Brown, M.K.; Zvomuya, F. Climate and agricultural land use change impacts on streamflow in the upper midwestern United States. Water Resour. Res. 2015, 51, 5301–5317. [Google Scholar] [CrossRef]
- Kelly, S.A.; Takbiri, Z.; Belmont, P.; Foufoula-Georgiou, E. Human amplified changes in precipitation-runoff patterns in large river basins of the Midwestern United States. Hydrol. Earth Syst. Sci. 2017, 21, 5065–5088. [Google Scholar] [CrossRef] [Green Version]
- Allen, M.R.; Ingram, W.J. Constraints on future changes in climate and the hydrologic cycle. Nature 2002, 419, 642. [Google Scholar] [CrossRef]
- Fischer, E.M.; Knutti, R. Observed heavy precipitation increase confirms theory and early models. Nat. Clim. Chang. 2016, 6, 986–991. [Google Scholar] [CrossRef]
- Shi, P.J.; Yuan, Y.; Zheng, J.; Wang, J.A.; Ge, Y.; Qiu, G.Y. The effect of land use/cover change on surface runoff in Shenzhen region, China. Catena 2007, 69, 31–35. [Google Scholar] [CrossRef]
- Tomer, M.D.; Schilling, K.E. A simple approach to distinguish land-use and climate-change effects on watershed hydrology. J. Hydrol. 2009, 376, 24–33. [Google Scholar] [CrossRef]
- Nangia, V.; Mulla, D.J.; Gowda, P.H. Precipitation changes impact stream discharge, nitrate-nitrogen load more than agricultural management changes. J. Environ. Qual. 2010, 39, 2063–2071. [Google Scholar] [CrossRef]
- Renner, M.; Bernhofer, C. Applying simple water-energy balance frameworks to predict the climate sensitivity of streamflow over the continental United States. Hydrol. Earth Syst. Sci. 2012, 16, 2531–2546. [Google Scholar] [CrossRef] [Green Version]
- Patterson, L.A.; Lutz, B.; Doyle, M.W. Climate and direct human contributions to changes in mean annual streamflow in the South Atlantic, USA. Water Resour. Res. 2013, 49, 7278–7291. [Google Scholar] [CrossRef]
- Tan, X.; Gan, T.Y. Contribution of human and climate change impacts to changes in streamflow of Canada. Sci. Rep. 2015, 5, 17767. [Google Scholar] [CrossRef] [PubMed]
- Gao, G.; Fu, B.; Wang, S.; Liang, W.; Jiang, X. Determining the hydrological responses to climate variability and land use/cover change in the Loess Plateau with the Budyko framework. Sci. Total Environ. 2016, 557, 331–342. [Google Scholar] [CrossRef]
- Joiner, J.; Yoshida, Y.; Vasilkov, A.P.; Schaefer, K.; Jung, M.; Guanter, L.; Zhang, Y.; Garrity, S.; Middleton, E.M.; Huemmrich, K.F.; et al. The seasonal cycle of satellite chlorophyll fluorescence observations and its relationship to vegetation phenology and ecosystem atmosphere carbon exchange. Remote Sens. Environ. 2014, 152, 375–391. [Google Scholar] [CrossRef] [Green Version]
- Slater, L.; Villarini, G. Evaluating the drivers of seasonal streamflow in the U.S. Midwest. Water 2017, 9, 695. [Google Scholar] [CrossRef]
- Crop Prophet. US Corn Production by State. 2020. Available online: https://www.cropprophet.com/us-corn-production-by-state (accessed on 10 January 2021).
- NOAA. cli-MATE Midwest Regional Climate Center. 2020. Available online: https://mrcc.purdue.edu/CLIMATE/ (accessed on 20 September 2020).
- U.S. Geological Survey. National Water Information System data available on the Worild Wide Web (USGS Water Data for the Nation). 2020. Available online: https://waterdata.usgs.gov/nwis (accessed on 15 October 2020).
- Illinois Climate Network. Water and Atmospheric Resources Monitoring Program; 2204 Griffith Drive, Champaign, I. 61820-7495; Illinois State Water Survey: Champaign, IL, USA, 2017. [Google Scholar] [CrossRef]
- Hamed, K.H.; Ramachandra Rao, A. A modified Mann-Kendall trend test for autocorrelated data. J. Hydrol. 1998, 204, 182–196. [Google Scholar] [CrossRef]
- Gocic, M.; Trajkovic, S. Analysis of changes in meteorological variables using Mann-Kendall and Sen’s slope estimator statistical tests in Serbia. Glob. Planet. Chang. 2013, 100, 172–182. [Google Scholar] [CrossRef]
- Taylor, W. A Pattern Test for Distinguishing between Autoregressive and Mean-Shift Data; Taylor Enterprises: Libertyville, IL, USA, 2000. [Google Scholar]
- Fath, B.D.; Cabezas, H.; Pawlowski, C.W. Regime changes in ecological systems: An information theory approach. J. Theor. Biol. 2003, 222, 517–530. [Google Scholar] [CrossRef]
- Karunanithi, A.; Cabezas, H.; Frieden, B.R.; Pawlowski, C.W. Detection and assessment of ecosystem regime shifts from Fisher information. Ecol. Soc. 2008, 13, 22. [Google Scholar] [CrossRef] [Green Version]
- Eason, T.; Garmestani, A.S. Cross-scale dynamics of a regional urban system through time. Reg. Et Dev. 2012, 36, 55–77. [Google Scholar]
- Gonzalez-Mejia, A.M. Fisher Information-Sustainability Analysis of Several US Metropolitan Statistical Areas. Ph.D. Thesis, University of Cincinnati, Cincinnati, OH, USA., 2011. [Google Scholar]
- Sundstrom, S.M.; Eason, T.; Nelson, R.J.; Angeler, D.G.; Barichievy, C.; Garmestani, A.S.; Graham, N.A.J.; Granholm, D.; Gunderson, L.; Knutson, M.; et al. Detecting spatial regimes in ecosystems. Ecol. Lett. 2017, 20, 19–32. [Google Scholar] [CrossRef] [PubMed] [Green Version]
- Budyko, M.; Miller, D.; Miller, D. Climate and Life; Academic: New York, NY, USA, 1974. [Google Scholar]
- Fu, B. On the calculation of evaporation from land surface in mountainous areas. Sci. Atmos. Sin. 1981, 5, 23–31. (in Chinese). [Google Scholar]
- Yang, H.; Yang, D. Derivation of climate elasticity of runoff to assess the effects of climate change on annual runoff. Water Resour. Res. 2011, 47, 7526. [Google Scholar] [CrossRef]
- Wu, J.; Miao, C.; Zhang, X.; Yang, T.; Duan, Q. Detecting the quantitative hydrological response to changes in climate and human activities. Sci. Total Environ. 2017, 586, 328–337. [Google Scholar] [CrossRef] [PubMed]
- McCabe, G.J.; Wolock, D.M. A step increase in streamflow in the conterminous United States. Geophys. Res. Lett. 2002, 29, 38-1. [Google Scholar] [CrossRef]
- Juckem, P.; Hunt, R.; Anderson, M.; Robertson, D.M. Effects of climate and land management change on streamflow in the driftless area of Wisconsin. J. Hydrol. 2008, 355, 123–130. [Google Scholar] [CrossRef]
- Adegoke, J.; Pielke Sr, R.; Carleton, A.M. Observational and modeling studies of the impacts of agriculture-related land use change on planetary boundary layer processes in the central US. Agric. For. Meteorol. 2007, 142, 203–215. [Google Scholar] [CrossRef]
- Wright, C.K.; Wimberly, M.C. Recent land use change in the Western Corn Belt threatens grasslands and wetlands. Proc. Natl. Acad. Sci. USA 2013, 110, 4134–4139. [Google Scholar] [CrossRef] [Green Version]
- Hatfield, J.L.; Cruse, R.M.; Tomer, M.D. Convergence of agricultural intensification and climate change in the Midwestern United States: Implications for soil and water conservation. CSIRO 2013, 64, 423–435. [Google Scholar] [CrossRef] [Green Version]
- Fenton, T.E. Mollisols. Dev. Soil Sci. 1983, 11, 125–163. [Google Scholar] [CrossRef]
- Rust, R.H. Alfisols. Dev. Soil Sci. 1983, 11, 253–281. [Google Scholar] [CrossRef]
Figure 1.
Location map of the studied watersheds in Illinois.

Figure 2.
Methodological framework for identification of regime shifts and relative contribution analysis.
Figure 2.
Methodological framework for identification of regime shifts and relative contribution analysis.

Figure 3.
10 year moving average of the (a) precipitation (P), (b) runoff (Q), and (c) runoff ratio (RR).
Figure 3.
10 year moving average of the (a) precipitation (P), (b) runoff (Q), and (c) runoff ratio (RR).

Figure 4.
Decadal average of the (a) precipitation (P), (b) runoff (Q), and (c) runoff ratio (RR).

Figure 5.
Seasonal pattern of the (a) precipitation (P), (b) runoff (Q), and (c) runoff ratio (RR).

Figure 6.
CUMSUM chart for the Sangamon, Vermillion and Skillet watersheds.

Figure 7.
Analyses of regime shifts of annual streamflows and precipitation time series using Fisher Information for (a) the Sangamon watershed; (b) the Vermillion watershed, and (c) the Skillet watershed. The black and red (dashed) vertical lines show the start of transition from one regime to the another and starting of new regime (year of regime shift), respectively.


Table 1.
Physical characteristics of the sample watersheds along with time period and source of data.
Table 1.
Physical characteristics of the sample watersheds along with time period and source of data.
| Watershed | Major Land Use * | Soil Order | Soil Type | Avg. Slope (%) | Drainage Area (km2) | Data Period and Source | Circularity Ratio |
|---|---|---|---|---|---|---|---|
| Vermillion | Agriculture (91) | Mollisols | Poorly drained | 0.57 | 1499.60 | P (1942–2010), [18] PET (1950–2010), [19] Q (1950–2010), [20] | 0.22 |
| Sangamon | Agriculture (86) | Mollisols | Poorly drained | 0.51 | 1424.49 | P (1950–2010), [18] PET (1950–2010 [19] Q (1921–2010), [20] | 0.15 |
| Skillet Fork | Agriculture (65) Forest (16) | Alfisols | Somewhat poorly drained | 0.49 | 1180.70 | P (1930–2010), [18] PET (1950–2010), [19] Q (1930–2010), [20] | 0.26 |
| Lusk Creek | Forest (80) Pasture (10) | Alfisols | Moderately well drained | 4.9 | 110.77 | P (1950–2010), [18] PET (1950–2010), [19] Q (1967–2010), [20] | 0.29 |
| Fork Saline | Forest (46) Pasture (33) | Alfisols | Moderately well drained | 2.1 | 405.38 | P (1950–2010), [18] PET (1950–2010), [19] Q (1965–2010), [20] | 0.21 |
| Cache | Forest (46) Pasture (35) | Alfisols, Inceptisols | Well drained | 1.6 | 631.47 | P (1931–2010), [18] PET (1950–2010), [19] Q (1931–2010), [20] | 0.18 |
* Numbers in parentheses indicate the percentage of the corresponding land cover in each watershed.
Table 2.
Change point analysis for annual runoff and precipitation time series for CUMSUM and FI methods for Sangamon, Vermillion, and Skillet, where SL and NCP represent a significance level and a no change point, respectively.
Table 2.
Change point analysis for annual runoff and precipitation time series for CUMSUM and FI methods for Sangamon, Vermillion, and Skillet, where SL and NCP represent a significance level and a no change point, respectively.
| Variable | Watershed | Start Date | End Date | Change Year | |
|---|---|---|---|---|---|
| CUMSUM (SL) | FI | ||||
| Streamflow | Sangamon | 1922 | 2016 | 1972 (99%) | 1981 |
| Vermillion | 1943 | 2016 | 1972 (98%) | 1977 | |
| Skillet | 1930 | 2016 | 1982 (91%) | 1974 | |
| Precipitation | Sangamon | 1950 | 2010 | NCP | 1979 |
| Vermillion | 1950 | 2010 | NCP | 1974 | |
| Skillet | 1950 | 2010 | 1966 (69%) | NCP | |
Table 3.
Percentage contribution from humans and the climate towards streamflow changes, according to both CUMSUM and FI methods for the Sangamon, Vermillion and Skillet watersheds.
Table 3.
Percentage contribution from humans and the climate towards streamflow changes, according to both CUMSUM and FI methods for the Sangamon, Vermillion and Skillet watersheds.
| Watershed | CUMSUM | Fisher Information | ||||
|---|---|---|---|---|---|---|
| Change Point | Climate Contribution (%) | Anthropogenic Contribution (%) | Change Point | Climate Contribution (%) | Anthropogenic Contribution (%) | |
| Sangamon | 1971 | 36.01 | 63.99 | 1981 | 28.34 | 71.66 |
| Vermillion | 1971 | 30.06 | 69.94 | 1977 | 18.54 | 81.46 |
| Skillet | 1981 | 30.30 | 69.70 | 1974 | 25.96 | 74.04 |
Publisher’s Note: MDPI stays neutral with regard to jurisdictional claims in published maps and institutional affiliations. |
© 2021 by the authors. Licensee MDPI, Basel, Switzerland. This article is an open access article distributed under the terms and conditions of the Creative Commons Attribution (CC BY) license (https://creativecommons.org/licenses/by/4.0/).
Share and Cite
MDPI and ACS Style
Khan, M.; Dahal, V.; Jeong, H.; Markus, M.; Bhattarai, R. Relative Contribution of Climate Change and Anthropogenic Activities to Streamflow Alterations in Illinois. Water 2021, 13, 3226. https://doi.org/10.3390/w13223226
AMA Style
Khan M, Dahal V, Jeong H, Markus M, Bhattarai R. Relative Contribution of Climate Change and Anthropogenic Activities to Streamflow Alterations in Illinois. Water. 2021; 13(22):3226. https://doi.org/10.3390/w13223226
Chicago/Turabian StyleKhan, Manas, Vaskar Dahal, Hanseok Jeong, Momcilo Markus, and Rabin Bhattarai. 2021. "Relative Contribution of Climate Change and Anthropogenic Activities to Streamflow Alterations in Illinois" Water 13, no. 22: 3226. https://doi.org/10.3390/w13223226
Note that from the first issue of 2016, this journal uses article numbers instead of page numbers. See further details here.