
Quantifying the Impacts of Coal Mining and Soil-Water Conservation on Runoff in a Typical Watershed on the Loess Plateau, China


1
Department of Hydraulic Engineering, Tsinghua University, Beijing 100084, China
2
State Key Laboratory of Simulation and Regulation of Water Cycle in River Basin, China Institute of Water Resources and Hydropower Research, Beijing 100038, China
3
College of Hydraulic Science and Engineering, Taiyuan University of Technology, Taiyuan 030024, China
*
Author to whom correspondence should be addressed.
Water 2021, 13(22), 3229; https://doi.org/10.3390/w13223229
Submission received: 29 September 2021
/
Revised: 9 November 2021
/
Accepted: 9 November 2021
/
Published: 14 November 2021
(This article belongs to the Section Hydrology)
Abstract
:Coal mining and soil-water conservation are the two major human interventions on the Loess Plateau in China. Analyzing their impacts on hydrological processes is of great significance for sustainable water resource management. Using hydrological simulation (Soil and Water Assessment Tool, SWAT) and a data-driven method (double mass curve, DMC), the contributions of these two human activities and climate change to the runoff decrease were analyzed in the upper Fenhe River. The runoff in the three affected periods (1967–1987, 1988–1994, and 1995–2017) decreased by 7.5%, 28.2%, and 24.1%, respectively, compared with the base period (1957–1966). In the first affected period (1967–1987), the amount of coal mining activities was small, human activities had little impact on runoff. In the second (1988–1994) and third (1995–2017) periods, as the coal mining and soil-water conservation intensified, their contributions to the runoff decrease rapidly increased. Due to the uncertainties in the model structure and parameters, in addition to the impact of the data accuracy, the results obtained from the two methods were different, but the proportions and the trends of the contribution rates in the different periods were consistent.
1. Introduction
Shanxi Province, located in central China, is rich in coal resources and is the coal energy base of China. The area of the coal-bearing strata is about 60,000 km2, accounting for 35% of the province’s total area. More than 14 billion tons of coal were mined in Shanxi Province between 1949 and 2015, ensuring the energy supply needed for China’s economic development [1]. Long-term, high-intensity, and unscientific coal mining has resulted in large mined-out areas in Shanxi Province. The Chinese Loess Plateau is an area with severe soil erosion and a fragile ecological environment. In order to control soil erosion and restore the ecological environment, the Chinese government has implemented a large-scale soil-water conservation project in this region over the past 30 years [2]. Tree planting and afforestation are the main measures used in this project. The increase in the vegetation coverage will strengthen the canopy interception and result in more vegetation evapotranspiration. The coal mining and soil-water conservation project have had significant impacts on the natural hydrological processes. Studying the impacts of the two human activities on runoff is important for scientific water resource management.
Since the 1980s, the runoff has decreased in most of northern China. Attribution of runoff decreases induced by climate change and human activities has become an important and difficult research topic [3,4]. Based on previous studies, there are two main methods for quantitatively assessing the effects of climate change and human activities on runoff change: process-based modelling and data-driven methods [5,6,7]. Modelling requires multiple input datasets with high precision and involves many physical parameters. In the processes of hydrological simulations, the contribution of climate variability to runoff change is revealed by keeping the underlying surface conditions unchanged and changing the meteorological input data. The contribution of human activities to runoff change is revealed by keeping the meteorological data fixed and changing the underlying surface conditions [8,9]. The data-driven method uses a simple linear relationship or nonlinear parametric estimation based on long-term observations, but generally lacks physical meaning [10]. Guo et al. [11] used the Yellow River Water Balance Model (YRWBM) to analyze the impact of coal mining on the runoff in the Kuye River basin in China. Decreased runoff was detected due to open coal mining; however, increased runoff was detected due to surface coal mining, in the Goulburn River catchment in Australia [12].
Soil-water conservation projects have been an important driving factor of the decrease in runoff from the Loess Plateau in China over the past 50 years [13,14,15]. Previous work has provided insight into the hydrological processes coupled with coal mining or soil-water conservation, respectively. However, studies about the hydrological impacts considering both coal mining and soil-water conservation projects at the same time are lacking.
The upper Fenhe River Basin, located in the Shanxi Province of China, is on the eastern flank of the Loess Plateau. The area, monitored by the Jingle Hydrological Station, is a mountainous watershed with a sparse population. Humans take little water directly from the river in this district. It is a typical area that has been strongly disturbed by coal mining and soil-water conservation. In the past few decades, the runoff of this area has decreased significantly due to the two human activities against the background of climate change. In addition, the area has a relatively complete long-term hydrometeorological dataset. In this study, this area was taken as the research object. Hydrological simulation and a data-driven method were used to quantitatively analyze the impacts of human activities and climate change on runoff during different periods. The specific objectives of this study include:
- (1)
- Examining the effects of coal mining and soil-water conservation projects on runoff of the upper Fenhe River Basin, China, using hydrological modelling (Soil and Water Assessment Tool, SWAT) and a data-driven method (double mass curve, DMC);
- (2)
- Quantifying the contributions of climate change, coal mining, and soil-water conservation to the runoff decrease; and
- (3)
- Identifying the advantages, disadvantages, and uncertainties of these two methods.
2. Data and Methods
2.1. Study Area
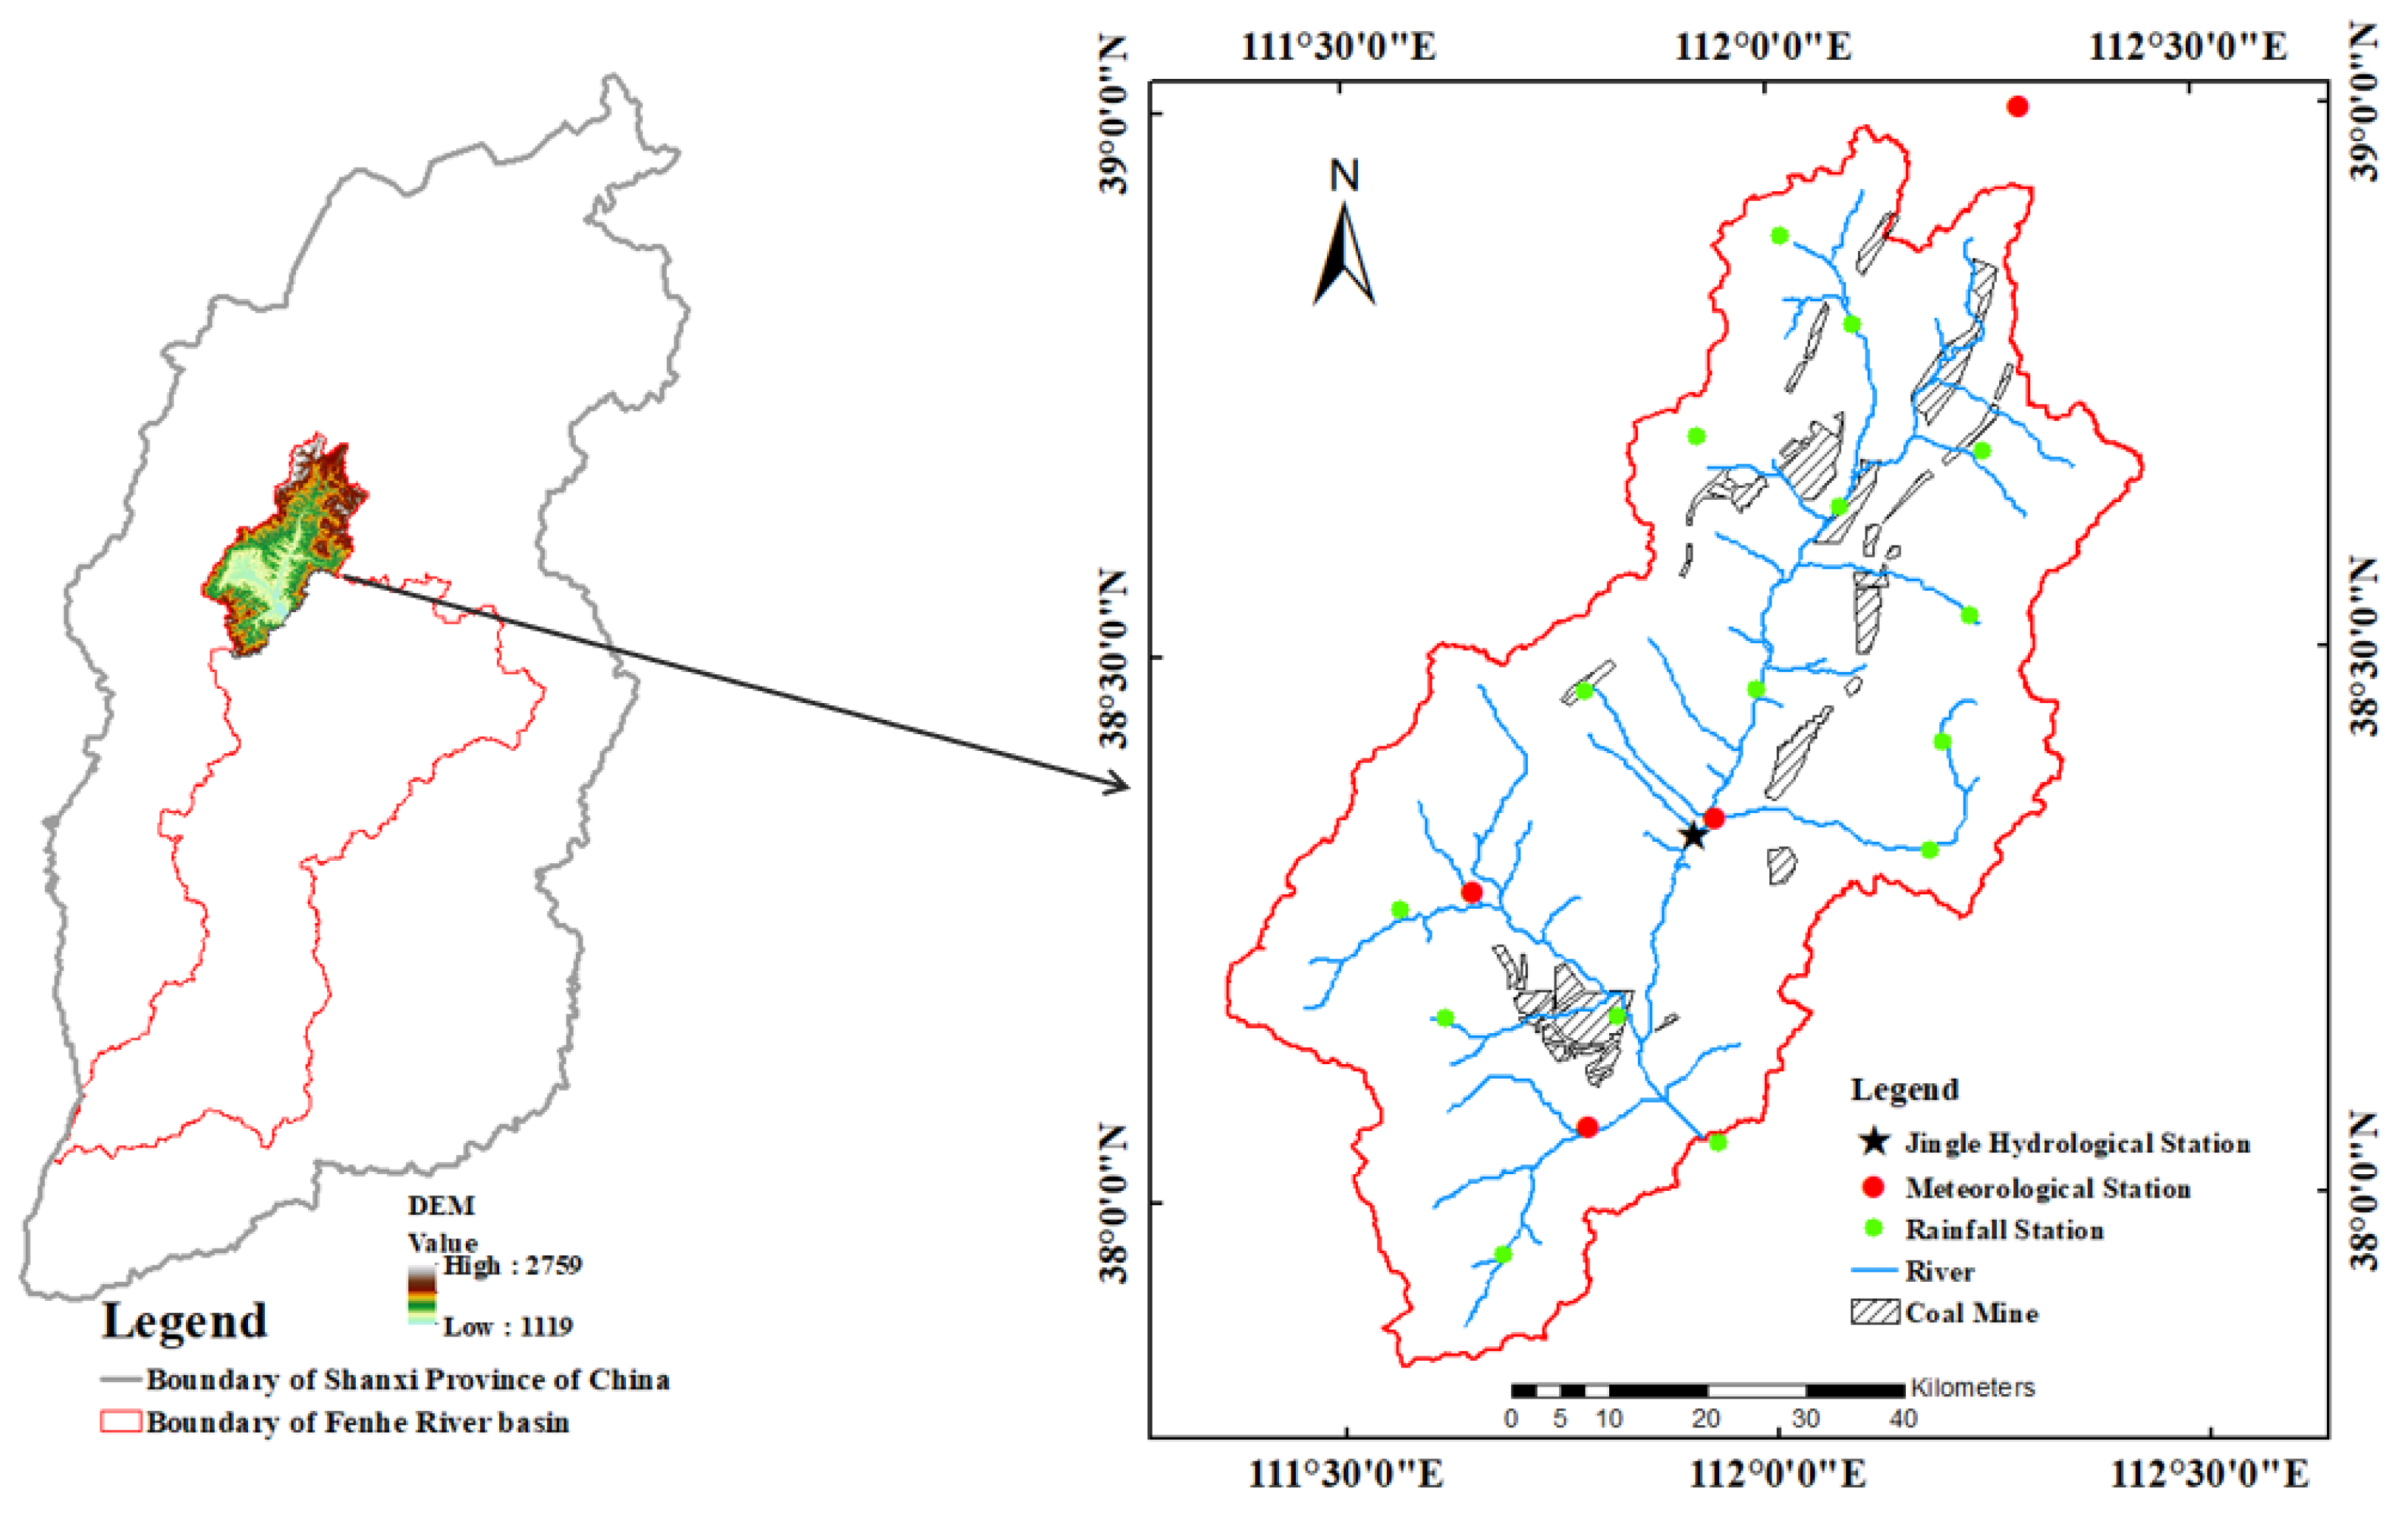
The Fenhe River, the largest river in Shanxi Province, is a first-level tributary and the second-largest tributary of the Yellow River. The basin monitored by the Jingle Hydrological Station in the upper Fenhe River was taken as the study area. The area is 2799 km2, and the elevation is 1100–2200 m. Figure 1 shows the location map of the study area. The basin, located in the semi-arid to semi-humid climate transition zone, has a temperate monsoon climate with four distinct seasons. From 1957 to 2017, the average annual rainfall in the basin was 519 mm, the annual average temperature was 7.19 °C, and the potential evapotranspiration was 865 mm. The rainfall is mainly concentrated from June to August, and most of the precipitation occurs as heavy rainfall, accounting for about 70% of the annual rainfall [16].
Coal mining and soil-water conservation measures are the most important human activities in the upper Fenhe River basin. The Ningwu Coal Field, located in the study area, is one of the six largest coal fields in Shanxi Province. From the 1960s to the present, 18 underground coal mines have been built in this area, with a total designed production capacity of 16 million t/year. Since 1988, the Shanxi Provincial Government has carried out large-scale soil-water conservation projects in the upper Fenhe River to reduce the sediment production and improve the natural ecology. The main measures included planting trees and grasses, returning farmland to forests and grasslands, building silt dams, and building terraces. Both types of human activities resulted in huge disturbances to the underlying surface of the study area.
2.2. Data
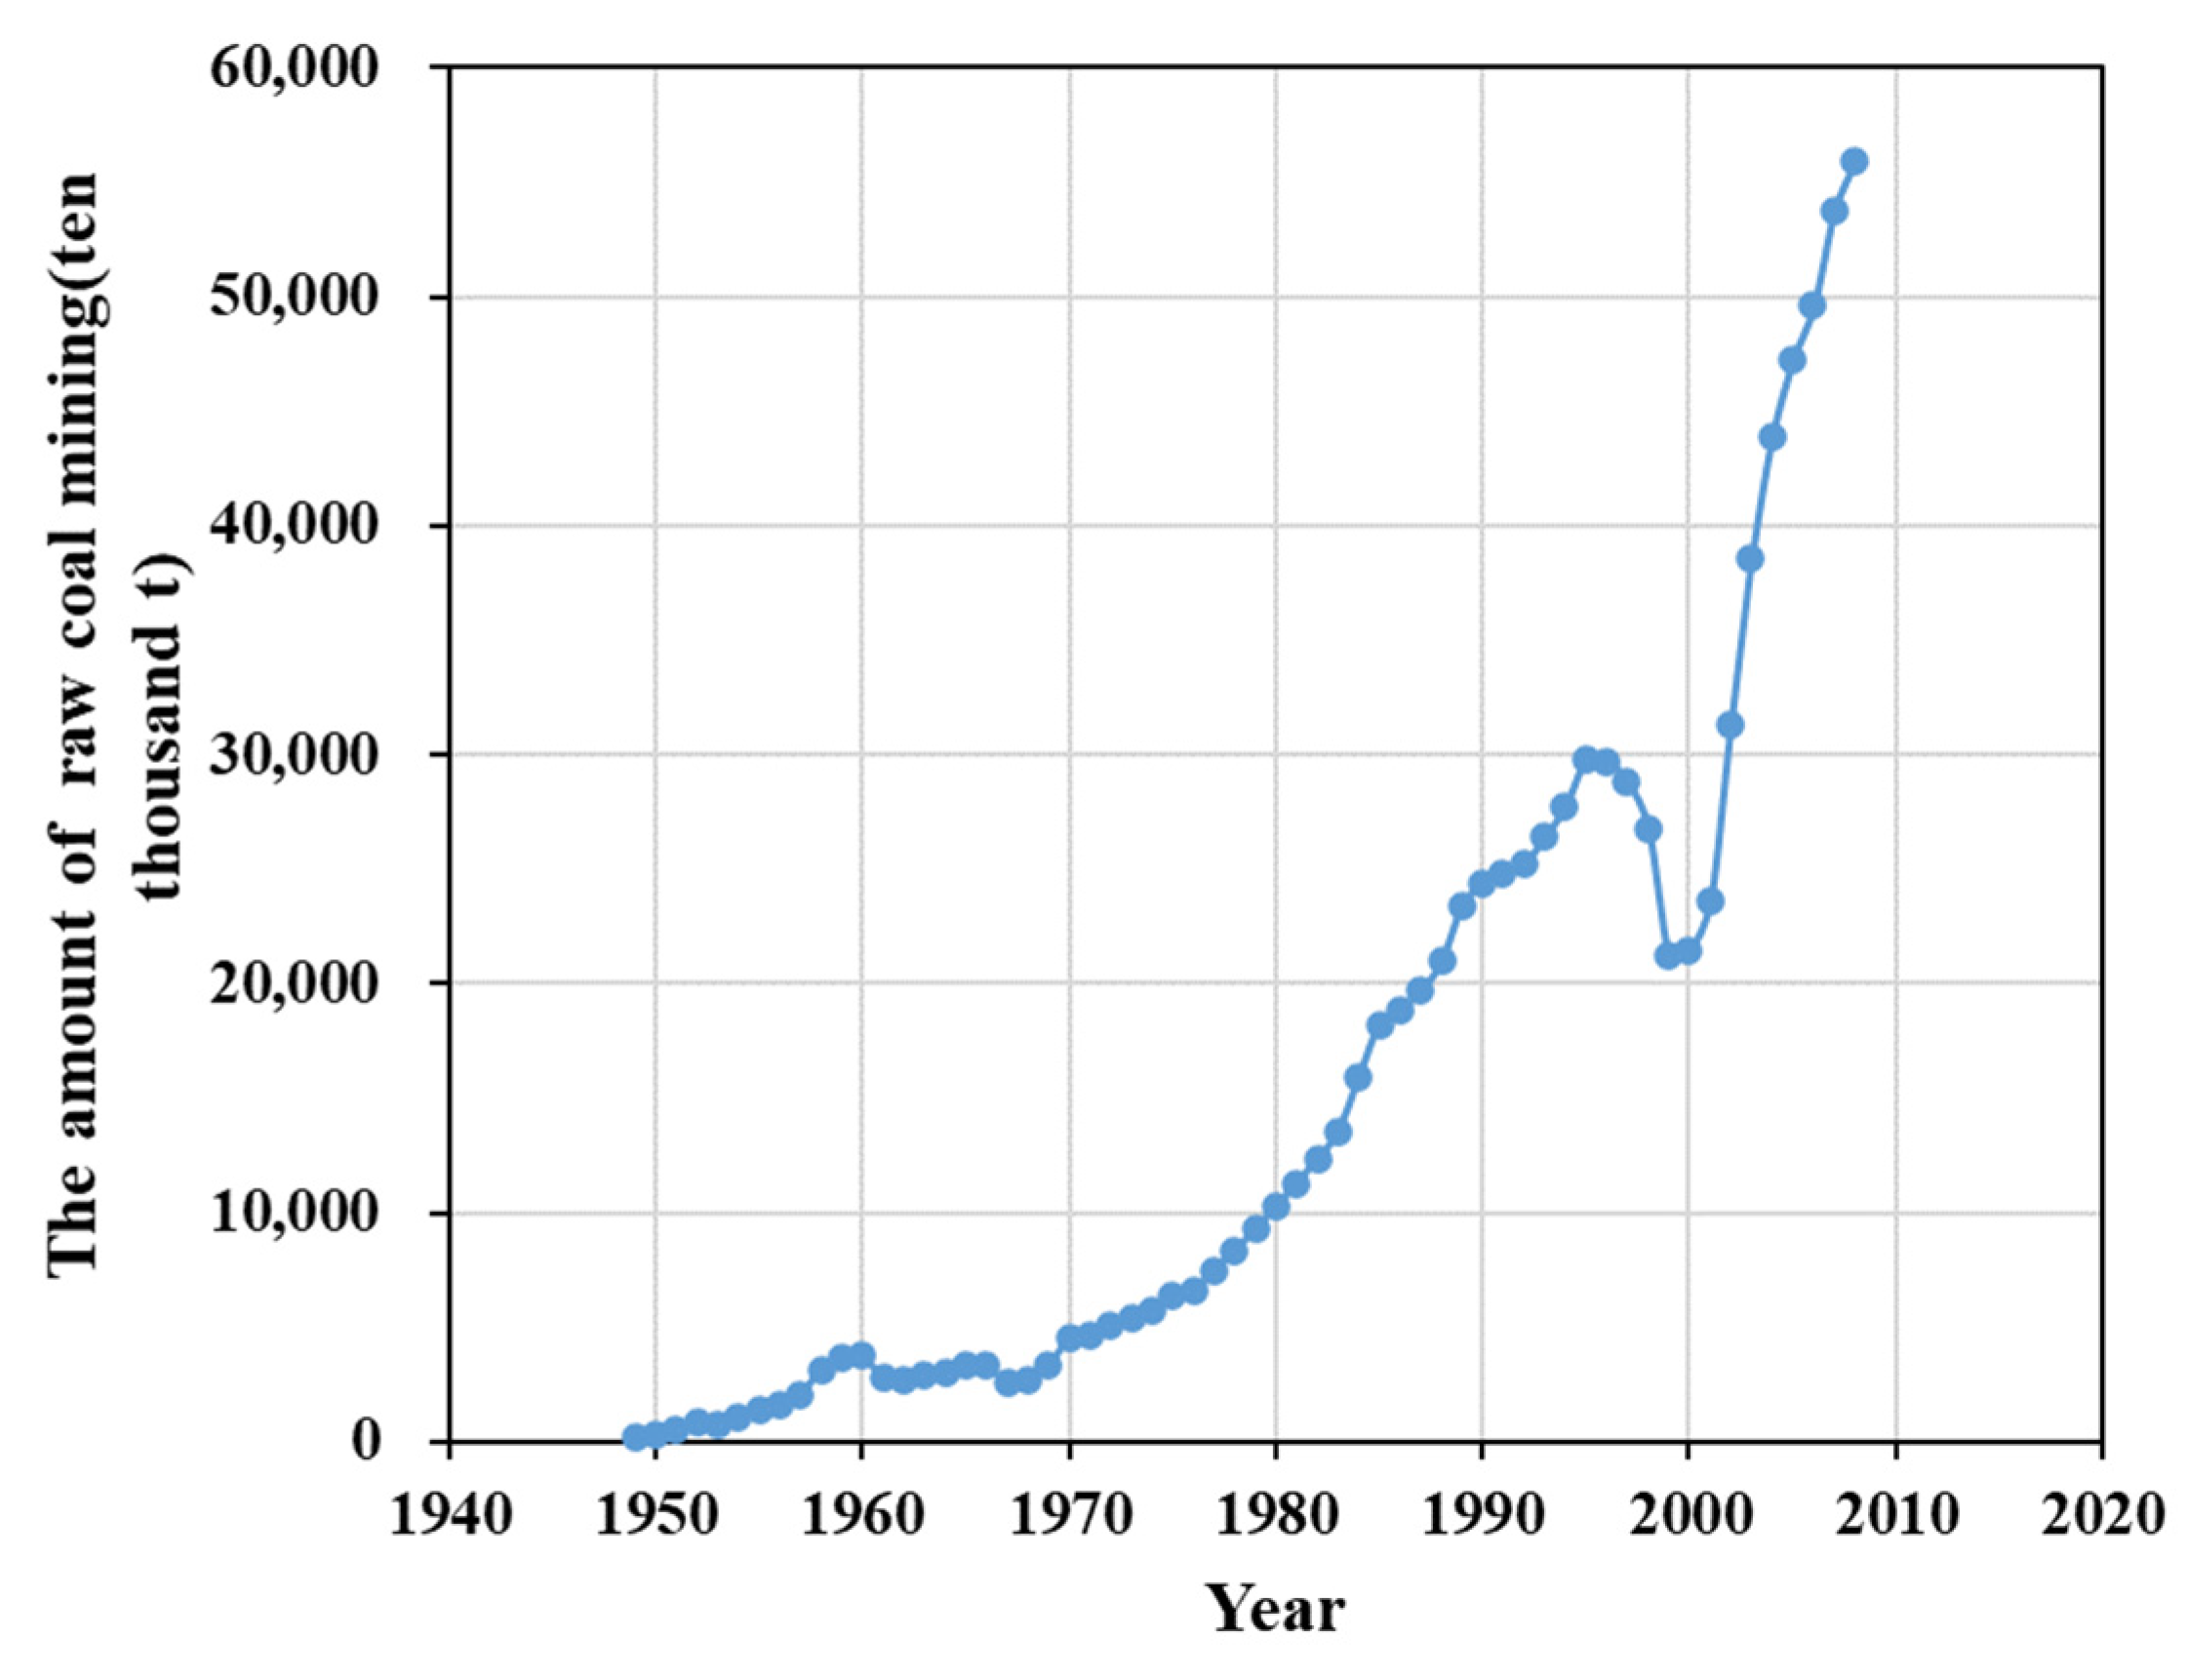
The data from four meteorological stations, including the highest temperature, lowest temperature, wind speed, and humidity, were obtained from the National Climate Center of China. A digital elevation model (DEM), with a resolution of 90 m, was obtained from the geospatial data cloud platform of the Chinese Academy of Sciences. The land use/land cover data, with a resolution of 1000 m, was obtained from the Resource and Environmental Science Data Center of the Chinese Academy of Sciences. The soil data was obtained from the Harmonized World Soil Database (HWSD). The daily water flow data for the Jingle Hydrological Station and the daily rainfall data from 15 rainfall stations for 61 years from 1952 to 2017 were both obtained from the Shanxi Hydrological Bureau. According to the coal mining history and the intensity of the soil-water conservation measures in the study area, the period from 1957 to 2017 was divided into four periods (as outlined in Table 1). As a result of the rapid development of China’s economy, the amount of raw coal mined in Shanxi Province rapidly increased during 1949–2008 (Figure 2). The average annual amount of coal mined during affected period 2 (1988–1994) was 2.7 times that mined during affected period 1 (1967–1987). The average annual amount of coal mined in affected period 3 (1995–2008) was 3.9 times that mined during affected period 1 (1967–1987).
2.3. Methods
2.3.1. SWAT Modelling
The SWAT 2012 version was used in this study. The model is a mature distributed hydrological model. It has a strong physical mechanism and has been widely used throughout the world [17,18]. The hydrologic cycle as simulated by SWAT is based on the water balance equation:
where is the final soil-water content (mm H2O), is the initial soil-water content on day i (mm H2O), t is the time (days), is the amount of precipitation on day i (mm H2O), is the amount of surface runoff on day i (mm H2O), is the amount of evapotranspiration on day i (mm H2O), is the amount of water entering the vadose zone from the soil profile on day i (mm H2O), and is the amount of return flow on day i (mm H2O).
The model was calibrated and verified using the data for the base period (1957–1966). The natural runoff processes during the affected periods were reconstructed using the calibrated SWAT model. The hydrological unit division, underlying surface data, and model parameters were kept unchanged, and only the input meteorological data were changed.
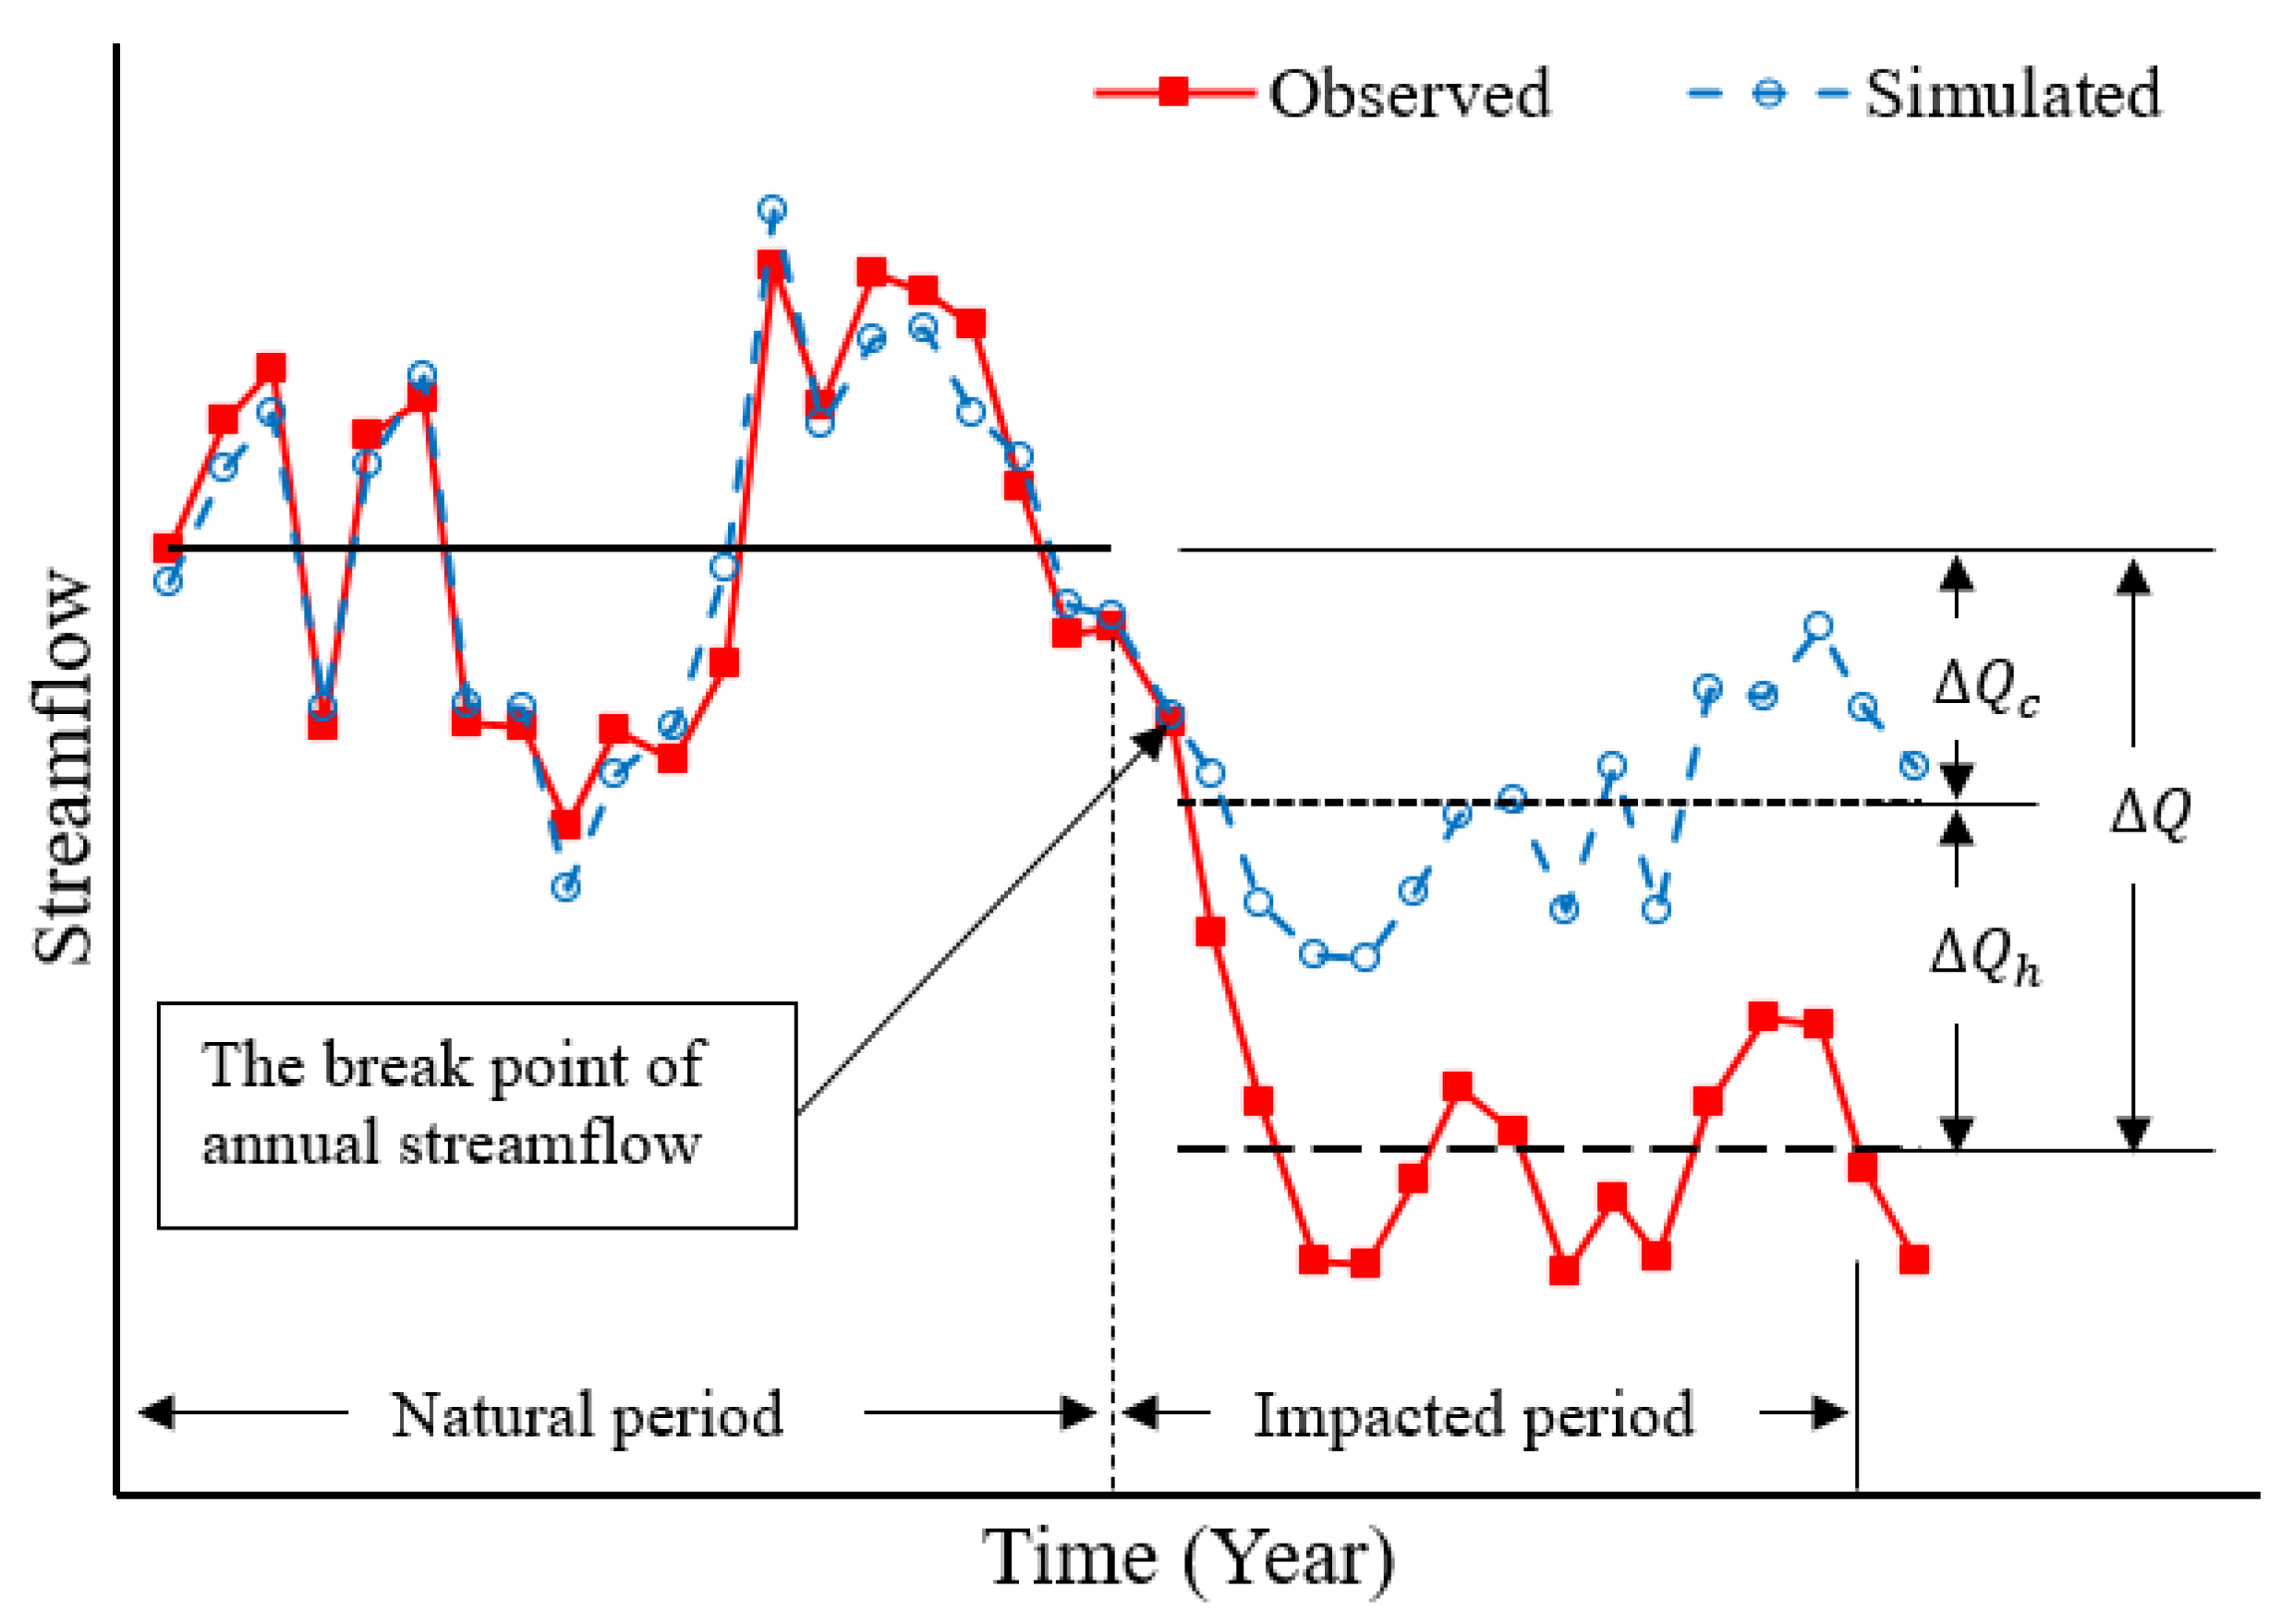
Figure 3 presents the framework of the quantitative evaluation of the runoff decrease based on the model simulation. The measured annual average runoff during the base period is , and that in the change period is . Thus, the total change in the runoff during the change period relative to the base period is , and the calculation formula is as follows:
consists of two parts: is the runoff change caused by climate change, and is the runoff change caused by human activities. and are the contribution rates of climate change and human activities to the runoff change, respectively. The calculation formula is as follows:
The blue line in Figure 3 is the reconstructed runoff process in the natural state. and are the average annual runoff of the simulated value in the base period and the affected period, respectively. The runoff change caused by climate change during the change period relative to the base period can be calculated using the following formula:
2.3.2. Double Mass Curve
The double mass curve (DMC) is a simple and intuitive method of hydrological analysis, and is often used for attribution analysis of runoff change. This method generally consists of three steps [10]:
- Step 1: Establishing the DMC
The cumulative amounts of the rainfall and runoff ( and , respectively) are calculated and a scatter plot of is drawn, with as the abscissa and as the ordinate.
- Step 2: Reconstructing the natural runoff process
Based on the DMC curve, the unitary linear regression Equation (6) of in the reference period and the change period are obtained. The natural relationship between during the change period is simulated using the unitary linear regression equations for the reference period. Finally, the simulated annual runoff under natural conditions is calculated using Equation (7).
- Step 3: Separating the contributions of climate change and human activities to the change in runoff
According to the change in the runoff during the change period relative to the base period, the contributions of climate change and human activities to change in the runoff are calculated using the method described in Table 2. The decrease in runoff caused by climate change is , the decrease in runoff reduction caused by human activities is , and ∆R is the total change.
3. Results
3.1. Constructing the SWAT Model
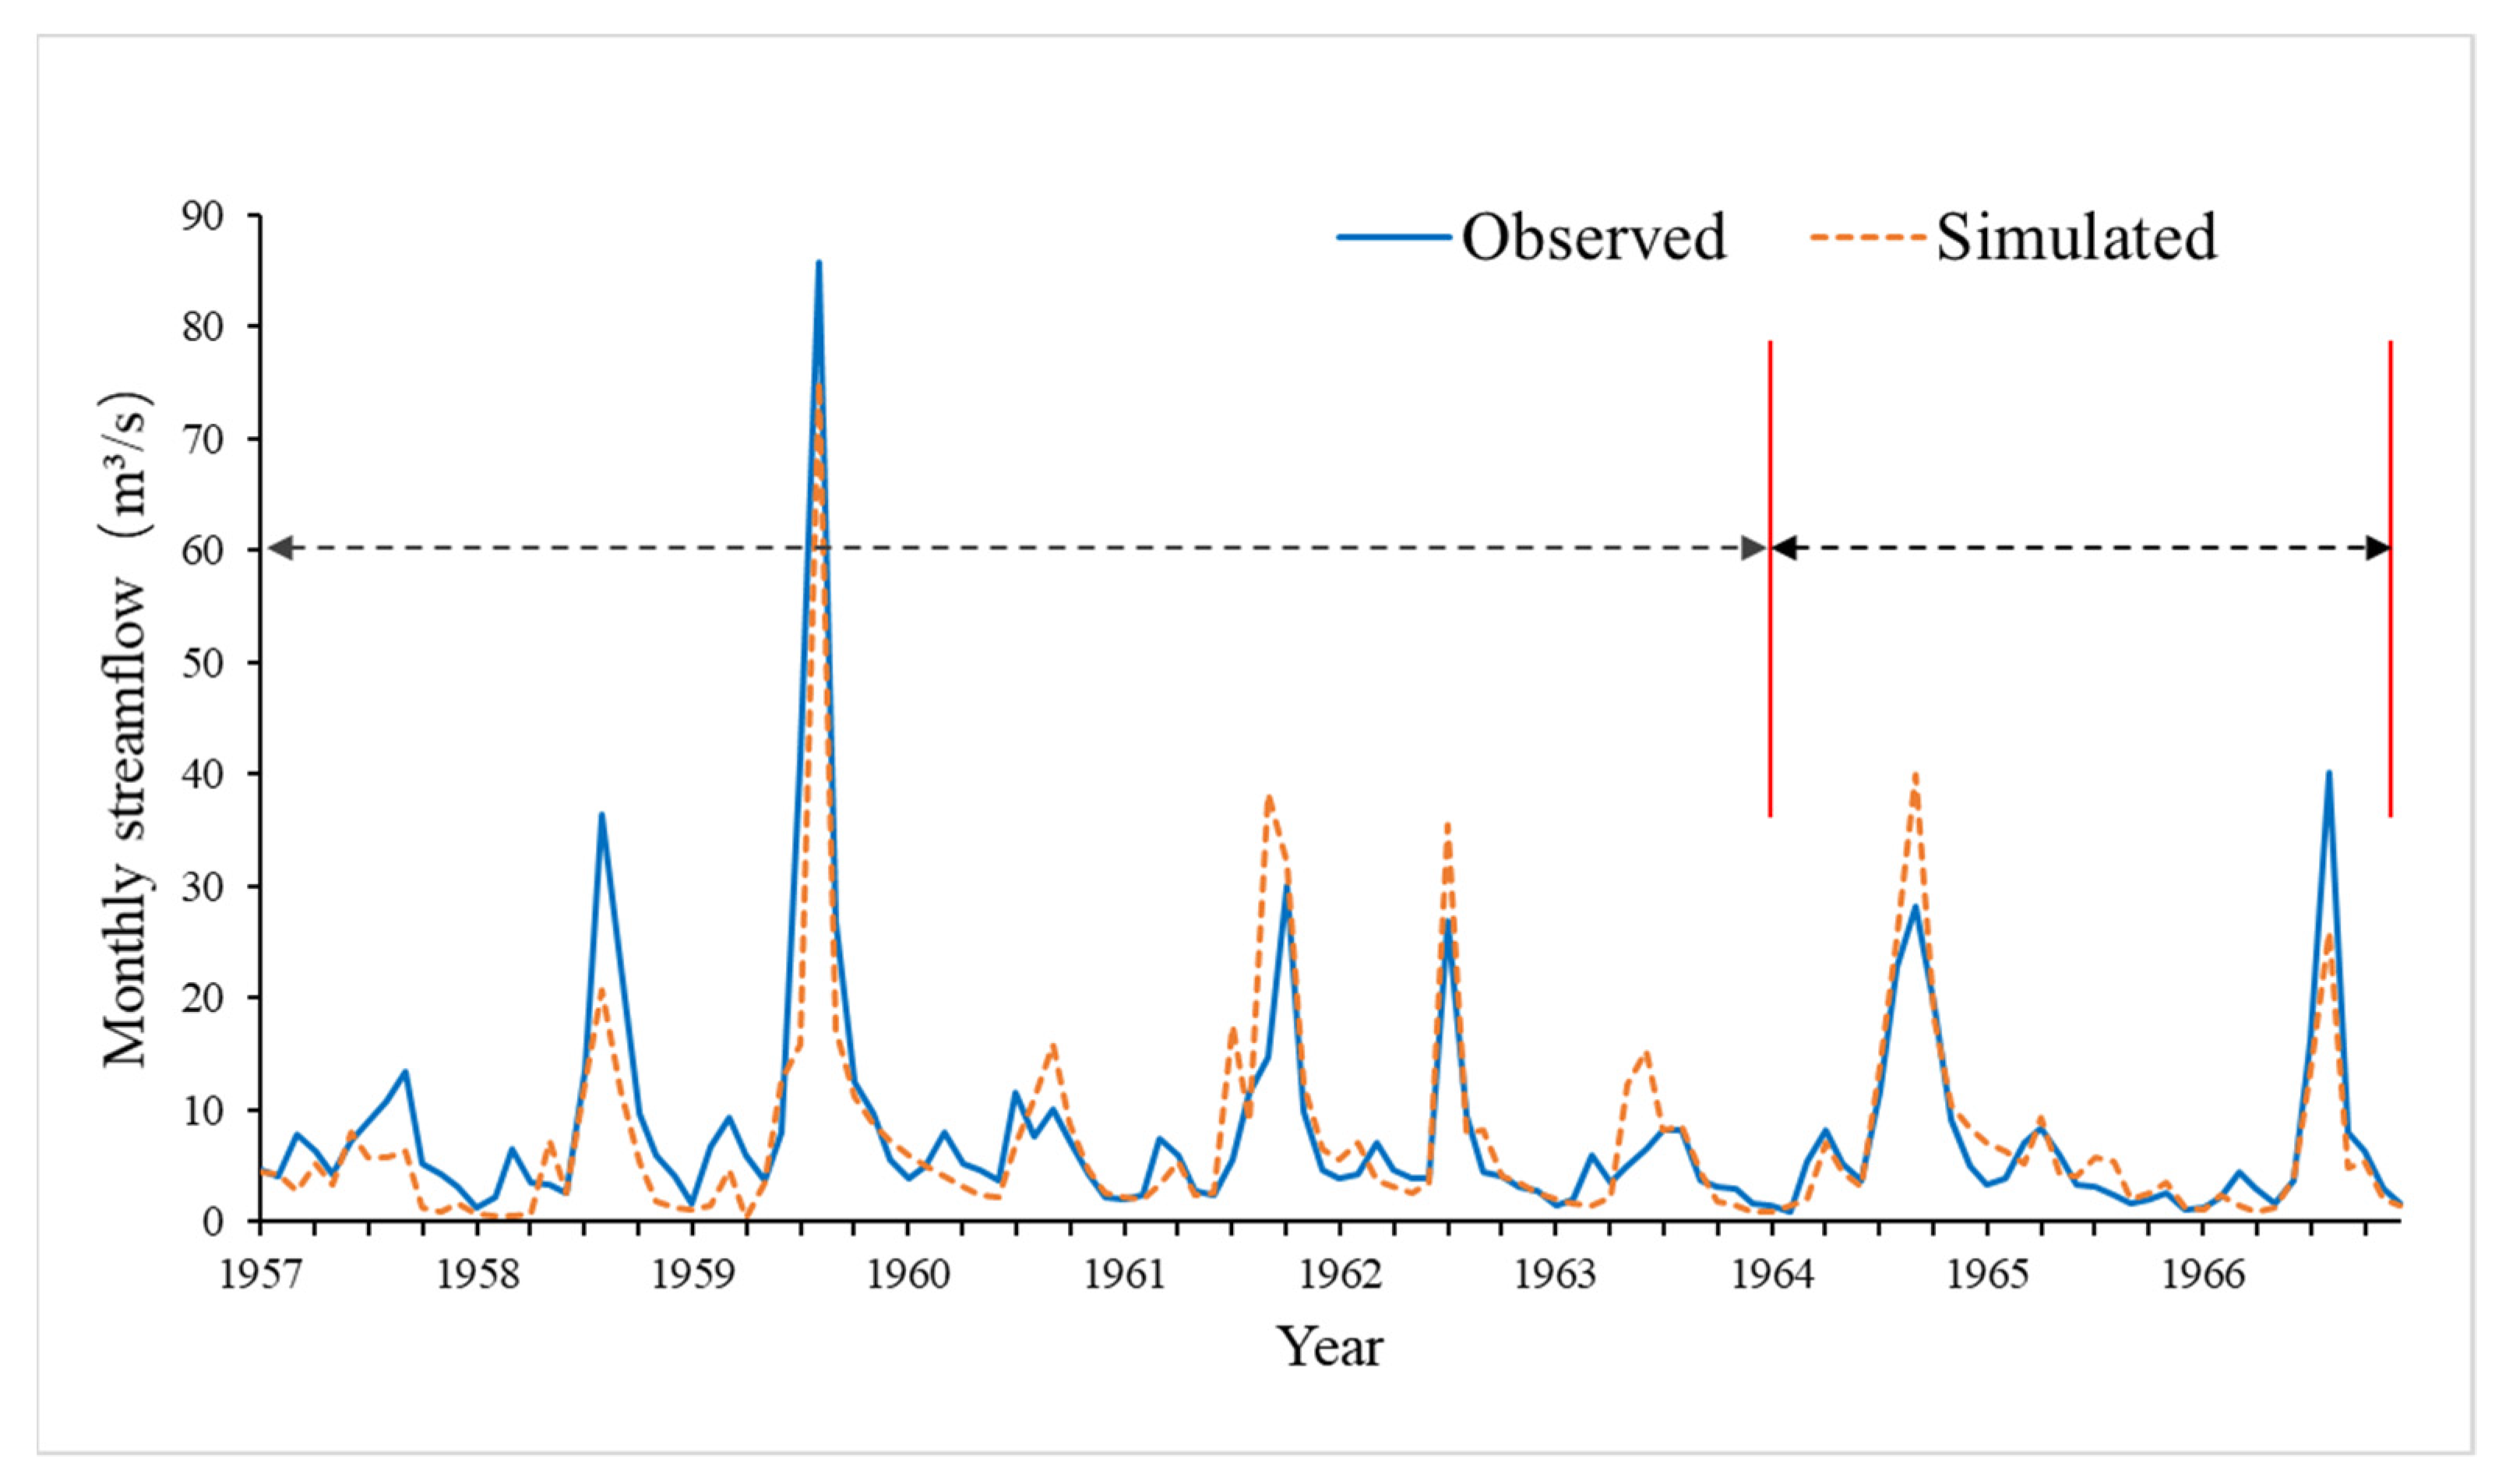
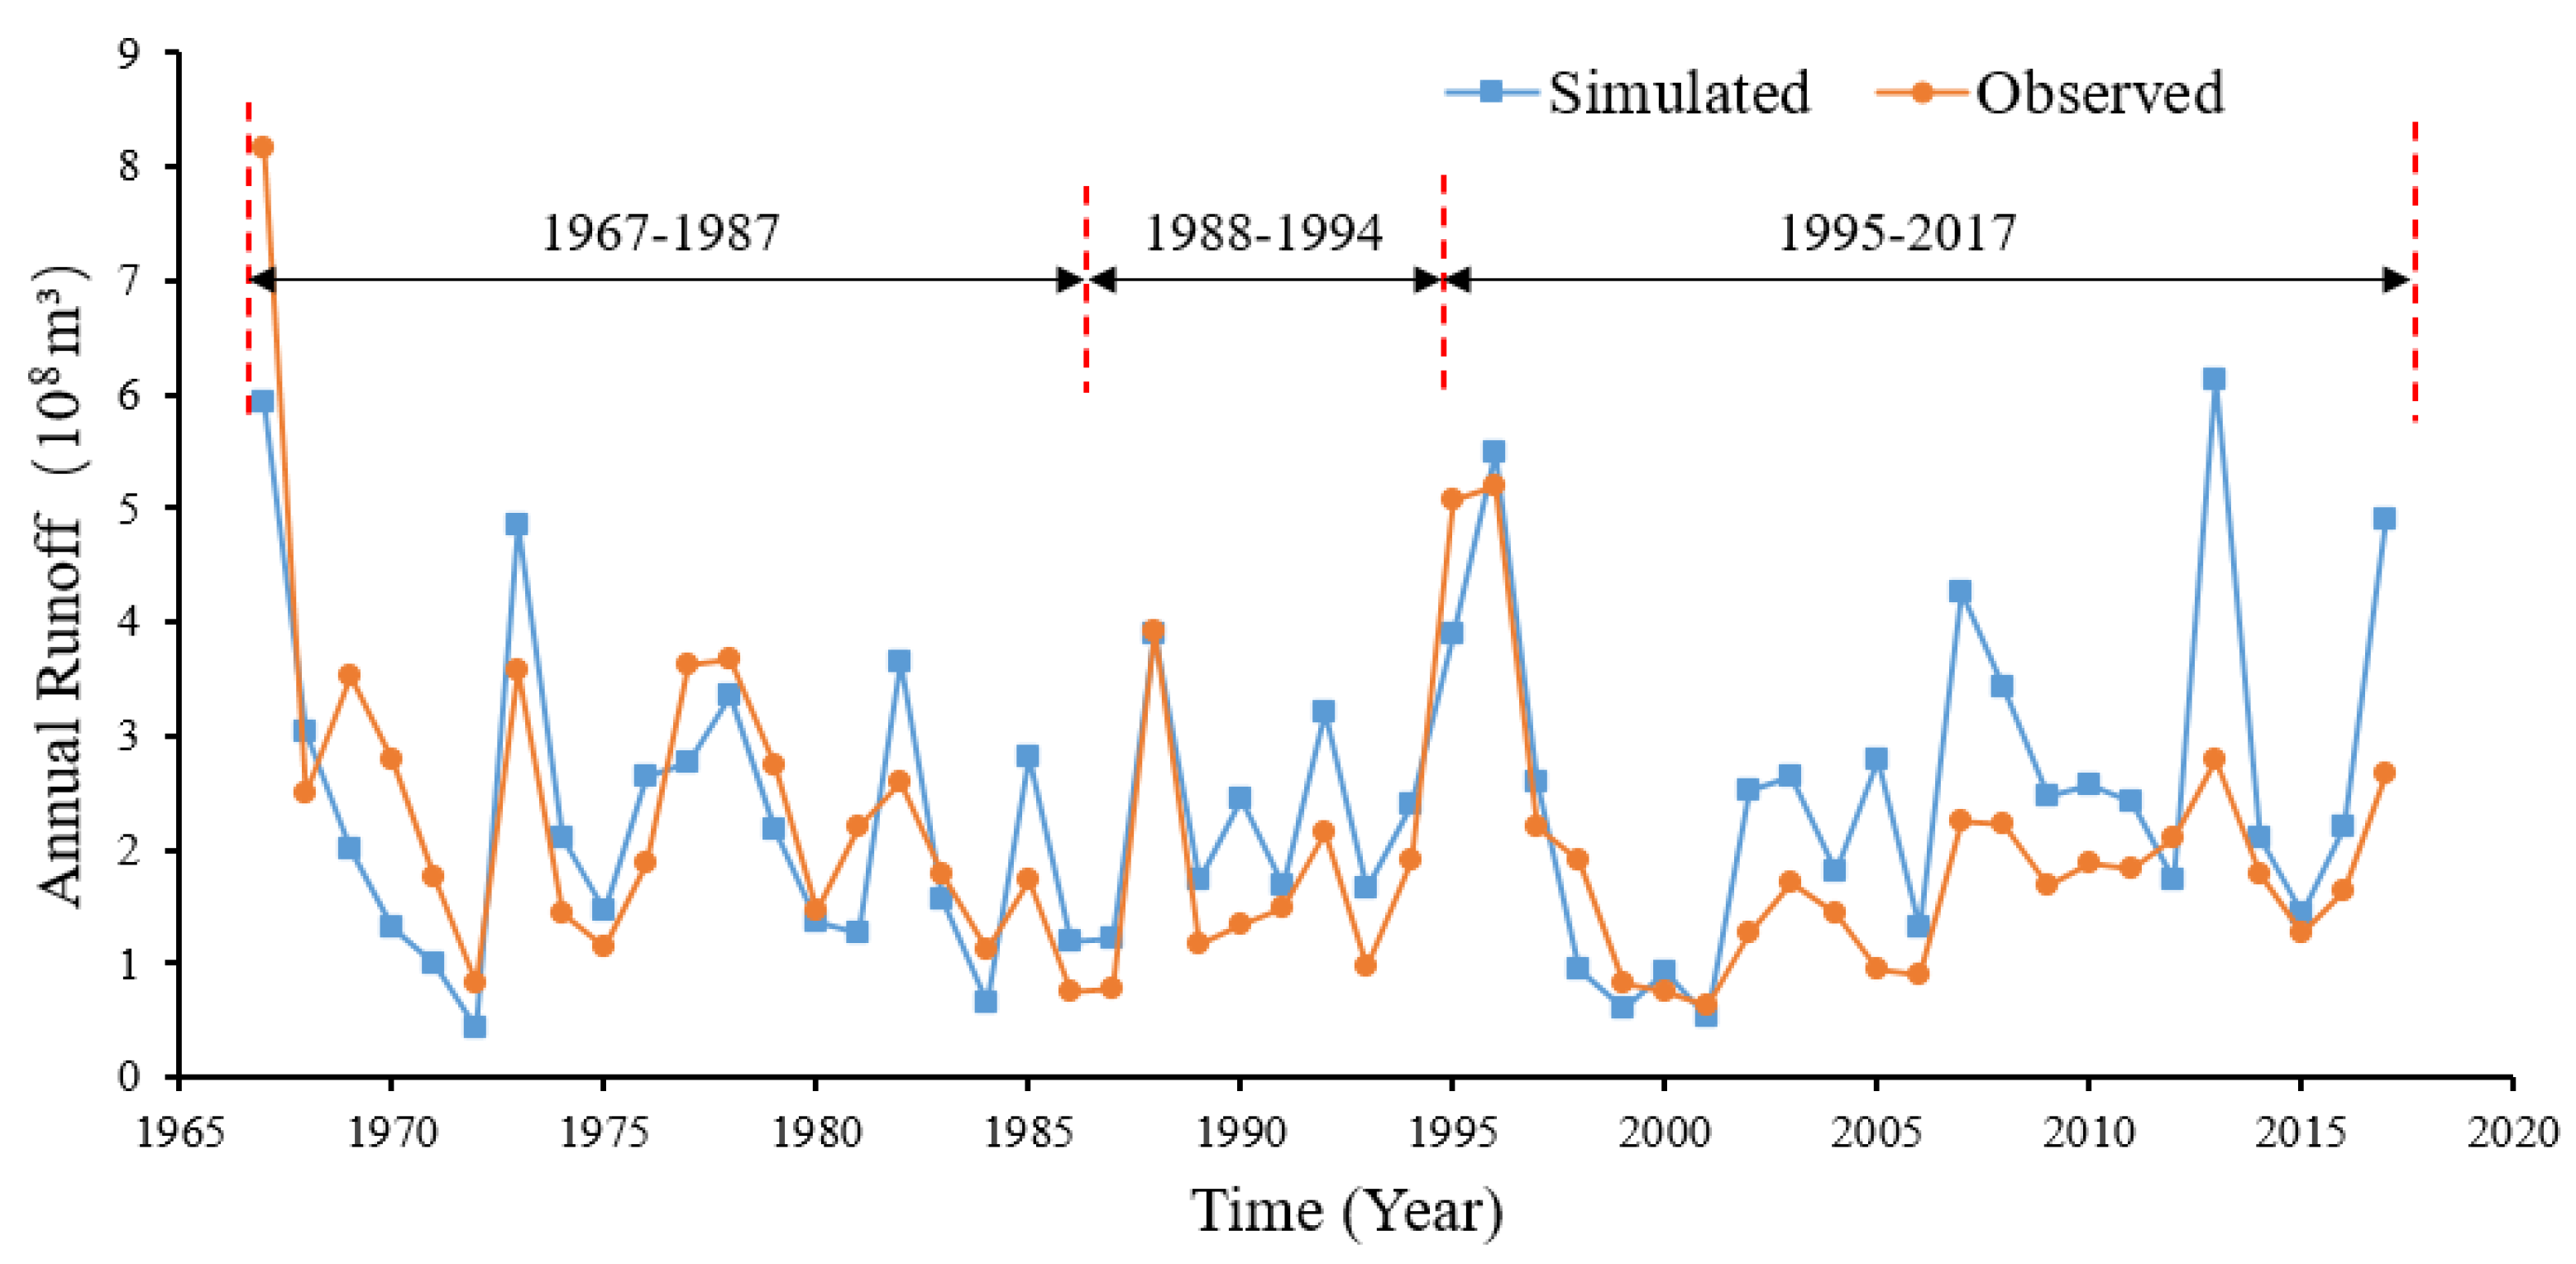
Based on the SWAT model, the digital river network was extracted, the terrain parameters were calculated, the land use/land cover and soil parameters were input into the model, and finally, the study area was divided into 59 sub-basins and 311 hydrological response units (HRUs). Using the measured monthly runoff data from the Jingle Hydrological Station as the objective function, the model was calibrated and verified during the base period (1957–1966). The Nash–Sutcliffe efficiency coefficient (NSE), percent bias (PBIAS), and ratio of the root mean square error to the standard deviation of measured data (RSR) were selected to evaluate the accuracy of the model simulation. According to simulation accuracy guidelines proposed by Moriasi et al. [19], model simulation can be judged as satisfactory if NSE > 0.50 and RSR ≤ 0.70, and if PBIAS ± 25% for streamflow. Table 3 summarizes the performance of the SWAT model, which shows the model has sufficient accuracy for long-term simulation of streamflow. Figure 4 shows the hydrographs of the observed streamflow and the simulated streamflow from the SWAT modelling. The natural runoff process was reconstructed during the three affected periods (1967–2017) by holding the calibrated model parameters constant and inputting the measured meteorological data during 1967 to 2017. Figure 5 shows most of the simulated values are greater than the measured values in the affected periods.
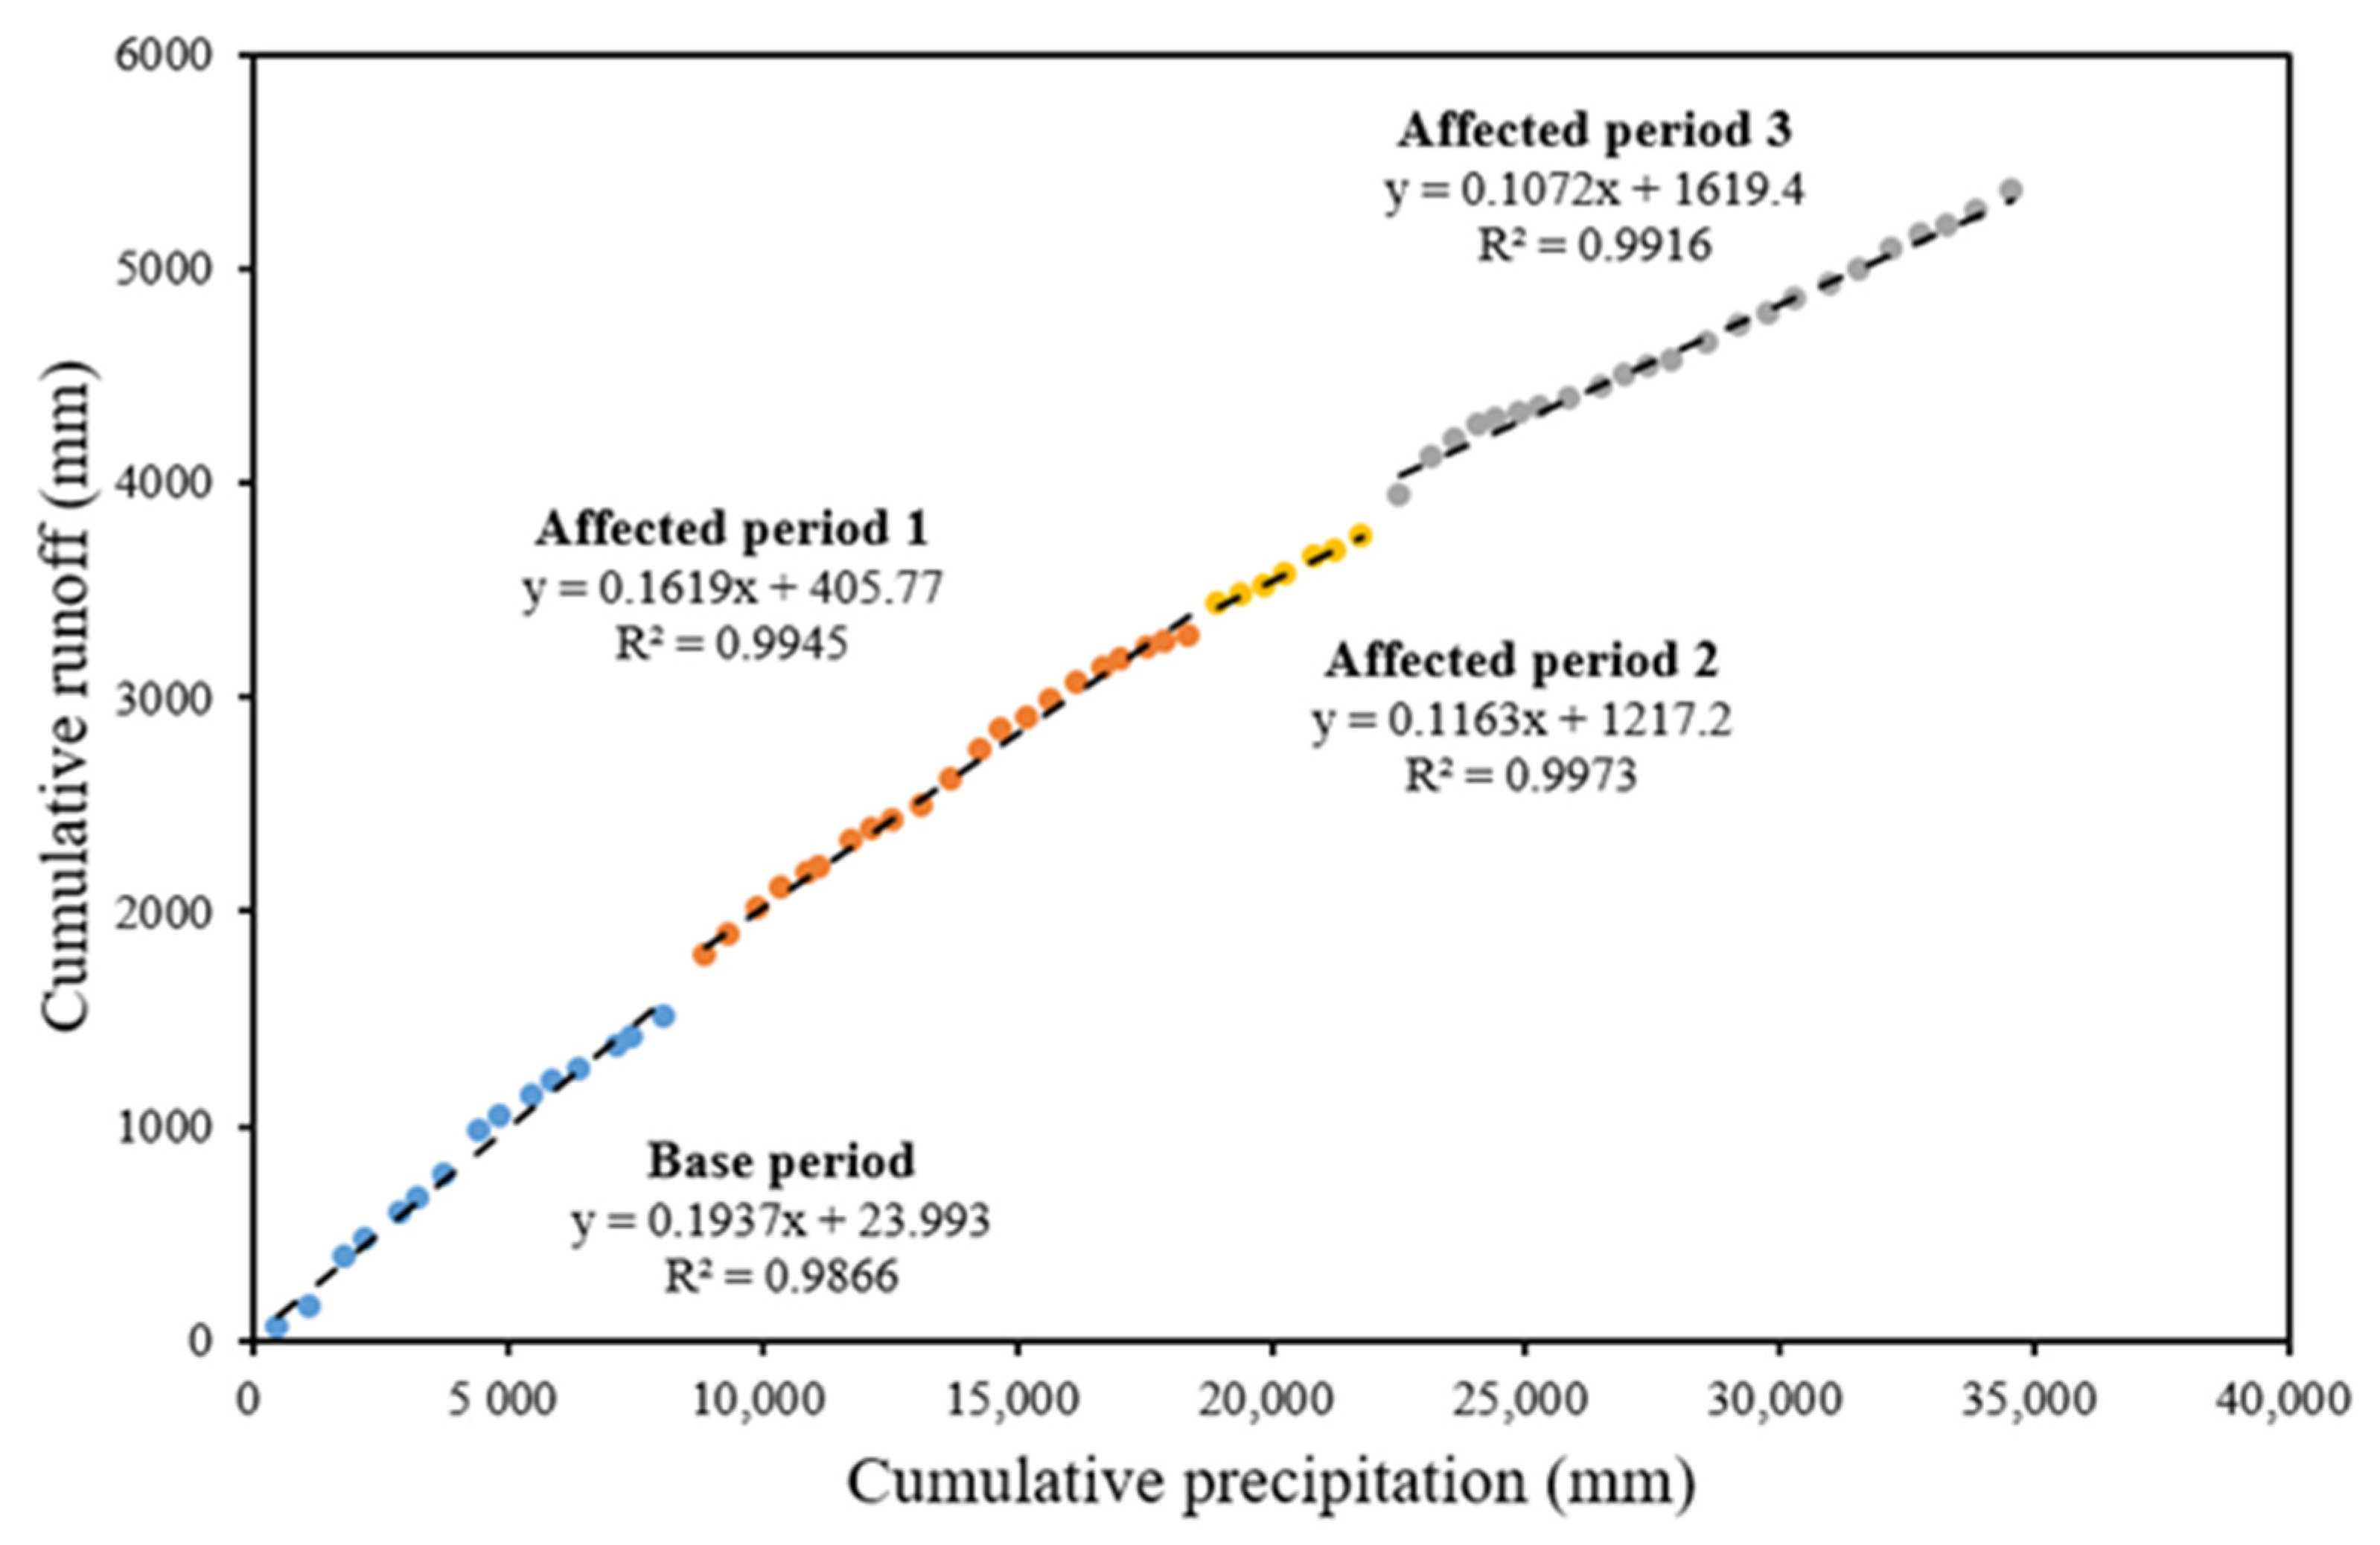
3.2. Constructing the DMC
The double mass curve of the accumulated rainfall and the accumulated runoff depth () was constructed for 1952–2017 (Figure 6). If the human activities’ impact on the runoff is constant or negligible, the plot of these two cumulative variables (precipitation and runoff) is a straight line. A significant change in the slope of the DMC indicates changes due to the contributions of the human activities. The one-variable linear regression equations of the DMCs for the four different periods were calculated. The slope of the linear relationship between the cumulative runoff and the cumulative precipitation was 0.1937 in the base period, 0.1619 in the first affected period (1967–1987), 0.1163 in the second affected period (1988–1994), and 0.1072 in the third affected period (1995–2017). The slopes of the four different periods exhibit a decreasing trend, indicating that the interferences of the coal mining and soil-water conservation measures on the runoff increased.
3.3. Response of Runoff to Coal Mining and Soil-Water Conservation
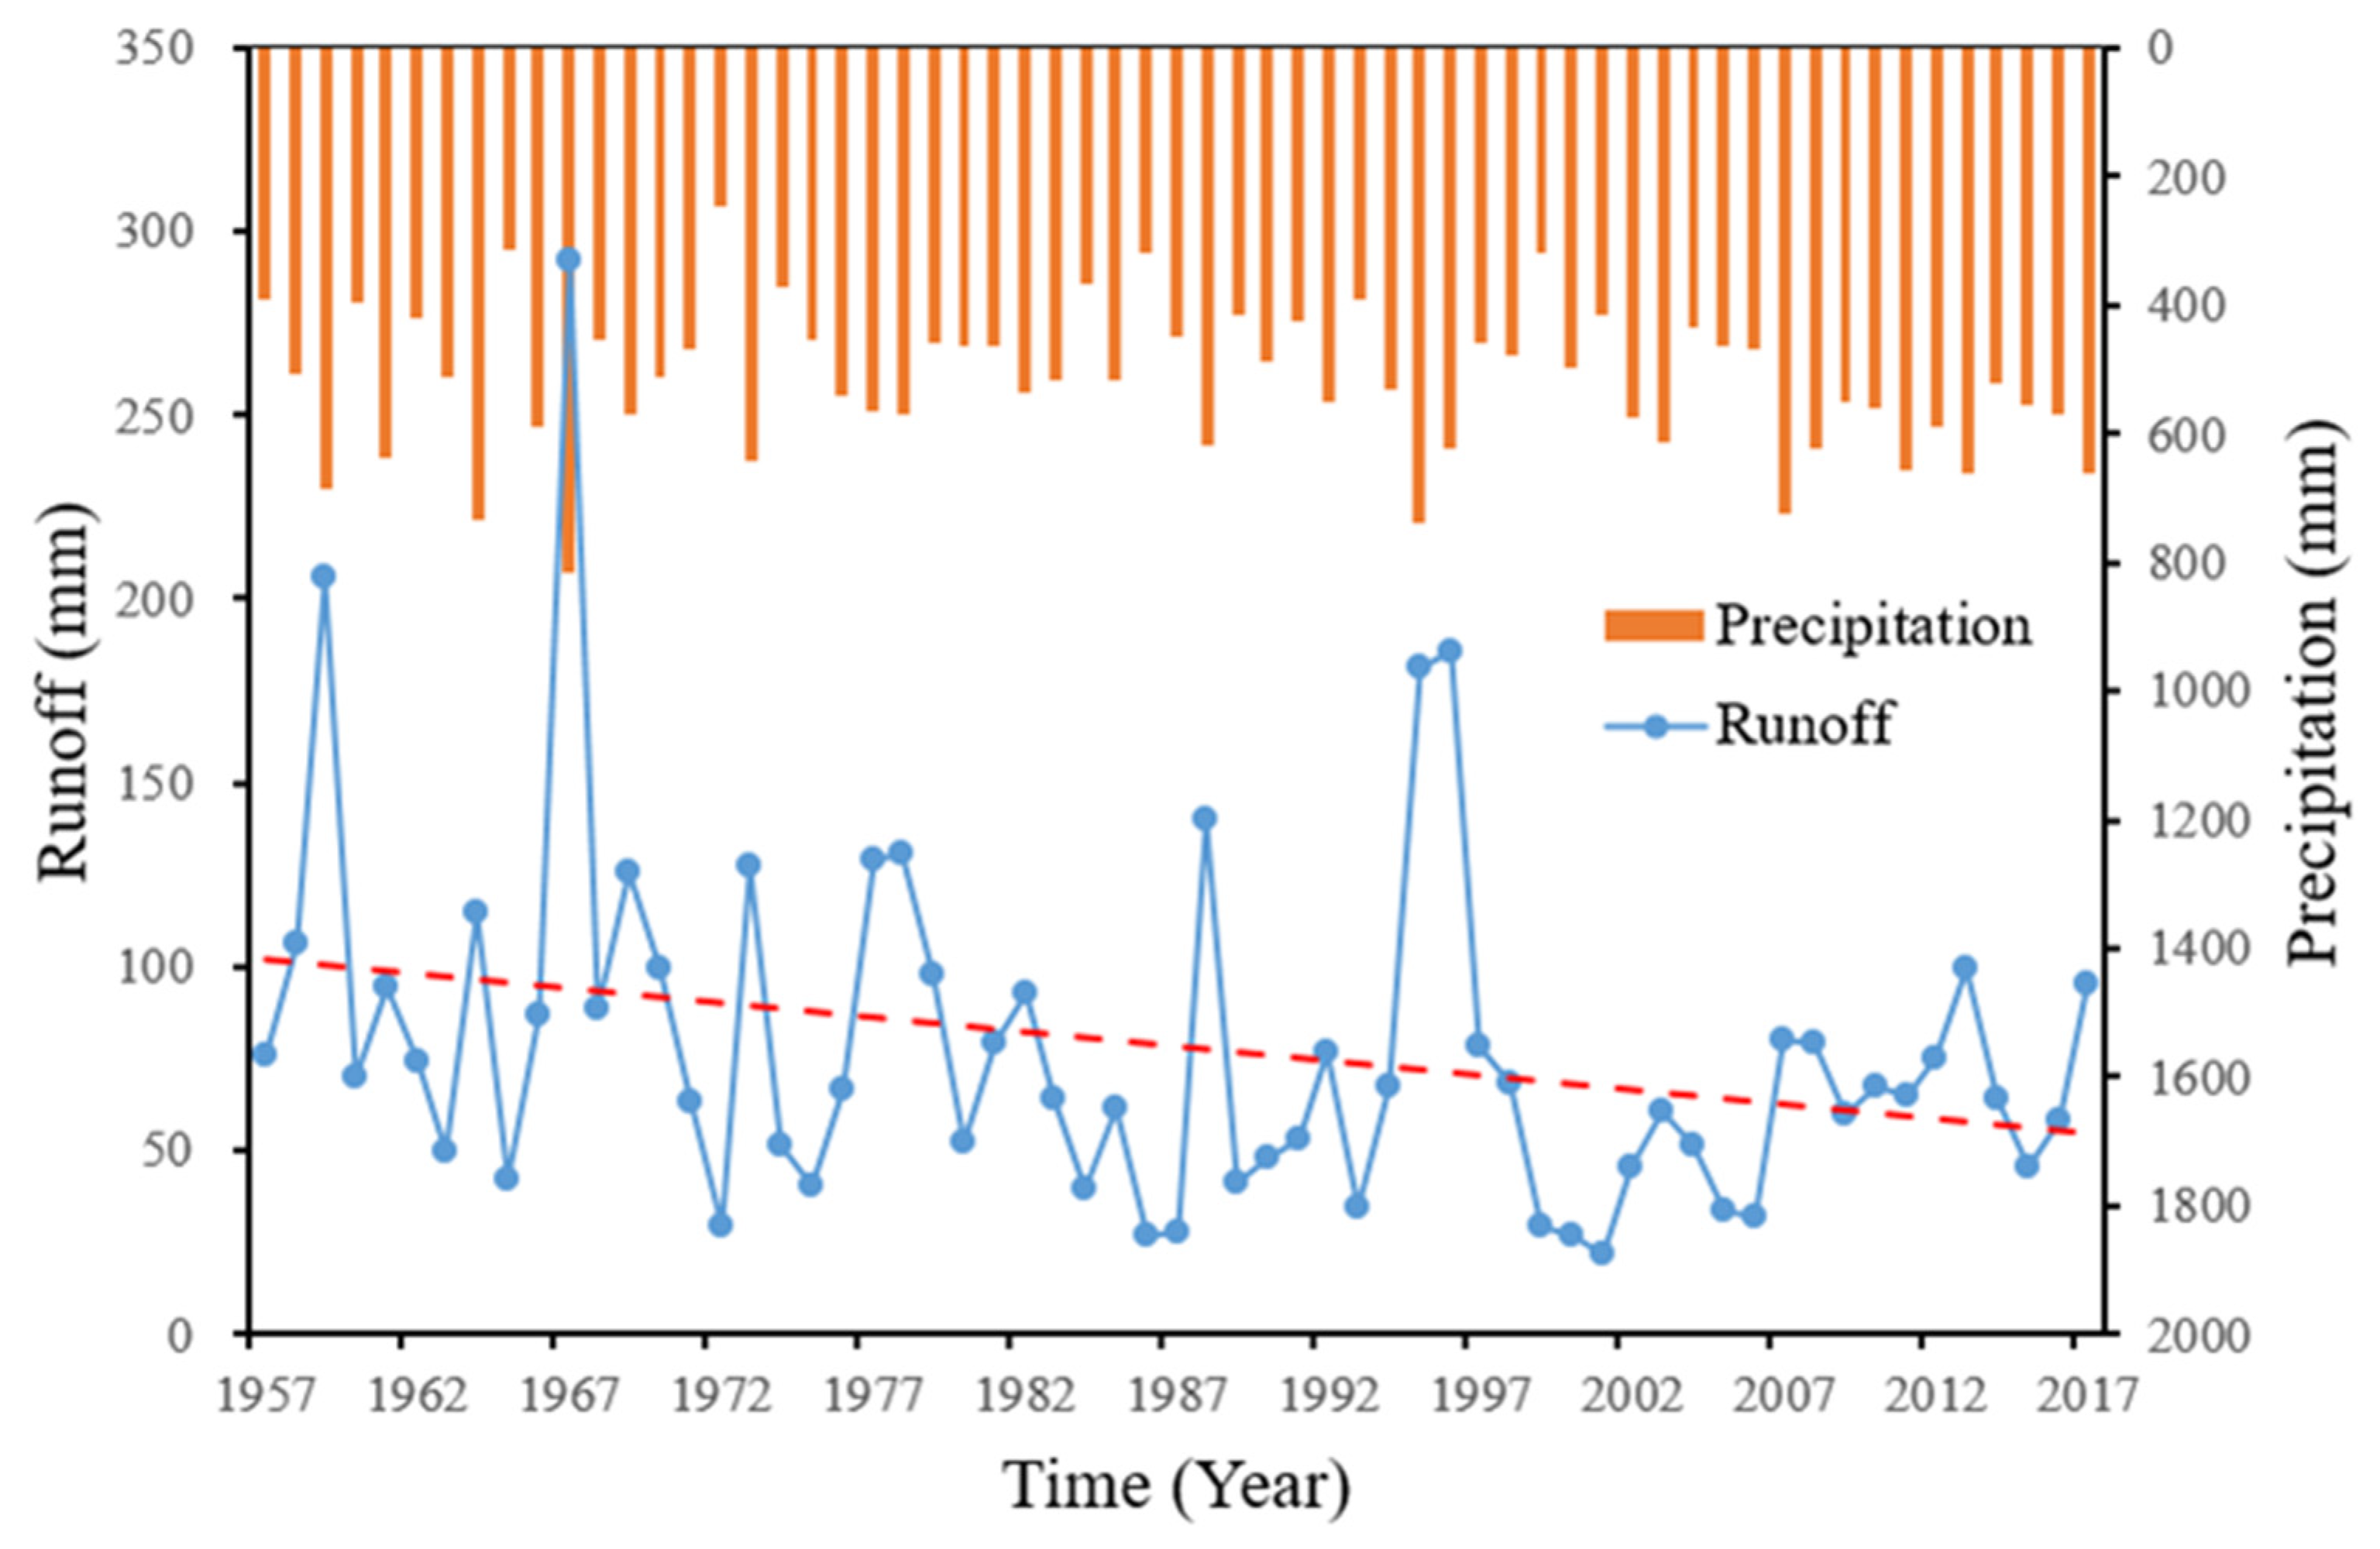
The Manner–Kendall [20,21] trend detection of the runoff depth at the Jingle Hydrological Station from 1957 to 2017 was conducted, and the Z statistic value was −2.02, indicating that the runoff depth significantly decreased over the 61-year period at the 5% significance level. The changes in the rainfall and runoff are shown in Figure 7. Compared with the base period, the average annual runoff depth of three affected periods respectively decreased by 6.8 mm (−7.5%), 25.8 mm (−28.2%), and 22.1 mm (−24.1%). The average annual precipitation decreased by 28.5 mm (−5.5%) during affected period 1, decreased by 20.8 mm (−4%) during affected period 2, and increased by 35.9 mm (+6.9%) during affected period 3 (see Table 4).
According to the two methods introduced in Section 2.3, the contribution rates of the coal mining, soil-water conservation, and climate change to the reduction in runoff were calculated. The results are listed in Table 5.
During affected period 1, the development of China’s economy was slow, and there was only a small amount of coal mining in the study area. In addition, soil-water conservation projects had not yet been implemented. The main reason for the decrease in runoff during affected period 1 was climate change. The contribution rates of climate change to the runoff reduction during this period were calculated to be 72.5% and 80.4% using the SWAT simulation and DMC methods, respectively.
During affected period 2, the development of China’s economy accelerated, the demand for coal expanded, the amount of coal mining in the study area increased, and the mined-out area continued to expand. In addition, during this period, the government began to implement soil-water conservation projects in a planned manner. These two types of human disturbances composed the main contributions to the decrease in runoff during this period. The contribution rates of the human activities to the decrease in runoff were calculated to be 97.8% and 77.0% using the SWAT simulation and DMC methods, respectively.
During affected period 3, China’s economy was in a stage of rapid development, the demand for coal increased rapidly, and the mined-out area in the study area expanded further. In addition, more soil-water conservation projects were implemented each year according to the plan, and the area of implementation continued to expand. Although the average annual rainfall during this period increased by 35.9 mm compared with the base period, the average annual runoff still decreased by 24.1%. The contribution rates of the human activities to the decrease in runoff were calculated to be 132.1% and 131.5% using the SWAT simulation and DMC methods, respectively. Comparing the three affected periods, it was found that the coal mining and soil-water conservation had increasingly stronger effects on the hydrological processes in the study area, and the resulting decrease in the runoff also became greater.
4. Discussion
4.1. Influence Mechanism of Coal Mining and Soil-Water Conservation on the Hydrological Processes
Coal mining and soil-water conservation had a continuous and significant impact on the hydrological processes and the river’s ecology [22]. The volume of coal mined in Shanxi Province in 2008 was 35 times that mined in 1956 and 10 times that mined in 1972. Due to decades of high-intensity coal mining, a large mined-out area formed in the Fenhe River Basin. The collapse of the overburden in the mined-out areas will increase the fissures in the strata. Some of these fissures will extend to the surface and cause ground subsidence. The fissures and ground subsidence have significantly disturbed the hydrological processes. Some of the runoff will leak directly into the ground through the fissures during the confluence on the slope. If cracks appear in the river, they will cause a large amount of runoff to leak directly into the ground. In addition, the fissures formed by coal mining subsidence cause the water in the upper aquifer to leak deeper into the ground, which eventually leads to a drop in the groundwater level. The drop in the groundwater level leads to a decline in the amount of groundwater replenishing the baseflow. The baseflow of the upper reaches of the Fen River exhibited a very significant downward trend from 1956 to 2016, and the average baseflow from 2000 to 2009 was only 1/8 that from 1956 to 1959 [23]. Lv et al. [24] determined that the baseflow loss caused by mining one ton of raw coal was 2.038 m3 in the Kuye River Basin of Shaanxi Province.
The soil-water conservation measures in the study area mainly include tree planting, afforestation, and construction of silt dams and terraces. These measures not only prevent soil erosion and reduce sedimentation, but also have a large impact on the hydrological processes in the basin. Afforestation has improved the ecology of the basin, leading to an increase in the vegetation coverage, which increases the actual evapotranspiration. The construction of silt dams and terraces increases the infiltration and evaporation losses. Based on the water balance, these measures reduced the runoff in the basin. From 1988 to 2005, a total of 601 km2 of soil and water conservation treatments was completed in the study area, accounting for 21% of the total area. Based on Moderate Resolution Imaging Spectroradiometer (MODIS) data, Di [25] analyzed the vegetation dynamics in the upper Fenhe River and found that the maximum normalized difference vegetation index (NDVI) increased from 2000 to 2010, with a growth rate of 7.8%/10 years, and the vegetation coverage significantly improved.
4.2. Uncertainty in Contribution Analysis
In addition to the direct impacts of climate change, the most important factors affecting the hydrological processes in the upper Fenhe River basin are mining activities and soil-water conservation. Two approaches, including the SWAT model and the DMC method, were applied to determine the relative contributions of climate change and human activities (coal mining and soil-water conservation measures) to the decrease in runoff. The relative contributions obtained using the two approaches were different, with a small difference in affected period 1 and a large difference in affected period 2. From the perspective of the relative contribution rates in the three affected periods, the results of the two methods were consistent: the impacts of coal mining and soil-water conservation on runoff increased from the first to the third affected period. The complex hydrological processes in the watershed are affected by many factors, such as meteorology, vegetation, soil conditions, and human activities. The methods have limitations and uncertainties. These resulted in a great uncertainty in separating the effects of climate change and human activities on hydrological processes. The hydrological model separates the contribution of climate variability to streamflow changes by varying the meteorological inputs for fixed model parameters based on reference period. The numerous physical parameters in the SWAT model and the accuracy of the input data will affect the accuracy of the simulation. The tendency of the model to underpredict flows in the calibration and verification periods may extend into the “affected periods” and may distort the determination of the relative contributions of climate change and anthropogenic activities. The DMC method only considers the impact of rainfall on the runoff and ignores the impacts of meteorological factors such as temperature, wind speed, and humidity. Quantitative uncertainty of attribution analysis will be further investigated in future studies.
5. Conclusions
Based on the coal mining history and the scale of the implementation of the soil-water conservation in the study area, the period from 1957 to 2017 was divided into four stages: a base period and three affected periods. The SWAT model and the DMC method were used to analyze the attribution of the runoff decrease in the three affected periods. The runoff in the upper Fenhe River significantly decreased from 1957 to 2017. In affected period 1 (1967–1987), the cause of the decrease in the runoff was mainly climate change. In affected period 2 (1988–1994) and affected period 3 (1995–2017), the cause of the decrease in the runoff was mainly human activities (coal mining and soil-water conservation measures). As the coal mining activities intensified and the scale of the soil-water conservation expanded, the interference of these two human activities on the runoff also increased. Due to the complexity of the hydrological processes and the limitations and uncertainties of the analysis methods, there were certain differences in the results obtained using the two methods. The results of this study provide technical support for the scientific management of the water resources in the basin. Reducing the uncertainty in the contribution analysis of the runoff change and separating the impacts of the two human activities (coal mining and soil-water conservation measures) on the runoff will be the focus of future research.
Author Contributions
Conceptualization, Y.W.; methodology, H.W.; software, B.L.; validation, Y.W. and H.W.; formal analysis, Y.W. and H.W.; investigation, B.L.; resources, W.X.; data curation, B.L.; writing—original draft preparation, B.L.; writing—review and editing, H.W. and W.X.; visualization, B.L.; supervision, W.X. All authors have read and agreed to the published version of the manuscript.
Funding
This research was funded by National Natural Science Foundation of China General Projects, grant number 51779271. The APC was funded by 51779271.
Data Availability Statement
Not applicable.
Conflicts of Interest
The authors declare no conflict of interest.
References
- Wen, L.; Liu, C.J.; Yu, C.R.; Zhou, J.; Zhang, S.F. Development of hydrological model considering the coal mined-out area underlying surface and its application in small basins of Shanxi Province. J. Glaciol. Geocryol. 2017, 39, 375–383. [Google Scholar]
- Feng, X.; Fu, B.; Piao, S.; Wang, S.; Ciais, P.; Zeng, Z.; Lü, X.F.B.F.S.W.Y.; Zeng, Y.; Li, Y.; Jiang, X.; et al. Revegetation in China’s Loess Plateau is approaching sustainable water resource limits. Nat. Clim. Chang. 2016, 6, 1019–1022. [Google Scholar] [CrossRef]
- Liang, W.; Bai, D.; Wang, F.Y.; Fu, B.J.; Yan, J.P.; Wang, S.; Yang, Y.T.; Long, D.; Feng, M.Q. Quantifying the impacts of climate change and ecological restoration on streamflow changes based on a Budyko hydrological model in China’s Loess Plateau. Water Resour. Res. 2015, 51, 6500–6519. [Google Scholar] [CrossRef]
- Liu, J.; Zhang, Q.; Singh, V.P.; Shi, P. Contribution of multiple climatic variables and human activities to streamflow changes across China. J. Hydrol. 2017, 545, 145–162. [Google Scholar] [CrossRef] [Green Version]
- Xu, X.; Yang, D.; Yang, H.; Lei, H. Attribution analysis based on the Budyko hypothesis for detecting the dominant cause of runoff decline in Haihe basin. J. Hydrol. 2014, 510, 530–540. [Google Scholar] [CrossRef]
- Sun, Y.; Tian, F.; Yang, L.; Hu, H. Exploring the spatial variability of contributions from climate variation and change in catchment properties to streamflow decrease in a mesoscale basin by three different methods. J. Hydrol. 2014, 508, 170–180. [Google Scholar] [CrossRef]
- Wang, S.; Zhang, Z.; McVicar, T.; Guo, J.; Tang, Y.; Yao, A. Isolating the impacts of climate change and land use change on decadal streamflow variation: Assessing three complementary approaches. J. Hydrol. 2013, 507, 63–74. [Google Scholar] [CrossRef]
- Ma, H.; Yang, D.; Tan, S.K.; Gao, B.; Hu, Q. Impact of climate variability and human activity on streamflow decrease in the Miyun Reservoir catchment. J. Hydrol. 2010, 389, 317–324. [Google Scholar] [CrossRef]
- Bao, Z.; Zhang, J.; Wang, G.; Fu, G.; He, R.; Yan, X.; Jin, J.; Liu, Y.; Zhang, A. Attribution for decreasing streamflow of the Haihe River basin, northern China: Climate variability or human activities? J. Hydrol. 2012, 460–461, 117–129. [Google Scholar] [CrossRef]
- Gao, P.; Li, P.F.; Zhao, B.L.; Xu, R.R.; Zhao, G.J.; Sun, W.Y.; Mu, X.M. Use of double mass curves in hydrologic benefit evalu-ations. Hydrol. Process. 2017, 31, 4639–4646. [Google Scholar] [CrossRef]
- Guo, Q.; Su, N.; Yang, Y.; Li, J.; Wang, X. Using hydrological simulation to identify contribution of coal mining to runoff change in the Kuye River Basin, China. Water Resour. 2017, 44, 586–594. [Google Scholar] [CrossRef]
- Song, X.; Sun, W.; Zhang, Y.; Song, S.; Li, J.; Gao, Y. Using hydrological modelling and data-driven approaches to quantify mining activities impacts on centennial streamflow. J. Hydrol. 2020, 585, 124764. [Google Scholar] [CrossRef]
- Zhang, S.L.; Yang, D.W.; Yang, H.B.; Lei, H.M. Analysis of the dominant causes of runoff reduction in five major basins over China during 1960–2010. Adv. Water Sci. 2015, 26, 605–613. [Google Scholar] [CrossRef]
- Chang, J.; Wang, Y.; Istanbulluoglu, E.; Bai, T.; Huang, Q.; Yang, D.; Huang, S. Impact of climate change and human activities on runoff in the Weihe River Basin, China. Quat. Int. 2015, 380–381, 169–179. [Google Scholar] [CrossRef]
- Zhang, X.; Zhang, L.; Zhao, J.; Rustomji, P.; Hairsine, P. Responses of streamflow to changes in climate and land use/cover in the Loess Plateau, China. Water Resour. Res. 2008, 44, 2–7. [Google Scholar] [CrossRef]
- Yuan, R.Q.; Long, X.T.; Wang, P.; Song, X.F. Tempo-spatial variation and forecast of precipitation in Shanxi Province. J. Nat. Resour. 2015, 30, 651–660. [Google Scholar] [CrossRef]
- Krysanov, V.; Srinivasan, R. Assessment of climate and land use change impacts with SWAT. Reg. Environ. Change 2015, 15, 431–434. [Google Scholar] [CrossRef] [Green Version]
- Arnold, J.G.; Fohrer, N. SWAT2000: Current capabilities and research opportunities in applied watershed modelling. Hydrol. Process. 2005, 19, 563–572. [Google Scholar] [CrossRef]
- Moriasi, D.N.; Arnold, J.G.; Van Liew, M.W.; Bingner, R.L.; Harmel, R.D.; Veith, T.L. model evaluation guidelines for systematic quantification of accuracy in watershed simulations. Trans. ASABE 2007, 50, 885–900. [Google Scholar] [CrossRef]
- Mann, H.B. Nonparametric Tests Against Trend. Econometrica 1945, 13, 245–259. [Google Scholar] [CrossRef]
- Kendall, M.G. Rank Correlation Methods, 4th ed.; Charles Grifin: London, UK, 1975; pp. 50–51. [Google Scholar]
- Wang, S.; Yan, M.; Yan, Y.; Shi, C.; He, L. Contributions of climate change and human activities to the changes in runoff increment in different sections of the Yellow River. Quat. Int. 2012, 282, 66–77. [Google Scholar] [CrossRef]
- Lv, X.L.; Ji, S.B.; Qiu, Y.Q.; Hao, C.F.; Yang, Y. Analysis of characteristics of base flow of Fenhe river upstream and its influ-encing factor. Water Resour. Prot. Available online: https://kns.cnki.net/kcms/detail/32.1356.tv.20210125.0931.002.html (accessed on 13 August 2021).
- Lv, X.; Wang, S.M.; Yang, Z.Y.; Bian, H.Y.; Liu, Y. Influence of coal mining on water resources: A case study in Kuye river basin. Coal Geol. Explor. 2014, 42, 54–57. [Google Scholar]
- Di, F.H. Dynamic monitoring of vegetation in the upper reaches of the Fenhe river in recent 10 years based on MODIS. Forest Resour. Manag. 2015, 4, 109–114. [Google Scholar]
Figure 1.
Location of the study area.

Figure 2.
The amount of raw coal mined in Shanxi Province (1949–2008).

Figure 3.
The framework for quantitative evaluation of the runoff decrease based on the model simulation (modified from Bao et al. [9]).
Figure 3.
The framework for quantitative evaluation of the runoff decrease based on the model simulation (modified from Bao et al. [9]).

Figure 4.
Hydrographs of the observed streamflow and the simulated streamflow from the SWAT modelling.
Figure 4.
Hydrographs of the observed streamflow and the simulated streamflow from the SWAT modelling.

Figure 5.
Observed and simulated using the SWAT model annual runoff series during the period of 1967–2017.
Figure 5.
Observed and simulated using the SWAT model annual runoff series during the period of 1967–2017.

Figure 6.
The double mass curve of cumulative annual runoff plotted against cumulative annual precipitation and their linear regressions during the different periods of 1952–2017.
Figure 6.
The double mass curve of cumulative annual runoff plotted against cumulative annual precipitation and their linear regressions during the different periods of 1952–2017.

Figure 7.
Changes in the annual runoff and precipitation during the period from 1957 to 2017.


Table 1.
Four different periods and characteristics of human activities.
| Periods | Characteristics of Human Activities |
|---|---|
| 1957–1966 | Base period (Near-natural state) |
| 1967–1987 | Affected period 1 (A small amount of coal mining) |
| 1988–1994 | Affected period 2 (Large-scale coal mining The implementation of soil-water conservation projects) |
| 1995–2017 | Affected period 3 (The mined-out area in the study area expanded further. The implemented area of soil-water conservation projects continued to expand.) |
Table 2.
Analytical method of the contributions of the climate change and human activities to change in the runoff.
Table 2.
Analytical method of the contributions of the climate change and human activities to change in the runoff.
| Period | Observed Mean | Simulated Mean | |||
|---|---|---|---|---|---|
| Based | |||||
| Affected |
Table 3.
The calibration and verification of SWAT model.
| Name | Period | OBS (m3/s) | SIM (m3/s) | NSE | RSR | PBIAS |
|---|---|---|---|---|---|---|
| Calibration | 1957–1963 | 8.5 | 7.51 | 0.74 | 0.51 | 11.7% |
| Verification | 1964–1966 | 7.18 | 7.15 | 0.82 | 0.43 | 0.4% |
Table 4.
The observed precipitation and runoff in the different periods.
| Name | Periods | Average Precipitation | Average Runoff | Change in Precipitation | Change in Runoff | Percentage (%) |
|---|---|---|---|---|---|---|
| Base period | 1957–1966 | 519.0 | 91.8 | |||
| Affected period 1 | 1967–1987 | 490.5 | 85.0 | −28.5 | −6.8 | −7.5% |
| Affected period 2 | 1988–1994 | 488.2 | 66.0 | −20.8 | −25.8 | −28.2% |
| Affected period 3 | 1995–2017 | 554.9 | 69.7 | 35.9 | −22.1 | −24.1% |
Table 5.
Fractional contribution of climate change and human activities (coal mining and soil-water conservation) to runoff decreases in the different periods.
Table 5.
Fractional contribution of climate change and human activities (coal mining and soil-water conservation) to runoff decreases in the different periods.
| Methods | Periods | Climate-Induced (%) | Human-Induced (%) |
|---|---|---|---|
| SWAT model | Affected period 1 (1967–1987) | 72.5% | 27.5% |
| Affected period 2 (1988–1994) | 2.2% | 97.8% | |
| Affected period 3 (1995–2017) | −32.1% | 132.1% | |
| DMC | Affected period 1 (1967–1987) | 80.4% | 19.6% |
| Affected period 2 (1988–1994) | 23.0% | 77.0% | |
| Affected period 3 (1995–2017) | −31.5% | 131.5% |
Publisher’s Note: MDPI stays neutral with regard to jurisdictional claims in published maps and institutional affiliations. |
© 2021 by the authors. Licensee MDPI, Basel, Switzerland. This article is an open access article distributed under the terms and conditions of the Creative Commons Attribution (CC BY) license (https://creativecommons.org/licenses/by/4.0/).
Share and Cite
MDPI and ACS Style
Lin, B.; Wang, Y.; Wang, H.; Xiao, W. Quantifying the Impacts of Coal Mining and Soil-Water Conservation on Runoff in a Typical Watershed on the Loess Plateau, China. Water 2021, 13, 3229. https://doi.org/10.3390/w13223229
AMA Style
Lin B, Wang Y, Wang H, Xiao W. Quantifying the Impacts of Coal Mining and Soil-Water Conservation on Runoff in a Typical Watershed on the Loess Plateau, China. Water. 2021; 13(22):3229. https://doi.org/10.3390/w13223229
Chicago/Turabian StyleLin, Binbin, Yicheng Wang, Hejia Wang, and Weihua Xiao. 2021. "Quantifying the Impacts of Coal Mining and Soil-Water Conservation on Runoff in a Typical Watershed on the Loess Plateau, China" Water 13, no. 22: 3229. https://doi.org/10.3390/w13223229
Note that from the first issue of 2016, this journal uses article numbers instead of page numbers. See further details here.